Article

The Impact of Urbanization on Environmental Quality in Ecologically Fragile Areas: Evidence from Hengduan Mountain, Southwest China

1
Business School, Chengdu University of Technology, Chengdu 610059, China
2
Digital Hu Line Research Institute, Chengdu University of Technology, Chengdu 610059, China
*
Author to whom correspondence should be addressed.
Land 2024, 13(4), 503; https://doi.org/10.3390/land13040503
Submission received: 10 January 2024 / Revised: 8 April 2024 / Accepted: 11 April 2024 / Published: 12 April 2024

Abstract

:
The impact of urbanization on the environmental quality of ecologically fragile areas has long been ambiguous. With a focus on the human–environment interaction in 95 counties of Hengduan Mountain, an ecologically fragile region in southwestern China, in this study, we clarify the impact and mechanism of urbanization on environmental quality through the environmental regulation effect, using econometric models and county-level panel data from 2010 to 2019. The results of this study show that: (1) urbanization and environmental regulation have increased over this 10-year period within the study area and regional differences in environmental quality have decreased; (2) urbanization significantly contributes to environmental quality, with heterogenous effects on different environmental elements—increasing the proportion of wetlands and green areas per capita but suppressing vegetation coverage and production efficiency; and (3) environmental regulation is an important mechanism for urbanization to improve environmental quality; however, there are negative externalities on neighboring areas. The results of this study show that urbanization and environmental quality are not always mutually exclusive, thus providing a reference for the development of pro-environmental urbanization to improve sustainable development in ecologically fragile areas.

1. Introduction

1.1. Research Background

Following the country’s economic reform and “opening up”, China has experienced the most rapid and extensive urbanization in human history [1], with the country’s urbanization rate increasing from 17.9% in 1987 to 62.51% in 2021. More than 700 million people have been added to the urban population in the process [2,3]. Urbanization often goes hand in hand with pollution [4], and the current level of rapid urbanization poses challenges to sustainable development in China [5]. According to the 2022 Environmental Performance Index, China ranks 160th out of 180 countries and regions [6], partly because of the extensive resource utilization and low-quality urbanization that caused long-term damage to environmental quality in the early years of reform and opening up [7]. The attention paid formally by China to environmental quality has increased over the last few decades, and a report presented at the 20th National Congress of the Communist Party emphasized the full implementation of the strictest environmental protection policies. In this context, those in academia and politics are increasingly focusing on sustainable urbanization to better balance environmental protection and socio-economic development [8].
In the existing literature, scholars discuss the relationship between urbanization and environmental quality from the perspectives of landscape fragmentation [9], air pollution [10], carbon sinks [11], etc. In China, the predominantly held view is that urbanization is threatening environmental sustainability [12]. Some scholars argue that urbanization can synergistically improve environmental quality in many fields [11,13]. However, the authors of most studies focus only on the impact of urbanization on one environmental element, and few provide comprehensive conclusions based on the perspective of overall environmental quality. In particular, few studies quantitatively explain the mechanism of urbanization’s effects on environmental quality, especially in ecologically fragile areas [14].
Ecologically fragile areas refer to areas with weak resistance to interference that are easily degraded and difficult to recover. More than 60% of China’s land area is ecologically fragile, with this rate of ecological fragility being one of the highest in the world [15]. Such areas hold rich natural resources for humans and have the potential for social and economic development; however, they are particularly sensitive to the impact of human activity [16,17]. Most of these areas are currently at low urbanization levels [18] and are considered to be one of the important areas of urbanization in the future [2,19]. Although urbanization is often a regional issue, its effects on ecologically fragile areas will likely threaten global natural sustainability [20,21]. Therefore, a systematic study is required to provide answers to the following questions: What is the impact of urbanization on environmental quality in ecologically fragile areas? How does urbanization have such an impact? Answers to the above questions are of vital reference significance for sustainable development policies and new urbanization development in ecologically fragile areas.
By combining multi-source remote sensing data and statistical data, in this study, we propose an evaluation index system to measure the comprehensive environmental quality level and quantitatively reveal the spatial–temporal evolution of urbanization and environmental quality in Hengduan Mountain, a typical ecologically fragile region in Southwest China. Under the premise of controlling the endogenous problem, we further explore the impact of urbanization on environmental quality and its environmental regulation mechanism, as well as the spatial spillover effect of environmental regulation at the county level, contributing to the coordinated development of urbanization and environmental quality in ecologically fragile areas.

1.2. Literature Review and Hypothesis

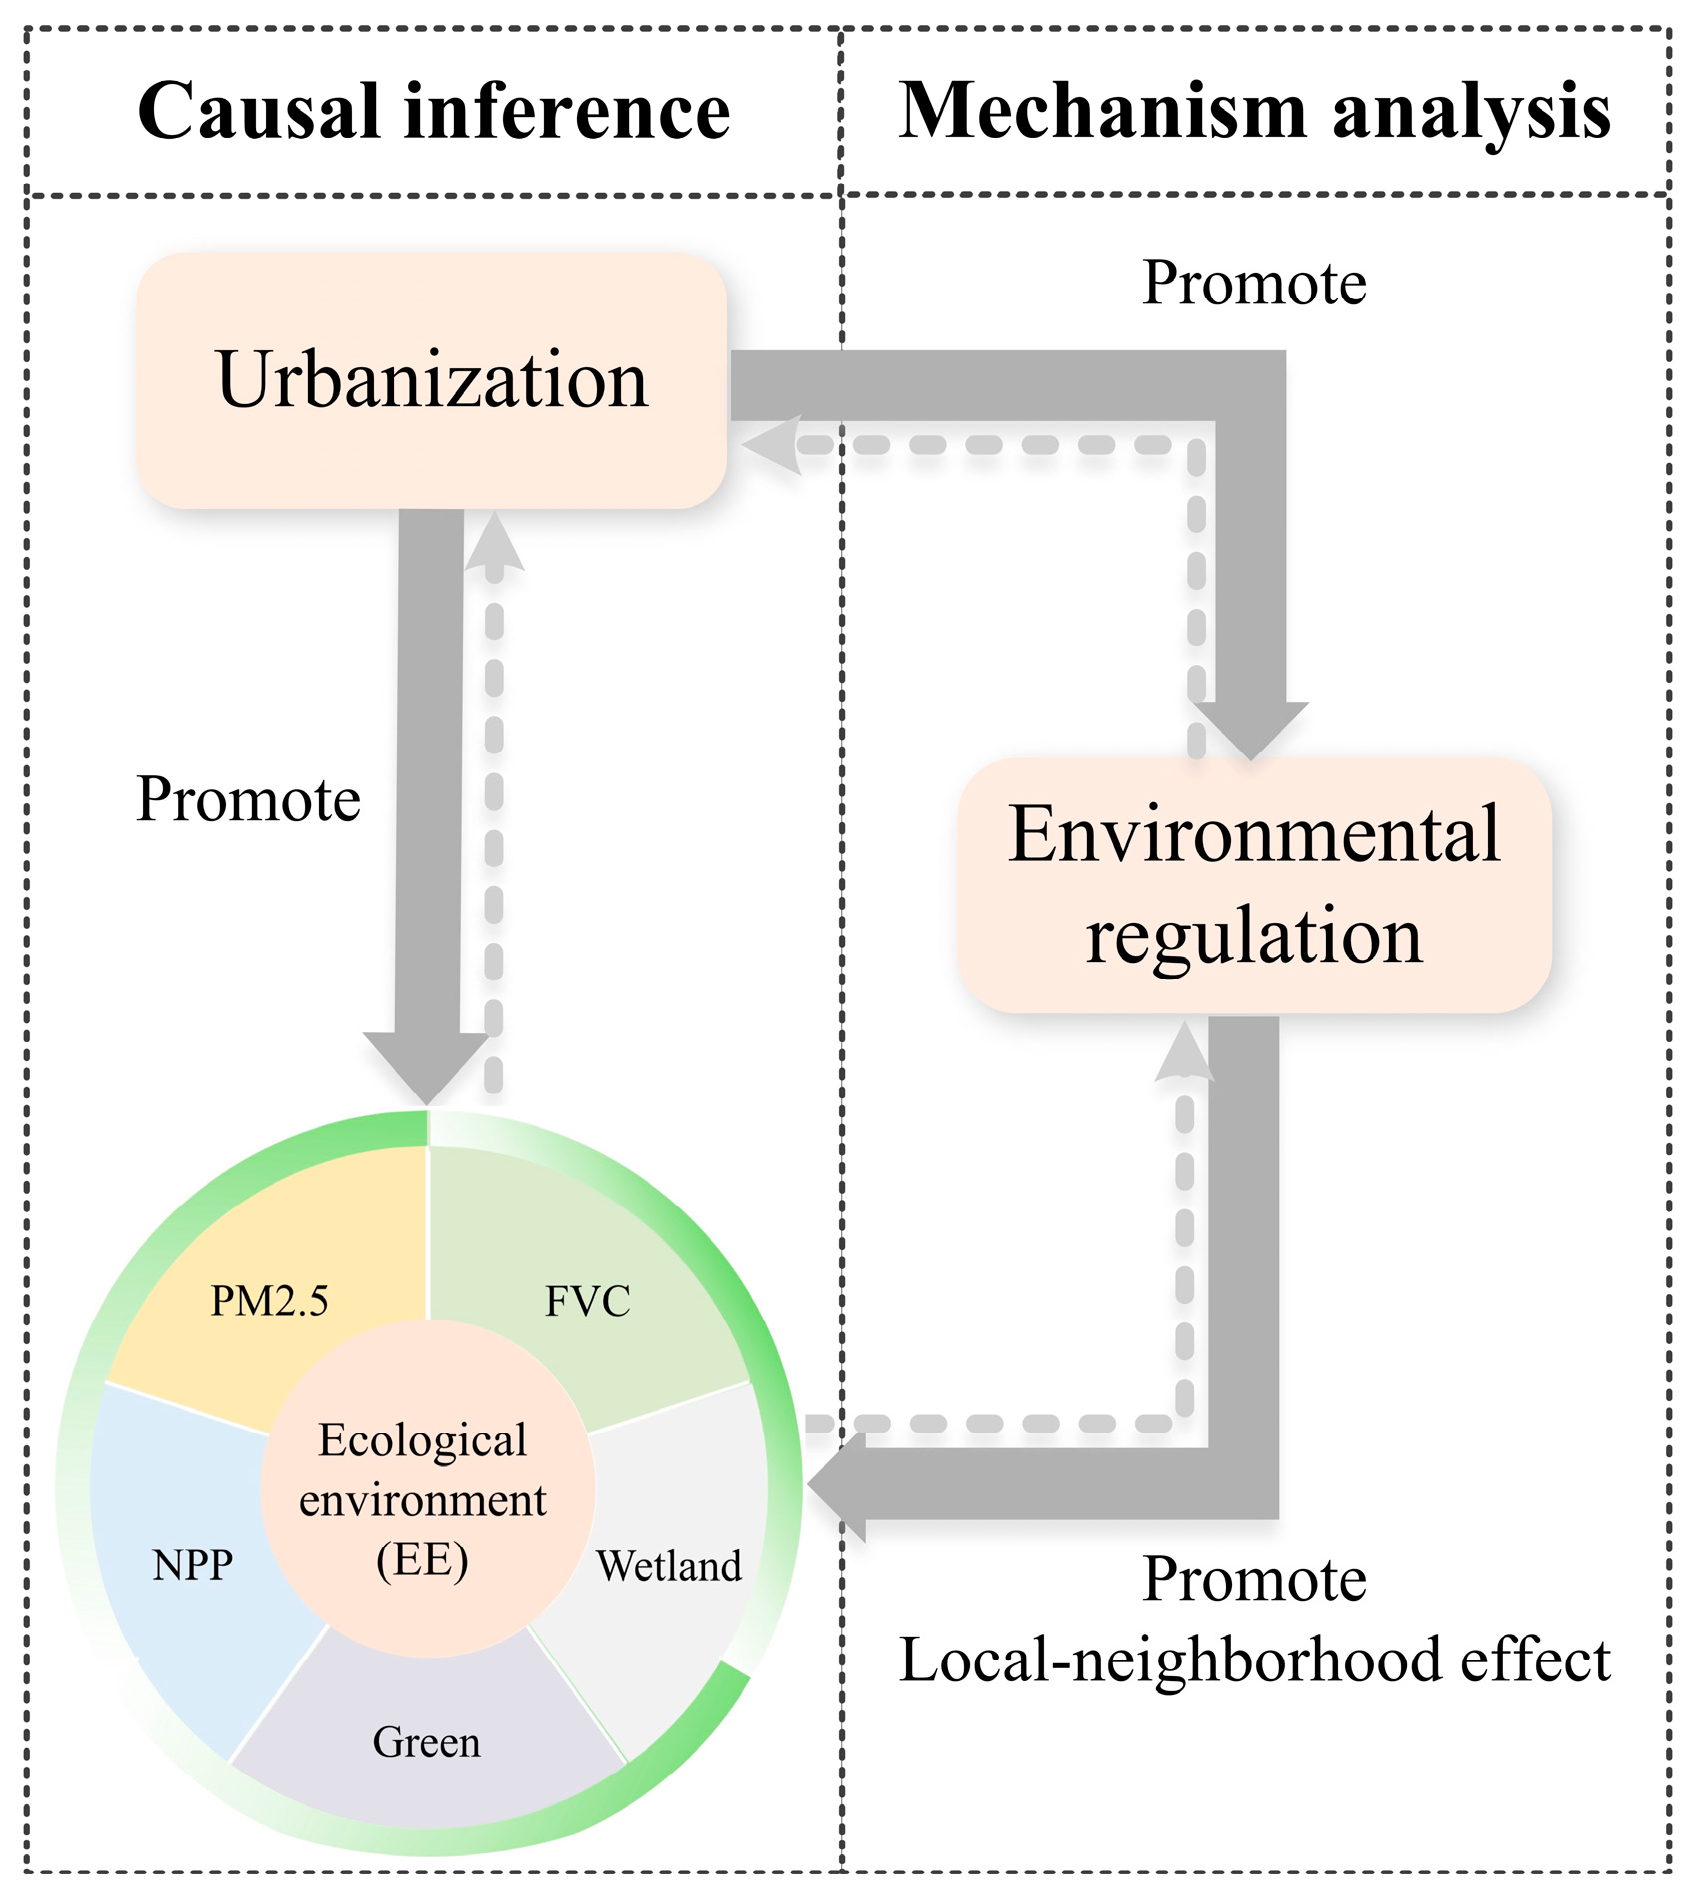
1.2.1. The Impact of Urbanization on Environmental Quality

With the spread of the current wave of global urbanization, the impacts of urbanization on environmental quality have caused great concern. It has been well documented that urbanization exacerbates air pollution, landscape fragmentation, and habitat loss, reduces biodiversity, and impedes ecosystem functions and processes [5,9,10]. However, the results of more recent studies have shown that urbanization and environmental quality are not mutually exclusive; their relationship is more complex than previously thought. There is significant regional heterogeneity in coupling coordination between urbanization and environmental quality [13,22]. The impact of urbanization differs among different development stages and different environmental elements [23,24]. It is necessary to use multi-source remote sensing data to explain the impact of urbanization comparatively and comprehensively on environmental quality from a multi-dimensional perspective.
China is placing increasing emphasis on environmental protection. Since the inclusion of “ecological civilization construction” as one of the national development goals in the 12th Five-Year Plan [25], the current level of urbanization is very different from the traditional natural resource predatory development mode [8,22,26]. The authors of some studies have indicated that high-quality urbanization under sustainable management can provide green technology and financial support for environmental restoration, and government-led construction of urban parks and the planting of roadside trees are also conducive to environmental quality enhancement [11,27,28]. However, at present, there is still limited quantitative evidence of such benefits. Most existing studies target developed regions, and the relationship between urbanization and environmental quality in ecologically fragile regions is still unclear. Therefore, we propose the following hypotheses as the focus of the empirical analysis of this study:
H1: 
Urbanization significantly contributes to environmental quality.
H1a: 
There are heterogeneous effects of urbanization on different environmental elements.

1.2.2. Urbanization Affects Environmental Quality through Environmental Regulation

Sustainable management could be used to effectively control the disturbance to environmental quality caused by rapid urbanization [26]. For instance, compensating for the reduced number of carbon sinks and level of biodiversity through urban greening may provide an even better environment than that seen at the pre-urbanization level [11]. Environmental regulation in China, primarily performed as an official task, is often led by the central government and implemented by the local government in designing specific programs, managing funds, providing ongoing evaluation, and so forth [7]. Environmental regulation includes mandatory legal instruments such as environmental taxes, laws, and rules [29] and other measures such as investment in environmental innovation and technology [30]. These measures are not only effective for short-term pollution control but also promote long-term environmental protection by raising the environmental awareness of society [31].
Regarding the relationship between urbanization and environmental regulation, the authors of numerous studies have highlighted the prevalence of the “race to the bottom”, i.e., after the central government implements environmental regulation, local governments have a strong incentive and tendency to reduce the level of environmental regulation to attract investment and profit from inter-local economic competition [32]. This results in a negative relationship between economic development and environmental regulation. In China, due to the direct link between the effectiveness of environmental protection and the promotion of local officials, the phenomenon of low competition is less prevalent [33]. With a large proportion of the rural population moving to cities, it is an inevitable trend for the leading industry to shift from agriculture to industry and service during the process of urbanization. As a result, the more developed a region, the stricter the environmental controls local officials must adopt to meet the environmental goals set by the central government [33].
Regarding the relationship between environmental regulation and environmental quality, there is ample evidence that environmental regulation can effectively mitigate environmental problems such as damaged carbon sinks and air pollution [20,34]. However, the strength of this effect varies across different regions [34]. For instance, some local governments do not implement environmental regulations properly, resulting in limited benefits [35]. In addition, there is evidence that the effects of environmental regulations on environmental quality have significant local neighborhood impacts [36]. The authors of some studies argue that the official emphasis on environmental regulation has led to the transfer of polluting industries to central and western China [33,37]. It was also highlighted that the local government in Brazil, for example, has strategically selected sites for polluting industries, known as the “pollution refuge”, triggering localized pollution and negative externalities [38]. In light of this, we propose the following hypotheses:
H2: 
Urbanization improves environmental quality through environmental regulation.
H2a: 
Urbanization significantly boosts environmental regulation.
H2b: 
Environmental regulation significantly improves environmental quality.
H2c: 
Environmental regulation has different local neighborhood effects on environmental quality.

1.2.3. Reverse Causal Effect

The authors of most studies have focused on the unidirectional influence of urbanization on environmental quality [17,19,20,23]. However, there might be a reverse effect of environmental quality on urbanization. For instance, a large proportion of Hengduan Mountain possesses a unique natural environment fit for tourism development; thus, rapid economic growth and urbanization are possible. For the less ecologically favored areas, poor natural resource endowment limits population growth, capital attractiveness, and urbanization [2]. Similarly, environmental quality may, in turn, affect environmental regulation. Most counties with better environmental quality are located in high-altitude areas with harsh climates, which are sparsely populated and, therefore, may be subjected to less environmental regulation [39].

1.3. Summary

The analytical framework used in this study to analyze the relationship between urbanization, environmental regulation, and environmental quality is shown in Figure 1. The marginal contributions of this study are as follows: (1) Research data. Based on the use of multi-source remote sensing data, in this study, we comprehensively evaluate the environmental quality of Hengduan Mountain. (2) Study area. There are differences in environmental endowment and development background between ecologically fragile areas and other areas. In this study, we take Hengduan Mountain as the study area, which provides a reference for the urbanization and development of ecologically fragile areas. (3) Research methods. Given the potential endogeneity between urbanization and environmental quality, we used the instrumental variable method to conduct empirical analysis, providing more robust evidence of a causal relationship. (4) Mechanism analysis. We further discuss the environmental regulation mechanisms of urbanization that affect environmental quality. We used the spatial two-stage least squares method to explore the spatial spillover effect of environmental regulation, which more clearly reveals the internal relationship between urbanization and environmental quality.

2. Materials and Methods
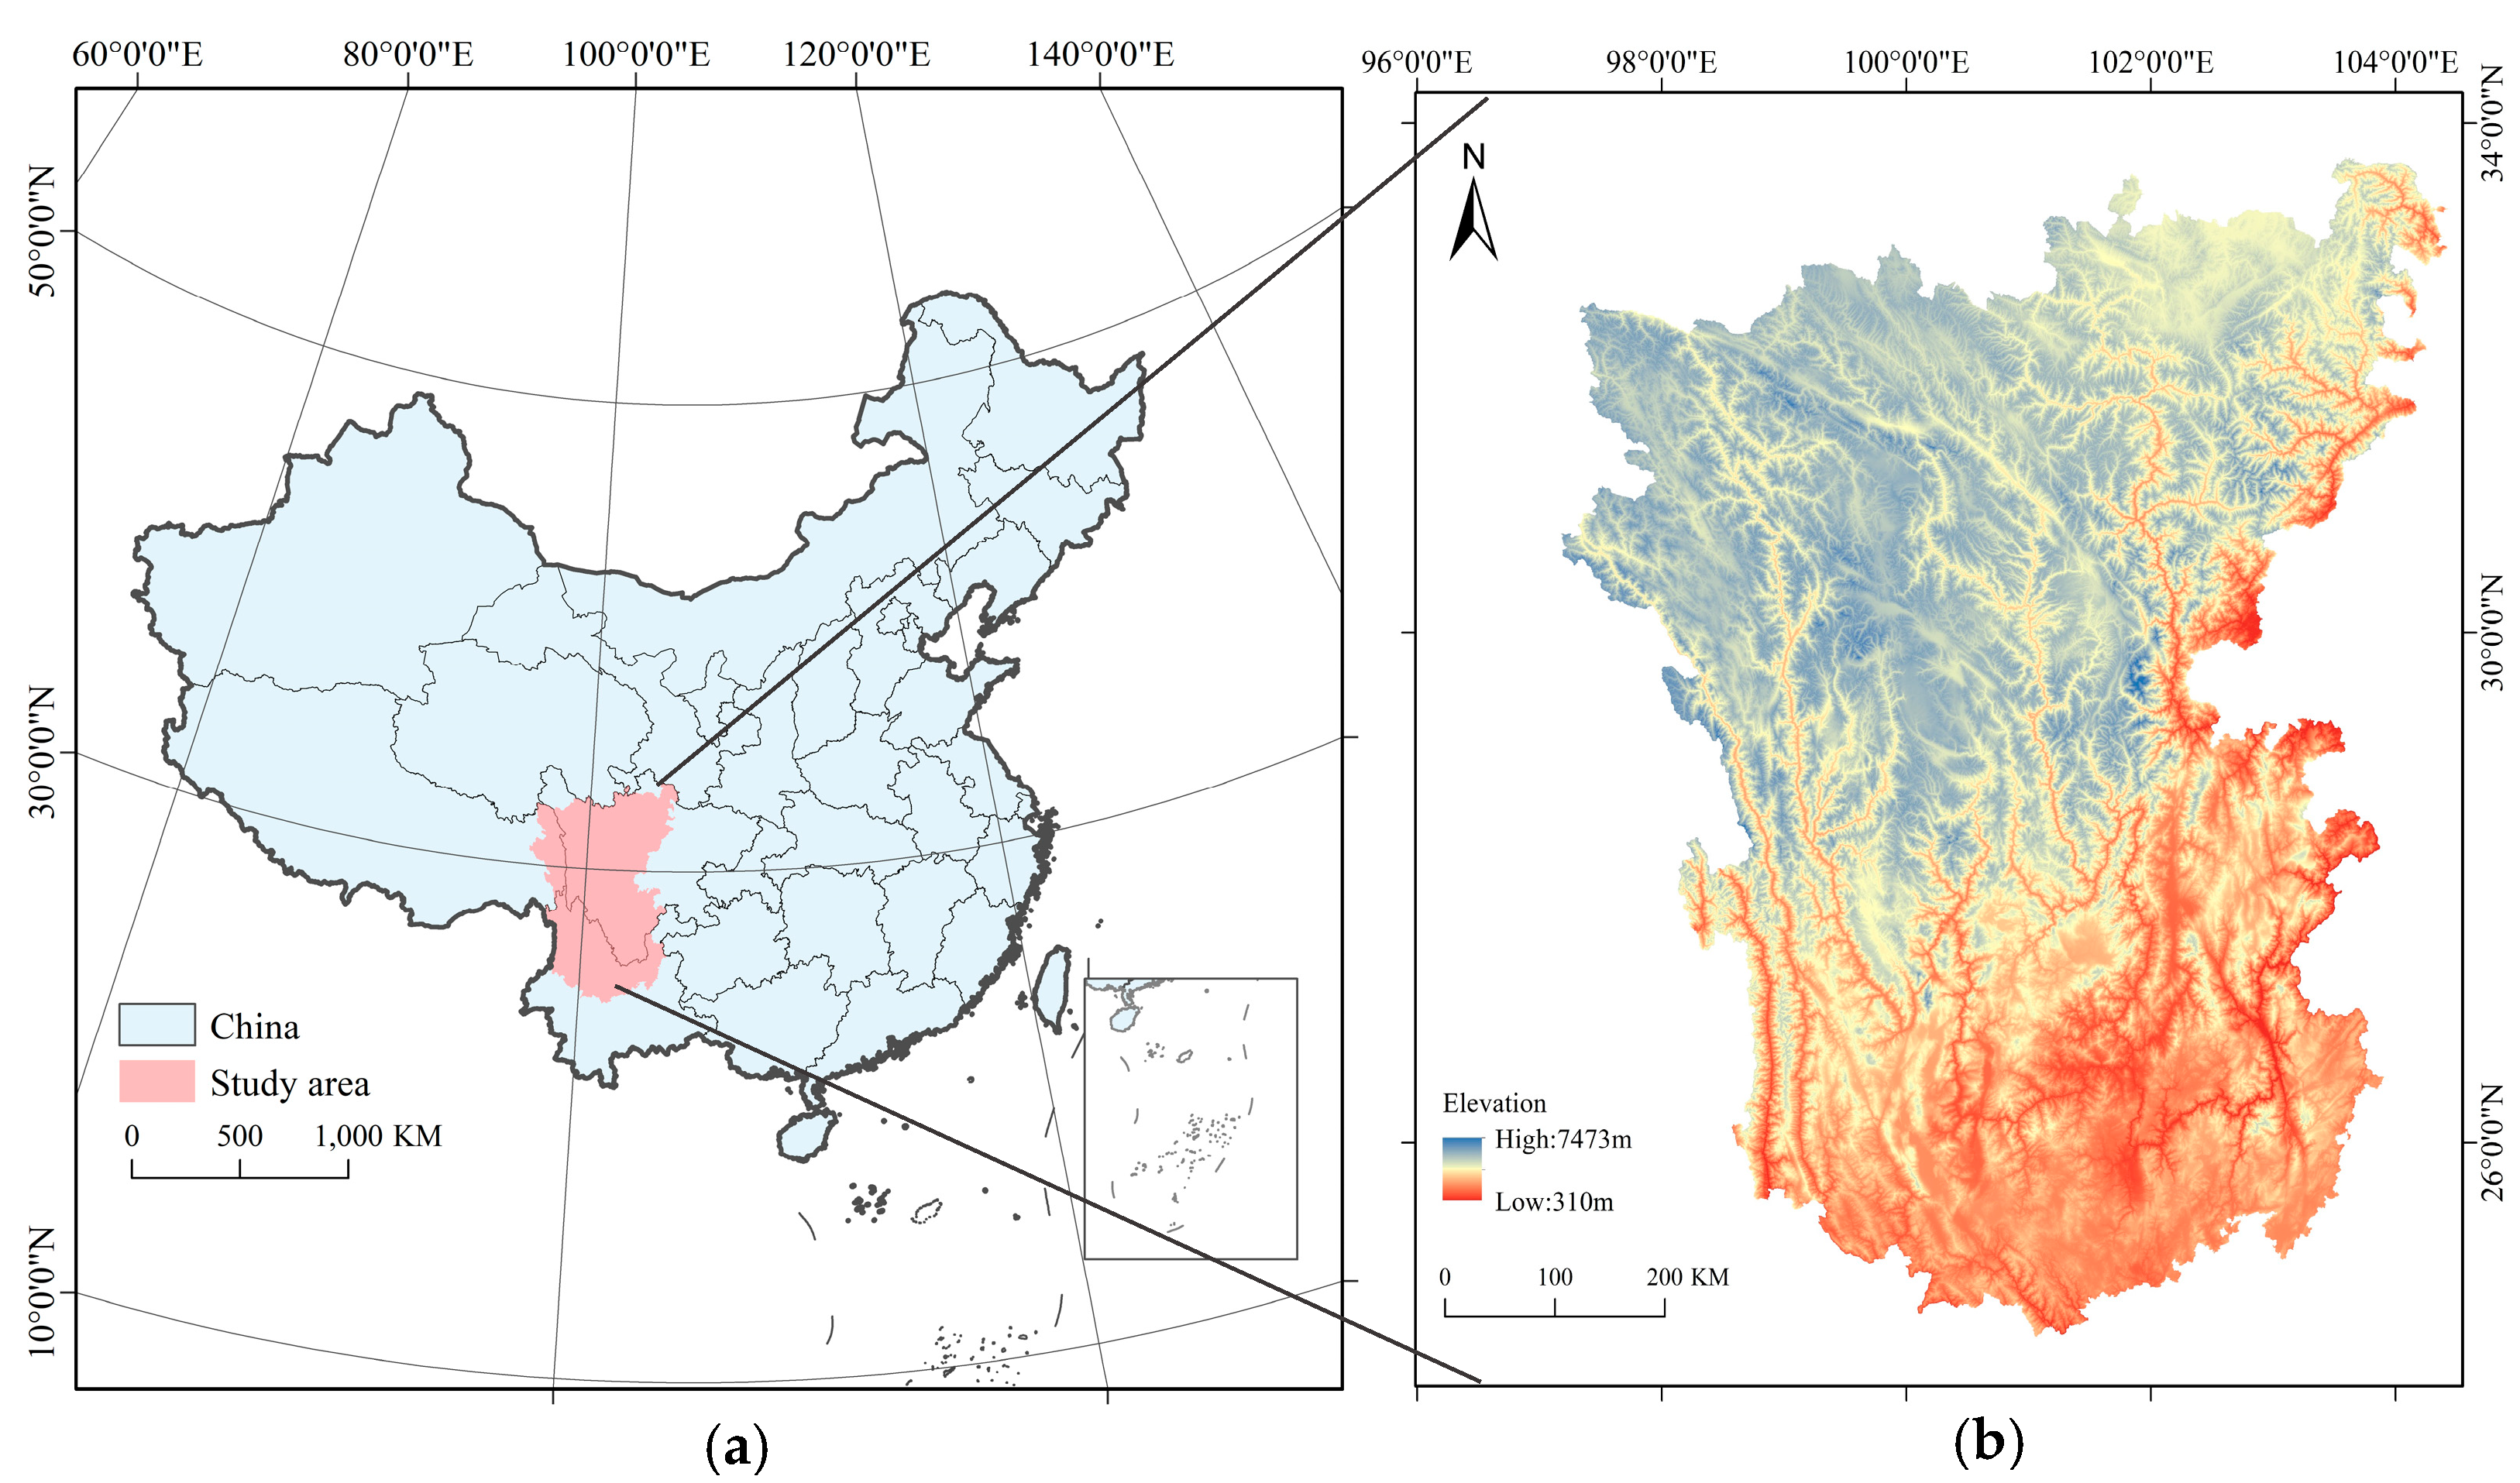
2.1. Study Area

As shown in Figure 2, Hengduan Mountain covers 99 counties, including western Sichuan Province, the eastern Tibet Autonomous Region, and northwestern Yunnan Province [40,41]. Hengduan Mountain comprises numerous mountains, with an altitude of 310–7473 m and an average altitude of more than 3000 m, and the northwestern area is higher than the southeastern area. However, 70.1% of the county seats in the Hengduan Mountain have an elevation below 2500 m, which means that higher elevation regions are often sparsely populated. The local land cover types mainly consist of forest (50.59%) and grassland (39.36%). Planting, forestry, animal husbandry, and tourism are the dominant industries in Hengduan Mountain, with these industries contributing to 50% of the regional gross domestic product (GDP).
Hengduan Mountain is an important natural resource reserve and ecological buffer area, with the area performing various ecological functions. It is also an ecologically fragile area subjected to high soil erosion, frequent landslides, and debris flows [42]. In recent decades, Hengduan Mountain has experienced large-scale urbanization, extensive population migration, land use change, and overexploitation of natural resources [17,41], resulting in ecological degradation and conflict between human activities and the fragile natural environment [43]. Owing to the above qualities, Hengduan Mountain is an ideal area for this study.

2.2. Variable Selection

2.2.1. Explained Variable: Environmental Quality

Environmental quality is a compound concept, with it being the comprehensive state of environmental elements, such as vegetation, altitude, and climate, under dynamic interaction with human society [44]. The authors of existing studies have either analyzed this concept from the perspective of a single environmental element or have used a composite index system to measure the comprehensive level of environmental quality [12,45]. Considering that the perspective of a single environmental element cannot reflect the overall characteristics of environmental quality, in this study, we designed a comprehensive index system to evaluate environmental quality [44]. With different research objectives, the authors of existing studies have applied various evaluation index systems for environmental quality [44,46,47,48,49]. Based on the existing evaluation index system, with the principles of scientificity and availability, we selected five elements from three aspects of vegetation coverage, air quality, and biodiversity to reflect the comprehensive environmental quality of Hengduan Mountain. Table 1 shows these specific elements.
For the composite index system, the index weight is vital. The authors of most studies in the literature use the subjective weighting method, represented by the analytic hierarchy process (AHP), or the objective weighting method, represented by the entropy weight method (EWM). The game-theory combination weighting method is applied in this study to define each element’s weight and obtain the integrated value of environmental quality. By combining the subjective and objective weighting results, this method can make up for the defects in the traditional weighting method and make the weighting more scientific and reasonable. This method has been applied in some studies on composite concept evaluation [50,51]. The specific calculation formula is shown in the Appendix A.

2.2.2. Core Explanatory Variable: Urbanization

Urbanization is a dynamic agglomeration process of multiple resources in space. Population urbanization, economic urbanization, and land urbanization are the three main dimensions of urbanization [52]. Owning different research perspectives, the measurement methods of urbanization in the existing literature are not unified. The authors of some studies use the percentage of urban resident population [53], the proportion of built-up areas [54], and the percentage of the non-farm population [55] to measure the level of urbanization; in contrast, the authors of other studies build a multi-dimensional index system to measure urbanization [56]. The extensive migration of rural populations to cities is the realistic requirement and fundamental driving force of the economy and land urbanization, and it is also the crucial reason for environmental phenomena such as returning farmland to forests and reducing straw burning. Therefore, in this study, we focus on the impact of population urbanization on environmental quality and measure this impact through the percentage of the urban resident population. This method takes into account both scientificity and feasibility and is widely used in related research [2].

2.2.3. Mediating Variables: Environmental Regulation

In this study, we used a synthetic measure to evaluate the strength of environmental regulation by considering both government plans and actual implementation. On the one hand, China’s annual government work report covers the official objectives and specific programs, and each word used has been thoroughly considered [36]. Therefore, with reference to the existing literature [57,58], the frequency and percentage of environmental-related phrases in the annual government work report from 2009 to 2019 were selected to reflect the environmental work plan and expectations, including environment (huanjing), pollution (wuran), energy consumption (nenghao), emission reduction (jianpai), environmental protection (huanbao), haze (wumai), PM2.5, etc. As government work reports are released at the beginning of each year, this measure can mitigate the reverse causal effect of environmental quality on environmental regulation to a certain extent. The industrial structure could reflect the actual implementation of environmental regulations. Therefore, we chose the interaction term between the industrial structure and the frequency of environmental phrases to measure environmental regulation. In order to perform the robust test, two indicators were used in the empirical model: the interaction term between the environmental-related term frequency in government reports and the industrial structure (TF×IS) and the interaction term between the environmental-related term proportion in government reports and the industrial structure (TP×IS).

2.3. Data Source

The social and economic data used in this study were derived from the National Economic and Social Development Statistical Bulletins of counties from 2010 to 2019. The utilized PM2.5 emission data were derived from the Atmospheric Composition Analysis Group at Dalhousie University (https://sites.wustl.edu/acag/datasets/surface-pm2-5/, accessed on 15 October 2023). NASA 500-meter spatial resolution data (MOD13A1 and MOD17A3) (https://ladsweb.nascom.nasa.gov, accessed on 15 October 2023) were used for NPP and FVC calculations. The green and wetland areas were calculated using the Chinese annual land cover dataset with a 30-m spatial resolution [59]. We excluded four counties within the Tibetan boundary due to a lack of statistical data. Given its relatively small proportion of the total area of Hengduan Mountain, this exclusion has little effect on the results of this study. Spatial analysis was conducted using ArcGIS 10.7, and econometric modeling was performed using StataMP 17. The descriptive statistical analysis of the variables is shown in Table 2.

2.4. Empirical Model

2.4.1. Baseline Model

The following model is used to analyze the impact of urbanization on environmental quality:
E Q i t = α + β U r b i t + γ X i t + σ t + μ i + ε i t
where E Q i t represents the environmental quality of county i in year t; U r b i t is the urbanization level of county i in year t; and X i t is a set of control variables including environmental regulation, GDP, and the population density of county i in year t. Moreover, α is a constant term; β and γ are the estimated coefficients of the explanatory variables; σ t and μ i represent the county-fixed effect and time-fixed effect; and ε i t is the random disturbance term.

2.4.2. Instrumental Variable (IV) Model

Since reverse causality may lead to biased empirical results, the average slope U r b _ S l o p e i t was introduced as an IV of urbanization to mitigate endogeneity. To overcome the limitations of cross-sectional data on the slope, we incorporated the interaction term of the year dummy variable and slope into the model [60]. The model is as follows:
E Q i t = α + β U r b _ S l o p e i t + γ X i t + μ i + σ t + ε i t
U r b _ S l o p e i t = θ S l o p e i t × Y e a r t + μ i + σ t + ξ i t
Similarly, we replaced the explained and explanatory variables in Equations (2) and (3) to test the influence of urbanization on environmental quality through environmental regulation.

2.4.3. Spatial Two-Stage Least-Squares Regression Model

The authors of several studies have pointed out that environmental regulation has significant local-neighborhood effects [33,37]; therefore, we investigated this effect further using spatial two-stage least-squares regression using the following models:
E Q i t = β 1 T F × I S _ S l o p e i t + β 2 W T F × I S _ S l o p e i t + β 3 W E Q i t + γ X i t + μ i + σ t + ε i t
E Q i t = β 1 T P × I S _ S l o p e i t + β 2 W T P × I S _ S l o p e i t + β 3 W E Q i t + γ X i t + μ i + σ t + ε i t
T F × I S _ S l o p e i t = θ S l o p e i t × Y e a r t + μ i + σ t + ξ i t
T P × I S _ S l o p e i t = θ S l o p e i t × Y e a r t + μ i + σ t + ξ i t
In Formulas (4) and (5), β 2 and β 3 are the spatial lag coefficients of the explanatory and explained variables, respectively.

3. Results

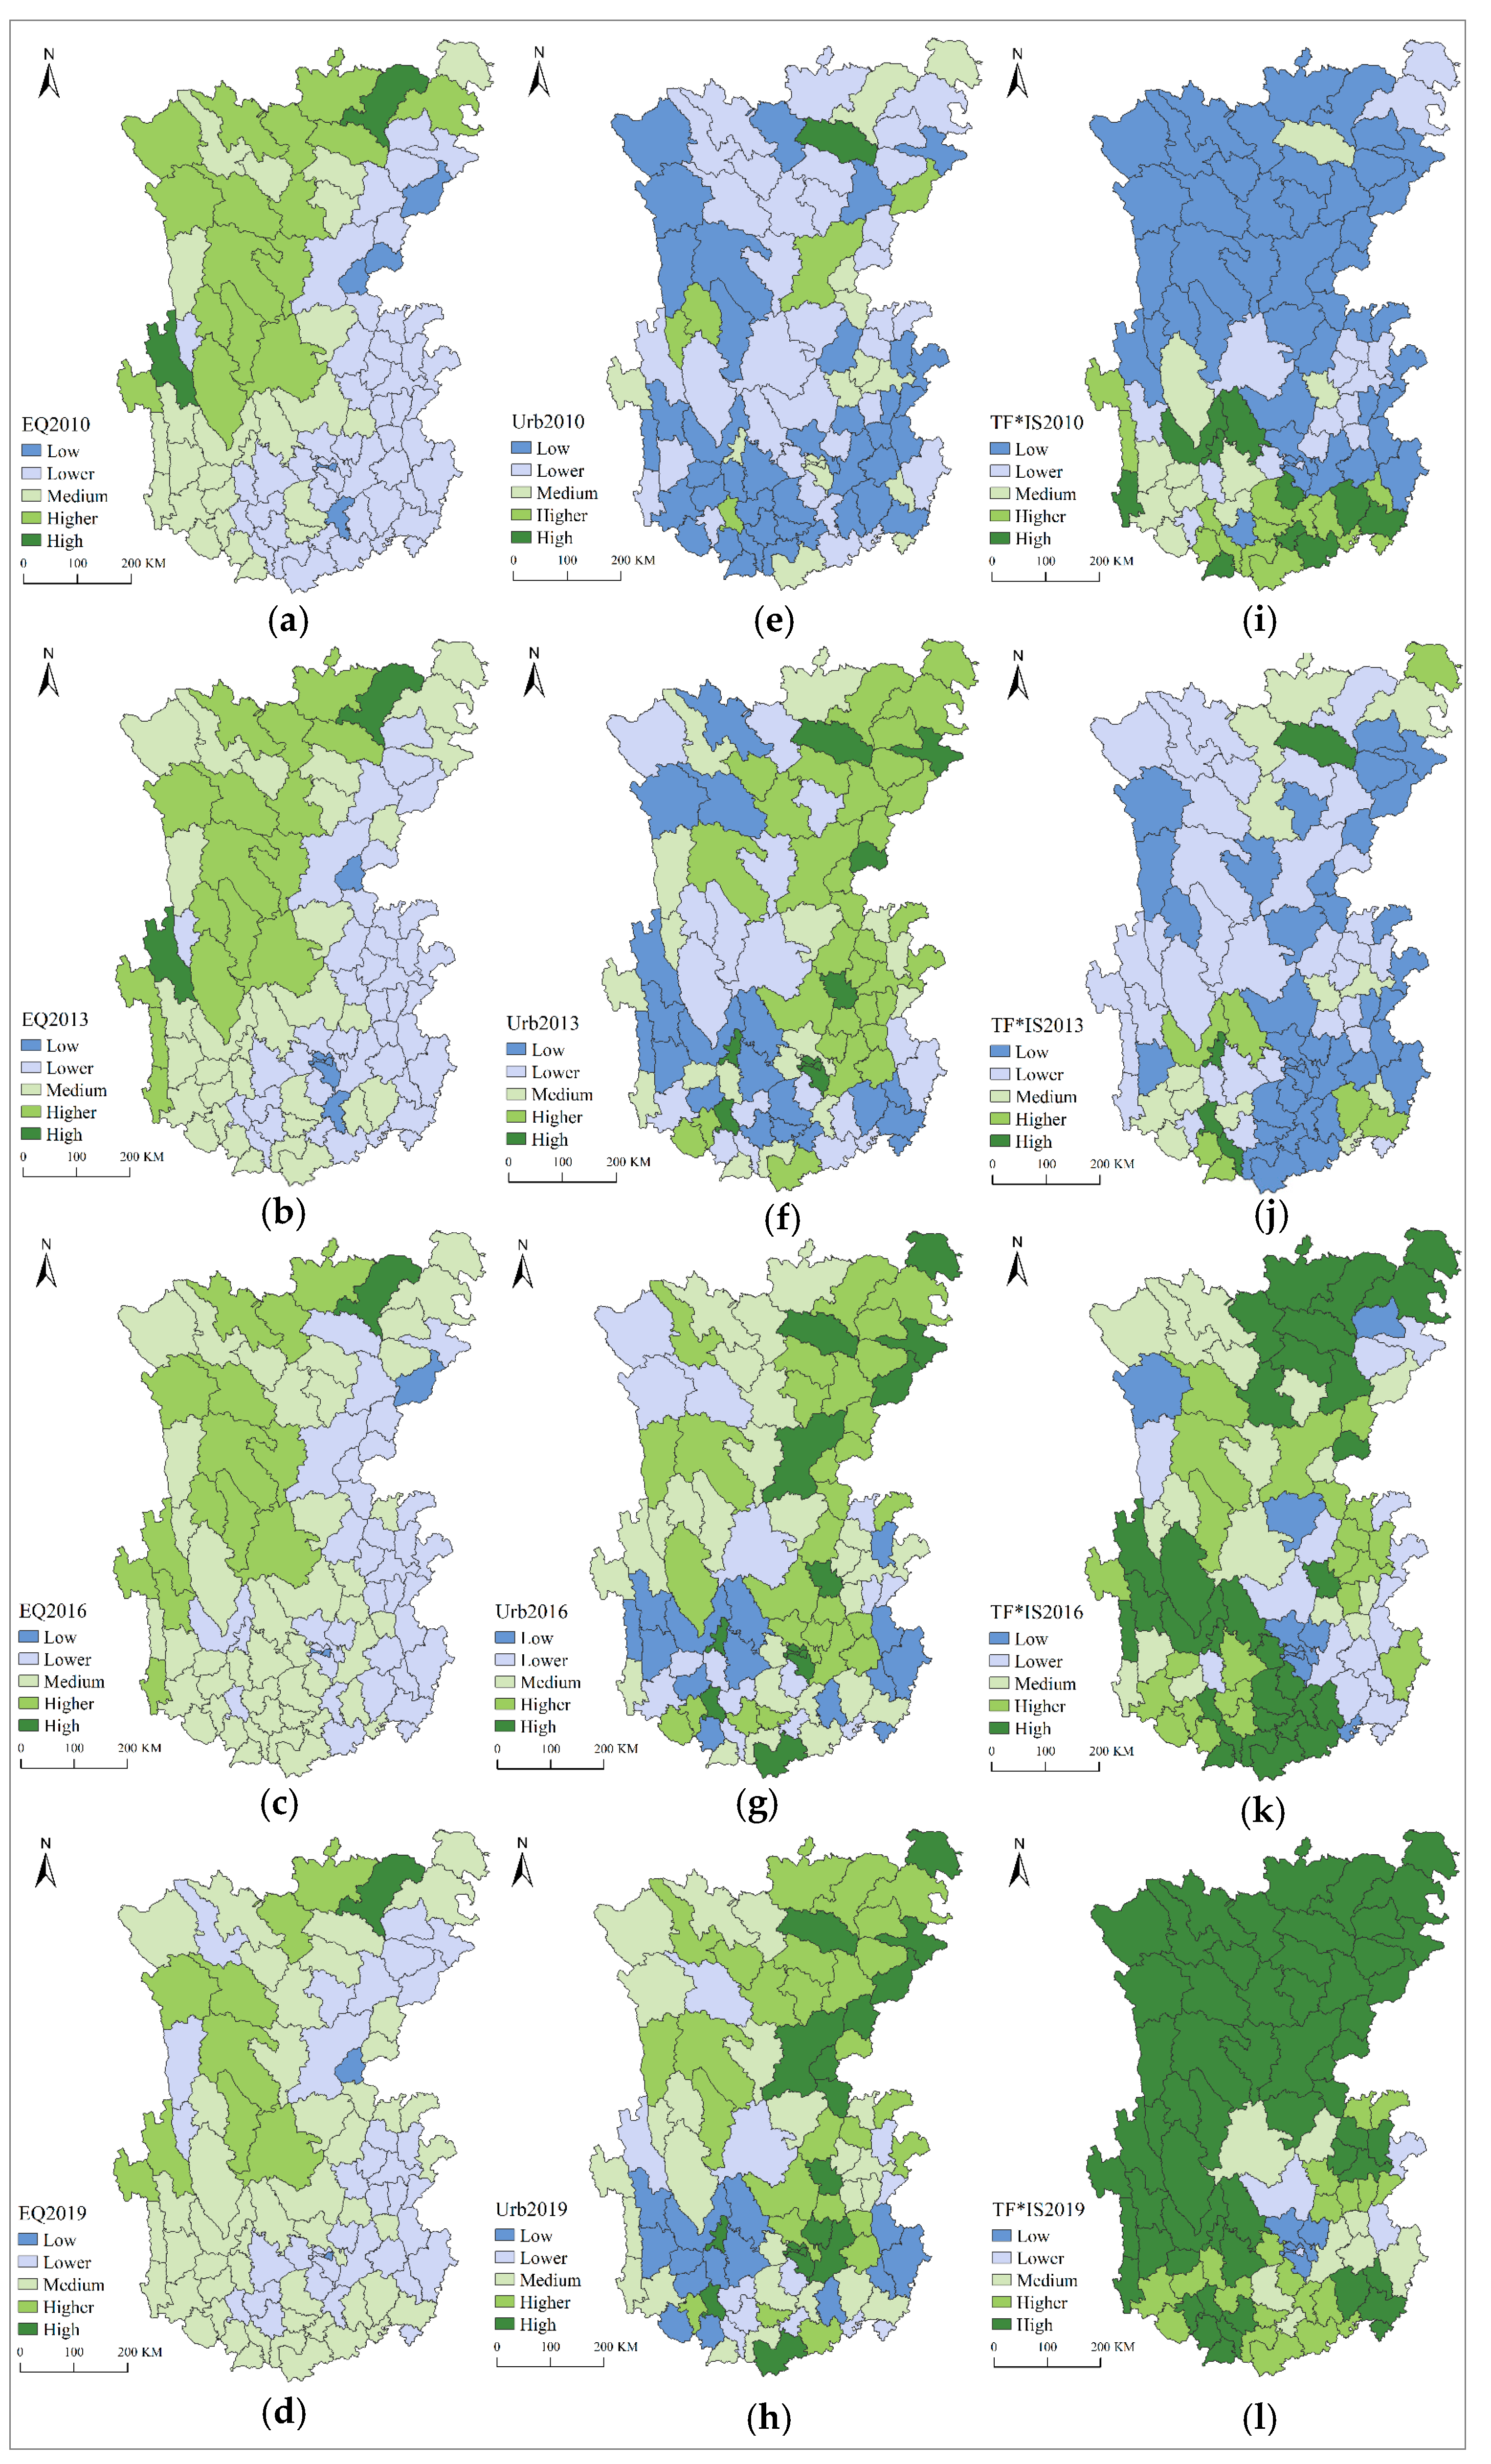
3.1. Spatial–Temporal Patterns of the Explained and Explanatory Variables

We first calculated the average environmental quality, urbanization, and environmental regulation in each county during the study period. Next, we used the Jenks natural breakpoint method to obtain five grade intervals of environmental quality, urbanization, and environmental regulation, and the results are shown in Table 3. Figure 3 illustrates the spatial–temporal patterns of environmental quality, urbanization, and environmental regulation.
First, environmental quality in the northwestern region is better than that in the southeastern region, and such a spatial difference tends to decrease over time. From 2010 to 2019, the effect of environmental remediation in the counties with poor environments in the southeast was significant; the standard deviation of environmental quality decreased from 0.067 to 0.046, and the proportion of counties with medium environmental quality increased from 26% to 53%. The improvement in environmental quality in the southeast may be due to the rapid industrial transformation brought about by tourism development and the reduction in the number of polluting industries combined with government environmental management.
Second, the overall urbanization level in Hengduan Mountain showed an apparent upward trend, aligning with the rapid urbanization process nationwide, which proves our hypothesis that ecologically fragile areas also have a realistic need to undergo urbanization. Counties with high urbanization levels are mainly distributed in the northeast, with a small portion scattered in some southern municipal districts and county-level cities. The northeastern area of Hengduan Mountain is close to Chengdu, the core city in southwestern China. Due to the driving effect of the metropolis, the socio-economic development of the counties in the northeastern area started earlier, and the urbanization level is relatively higher.
Third, in 2010, the intensity of environmental regulation in the north of Hengduan Mountain was generally lower than that in the south, while the intensity of environmental regulation in the north increased significantly during the study period and was generally higher than that in the south by 2019. Since the “ecological civilization” strategy was put forward, officials in local government have paid more attention to environmental protection.

3.2. Influence of Urbanization on Environmental Quality

Table 4 presents the baseline regression results based on Formula (1). The results of Model (1) show that urbanization inhibits environmental quality. Considering that environmental quality in the current year does not affect urbanization in previous years, Model (2) was constructed by replacing the explanatory variable with a one-period lag of urbanization in Formula (1). The results show no significant effect of urbanization on environmental quality. The inconsistency between Model (1) and Model (2) indicates the existence of endogeneity.
Due to this endogeneity, the approximate unbiased estimate needs to be obtained through IV regression [61]. Table 5 shows the results of IV regression based on Formulas (4) and (5). The F statistic is greater than the critical value of 10 [61], indicating that the slope is highly correlated with urbanization and is a suitable IV for urbanization. The results of Models (1) and (2) indicate that urbanization has a significant promotional effect on environmental quality. This effect is robust because it is not affected by the addition of control variables and the replacement of the explanatory variable with a one-period lag of urbanization. Therefore, H1 is confirmed.
To further demonstrate the relationship between urbanization and environmental quality, Table 6 provides the regression results of urbanization for five environmental elements. Urbanization contributes to ecological construction mainly through wetlands and green areas per capita. This effect may be due to the fact that local governments have been emphasizing urban greening since the concept of “ecological civilization” was introduced in China. As a part of this concept, for instance, all residential areas must possess a certain percentage of green space and an increased number of urban parks and trees along roads [62,63]. Urbanization significantly suppressed FVC and NPP. A significant number of rural people entering the city to work is one of the primary forms of urbanization in China’s less developed areas, which means that local farmers migrate to other regions. This process is conducive to the depletion of natural resources; however, urbanization may still lead to farmland disuse, industrial pollution, and other phenomena, thus having a negative impact on vegetation. Another possible reason for this is the fact that although urban greening can make up for the loss of part of the green area, the vegetation used in urban greening mainly comprises shrubs and grasslands. The FVC and NPP results show that the quality of vegetation is still reduced.

3.3. Mechanisms of Urbanization Influencing Environmental Quality

In Table 7, Models (1) and (2) are the IV regressions of urbanization on two measures of environmental regulation, and Models (3) and (4) are the IV regressions of replacing urbanization with the one-period lag of urbanization. The results show that counties with higher levels of urbanization have stronger environmental controls; thus, H2a is confirmed. In all four models, urbanization significantly contributes to environmental regulation regardless of the selected measures, indicating the robustness of the results.
Table 8 provides the results of the IV regression of environmental regulation on environmental quality, indicating that counties with stronger environmental control have better environmental quality; thus, H2b is confirmed. The results in Table 7 and Table 8 together show that urbanization improves environmental quality by implementing environmental regulations; therefore, H2 is confirmed.
Table 9 presents the regression results based on Formulas (4) and (5) to test the local neighborhood effect of environmental regulation. In order to ensure the robustness of the regression results, we used the continuity spatial weights matrix to build Models (1) to (4), the inverse distance spatial weights matrix to build Models (5) and (6), and the inverse distance squared spatial weights matrix to build Models (7) and (8). The results show that environmental regulation in one county significantly promotes local environmental quality but suppresses neighboring counties’ environmental quality, indicating its negative externalities in adjacent areas. Therefore, H2c is proven, indicating the robustness of the results.

4. Discussion

4.1. Interpretations of the Results and Comparison with the Literature

In this study, we quantitatively discuss the causal relationship between urbanization and environmental quality and environmental regulation mechanisms in Hengduan Mountain, a typical ecologically fragile area in China. We found that urbanization optimizes environmental quality by improving environmental regulation. This result is not consistent with the results of some existing studies [49,64]. The authors of previous studies on urbanization and environmental quality have frequently highlighted the fact that urbanization has a negative impact on environmental quality. The reasons for this negative impact may lie in the following three points: (1) Various theoretical perspectives lead to different measurement methods for environmental quality. (2) Our study was carried out in ecologically fragile areas where stricter environmental regulation has optimized the impact of urbanization on environmental quality. (3) The empirical methods used differ. In a similar manner to the results of our baseline model, ignoring the endogenous problem will lead to biased regression results or even the opposite results.
Our research results also confirm the fact that environmental regulation is an important mechanism of urbanization affecting environmental quality. This finding supports the view that environmental regulation plays a vital role in coordinating socio-economic development and environmental quality. Urbanization under strict management can even act as a feasible channel for environmental remediation [8,11,34,65]. However, in this study, we observed that local environmental regulation has a negative impact on the environmental quality of the neighboring counties, which means there may still be uncoordinated environmental protection strategies between counties in ecologically fragile areas such as Hengduan Mountain. Moreover, from the perspective of individual environmental elements, the positive effect of urbanization on environmental quality mainly lies in promoting per capita wetlands and green areas. The authors of previous studies have also highlighted the ecological contribution made by urbanization in China [11]. We also found that urbanization still has a negative effect on FVC and NPP, which is consistent with the results of previous studies [12,17,20].
However, there are still other possible mechanisms to explain the positive impact of urbanization on environmental quality in Hengduan Mountain. On the one hand, China’s sustainable urbanization model has increased the number of urban parks and the planting of roadside trees, which partially compensate for the negative impact of urbanization on the environment [11]. On the other hand, the reduction in cultivated land area is believed to improve the relationship between urbanization and environmental quality [11]. Due to the migration of a large proportion of the rural population to cities, the demand for cultivated land has decreased significantly [7]. Although the expansion of urban impervious surfaces will lead to the occupation of forest areas, the conversion of farmland to forest in a large area will lead to more extensive land cover changes and ecological benefits [66]. The migration of the rural population and the environmental regulations set by the local government are both core components of environmental protection in ecologically fragile areas in China. Considering the fact that few studies have quantitatively revealed the critical role of local governments in urbanization and environmental quality, the conclusions of this study further prove the effectiveness of environmental protection and the sustainability of the urbanization mode in China.

4.2. Implications for Urbanization Construction

In this study, we explore the causality among urbanization, environmental regulation, and environmental quality in ecologically fragile areas, with the results having a theoretical reference value. The results of this study are also of important practical significance for the sustainable development and new urbanization of ecologically fragile areas. (1) It is recommended that policymakers gradually develop urbanization under the premise of environmental regulation, especially in ecologically fragile areas, and the “one size fits all” strategy is not advisable. (2) Considering the negative impact of urbanization on NPP and FVC, it is recommended that deforestation in Hengduan Mountain be controlled through relevant regulations during urbanization. In addition, it is recommended that the improvement of the Grain for Green project be accelerated and that abandoned rural land be converted into forest carbon sinks in a timely manner. (3) Given the negative externalities observed in environmental regulation, more attention should be paid to resource allocation and coordinated development between counties, such as setting up cross-county conferences so that officials from different counties can jointly negotiate development plans.

5. Conclusions

In this study, we reveal the relationship between urbanization, environmental regulation, and environmental quality using econometric models based on panel data from 95 counties in Hengduan Mountain from 2010 to 2019. The results show that the levels of urbanization and environmental regulation in Hengduan Mountain have increased, and the heterogeneity in regional environmental quality has decreased. Urbanization significantly contributes to environmental quality, with heterogeneous effects on different environmental elements—increasing the proportion of wetlands and green areas per capita but suppressing vegetation coverage and production efficiency. Environmental regulation is a mechanism that explains the promoting effect of urbanization on environmental quality in Hengduan Mountain. Environmental regulation promotes local environmental quality but brings negative externalities to neighboring areas. Based on the findings of this study, it is recommended that policymakers gradually implement urbanization under environmental regulation.
This study has some limitations. First, although we have built an environmental quality evaluation system from a multi-dimensional perspective based on existing multi-source remote sensing data, the current evaluation system still does not cover all elements of environmental quality. Future studies could establish an interdisciplinary expert group to construct a more systematic evaluation index system. Second, this study leaves room for a comparative analysis of ecologically fragile areas under different backgrounds, such as religious beliefs, development status, and traditional cultures. Therefore, more empirical evidence is needed to systematically study the impact of urbanization on environmental quality in ecologically fragile areas. Finally, the current modeling methods are only able to reflect the impact of environmental regulation on neighboring counties’ environmental quality and cannot clarify whether there is any impact on environmental quality in further counties. Therefore, future studies can consider improving the empirical methods further to clarify the spatial spillover effects of environmental regulation.
Human activities have maintained a tense relationship with the natural environment for a long time in ecologically fragile areas. In the new era of rapid global social development, in particular, the protection of the natural environment in ecologically fragile areas has become an essential prerequisite for sustainable development. To achieve the win-win goal of socio-economic development and environmental remediation, it is necessary to understand the internal relationship between urbanization and environmental quality. Therefore, we believe that this study is a step toward formulating more sustainable urbanization policies in ecologically fragile areas.

Author Contributions

Conceptualization, J.W.; methodology, J.W. and R.W.; software, R.W.; investigation, J.W. and R.W.; data curation, J.W.; writing—original draft preparation, R.W. and J.W.; writing—review and editing, J.W.; visualization, J.W.; supervision, J.W.; project administration, J.W.; funding acquisition, J.W. All authors have read and agreed to the published version of the manuscript.

Funding

This research was funded by the Sichuan Science and Technology Program (Grant Number 2023NSFSC0749); the Chengdu Philosophy and Social Science Program (NY0520231283); the Research Center for Tuojiang River Basin High Quality Development (TJGZL2023-01); and the Philosophy and Social Science Research Fund of Chengdu University of Technology (Grant Number YJ2023-PY008).

Data Availability Statement

Data are available from the authors upon request.

Conflicts of Interest

The authors declare no conflicts of interest.

Appendix A. Combination Weighting Methods

We applied the analytic hierarchy process (AHP), the entropy weight method (EWM), and the game-theory combination weighting method to define each element’s weight and calculate the value of environmental quality, conducting the following steps:
Step 1: Standardization.
To make the data comparable, we transformed the data into 0–1, using Formula (A1) for positive indicators and Formula (A2) for negative indicators.
x i j = x i j min x i j max x i j min x i j
x i j = m a x ( x i j ) x i j m a x ( x i j ) m i n ( x i j )
where x i j is the normalized value; x i j is the original value of index j in county i ; and m i n ( x i j ) and m a x ( x i j ) are the minimum and maximum values on index j .
Step 2: EWM.
It is an objective weighting method that determines the weight according to variations in index value and data size. The weight ω j for index j is calculated by Formulas (A3) to (A6).
ρ i j = x i j i = 1 n x i j , ( i = 1 , 2 , 3 , , n ; j = 1 , 2 , 3 , , m )
e j = 1 ln n i = 1 n ρ i j ln ρ i j , ( j = 1 , 2 , 3 , , m )
d j = 1 e j
ω j = d j j = 1 m d j , ( j = 1 , 2 , 3 , , m )
Step 3: AHP.
It is a subjective weighting method widely used in the research of composite index systems. We found seven experts to evaluate the pairwise importance of all indexes through a ten-point Likert scale. Their information is listed in Table A1. These experts all have at least seven years of experience in fields related to urbanization, environmental quality, or environmental regulation. The consistency of evaluation results was tested by consistency ratio (CR), and we asked corresponding experts to re-score when the CR value was greater than 0.1 until all matrices had passed the consistency test. Finally, we obtained the AHP weight ω j for index j .
Table A1. Expert information in AHP.
ExpertsAgeGenderOrganizationRole
A35Male UniversityLecturer
B32FemaleGovernmentSection chief
C36FemaleUniversityProfessor
D48MaleUniversityProfessor
E42FemaleUniversityProfessor
F38FemaleCompanyTechnical director
G35MaleUniversityAssociate professor
Step 4: Game-theory combination weighting method.
It used Nash equilibrium to obtain weight with both subjective and objective weights to improve the scientificity and rationality of index weights [50,51]. The set of weight vectors ω k   = { ω k 1 , ω k 2 ,   …,   ω k m } ( k   = 1, 2, …,   L ) is calculated by different weighting methods, where L is the number of weighting methods and m is the number of indexes. The linear combination of the weight vectors is shown in Formula (A7).
z = k = 1 L α k ω k T ,   α k > 0
Using game theory to identify the linear combination coefficient vector α k that minimizes the deviation of z from ω k , as shown in Formula (A8).
m i n k = 1 L α k ω k T ω i T , ( i = 1 , 2 , , L )
According to the differential properties of the matrix, the first-order derivative condition of the above formula optimization is as follows:
k = 1 L α k ω i ω k T = ω i ω i T
Normalize the linear combination coefficient obtained from Formula (A9) using Formula (A10).
α k = α k k = 1 L α k
Calculate the combined weight z * with Formula (A11).
z * = k = 1 L α k ω k T

References

  1. Ren, Y.T.; Li, H.; Shen, L.Y.; Zhang, Y.; Chen, Y.; Wang, J.H. What is the efficiency of fast urbanization? A China study. Sustainability 2018, 10, 3180. [Google Scholar] [CrossRef]
  2. Zhang, H.; Chen, M.X.; Liang, C. Urbanization of county in China: Spatial patterns and influencing factors. J. Geogr. Sci. 2022, 32, 1241–1260. [Google Scholar] [CrossRef]
  3. World Bank. World Bank Open Data. 2021. Available online: http://data.worldbank.org/ (accessed on 30 March 2023).
  4. Hanlon, W.W. Coal smoke, city growth, and the costs of the Industrial Revolution. J. Geogr. Sci. 2020, 130, 462–488. [Google Scholar] [CrossRef]
  5. Yang, X.J. China’s rapid urbanization. Science 2013, 342, 310. [Google Scholar] [CrossRef] [PubMed]
  6. Wolf, M.J.; Emerson, J.W.; Esty, D.C.; de Sherbinin, A.; Wendling, Z.A. Environmental Performance Index; Yale Center for Environmental Law & Policy: New Haven, CT, USA, 2022; Available online: https://epi.yale.edu (accessed on 30 March 2023).
  7. Bryan, B.A.; Gao, L.; Ye, Y.Q.; Sun, X.F.; Connor, J.D.; Crossman, N.D.; Stafford-Smith, M.; Wu, J.G.; He, C.Y.; Yu, D.Y.; et al. China’s response to a national land-system sustainability emergency. Nature 2018, 559, 193–204. [Google Scholar] [CrossRef] [PubMed]
  8. Guan, X.L.; Wei, H.K.; Lu, S.S.; Dai, Q.; Su, H.J. Assessment on the urbanization strategy in China: Achievements, challenges and reflections. Habitat Int. 2018, 71, 97–109. [Google Scholar] [CrossRef]
  9. Dadashpoor, H.; Azizi, P.; Moghadasi, M. Land use change, urbanization, and change in landscape pattern in a metropolitan area. Sci. Total Environ. 2019, 655, 707–719. [Google Scholar] [CrossRef] [PubMed]
  10. Qi, G.; Che, J.; Wang, Z. Differential effects of urbanization on air pollution: Evidences from six air pollutants in mainland China. Ecol. Indic. 2023, 146, 109924. [Google Scholar] [CrossRef]
  11. Zhang, X.X.; Brandt, M.; Tong, X.W.; Ciais, P.; Yue, Y.M.; Xiao, X.M.; Zhang, W.M.; Wang, K.L.; Fensholt, R. A large but transient carbon sink from urbanization and rural depopulation in China. Nat. Sustain. 2022, 5, 321. [Google Scholar] [CrossRef]
  12. Zhou, W.Q.; Zhang, S.; Yu, W.J.; Wang, J.; Wang, W.M. Effects of urban expansion on forest loss and fragmentation in six megaregions, China. Remote Sens. 2017, 9, 991. [Google Scholar] [CrossRef]
  13. Zhou, W.Q.; Yu, W.J.; Qian, Y.G.; Han, L.J.; Pickett, S.; Wang, J.; Li, W.F.; Ouyang, Z.Y. Beyond city expansion: Multi-scale environmental impacts of urban megaregion formation in China. Natl. Sci. Rev. 2022, 9, nwab107. [Google Scholar] [CrossRef] [PubMed]
  14. Hu, J.J.; Huang, Y.; Du, J. The impact of urban development intensity on ecological carrying capacity: A case study of ecologically fragile areas. Int. J. Environ. Res. Public Health 2021, 18, 7094. [Google Scholar] [CrossRef] [PubMed]
  15. Gong, X.W.; Li, Y.Q.; Wang, X.Y.; Zhang, Z.S.; Lian, J.; Ma, L.; Chen, Y.; Li, M.Y.; Si, H.T.; Cao, W.J. Quantitative assessment of the contributions of climate change and human activities on vegetation degradation and restoration in typical ecologically fragile areas of China. Ecol. Indic. 2022, 144, 109536. [Google Scholar] [CrossRef]
  16. Sun, J.R.; Zhou, L.; Zong, H. Landscape pattern vulnerability of the eastern Hengduan Mountains, China and response to elevation and artificial disturbance. Land 2022, 11, 1110. [Google Scholar] [CrossRef]
  17. Yin, L.; Dai, E.F.; Zheng, D.; Wang, Y.H.; Ma, L.; Tong, M. What drives the vegetation dynamics in the Hengduan Mountain region, Southwest China: Climate change or human activity? Ecol. Indic. 2020, 112, 106013. [Google Scholar] [CrossRef]
  18. Liu, Y.S.; Guo, Y.Z.; Zhou, Y. Poverty alleviation in rural China: Policy changes, future challenges and policy implications. China Agr. Econ. Rev. 2018, 10, 241–259. [Google Scholar] [CrossRef]
  19. Seto, K.C.; Güneralp, B.; Hutyra, L.R. Global forecasts of urban expansion to 2030 and direct impacts on biodiversity and carbon pools. Proc. Natl. Acad. Sci. India B 2012, 109, 16083–16088. [Google Scholar] [CrossRef] [PubMed]
  20. Li, J.; Wang, Z.L.; Lai, C.G.; Wu, X.Q.; Zeng, Z.Y.; Chen, X.H.; Lian, Y.Q. Response of net primary production to land use and land cover change in mainland China since the late 1980S. Sci. Total. Environ. 2018, 639, 237–247. [Google Scholar] [CrossRef] [PubMed]
  21. McDonald, R.I.; Mansur, A.V.; Ascensao, F.; Colbert, M.; Crossman, K.; Elmqvist, T.; Gonzalez, A.; Guneralp, B.; Haase, D.; Hamann, M.; et al. Research gaps in knowledge of the impact of urban growth on biodiversity. Nat. Sustain. 2020, 3, 16–24. [Google Scholar] [CrossRef]
  22. Zhou, T.Y.; Liu, H.M.; Gou, P.; Xu, N. Conflict or coordination? Measuring the relationships between urbanization and vegetation cover in China. Ecol. Indic. 2023, 147, 109993. [Google Scholar] [CrossRef]
  23. Chu, M.R.; Lu, J.Y.; Sun, D.Q. Influence of urban agglomeration expansion on fragmentation of green space: A case study of Beijing-Tianjin-Hebei urban agglomeration. Land 2022, 11, 275. [Google Scholar] [CrossRef]
  24. Sun, Y.; Liu, S.; Dong, Y.; An, Y.; Shi, F.; Dong, S.; Liu, G. Spatio-temporal evolution scenarios and the coupling analysis of ecosystem services with land use change in China. Sci. Total. Environ. 2019, 681, 211–225. [Google Scholar] [CrossRef] [PubMed]
  25. Heurtebise, J.Y. Sustainability and ecological civilization in the age of Anthropocene: An epistemological analysis of the psychosocial and “culturalist” interpretations of global environmental risks. Sustainability 2017, 9, 1331. [Google Scholar] [CrossRef]
  26. Huang, A.; Xu, Y.; Sun, P.; Zhou, G.; Liu, C.; Lu, L.; Xiang, Y.; Wang, H. Land use/land cover changes and its impact on ecosystem services in ecologically fragile zone: A case study of Zhangjiakou city, Hebei Province, China. Ecol. Indic. 2019, 104, 604–614. [Google Scholar] [CrossRef]
  27. Liao, S.J.; Wu, Y.; Wong, S.W.; Shen, L.Y. Provincial perspective analysis on the coordination between urbanization growth and resource environment carrying capacity (recc) in China. Sci. Total. Environ. 2020, 730, 138964. [Google Scholar] [CrossRef]
  28. Zhang, W.M.; Randall, M.; Jensen, M.B.; Brandt, M.; Wang, Q.; Fensholt, R. Socio-economic and climatic changes lead to contrasting global urban vegetation trends. Global Environ. Chang. 2021, 71, 102385. [Google Scholar] [CrossRef]
  29. Liu, X.H.; Wang, E.X.; Cai, D.T. Environmental regulation and corporate financing-quasi-natural experiment evidence from China. Sustainability 2018, 10, 4028. [Google Scholar] [CrossRef]
  30. Shao, Y.M.; Chen, Z.F. Can government subsidies promote the green technology innovation transformation? Evidence from Chinese listed companies. Econ. Anal. Policy 2022, 74, 716–727. [Google Scholar] [CrossRef]
  31. Feng, Q.; Teo, T.S.H.; Sun, T. Effects of official and unofficial environmental regulations on environmental quality: Evidence from the Yangtze River Economic Belt, China. Environ. Res. 2023, 226, 115667. [Google Scholar] [CrossRef] [PubMed]
  32. Konisky, D.M. Regulatory competition and environmental enforcement: Is there a race to the bottom? Am. J. Polit. Sci. 2007, 51, 853–872. [Google Scholar] [CrossRef]
  33. Wu, H.Y.; Guo, H.X.; Zhang, B.; Bu, M.L. Westward movement of new polluting firms in China: Pollution reduction mandates and location choice. J. Comp. Econ. 2017, 45, 119–138. [Google Scholar] [CrossRef]
  34. Wang, Y.; Gao, W.; Wang, S.; Song, T.; Gong, Z.; Ji, D.; Wang, L.; Liu, Z.; Tang, G.; Huo, Y.; et al. Contrasting trends of pm2.5 and surface-ozone concentrations in China from 2013 to 2017. Natl. Sci. Rev. 2020, 7, 1331–1339. [Google Scholar] [CrossRef] [PubMed]
  35. Liu, D.S.; Wang, R.Q.; Thompson, J.R. Don’t cheat Chinese environment laws. Nature 2020, 578, 37. [Google Scholar] [CrossRef] [PubMed]
  36. Chen, Z.; Kahn, M.E.; Liu, Y.; Wang, Z. The consequences of spatially differentiated water pollution regulation in China. J. Environ. Econ. Manag. 2018, 88, 468–485. [Google Scholar] [CrossRef]
  37. Peng, X. Strategic interaction of environmental regulation and green productivity growth in China: Green innovation or pollution refuge? Sci. Total Environ. 2020, 732, 139200. [Google Scholar] [CrossRef] [PubMed]
  38. Lipscomb, M.; Mobarak, A.M. Decentralization and pollution spillovers: Evidence from the re-drawing of county borders in Brazil. Rev. Econ. Stud. 2017, 84, 464–502. [Google Scholar] [CrossRef]
  39. Wang, Y.H.; Dai, E.F.; Ge, Q.S.; Zhang, X.Z.; Yu, C.Q. Spatial heterogeneity of ecosystem services and their trade-offs in the Hengduan Mountain region, Southwest China. Catena 2021, 207, 105623. [Google Scholar] [CrossRef]
  40. Yang, Q.Y.; Zheng, D. An outline of physic-geographic regionalization of the Hengduan Mountainous region. Mt. Res. 1989, 7, 56–63. (In Chinese) [Google Scholar]
  41. Wang, Y.H.; Dai, E.F.; Yin, L.; Ma, L. Land use/land cover change and the effects on ecosystem services in the Hengduan Mountain region, China. Ecosyst. Serv. 2018, 34, 55–67. [Google Scholar] [CrossRef]
  42. Li, J.Y. An assessment of ecological protection importance based on ecosystems services and vulnerabilities in Tibet, China. Sustainability 2022, 14, 12902. [Google Scholar] [CrossRef]
  43. Chen, T.T.; Peng, L.; Wang, Q.; Liu, S.Q. Measuring the coordinated development of ecological and economic systems in Hengduan Mountain area. Sustainability 2017, 9, 1270. [Google Scholar] [CrossRef]
  44. Wang, D.; Ding, W. Spatial pattern of the ecological environment in Yunnan Province. PLoS ONE 2021, 16, e248090. [Google Scholar] [CrossRef] [PubMed]
  45. Jiang, L.G.; Liu, Y.; Wu, S.; Yang, C. Analyzing ecological environment change and associated driving factors in China based on NDVI time series data. Ecol. Indic. 2021, 129, 107933. [Google Scholar] [CrossRef]
  46. Su, L. The impact of coordinated development of ecological environment and technological innovation on green economy: Evidence from China. Int. J. Environ. Res. Public Health 2022, 19, 6994. [Google Scholar] [CrossRef]
  47. Chen, S.F.; Zhang, Q.F.; Chen, Y.N.; Zhou, H.H.; Xiang, Y.Y.; Liu, Z.H.; Hou, Y.F. Vegetation change and eco-environmental quality evaluation in the Loess Plateau of China from 2000 to 2020. Remote Sens. 2023, 15, 424. [Google Scholar] [CrossRef]
  48. Jiao, L.; Luo, F.; Wu, F.; Zhang, Y.; Huo, X.; Wu, Y. Exploring the interactive coercing relationship between urban rail transit and the ecological environment. Land 2022, 11, 836. [Google Scholar] [CrossRef]
  49. Zou, C.; Zhu, J.W.; Lou, K.L.; Yang, L. Coupling coordination and spatiotemporal heterogeneity between urbanization and ecological environment in Shaanxi Province, China. Ecol. Indic. 2022, 141, 109152. [Google Scholar] [CrossRef]
  50. Peng, J.Q.; Zhang, J.M. Urban flooding risk assessment based on gis- game theory combination weight: A case study of Zhengzhou city. Int. J. Disaster Risk Reduct. 2022, 77, 103080. [Google Scholar] [CrossRef]
  51. Xia, C.H.; Zhai, G.F. The spatiotemporal evolution pattern of urban resilience in the Yangtze River Delta urban agglomeration based on topsis-pso-elm. Sustain. Cities Soc. 2022, 87, 104223. [Google Scholar] [CrossRef]
  52. Zhang, B.F.; Zhang, J.; Miao, C.H. Urbanization level in Chinese counties: Imbalance pattern and driving force. Remote Sens. 2022, 14, 2268. [Google Scholar] [CrossRef]
  53. Zhang, R.J.; Jiang, G.H.; Zhang, Q. Does urbanization always lead to rural hollowing? Assessing the spatio-temporal variations in this relationship at the county level in China 2000–2015. J. Clean. Prod. 2019, 220, 9–22. [Google Scholar] [CrossRef]
  54. Song, S.; Honglin Zhang, K. Urbanisation and city size distribution in China. Urban Stud. 2002, 39, 2317–2327. [Google Scholar] [CrossRef]
  55. Liu, Y.; Yang, R.; Li, Y. Potential of land consolidation of hollowed villages under different urbanization scenarios in China. J. Geogr. Sci. 2013, 23, 503–512. [Google Scholar] [CrossRef]
  56. Wu, J.S.; Cheng, D.J.; Xu, Y.Y.; Huang, Q.; Feng, Z. Spatial-temporal change of ecosystem health across China: Urbanization impact perspective. J. Clean. Prod. 2021, 326, 129393. [Google Scholar] [CrossRef]
  57. Yu, H.W.; Xu, J.H.; Shen, F.; Fang, D.B.; Shi, D.Q. The effects of an environmental accountability system on local environmental governance and firms’ emissions. Econ. Syst. 2022, 46, 100987. [Google Scholar] [CrossRef]
  58. Li, F.Y.; Wang, Z.; Huang, L.X. Economic growth target and environmental regulation intensity: Evidence from 284 cities in China. Environ. Sci. Pollut. Res. 2022, 29, 10235–10249. [Google Scholar] [CrossRef] [PubMed]
  59. Yang, J.; Huang, X. The 30 m annual land cover dataset and its dynamics in China from 1990 to 2019. Earth Syst. Sci. Data 2021, 13, 3907–3925. [Google Scholar] [CrossRef]
  60. Nunn, N.; Qian, N. Us food aid and civil conflict. Am. Econ. Rev. 2014, 104, 1630–1666. [Google Scholar] [CrossRef]
  61. Maydeu-Olivares, A.; Shi, D.; Rosseel, Y. Instrumental variables two-stage least squares (2sls) vs. maximum likelihood structural equation modeling of causal effects in linear regression models. Struct. Equ. Model. 2019, 26, 876–892. [Google Scholar] [CrossRef]
  62. Dou, Y.Y.; Kuang, W.H. A comparative analysis of urban impervious surface and green space and their dynamics among 318 different size cities in China in the past 25 years. Sci. Total Environ. 2020, 706, 135828. [Google Scholar] [CrossRef] [PubMed]
  63. Jim, C.Y. Sustainable urban greening strategies for compact cities in developing and developed economies. Urban Ecosyst. 2013, 16, 741–761. [Google Scholar] [CrossRef]
  64. Li, W.; An, M.; Wu, H.; An, H.; Huang, J.; Khanal, R. The local coupling and telecoupling of urbanization and ecological environment quality based on multi-source remote sensing data. J. Environ. Manage. 2023, 327, 116921. [Google Scholar] [CrossRef]
  65. Zhong, Z.Q.; Chen, Z.G. Urbanization, green development and residents’ happiness: The moderating role of environmental regulation. Environ. Impact Assess. 2022, 97, 106900. [Google Scholar] [CrossRef]
  66. Shi, S.W.; Han, P.F. Estimating the soil carbon sequestration potential of China’s Grain for Green Project. Glob. Biogeochem. Cycles 2014, 28, 1279–1294. [Google Scholar] [CrossRef]
Figure 1. Analytical framework of this study.
Land 13 00503 g001
Figure 2. The Hengduan Mountain region. (a) The location of Hengduan Mountain; (b) The elevation map of Hengduan Mountain. Note: The map is based on the standard map of the Ministry of Natural Resources of the People’s Republic of China (review number GS (2019) 1822), with no changes to the base map boundary.
Land 13 00503 g002
Figure 3. Spatial–temporal distribution of environmental quality, urbanization, and environmental regulation. (ad) environmental quality in 2010, 2013, 2016, and 2019; (eh) environmental quality in 2010, 2013, 2016, and 2019; (il) urbanization in 2010, 2013, 2016, and 2019.
Land 13 00503 g003
Table 1. Elements of environmental quality in this study.
IndicatorMeaning+/−Abbr.Weight
Mean annual net primary production (NPP) [47]Vegetation production efficiency+NPP0.070
Mean annual concentration of PM2.5 [48]Air pollutionPM2.50.071
Mean annual fraction of vegetation coverage (FVC) [44]Vegetation coverage+FVC0.603
Per capita wetland area [46]Freshwater productivity and biodiversity+Wetland0.146
Per capita green area [49]Vegetation redundancy+Green0.111
Table 2. Descriptive statistics of variables.
VariableNMeanS.D.Unit
Environmental quality9500.2100.064-
NPP950729.523242.623-
PM2.595016.28710.223μg/m3
FVC9500.9030.060%
Wetland9500.0460.380100 m2/person
Green950452.021558.684100 m2/person
Urbanization9500.2490.159%
Environmental term frequency95022.1668.695time
Environmental term proportion9500.0030.001%
Industrial structure9500.3730.124%
GDP9505.8347.617billion CNY
Population density9507.5937.4371000 persons/km2
Slope9523.6344.800%
Table 3. The level interval of variables.
LevelEQUrbTF×IS
Level Ⅰ0.000–0.1540.000–0.1260.000–5.492
Level Ⅱ0.154–0.2000.126–0.2065.492–7.459
Level Ⅲ0.200–0.2320.206–0.2927.459–9.195
Level Ⅳ0.232–0.2990.292–0.4439.195–11.243
Level Ⅴ0.299–1.0000.443–1.00011.243–19.440
Table 4. Results of the baseline regression of urbanization on environmental quality.
Variable(1)(2)
EQEQ
YUrb−0.021 ***
(−0.008)
YL1_Urb −0.002
(−0.007)
ControlYesYes
YearYesYes
CityYesYes
_consYesYes
N950950
R20.9320.931
Note: *** denotes 1% significance levels. The values in parentheses are standard errors.
Table 5. Results of the IV regression of urbanization on environmental quality.
Variable(1)(2)
EQEQ
Urb0.315 ***
(0.116)
L1_Urb 0.301 ***
(0.111)
ControlYesYes
YearYesYes
CityYesYes
_consYesYes
First stage F21.0321.03
N950950
R20.9320.932
Note: *** denotes 1% significance levels. The values in parentheses are standard errors.
Table 6. Results of the influence of urbanization on environmental elements.
Variable(1)(2)(3)(4)(5)
PM2.5NPPFVCWetlandGreen
Urb11.606−978.565 ***−0.322 ***3.364 ***922.920 **
(38.388)(175.210)(0.078)(0.678)(376.046)
ControlYesYesYesYesYes
YearYesYesYesYesYes
CityYesYesYesYesYes
_consYesYesYesYesYes
First stage F27.3627.3627.3627.3627.36
N950950950950950
R20.7130.9890.9660.9350.991
Note: ** and *** denote 5% and 1% significance levels, respectively. The values in parentheses are standard errors.
Table 7. Results of the IV regression of urbanization on environmental regulation.
Variable(1)(2)(3)(4)
TFISTPISTFISTPIS
Urb104.742 ***0.015 ***
(17.214)(0.002)
L1_Urb 100.073 ***0.014 ***
(16.447)(0.002)
ControlYesYesYesYes
YearYesYesYesYes
CityYesYesYesYes
_consYesYesYesYes
First stage F27.3627.3621.0321.03
N950950950950
R20.6700.6800.6700.680
Note: *** denotes 1% significance levels. The values in parentheses are standard errors.
Table 8. Results of the IV regression of environmental regulation on environmental quality.
Variable(1)(2)(3)(4)
EQEQEQEQ
TFIS0.003 ***
(0.001)
TPIS 22.686 ***
(8.151)
L1_TFIS 0.007 ***
(0.003)
L1_TPIS 35.649 ***
(12.808)
ControlYesYesYesYes
YearYesYesYesYes
CityYesYesYesYes
_consYesYesYesYes
First stage F16.3417.0714.3614.19
N950950950950
R20.9320.9320.9320.932
Note: *** denotes 1% significance levels. The values in parentheses are standard errors.
Table 9. Results of spatial econometric models of environmental regulation on environmental quality.
Variable(1)(2)(3)(4)(5)(6)(7)(8)
EQEQEQEQEQEQEQEQ
TFIS0.019 *** 0.013 *** 0.014 ***
(0.002) (0.001) (0.001)
TPIS 136.443 *** 91.492 *** 103.135 ***
(11.685) (9.321) (10.063)
L1_TFIS 0.043 ***
(0.004)
L1_TPIS 214.411 ***
(18.362)
W×TFIS−0.024 *** −0.065 *** −0.030 ***
(0.002) (0.010) (0.004)
W×TPIS −173.115 *** −475.308 *** −221.324 ***
(17.354) (72.066) (27.294)
W×L1_TFIS −0.055 ***
(0.006)
W×L1_TPIS −272.041 ***
(27.271)
Spatial-rho0.327 ***0.327 ***0.327 ***0.320 ***0.660 ***0.660 ***0.556 ***0.556 ***
(0.038)(0.038)(0.038)(0.038)(0.093)(0.093)(0.061)(0.061)
ControlYesYesYesYesYesYesYesYes
YearYesYesYesYesYesYesYesYes
CityYesYesYesYesYesYesYesYes
_consYesYesYesYesYesYesYesYes
First stage F16.3417.0714.3614.1916.3417.0716.3417.07
N950950950950950950950950
R20.2510.2510.2510.2510.1640.1640.1840.184
Note: *** denotes 1% significance levels. The values in parentheses are standard errors.
Disclaimer/Publisher’s Note: The statements, opinions and data contained in all publications are solely those of the individual author(s) and contributor(s) and not of MDPI and/or the editor(s). MDPI and/or the editor(s) disclaim responsibility for any injury to people or property resulting from any ideas, methods, instructions or products referred to in the content.

