Article

Analysis of Spatio-Temporal Evolution and Driving Factors of Eco-Environmental Quality during Highway Construction Based on RSEI

1
School of Geographical Sciences, Harbin Normal University, Harbin 150025, China
2
Heilongjiang Province Key Laboratory of Geographical Environment Monitoring and Spatial Information Service in Cold Regions, Harbin Normal University, Harbin 150025, China
3
Antai College of Economics and Management, Shanghai Jiao Tong University, Shanghai 200030, China
4
School of Economic and Management, Chang’an University, Xi’an 710064, China
*
Author to whom correspondence should be addressed.
These authors contributed equally to this work.
Land 2024, 13(4), 504; https://doi.org/10.3390/land13040504
Submission received: 3 March 2024 / Revised: 4 April 2024 / Accepted: 10 April 2024 / Published: 12 April 2024

Abstract

:
One essential part of transportation infrastructure is highways. The surrounding eco-environment is greatly impacted by the construction of highways. However, few studies have investigated changes in eco-environmental quality during highway construction, and the main impact areas of the construction have not been clarified. The highway from Sunit Right Banner to Huade (Inner Mongolia–Hebei border) was used as the study area. GEE was used to establish RSEI. During highway construction, Sen + M-K trend analysis, Hurst analysis, and Geodetector were employed to assess RSEI changes and driving factors. The results show the following: (1) An area of 1500 m around the highway is where the ecological impact of highway construction will be the greatest. (2) The curve of the annual mean of the RSEI from 2016 to 2021 is V-shaped. From northwest to southeast, there is an increasing trend in spatial distribution. (3) The largest environmental degradation during highway construction occurred during the first year of highway construction. (4) The factor detector results indicate that DEM, precipitation, distance from the administrative district, and FVC were the main RSEI drivers in the research region. The interaction detector’s findings show that the drivers’ combined influence on the RSEI was greater than that of their individual components. (5) Compared to the 2016–2021 trend, the proportion of future degraded areas in terms of eco-environmental quality will increase by 3.16%, while the proportion of improved areas will decrease by 2.99%.

1. Introduction

With the rapid growth of the world’s economies and the accelerating pace of urbanization, there is a significant increase in demand for public transportation infrastructure, such as highways and trains, in many different countries [1]. Public transportation facilities have a multifaceted impact on the eco-environment. Examples include increased landscape fragmentation, land-use efficiency, air pollution, and suppression of animal reproduction [2,3,4,5]. As an important component of linear transportation infrastructure, highways account for a large share of China’s public transportation facilities and will continue to grow. Therefore, achieving a balance between highway construction and eco-environmental protection has become an essential issue that must be addressed for China’s future development. Highway construction’s impacts on an area’s eco-environmental quality must be monitored and assessed in order to support sustainable regional development. This is carried out in order to strike a balance between environmental protection and socio-economic growth [6].
Remote sensing images are critical for monitoring the eco-environment due to their multiple temporal, spatial, and spectral resolution characteristics. Various vegetation parameters can be extracted from remote sensing imagery [7]. In studies on long-term dynamic changes in vegetation, FVC is a crucial metric for tracking vegetation conditions [8]. The EVI is another common indicator for monitoring vegetation cover [9]. The NDVI is widely used to monitor the ecological condition of regions using long time-series data. It is often combined with other factors to conduct an integrated assessment of the eco-environment [10,11]. The LAI has been applied in numerous ecological studies as a key indicator to measure the characteristics of terrestrial ecosystem changes [12]. The TVDI and the LST are widely applied to assess regional environmental thermal conditions [13,14]. However, due to the complex nature of ecosystems and the diverse drivers, using only one ecological indicator to assess regional ecosystems is insufficient. Therefore, many studies have integrated conceptual models that combine various indicators, such as social statistics, remote sensing data, and meteorological data [15]. These studies seek to conduct a holistic and integrated evaluation of the eco-environment. Although the construction of aggregate indices and the application of models can reflect regional eco-environment characteristics, difficulties remain in establishing aggregate indices. The establishment of various indicator weights and the accessibility of socio-economic data are two examples. The RSEI is a composite index to assess the state of the eco-environment. It consists of four remote sensing indicators, NDVI, WET, NDBSI, and LST, and is derived by PCA. It is closely related to ecological health and symbolizes how human activity affects the environment and how we respond to climate change [16]. It also avoids the errors caused by subjective factors in determining the weights. However, using standard remote sensing software (e.g., ENVI) to construct the RSEI to assess regional eco-environmental quality is tedious and time-consuming [17]. In contrast, the GEE is easy to operate. Numerous datasets, including preprocessed Landsat datasets, are available in GEE [18]. Furthermore, investigating the drivers of RSEI is a crucial area of study, and in recent years, Geodetector has been extensively employed in this context. Geodetector was created by Wang et al. in 2010 [19]. The model is less constrained in terms of assumptions and can explore whether there is an interaction between the two factors. It has been extensively employed to the effects of different drivers and the interaction of different drivers on eco-environmental factors [20,21]. With the help of Geodetector, this study makes sense of the intricate mechanisms influencing eco-environmental quality.
The relationship between the role of highways and the environment has been of wide interest, and related research has been conducted from various aspects. Most of the pertinent research that is currently available assesses how roads affect the quality of the local air and soil [22,23,24]. However, it is undeniable that highways will theoretically have an impact on regional ecosystems due to their construction process and operational mechanisms, and numerous studies have proved this fact. According to this study, the construction of highways will significantly alter a region’s land use, and there will be some continuity in the detrimental effects on the ecosystem along routes [25]. In addition, changes in the value of ecosystem services resulting from proximity to highways vary by land-use type [26]. As a direct indicator of regional ecological assessment, forest cover will also be adversely affected during highway construction, which will continue beyond the completion of construction. It is important to remember that the impact’s geographical reach extends beyond the immediate vicinity of the roadway [27]. Similarly, Klarenberg et al. found that road construction will have an impact on vegetation dynamics and thus on regional ecosystem services [28]. While the effects of constructing highways have been extensively studied in the past, the majority of these studies have concentrated on the detrimental effects on soil, air quality, and land-use types. The majority of these studies were conducted after the construction process was completed. The images were chosen from sporadic years, and the majority of the quantitative analysis of the effects of highway construction on the local ecosystem was performed using a single indicator. This is not sufficiently persuasive to identify the impacts of highway construction on the regional ecosystem.
In this study, the RSEI index was used to monitor its impact characteristics, which improved the comprehensiveness of the evaluation indicators. In order to ensure the study’s continuity, the regional eco-environmental quality of the highway was evaluated during its development cycle utilizing image data from years that followed one another. It avoids the lack of systematic evaluation that might result from a study that relies only on images from interrupted years. Furthermore, the primary regional scope of the effects of highway building on the local natural environment was elucidated. To sum up, this research provides a theoretical basis for developing eco-environmental protection strategies in areas where highways are being constructed, carrying out governance projects, and determining the boundaries of protection and governance. Simultaneously, the methods employed in this research can also be employed to evaluate the effects of more highway development on local ecological surroundings, thereby offering scientific backing for the coordinated advancement of highway construction and ecological environmental preservation and administration. This study’s objectives are the following: (1) Determine the primary spatial extent of the impact of highway construction on the eco-environmental quality of the areas along the highway by calculating the indicators and building the RSEI model with the aid of the GEE. (2) Define the spatial and temporal characteristics of eco-environmental quality during the whole cycle of highway construction and monitor the dynamic changes in RSEI in the study area with the help of trend analysis. (3) Explore the driving factors of RSEI in the area along the highway construction with the help of Geodetector. (4) Using the dynamic change characteristics as a basis, forecast the trajectory of environmental quality in the research area going forward.

2. Materials and Methods

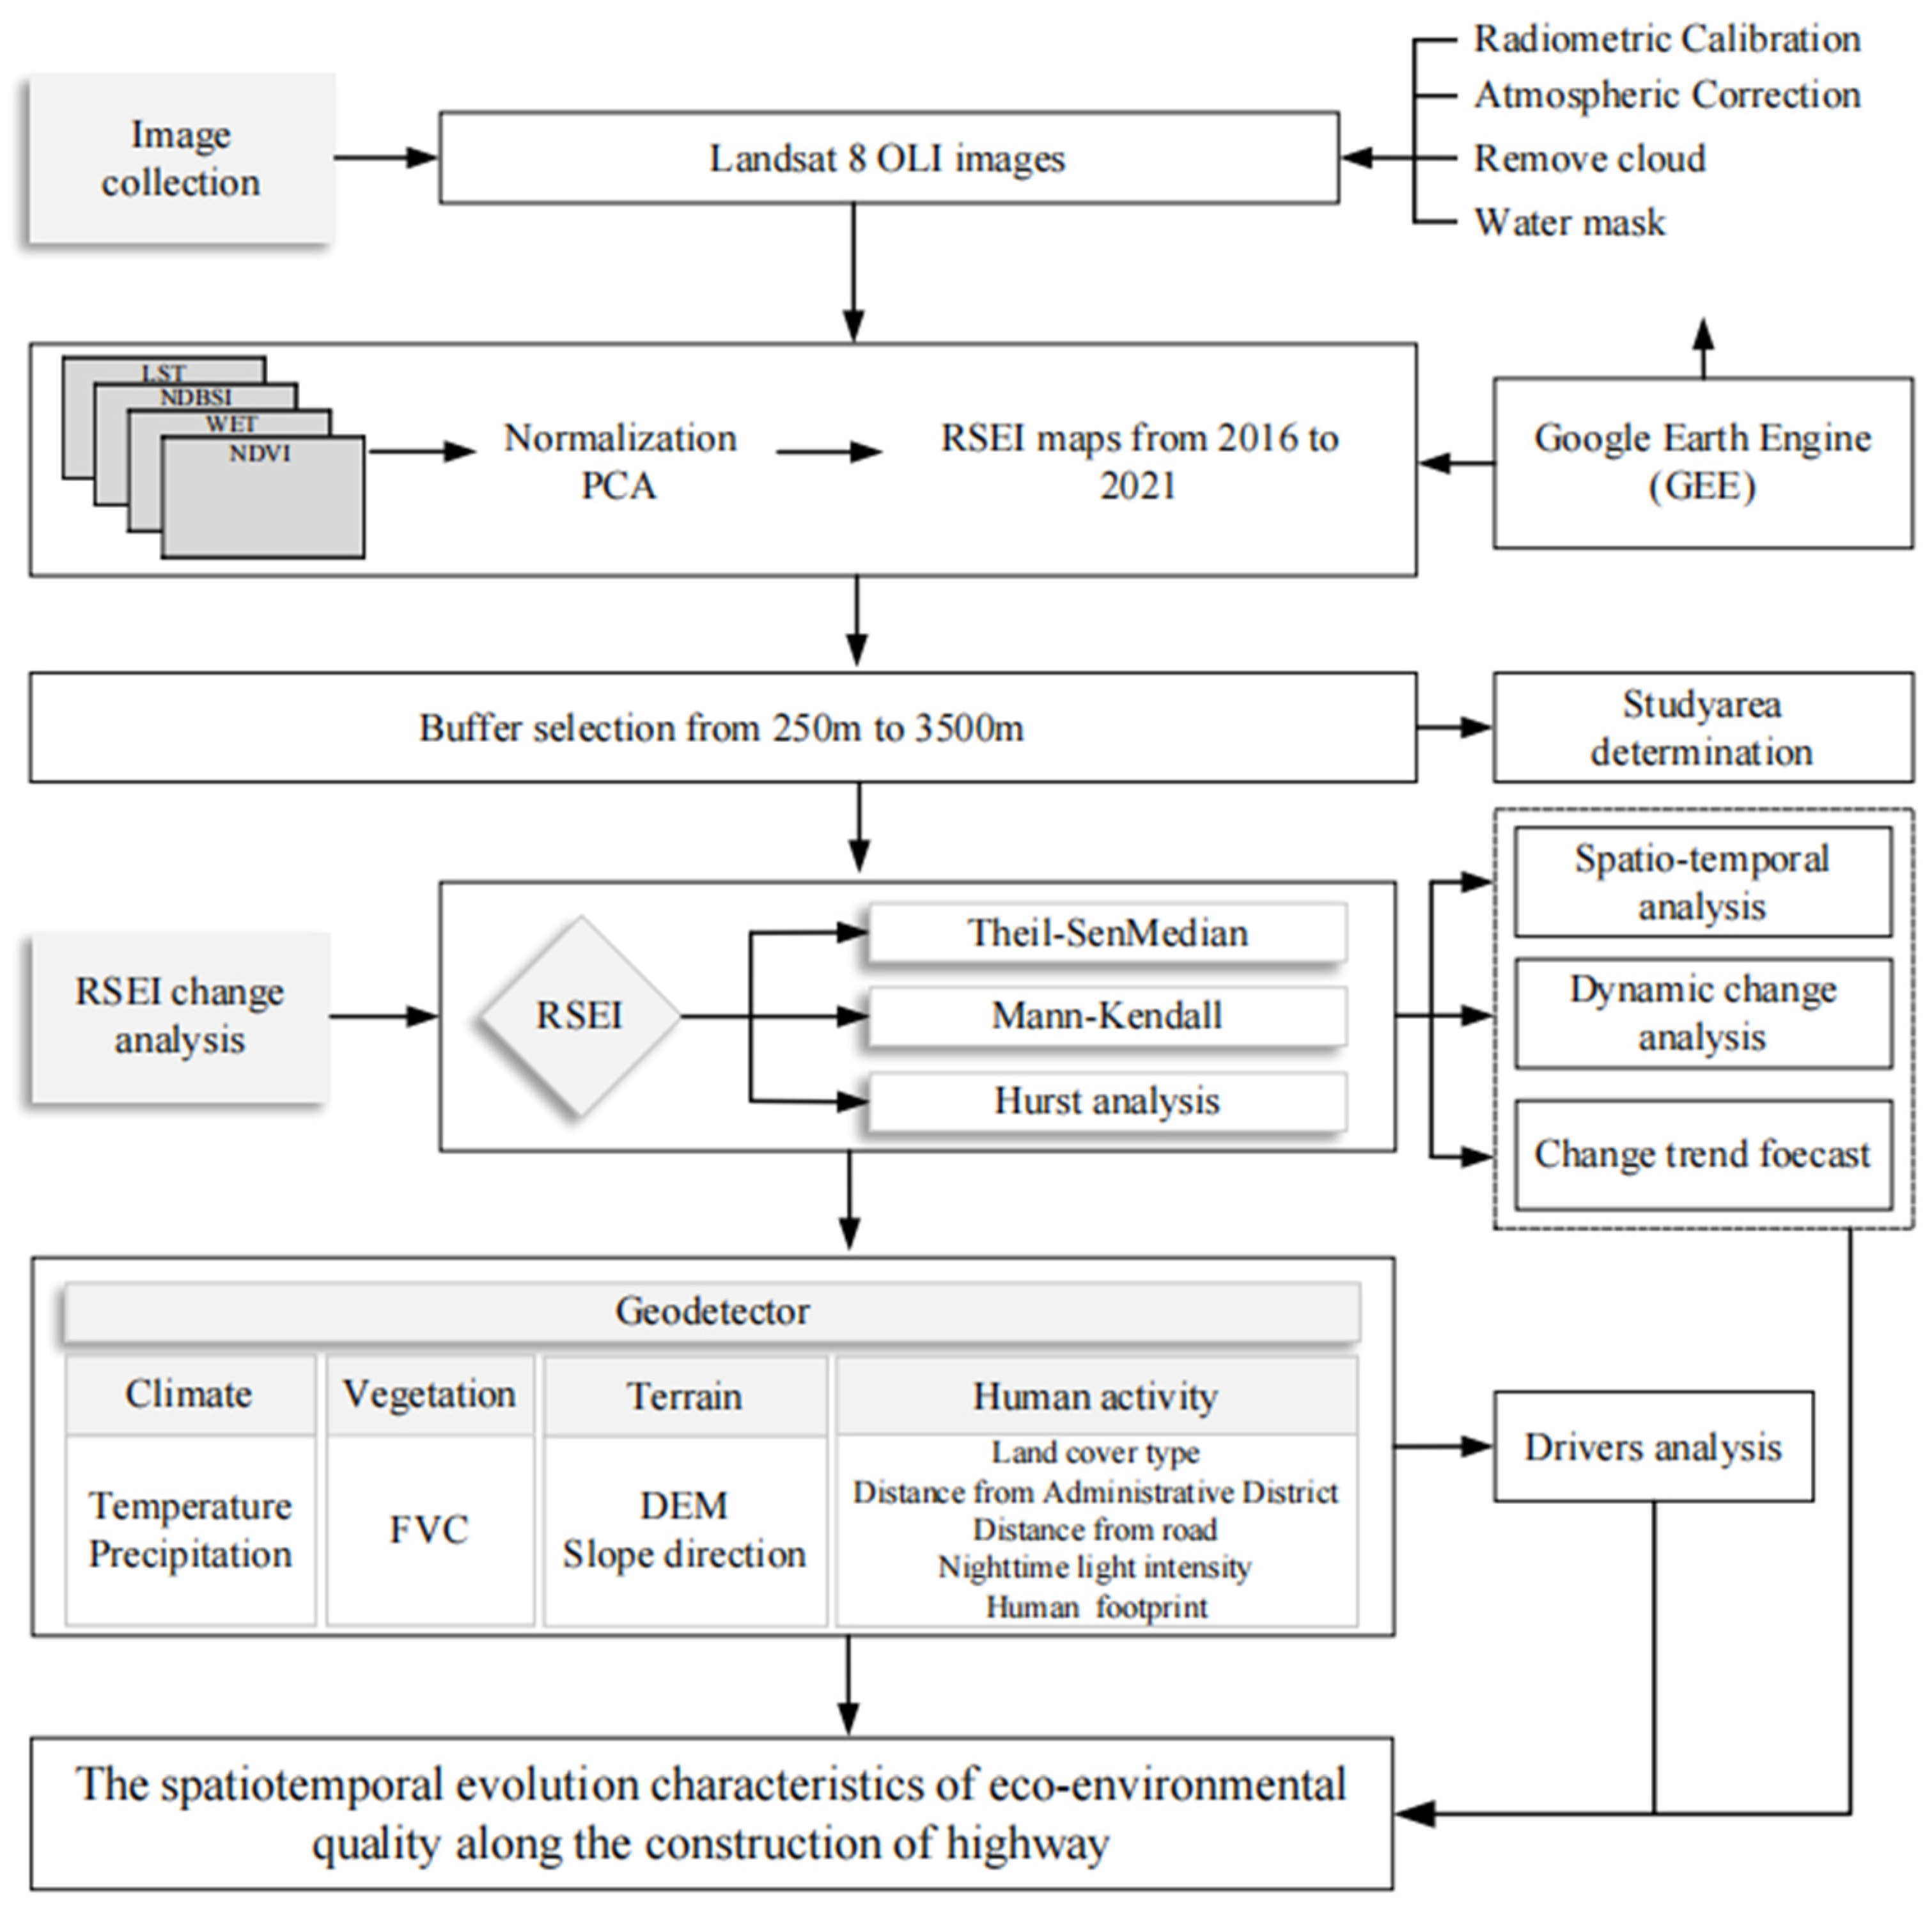
2.1. Research Framework
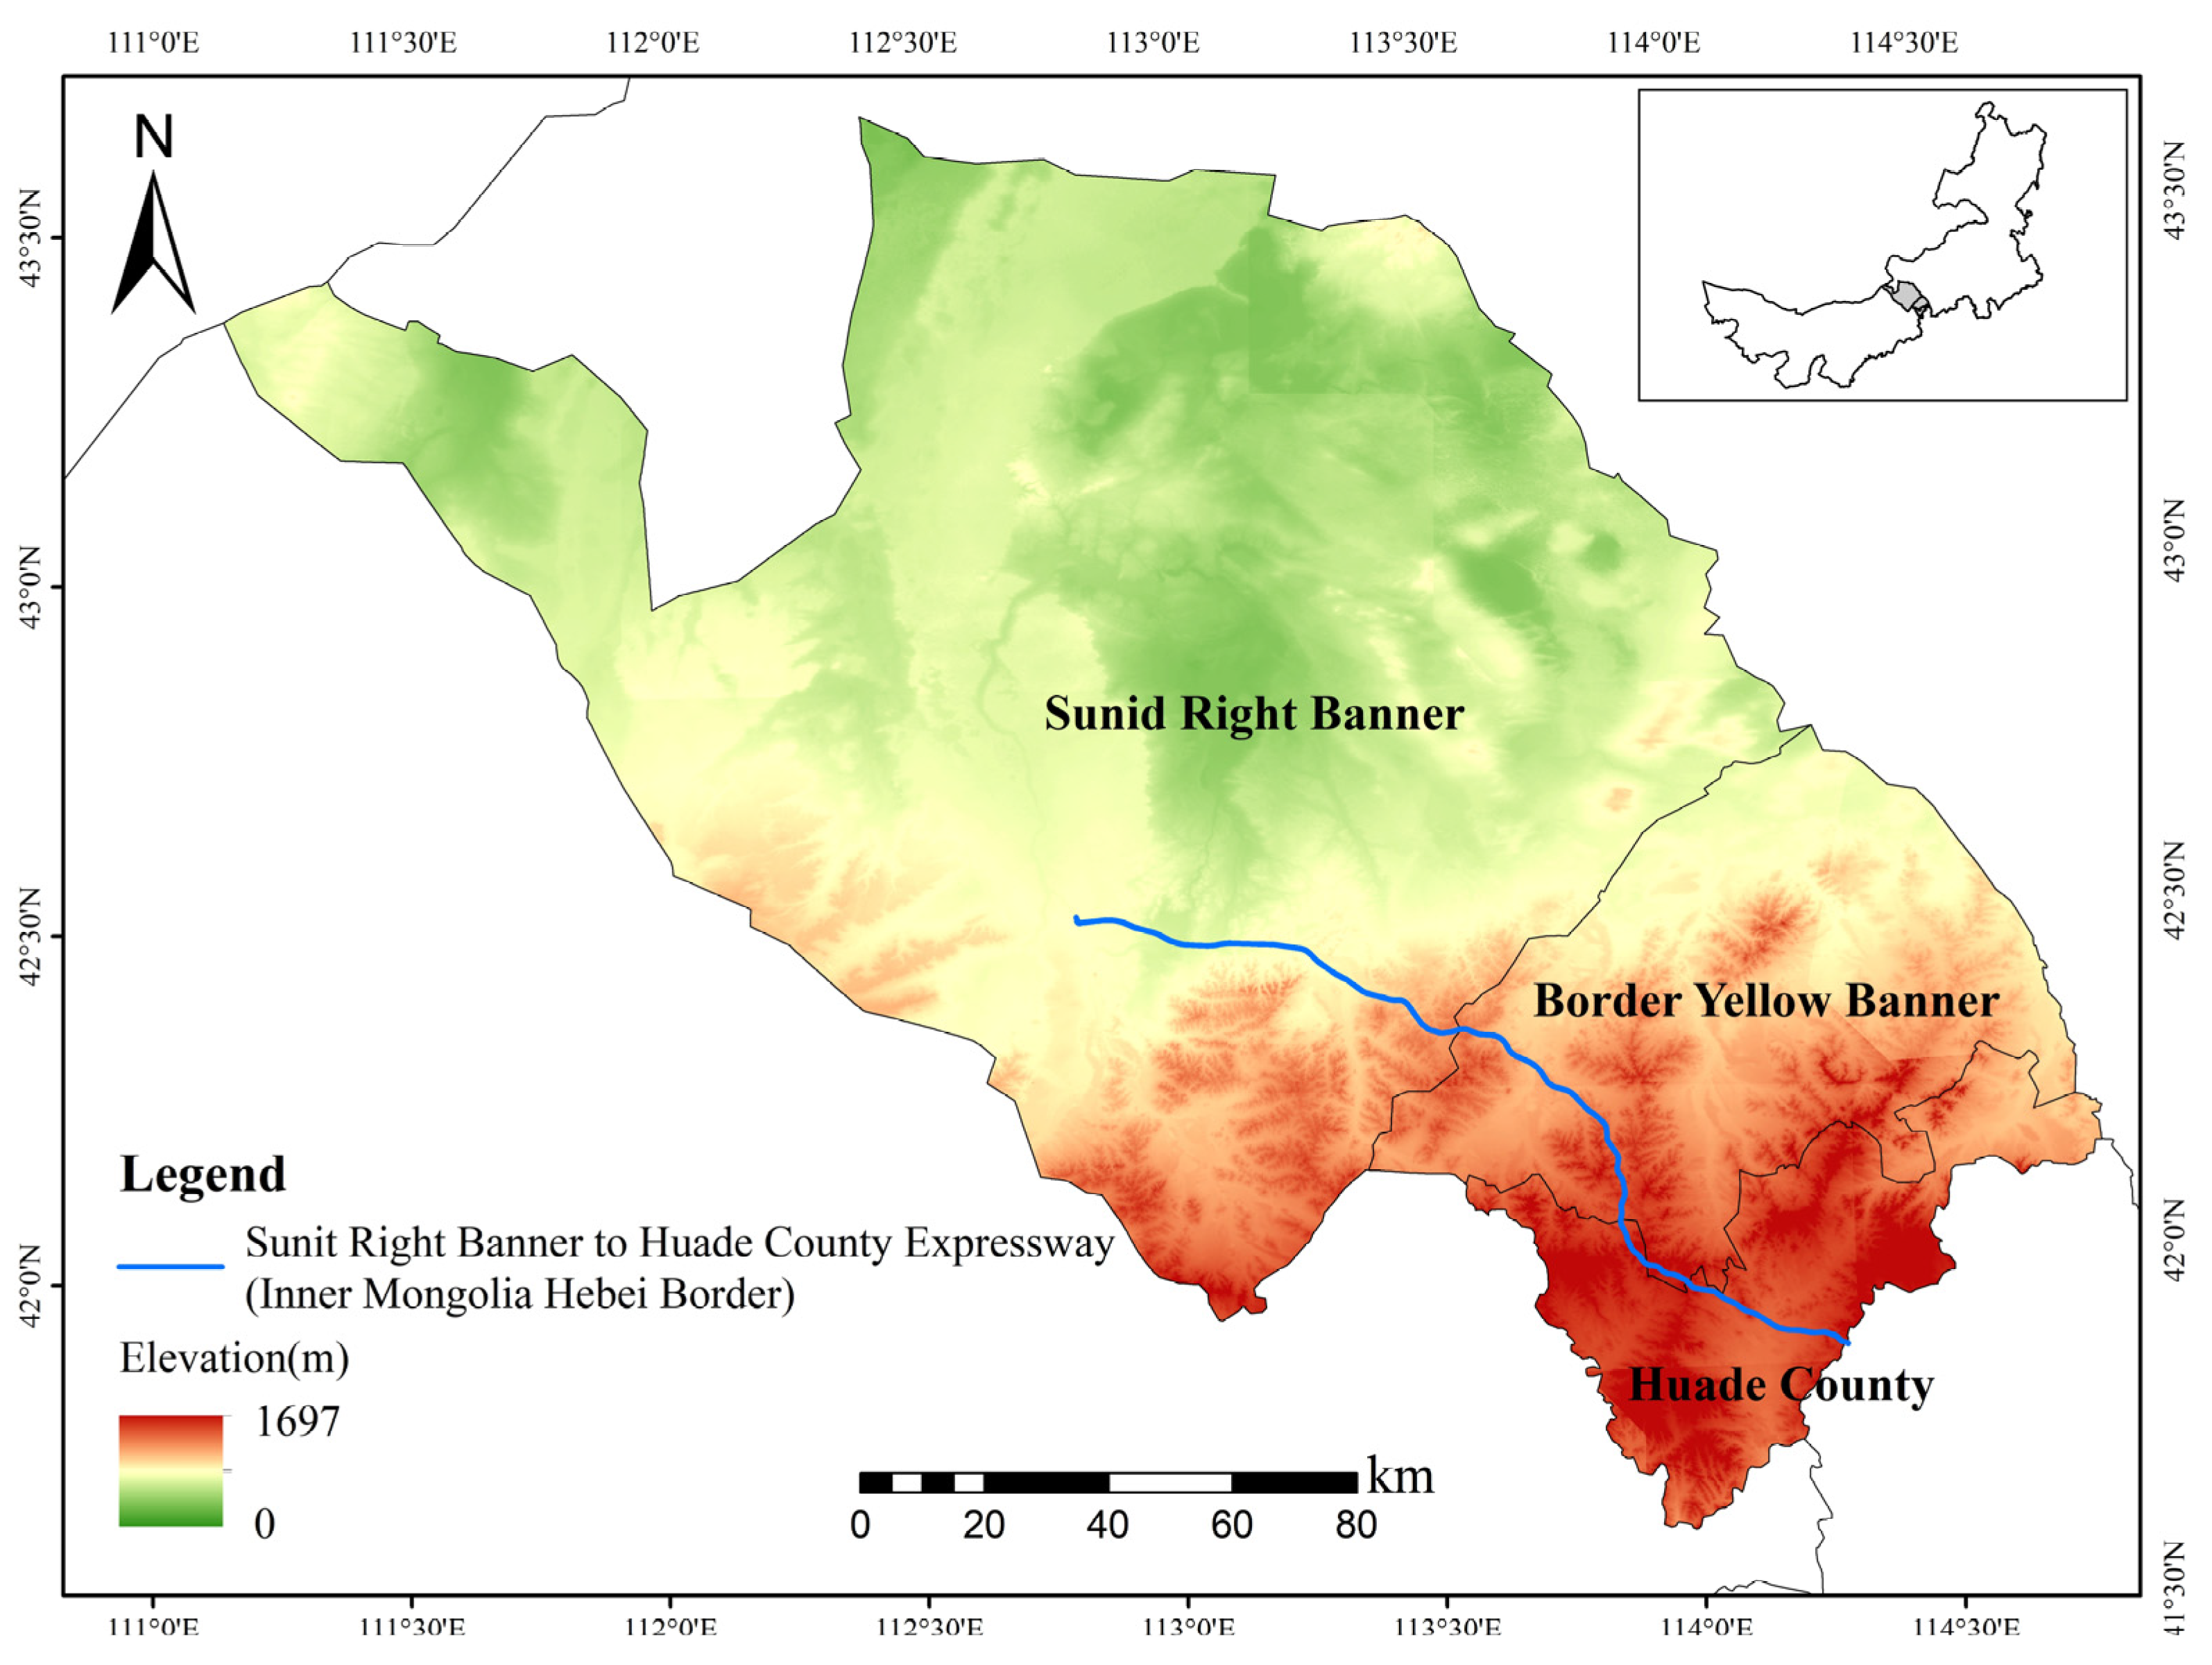
In this study, the RSEI along the highway construction route was obtained through GEE, and the main impact areas of highway construction were identified. It also analyzed the characteristics of RSEI change in the research region and predicted the future trend. The drivers of RSEI in the region along the highway construction were categorized into four groups: climate, vegetation, topography, and human activities. Figure 1 depicts the study framework.

2.2. Study Area

The Sunit Right Banner to Huade (Inner Mongolia–Hebei border) highway is an important part of the Sunit Right Banner to Zhangjiakou Highway (G5516), one of the highway connections from Erenhot to Guangzhou, China. It is critical for improving regional transportation conditions and the development of regional resources along the highway. The study section is located in Inner Mongolia (41°52′ N~42°30′ N, 112°48′ E~114°17′ E) and has a length of 156.195 km. The section was started in August 2018, and the main project was completed in November 2020. We divided the study period into pre-construction (2016–2017), construction (2018–2020), and post-construction (2021) using construction process nodes. The location is shown in Figure 2. The starting point of the Sunit Right Banner to Huade (Inner Mongolia–Hebei border) highway is located in the town of Zhu Rihe, Sunit Right Banner of Xilin Gol, via Border Yellow Banner, and the endpoint is located in Huade County of Ulanqab city. Seventeen state-level protected animal species, three protected grassland plant species, and one second-level protected plant species occur in the Inner Mongolia Autonomous Region in the highway area. The region is rich in plant and animal species. The study section pathway passes through grasslands, planted forests, and agroecosystems. According to the National Ecological Function Zoning, the area through which the highway passes belongs to the western arid ecological region. It is divided into two ecological zones, two ecological subzones, and three ecological function zones, representing critical protected regions in China. The ecosystems have high biodiversity and are fragile and sensitive, making the area valuable for research.

2.3. Data Sources

This paper uses the Landsat 8 OLI dataset from 2016–2021 in the GEE platform. Moreover, 30 m is the spatial resolution, and 16 d is the time resolution of the obtained images. The data were subjected to preprocessing operations such as radiometric correction, atmospheric correction, and geometric correction. Vegetation cover was high from May to October in the study area. During the GEE programming process, the images of May–October of the selected year were screened, and the images were subjected to cloud mask processing, median synthesis, mosaicking, cropping, and removal of water bodies in the GEE. The spatial distribution of RSEI in the research region was also derived with the help of GEE platform. In addition, the data we used included FVC, temperature, precipitation, DEM, slope direction, land cover type, road network, administrative district station, nighttime light intensity, and human footprint data (Table 1). Its preprocessing operations include uniform projection, resampling, cropping, etc.

2.4. Methods

2.4.1. Calculation of RSEI

The RSEI is a comprehensive indicator that enables visual monitoring of the eco-environment [29]. Its objective is to evaluate the quality of the eco-environment. The equations for the remote sensing indices are listed in Table 2. Prior to analysis, the range of values and units of each remotely sensed indicator must be normalized. The following equation is used to obtain the RSEI by PCA [30]:
R S E I 0 = 1 P C 1 f N D V I , W E T , N D B S I , L S T
R S E I = ( R S E I 0 R S E I 0 m i n ) / ( R S E I 0 m a x R S E I 0 m i n )
where R S E I 0 is the initial RSEI, and PC1 is the first principal component of the four indicators. The final RSEI was obtained by normalizing the R S E I 0 We used the equal interval method to classify the RSEI.

2.4.2. Trend Analysis

Sen analysis and the M-K test were used in this work to assess the RSEI trends in the studied region. The samples for the Sen analysis do not have to be normally distributed, and the results are not affected by outliers [40]. Therefore, this trend analysis method was used. The formula is as follows:
β = M e d i a n x j x i j i   j > i
where β is the trend of RSEI, and i and j represent the number of time series. x i and x j represent the RSEI values in years i and j, respectively. When β > 0, the eco-environmental quality shows an upward trend. When β < 0, the eco-environmental quality shows a decreasing trend. β = 0 indicates a constant trend. Since there is no theoretical zero value, −0.001 < β < 0.001 was chosen to indicate a constant trend.
The M-K test is a nonparametric statistical test used to identify trends in variables [41,42]. The method is widely used in climatology and hydrology [43,44]. The formula is as follows:
Z = S 1 v a r S   S > 0   0   S = 0 S + 1 v a r ( S )   S < 0
S = i = 1 n 1 j = i + 1 n s i g n ( R S E I j R S E I i )
v a r S = n n 1 2 n + 5 18
s i g n R S E I j R S E I i =   1   , R S E I j R S E I i > 0 0   , R S E I j R S E I i = 0 1   , R S E I j R S E I i < 0
where n is the length of the time series, and R S E I i and R S E I j represent the RSEI values of years i and j, respectively. S is the test statistic for the hypothesis. At the confidence level of 0.05, if |Z| > 1.96, a change in the RSEI is significant.

2.4.3. Hurst Analysis

Hurst analysis is an effective method to describe long-term time-series dependence [45,46]. Studies on vegetation, hydrology, and climatology frequently utilize it [47,48,49]. In this study, Hurst analysis was used to describe the future trend of RSEI. The process was performed in MATLAB2016a. The formula follows below.
Mean sequence was defined as:
R S E I ¯ τ = 1 τ t = 1 τ R S E I τ   τ = 1 , 2 , , n
Cumulative deviation sequence was defined as:
X ( t , τ ) = t = 1 τ R S E I t R S E I ¯ τ   1 t τ
Range sequence was defined as:
R ( τ ) = max 1 t τ X ( t , τ ) min 1 t τ X ( t , τ )   τ = 1 , 2 , , n
Standard deviation sequence was defined as:
S ( τ ) = 1 τ t = 1 τ ( R S E I ( t ) R S E I τ ) 2 1 2   τ = 1 , 2 , , n
R τ S τ = ( c τ ) H
where c is the scaling parameter. The value of H is obtained by taking the logarithm of both sides of Equation (11) and fitting it using the least squares method [50]. The Hurst index is divided into three classes. When Hurst ≥ 0.5, the past trend will continue in the future. When 0 ≤ Hrust < 0.5, the future trend is the opposite of the past trend. When Hurst = 0.5, the future trend is not related to the past trend [45].

2.4.4. Geodetector

According to Geodetector’s basic theory, if an independent variable significantly affects a dependent variable, their geographical distributions will be similar [21]. We used factor detector and interaction detector with the aid of a Geodetector software package (http://www.geodetector.cn/) to investigate the drivers influencing the quality of the eco-environment.
The factor detector was used to determine the degree to which the independent variable explained the dependent variable. q is calculated as follows:
q = 1 h = 1 L N h σ h 2 N σ 2
where q denotes the factor’s degree of influence. h = 1, …, L represent the stratification of dependent or independent variables; Nh and N represent the number of cells in layer h and the whole region, respectively. σ h 2 and σ 2 represent the variances in the dependent variables for layer h and the whole region, respectively.
The interaction detector determines the interaction between different factors by comparing the q-values of one and two factors. The main types of interactions include nonlinear attenuation, single-factor nonlinear weakening, and double-factor, independent, and nonlinear enhancements.
According to previous studies and the principles of factor selection, we selected factors in four categories: climate, vegetation, terrain, and human activity. Ten factors (temperature, precipitation, FVC, DEM, slope direction, land cover type, distance from road, distance from administrative district, nighttime light intensity, and human footprint) were used as the Geodetector factors affecting RSEI. They were referred to as X1–X10. The data were classified using the natural breakpoint method, except for the land cover type, which corresponded to the original categories. An analysis of overflow errors was conducted. Finally, 5359 sampling points were generated by establishing a 300 m × 300 m grid. Subsequently, Geodetector was used to determine the drivers of RSEI.

3. Results

3.1. The Influence of Highway Construction on the Eco-Environmental Quality of the Surrounding Area

The PC1 of the RSEI ranged from 63.49% to 87.31% over the course of 6 years, with an average contribution of over 74.06%. This result demonstrated that PC1 possessed the bulk of the data pertaining to environmental characteristics and that the RSEI was a sufficient measure of the quality of the eco-environment in the region. Fourteen buffer zones, separated by 250 m, were created around the highway center in order to gauge the extent to which the construction of the highway will impact the quality of the local eco-environment. Furthermore, we set the maximum buffer zone extent at 3500 m in order to adequately account for the effects of highway construction on the quality of the regional eco-environment. Figure 3 displays the amount of change as well as the mean RSEI values for each buffer zone before and after the highway was constructed. As can be seen in Figure 3, the impact of highway construction in the buffer zone of 250 m–500 m on the quality of the regional eco-environment showed an increasing trend. The felling of trees in the area during the construction of the highway and the destruction of the land were the direct cause of this result. The impact of highway construction in the 250 m–1250 m buffer zones on the eco-environmental quality along the route showed a decreasing trend with an increase in the buffer zone. The change in land-use structure and the impact on regional air and water environment during the construction of the highway will indirectly affect the eco-environment of the region. Since the trend of the average RSEI difference is relatively smooth in the buffer zone range of 1500 m–1750 m, the large fluctuation in the average RSEI difference in the buffer range larger than 1750 m may be influenced by other factors. Therefore, this study identifies the 1500 m buffer zone as the main ecological impact area and uses it for an in-depth analysis.

3.2. Spatio-Temporal Characteristics of Regional Eco-Environmental Quality along the Highway

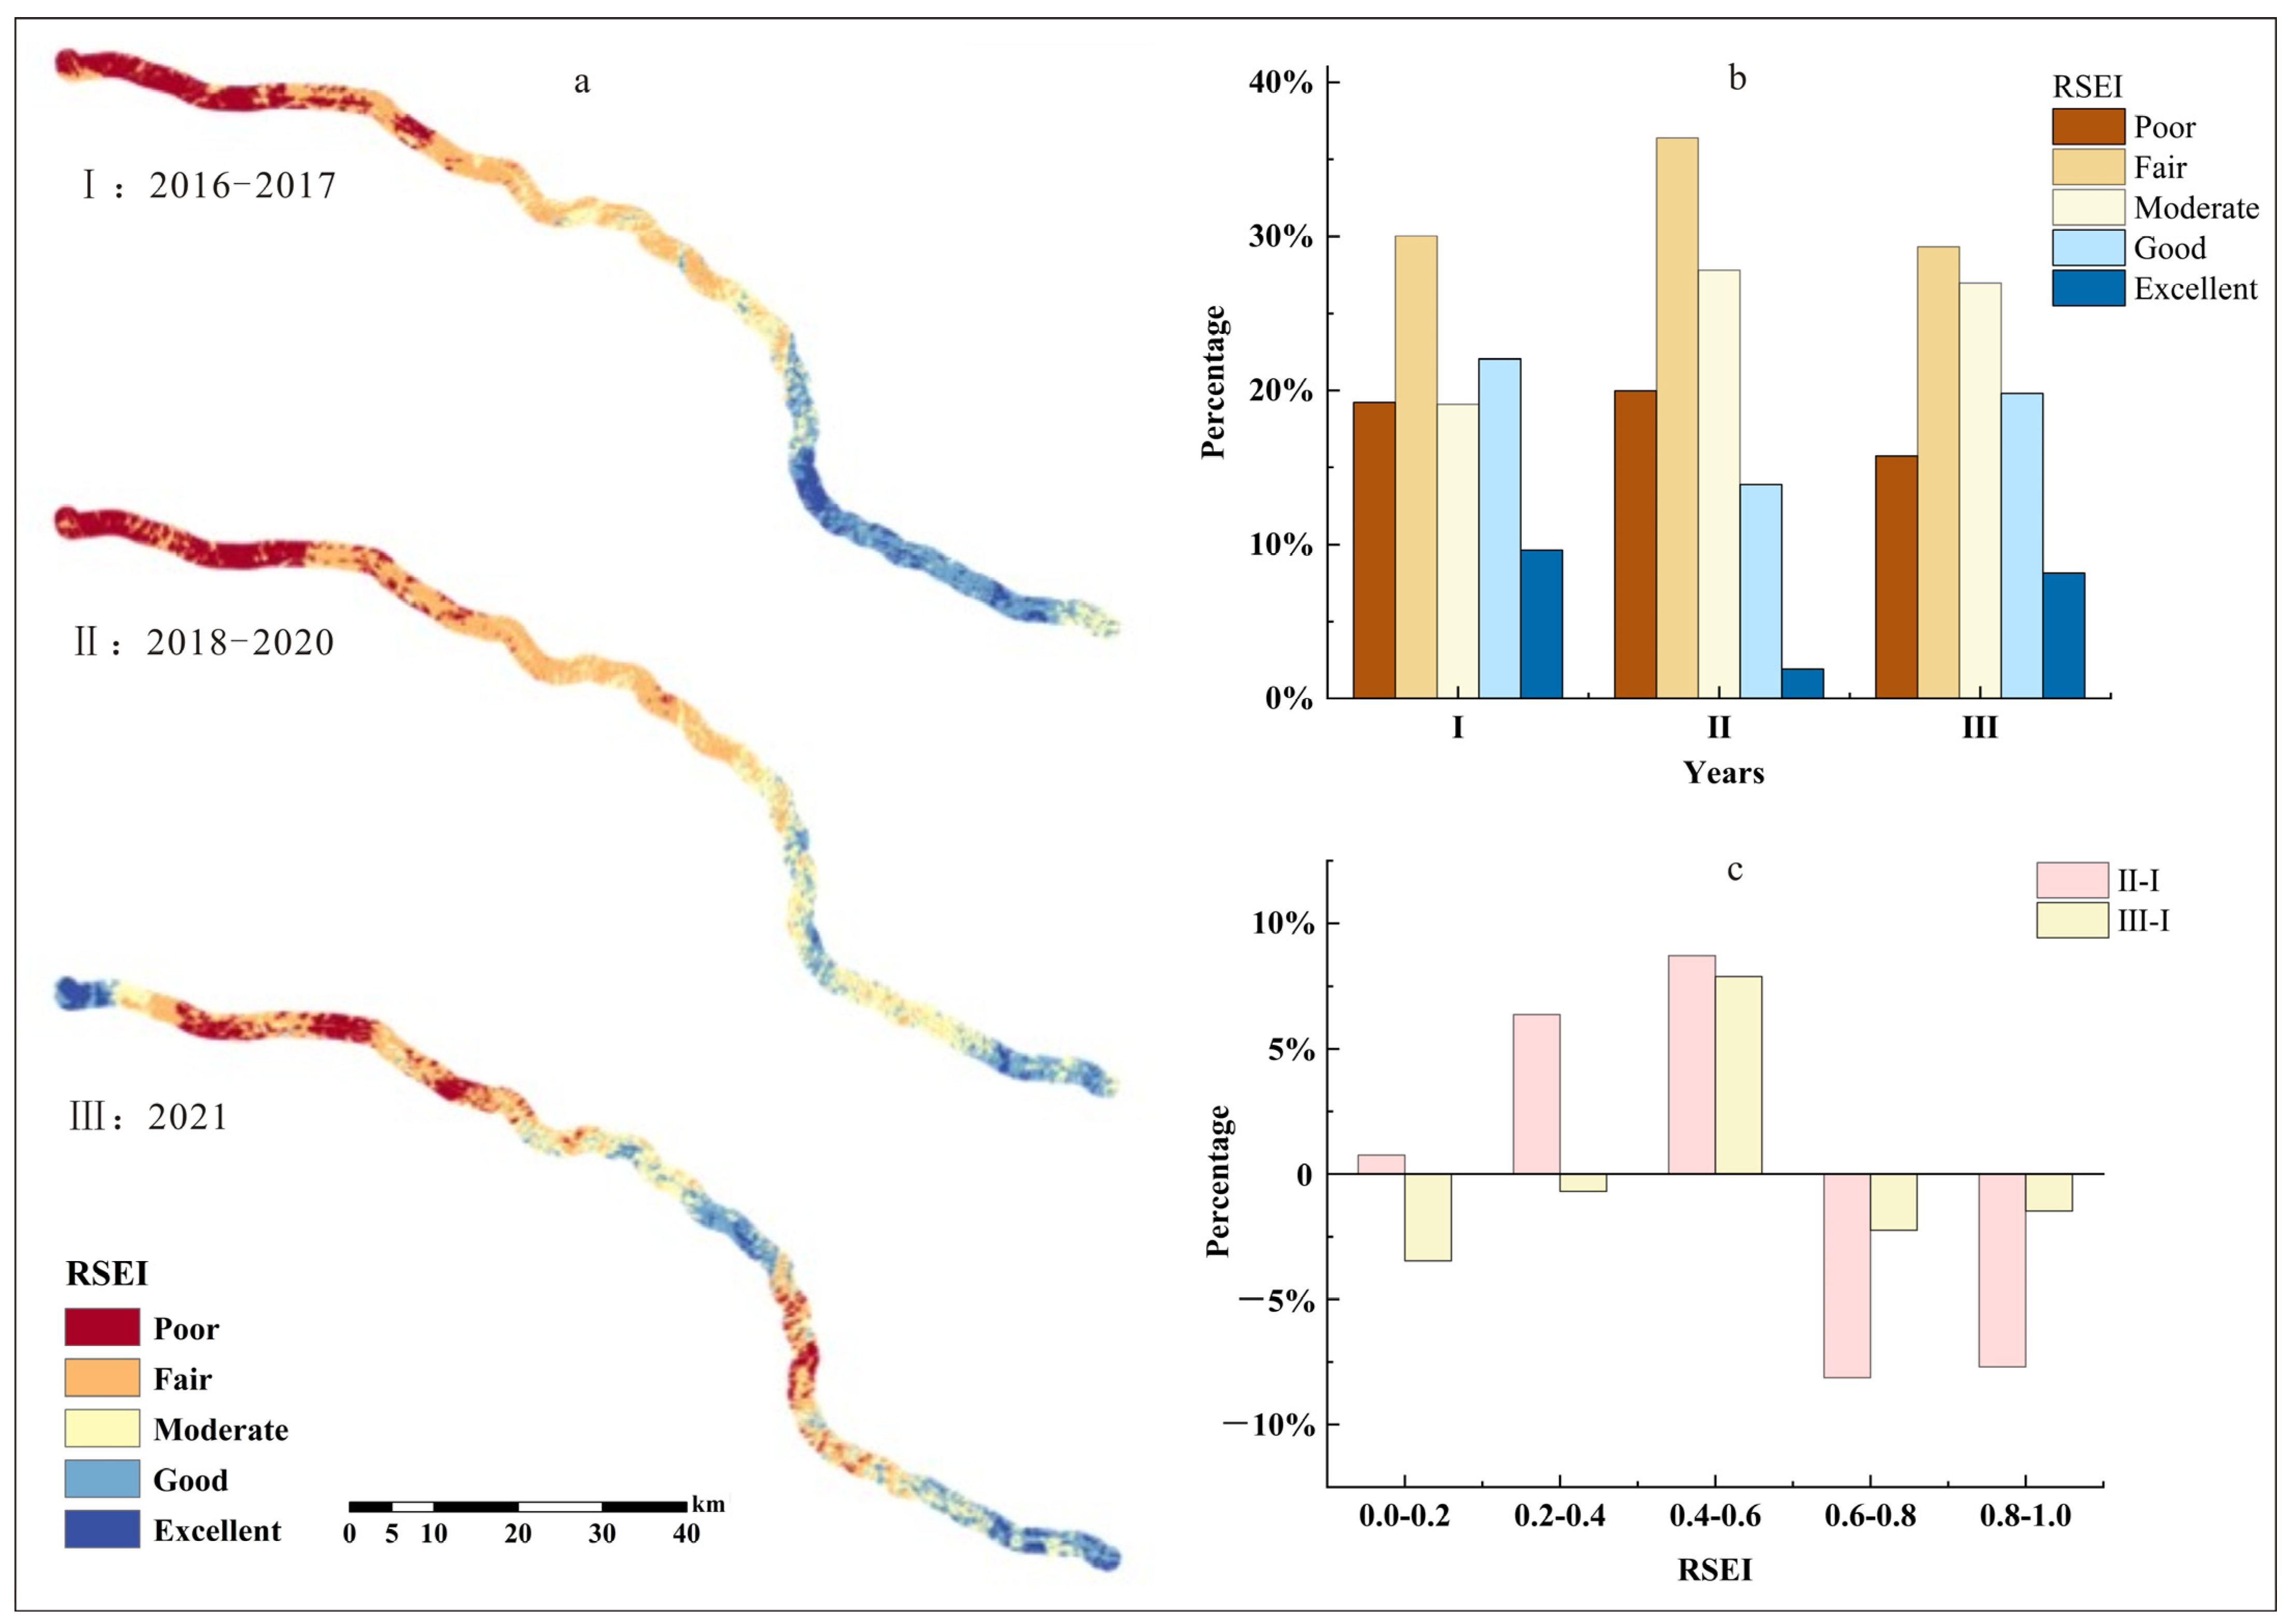
3.2.1. Temporal Characteristics of Regional Eco-Environmental Quality along the Highway

Throughout the research period, the average RSEI curve for each year was V-shaped (2016–2018 and 2018–2021) (Figure 4). Table 3 lists the area and percentage of the region’s various eco-environmental quality levels in the representative years. The years selected represent pre-construction, construction, and post-construction. Post-construction quality compared with the pre-construction eco-environmental quality of the good and above level area decreased by 5.39 km2, and fair and poor quality levels of the eco-environmental quality area increased by 35.57 km2. However, the region with the lowest quality level grew by 22.03 km2. In conclusion, the region’s eco-environmental quality declined over time. The pre-construction study area’s RSEI level was primarily moderate. The eco-environmental quality began to decline in 2018 with mostly a fair level. During the construction process, the quality of the eco-environment began to decline, with most of the levels being fair. It is noteworthy that 460.1 km2, or 70.73% of the research area, was in the categories of poor and fair eco-environmental quality levels during this time. Combined with the change in the average value of RSEI in the whole cycle of highway construction (Figure 4), it is possible to conclude that the regional eco-environment along the highway is negatively impacted by the highway construction process as a whole, and the impact is most serious during this period of highway construction in the early stage, i.e., 2018. It can be seen that the initial stage of highway construction caused the greatest disturbance to the surrounding ecological environment, which may be mainly due to the sudden destruction of the regional vegetation cover.

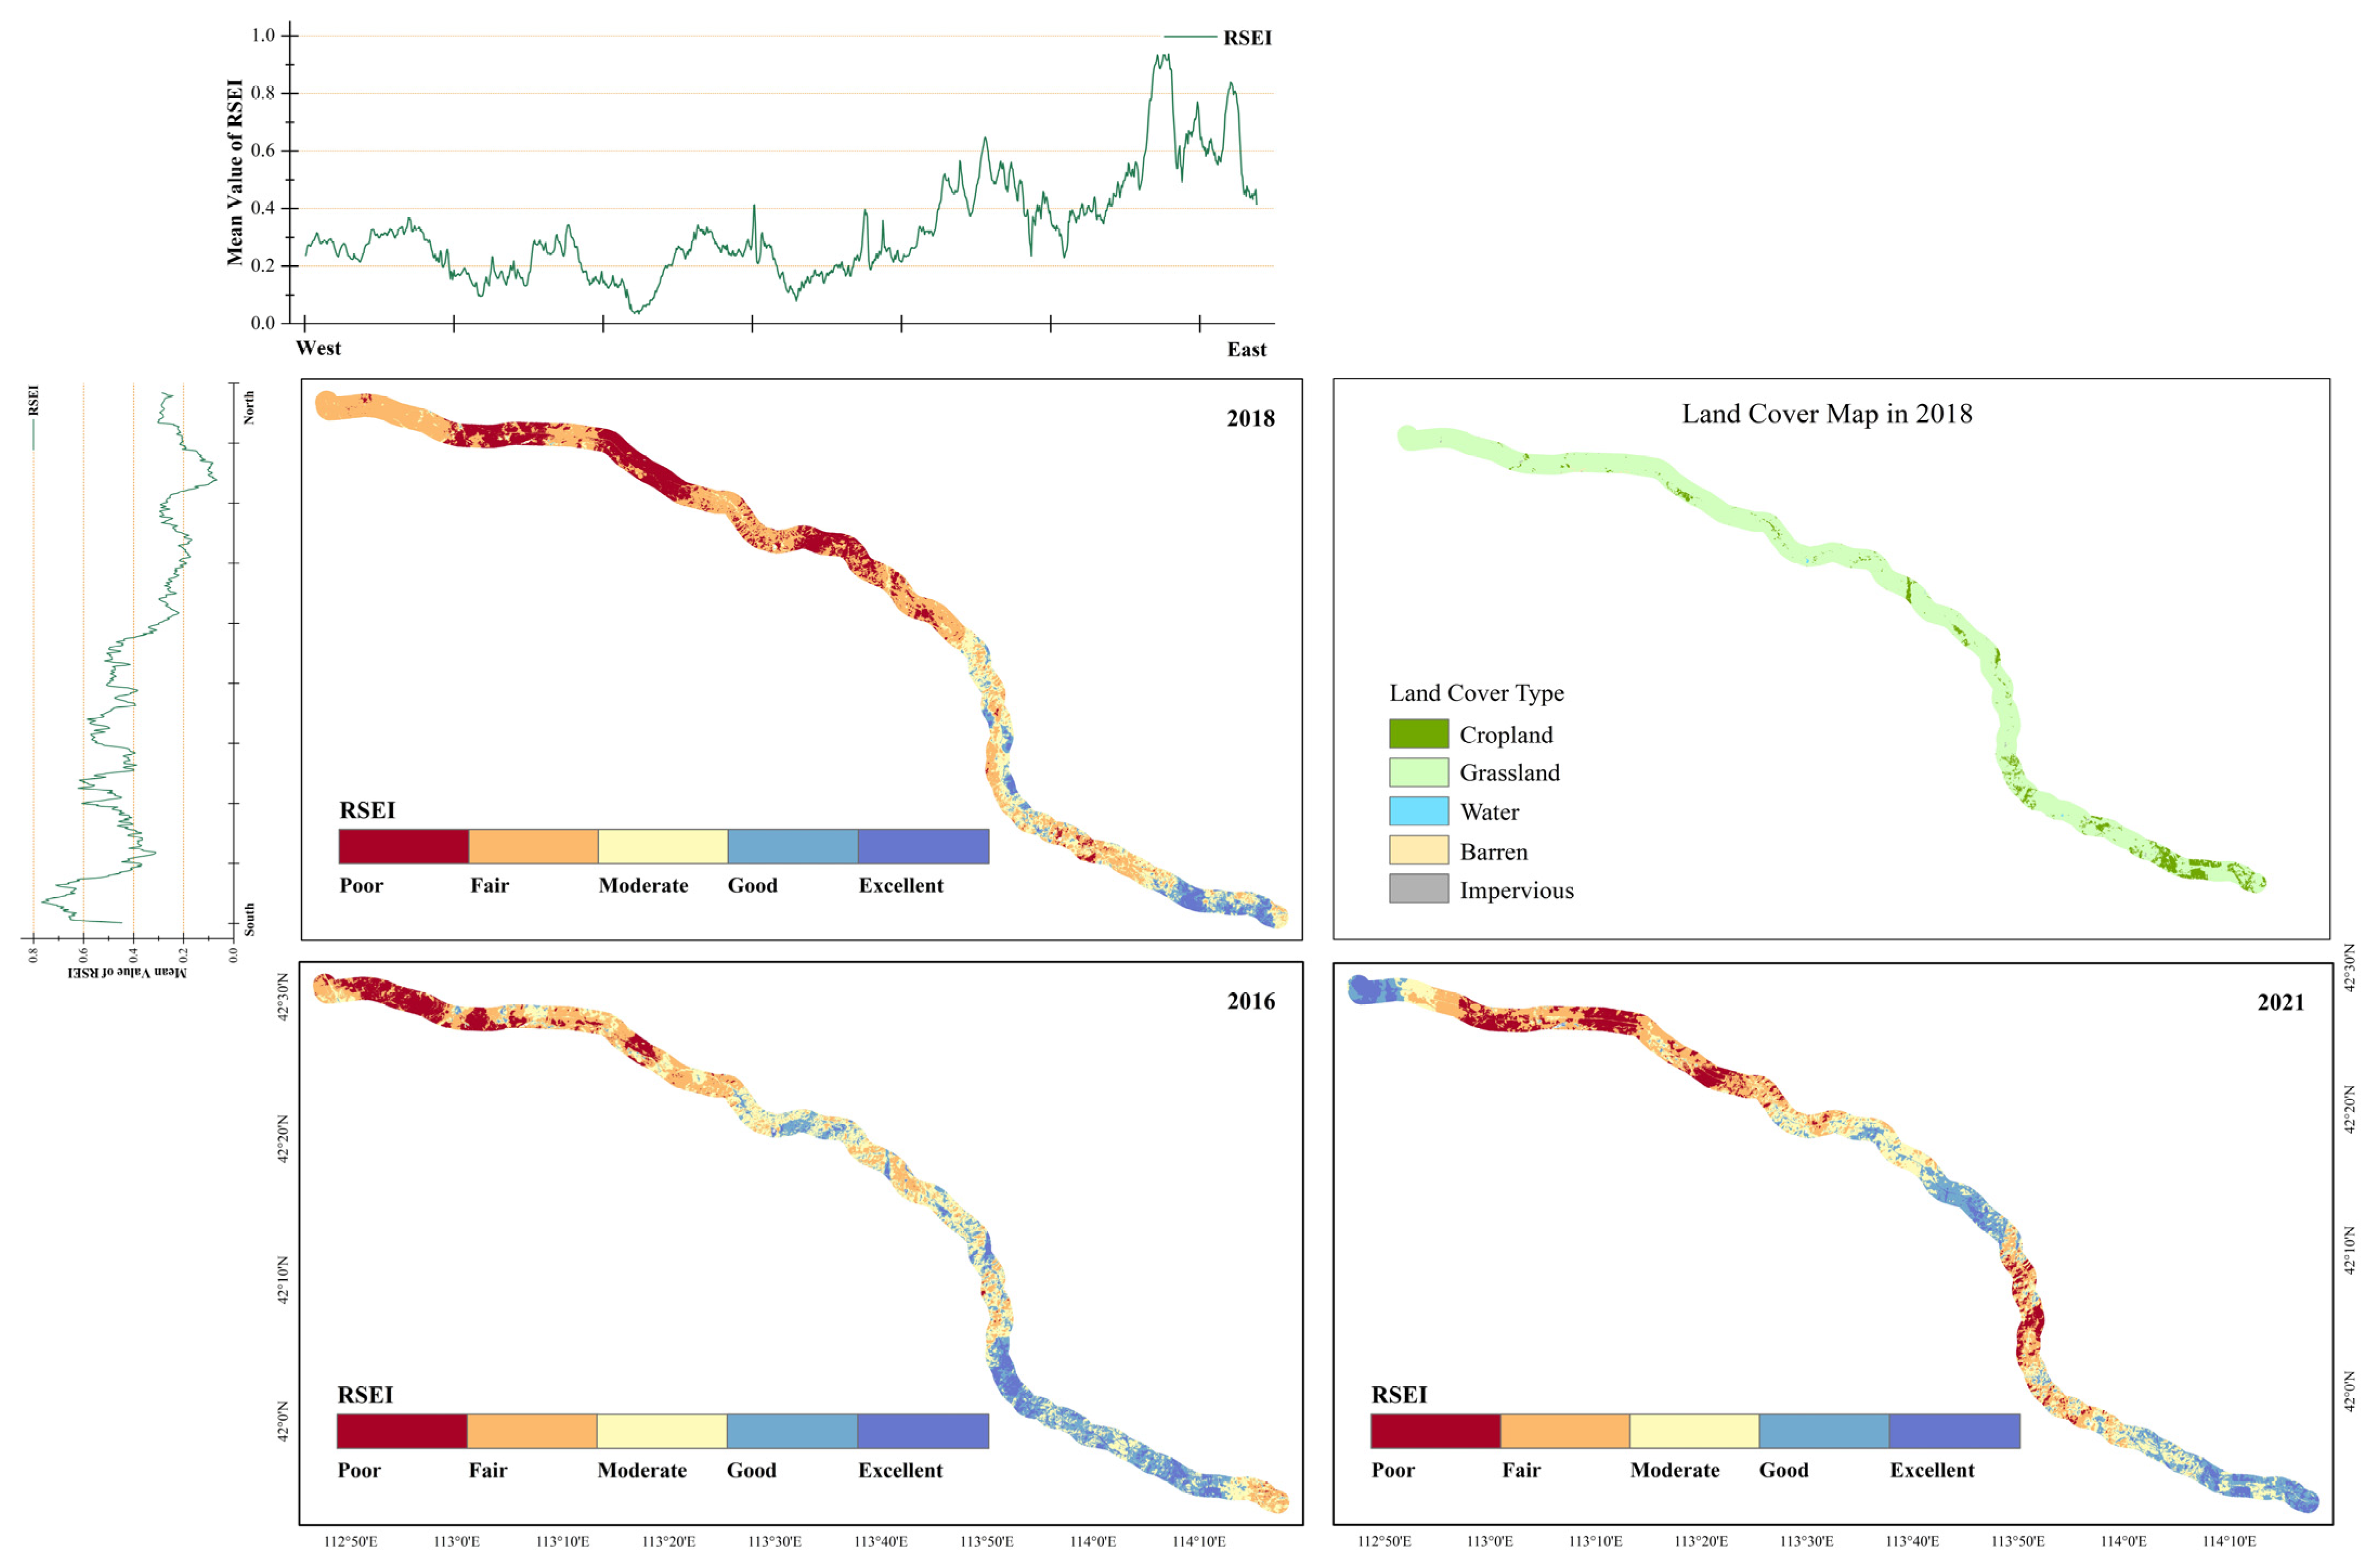
3.2.2. Spatial Characteristics of Regional Eco-Environmental Quality along the Highway

The regional distribution of the eco-environmental quality over the research zone is shown in Figure 5. The RSEI values show an increasing trend from northwest to southeast due to the denser road network in the northwestern part of the research region. Areas with fair and poor eco-environmental quality levels occur at the boundary of the Sunit Right Banner in the northwestern section of the research region, where grassland and cropland are dominant. The areas with eco-environmental quality levels of fair and below in the process of highway construction are mainly distributed in the northwestern part of the study area within the boundary of Sunit Right Banner and the central part of the Border Yellow Banner. When paired with the map of land cover types, it becomes evident that the predominant land cover type in the area is grassland. The majority of the study area’s good and excellent quality areas are found inside Huade County’s boundaries in the southeast of the region. Grassland and cropland are the predominant land cover categories in the area. It can be seen that grassland is more susceptible to the immediate and direct impacts of highway construction than cropland.

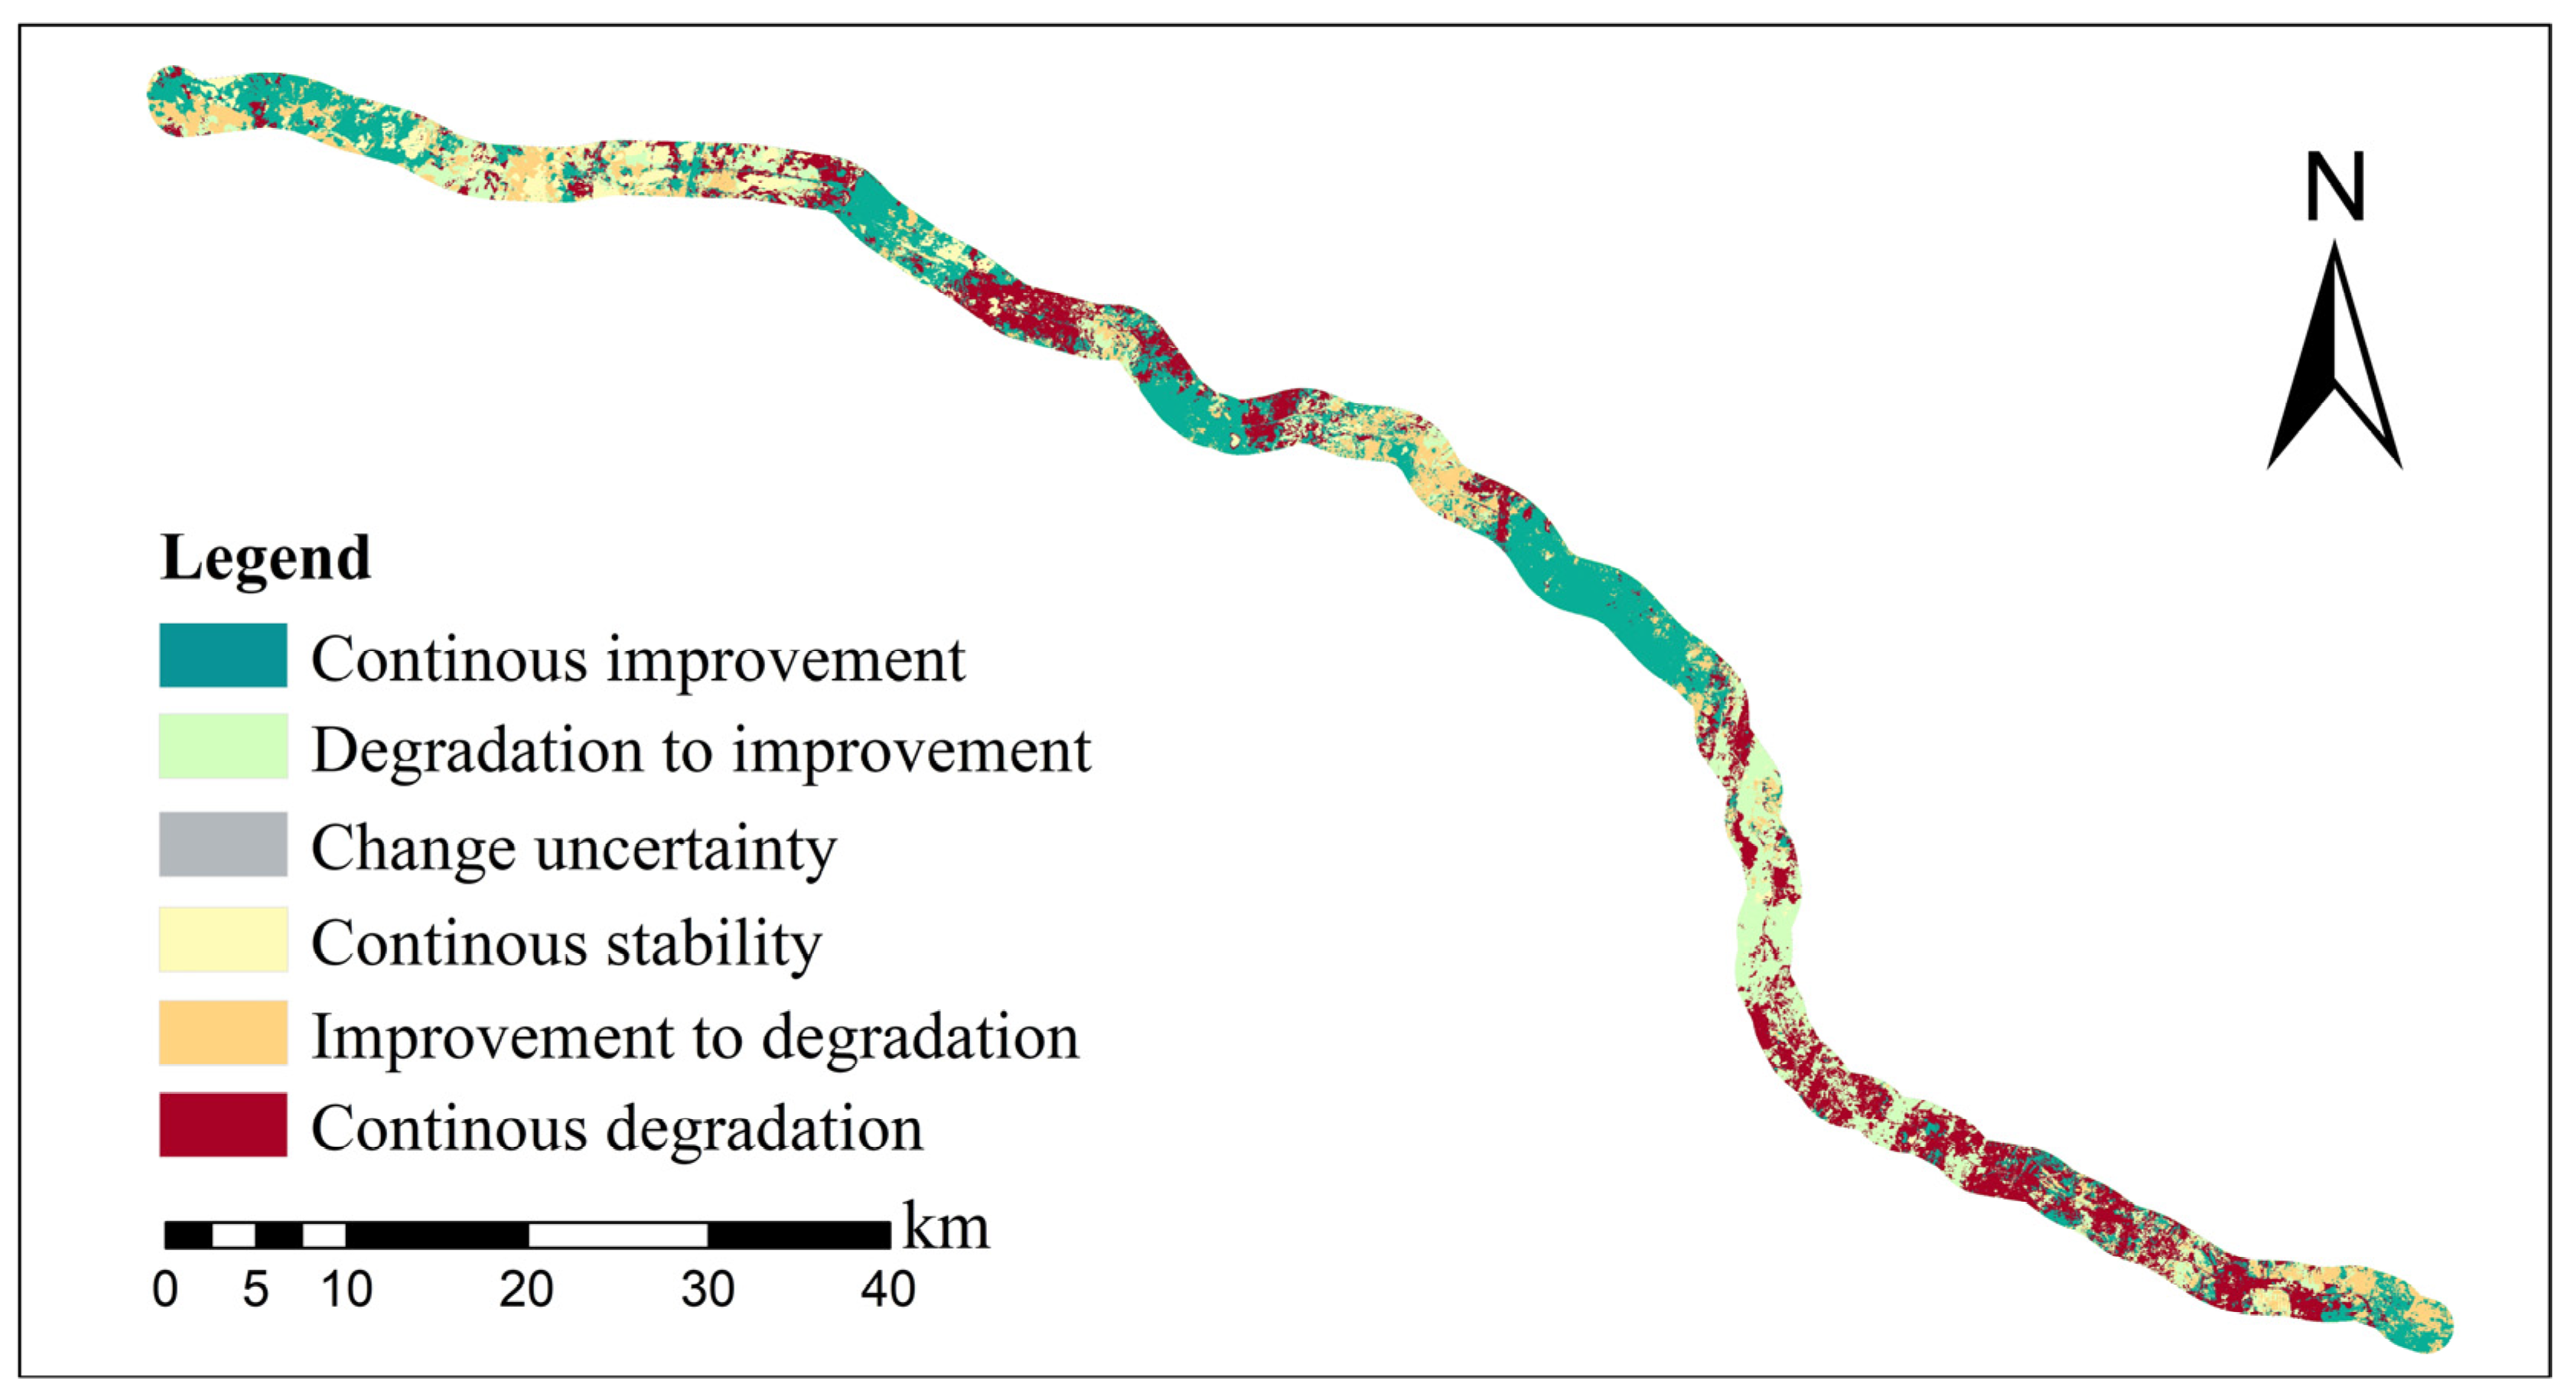
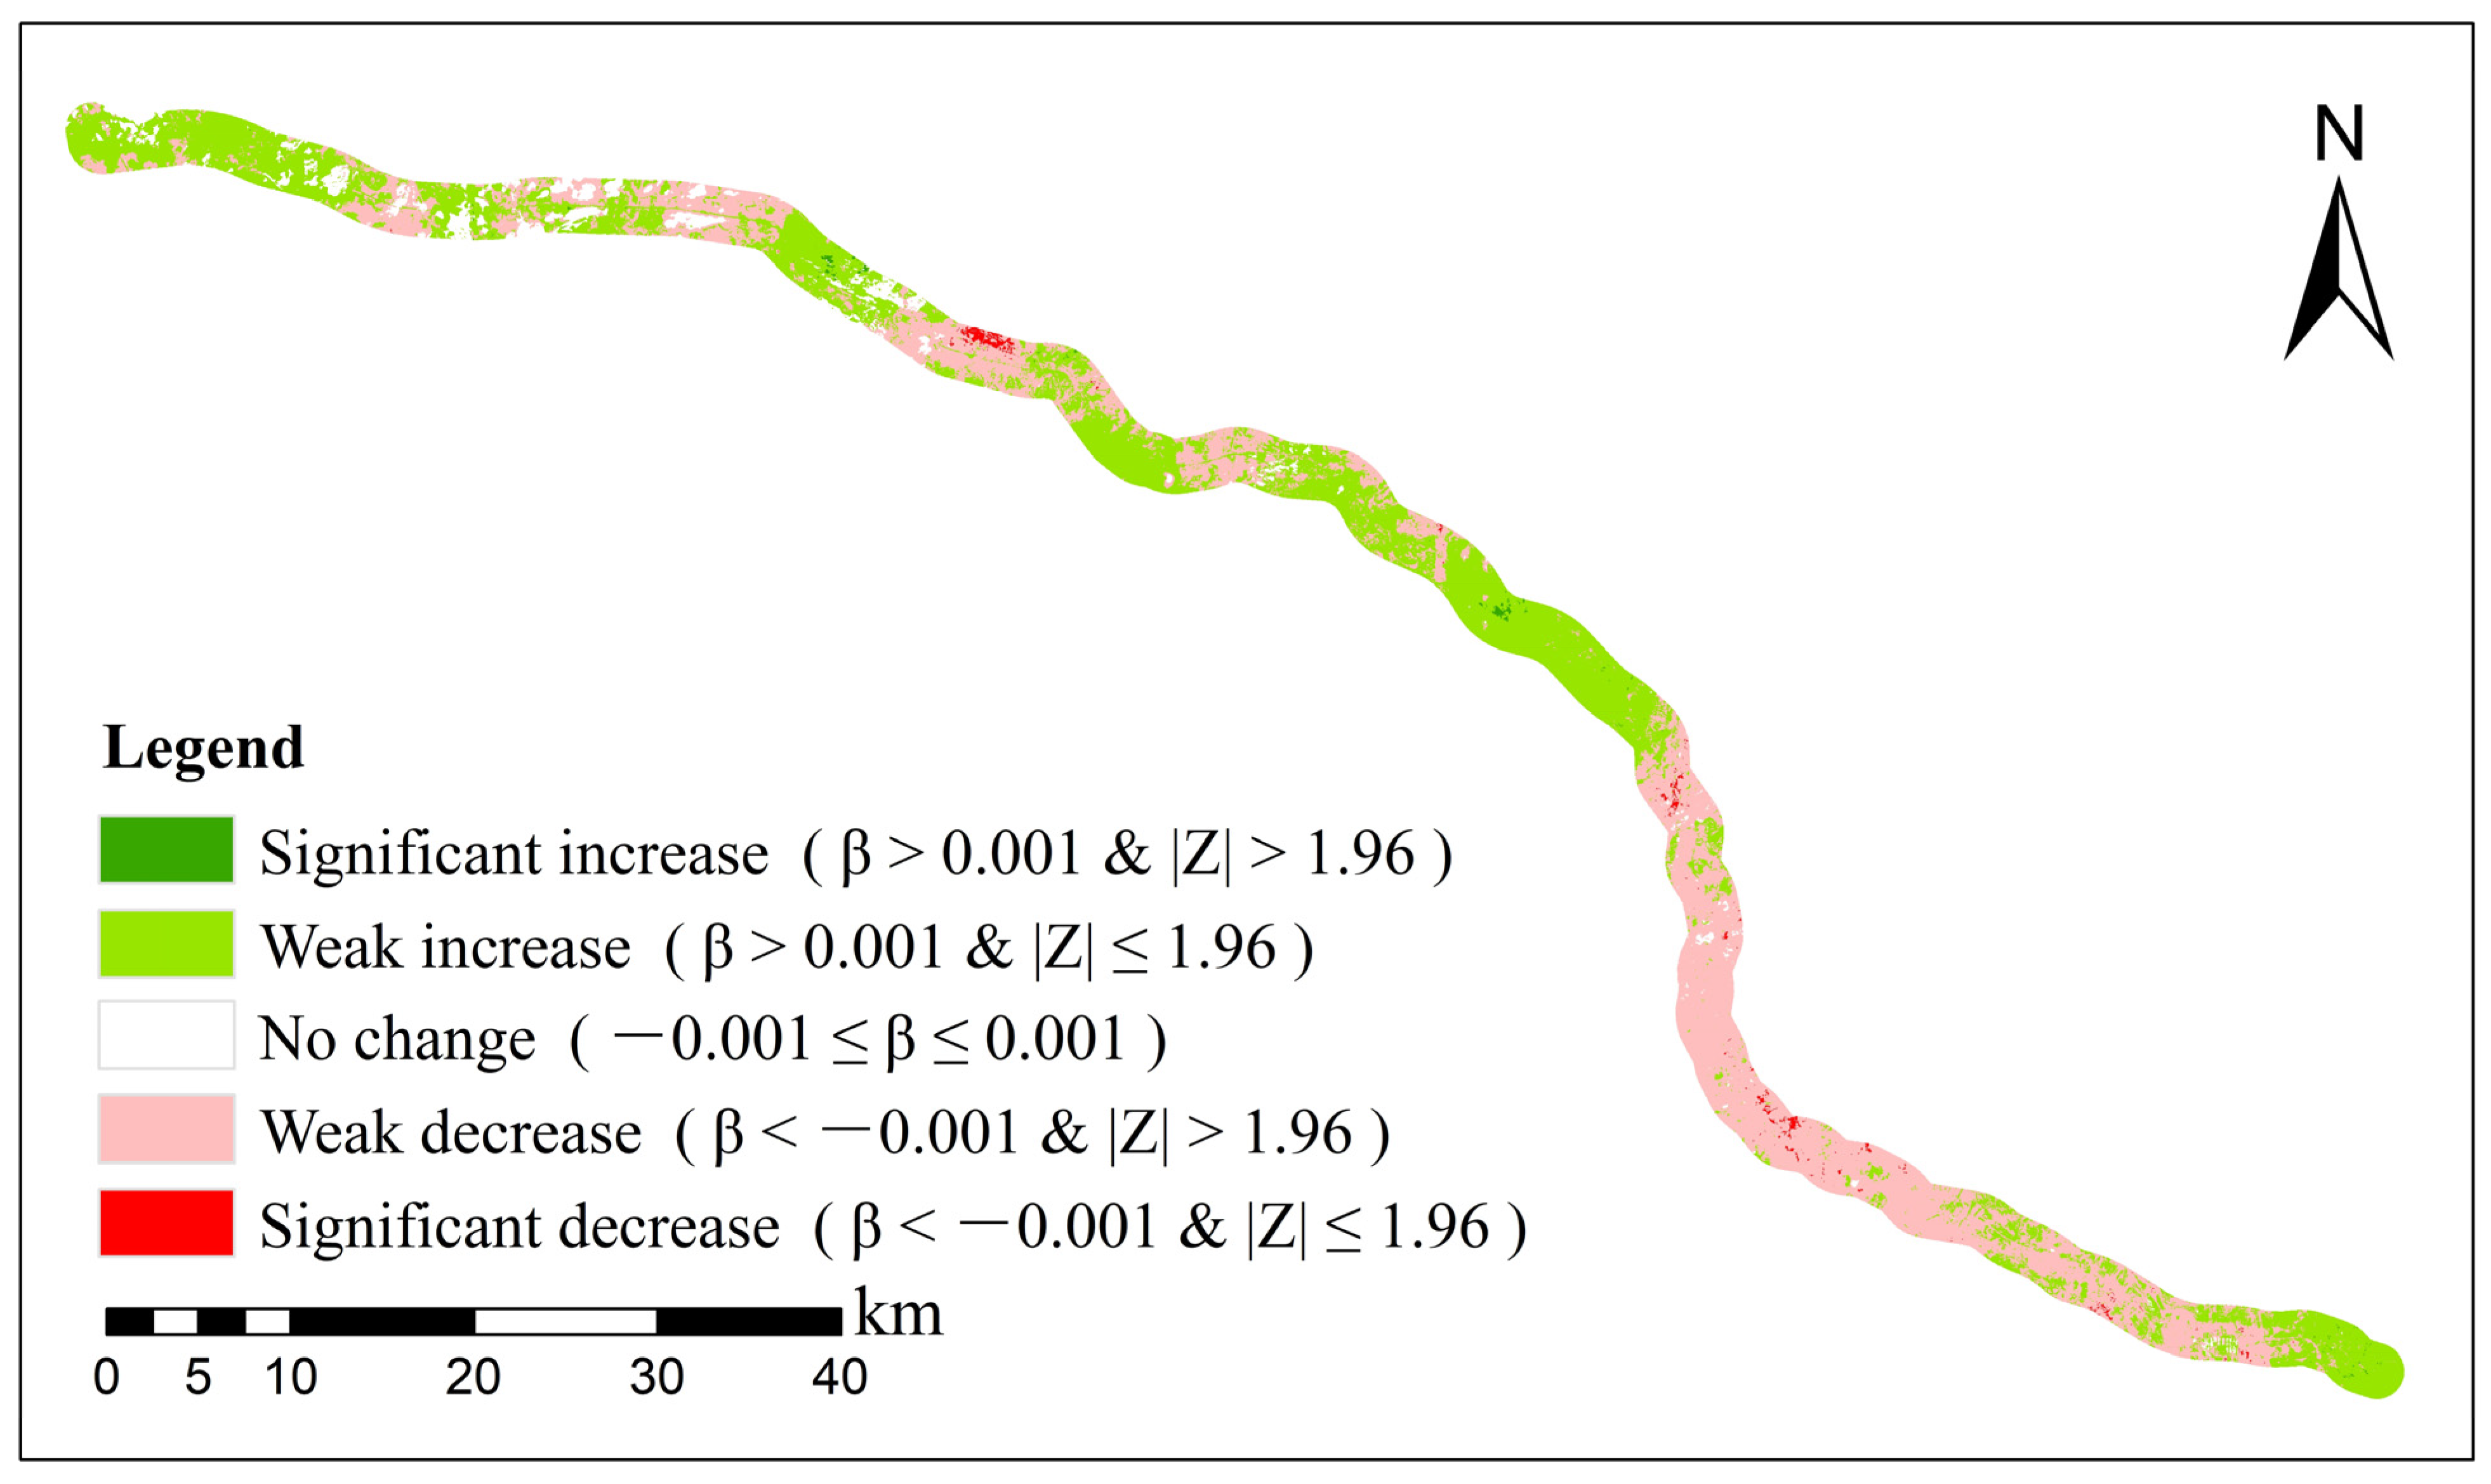
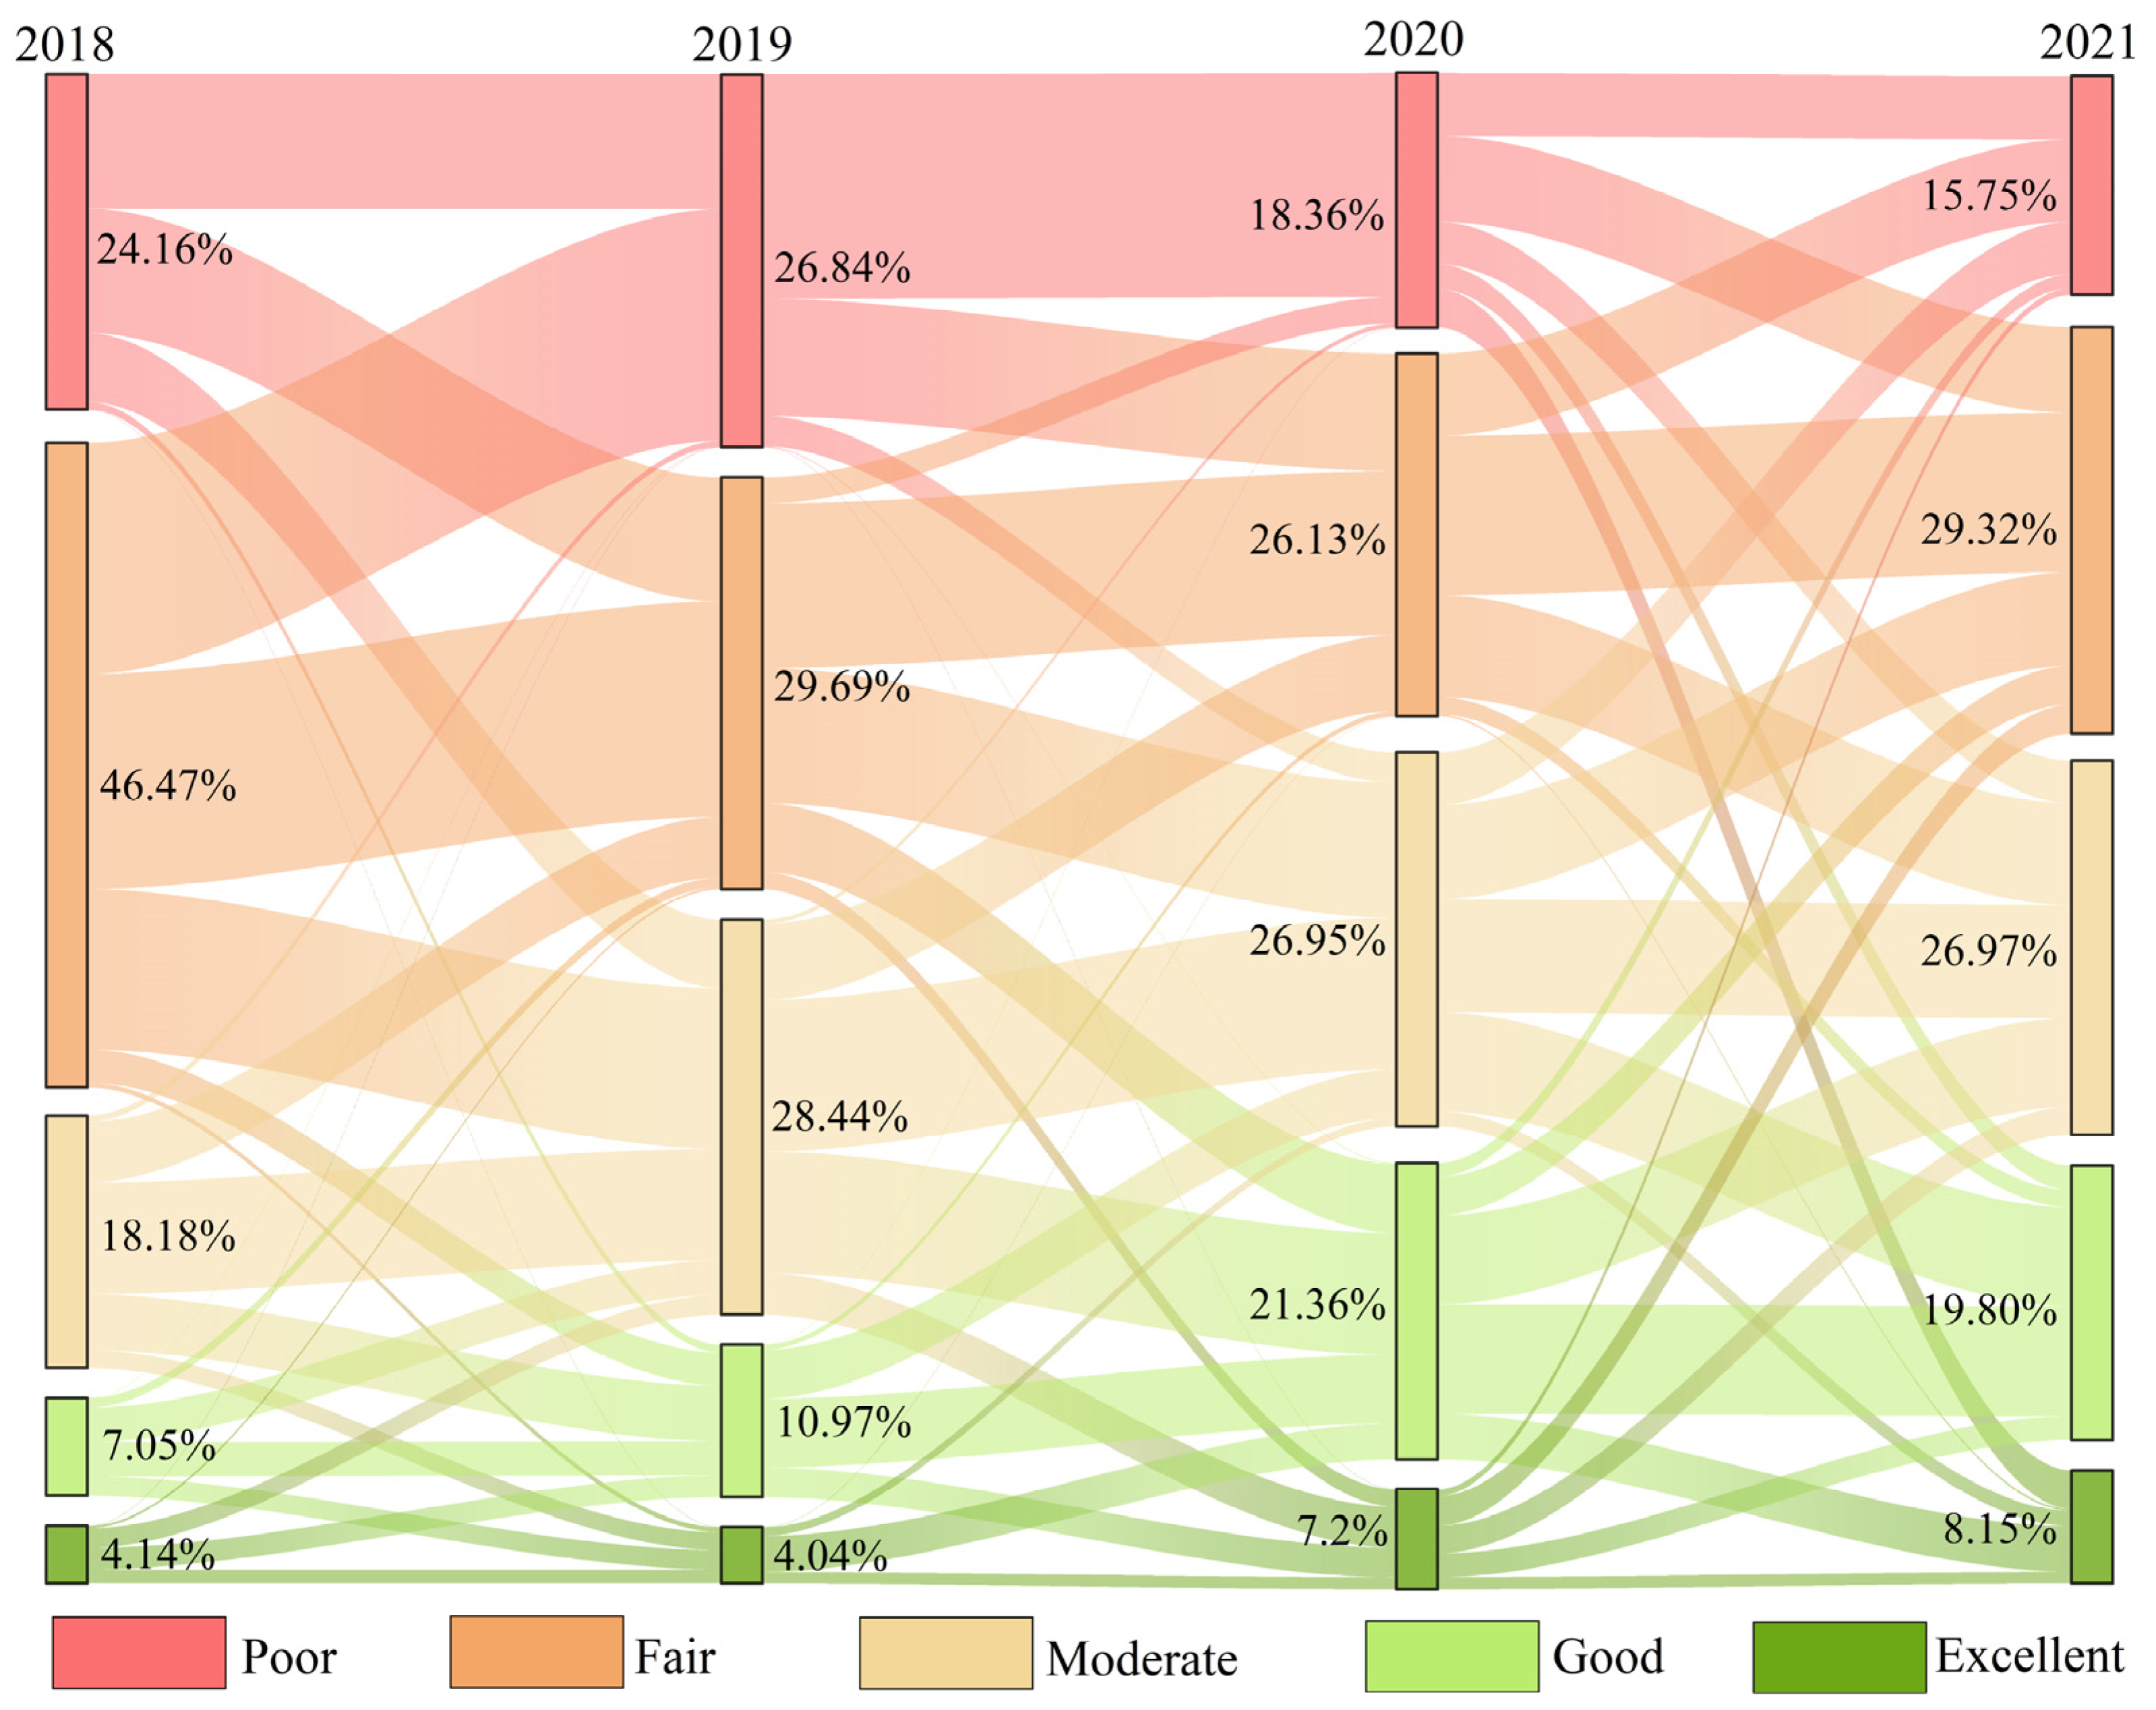
3.3. Dynamic Change Characteristics of Eco-Environmental Quality

During the research period, growing and declining trends were seen in 45.99% and 48.14% of the districts, respectively. The trends in RSEI are shown in Figure 6. The RSEI showed that an increasing trend area was primarily dispersed in the northern part of the Sunit Right Banner in the central part of the research region and within the boundary of the Border Yellow Banner in a block shape. The RSEI showed a decreasing trend consisting of two regions. The first part was located in the northwestern part of the research region in the vicinity of the border between the Sunit Right Banner and the Border Yellow Banner. The second part was located in the southeastern part of the research region extending from within the boundary of the Yellow Banner to the vicinity of the border between Border Yellow Banner and Huade County. Most of the trend changes in eco-environmental quality of the research region are not significant. The main reasons for this may be the implementation of human environmental protection measures and the uninterrupted self-recovery capacity of the natural environment.

3.4. The Drivers of Eco-Environmental Quality

3.4.1. Factor Detector Results

The factor detector results are listed in Table 4. The effects of the factors on RSEI in 2018 from strong to weak were DEM (X4), precipitation (X2), distance from the administrative district (X8), FVC (X3), land cover type (X6), human footprint (X10), slope direction (X5), temperature (X1), nighttime light intensity (X9), and distance from the road (X7). In 2020, this ranking was DEM (X4), precipitation (X2), distance from the administrative district (X8), FVC (X3), temperature (X1), nighttime light intensity (X9), human footprint (X10), land cover type (X6), slope direction (X5), and distance from the road (X7). Among them, temperature and nighttime light intensity ranks increased; slope direction, land cover type and human footprint influence ranks showed different degrees of decline. However, the q-values of all impact factors were larger in 2020 than in 2018, except for land cover type. The results demonstrate that the DEM, precipitation, distance from the administrative district, and FVC have strong influences on the RSEI of the region during highway construction.

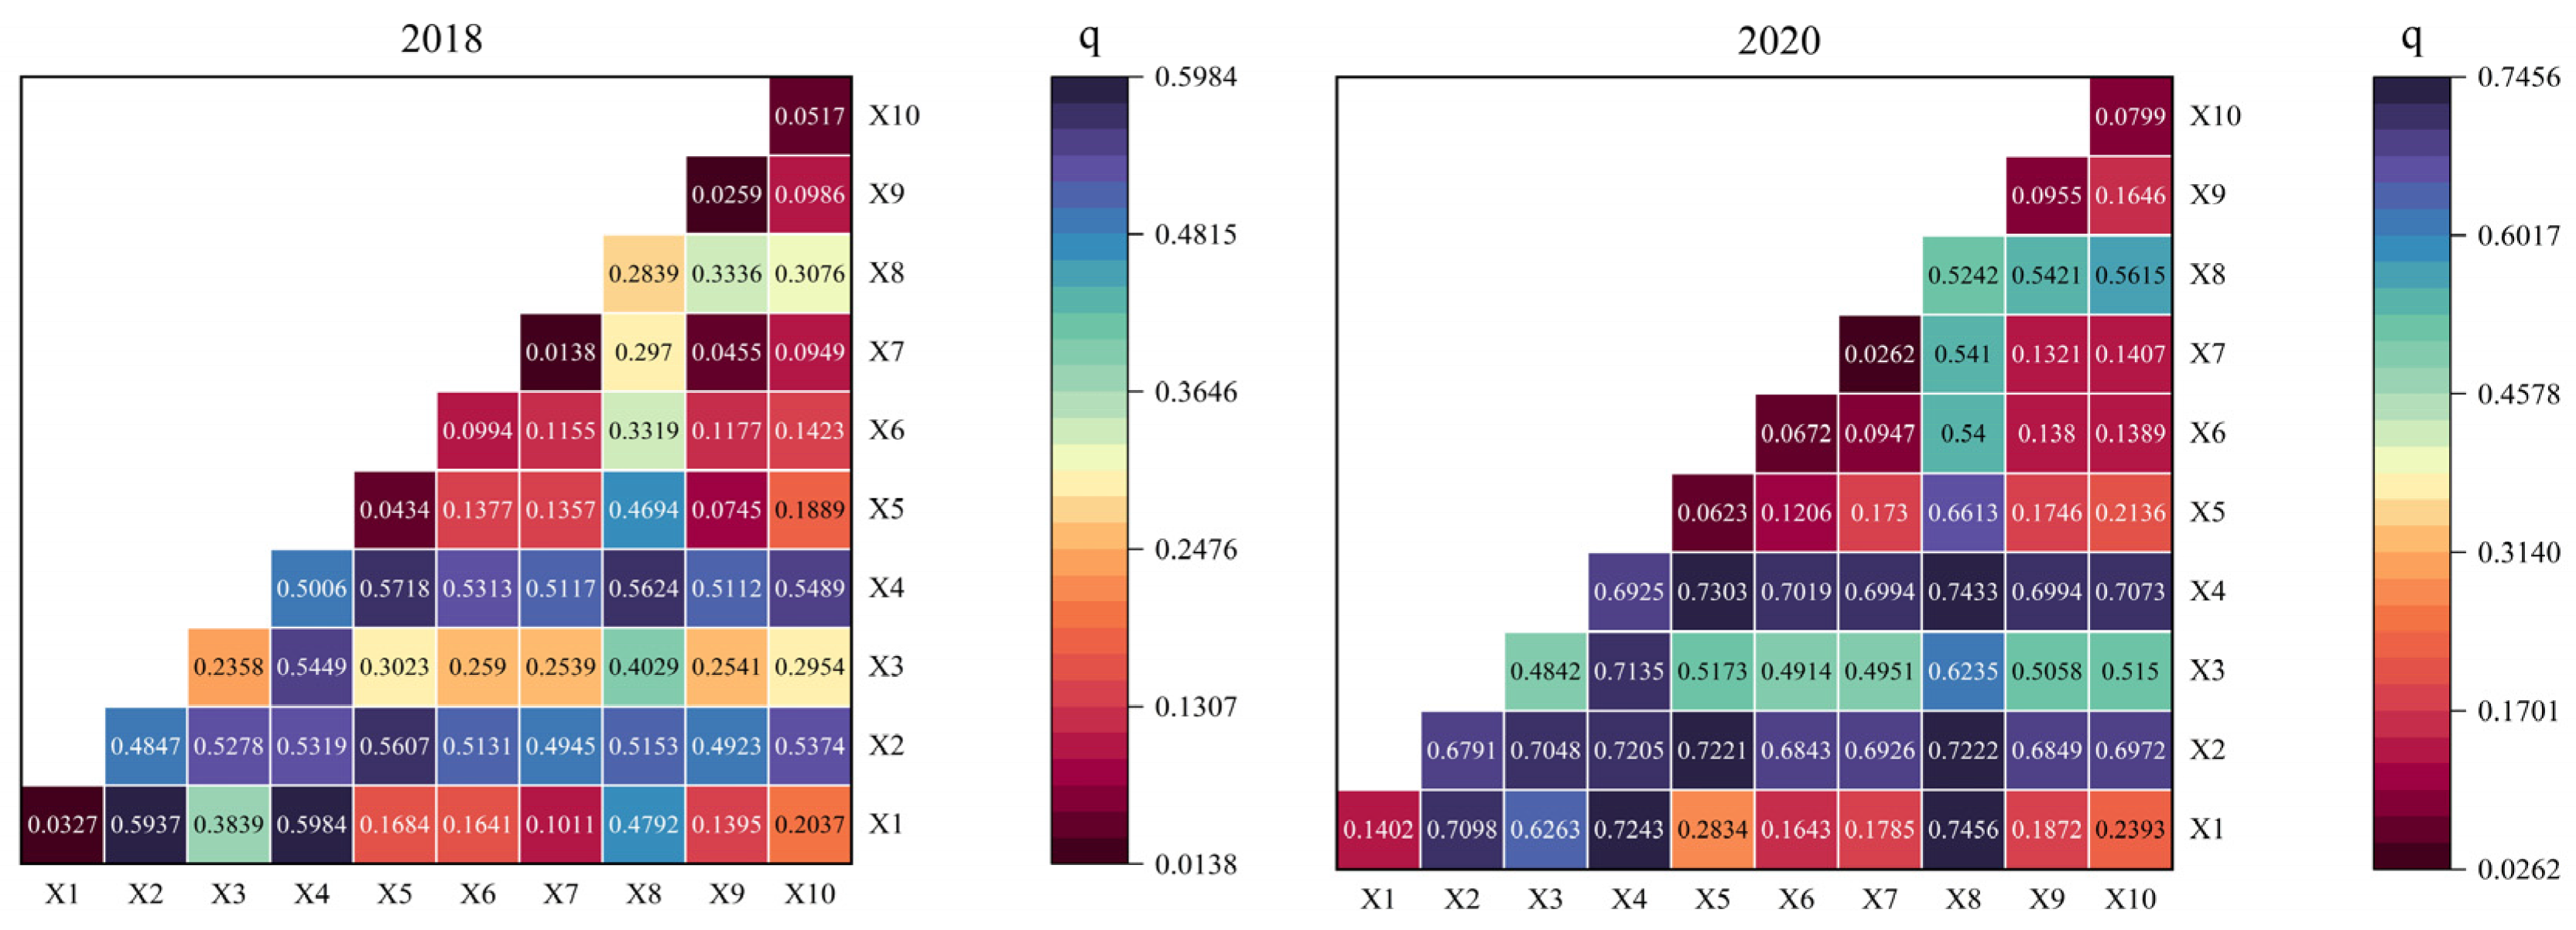
3.4.2. Interaction Detector Results

The interaction detector results (double-factor and nonlinear enhancement) are listed in Figure 7. The results suggest that when two components work together, their combined effect on the RSEI is larger than when one element acts alone. The interaction detector results for 2018 revealed that the most significant factors affecting the RSEI were temperature ∩ DEM, temperature ∩ precipitation, DEM ∩ slope direction, and DEM ∩ distance from the administrative district, with values of 0.5984, 0.5937, 0.5718, and 0.5624, respectively. The significant factors for the interaction effects in 2020 were temperature ∩ distance from the administrative district, DEM ∩ distance from the administrative district, DEM ∩ slope direction, and temperature ∩ DEM, with values of 0.7456, 0.7433, 0.7303, and 0.7243, respectively. Climate and terrain factors always play a significant role in the interaction detection, mainly through their direct impact on vegetation growth and thus on the eco-environmental quality.

3.5. Future Trends in Eco-Environmental Quality

Figure 8 displays the findings of the Hurst analysis used to forecast the features of future change for the RSEI in the research region. The results were classified into six categories: continuous improvement, degradation to improvement, change uncertainty, continuous stability, improvement to degradation, and continuous degradation. The area of continuous improvement of the RSEI accounted for 26.95%. This area occurred in the Sunit Right Banner and the Yellow Banner. In contrast, 20.05% of the area fell into the improvement to degradation category. This area was mainly located in the central section of the research region within the border of the Border Yellow Banner. The percentage of the area with continuous degradation was 31.26% and that in the degradation to improvement class was 15.87%. This section was mainly distributed in a mosaic in the northwestern and central parts of the research region. In the northwest and southeast of the research region, there were isolated patches of these regions.

4. Discussion

4.1. Impact of Highway Construction on RSEI

A comparison study has been carried out comparing the RSEI difference in a multi-scale buffer zone prior to and during highway construction (Figure 3). The 1500 m buffer zone was identified as the main area influenced by highway construction. The results are consistent with the spatial extent of environmental impacts during road construction identified by Song et al. [51]. When highway construction began in 2018, the surrounding environment was more vulnerable to project disruptions and was heavily impacted by the work. Predictions of future trends in RSEI exhibit that 51.31% of the area will show a degrading trend, while 42.82% will show an improving trend. The proportion of degraded areas is predicted to increase by 3.16%, whereas the proportion of areas with improved quality is predicted to decrease by 2.99%. This result suggests that there will likely be a decline in the research area’s eco-environmental quality in the future. The increased intensity of human activity in the region after completion of the highway will also contribute to this result. It is evident that the construction of the highway had a complicated, long-lasting, and cumulative effect on the environment around it [52].
We quantified the effects of highway construction along the highway from Sunit Right Banner to Huade County (Inner Mongolia–Hebei border) on the state of the surrounding environment. Taking the year of the start of construction of the Sunit Right Banner to Huade (Inner Mongolia–Hebei border) highway as the time node, the study period is divided into three stages: pre-construction I (2016–2017), construction II (2018–2020), and post-construction III (2021). The average RSEI spatial distribution was calculated for the three time periods (Figure 9a), and the percentage of the area with different levels of RSEI in the three periods was obtained (Figure 9b). The differences in the percentages of different levels of RSEI in the three time periods are shown in Figure 9c. The results indicated that the average RSEI pre-construction was 0.4469. The proportion of the area with moderate quality and below levels was 68.33%. The average RSEI in construction was 0.3834, and the proportion of the area with moderate quality and below levels was 84.16%. The percentage of moderate- and below-rated square footage in construction compared to pre-construction showed varying degrees of increase. The difference in average RSEI post-construction compared to pre-construction is not significant. However, the percentage of area in moderate- and below-rated areas is 3.71% higher than pre-construction (68.33%, 72.04%). It is evident that the eco-environment of the area along the highway would be greatly affected by highway construction [53].
We compared the variations in the different levels of RSEI since the construction period (Figure 10). During highway construction, the study area’s overall RSEI level was low, but as the work progressed, the percentage of locations with moderate and above quality grew. At the beginning of highway construction (2018), 70% of the area fell into the poor and fair quality levels. This result may be due primarily to the entry of heavy equipment onto the site during the early stages of construction and direct damage to regional vegetation from the construction of the roadbed [54]. The percentage of regions with poor and fair quality levels decreased to 56.5% by 2019. Nonetheless, there was no discernible change in the proportion of locations with excellent quality between 2018 and 2019. Over the course of these two years, the RSEI levels mostly changed between the poor, fair, and moderate levels. Areas with moderate and higher quality increased by 13.6% from 2019 to 2020, and the RSEI shifted from the fair and moderate levels to the good and excellent levels. This shift was the primary reason for the upward trend in eco-environmental quality in 2020. The main reason for this may be the environment recovered from the damages caused in the early construction stage. There is a large span of change among the levels of eco-environmental quality from 2020 to 2021, and the proportion of moderate and higher levels by 2021 is not much different from that in 2020. However, compared to the highway construction period, 2021 had the lowest proportion of poor levels and the highest proportion of excellent levels for eco-environmental quality. It is evident that the study area’s general eco-environmental quality demonstrated a positive trend following construction as compared to the time of highway construction. This result may be mainly due to the decrease in the intensity of the impact of human activities on the ecosystem after the construction of the highway and the implementation of the corresponding restoration measures. Our results indicate different impact degrees on the eco-environmental quality in different construction periods. Therefore, environmental management measures of different intensities must be implemented in different construction phases.

4.2. Factors Influencing Regional Eco-Environmental Quality during Highway Construction

Previous studies have shown that the dominant climatic factors vary from region to region due to differences in geographical location [55,56]. However, climatic factors are still considered to have a substantial influence on eco-environmental quality [57,58]. Our results agree with those of earlier research. We identified climatic factors as key indicators of regional eco-environmental quality during highway construction, with interactions with various other factors reinforcing this outcome. Precipitation had a significant impact on the area’s eco-environmental quality in this research. We also noticed that variations in temperature and precipitation in various years can lead to differences in the extent of their impact on eco-environmental quality. For example, the q-values of the temperature and precipitation increased significantly in 2020. However, the factor detector results suggested that climatic factors were not the only drivers of regional eco-environmental quality during highway construction. Figure 8 suggests that elevation had a substantial influence on eco-environmental quality, while the interaction of DEM, slope direction, and other factors all have a significant effect on eco-environmental quality. DEM had an effect on vegetation growth by influencing climatic factors [59], and this result will in turn effect the quality of the regional eco-environment. The effect of slope direction was similar. At the same time, DEM and slope direction influence surface runoff and regional soil moisture, respectively [60]. This impact will in turn further contribute to the quality of the eco-environment. Without a doubt, the rate of vegetation present directly affects the eco-environmental quality [61]. Similar conclusions were discovered in this research, which showed that in both 2018 and 2020, the FVC had an important impact on the eco-environmental quality of the region surrounding the highway construction.
In addition, human activities impact eco-environmental quality [62,63]. We used land cover type, distance from roads, distance from the administrative district, nighttime light intensity, and human footprint to characterize human activity. With the exception of the distance from the administrative district, human activity variables had an insignificant effect on the eco-environmental quality at this regional scale. Previous studies have found that highways lead to urban land expansion development [64]. It can be seen that the significant effect of distance from the administrative area may come from the counterforce of the expansion of the urban fringe due to the construction of the highway on the regional ecosystem. In addition, an interaction occurred between the distance from the road and the distance from the administrative district, and both factors influenced the change in land cover type separately [3,65]. Stated differently, the quality of the eco-environment in the research region is influenced by the interactions among the elements related to human activities. Several studies have demonstrated that the human footprint and nighttime light intensity will have an ecological impact [66,67]. Similar conclusions were obtained in the present study. However, unlike previous studies, highways, as the first construction of unengineered land, are not significantly affected by human footprint and nighttime light intensity along their construction. However, Figure 8 indicates that the interaction between human factors and natural factors had a stronger impact on eco-environmental quality than the single factors. This implies that the influence of human activity-related factors on eco-environmental quality does not exist independently but to some extent in conjunction with other natural factors.
The interaction detector results reveal that the q-values of two interacting factors are larger than those of single factors (Figure 8), and the ranking of the dominant interaction factors varies significantly from year to year, despite the fact that the factor detector results (Table 4) show no differences in the dominant drivers of regional eco-environmental quality during highway construction in 2018 and 2020. The complexity of the effect mechanism of the regional eco-environmental quality during highway construction is shown in this study, which shows that the eco-environmental quality is not controlled by one factor or a single type of factor. Thus, it is necessary to develop targeted protection and management measures for the regional eco-environment during highway construction at different time points and consider the environmental characteristics.

4.3. Limitations and Future Perspectives

We utilized continuous time-series data of the RSEI to bolster the dependability and precision of the RSEI trend analysis results compared to previous studies. However, the selection of the driving factors of the RSEI was not comprehensive; for example, no socio-economic factors were considered. In addition, the purpose of this article is to assess the ecological impacts during the construction of the highway, while the evaluation of the regional eco-environment after the construction of the highway is not comprehensive.

5. Conclusions

We explored the changes in regional eco-environment development over the full cycle of highway construction through detailed image data and investigated the evolution of regional eco-environmental quality and its drivers due to highway construction. Using the GEE platform, our work built the RSEI and used the trend analysis approach to explain changes in the dual dimensions of time–space. In addition, we explored the drivers of RSEI from four aspects: climate, vegetation, terrain, and human activities, a process accomplished with the help of Geodetector. Based on the results of the Hurst analysis, we made a prediction of the future eco-environmental quality of the region. The following are the conclusions:
(1)
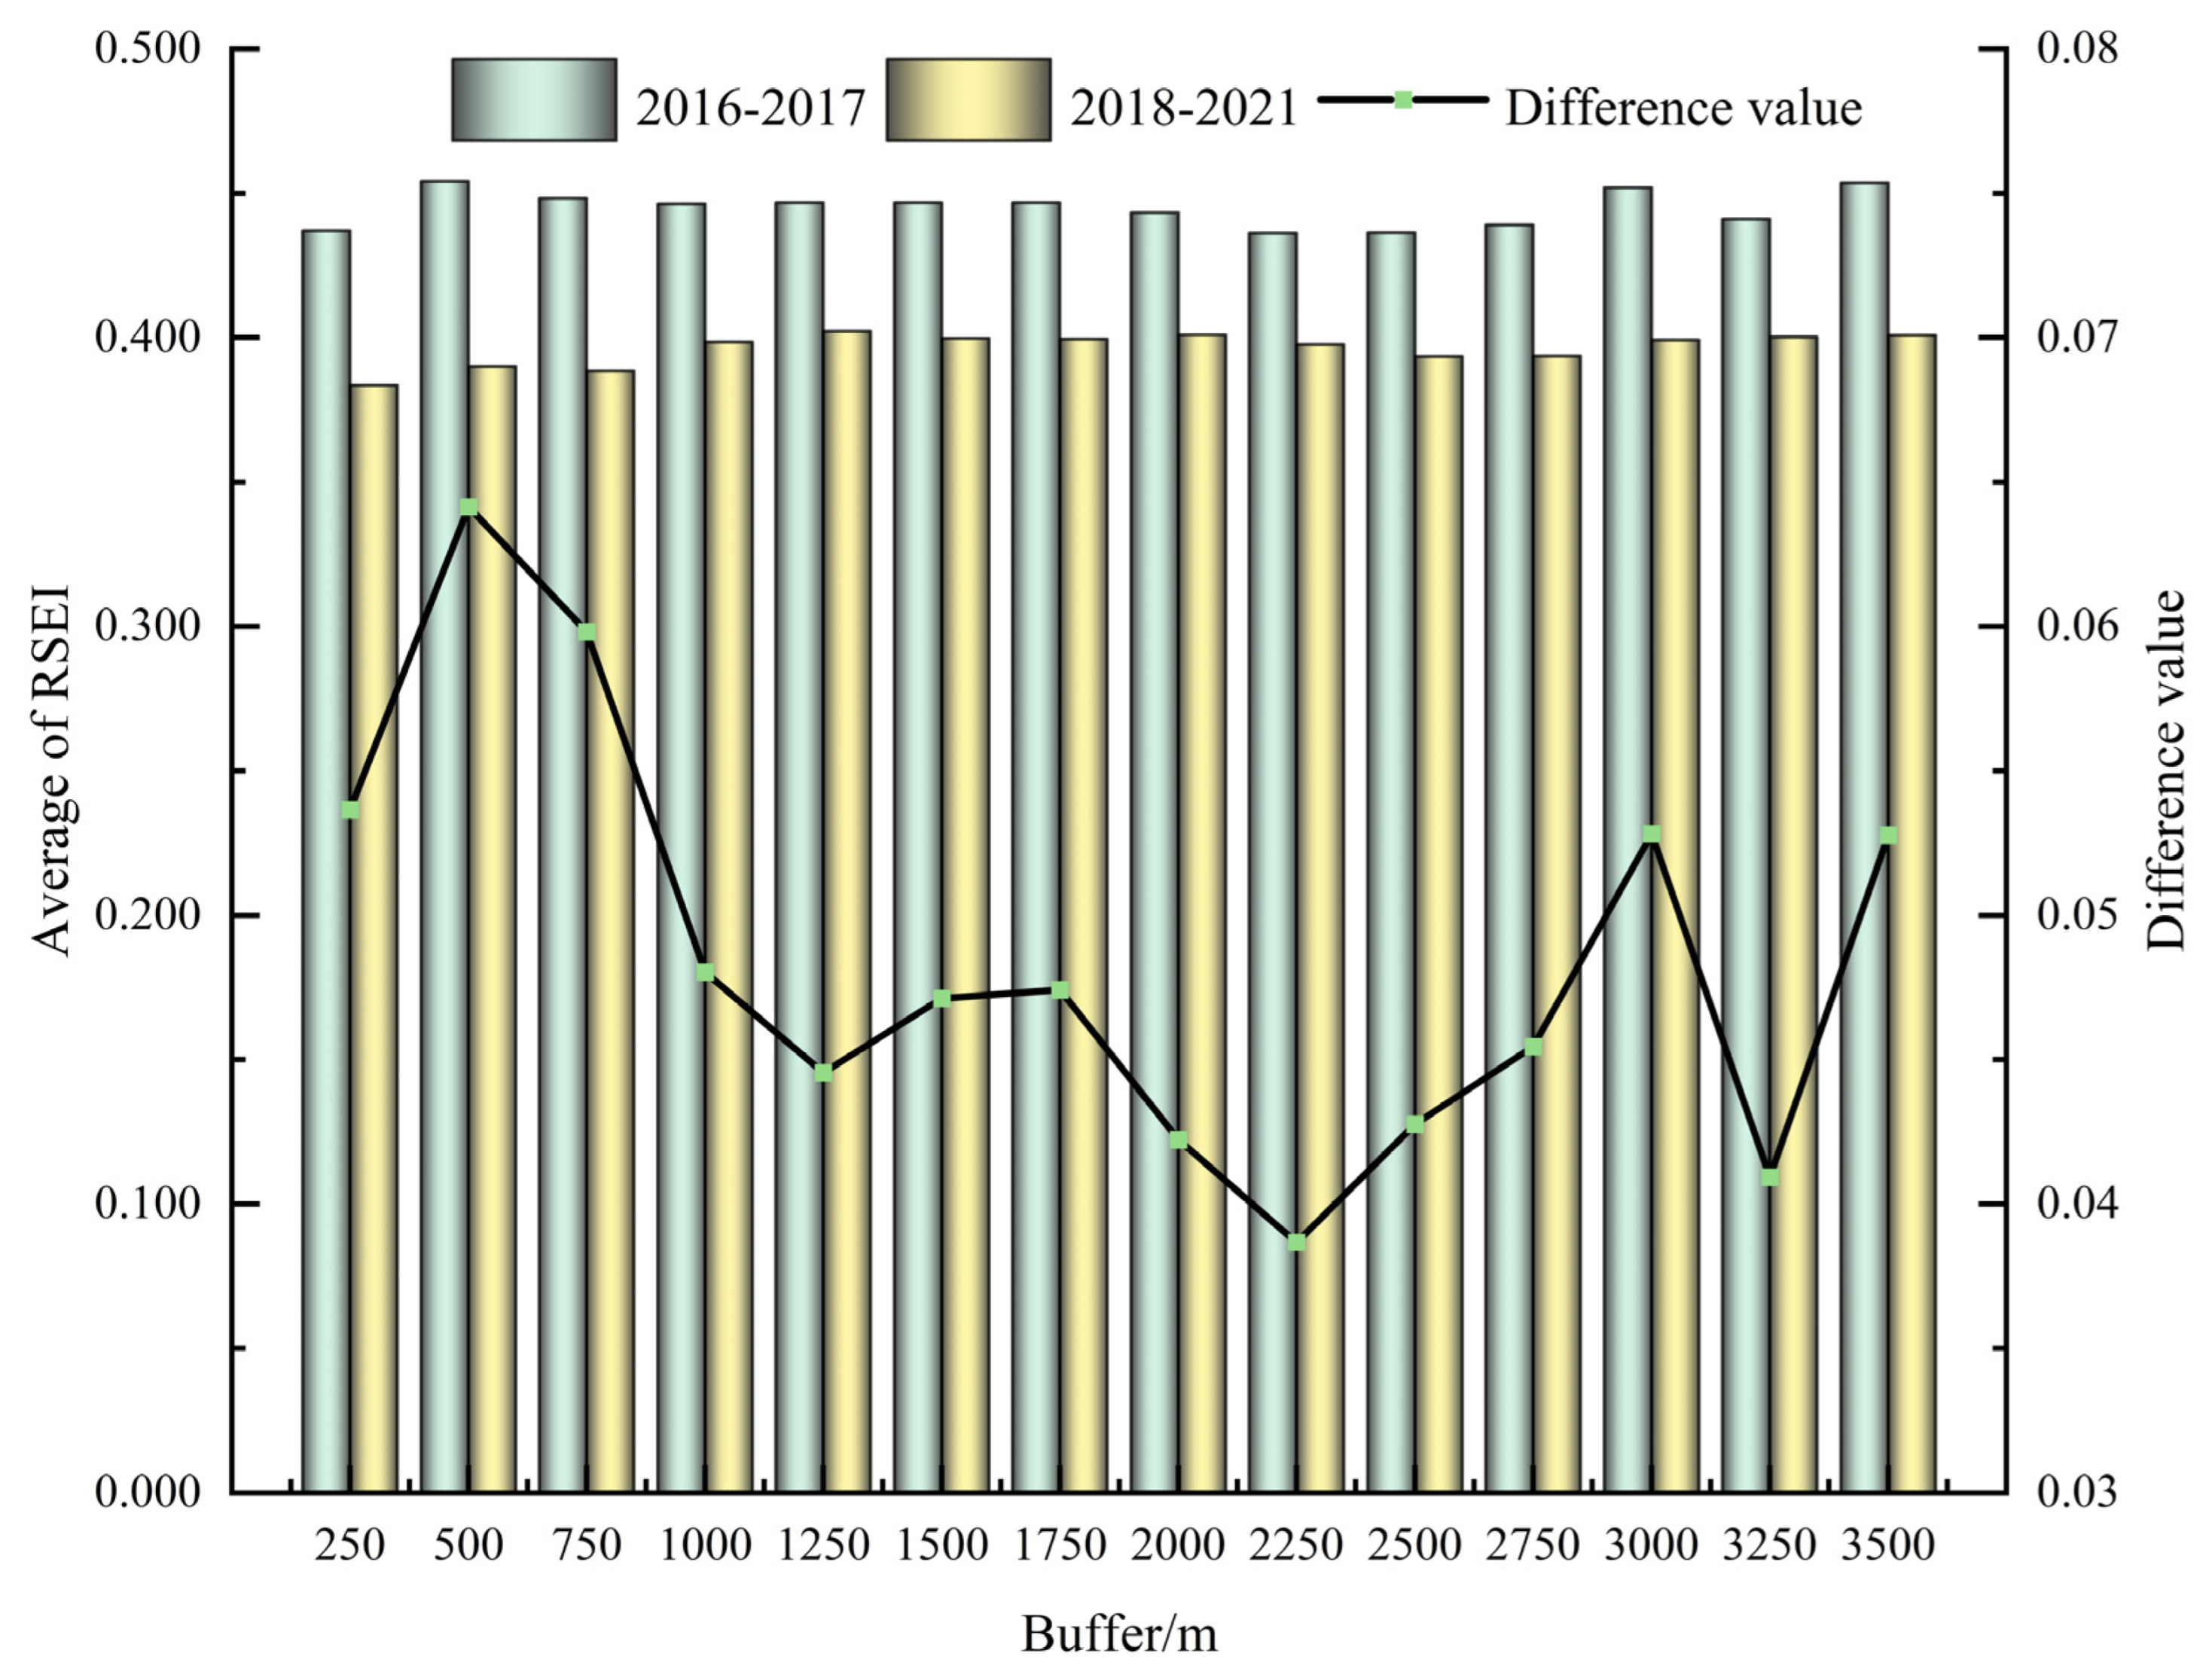
The analysis of several buffer zones revealed that the buffer zone extending 1500 m along the route was primarily affected by highway construction in terms of the quality of the eco-environment.
(2)
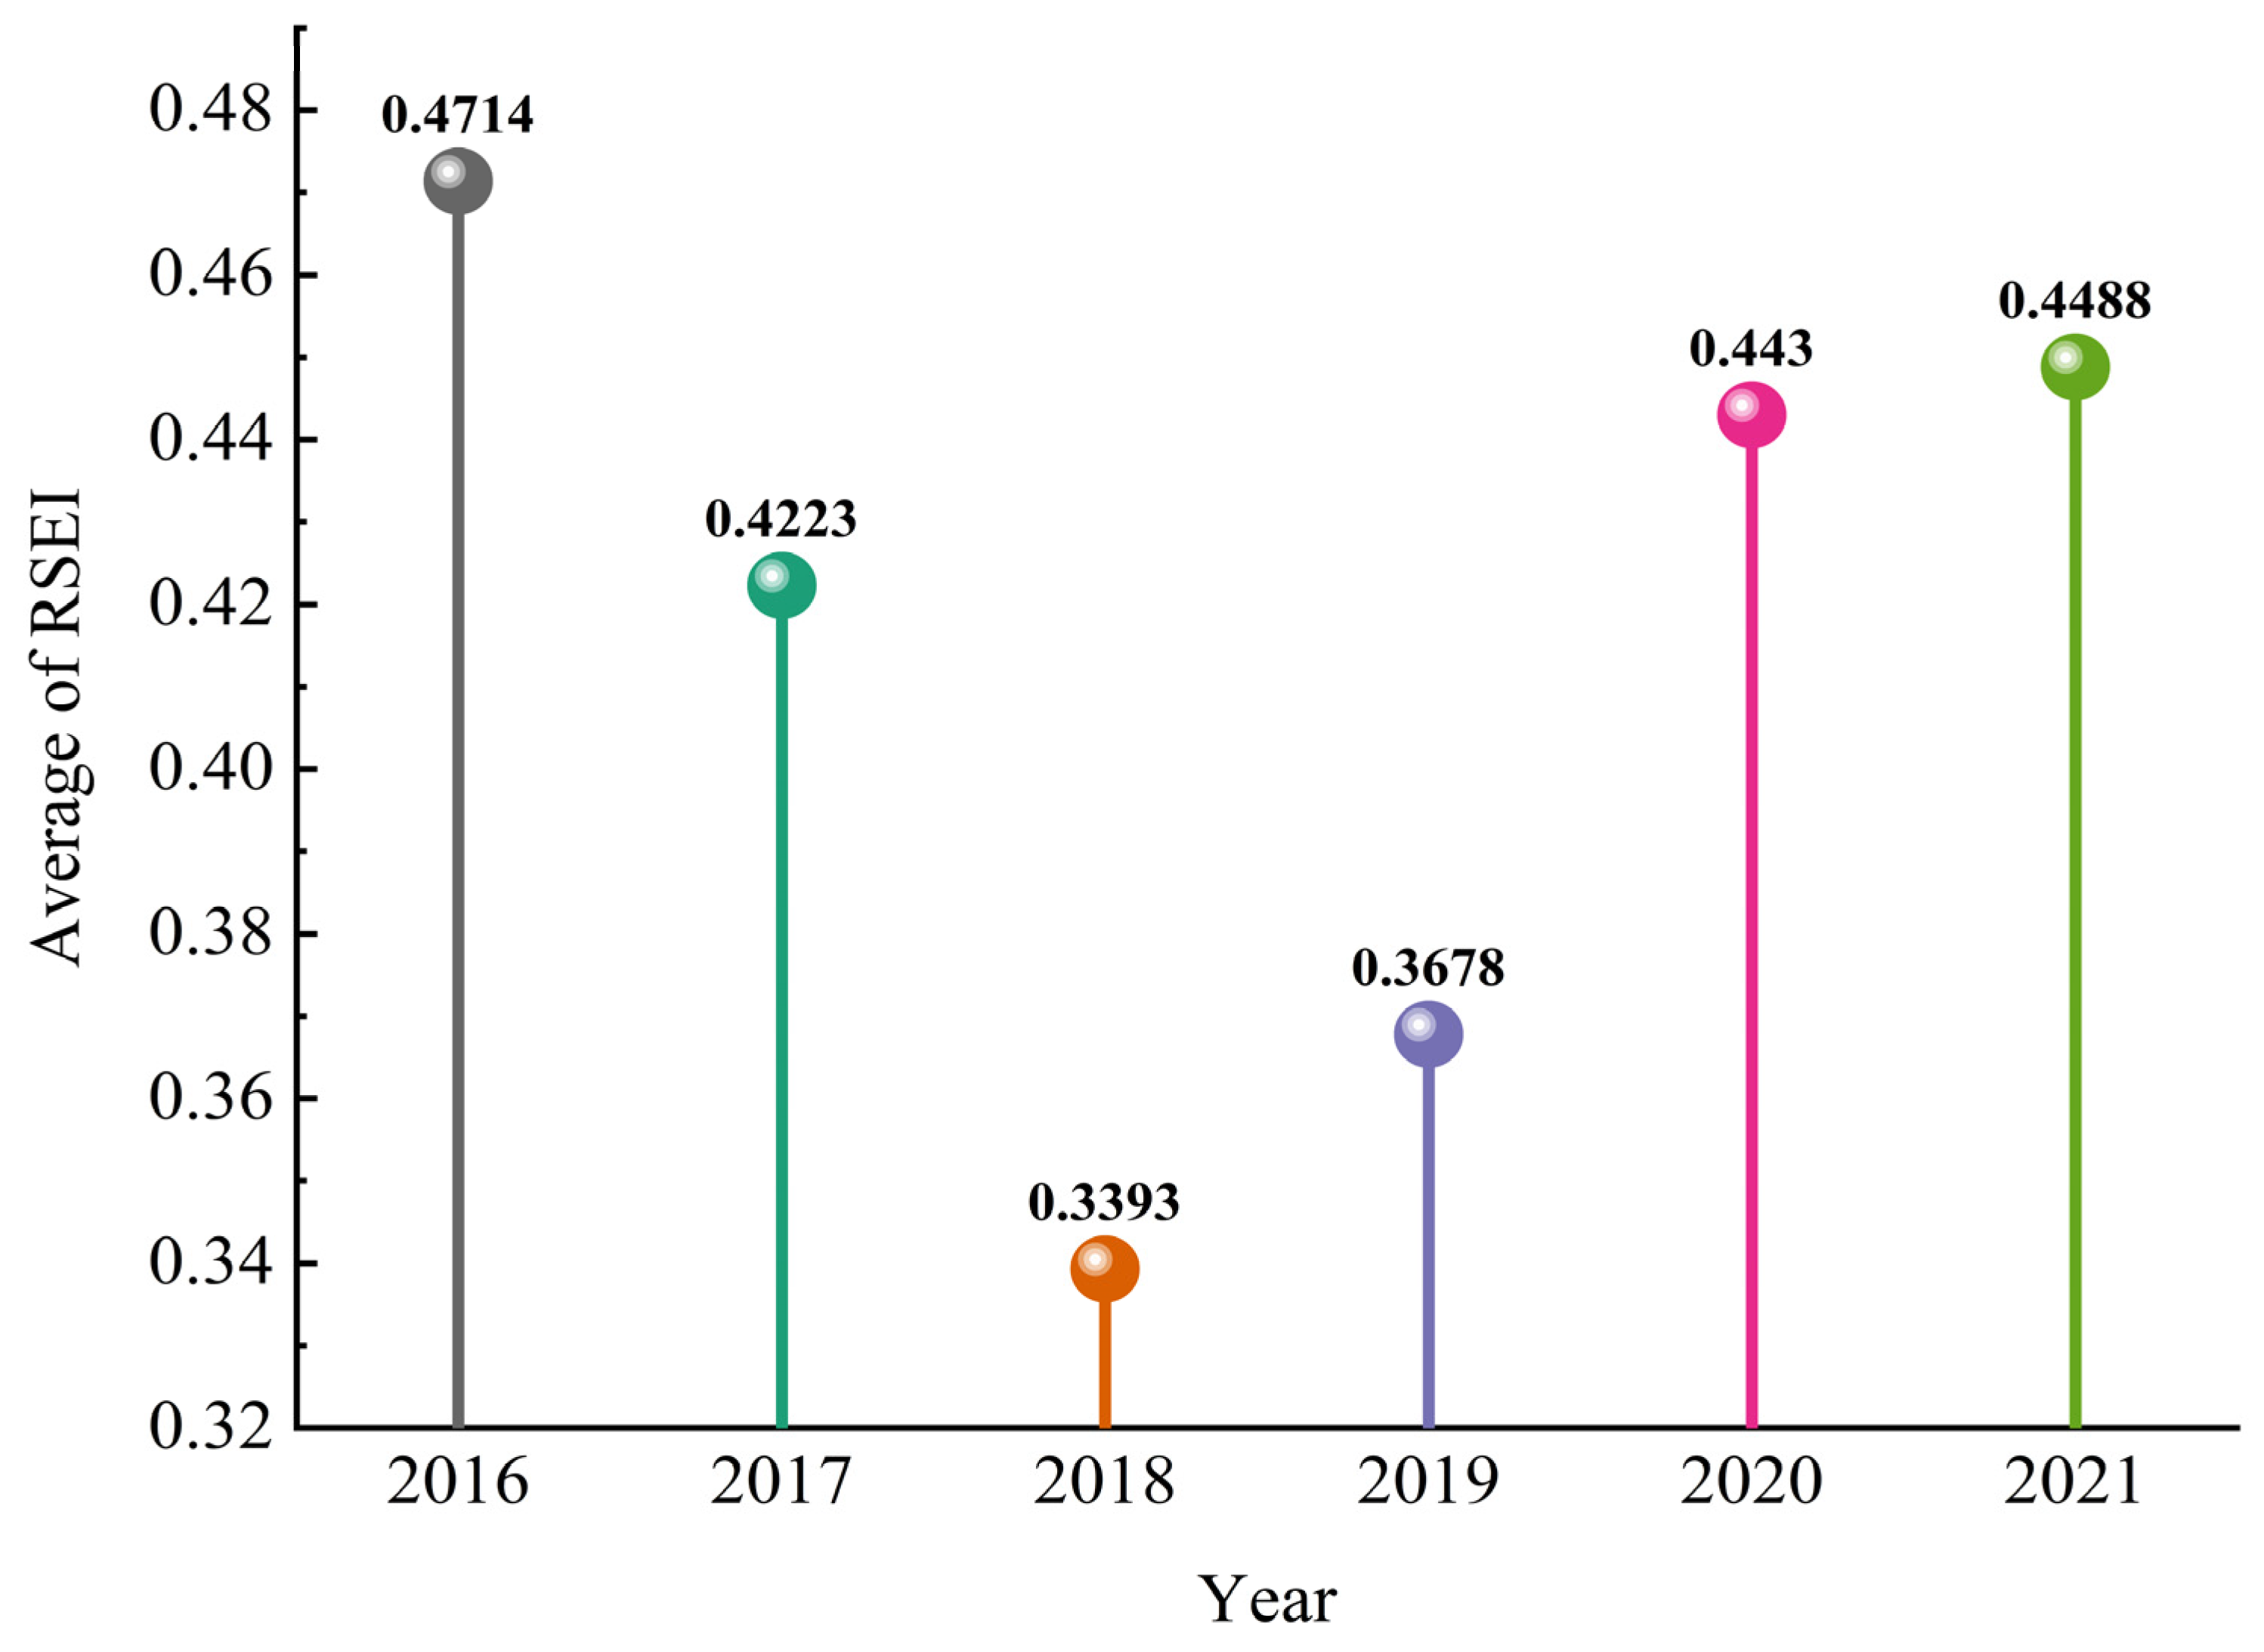
The RSEI’s yearly average value during the Sunit Right Banner to Huade (Inner Mongolia–Hebei border) highway’s whole construction period (2016–2021) had a V-shaped curve.
(3)
The state of the environment during and after construction has been impacted to varying degrees in comparison to the highway’s pre-construction phase, with the construction phase seeing a larger degree of effect. Furthermore, the construction process is most heavily impacted during the early stages of the project.
(4)
DEM, precipitation, distance from the administrative district, and FVC were the main determinants of regional eco-environmental quality along the highway. The dominant factors of interaction effects were temperature ∩ DEM, temperature ∩ precipitation, DEM ∩ slope direction, DEM ∩ distance from the administrative district, and temperature ∩ distance from the administrative district. In summary, most driving factors were environmental factors, and the distance from the administrative district was the dominant human activity factor.
(5)
It is anticipated that, compared to the study period, the percentage of places with worsened eco-environmental quality will rise by 3.16%, while the percentage of areas with improved eco-environmental quality will fall by 2.99%. As a result, highway construction had an ongoing, long-term effect on the local environment along its path.

Author Contributions

Conceptualization, X.Y. and Y.H.; methodology, X.G. and Y.H.; software, X.G. and Y.H.; validation, X.Y. and Y.H.; formal analysis, J.Z.; investigation, X.Y. and J.Z.; resources, X.Y.; data curation, L.K. and Y.H.; writing—original draft preparation, X.Y. and Y.H.; supervision, X.Y.; project administration, X.Y. All authors have read and agreed to the published version of the manuscript.

Funding

This research was funded by the National Natural Science Foundation of China, grant number 71942006; by the Heilongjiang Province Philosophy and Social Sciences Research and Planning Project, grant number 22JYE462, and Innovative Research Project of Graduate Students in Harbin Normal University of China, grant number HSDSSCX2023-47.

Data Availability Statement

Data are contained within the article.

Conflicts of Interest

The authors declare no conflicts of interest.

References

  1. Meijer, J.; Huijbregts, M.; Schotten, K.; Schipper, A. Global patterns of current and future road infrastructure. Environ. Res. Lett. 2018, 13, 064006. [Google Scholar] [CrossRef]
  2. Miao, Y.; Dai, T.; Yang, X.; Song, J. Landscape fragmentation associated with the Qingzang Highway and its influencing factors—A comparison study on road sections and buffers. Geogr. Sustain. 2021, 2, 59–67. [Google Scholar] [CrossRef]
  3. Cui, X.; Fang, C.; Wang, Z.; Bao, C. Spatial relationship of high-speed transportation construction and land-use efficiency and its mechanism: Case study of Shandong Peninsula urban agglomeration. J. Geogr. Sci. 2019, 29, 549–562. [Google Scholar] [CrossRef]
  4. Giunta, M. Assessment of the environmental impact of road construction: Modelling and prediction of fine particulate matter emissions. Build. Environ. 2020, 176, 106865. [Google Scholar] [CrossRef]
  5. Hamer, A.J.; Barta, B.; Bohus, A.; Gál, B.; Schmera, D. Roads reduce amphibian abundance in ponds across a fragmented landscape. Glob. Ecol. Conserv. 2021, 28, e01663. [Google Scholar] [CrossRef]
  6. Ye, K.; Guo, Z.; Zhang, W.; Liang, Y. Heterogeneous environmental policy tools for expressway construction projects: A crossregional analysis in China. Environ. Impact Assess. Rev. 2022, 97, 106907. [Google Scholar] [CrossRef]
  7. Li, S.; Wang, J.; Zhang, M.; Tang, Q. Characterizing and attributing the vegetation coverage changes in North Shanxi coal base of China from 1987 to 2020. Resour. Policy 2021, 74, 102331. [Google Scholar] [CrossRef]
  8. Li, J.; Wang, J.; Zhang, J.; Liu, C.; He, S.; Liu, L. Growing-season vegetation coverage patterns and driving factors in the China-Myanmar Economic Corridor based on Google Earth Engine and geographic detector. Ecol. Indic. 2022, 136, 108620. [Google Scholar] [CrossRef]
  9. Silva, R.G.d.; Santos, A.R.d.; Pelúzio, J.B.E.; Fiedler, N.C.; Juvanhol, R.S.; Souza, K.B.d.; Branco, E.R.F. Vegetation trends in a protected area of the Brazilian Atlantic forest. Ecol. Eng. 2021, 162, 106180. [Google Scholar] [CrossRef]
  10. Xue, S.-Y.; Xu, H.-Y.; Mu, C.-C.; Wu, T.-H.; Li, W.-P.; Zhang, W.-X.; Streletskaya, I.; Grebenets, V.; Sokratov, S.; Kizyakov, A.; et al. Changes in different land cover areas and NDVI values in northern latitudes from 1982 to 2015. Adv. Clim. Change Res. 2021, 12, 456–465. [Google Scholar] [CrossRef]
  11. Jin, H.; Chen, X.; Wang, Y.; Zhong, R.; Zhao, T.; Liu, Z.; Tu, X. Spatio-temporal distribution of NDVI and its influencing factors in China. J. Hydrol. 2021, 603, 127129. [Google Scholar] [CrossRef]
  12. Peng, J.; Jiang, H.; Liu, Q.; Green, S.M.; Quine, T.A.; Liu, H.; Qiu, S.; Liu, Y.; Meersmans, J. Human activity vs. climate change: Distinguishing dominant drivers on LAI dynamics in karst region of southwest China. Sci. Total Environ. 2021, 769, 144297. [Google Scholar] [CrossRef] [PubMed]
  13. Jamali, A.A.; Ghorbani Kalkhajeh, R.; Randhir, T.O.; He, S. Modeling relationship between land surface temperature anomaly and environmental factors using GEE and Giovanni. J. Environ. Manag. 2022, 302, 113970. [Google Scholar] [CrossRef] [PubMed]
  14. Wan, W.; Liu, Z.; Li, K.; Wang, G.; Wu, H.; Wang, Q. Drought monitoring of the maize planting areas in Northeast and North China Plain. Agric. Water Manag. 2021, 245, 106636. [Google Scholar] [CrossRef]
  15. Zou, S.; Qian, J.; Xu, B.; Tu, Z.; Zhang, W.; Ma, X.; Liang, Y. Spatiotemporal changes of ecosystem health and their driving mechanisms in alpine regions on the northeastern Tibetan Plateau. Ecol. Indic. 2022, 143, 109396. [Google Scholar] [CrossRef]
  16. Li, T.; Dong, Y. Phased and polarized development of ecological quality in the rapidly-urbanized Pearl River Delta, China. Environ. Sci. Pollut. Res. 2022, 30, 36176–36189. [Google Scholar] [CrossRef] [PubMed]
  17. Zhao, W.; Yan, T.; Ding, X.; Peng, S.; Chen, H.; Fu, Y.; Zhou, Z. Response of ecological quality to the evolution of land use structure in Taiyuan during 2003 to 2018. Alex. Eng. J. 2021, 60, 1777–1785. [Google Scholar] [CrossRef]
  18. Zhang, Y.; She, J.; Long, X.; Zhang, M. Spatio-temporal evolution and driving factors of eco-environmental quality based on RSEI in Chang-Zhu-Tan metropolitan circle, central China. Ecol. Indic. 2022, 144, 109436. [Google Scholar] [CrossRef]
  19. Wang, J.F.; Li, X.H.; Christakos, G.; Liao, Y.L.; Zhang, T.; Gu, X.; Zheng, X.Y. Geographical Detectors-Based Health Risk Assessment and its Application in the Neural Tube Defects Study of the Heshun Region, China. Int. J. Geogr. Inf. Sci. 2010, 24, 107–127. [Google Scholar] [CrossRef]
  20. Zhang, L.; Fang, C.; Zhao, R.; Zhu, C.; Guan, J. Spatial–temporal evolution and driving force analysis of eco-quality in urban agglomerations in China. Sci. Total Environ. 2023, 866, 161465. [Google Scholar] [CrossRef]
  21. Tao, S.; Peng, W.; Xiang, J. Spatiotemporal variations and driving mechanisms of vegetation coverage in the Wumeng Mountainous Area, China. Ecol. Inform. 2022, 70, 101737. [Google Scholar] [CrossRef]
  22. Xu, X.; Xu, Y.; Xu, H.; Wang, C.; Jia, R. Does the expansion of highways contribute to urban haze pollution?—Evidence from Chinese cities. J. Clean. Prod. 2021, 314, 128018. [Google Scholar] [CrossRef]
  23. Islam, M.S.; Nur-E-Alam, M.; Iqbal, M.A.; Khan, M.B.; Mamun, S.A.; Miah, M.Y.; Rasheduzzaman, M.; Appalasamy, S.; Salam, M.A. Spatial distribution of heavy metal abundance at distance gradients of roadside agricultural soil from the busiest highway in Bangladesh: A multi-index integration approach. Environ. Res. 2024, 250, 118551. [Google Scholar] [CrossRef] [PubMed]
  24. Jiang, G.; Fu, Z.; Gao, S.; Zhao, H.; Chen, J.; Liu, Y.; Wu, Q. Long-term responses of permafrost to the dual impacts of climate warming and engineering disturbance along the Qinghai-Tibet Highway. Cold Reg. Sci. Technol. 2024, 220, 104135. [Google Scholar] [CrossRef]
  25. Feng, S.; Liu, S.; Jing, L.; Zhu, Y.; Yan, W.; Jiang, B.; Liu, M.; Lu, W.; Ning, Y.; Wang, Z. Quantification of the environmental impacts of highway construction using remote sensing approach. Remote Sens. 2021, 13, 1340. [Google Scholar] [CrossRef]
  26. Zhao, L.; Fan, X.; Lin, H.; Hong, T.; Hong, W. Impact of Expressways on Land Use Changes, Landscape Patterns, and Ecosystem Services Value in Nanping City, China. Pol. J. Environ. Stud. 2021, 30, 2935–2946. [Google Scholar] [CrossRef]
  27. Baehr, C.; BenYishay, A.; Parks, B. Highway to the forest? Land governance and the siting and environmental impacts of Chinese government-funded road building in Cambodia. J. Environ. Econ. Manag. 2023, 122, 102898. [Google Scholar] [CrossRef]
  28. Klarenberg, G.; Muñoz-Carpena, R.; Campo-Bescós, M.A.; Perz, S.G. Highway paving in the southwestern Amazon alters long-term trends and drivers of regional vegetation dynamics. Heliyon 2018, 4, e00721. [Google Scholar] [CrossRef] [PubMed]
  29. Zhu, D.; Chen, T.; Wang, Z.; Niu, R. Detecting ecological spatial-temporal changes by Remote Sensing Ecological Index with local adaptability. J. Environ. Manag. 2021, 299, 113655. [Google Scholar] [CrossRef]
  30. Xu, H. A remote sensing urban ecological index and its application. Shengtai Xuebao/Acta Ecol. Sin. 2013, 33, 7853–7862. [Google Scholar]
  31. Huang, S.; Tang, L.; Hupy, J.P.; Wang, Y.; Shao, G. A commentary review on the use of normalized difference vegetation index (NDVI) in the era of popular remote sensing. J. For. Res. 2021, 32, 1–6. [Google Scholar] [CrossRef]
  32. Riihimäki, H.; Heiskanen, J.; Luoto, M. The effect of topography on arctic-alpine aboveground biomass and NDVI patterns. Int. J. Appl. Earth Obs. Geoinf. 2017, 56, 44–53. [Google Scholar] [CrossRef]
  33. Crist, E.P. A TM Tasseled Cap equivalent transformation for reflectance factor data. Remote Sens. Environ. 1985, 17, 301–306. [Google Scholar] [CrossRef]
  34. Huang, C.; Wylie, B.; Yang, L.; Homer, C.; Zylstra, G. Derivation of a tasselled cap transformation based on Landsat 7 at-satellite reflectance. Int. J. Remote Sens. 2002, 23, 1741–1748. [Google Scholar] [CrossRef]
  35. Roy, P.S. Tropical forest cover density mapping. Trop. Ecol. 2002, 43, 39–47. [Google Scholar]
  36. Xu, H. A new index for delineating built-up land features in satellite imagery. Int. J. Remote Sens. 2008, 29, 4269–4276. [Google Scholar] [CrossRef]
  37. Zhu, Q.; Guo, X.; Guo, J.; Wu, J.; Ye, Y.; Cai, W.; Liu, S. The quality attribute of watershed ecosystem is more important than the landscape attribute in controlling erosion of red soil in southern China. Int. Soil Water Conserv. Res. 2022, 10, 507–517. [Google Scholar] [CrossRef]
  38. Artis, D.A.; Carnahan, W.H. Survey of emissivity variability in thermography of urban areas. Remote Sens. Environ. 1982, 12, 313–329. [Google Scholar] [CrossRef]
  39. Kimothi, S.; Thapliyal, A.; Gehlot, A.; Aledaily, A.N.; Gupta, A.; Bilandi, N.; Singh, R.; Kumar Malik, P.; Vaseem Akram, S. Spatio-temporal fluctuations analysis of land surface temperature (LST) using Remote Sensing data (LANDSAT TM5/8) and multifractal technique to characterize the urban heat Islands (UHIs). Sustain. Energy Technol. Assess. 2023, 55, 102956. [Google Scholar] [CrossRef]
  40. Sen, P.K. Estimates of the Regression Coefficient Based on Kendall’s Tau. J. Am. Stat. Assoc. 1968, 63, 1379–1389. [Google Scholar] [CrossRef]
  41. Kendall, M.G. Rank Correlation Methods; Griffin: London, UK, 1948. [Google Scholar]
  42. Mann, H.B. Nonparametric tests against trend. Econom. J. Econom. Soc. 1945, 13, 245–259. [Google Scholar] [CrossRef]
  43. Abebe, S.A.; Qin, T.; Zhang, X.; Yan, D. Wavelet transform-based trend analysis of streamflow and precipitation in Upper Blue Nile River basin. J. Hydrol. Reg. Stud. 2022, 44, 101251. [Google Scholar] [CrossRef]
  44. Masroor, M.; Rehman, S.; Avtar, R.; Sahana, M.; Ahmed, R.; Sajjad, H. Exploring climate variability and its impact on drought occurrence: Evidence from Godavari Middle sub-basin, India. Weather. Clim. Extrem. 2020, 30, 100277. [Google Scholar] [CrossRef]
  45. Mandelbrot, B.B.; Wallis, J.R. Noah, Joseph, and operational hydrology. Water Resour. Res. 1968, 4, 909–918. [Google Scholar] [CrossRef]
  46. Barunik, J.; Kristoufek, L. On Hurst exponent estimation under heavy-tailed distributions. Phys. A Stat. Mech. Its Appl. 2010, 389, 3844–3855. [Google Scholar] [CrossRef]
  47. Jiang, L.; Jiapaer, G.; Bao, A.; Guo, H.; Ndayisaba, F. Vegetation dynamics and responses to climate change and human activities in Central Asia. Sci. Total Environ. 2017, 599–600, 967–980. [Google Scholar] [CrossRef] [PubMed]
  48. Wu, J.; Tan, X.; Chen, X.; Lin, K. Dynamic changes of the dryness/wetness characteristics in the largest river basin of South China and their possible climate driving factors. Atmos. Res. 2020, 232, 104685. [Google Scholar] [CrossRef]
  49. Mohammed, I.N.; Bolten, J.D.; Srinivasan, R.; Lakshmi, V. Satellite observations and modeling to understand the Lower Mekong River Basin streamflow variability. J. Hydrol. 2018, 564, 559–573. [Google Scholar] [CrossRef] [PubMed]
  50. Li, J.; Wang, J.; Zhang, J.; Zhang, J.; Kong, H. Dynamic changes of vegetation coverage in China-Myanmar economic corridor over the past 20 years. Int. J. Appl. Earth Obs. Geoinf. 2021, 102, 102378. [Google Scholar] [CrossRef]
  51. Song, Y.; Jin, L.; Wang, H. Vegetation changes along the Qinghai-Tibet Plateau engineering corridor since 2000 induced by climate change and human activities. Remote Sens. 2018, 10, 95. [Google Scholar] [CrossRef]
  52. Qin, X.; Wang, Y.; Cui, S.; Liu, S.; Liu, S.; Wangari, V.W. Post-assessment of the eco-environmental impact of highway construction– A case study of Changbai Mountain Ring Road. Environ. Impact Assess. Rev. 2023, 98, 106963. [Google Scholar] [CrossRef]
  53. Cao, S.; Ye, H.; Zhan, Y. Cliff roads: An ecological conservation technique for road construction in mountainous regions of China. Landsc. Urban Plan. 2010, 94, 228–233. [Google Scholar] [CrossRef]
  54. Chaudhary, A.; Akhtar, A. A novel approach for environmental impact assessment of road construction projects in India. Environ. Impact Assess. Rev. 2024, 106, 107477. [Google Scholar] [CrossRef]
  55. Qu, S.; Wang, L.; Lin, A.; Zhu, H.; Yuan, M. What drives the vegetation restoration in Yangtze River basin, China: Climate change or anthropogenic factors? Ecol. Indic. 2018, 90, 438–450. [Google Scholar] [CrossRef]
  56. Xu, X.; Liu, H.; Lin, Z.; Jiao, F.; Gong, H. Relationship of Abrupt Vegetation Change to Climate Change and Ecological Engineering with Multi-Timescale Analysis in the Karst Region, Southwest China. Remote Sens. 2019, 11, 1564. [Google Scholar] [CrossRef]
  57. Wang, J.; Ding, J.; Ge, X.; Qin, S.; Zhang, Z. Assessment of ecological quality in Northwest China (2000–2020) using the Google Earth Engine platform: Climate factors and land use/land cover contribute to ecological quality. J. Arid. Land 2022, 14, 1196–1211. [Google Scholar] [CrossRef]
  58. Wu, S.; Gao, X.; Lei, J.; Zhou, N.; Guo, Z.; Shang, B. Ecological environment quality evaluation of the Sahel region in Africa based on remote sensing ecological index. J. Arid. Land 2022, 14, 14–33. [Google Scholar] [CrossRef]
  59. Gao, M.; Piao, S.; Chen, A.; Yang, H.; Liu, Q.; Fu, Y.H.; Janssens, I.A. Divergent changes in the elevational gradient of vegetation activities over the last 30 years. Nat. Commun. 2019, 10, 2970. [Google Scholar] [CrossRef] [PubMed]
  60. Salisbury, A.B.; Miesbauer, J.W.; Koeser, A.K. Long-term tree survival and diversity of highway tree planting projects. Urban For. Urban Green. 2022, 73, 127574. [Google Scholar] [CrossRef]
  61. Long, Y.; Jiang, F.; Deng, M.; Wang, T.; Sun, H. Spatial-temporal changes and driving factors of eco-environmental quality in the Three-North region of China. J. Arid. Land 2023, 15, 231–252. [Google Scholar] [CrossRef]
  62. Zheng, Z.; Wu, Z.; Chen, Y.; Yang, Z.; Marinello, F. Exploration of eco-environment and urbanization changes in coastal zones: A case study in China over the past 20 years. Ecol. Indic. 2020, 119, 106847. [Google Scholar] [CrossRef]
  63. Liu, C.; Yang, M.; Hou, Y.; Zhao, Y.; Xue, X. Spatiotemporal evolution of island ecological quality under different urban densities: A comparative analysis of Xiamen and Kinmen Islands, southeast China. Ecol. Indic. 2021, 124, 107438. [Google Scholar] [CrossRef]
  64. Pratama, A.P.; Yudhistira, M.H.; Koomen, E. Highway expansion and urban sprawl in the Jakarta Metropolitan Area. Land Use Policy 2022, 112, 105856. [Google Scholar] [CrossRef]
  65. Zhang, S.; Li, C.; Ma, Z.; Li, X. Influences of Different Transport Routes and Road Nodes on Industrial Land Conversion: A Case Study of Changchun City of Jilin Province, China. Chin. Geogr. Sci. 2020, 30, 544–556. [Google Scholar] [CrossRef]
  66. Huang, Z.; Chen, Y.; Zheng, Z.; Wu, Z. Spatiotemporal coupling analysis between human footprint and ecosystem service value in the highly urbanized Pearl River Delta urban Agglomeration, China. Ecol. Indic. 2023, 148, 110033. [Google Scholar] [CrossRef]
  67. Zhao, Y.; Qu, Z.; Zhang, Y.; Ao, Y.; Han, L.; Kang, S.; Sun, Y. Effects of human activity intensity on habitat quality based on nighttime light remote sensing: A case study of Northern Shaanxi, China. Sci. Total Environ. 2022, 851, 158037. [Google Scholar] [CrossRef]
Figure 1. Research framework.
Land 13 00504 g001
Figure 2. Overview of the study area.
Land 13 00504 g002
Figure 3. The average RSEI for each buffer zone before and after the highway was constructed.
Land 13 00504 g003
Figure 4. The changing trend of RSEI.
Land 13 00504 g004
Figure 5. The spatial distribution of the RSEI.
Land 13 00504 g005
Figure 6. Dynamic change in RSEI.
Land 13 00504 g006
Figure 7. Interaction detector results.
Land 13 00504 g007
Figure 8. Future trends of the RSEI.
Land 13 00504 g008
Figure 9. Comparison of mean RSEI values before and after highway construction: (a) spatial distribution of mean RSEI values in pre-construction I (2016–2017), construction II (2018–2020), and post-construction III (2021); (b) distribution of RSEI values; (c) comparison of mean RSEI differences in construction and post-construction with pre-construction.
Land 13 00504 g009
Figure 10. Changes in the RSEI level since highway construction.
Land 13 00504 g010
Table 1. Type and source of data.
TypeNameSourceTimeResolution
ClimateTemperature Precipitationhttp://data.cma.cn/ (accessed on 12 January 2023)2018, 2020250 m
VegetationFVChttps://data.tpdc.ac.cn/home (accessed on 15 January 2023)2018, 2020250 m
TerrainDEMhttps://www.gscloud.cn (accessed on 17 January 2023)201030 m
Slope directionAcquired through DEM data
Human activityLand cover typehttp://doi.org/10.5281/zenodo.4417809 (accessed on 18 January 2023)2018, 202030 m
Road networkhttp://www.download.geofabrik.de/ (accessed on 23 January 2023)2018, 2020/
Administrative district station
Nighttime light intensityhttps://www.ngdc.noaa.gov/eog/download.html (accessed on 22 March 2024)2018, 2020500 m
Human footprinthttps://www.x-mol.com/groups/li_xuecao/news/48145 (accessed on 23 March 2024)2018, 20201000 m
Table 2. Index construction.
IndicatorsCalculation MethodsIndicator Description
NDVI N D V I = ρ N I R ρ r e d / ρ N I R + ρ r e d The description of each variable is shown in the articles [31,32].
WET W E T O L I = 0.1511 ρ b l u e + 0.1973 ρ g r e e n + 0.3283 ρ r e d + 0.3407 ρ N I R 0.7117 ρ S W I R 1 0.4559 ρ S W I R 2 The description of each variable is shown in the articles [17,33,34].
NDBSI I B I = 2 ρ S W I R 1 / ρ S W I R 1 + ρ N I R ρ N I R / ρ N I R + ρ r e d + ρ g r e e n / ρ g r e e n + ρ S W I R 1 2 ρ S W I R 1 / ρ S W I R 1 + ρ N I R + ρ N I R / ρ N I R + ρ r e d + ρ g r e e n / ρ g r e e n + ρ S W I R 1
S I = ρ S W I R 1 + ρ r e d ρ N I R + ρ b l u e ρ S W I R 1 + ρ r e d + ρ N I R + ρ b l u e
N D S B I = ρ I B I + ρ S I 2
The description of each variable is shown in the articles [35,36,37].
LST L i = g a i n · D N + b i a s
T = K 2 / l n K 1 / L i + 1
L S T = T / 1 + λ T / ρ l n ( ε )
The description of each variable is shown in the articles [38,39].
Table 3. Changes in the RSEI in different levels.
RSEI201620182021
Area/km2Percent/%Area/km2Percent/%Area/km2Percent/%
Poor (0–0.2)80.6112.39157.5524.22102.6415.78
Fair (0.2–0.4)177.7027.32302.5546.51191.1729.39
Moderate (0.4–0.6)205.4531.58118.0818.15175.3526.96
Good (0.6–0.8)130.5320.0745.647.02128.3219.73
Excellent (0.8–1)56.228.6426.684.1053.048.15
Table 4. Factor detector results of RSEI.
Year TemperaturePrecipitationFVCDEMSlope DirectionLand Cover TypeDistance from RoadDistance from Administrative DistrictNighttime Light IntensityHuman Footprint
q0.03270.48470.23580.50060.04340.09940.01380.28390.02590.0517
2018p0.00000.00000.00000.00000.00000.00000.00000.00000.00000.0000
q rank82417510396
q0.14020.67910.48420.69250.06230.06720.02620.52420.09550.0799
2020p0.00000.00000.00000.00000.00000.00000.00000.00000.00000.0000
q rank52419810367
Disclaimer/Publisher’s Note: The statements, opinions and data contained in all publications are solely those of the individual author(s) and contributor(s) and not of MDPI and/or the editor(s). MDPI and/or the editor(s) disclaim responsibility for any injury to people or property resulting from any ideas, methods, instructions or products referred to in the content.

