Article

Spatial-Temporal Assessment of Urban Resilience to Disasters: A Case Study in Chengdu, China

1
School of Design, Southwest Jiaotong University, Chengdu 611756, China
2
Center for Sustainable Development Studies, Toyo University, Tokyo 112-8606, Japan
3
Department of Urban Engineering, Graduate School of Engineering, The University of Tokyo, Tokyo 113-8656, Japan
*
Author to whom correspondence should be addressed.
Land 2024, 13(4), 506; https://doi.org/10.3390/land13040506
Submission received: 21 February 2024 / Revised: 8 April 2024 / Accepted: 11 April 2024 / Published: 12 April 2024
(This article belongs to the Special Issue Urban Resilience and Urban Sustainability under Climate Change)

Abstract

:
Urban areas with an imbalanced vulnerability to disasters have garnered attention. Building an urban resilience index helps to develop a progressively favored instrument for tracking progress toward disaster-resilient cities. However, there remains a lack of empirical studies on measuring urban resilience, with limited focus on the spatial-temporal characteristics of urban resilience to disasters, particularly relevant in developing nations like China. Thus, a refined urban resilience index to disasters based on the subcomponents of infrastructure, environment, socio-economy, and institution is suggested in this study. This index-based assessment framework is applied and validated to measure the spatial-temporal resilience using a real-world case study in Chengdu, China. The main findings of this study indicate that: (1) the overall urban resilience of Chengdu has been growing toward better conditions, with infrastructural resilience accounting for the majority of this growth. (2) The distribution of urban resilience exhibits a regional disparity and a spatially polarized pattern. (3) The agglomeration characteristics of urban resilience are significant. (4) There is a clear regional mismatch in the distribution of urban resilience to disaster risk. The validated model offers a comprehensive and replicable approach for urban resilience assessment and planning, especially for disaster-frequent regions.

1. Introduction

The world is urbanizing. More than two-thirds of the world’s population is anticipated to reside in urban areas by 2050, up from about 57 percent of the total population in 2021 (UN, 2022 [1]). Empirical data have demonstrated that rapidly increasing urbanization and population growth drive, to a large extent, the impact of disasters, hence amplifying the worldwide risk (UNISDR, 2017 [2]). Asia experienced the most frequent occurrence of disasters in 2020, and developing countries were more severely affected by these disasters compared to industrialized countries (UNDRR, 2020 [3]). Especially China, the largest developing nation, experienced a rapid rise in urbanization following the initiation of the reform and the adoption of an opening policy in the 1980s. China’s urbanization rate as of 2022 was 64.7%, and by 2035, it was anticipated to rise to 75–80% (State Council, 2022 [4]). However, urban settlements are a relatively new phenomenon in human history. With more and more people residing in urban areas, our society grows more complex, and the environments become less certain, making it progressively challenging to ensure the sustainability of our social, economic, and ecological systems. It is, hence, crucial to assess the resilience of urban areas and systems while addressing disasters in this particular scenario. Urban resilience, which refers to the capacity of a city’s systems to withstand, absorb, and adapt to the impacts of various shocks and pressures by effectively utilizing available resources, has received significant attention across a variety of fields and disciplines due to its potent analytical capabilities (Cutter et al., 2008 [5]; Ahern, 2011 [6]). Urban resilience, as a theoretical tool, has gained popularity in urban planning and governance as cities face uncertainties and challenges such as disasters and climate change (Leichenko, 2011 [7]; Mehmood, 2016 [8]; Béné et al., 2018 [9]).
Research from various academic fields has enhanced our understanding of disaster, vulnerability, and risk management in urban areas, contributing to the advancement of urban resilience in recent years (Gencer, 2013 [10]). Resilient planning focuses on the ability of individuals, communities, and cities to effectively deal with various challenges and uncertainties and takes advantage of possibilities for transformational and sustainable development. A literature review of the studies on urban resilience showed that concepts such as definition (Meerow et al., 2016 [11]; Meerow & Newell, 2019 [12]), theoretical framework (Ribeiro & Gonçalves, 2019 [13]), and assessment (Sharifi & Yamagata, 2016 [14]; Dianat et al., 2022 [15]), as well as diverse disasters, such as floods (Song et al., 2019 [16]; Bertilsson et al., 2019 [17]; Yu et al., 2023 [18]), hurricanes (Campanella, 2006 [19]; Burton, 2015 [20]), tsunamis (Tumini et al., 2017 [21]), earthquakes (Ainuddin, & Routray, 2012 [22]; Allan, 2013 [23]), climate change (Boyd & Juhola, 2015 [24]; Zheng et al., 2018 [25]; Lu et, al., 2022 [26]), extreme weather (Choryński et al., 2023 [27]) and post-disaster reconstruction (Guo, 2012 [28]; Xu & Shao, 2020 [29]) have been investigated worldwide. The spatial scale of these resilience-related studies varied from global (Leitner et al., 2018 [30]; Langemeyer et al., 2021 [31]), and regional (Christopherson et al., 2010 [32]; Peng et al., 2017 [33]; Huang, 2022 [34]) to national (DeWit et al., 2020 [35]; Elkhidir et al., 2023 [36]), and urban (Cariolet et al., 2019 [37]; Sharifi, 2019 [38]), rural (Scott, 2013 [39]; Huang et al., 2018 [40]; Baldwin et al., 2023 [41]), as well as community (Berkes & Ross, 2013 [42]; Fang et al., 2018 [43]; Rapaport et al., 2018 [44]), and building (Roostaie et al., 2019 [45]).
To conclude, numerous pieces of literature works outline methodological approaches to index construction; yet, there is still no agreed-on standard for the measurement of urban resilience (Cutter et al., 2008 [5]; Sherrieb et al., 2010 [46]; N. Lam et al., 2016 [47]; Du et al., 2020 [48]; Shi, et al., 2021 [49]; Mehryar & Surminski, 2022 [50]). Therefore, there is a need to develop a method to measure the resilience of different urban systems and how these should be designed, implemented, and monitored. However, the existing resilience assessment indicators mainly focus on a single part of the urban system such as energy (Sharifi & Yamagata, 2016 [14]), water supply (Milman, 2008 [51]), economic sector (Mai et al., 2021 [52]), or ecosystem (Colding, 2007 [53]; Zhao et al., 2021 [54]) and lack an understanding of the integrated and comprehensive urban system resilience. Moreover, there is little empirical research to explore which set of indicators plays an important role in determining the level of urban resilience to disasters in the local context, especially in developing countries like China.
China is one of the countries that have been frequently stricken by diverse disasters with severe consequences (Yang et al., 2015 [55]; Shi et al., 2016 [56]). As one of the most densely populated and economically developing areas in China, the Sichuan Basin is frequently affected by a variety of disasters (Shi et al., 2016 [56]). The losses caused by various disasters in Chengdu City showed an increasing trend by the municipal government. Currently, some works of literature on urban resilience are illustrated in Chengdu from the perspective of agro-ecosystems (Abramson, 2020 [57]), system dynamics (Mou et al., 2021 [58]), urban agglomeration (Lu et al., 2022 [59]) and rural community (Yang, 2020 [60]). However, few studies have been conducted to construct an index system and reveal the variation in urban resilience there. Thus, taking the disaster-prone city of China as an example, we conducted a study to empirically evaluate the spatial-temporal variations of urban resilience in Chengdu City.

2. Methodology

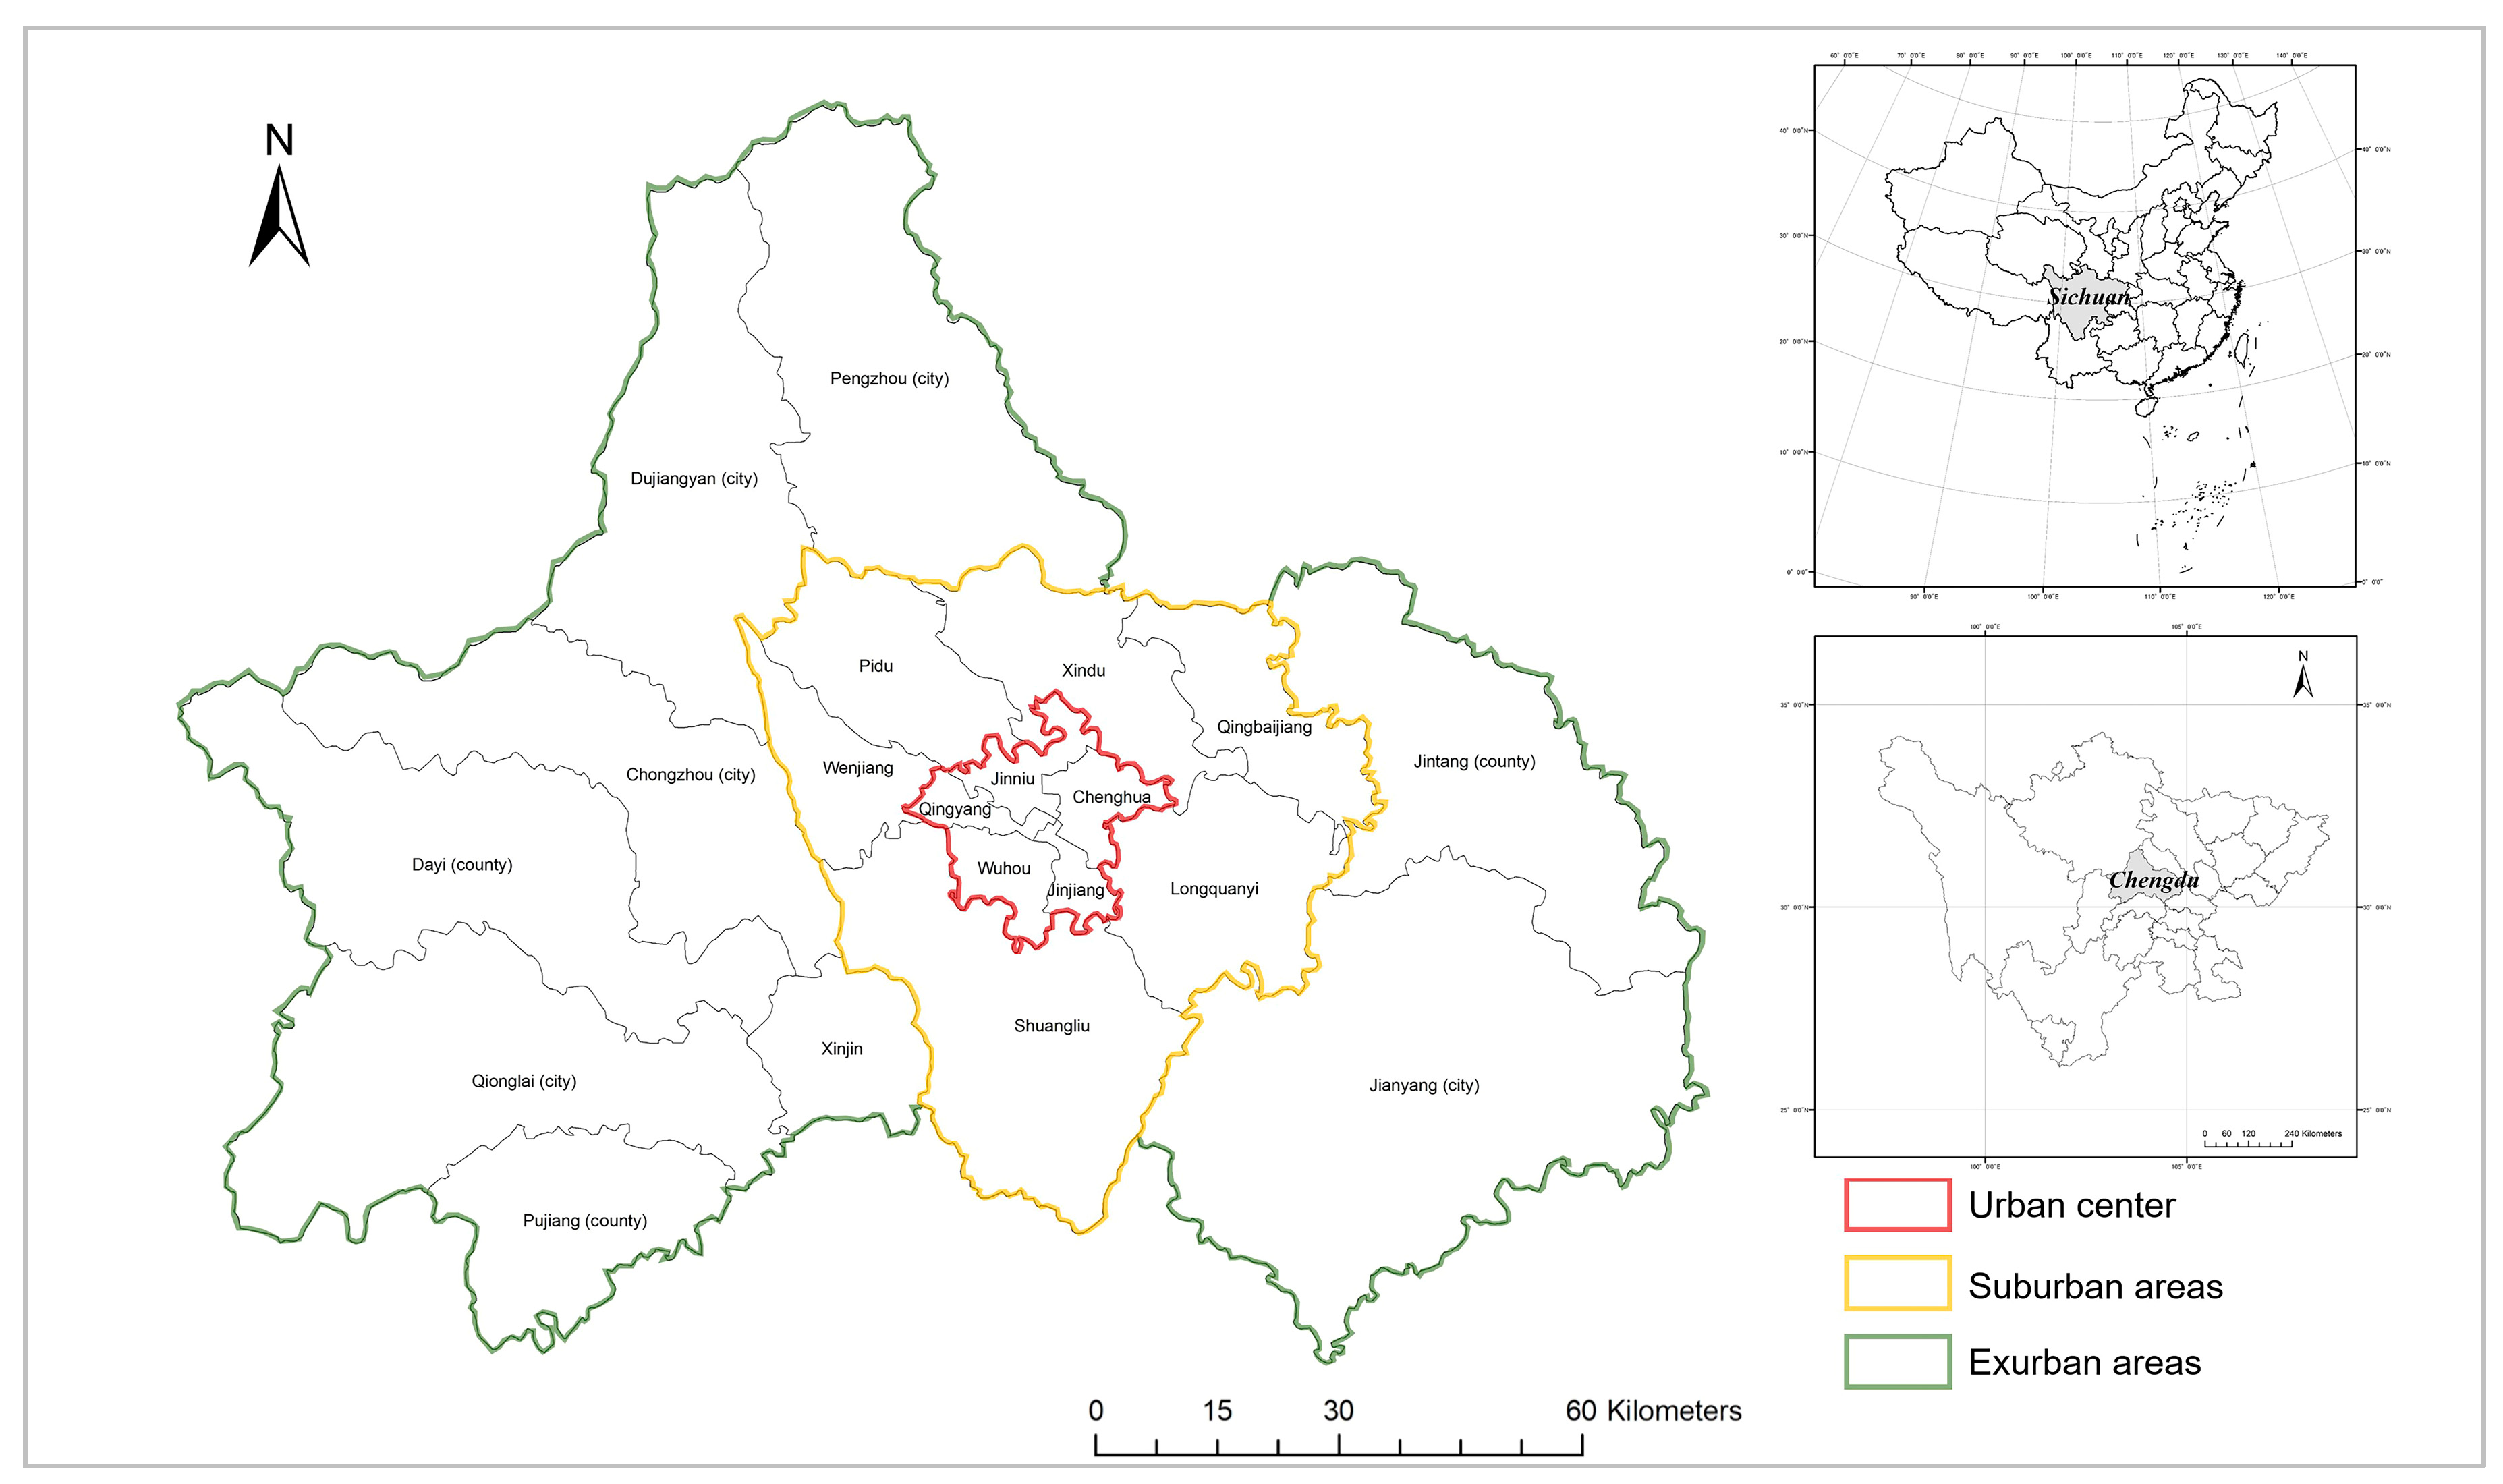
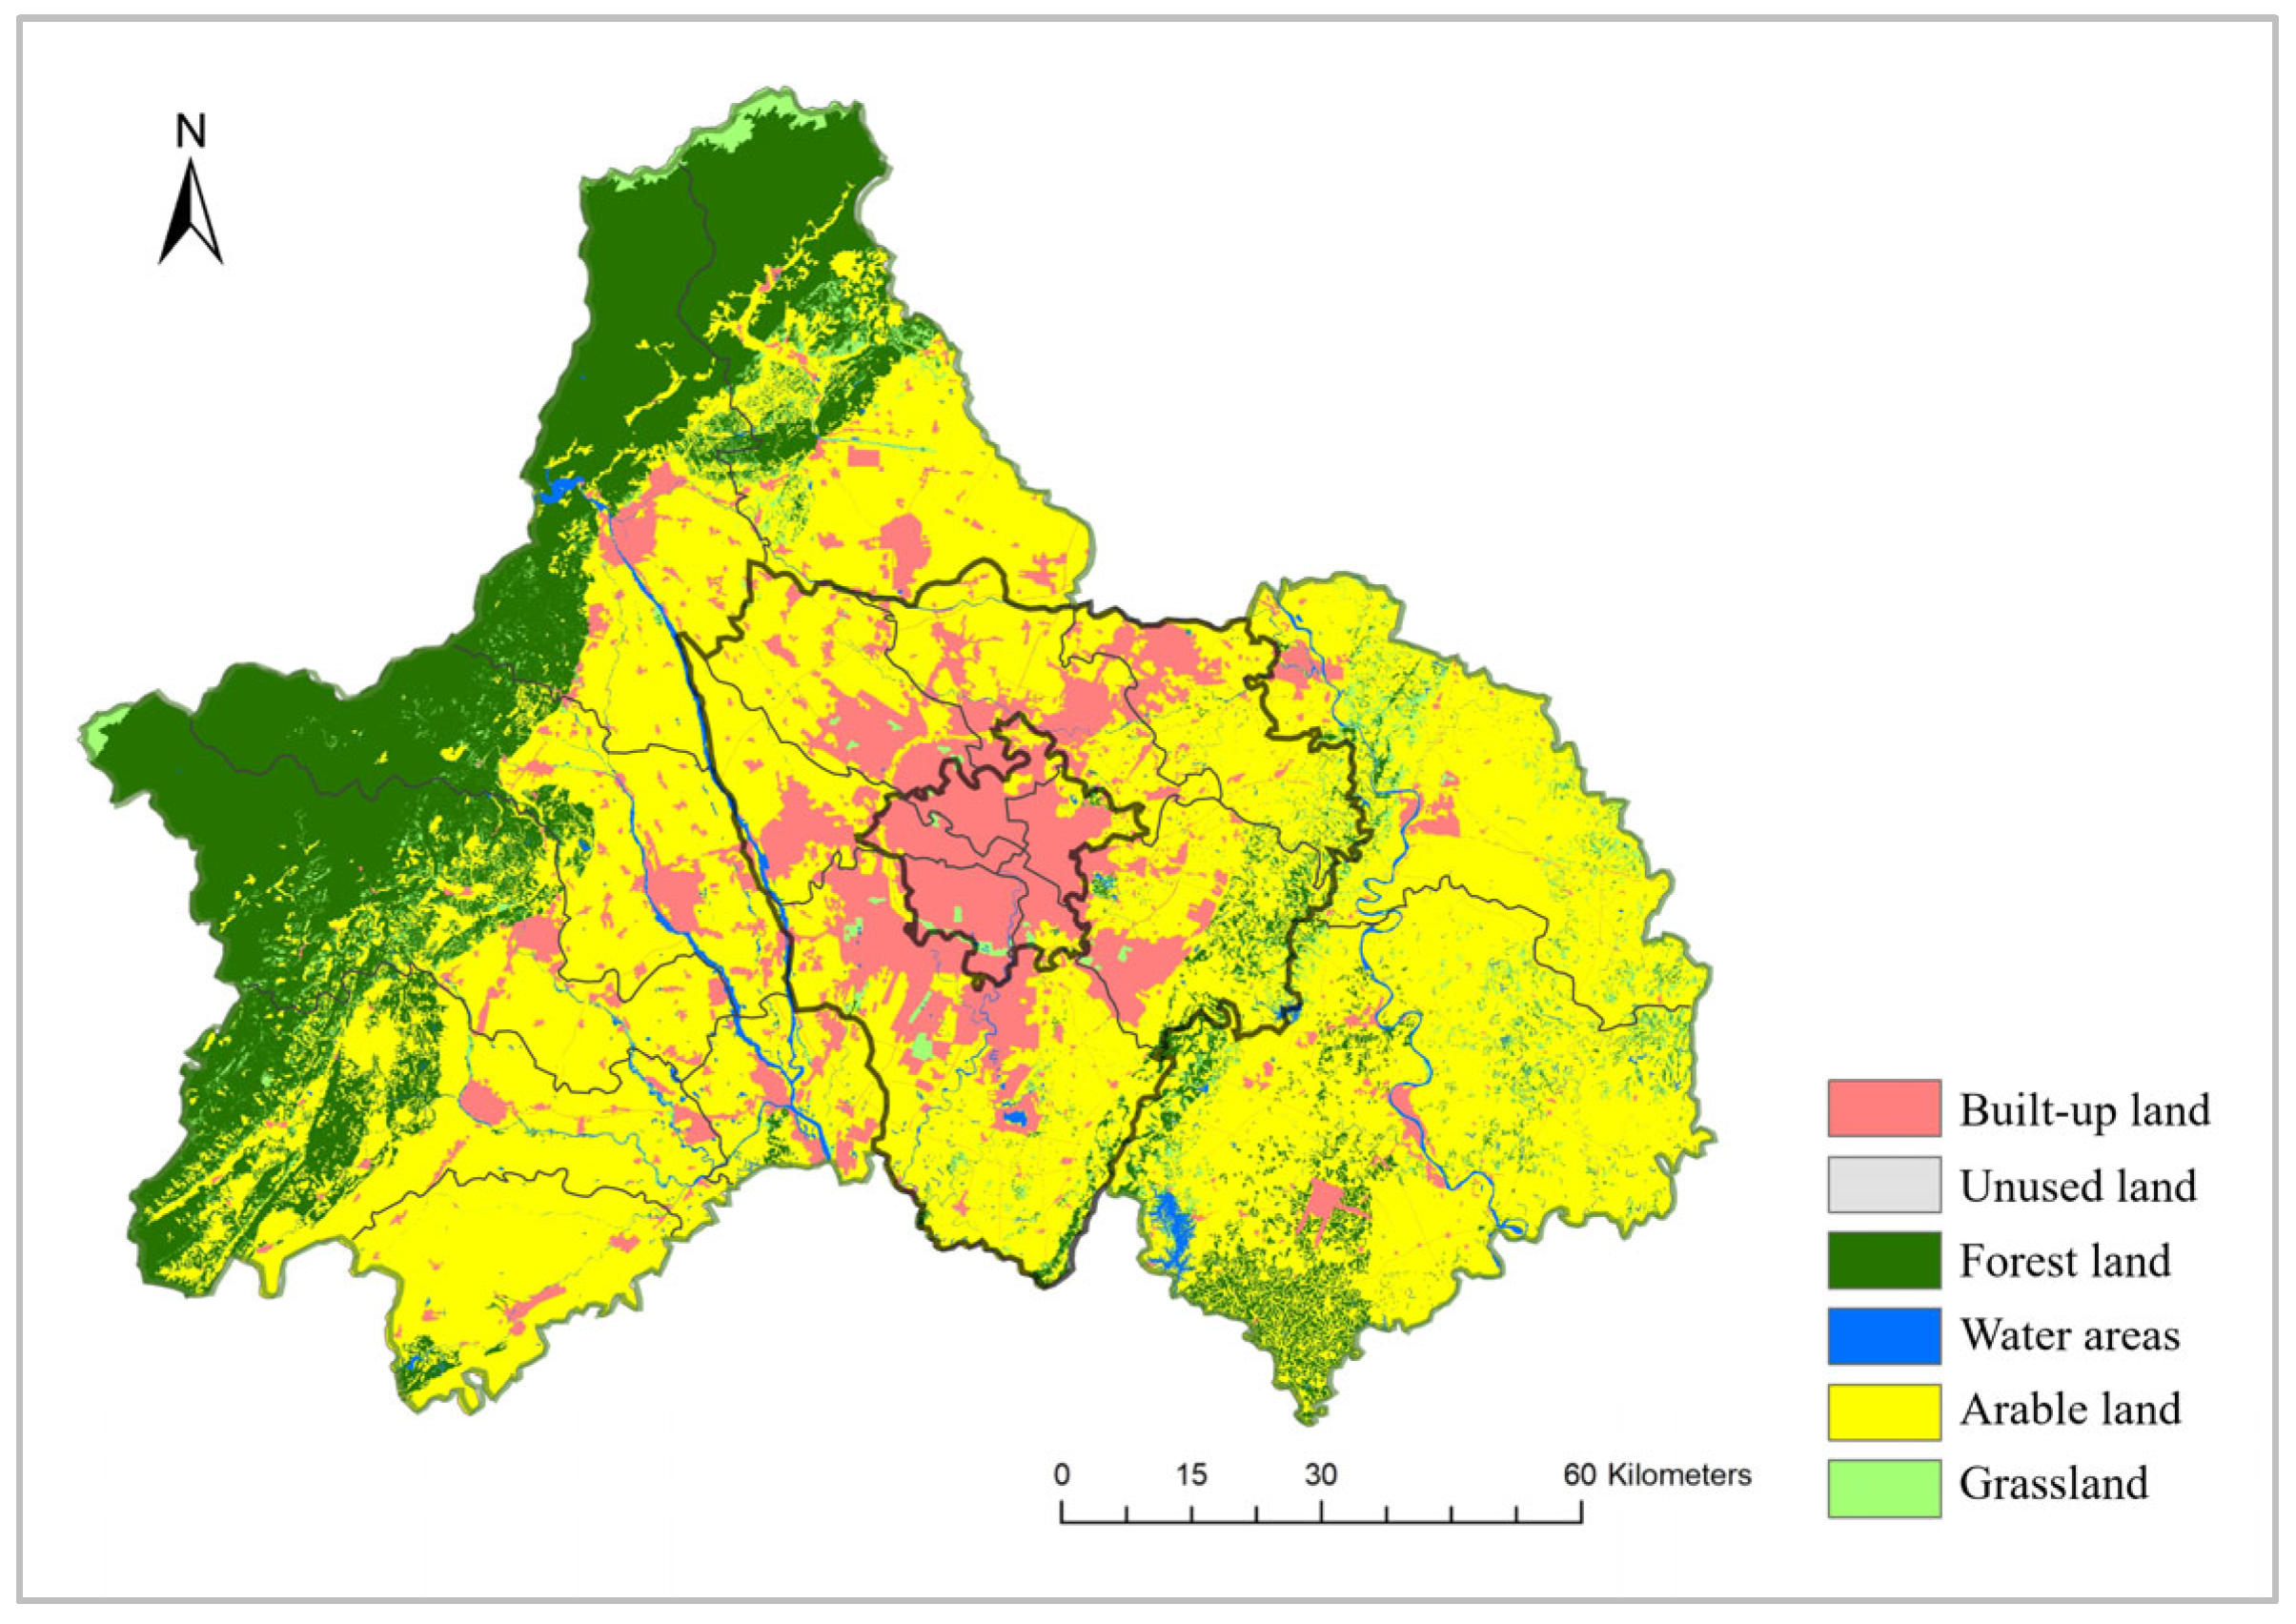
2.1. Study Area and Data Sources

The Sichuan Basin, one of China’s most populous and economically advanced regions, is regularly hit by a range of disasters, the most common of which are earthquakes, geological hazards, and floods. Recently, for instance, there was a great deal of damage and casualties caused by the significant earthquakes that happened in 2008, 2013, 2017, and 2022, as well as the floodings that occurred in 2011, 2013, 2018, and 2020. Hence, as the most densely populated area, the development of Chengdu is facing the threat of numerous disasters and risks.
Chengdu (30°05′–31°26′ N, 102°54′–104°53′ E) is a mega-city that serves as the capital of the Chinese of Sichuan province (Figure 1). To date, it is one of the most populous cities in Western China with a 21.19 million population on 14,335 Km2 of land. Meanwhile, Chengdu is a very large regional city, which has direct jurisdiction over 20 county-level administrative units. Thus, this study attempts to divide the study area into three areas, namely, urban center, suburban areas, and exurban areas, which are determined by the situation of land use (Figure 2), population, and urbanization in different areas.
The socio-economic data used for measuring urban resilience in this study were primarily obtained from The Statistical Yearbook of Chengdu Municipality (2001–2021), as well as from the Statistical Yearbook of 20 county-level administrative units, respectively. The spatial data come from the Resource and Environmental Science and Data Center of the Chinese Academy of Sciences. Finally, land data have been accessed from the Chengdu Municipal Bureau of Planning and Natural Resources.

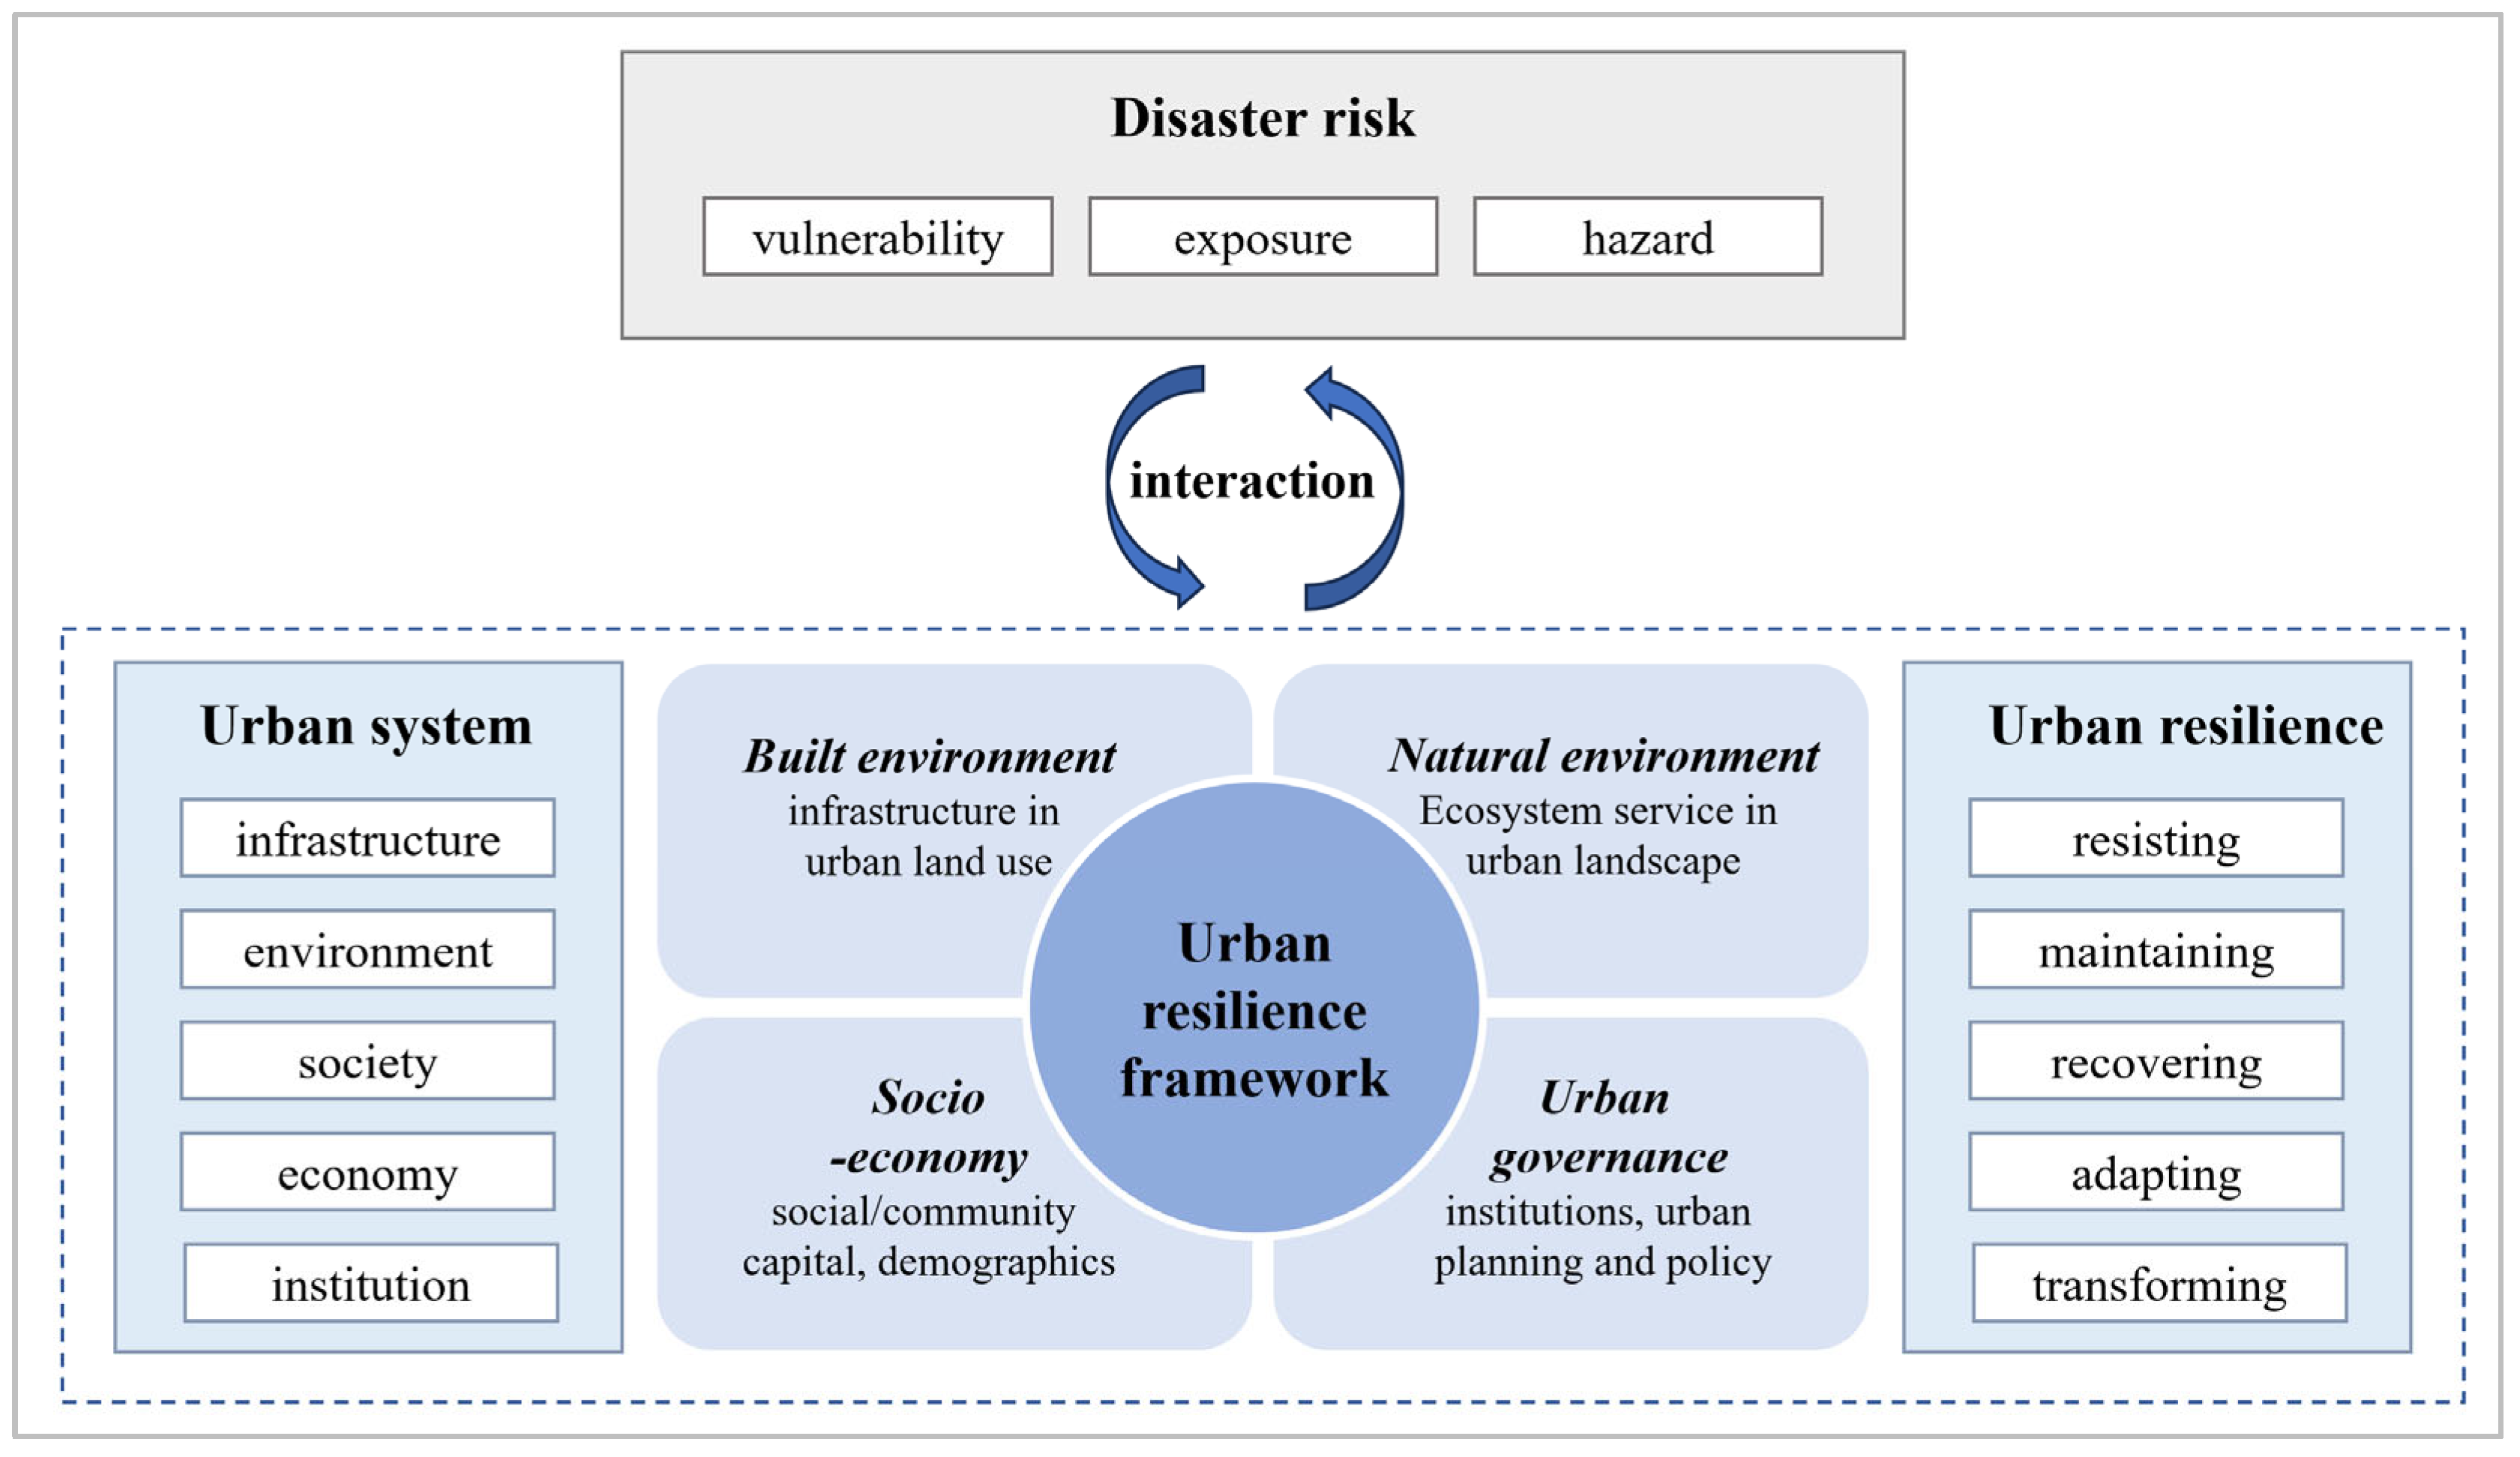
2.2. Urban Resilience Assessment Framework

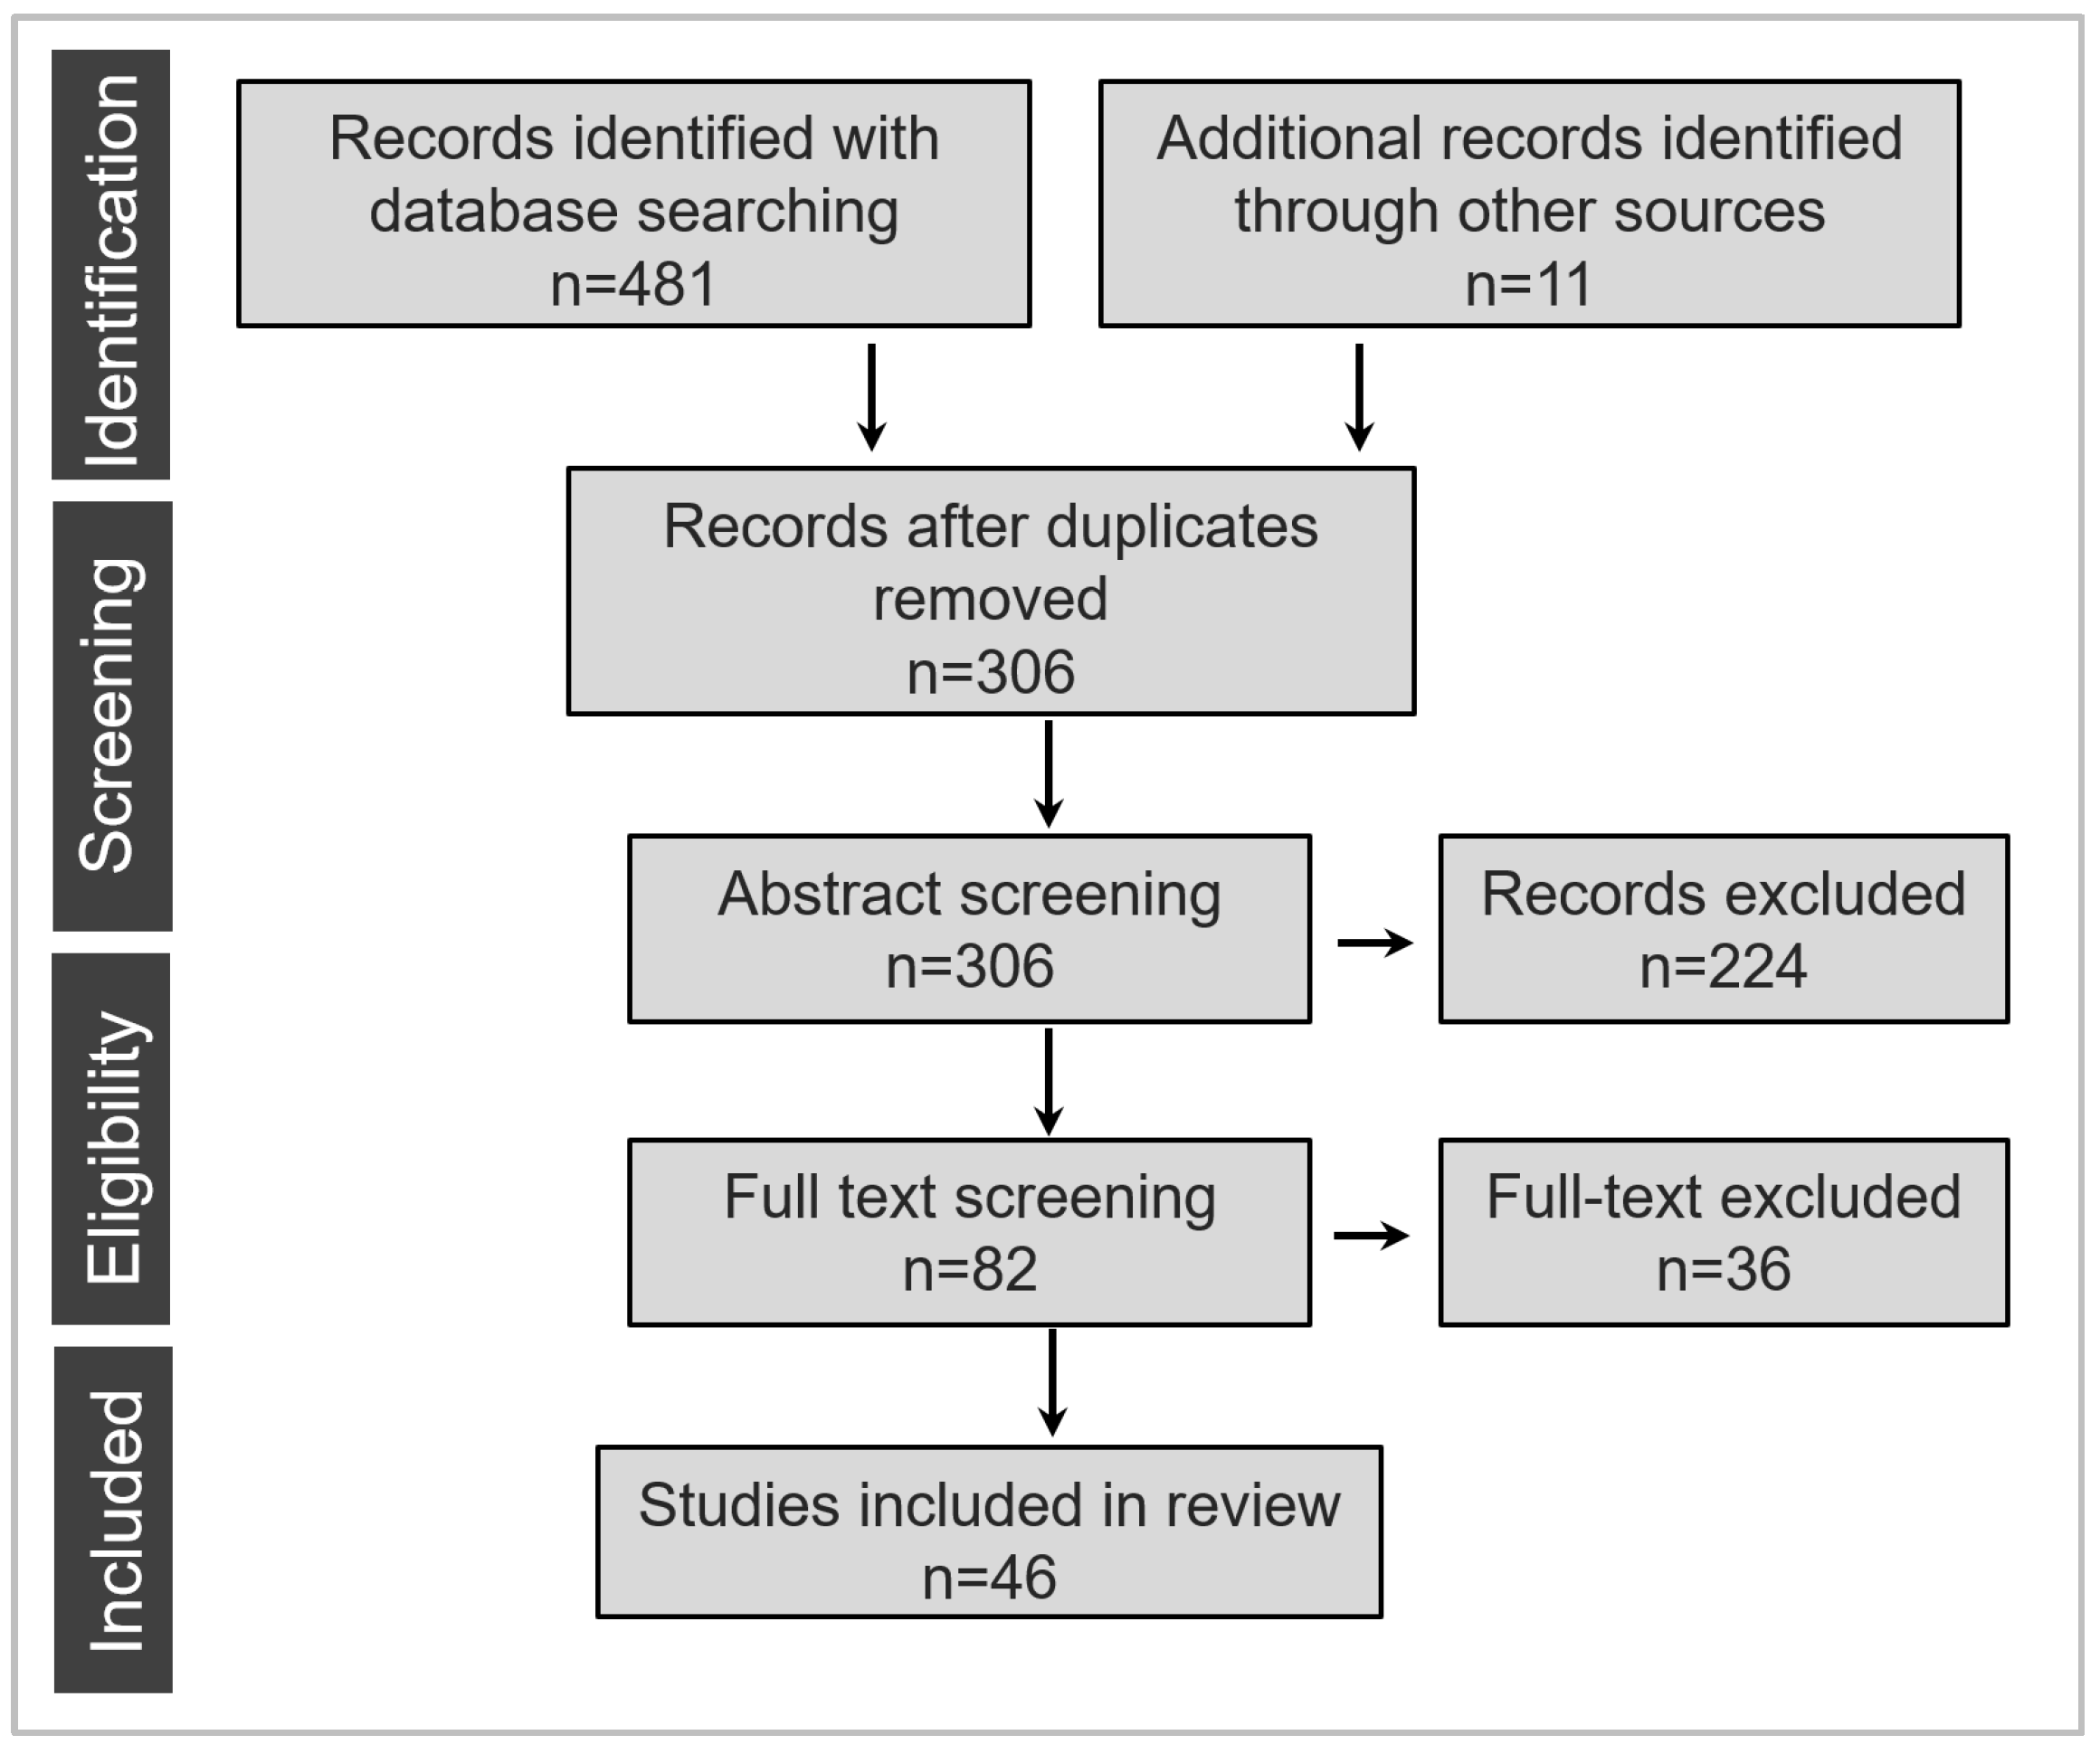
2.2.1. The Process of Measurement Selection

This section provides a systematic literature analysis of assessment methodologies for urban resilience to disasters, aiming to design the framework of urban resilience assessment. First, the search terms were: “urban resilien*” AND (“assess*” or “measur*” or “evaluat*” or “index*”). Second, the exclusion criteria were developed, as follows: (1) urban resilience was not the primary emphasis; (2) disaster issues were not tackled; (3) an assessment index was not formulated; (4) a case study was not incorporated. In total, 46 records were generated from the search and included in the analysis. The PRISMA flow diagram of the search and review is presented in Figure 3. The second phase of assessment establishment involves identifying and creating appropriate metrics based on existing literature. A list of approximately 80 measurements that were suitable for the study was collected first. Then, the Delphi method and expert consultation were applied here for indicator reduction, which is a qualitative approach to indicator screening. After indicator screening and reselection, the justification for the remaining 30 measurements and their respective subcomponents and their effects on urban resilience are discussed in this study.

2.2.2. Acquisition of Measurement Weight

In this study, the weight of each measurement in the indicator system is determined by the method of combining the analytic hierarchy process and the entropy weight method (AHP-EWM) (Song et al., 2021 [61]; Yu et al., 2024 [62]). AHP is based on subjective information, and EWM is based on the degree of information disorder in the assessment system. AHP is sensitive to the perceptions of interviewees, and EWM is susceptible to extreme values. To minimize the potential bias caused by AHP, EWM was employed for objective weighting.
The AHP method facilitates the determination of the relative importance of various indicators through expert scoring and involves the following steps (Saaty, 1977 [63]): firstly, the judgment matrix is constructed by 30 experts who are tasked to compare all evaluation indicators in pairs using the relative importance scale by conducting a structured questionnaire survey (Table 1). Among them, 10 are professional planning teachers, 10 are urban planners and 10 are government staff from a City Planning and Emergency Management Agency. Secondly, the subjective weight ( w a ) is calculated by multiplying the maximum eigenvalue ( λ m a x ) by the eigenvector ( W ) of the judgment matrix, as shown in Equation (2). Finally, it is ensured that the consistency ratio ( C R ) is less than 0.1, indicating reasonable calculation results. The C R is obtained by dividing the consistency index ( C I ) by the randomness index ( R I ), as shown in Equation (3). The C I is calculated by Equation (4), while the values of R I correspond to the matrix order in Table 2.
A = a 11 a 12 a 1 n a 21 a 22 a 2 n a n 1 a n 2 a n n , a i j = 1
w a j = λ m a x × W
C R = C I R I
C I = λ m a x n n 1
where a i j ( i , j   = 1, 2…, n ) represents the importance score of the i th measurement compared to the j th measurement. w a j denotes the subjective weight assigned to the j th measurement. λ m a x and W are the maximum eigenvalues and eigenvectors, respectively, derived from the judgment matrix A . C R , C I and R I represent the consistency ratio, consistency index and randomness index of all expert scores, respectively.
When using EWM to calculate the weight of factors, there are the following steps (Zhu et al., 2020 [64]): the first step is the standardization of measured values. Then, the standardized value is denoted as p i j , which is estimated by Equation (5). And the entropy value of the j th indicator e j is calculated by Equation (6). The range of entropy value e j is [0, 1]. The larger the e j is, the greater the differentiation degree of index j is, and more information can be derived. Hence, a higher weight should be given to the index. Therefore, in the EWM, the objective weight ( w b j ) of the j th measurement can be calculated by Equation (7).
p i j = x i j j = 1 n x i j
e j = 1 ln n i = 1 n p i j ln ( p i j )
w b j = 1 e j i = 1 n ( 1 e j )
where p i j ( i , j = 1, 2…, n ) indicates the percentage of the score of the i th alternative in the j th measurement, and e j represents the entropy of the j th h measurement. Thus, w b j is the objective weight assigned to the j th measurement.
Crucially, as shown by Equation (8), the multiplicative normalization method, which is suggested by Fan et al. (2023) [65], is applied in this study to balance w a j and w b j .
w i j = w a j × w b j j = 1 n ( w a j × w b j )
where w i j , w a j and w b j represent the integrated weight, subjective weight, and objective weight of the j th measurement, respectively.

2.2.3. Dimension and Indicator System of Urban Resilience

To date, there is a consensus within urban studies that urban resilience is a multifaceted concept that includes different subsystems such as social, economic, institutional, infrastructural, and environmental or ecological components (Bruneau et al., 2003 [66]; Cutter et al., 2008 [5]; Norris et al., 2008 [67]; Burton, 2015 [20]; Kwok et al., 2016 [68]; Ainuddin & Routray, 2012 [22]; Cutter et al. 2010 [69]; Moghadas et al., 2019 [70]). Based on these findings, this paper proposes a theoretical framework and index of urban resilience, which aims to categorize the research into one of the these five afore-mentioned subsystems (Figure 4).
Table 3 presents a refined indicator system that this research considers well-balanced from a statistical viewpoint and that may be appropriate for measuring urban resilience to disasters. Undoubtedly, infrastructural resilience is the fundamental dimension of urban resilience (Qin et al., 2017 [71]). Infrastructure resilience is related to the physical aspects of the city system, including the vital facilities that support our society and city’s ability to respond to and recover from disasters. Thus, it is crucial to strike a balance between environmental concerns and development objectives in order to promote the creation of secure and habitable communities, which is essential for achieving urban resilience2 (Cutter et al., 2008 [5]). Environmental resilience indicators conceptually relate to natural resources and ecosystems that enhance the absorptive capacity and are vital for fostering urban resilience to disasters. Furthermore, socio-economic resilience indicators proposed here are intended to capture the differential social capacities and economic resources of cities that affect their propensity to respond to external stressors such as the impact and threat of disasters. Lastly, institutional resilience primarily assesses the operations of local governments, such as the presence of disaster management plans and policies, as well as their capacity to effectively communicate and collaborate with other stakeholders before, during, and after disasters, which is also crucial for the functioning of the overall city system.
It is important to note that both AHP and EWM calculations were based on a hierarchy consisting of dimensions and measurements, and the indicator layer was used to represent the measurements for later analysis and discussion.

2.2.4. Processing of Data

After collecting the raw indicators, the data items then underwent a process of transformation, normalization, and theoretical orientation. The study employed min–max scaling, a widely used normalization technique in social indicators research (Tarabusi and Guarini, 2012 [97]). Equations (9) and (10), therefore, were used to maximize and minimize the raw data separately.
x i j = X i j m i n X j m a x X j m i n X j
x i j = m a x X j X i j m a x X j m i n X j
where i refers to the ith sample (i = 1, 2, …, n), j refers to the jth measurement (j = 1, 2, …, m), m a x is the maximum value of a given measurement, and m i n is the minimum value of the given measurement.
The URI advanced in this research is the weighted sum of the four components and each component is the weighted sum of several individual measurements. Equations (11) and (12) for calculating the URI is as follows:
U R I = i = 1 4 w i D i
D i = j = 1 n i w i j M i j
where U R I is the Urban Resilience Index; D i is the resilience dimension index; M i j is the standardized value of each individual measurement; w i is the weight of each dimension, and w i j is the weight of each individual measurement.

3. Results and Analysis

3.1. Temporal Variations of Urban Resilience at City Scale

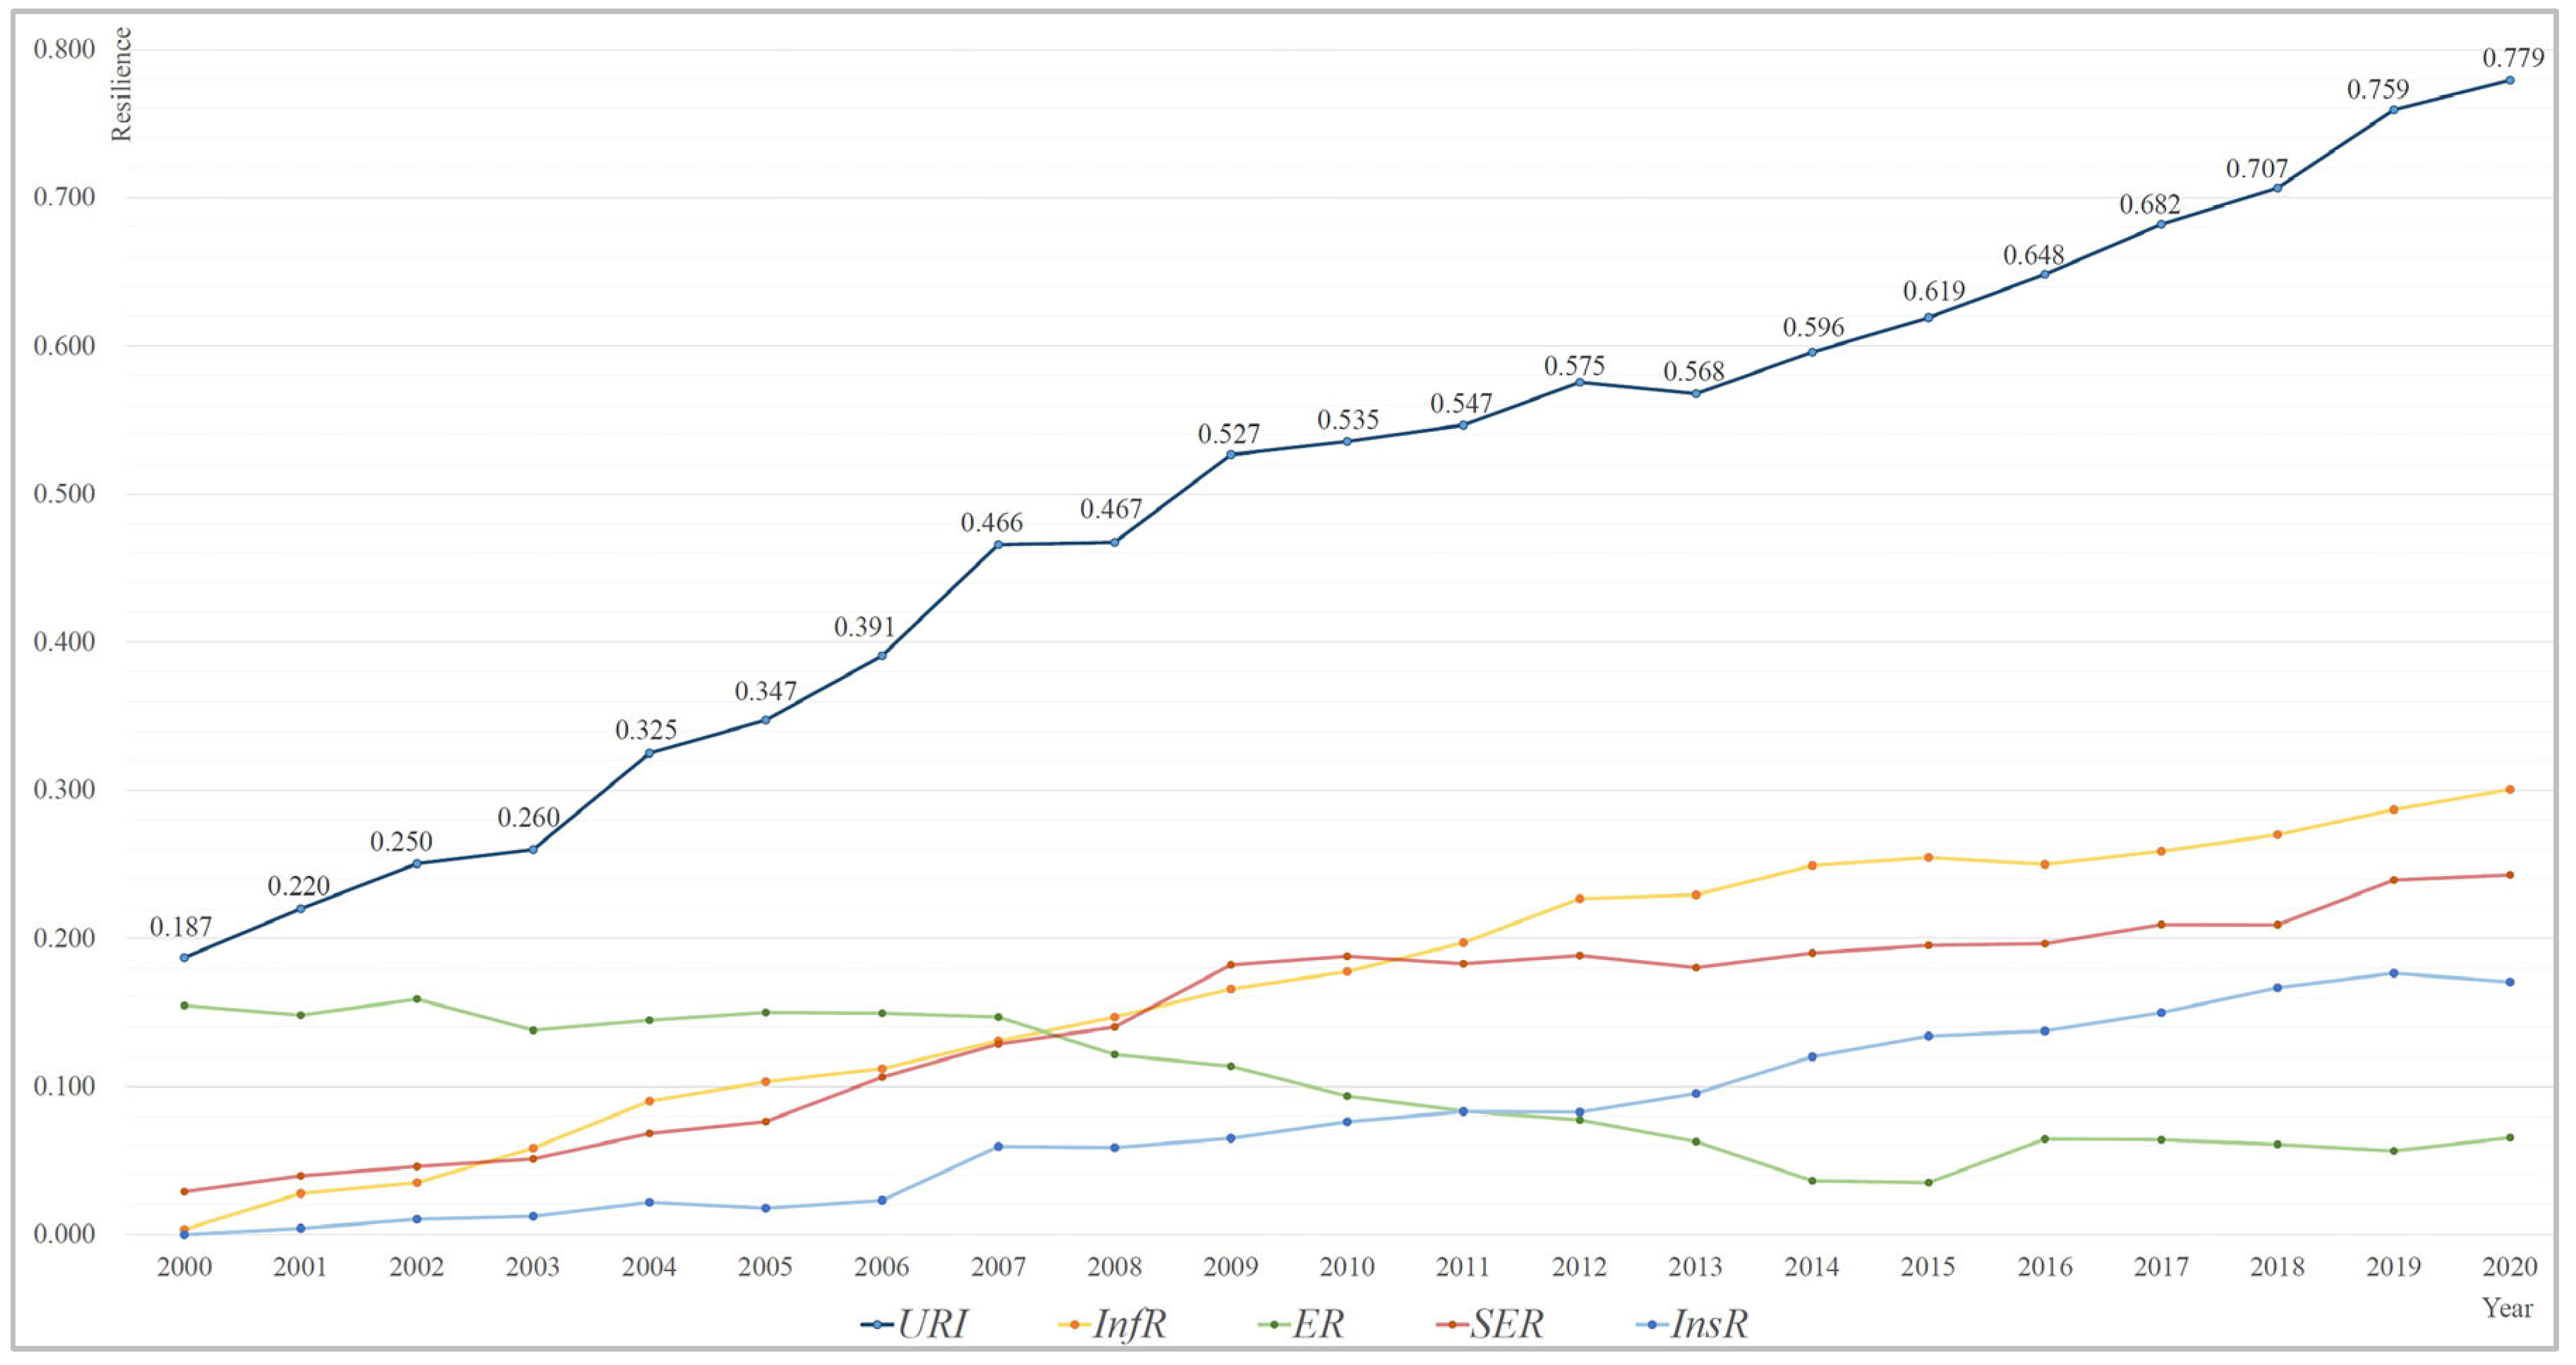
3.1.1. Time-Series Analysis

The temporal resilience is visualized from 2000 to 2020 in Figure 5. The results show that since 2000, Chengdu’s overall urban resilience index (URI) to disasters has increased continuously, although there was also a decline and slow growth period. We could see the infrastructure resilience (InfR) grow steadily at a comparable rate. Socio-economic resilience (SER) and institutional resilience (InsR) have also increased since 2000 but experienced some fluctuation. In comparison, environmental resilience (ER), measured by natural resources and ecological system-related indicators, has been stable from 2000 to 2007, then dropped rapidly after 2008, and rebounded a bit after 2016.

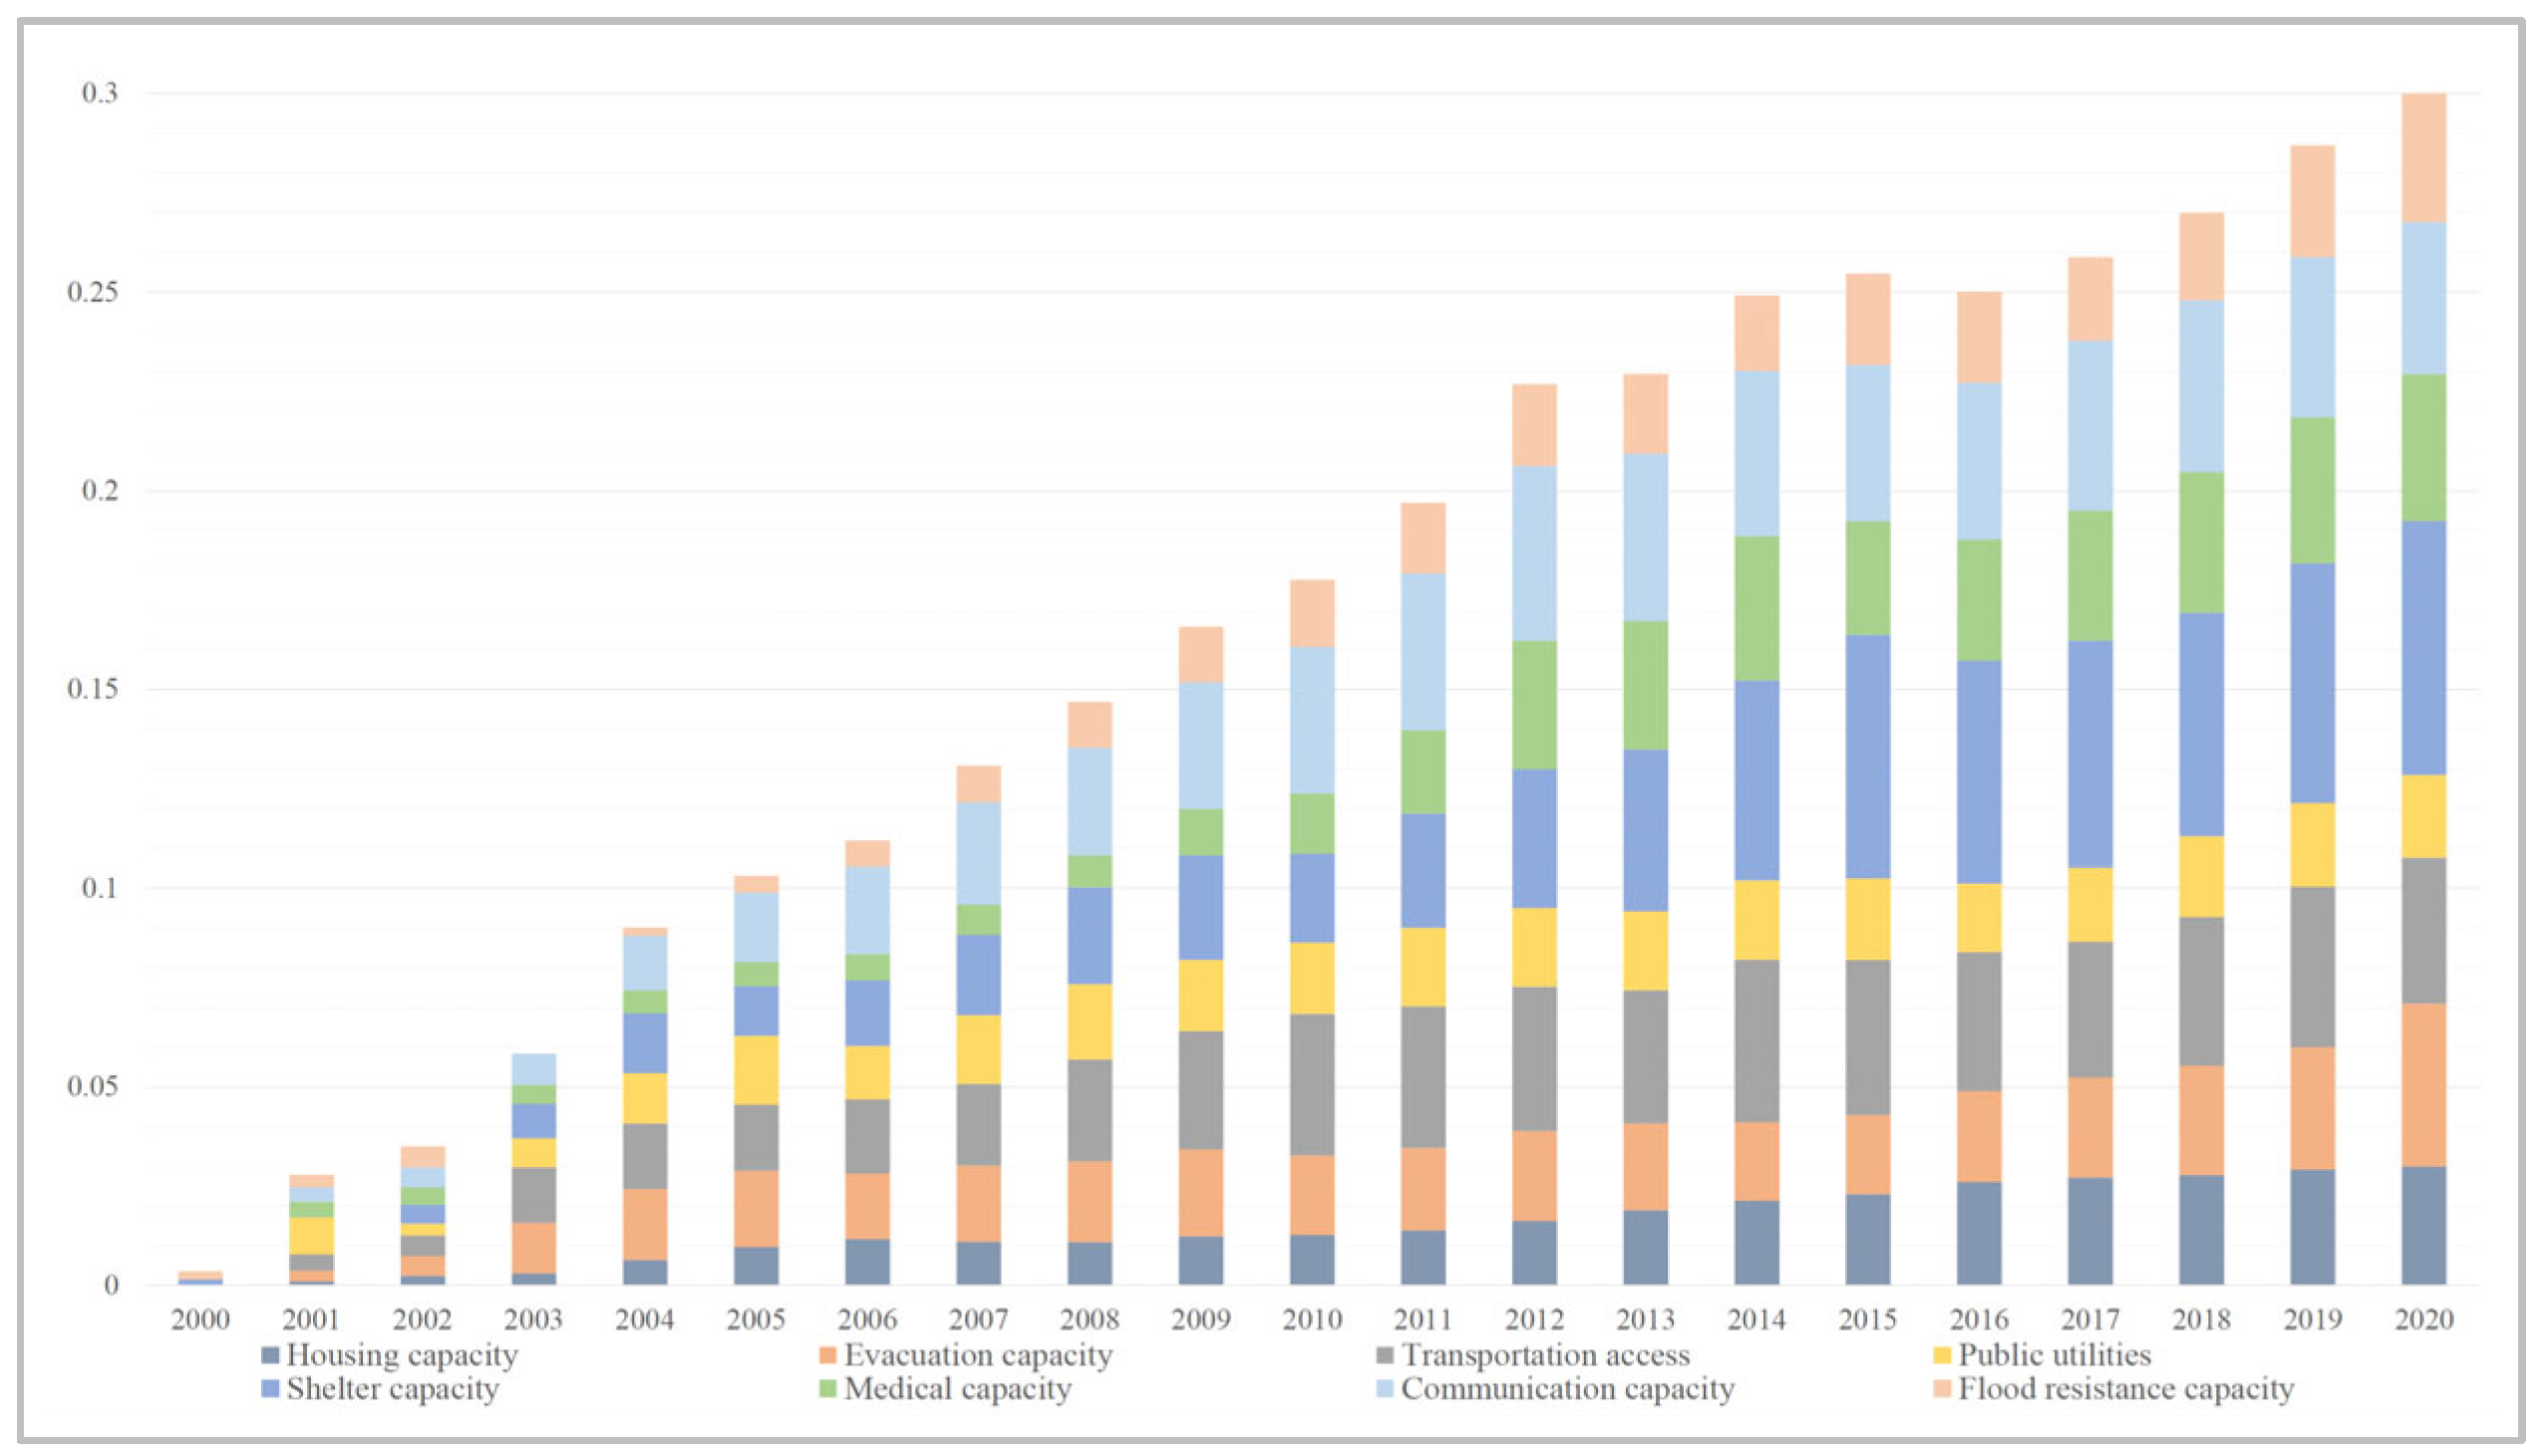
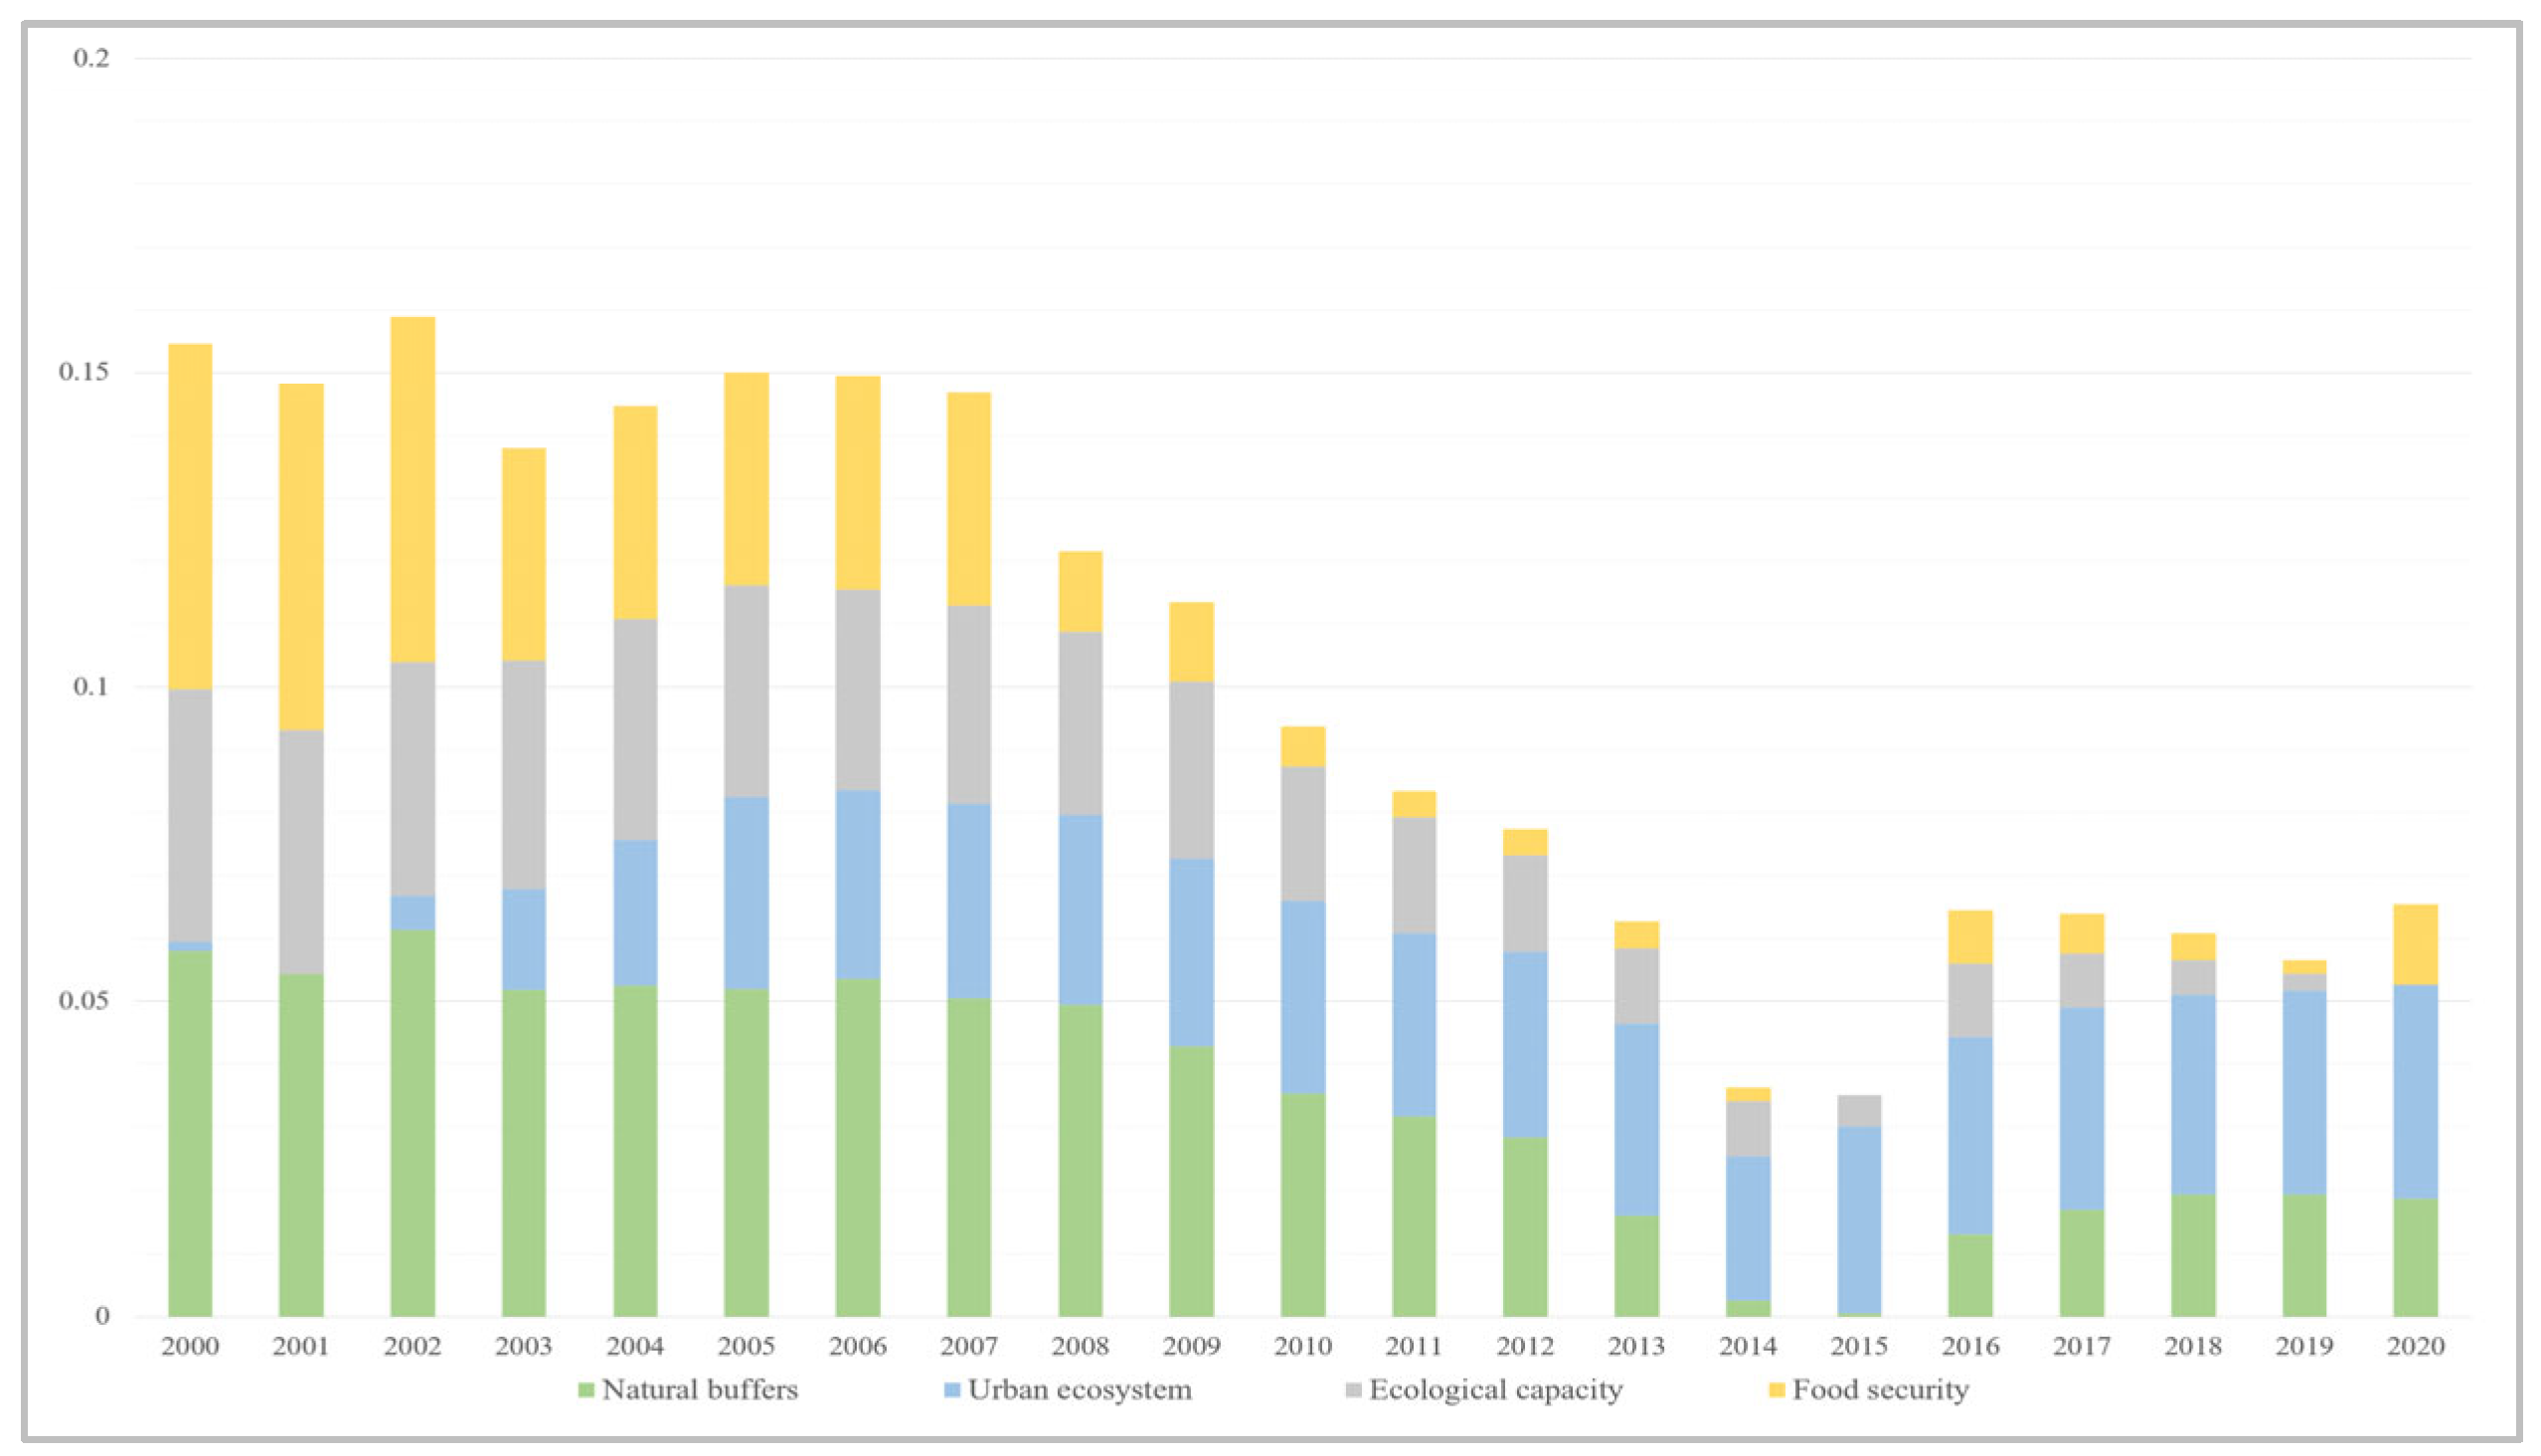
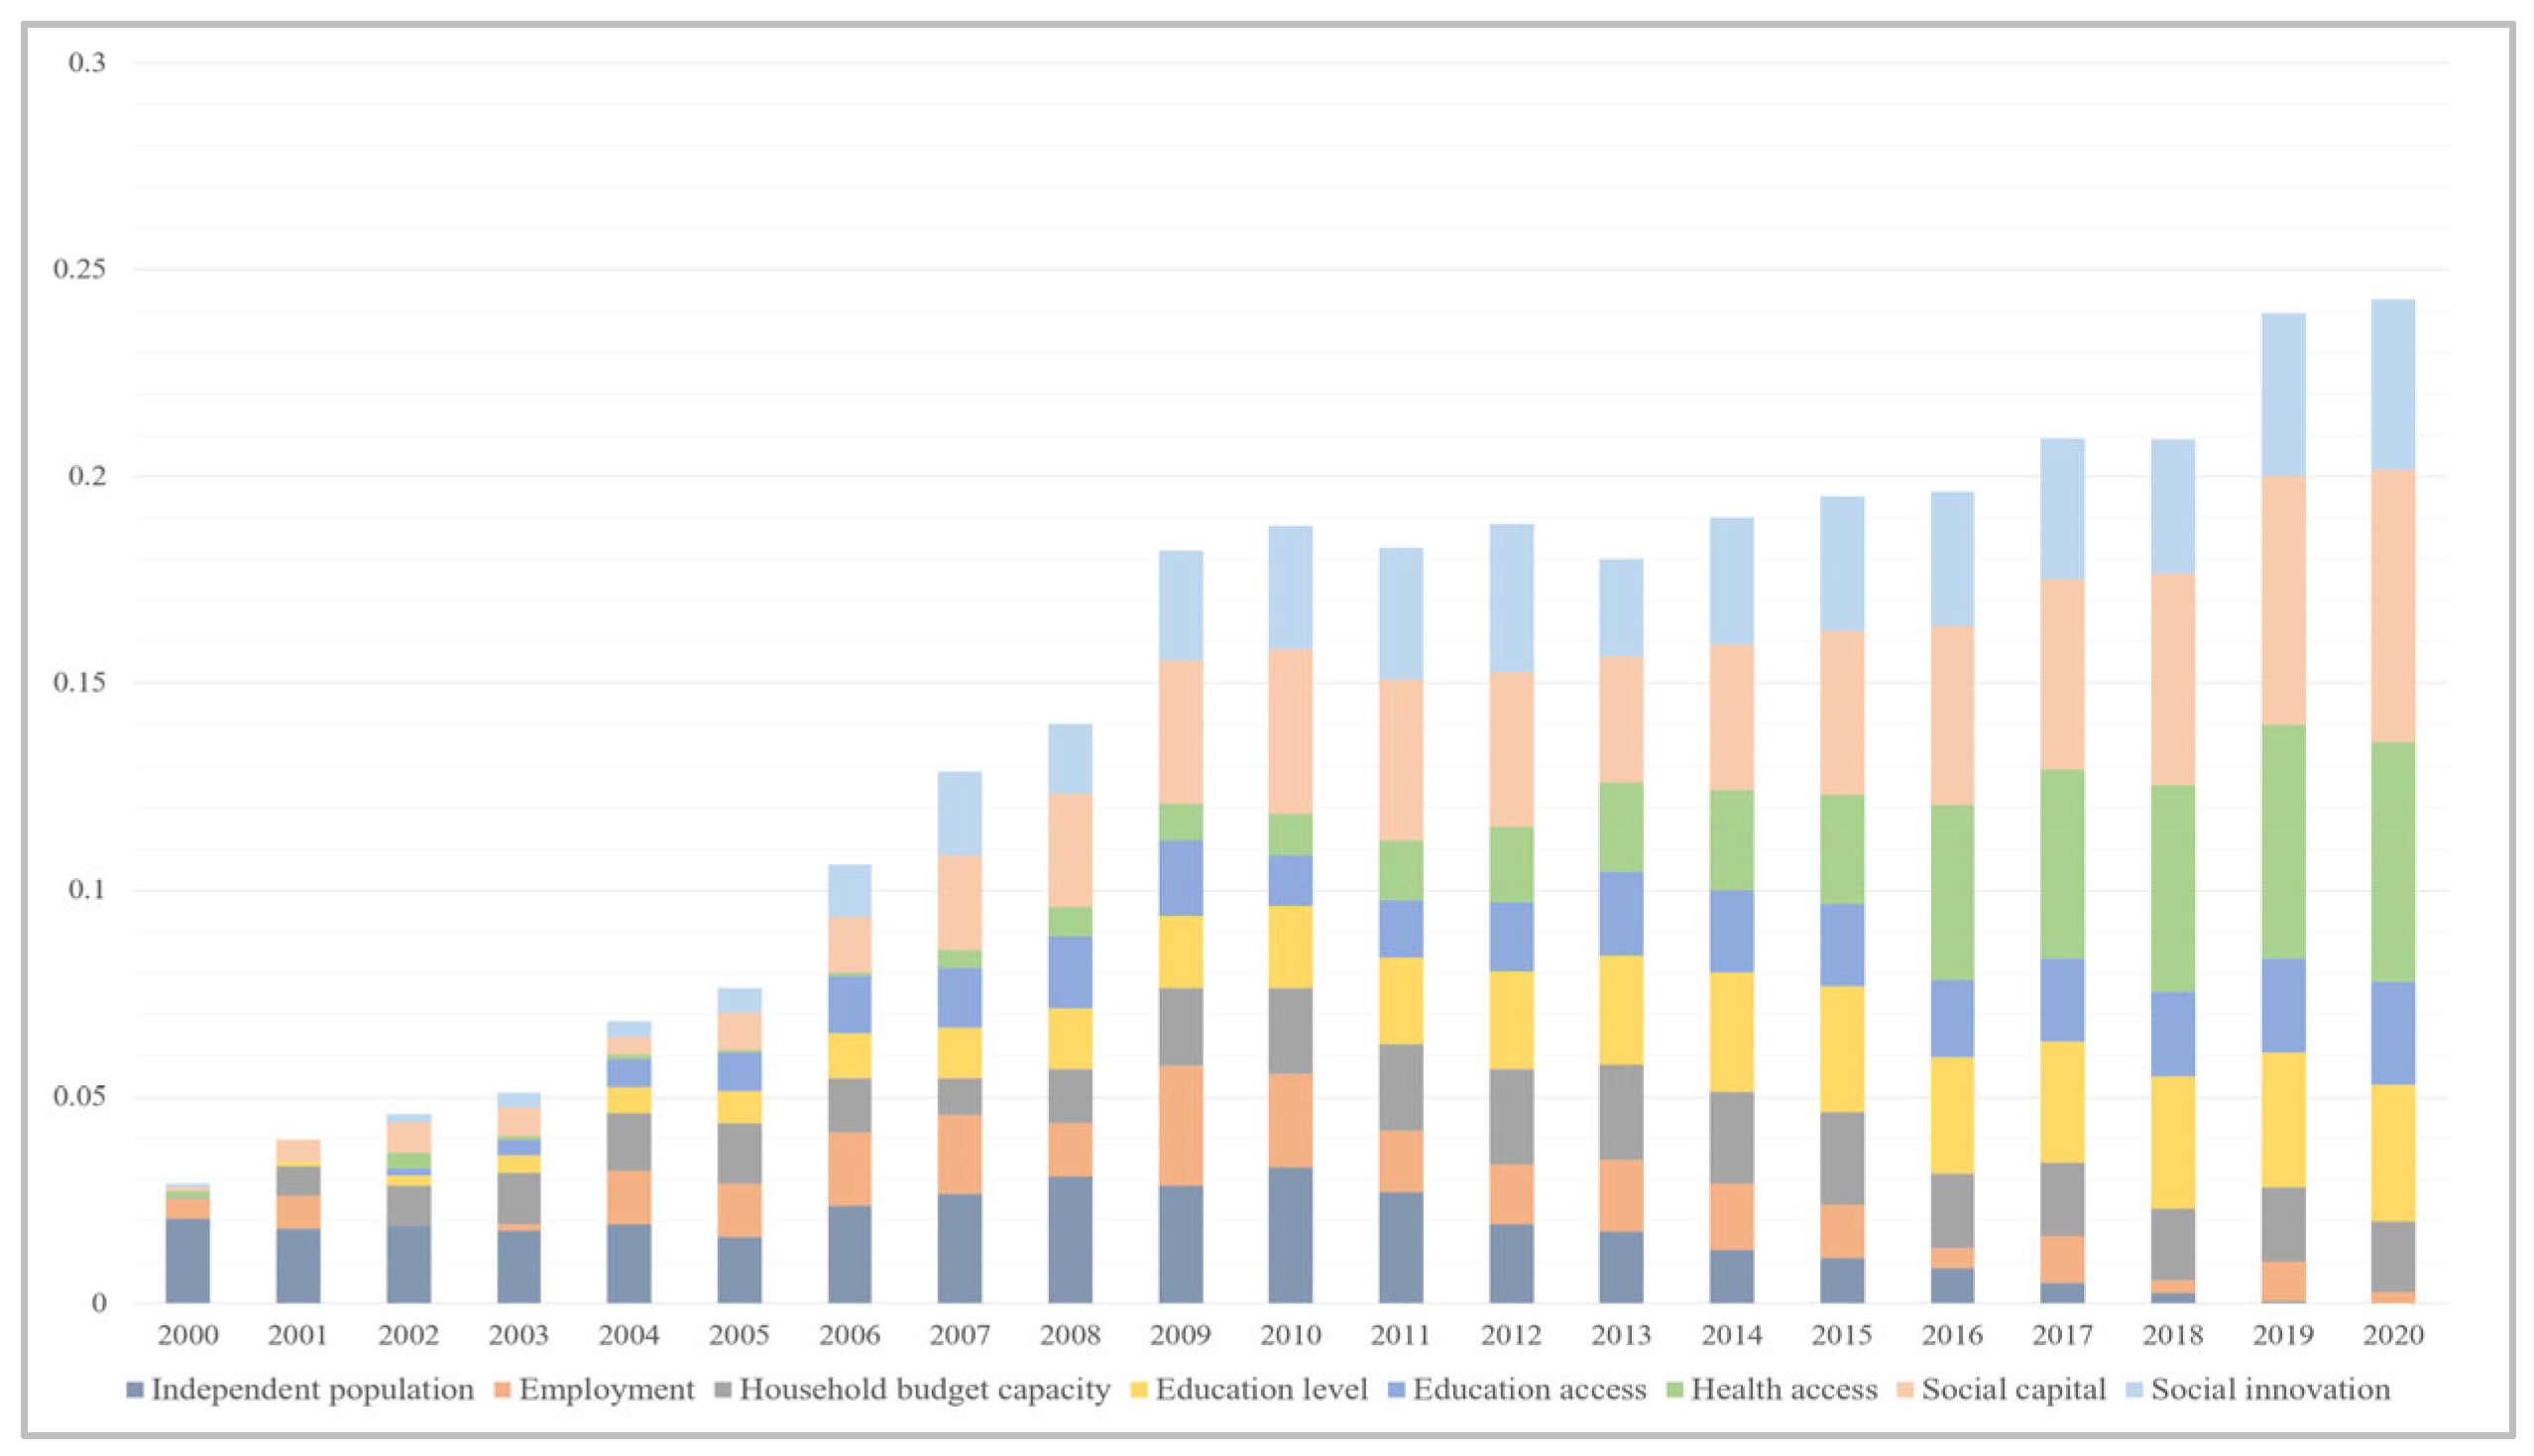
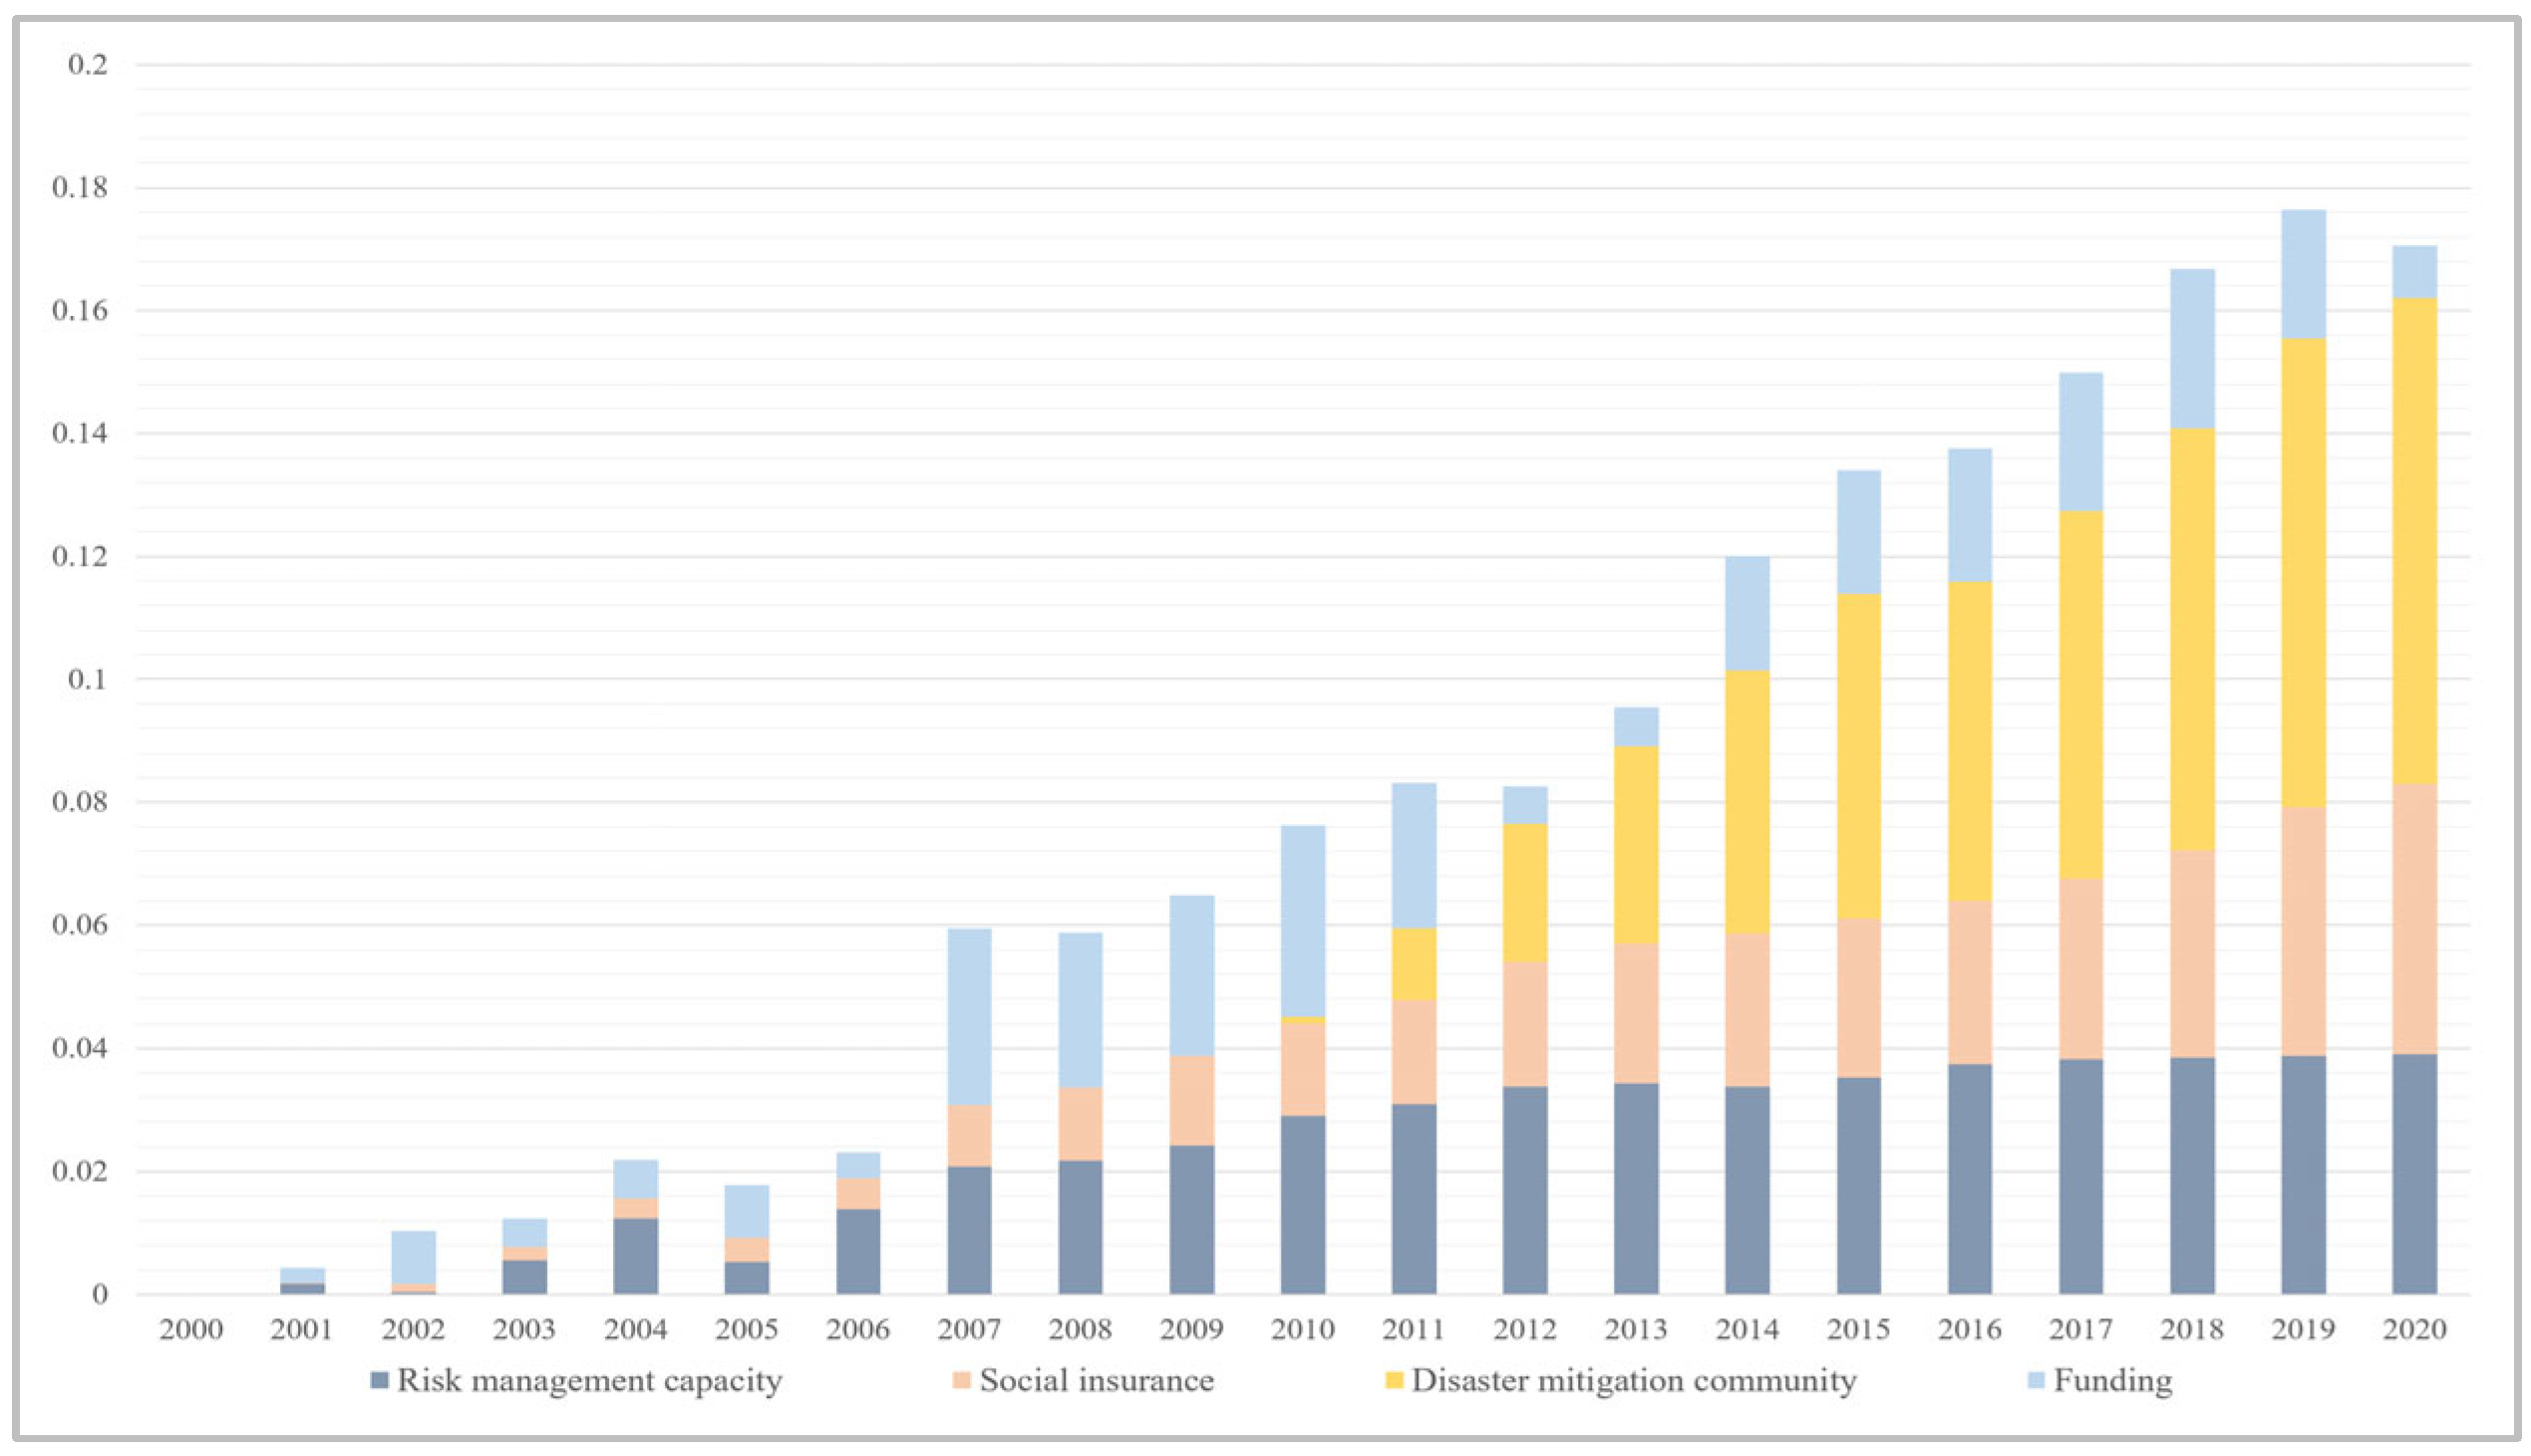
3.1.2. Subcomponents Analysis

Figure 6 shows that the score of infrastructure resilience is generally on the rise. The increase in the evacuation capacity and shelter capacity mainly contributed to the growth of InfR, which reflects the emphasis on physical connectivity in urban resilience building by engineering solutions. However, with the slowdown of urbanization and infrastructure construction, the scores of some indicators have also slowed down recently, such as transportation access, medical capacity, communication capacity, public utilities, and flood resistance capacity.
As shown in Figure 7, the score of environmental resilience remained stable from 2000 to 2007, then dropped rapidly after 2008, and rebounded a bit after 2016. Among the ER indicators, only the score of urban ecosystems is increasing, which shows that urban planning only applied engineering construction to build urban resilience and lacked ecological adaptation and nature-based solutions. However, the score of the urban ecosystem has continued to stagnate after 2007, as the greening project reached its end. The rapid increase in urban population and the expansion of urban land led to a decline in ER, which is the process of invading natural and agricultural land with built-up areas.
From Figure 8, the score of socio-economic resilience grew rapidly from 2000 to 2009 and grew slowly in fluctuations after 2009. The increase in social capital, health access, and innovation mainly contributed to the growth of SER. The score of independent population began to decline in 2011, which calls for urban planning to focus on vulnerable groups, such as the elderly and children. The decrease in employment and household budget capacity also reminds us that, in recent years, the socio-economic system has become less stable than before.
Figure 9 shows that the score of institutional resilience has generally increased, except for the decline in 2012 and 2020 due to the instability of funding. Among these indicators, the increase in disaster mitigation community mainly contributed to the growth of InsR. Although the risk management capacity has increased a lot, the score has stagnated in recent years, which may be because the control of various accidents by traditional urban management methods has reached the limit. In addition, the planning and construction of disaster prevention communities have been greatly improved, but the current coverage rate is still very low, only 21.16%.

3.1.3. Validations

The study conducted by Cai et al. (2018) [79] indicates that a mere 45% of the existing studies have made efforts to develop quantitative resilience indices. Significantly, only a small proportion (10.3%) have employed empirical methods to validate the generated resilience index. Validation is essential for ensuring that indices can be used as dependable instruments for decision-making. The challenge of validation arises for multiple reasons, such as the varying definitions of relevant concepts and the data unavailability.
In this section, this study attempted to validate the measurement by testing the impact of resilience on a city’s economic losses. In particular, this study regressed the relative economic losses caused by disasters in the 20 years of urban resilience assessment. This study hypothesizes that a city with a low urban resilience score is more vulnerable to disasters, thus resulting in higher economic losses. The variable of relative economic losses is defined by Equation (13). We scaled the original total economic losses of the disaster by the city’s GDP.
R e l a t i v e   E c o n o m i c   L o s s e s   f r o m   D i s a s t e r s = T o t a l   E c o n o m i c   L o s s e s   i n   D i s a s t e r s C i t y s   G D P
In the regression model, as Equation (14) shows, the relative economic loss of Chengdu city in year i is the dependent variable, while the resilience level of the city in year i is the key explanatory variable. Relative losses are log-transformed in advance. This study applied the urban population as the control variable in the regression, while considering the economic volume of a city and the impact of disasters as dependent variables.
L n   R e l a t i v e   l o s s i = β 0 + β 1 R e s i l i e n c e i + β 2 P o p u l a t i o n i + ε i
Table 4, which summarizes the regression results, demonstrates a correlation between resilience and relative economic loss of −1.0747, with a p-value less than 0.05. Thus, the findings support the hypothesis, according to which the resilience measure is significantly negatively correlated with the relative economic losses suffered by the city. The findings show that the urban resilience assessment system in this study, to a certain extent, is a valid and reliable measure of a city’s resilience to cope with disasters.

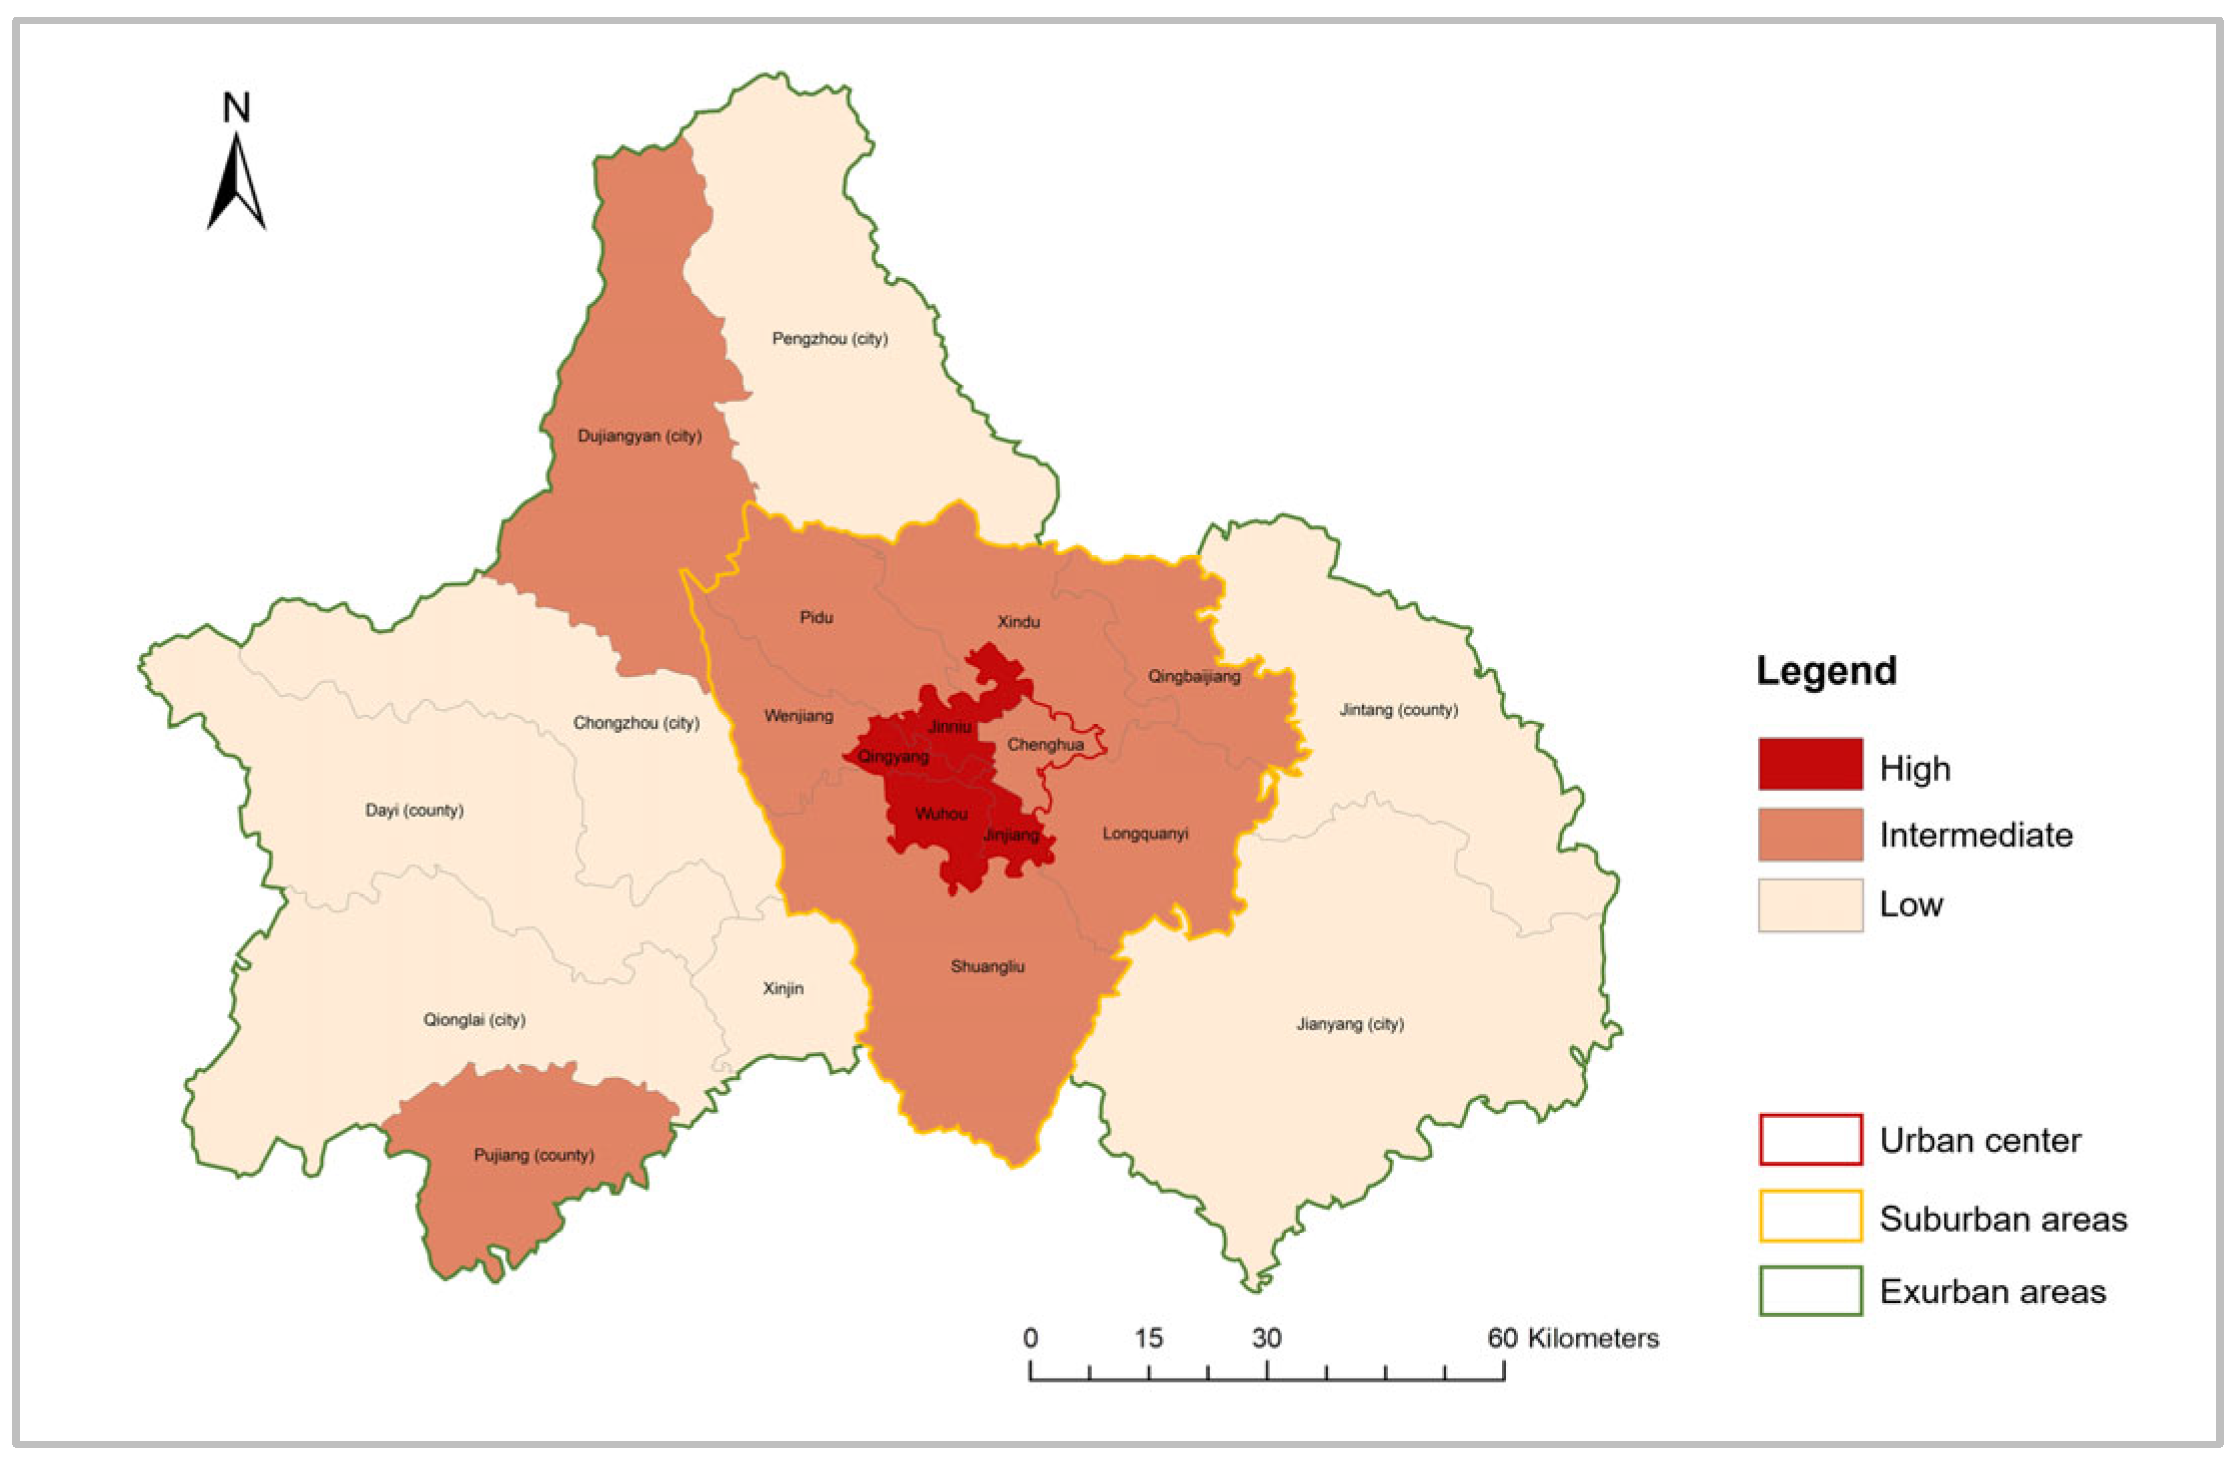
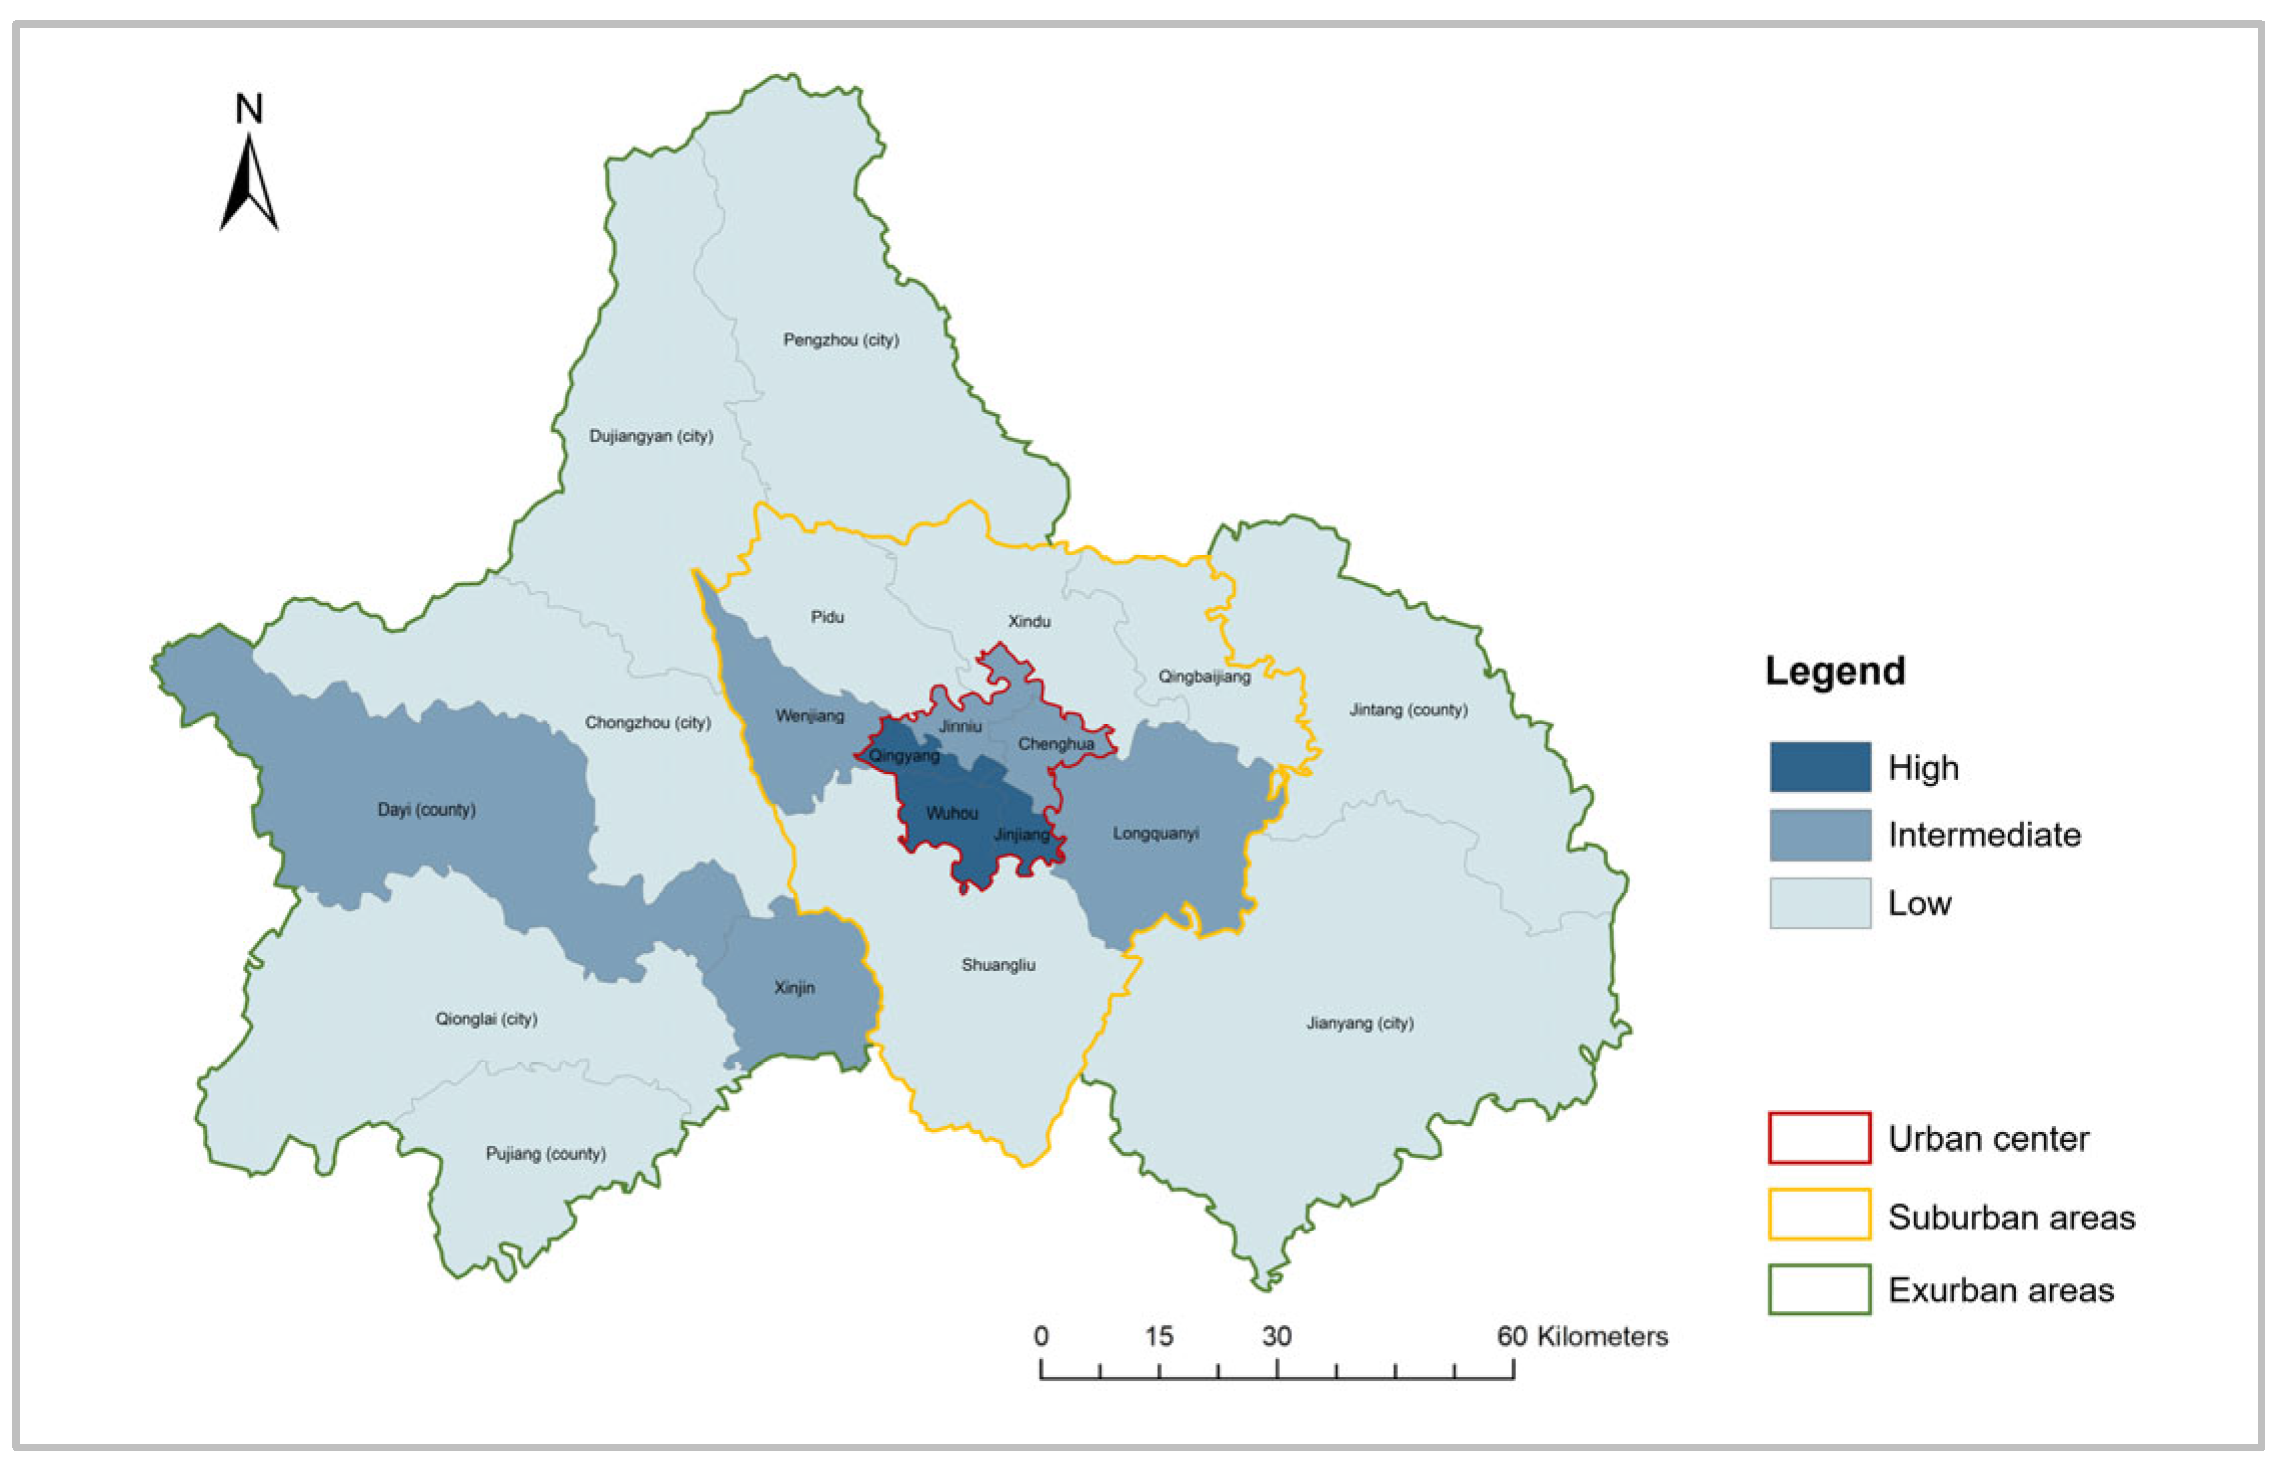
3.2. Spatial Distribution of Urban Resilience at County Scale

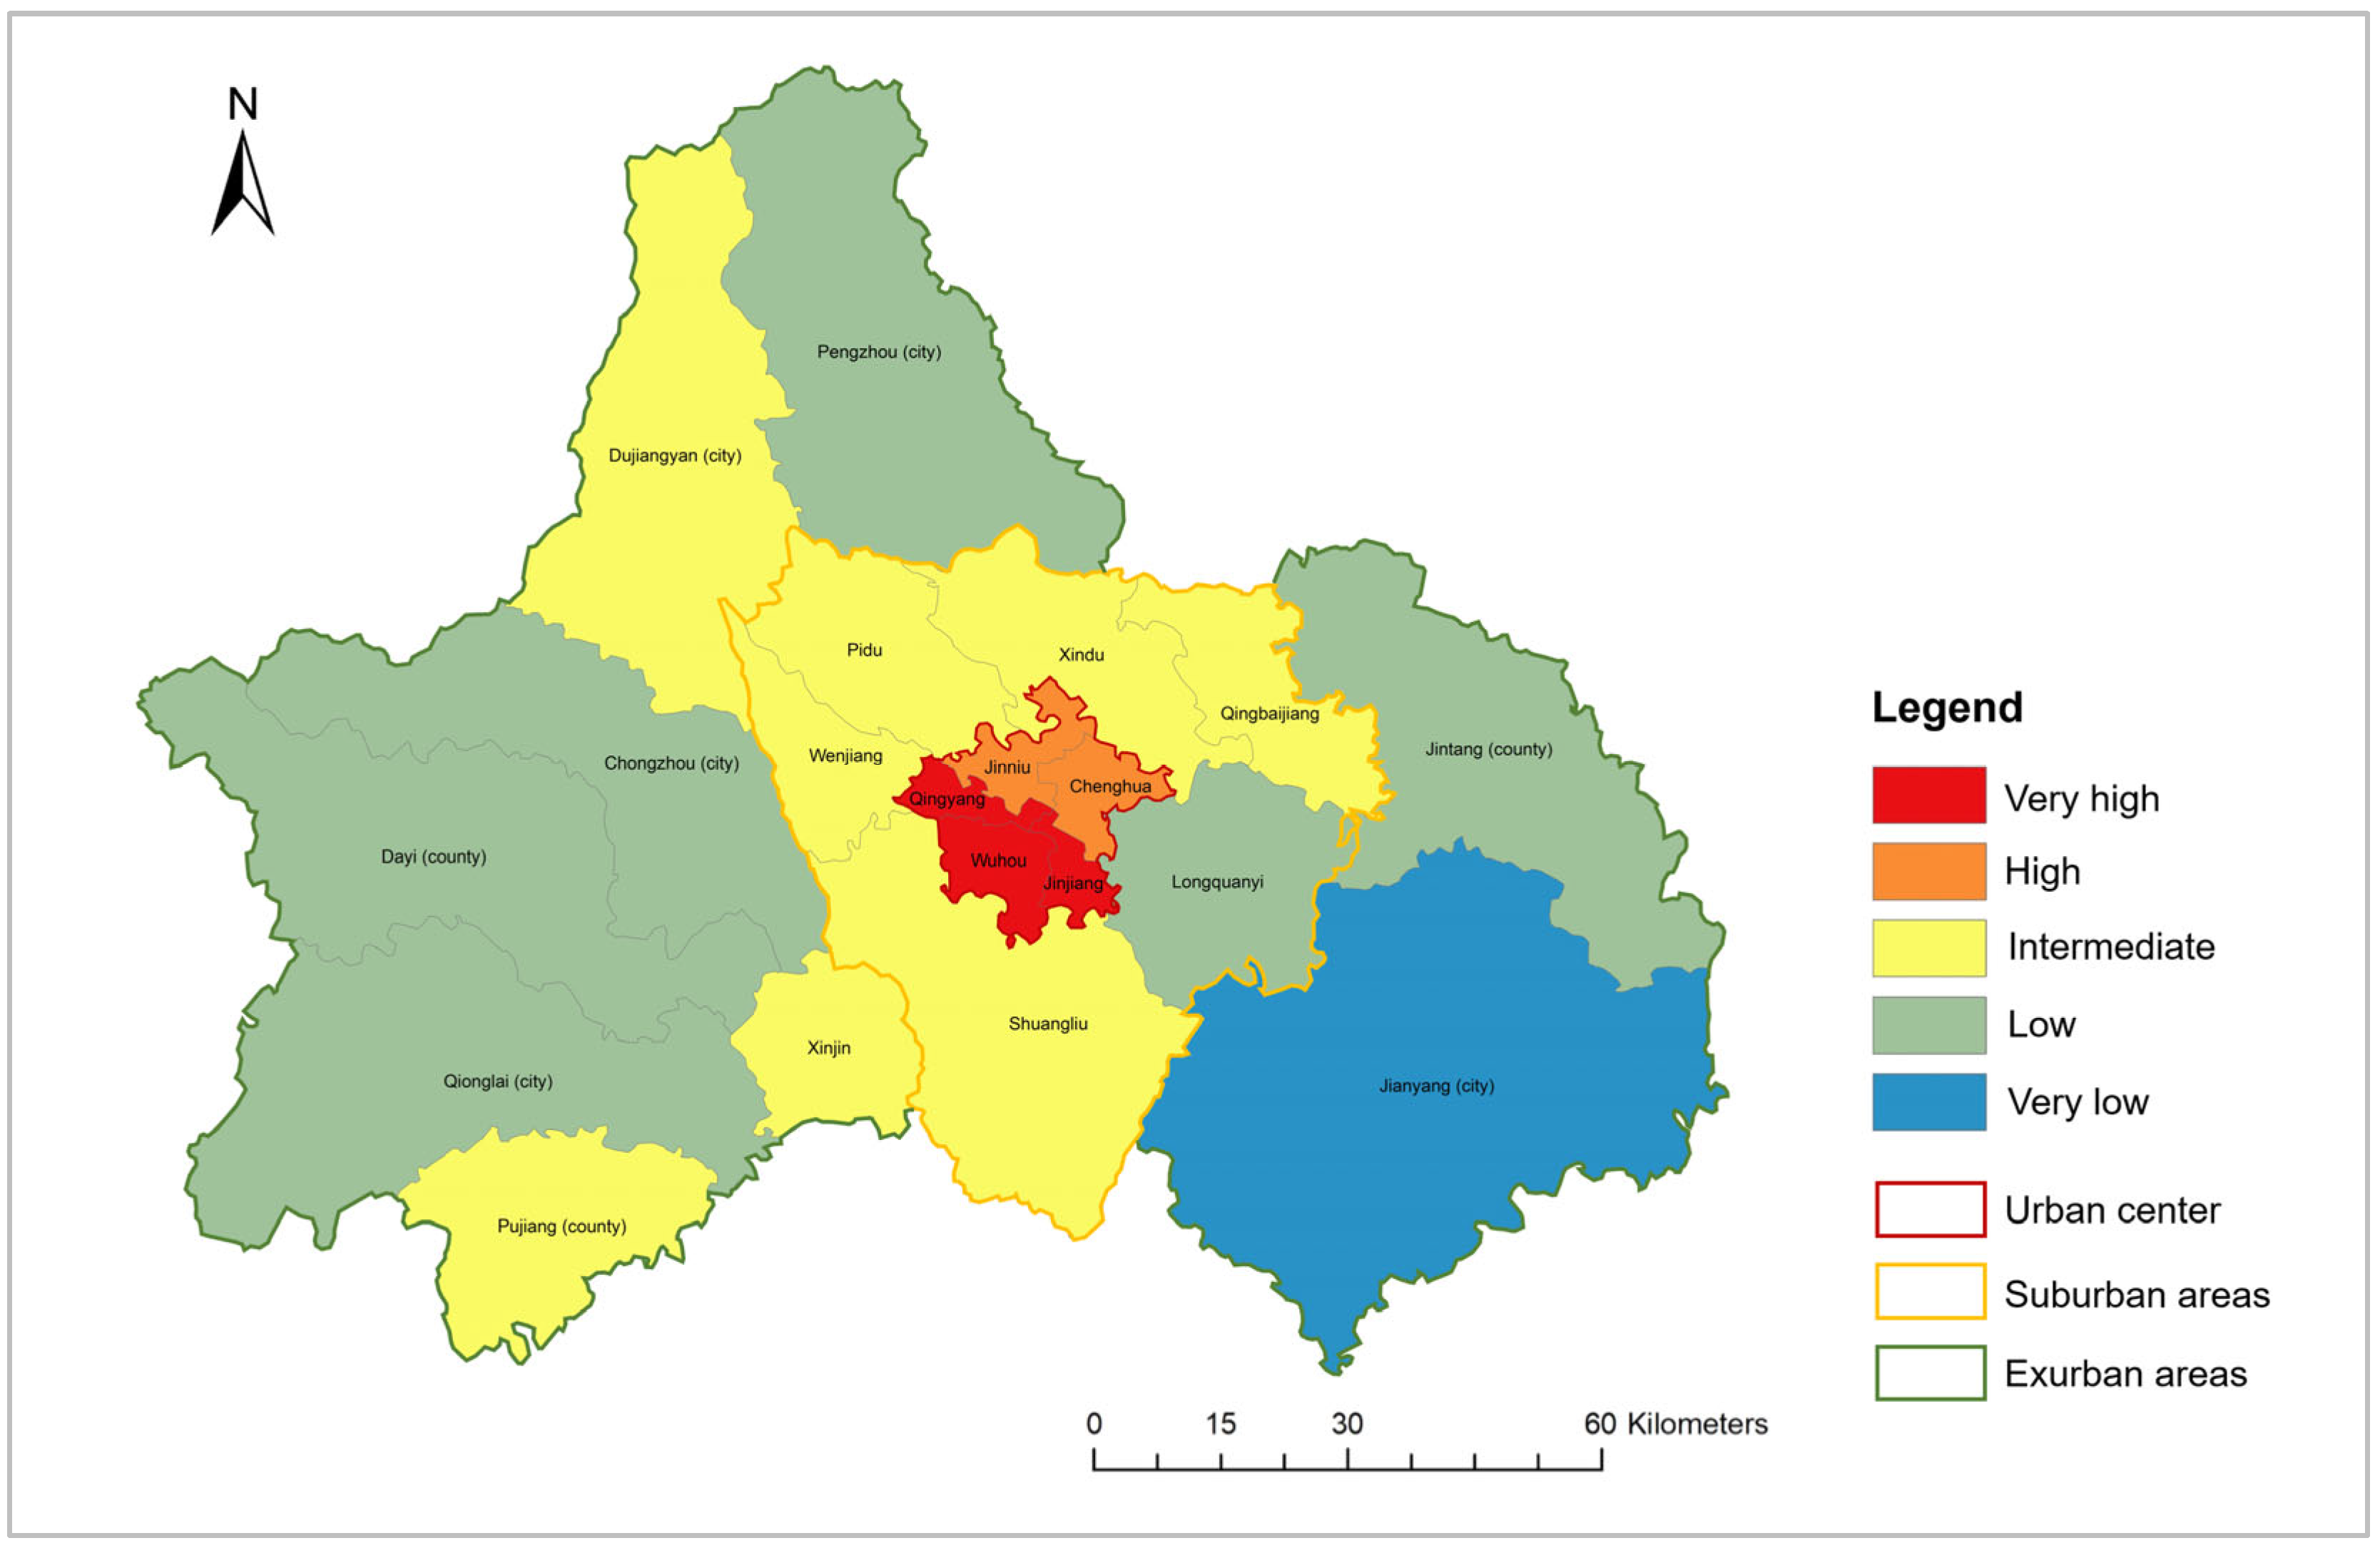
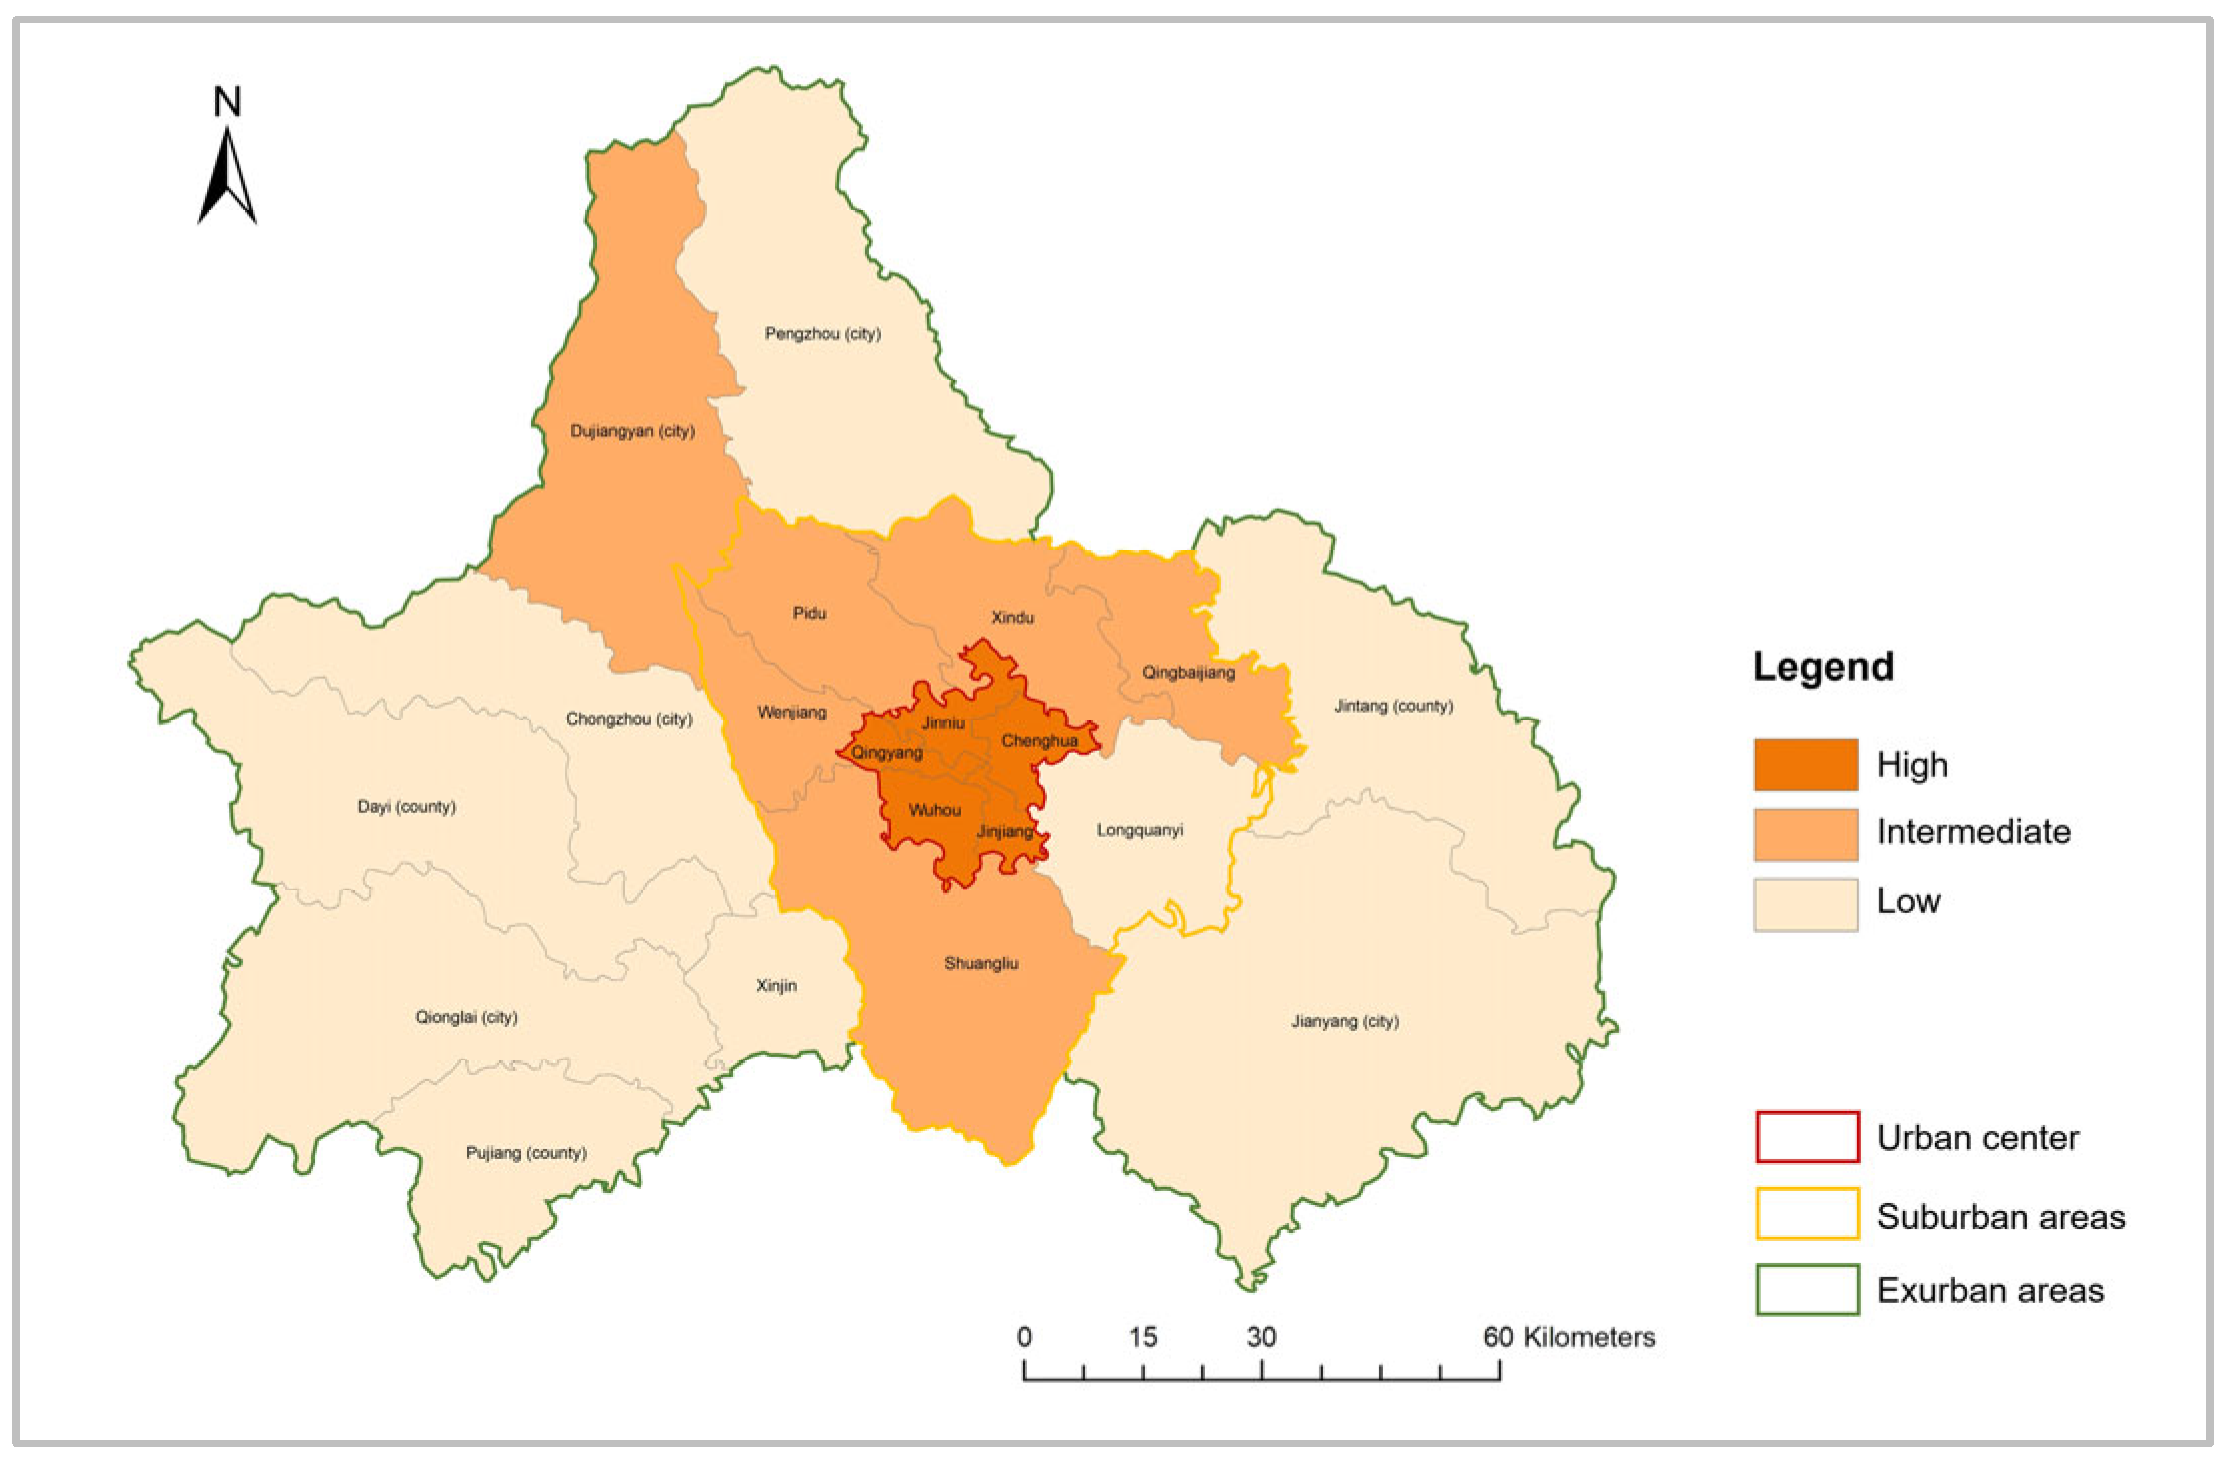
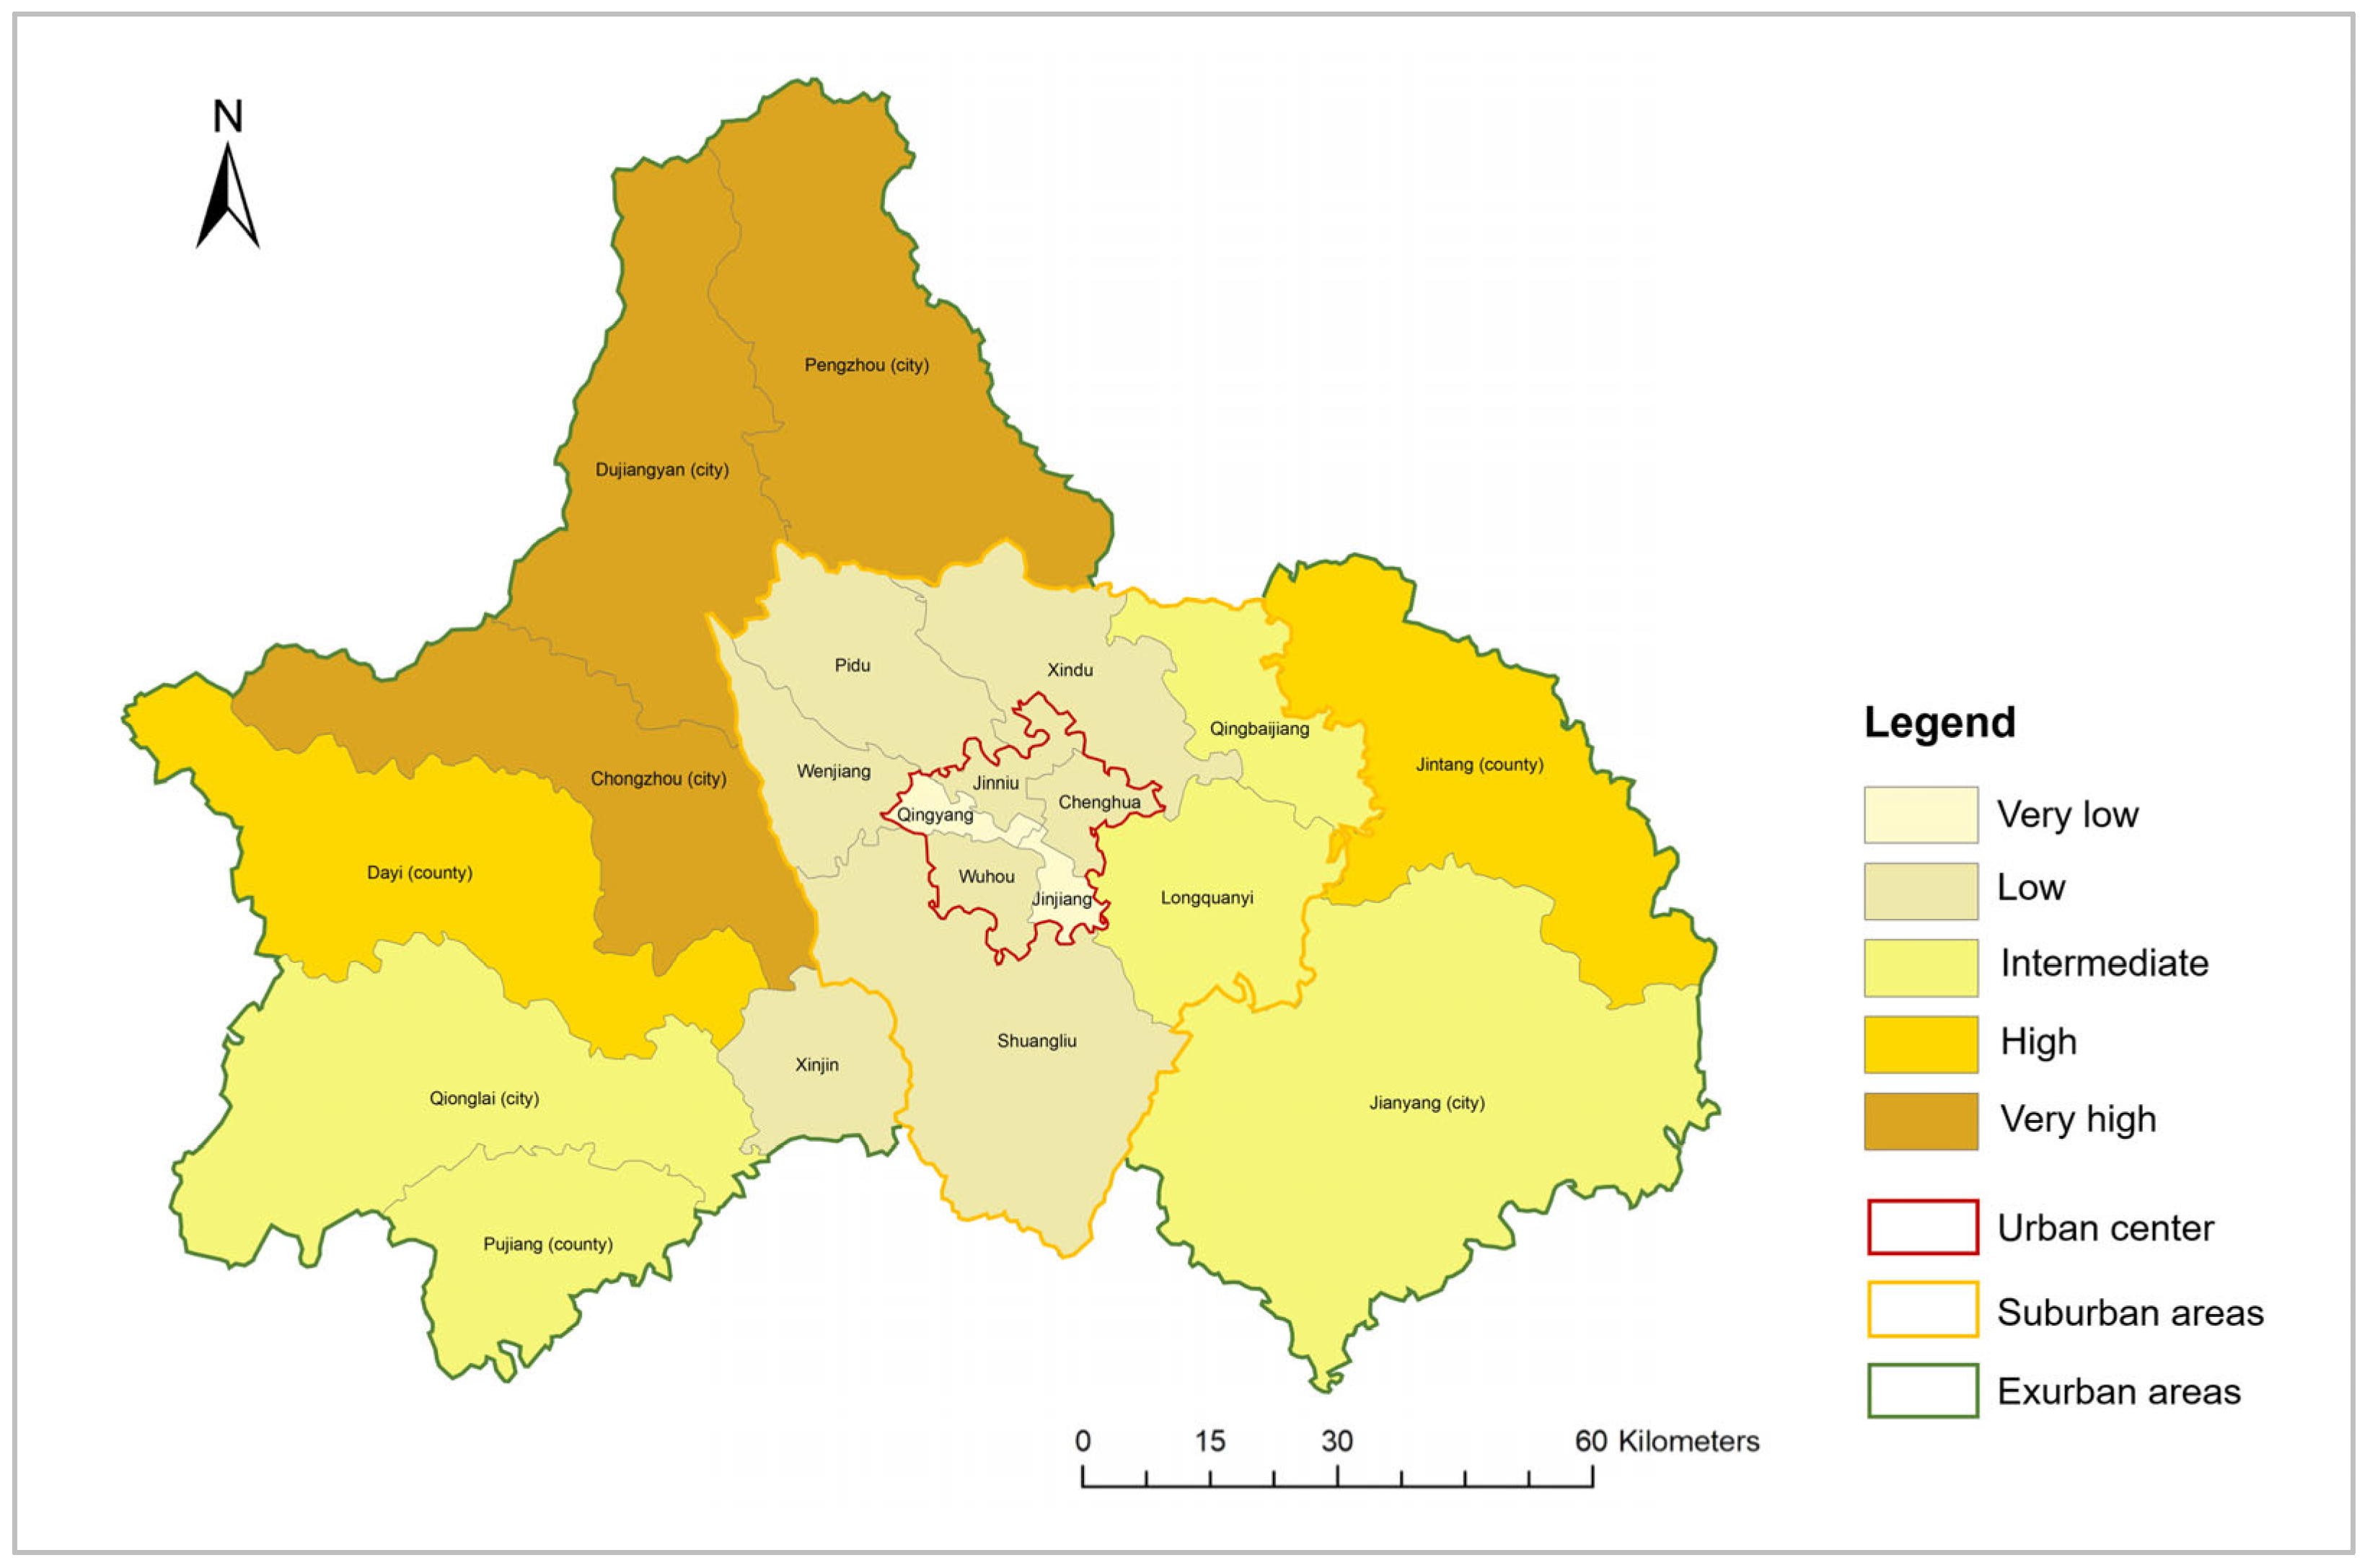
3.2.1. Spatial Features Analysis

Based on the ArcGIS 10.5 software, Natural Breaks (Jenks) is used to classify urban resilience into five categories: very high, high, intermediate, low, and very low. Consequently, Figure 10 visualizes the spatial distribution of urban resilience in Chengdu City in 2020. It is worth noting that this categorization of urban resilience at the county scale is based on the scores of the URI, but not the true resilience situation, which cannot be directly measured. The results show that (1) there are three very high and two high resilience units, and all are located in the urban center area; (2) most of the units are of intermediate resilience, mainly concentrated in the suburbs, with some distribution in the exurban area as well; (3) the low resilience is mainly distributed in the exurban area, and there is also a unit in very low resilience. The assessment results indicate that, at the city scale, there is a significant spatial differentiation in the distribution of urban resilience. Meanwhile, there are also gaps within each area.
With regards to infrastructure resilience, the assessment results suggest that InfR is concentrated in the urban center area, but the vast majority of the exurban areas have low InfR to cope with disasters (Figure 11). The results indicate that urban planning in China is still dominated by the central place principle, which determines the allocation of public resources and facilities. Consequently, essential public services such as healthcare, transportation, shelters, and schools remain predominantly concentrated in the urban center. The distribution of resources in Chengdu exhibits spatial disparities, leading to the spatial differentiation of InfR.
Figure 12 shows that with population concentration and urbanized areas’ expansion, environmental resilience decreased in Chengdu. The assessment results reveal that urban centers have the lowest ER and the vast majority of the exurban have the highest ER, owing to the acceptable natural environment. The results indicate that, in China, urban planning focused more on economic growth and urban construction, and neglected ecological protection for a long time, especially in urban centers. Thus, although the urban center is more resilient in terms of infrastructure and socio-economic aspects, the impact of ecological destruction and population pressure also reduces environmental resilience.
Concerning socio-economic resilience, the assessment results reveal that most counties are in the intermediate SER, and urban centers have the highest ER but most exurban counties are low in SER (Figure 13). The results suggest that development-oriented urban planning in Chengdu City created spatial and social segregation and manifested in the spatial distribution of SER. The improvement of the built environment and better medical and educational conditions attracted more educated people to the urban center. Meanwhile, the concentration of population has also strengthened the concentration of social and economic resources.
Institutional resilience is concentrated in the urban center area, as shown in Figure 14, and the scores of other areas are relatively low. The results imply that, currently, most counties in Chengdu have room for improvement in building InsR. Furthermore, InsR is less affected by spatial differentiation yet is more closely related to government policy formulation and implementation. Thus, the spatial distribution of InsR varies from area to area.

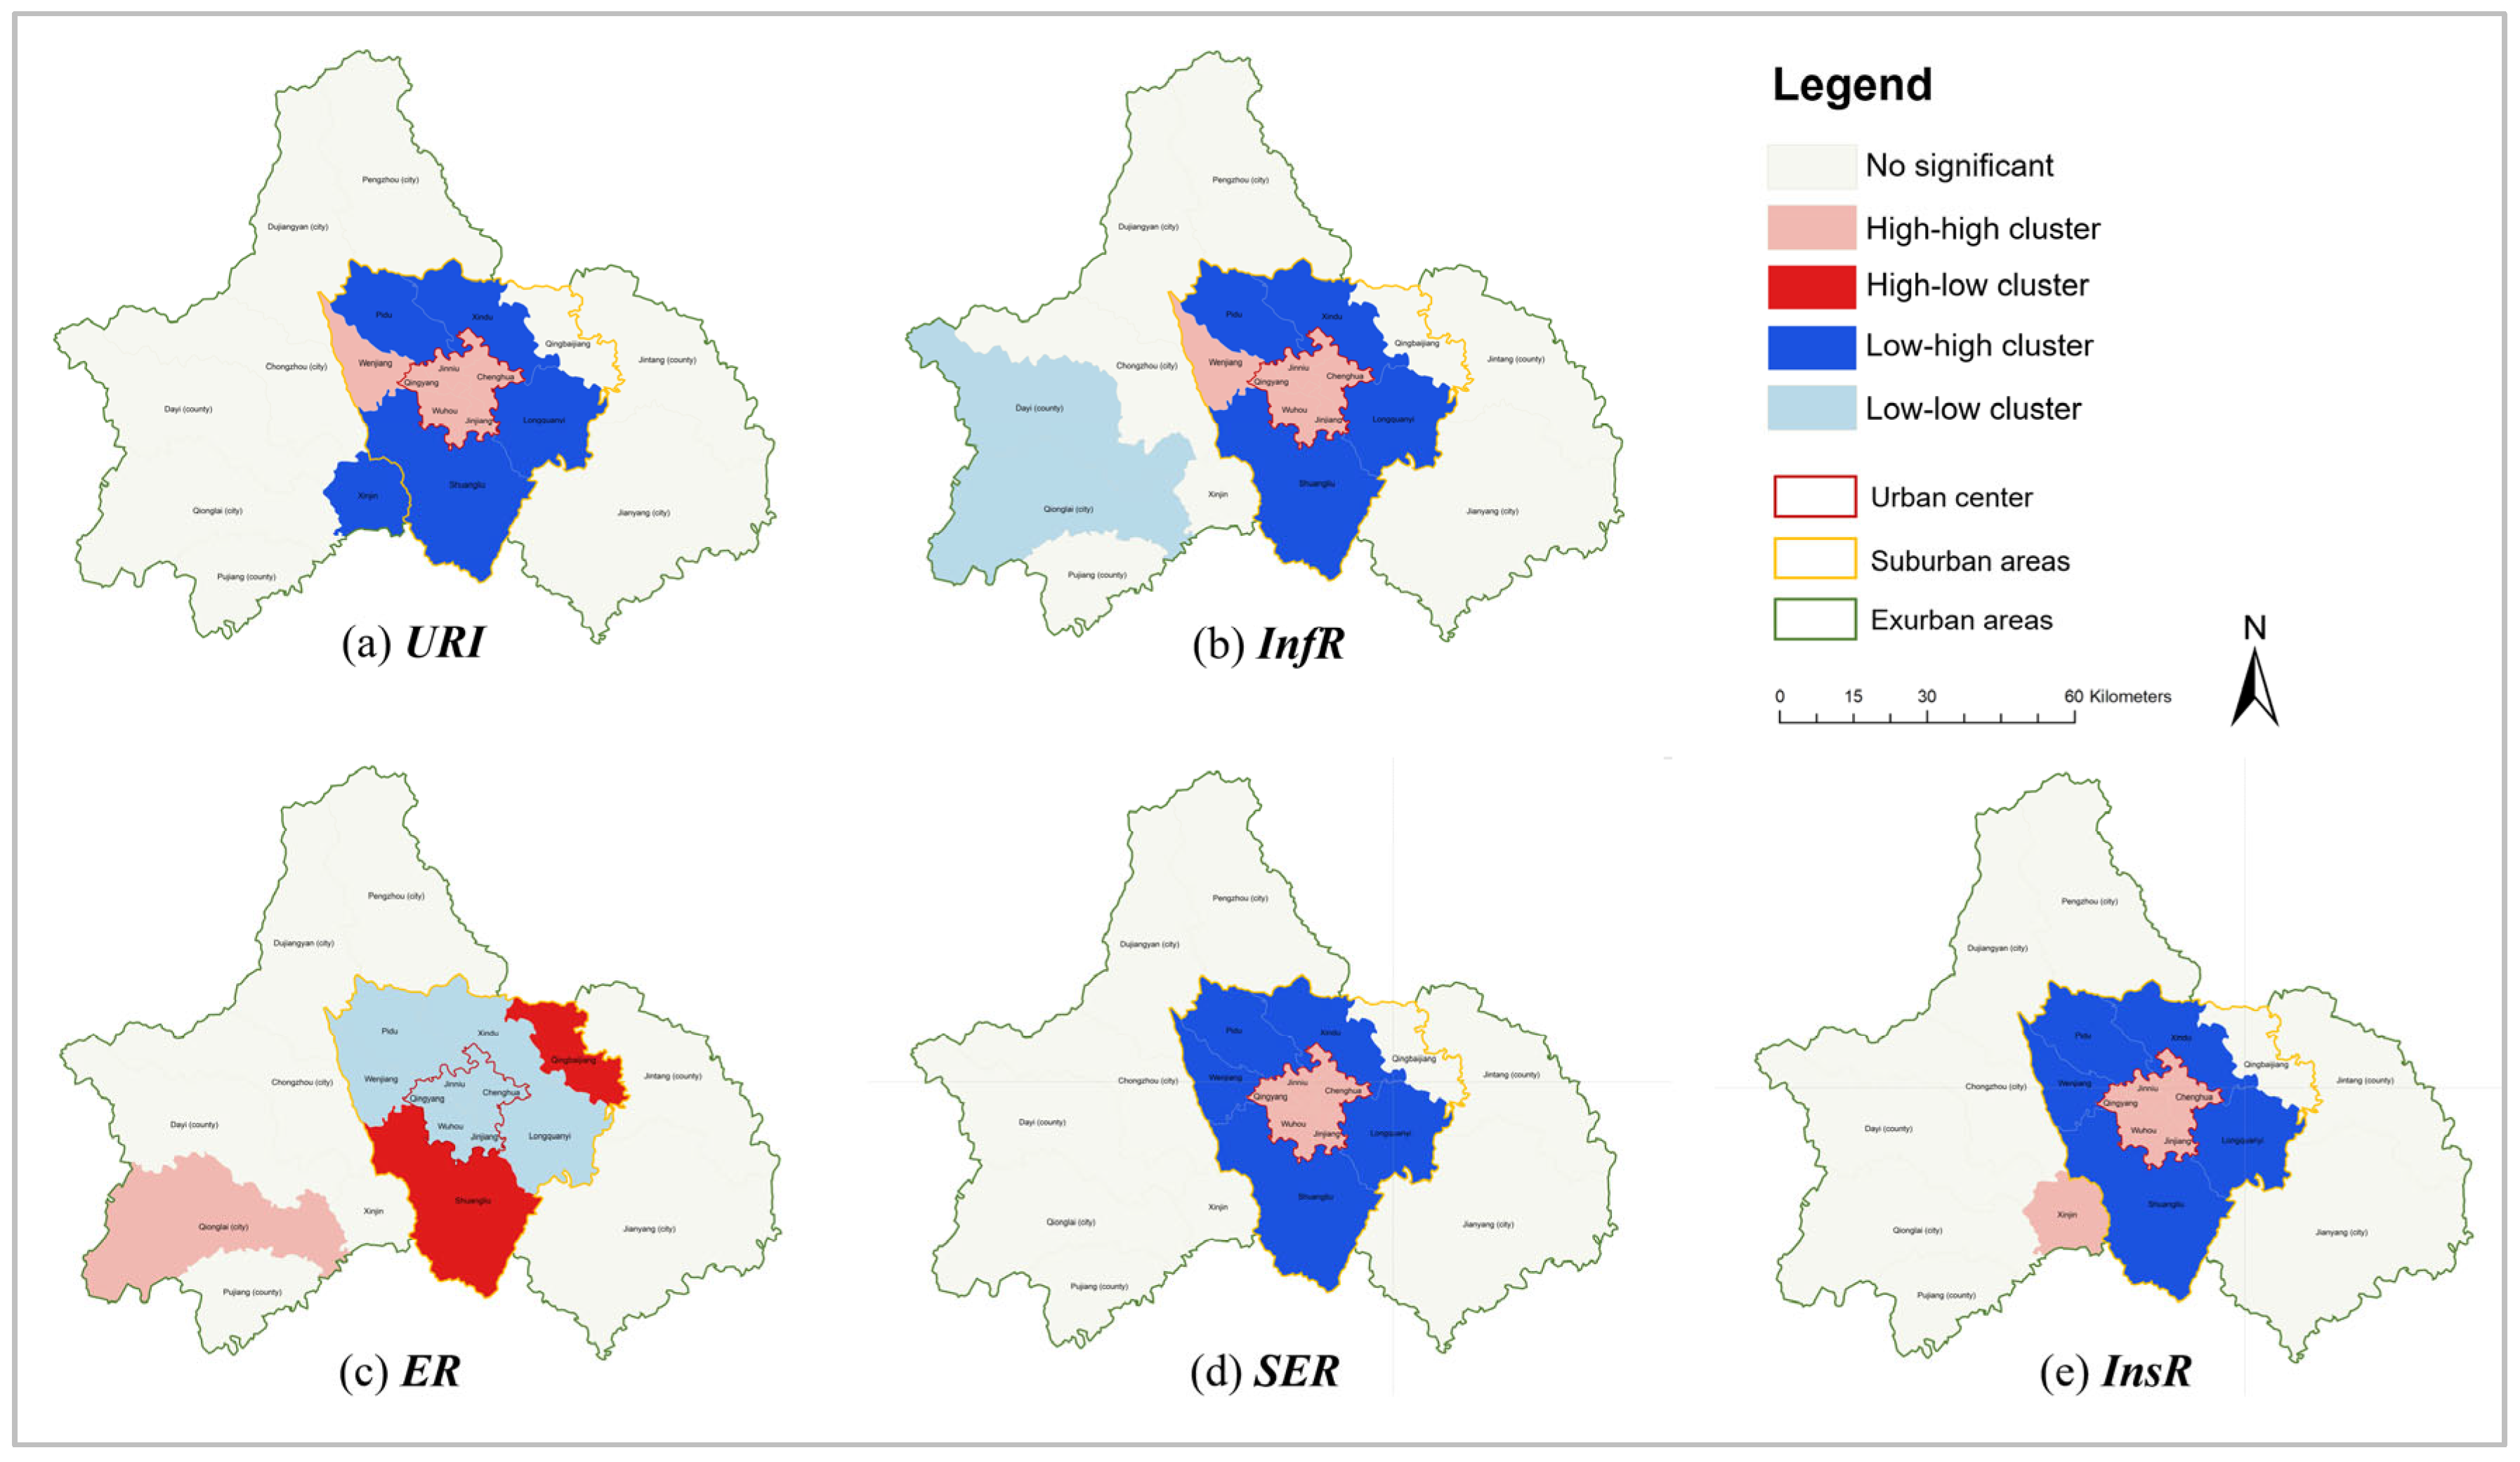
3.2.2. Cluster Analysis

This study used ArcGIS 10.5 software to calculate the spatial autocorrelation Moran index of urban resilience. Table 5 shows that the Z score was greater than 1.96, some were even greater than 2.58, and p values were all more than 0.01, indicating that it passed the 1% significance level test. This further indicates a significant correlation in the spatial distribution of urban resilience in different sub-components, and the agglomeration characteristics are significant. Figure 15 further visualizes the spatial correlation of urban resilience, and the urban resilience and four subcomponents of the study area have spatial agglomeration characteristics within the city. The spatial agglomeration characteristics of urban resilience in the urban center, suburban, and exurban areas of Chengdu are obvious, and a significant distribution of “cold hot spots” exists in the spatial distribution. First, the urban resilience “H-H” cluster (high-efficiency type) was largely concentrated in the urban center, and the “L-H” agglomeration area (hollow type) is mostly distributed in the suburban area, which is similar in InfR, SER, and InsR. On the contrary, the “L-L” agglomeration area (inefficient type) of ER is mainly distributed in urban centers and suburban areas.

4. Discussion

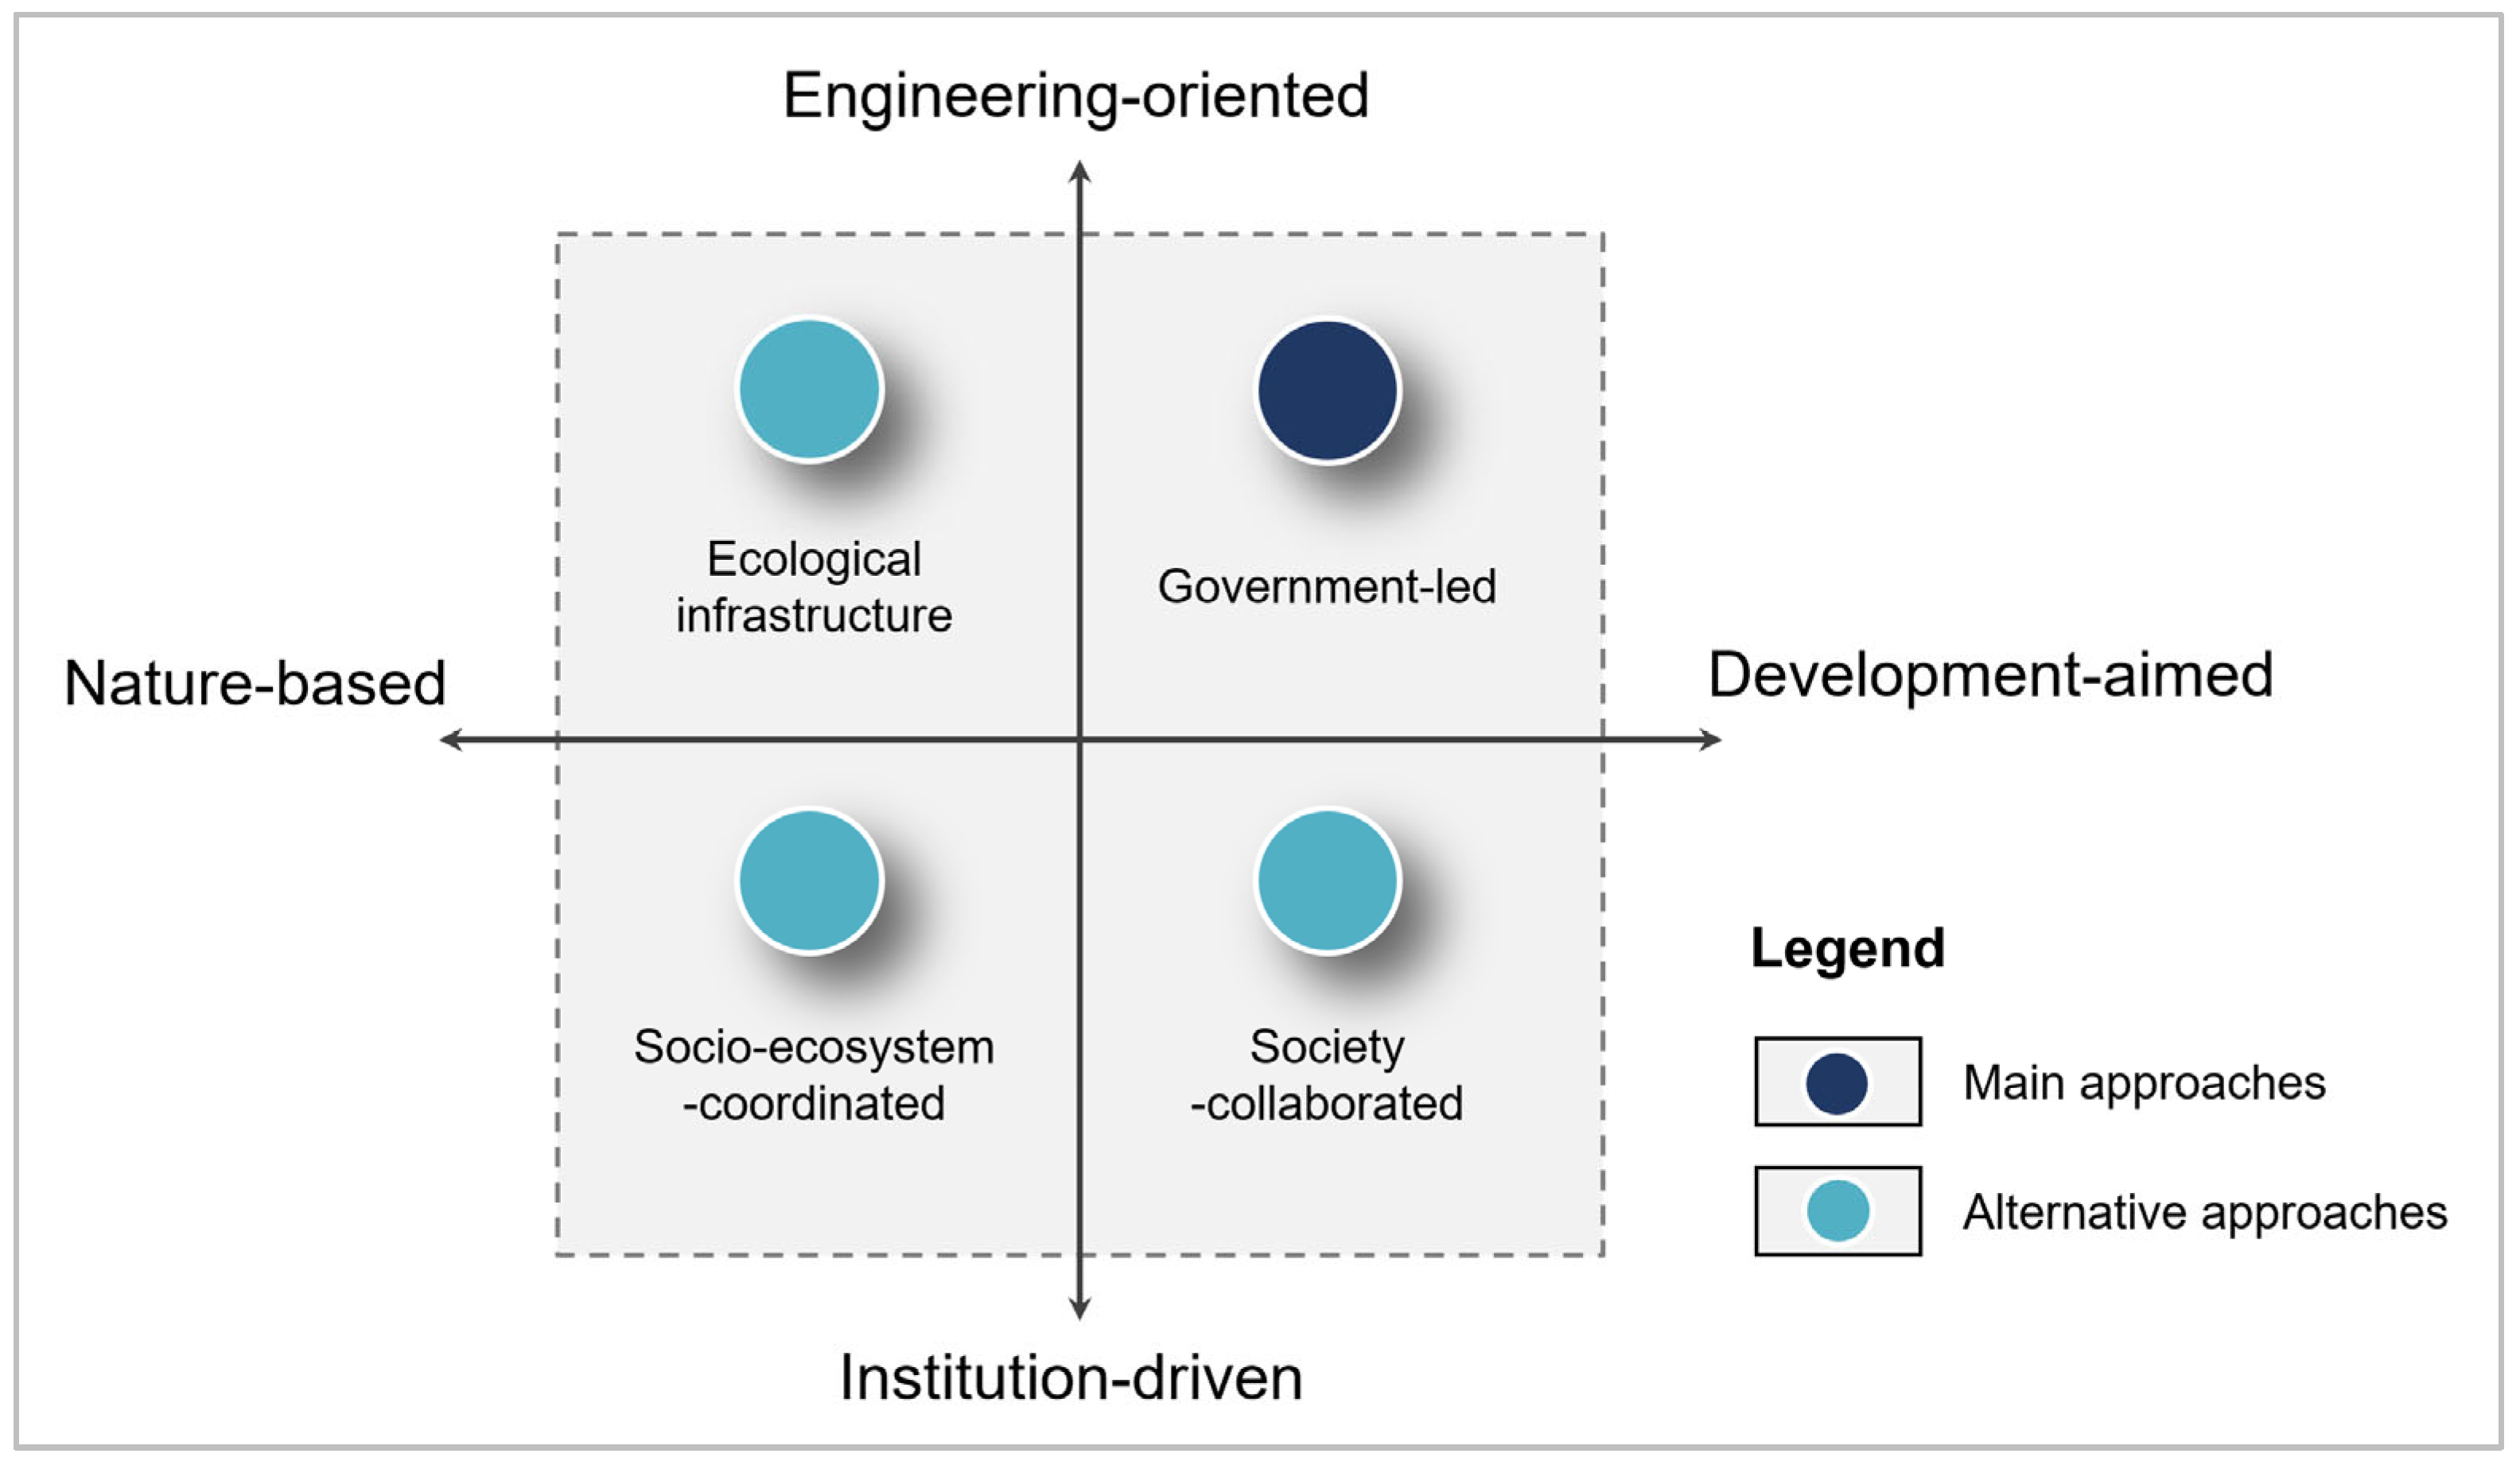
4.1. Framework and Policy Implication for Urban Resilience Planning

This study builds an integrated framework based on the four dimensions of urban resilience in the above-illustrated theoretical framework (Figure 5) in order to investigate the approach to urban resilience planning in Chengdu. The four distinct dimensions, namely built environment, natural environment, socio-economy and urban governance, are treated as four single resilience approaches in the streamlined schematic model shown in Figure 16. In this case city, in Chengdu, the current urban resilience building is mainly based on the infrastructure approach, which is engineering resilience, and needs to transform to socio-ecosystem resilience thinking. Specifically, based on the urban resilience planning framework, engineering-oriented and development-aimed are the main approaches applied in Chengdu, which is mostly led by the government. Importantly, more resilience-building approaches need to be introduced, for example, nature-based solutions, such as green-infrastructure, as well as coordinated socio-ecosystem development and broad social collaboration and participation. This study suggests that resilience thinking should be conceptualized and operationalized in urban planning, especially in the context of current spatial planning reforms.
Secondly, in this study, institutional resilience is another important part of overall resilience, while it is hard to quantify, as statistical data on the disaster management institutions, disaster relief plan, and policy were limited. Although the current system construction related to resilience in China is not perfect, it is already on the way. In the next step, more quantifiable policies and measures are needed to monitor changes in the resilience of the urban system, such as the coverage rate of disaster insurance, the percentage of the population employed in emergency services, etc.
Thirdly, the emphasis on justice, inclusion of vulnerable groups, and a participatory approach is called for in setting the agenda and designing the practices of future planning. An equity issue arises from the political interpretation of resilience in the socio-ecological system. In this study, there is evidence that the independent population is declining, employment is unstable, and household budgeting capacity is stagnating. Therefore, it is necessary to improve the ability of the urban system to deal with risks through the efforts of the whole society, rather than a small part of the class.
Last but not least, although environmental resilience has been rebuilt a bit, it is still at a relatively low level. Many studies have demonstrated that urban ecosystem services, such as green infrastructure, can serve as a crucial means of foresting resilience in urban environments (McPhearson et al., 2015 [98]; Wu et al., 2020 [99]). Despite accumulating evidence showing that the ability of urban systems to cope with disasters is directly linked to the quality, quantity, and variety of environmental resilience, urban ecosystems have not been sufficiently integrated into our urban governance and planning agenda for resilience. This study suggests that ecosystem services and natural buffers play a vital role in connecting planning, management, and governance approaches that aim to achieve more sustainable cities and serve as essential components in enhancing the resilience of urban systems.

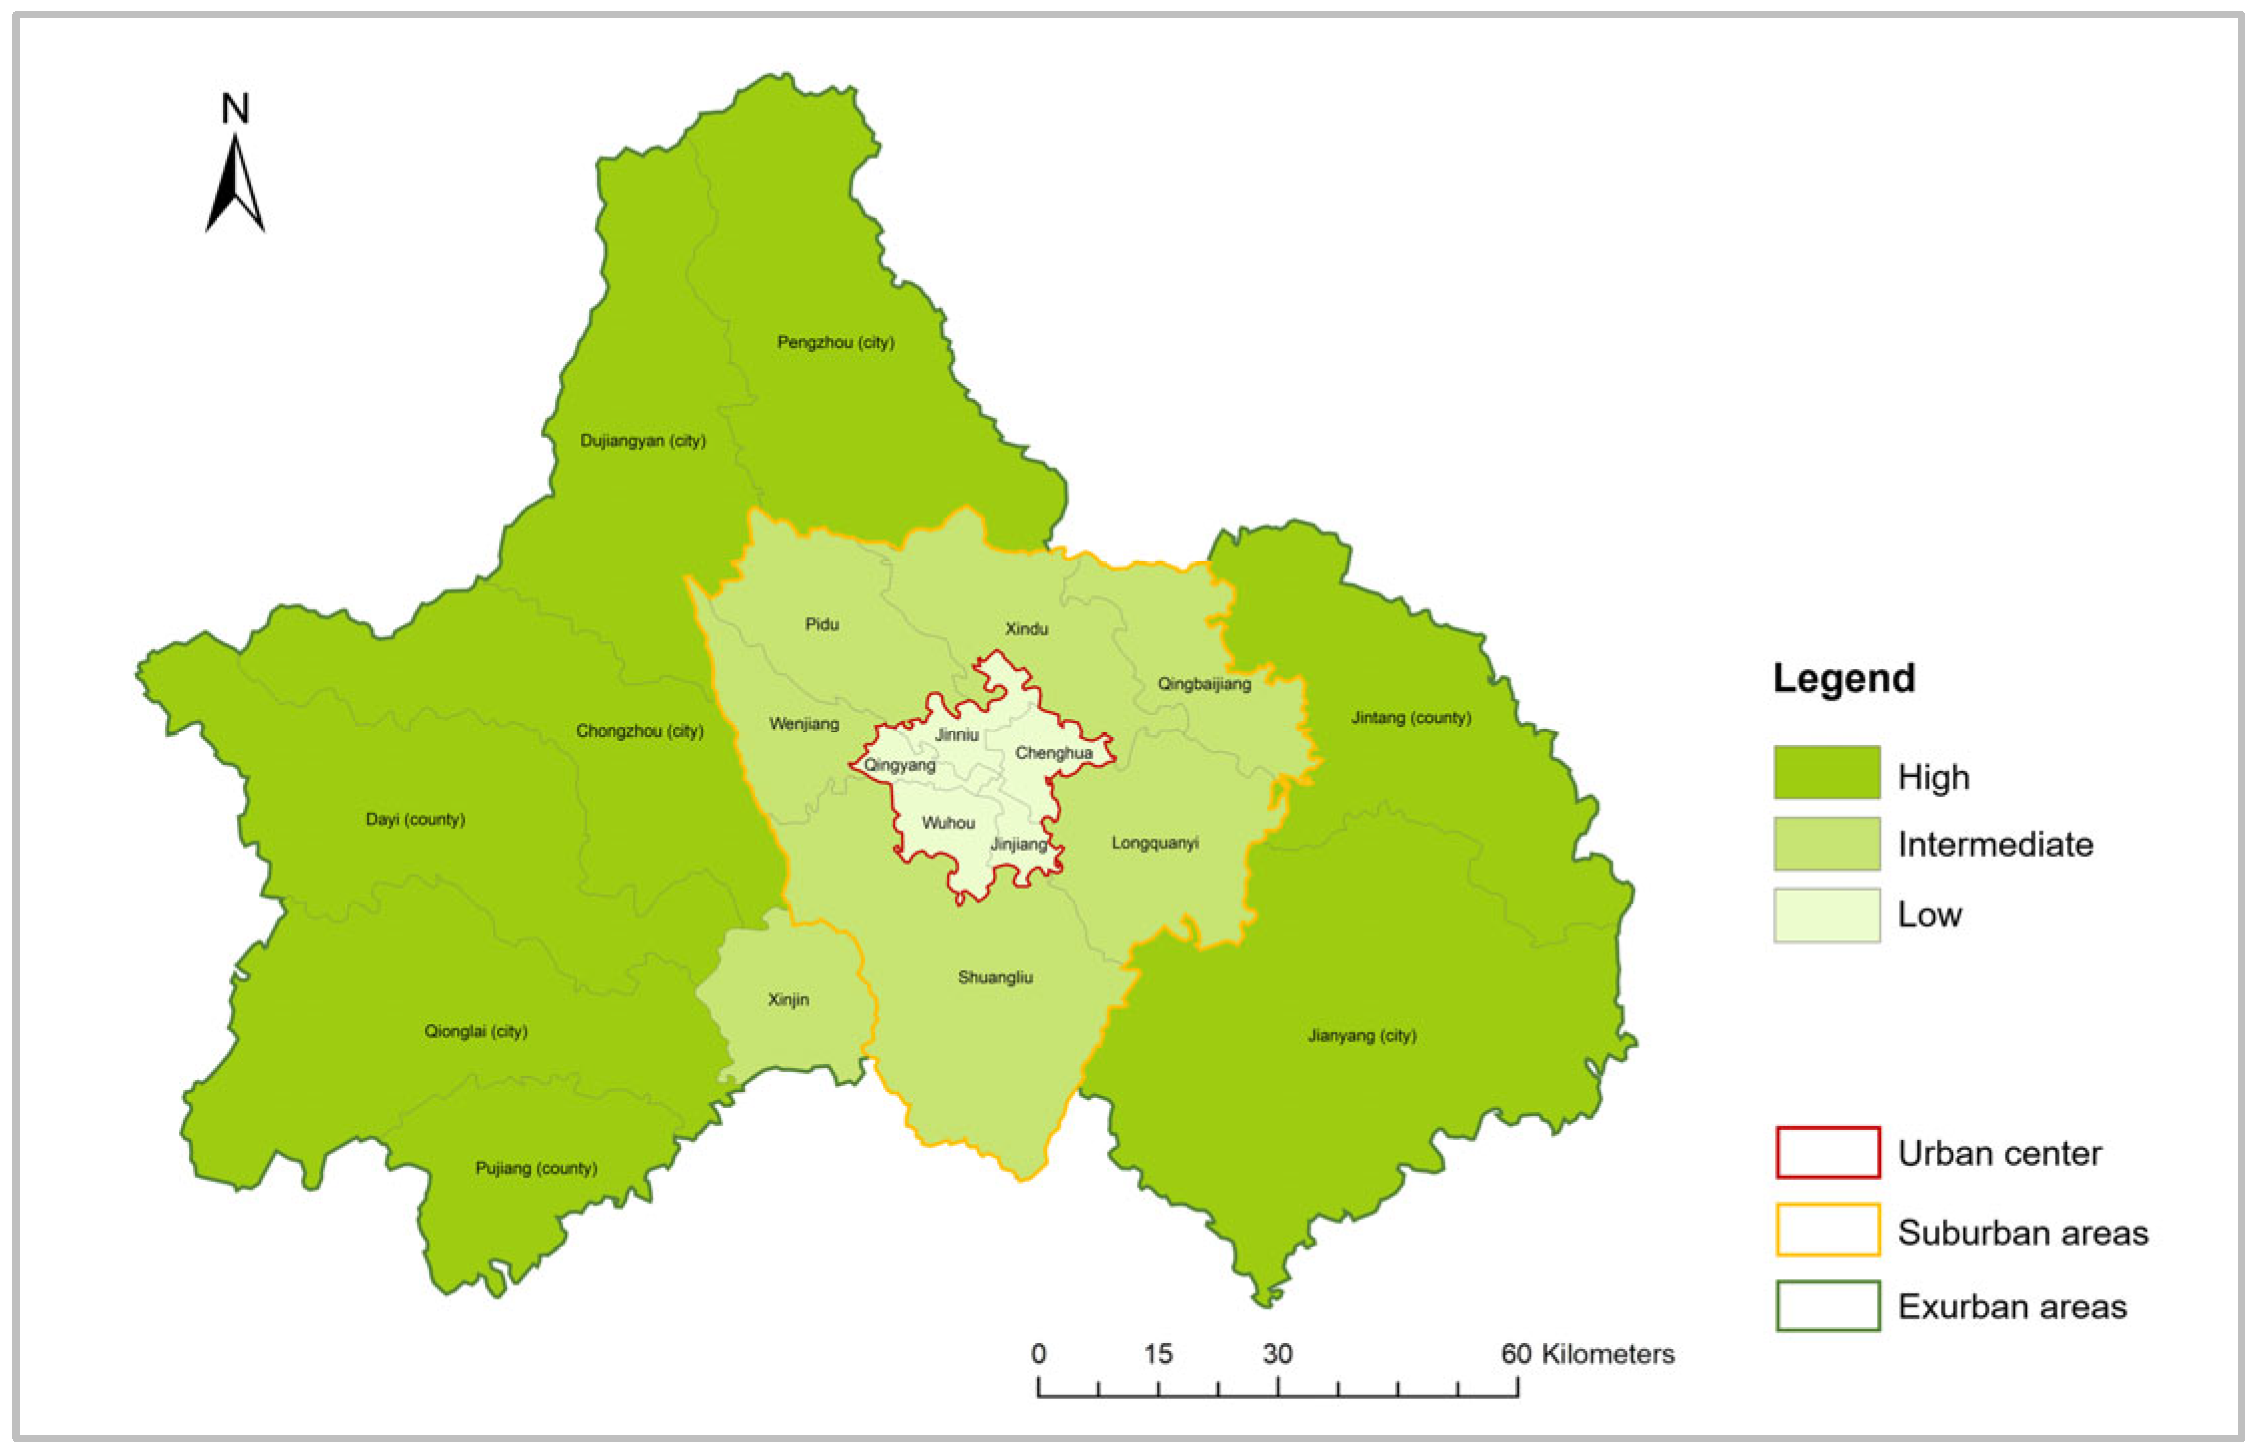
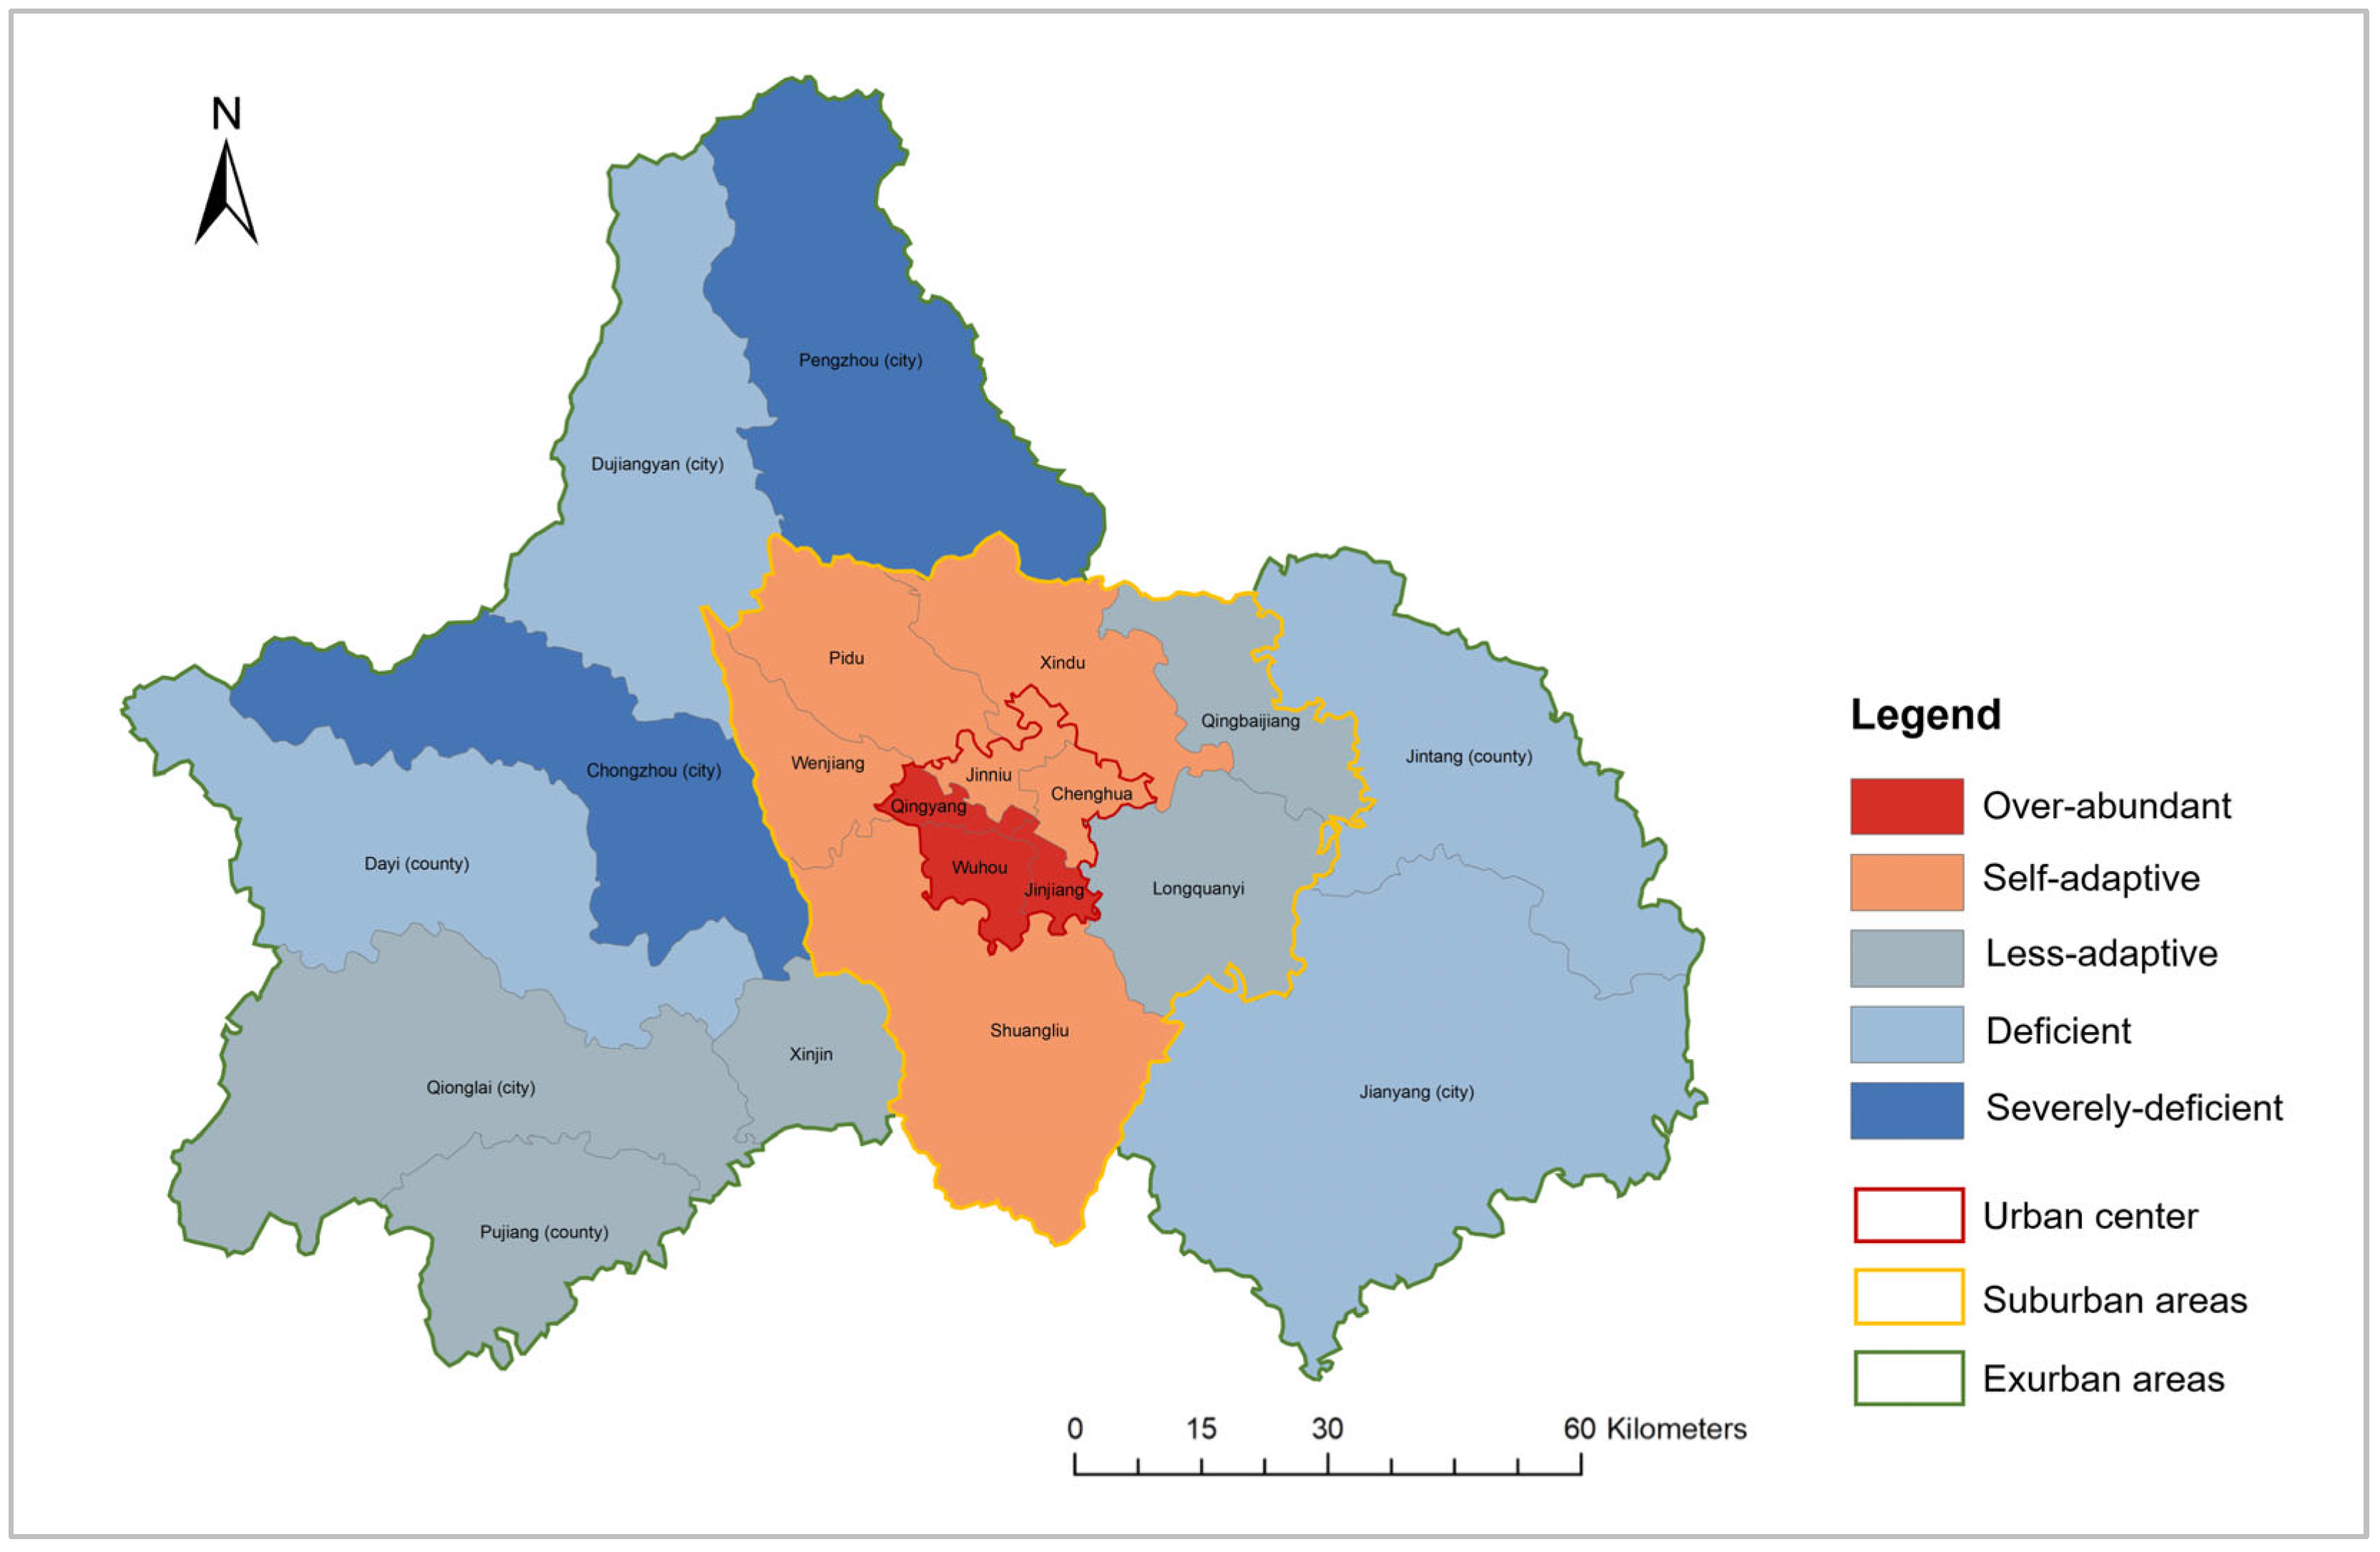
4.2. Spatial Imbalance between Resilience and Disaster Risk

Based on the urban resilience assessment results, combined with the spatial correlation analysis of disaster risk in each county, this section aims to explore whether there is a spatial mismatch of resilience to cope with disaster risk. Figure 17 shows the spatial distribution of disaster risk, which is based on the disaster maps released by the government. Then, the spatial results of the resilience and the disaster risk of different counties were combined, and these combinations were clustered into five groups (Table 6). Consequently, the spatial correlation between resilience and disaster risk is further visualized in Figure 18. The results indicate that only nine counties in Chengdu City have matched resources to cope with and adapt to disasters. Among them, three districts possess an excess of resources, and all of these districts are located in the urban center, where urban resilience is over-resourcefully planned. However, a total of eleven counties lack adequate adaptation resources, rendering them susceptible and vulnerable to disasters, and these counties are situated in suburban and exurban areas. Moreover, four districts are deficient and two are severely deficient, and all of them are located in exurban areas. Most of the counties in exurban areas have low resilience and high risk, so they are deficient or even severely deficient in resources and the capacity to adapt to disasters by themselves. Therefore, the resource allocation and capacity in Chengdu City is uneven in terms of spatial distribution, and there is a clear mismatch and imbalance between urban resilience and disaster risk.
The seriousness of the situation arises from the spatial imbalance in the allocation of urban resilience in Chengdu to disasters. This study attempts to analyze the mechanism of the current spatial imbalance of urban resilience to disaster risk. The first is the way the government allocates resources. China’s urban planning, currently, is still dominated by the central place theory, and the allocation of various public resources is subordinated to population criteria. This has resulted in a concentration of various infrastructure and public facilities, such as schools, hospitals, transportation, etc., in urban centers, which explains why the infrastructure resilience of urban centers is much higher than suburban and exurban areas. The second is about resource allocation by market. The result of marketization is that capital flows to the better-developed area, referring to urban center areas with good infrastructure and built-up environments, which leads to social and economic resources, for instance, employment opportunities, educated people, and innovative talents flowing into this area. This process explains why socioeconomic resilience also clusters in urban centers. Finally, there are also negative externalities from the market. While various resources are concentrated in the city center, without reasonable planning and policy control, the negative externalities of the market could cause environmental issues and ecological degradation due to the market chasing the maximization of private interests.
The correlation analysis using the spatial matching view between disaster risk and urban resilience enhances our understanding of our ability to withstand disasters. Additionally, it offers valuable insights into how urban planning can mitigate the effects of disasters, particularly by optimizing the distribution of public resources. Several policy implications are proposed for planning resilience to reduce the vulnerability of city areas. First, the distribution of adaptation resources should be accompanied by the expansion of city areas that are marginalized and vulnerable, shifting the way public resources are planned and allocated based on population size. Second, the population should be incentivized to disperse into suburban and exurban areas by means of available public transportation infrastructure. Furthermore, a polycentric network and decentralized urban system are promoted instead of a monocentric and hierarchical system (Sharifi, 2019 [38]; Bixler et al., 2020 [100]). Third, the government should balance the decentralization and marketization of planned adaptation resources, such as medical resources, shelters, and road networks. Then, the government should plan and consider the allocation of public adaptation resources to ensure spatial resilience equilibrium with the current level of disaster risk. Fourth, emphasis should be made on the distribution and provision of social resources and the development of institutions, as achieving a fair distribution of constructed resources and built environments is challenging. Finally, strict environmental protection policies and environmental planning tools should be emphasized to offset the negative externalities of marketization and thus improve environmental resilience.

5. Conclusions

This paper presents one of the attempts to integrate urban resilience with the empirical study of China’s urban planning context by developing a theoretically sound and empirically valid measurement framework of urban resilience to disasters. The empirical analysis results show that although Chengdu’s urban resilience has grown in the last two decades, it is largely a government-led approach that lacks attention to ecological and institutional systems. Further analysis of the four subsystems of urban resilience reveals exciting results that the infrastructure and socio-economic resilience all presented a polarized pattern. Furthermore, given spatial distribution, there is a significant spatial differentiation in the distribution of urban resilience in Chengdu, and the spatial resilience allocation to disasters exhibits that the spatial imbalance is serious and noticeable. Based on this empirical case, some solid suggestions and evidence-based implications on resilience planning and sustainable development are concluded, especially for disaster-prone countries. The assessment model of the urban resilience index suggested in this study has the potential to forecast urban resilience evolution and can be extrapolated and generalized to other cities or regions.
This study advances the current empirical research on the urban resilience index, making it possible to operationalize the concept of resilience applied in urban planning. However, the limitation of this study lies in the selection of indicators and the unavailability of data. The indicators selected in this paper cannot fully reflect the characteristics of urban resilience due to the fact that city areas are complex systems, especially those used for representing resilience in the environmental and institutional subsystems. Consequently, future studies could explore more measurable indicators to assess environmental and institutional resilience, and more spatial data are also recommended. Last, many indicators in this study are only counted for municipal units due to the difficulty of obtaining statistical data at the town level and below in China; thus, more community-level resilience evaluation studies are encouraged to capture the characteristics of China’s micro-scale urban resilience in the future.

Author Contributions

Conceptualization, Y.W.; Validation, F.S.; Investigation, Y.W.; Data curation, Y.W.; Writing—original draft, Y.W.; Writing—review & editing, F.S. and B.S.; Supervision, T.K. Funding acquisition—B.S. and Y.W. All authors have read and agreed to the published version of the manuscript.

Funding

This paper is supported by the project of Science & Technology Department of Sichuan Province (Key R&D Project) (Grant No. 2020YFS0309) and (Grant No. 2020YFS0308). This study was also funded by CSC (Chinese Scholarship Council) and MEXT (the Ministry of Education, Culture, Sports, Science and Technology, the Japanese Government) (Grant No. 201806250011).

Data Availability Statement

The original contributions presented in the study are included in the article, further inquiries can be directed to the corresponding author.

Conflicts of Interest

The authors declare no conflicts of interest.

References

  1. United Nations Department of Economic and Social Affairs, Population Division. World Population Prospects 2022: Summary of Results. UN DESA/POP/2022/TR/NO. 3. 2022. Available online: https://www.un.org/development/desa/pd/content/World-Population-Prospects-2022 (accessed on 28 April 2023).
  2. UNISDR. How to Make Cities More Resilient—A Handbook for Mayors and Local Government Leaders; United Nations Office for Disaster Risk Reduction: Geneva, Switzerland, 2017; Available online: https://www.preventionweb.net/quick/11635 (accessed on 6 May 2023).
  3. UNDRR. 2020 Global Natural Disaster Assessment Report; UNDRR: Beijing, China, 2020; Available online: https://www.preventionweb.net/quick/67380 (accessed on 16 December 2022).
  4. The State Council of People Republic of China. China’s Urbanization Rate Hits 64.72% in 2021. 2022. Available online: http://english.www.gov.cn/archive/statistics/202202/22/content_WS62149dc7c6d09c94e48a5517.html (accessed on 2 October 2022).
  5. Cutter, S.L.; Barnes, L.; Berry, M.; Burton, C.; Evans, E.; Tate, E.; Webb, J. A place-based model for understanding community resilience to natural disasters. Glob. Environ. Chang. 2008, 18, 598–606. [Google Scholar] [CrossRef]
  6. Ahern, J. From fail-safe to safe-to-fail: Sustainability and resilience in the new urban world. Landsc. Urban Plan. 2011, 100, 341–343. [Google Scholar] [CrossRef]
  7. Leichenko, R. Climate change and urban resilience. Curr. Opin. Environ. Sustain. 2011, 3, 164–168. [Google Scholar] [CrossRef]
  8. Mehmood, A. Of resilient places: Planning for urban resilience. Eur. Plan. Stud. 2016, 24, 407–419. [Google Scholar] [CrossRef]
  9. Béné, C.; Mehta, L.; McGranahan, G.; Cannon, T.; Gupte, J.; Tanner, T. Resilience as a policy narrative: Potentials and limits in the context of urban planning. Clim. Dev. 2018, 10, 116–133. [Google Scholar] [CrossRef]
  10. Gencer, E.A. Natural disasters, urban vulnerability, and risk management: A theoretical overview. Interplay Between Urban Dev. Vulnerability Risk Manag. A Case Study Istanb. Metrop. Area 2013, 7, 7–43. [Google Scholar] [CrossRef]
  11. Meerow, S.; Newell, J.P.; Stults, M. Defining urban resilience: A review. Landsc. Urban Plan. 2016, 147, 38–49. [Google Scholar] [CrossRef]
  12. Meerow, S.; Newell, J.P. Urban resilience for whom, what, when, where, and why? Urban Geogr. 2019, 40, 309–329. [Google Scholar] [CrossRef]
  13. Ribeiro PJ, G.; Gonçalves LA, P.J. Urban resilience: A conceptual framework. Sustain. Cities Soc. 2019, 50, 101625. [Google Scholar] [CrossRef]
  14. Sharifi, A.; Yamagata, Y. Urban resilience assessment: Multiple dimensions, criteria, and indicators. Urban Resil. A Transform. Approach 2016, 2016, 259–276. [Google Scholar] [CrossRef]
  15. Dianat, H.; Wilkinson, S.; Williams, P.; Khatibi, H. Choosing a holistic urban resilience assessment tool. Int. J. Disaster Risk Reduct. 2022, 71, 102789. [Google Scholar] [CrossRef]
  16. Song, J.; Chang, Z.; Li, W.; Feng, Z.; Wu, J.; Cao, Q.; Liu, J. Resilience-vulnerability balance to urban flooding: A case study in a densely populated coastal city in China. Cities 2019, 95, 102381. [Google Scholar] [CrossRef]
  17. Bertilsson, L.; Wiklund, K.; de Moura Tebaldi, I.; Rezende, O.M.; Veról, A.P.; Miguez, M.G. Urban flood resilience–A multi-criteria index to integrate flood resilience into urban planning. J. Hydrol. 2019, 573, 970–982. [Google Scholar] [CrossRef]
  18. Kawakubo, S.; Yuan, M.; Wang, Q.; Corcoran, J.; Xu, Z.; Peng, J. Dealing with urban floods within a resilience framework regarding disaster stages. Habitat Int. 2023, 136, 102783. [Google Scholar] [CrossRef]
  19. Campanella, T.J. Urban resilience and the recovery of New Orleans. J. Am. Plan. Assoc. 2006, 72, 141–146. [Google Scholar] [CrossRef]
  20. Burton, C.G. A validation of metrics for community resilience to natural hazards and disasters using the recovery from Hurricane Katrina as a case study. Ann. Assoc. Am. Geogr. 2015, 105, 67–86. [Google Scholar] [CrossRef]
  21. Tumini, I.; Villagra-Islas, P.; Herrmann-Lunecke, G. Evaluating reconstruction effects on urban resilience: A comparison between two Chilean tsunami-prone cities. Nat. Hazards 2017, 85, 1363–1392. [Google Scholar] [CrossRef]
  22. Ainuddin, S.; Routray, J.K. Community resilience framework for an earthquake prone area in Baluchistan. Int. J. Disaster Risk Reduct. 2012, 2, 25–36. [Google Scholar] [CrossRef]
  23. Allan, P.; Bryant, M.; Wirsching, C.; Garcia, D.; Teresa Rodriguez, M. The influence of urban morphology on the resilience of cities following an earthquake. J. Urban Des. 2013, 18, 242–262. [Google Scholar] [CrossRef]
  24. Boyd, E.; Juhola, S. Adaptive climate change governance for urban resilience. Urban Stud. 2015, 52, 1234–1264. [Google Scholar] [CrossRef]
  25. Zheng, Y.; Xie, X.-L.; Lin, C.-Z.; Wang, M.; HE, X.-J. Development as adaptation: Framing and measuring urban resilience in Beijing. Adv. Clim. Chang. Res. 2018, 9, 234–242. [Google Scholar] [CrossRef]
  26. Lu, Y.; Li, R.; Mao, X.; Wang, S. Towards comprehensive regional resilience evaluation, resistance, recovery, and creativity: From the perspective of the 2008 Wenchuan Earthquake. Int. J. Disaster Risk Reduct. 2022, 82, 103313. [Google Scholar] [CrossRef]
  27. Choryński, A.; Matczak, P.; Jeran, A.; Witkowski, M. Extreme weather events and small municipalities’ resilience in Wielkopolska Province (Poland). Int. J. Disaster Risk Reduct. 2023, 95, 103928. [Google Scholar] [CrossRef]
  28. Guo, Y. Urban resilience in post-disaster reconstruction: Towards a resilient development in Sichuan, China. Int. J. Disaster Risk Sci. 2012, 3, 45–55. [Google Scholar] [CrossRef]
  29. Xu, J.; Shao, Y. The role of the state in China’s post-disaster reconstruction planning: Implications for resilience. Urban Stud. 2020, 57, 525–545. [Google Scholar] [CrossRef]
  30. Leitner, H.; Sheppard, E.; Webber, S.; Colven, E. Globalizing urban resilience. Urban Geogr. 2018, 39, 1276–1284. [Google Scholar] [CrossRef]
  31. Langemeyer, J.; Madrid-Lopez, C.; Beltran, A.M.; Mendez, G.V. Urban agriculture—A necessary pathway towards urban resilience and global sustainability? Landsc. Urban Plan. 2021, 210, 104055. [Google Scholar] [CrossRef]
  32. Christopherson, S.; Michie, J.; Tyler, P. Regional resilience: Theoretical and empirical perspectives. Camb. J. Reg. Econ. Soc. 2010, 3, 3–10. [Google Scholar] [CrossRef]
  33. Peng, C.; Yuan, M.; Gu, C.; Peng, Z.; Ming, T. A review of the theory and practice of regional resilience. Sustain. Cities Soc. 2017, 29, 86–96. [Google Scholar] [CrossRef]
  34. Huang, X. Do immigrants build regional resilience? An analysis of US regions from 1980 to 2010. Cities 2022, 131, 103891. [Google Scholar] [CrossRef]
  35. DeWit, A.; Shaw, R.; Djalante, R. An integrated approach to sustainable development, National Resilience, and COVID-19 responses: The case of Japan. Int. J. Disaster Risk Reduct. 2020, 51, 101808. [Google Scholar] [CrossRef] [PubMed]
  36. Elkhidir, E.; Mannakkara, S.; Henning, T.F.; Wilkinson, S. A pathway towards resilient cities: National resilience knowledge networks. Cities 2023, 136, 104243. [Google Scholar] [CrossRef]
  37. Cariolet, J.M.; Vuillet, M.; Diab, Y. Mapping urban resilience to disasters–A review. Sustain. Cities Soc. 2019, 51, 101746. [Google Scholar] [CrossRef]
  38. Sharifi, A. Urban form resilience: A meso-scale analysis. Cities 2019, 93, 238–252. [Google Scholar] [CrossRef]
  39. Scott, M. Resilience: A conceptual lens for rural studies? Geogr. Compass 2013, 7, 597–610. [Google Scholar] [CrossRef]
  40. Huang, X.; Li, H.; Zhang, X.; Zhang, X. Land use policy as an instrument of rural resilience–The case of land withdrawal mechanism for rural homesteads in China. Ecol. Indic. 2018, 87, 47–55. [Google Scholar] [CrossRef]
  41. Baldwin, C.; Hamerlinck, J.; McKinlay, A. Institutional support for building resilience within rural communities characterised by multifunctional land use. Land Use Policy 2023, 132, 106808. [Google Scholar] [CrossRef]
  42. Berkes, F.; Ross, H. Community resilience: Toward an integrated approach. Soc. Nat. Resour. 2013, 26, 5–20. [Google Scholar] [CrossRef]
  43. Fang, Y.P.; Zhu, F.B.; Qiu, X.P.; Zhao, S. Effects of natural disasters on livelihood resilience of rural residents in Sichuan. Habitat Int. 2018, 76, 19–28. [Google Scholar] [CrossRef]
  44. Rapaport, C.; Hornik-Lurie, T.; Cohen, O.; Lahad, M.; Leykin, D.; Aharonson-Daniel, L. The relationship between community type and community resilience. Int. J. Disaster Risk Reduct. 2018, 31, 470–477. [Google Scholar] [CrossRef]
  45. Roostaie, S.; Nawari, N.; Kibert, C.J. Sustainability and resilience: A review of definitions, relationships, and their integration into a combined building assessment framework. Build. Environ. 2019, 154, 132–144. [Google Scholar] [CrossRef]
  46. Sherrieb, K.; Norris, F.H.; Galea, S. Measuring capacities for community resilience. Soc. Indic. Res. 2010, 99, 227–247. [Google Scholar] [CrossRef]
  47. Lam, N.S.N.; Reams, M.; Li, K.; Li, C.; Mata, L.P. Measuring community resilience to coastal hazards along the Northern Gulf of Mexico. Nat. Hazards Rev. 2016, 17, 04015013. [Google Scholar] [CrossRef]
  48. Du, M.; Zhang, X.; Wang, Y.; Tao, L.; Li, H. An operationalizing model for measuring urban resilience on land expansion. Habitat Int. 2020, 102, 102206. [Google Scholar] [CrossRef]
  49. Shi, Y.; Zhai, G.; Xu, L.; Zhou, S.; Lu, Y.; Liu, H.; Huang, W. Assessment methods of urban system resilience: From the perspective of complex adaptive system theory. Cities 2021, 112, 103141. [Google Scholar] [CrossRef]
  50. Mehryar, S.; Sasson, I.; Surminski, S. Supporting urban adaptation to climate change: What role can resilience measurement tools play? Urban Clim. 2022, 41, 101047. [Google Scholar] [CrossRef]
  51. Milman, A.; Short, A. Incorporating resilience into sustainability indicators: An example for the urban water sector. Glob. Environ. Chang. 2008, 18, 758–767. [Google Scholar] [CrossRef]
  52. Mai, X.; Zhan, C.; Chan, R.C. The nexus between (re) production of space and economic resilience: An analysis of Chinese cities. Habitat Int. 2021, 109, 102326. [Google Scholar] [CrossRef]
  53. Colding, J. ‘Ecological land-use complementation’ for building resilience in urban ecosystems. Landsc. Urban Plan. 2007, 81, 46–55. [Google Scholar] [CrossRef]
  54. Zhao, R.; Fang, C.; Liu, H.; Liu, X. Evaluating urban ecosystem resilience using the DPSIR framework and the ENA model: A case study of 35 cities in China. Sustain. Cities Soc. 2021, 72, 102997. [Google Scholar] [CrossRef]
  55. Yang, S.; He, S.; Du, J.; Sun, X. Screening of social vulnerability to natural hazards in China. Nat. Hazards 2015, 76, 1–18. [Google Scholar] [CrossRef]
  56. Shi, P.; Xu, W.; Wang, J.A. Natural disaster system in China. In Natural Disasters in China; Springer: Berlin/Heidelberg, Germany, 2016; pp. 1–36. [Google Scholar] [CrossRef]
  57. Abramson, D.B. Ancient and current resilience in the Chengdu Plain: Agropolitan development re-‘revisited’. Urban Stud. 2020, 57, 1372–1397. [Google Scholar] [CrossRef]
  58. Mou, Y.; Luo, Y.; Su, Z.; Wang, J.; Liu, T. Evaluating the dynamic sustainability and resilience of a hybrid urban system: Case of Chengdu, China. J. Clean. Prod. 2021, 291, 125719. [Google Scholar] [CrossRef]
  59. Lu, H.; Zhang, C.; Jiao, L.; Wei, Y.; Zhang, Y. Analysis on the spatial-temporal evolution of urban agglomeration resilience: A case study in Chengdu-Chongqing Urban Agglomeration, China. Int. J. Disaster Risk Reduct. 2022, 79, 103167. [Google Scholar] [CrossRef]
  60. Yang, W. Rural Community Resilience in the Chengdu Plain, China: A Comparative Study of Three Community-Scale Cases. Rethink. Sustain. Pac. Rim Territ. 2020, 237–247. [Google Scholar] [CrossRef]
  61. Song, H.; Lu, B.; Ye, C.; Li, J.; Zhu, Z.; Zheng, L. Fraud vulnerability quantitative assessment of Wuchang rice industrial chain in China based on AHP-EWM and ANN methods. Food Res. Int. 2021, 140, 109805. [Google Scholar] [CrossRef]
  62. Yu, L.; Li, D.; Mao, L.; Zhou, S.; Feng, H. Towards people-centric smart cities: A comparative evaluation of citizens’ sense of gain in pilot cities in China. J. Clean. Prod. 2024, 434, 140027. [Google Scholar] [CrossRef]
  63. Saaty, T.L. A scaling method for priorities in hierarchical structures. J. Math. Psychol. 1977, 15, 234–281. [Google Scholar] [CrossRef]
  64. Zhu, Y.; Tian, D.; Yan, F. Effectiveness of entropy weight method in decision-making. Math. Probl. Eng. 2020, 2020, 3564835. [Google Scholar] [CrossRef]
  65. Fan, R.; Zhang, H.; Gao, Y. The global cooperation in asteroid mining based on AHP, entropy and TOPSIS. Appl. Math. Comput. 2023, 437, 127535. [Google Scholar] [CrossRef]
  66. Bruneau, M.; Chang, S.E.; Eguchi, R.T.; Lee, G.C.; O’Rourke, T.D.; Reinhorn, A.M.; Shinozuka, M.; Tierney, K.; Wallace, W.A.; Von Winterfeldt, D. A framework to quantitatively assess and enhance the seismic resilience of communities. Earthq. Spectra 2003, 19, 733–752. [Google Scholar] [CrossRef]
  67. Norris, F.H.; Stevens, S.P.; Pfefferbaum, B.; Wyche, K.F.; Pfefferbaum, R.L. Community resilience as a metaphor, theory, set of capacities, and strategy for disaster readiness. Am. J. Community Psychol. 2008, 41, 127–150. [Google Scholar] [CrossRef] [PubMed]
  68. Kwok, A.H.; Doyle, E.E.; Becker, J.; Johnston, D.; Paton, D. What is ‘social resilience’? Perspectives of disaster researchers, emergency management practitioners, and policymakers in New Zealand. Int. J. Disaster Risk Reduct. 2016, 19, 197–211. [Google Scholar] [CrossRef]
  69. Cutter, S.L.; Burton, C.G.; Emrich, C.T. Disaster resilience indicators for benchmarking baseline conditions. J. Homel. Secur. Emerg. Manag. 2010, 7, 1–22. [Google Scholar] [CrossRef]
  70. Moghadas, M.; Asadzadeh, A.; Vafeidis, A.; Fekete, A.; Kötter, T. A multi-criteria approach for assessing urban flood resilience in Tehran, Iran. Int. J. Disaster Risk Reduct. 2019, 35, 101069. [Google Scholar] [CrossRef]
  71. Qin, W.; Lin, A.; Fang, J.; Wang, L.; Li, M. Spatial and temporal evolution of community resilience to natural hazards in the coastal areas of China. Nat. Hazards 2017, 89, 331–349. [Google Scholar] [CrossRef]
  72. Scherzer, S.; Lujala, P.; Rød, J.K. A community resilience index for Norway: An adaptation of the Baseline Resilience Indicators for Communities (BRIC). Int. J. Disaster Risk Reduct. 2019, 36, 101107. [Google Scholar] [CrossRef]
  73. Yang, Y.; Guo, H.; Chen, L.; Liu, X.; Gu, M.; Pan, W. Multiattribute decision making for the assessment of disaster resilience in the Three Gorges Reservoir Area. Ecol. Soc. 2020, 25, 5. [Google Scholar] [CrossRef]
  74. Zhao, R.; Fang, C.; Liu, J.; Zhang, L. The evaluation and obstacle analysis of urban resilience from the multidimensional perspective in Chinese cities. Sustain. Cities Soc. 2022, 86, 104160. [Google Scholar] [CrossRef]
  75. Da Silva, J.; Morera, B. City Resilience Framework; Ove Arup and Partners: London, UK, 2014; Available online: https://www.rockefellerfoundation.org/wp-content/uploads/City-Resilience-Framework-2015.pdf (accessed on 5 April 2022).
  76. Baba, K.; Nagata, Y.; Kawakubo, S.; Tanaka, M. A framework and indicators of resilience. Resilient Policies Asian Cities Adapt. Clim. Chang. Nat. Disasters 2020, 2020, 3–45. [Google Scholar] [CrossRef]
  77. Kawakubo, S.; Baba, K.; Tanaka, M.; Murakami, S.; Ikaga, T. Assessment of city resilience using urban indicators in Japanese cities. Resilient Policies Asian Cities Adapt. Clim. Chang. Nat. Disasters 2020, 2020, 47–60. [Google Scholar] [CrossRef]
  78. Liu, X.; Li, S.; Xu, X.; Luo, J. Integrated natural disasters urban resilience evaluation: The case of China. Nat. Hazards 2021, 107, 2105–2122. [Google Scholar] [CrossRef]
  79. Cai, H.; Lam, N.S.; Qiang, Y.; Zou, L.; Correll, R.M.; Mihunov, V. A synthesis of disaster resilience measurement methods and indices. Int. J. Disaster Risk Reduct. 2018, 31, 844–855. [Google Scholar] [CrossRef]
  80. Zhu, S.; Li, D.; Huang, G.; Chhipi-Shrestha, G.; Nahiduzzaman, K.M.; Hewage, K.; Sadiq, R. Enhancing urban flood resilience: A holistic framework incorporating historic worst flood to Yangtze River Delta, China. Int. J. Disaster Risk Reduct. 2021, 61, 102355. [Google Scholar] [CrossRef]
  81. Javadpoor, M.; Sharifi, A.; Roosta, M. An adaptation of the Baseline Resilience Indicators for Communities (BRIC) for assessing resilience of Iranian provinces. Int. J. Disaster Risk Reduct. 2021, 66, 102609. [Google Scholar] [CrossRef]
  82. Gerges, F.; Nassif, H.; Geng, X.; Michael, H.A.; Boufadel, M.C. GIS-based approach for evaluating a community intrinsic resilience index. Nat. Hazards 2022, 111, 1271–1299. [Google Scholar] [CrossRef]
  83. Serdar, M.Z.; Koç, M.; Al-Ghamdi, S.G. Urban transportation networks resilience: Indicators, disturbances, and assessment methods. Sustain. Cities Soc. 2022, 76, 103452. [Google Scholar] [CrossRef]
  84. Buck, K.D.; Dunn, R.J.; Bennett, M.K.; Bousquin, J.J. Influence of cross-scale measures on neighborhood resilience. Nat. Hazards 2022, 119, 1011–1040. [Google Scholar] [CrossRef]
  85. Liu, L.; Lei, Y.; Fath, B.D.; Hubacek, K.; Yao, H.; Liu, W. The spatio-temporal dynamics of urban resilience in China’s capital cities. J. Clean. Prod. 2022, 379, 134400. [Google Scholar] [CrossRef]
  86. Joerin, J.; Shaw, R.; Takeuchi, Y.; Krishnamurthy, R. The adoption of a climate disaster resilience index in Chennai, India. Disasters 2014, 38, 540–561. [Google Scholar] [CrossRef]
  87. Hung, H.C.; Yang, C.Y.; Chien, C.Y.; Liu, Y.C. Building resilience: Mainstreaming community participation into integrated assessment of resilience to climatic hazards in metropolitan land use management. Land Use Policy 2016, 50, 48–58. [Google Scholar] [CrossRef]
  88. Zhang, H.; Yang, J.; Li, L.; Shen, D.; Wei, G.; Dong, S. Measuring the resilience to floods: A comparative analysis of key flood control cities in China. Int. J. Disaster Risk Reduct. 2021, 59, 102248. [Google Scholar] [CrossRef]
  89. Cimellaro, G.P.; Reinhorn, A.M.; Bruneau, M. Framework for analytical quantification of disaster resilience. Eng. Struct. 2010, 32, 3639–3649. [Google Scholar] [CrossRef]
  90. Cutter, S.L.; Ash, K.D.; Emrich, C.T. The geographies of community disaster resilience. Glob. Environ. Chang. 2014, 29, 65–77. [Google Scholar] [CrossRef]
  91. Cardoni, A.; Noori, A.Z.; Greco, R.; Cimellaro, G.P. Resilience assessment at the regional level using census data. Int. J. Disaster Risk Reduct. 2021, 55, 102059. [Google Scholar] [CrossRef]
  92. Wang, Y.; Meng, F.; Liu, H.; Zhang, C.; Fu, G. Assessing catchment scale flood resilience of urban areas using a grid cell based metric. Water Res. 2019, 163, 114852. [Google Scholar] [CrossRef]
  93. Abenayake, C.C.; Mikami, Y.; Matsuda, Y.; Jayasinghe, A. Ecosystem services-based composite indicator for assessing community resilience to floods. Environ. Dev. 2018, 27, 34–46. [Google Scholar] [CrossRef]
  94. Anelli, D.; Tajani, F.; Ranieri, R. Urban resilience against natural disasters: Mapping the risk with an innovative indicators-based assessment approach. J. Clean. Prod. 2022, 371, 133496. [Google Scholar] [CrossRef]
  95. Ji, T.; Wei, H.H.; Sim, T.; Yang, L.E.; Scheffran, J. Disaggregated validation of disaster-resilience indicators using household survey data: A case study of Hong Kong. Sustain. Cities Soc. 2021, 67, 102726. [Google Scholar] [CrossRef]
  96. Cutter, S.L. The landscape of disaster resilience indicators in the USA. Nat. Hazards 2016, 80, 741–758. [Google Scholar] [CrossRef]
  97. Casadio Tarabusi, E.; Guarini, G. An unbalance adjustment method for development indicators. Soc. Indic. Res. 2013, 112, 19–45. [Google Scholar] [CrossRef]
  98. McPhearson, T.; Andersson, E.; Elmqvist, T.; Frantzeskaki, N. Resilience of and through urban ecosystem services. Ecosyst. Serv. 2015, 12, 152–156. [Google Scholar] [CrossRef]
  99. Wu, X.; Zhang, J.; Geng, X.; Wang, T.; Wang, K.; Liu, S. Increasing green infrastructure-based ecological resilience in urban systems: A perspective from locating ecological and disturbance sources in a resource-based city. Sustain. Cities Soc. 2020, 61, 102354. [Google Scholar] [CrossRef]
  100. Bixler, R.P.; Lieberknecht, K.; Atshan, S.; Zutz, C.P.; Richter, S.M.; Belaire, J.A. Reframing urban governance for resilience implementation: The role of network closure and other insights from a network approach. Cities 2020, 103, 102726. [Google Scholar] [CrossRef]
Figure 1. The location and study area of Chengdu City.
Land 13 00506 g001
Figure 2. The land use patterns of Chengdu.
Land 13 00506 g002
Figure 3. PRISMA flow diagram.
Land 13 00506 g003
Figure 4. Theoretical framework of urban resilience to disasters.
Land 13 00506 g004
Figure 5. URI assessment results in Chengdu City from 2000 to 2020.
Land 13 00506 g005
Figure 6. InfR assessment results in Chengdu City.
Land 13 00506 g006
Figure 7. ER assessment results in Chengdu City.
Land 13 00506 g007
Figure 8. SER assessment results in Chengdu City.
Land 13 00506 g008
Figure 9. InsR assessment results in Chengdu City.
Land 13 00506 g009
Figure 10. Spatial distribution of urban resilience in Chengdu City.
Land 13 00506 g010
Figure 11. Spatial distribution of InfR in Chengdu City.
Land 13 00506 g011
Figure 12. Spatial distribution of ER in Chengdu City.
Land 13 00506 g012
Figure 13. Spatial distribution of SER in Chengdu City.
Land 13 00506 g013
Figure 14. Spatial distribution of InsR in Chengdu City.
Land 13 00506 g014
Figure 15. Spatial agglomeration of urban resilience in Chengdu City.
Land 13 00506 g015
Figure 16. The framework of urban resilience planning based on four dimensions.
Land 13 00506 g016
Figure 17. Spatial distribution of disaster risk in Chengdu City.
Land 13 00506 g017
Figure 18. Spatial correlation between resilience and disaster risk in Chengdu City.
Land 13 00506 g018
Table 1. AHP scale.
Table 1. AHP scale.
The Level of ImportanceNumerical ValueReciprocal Value
Extreme importance 9 1/9 (0.111)
Very strong to extreme importance 8 1/8 (0.125)
Very strong importance 7 1/7 (0.143)
Strong to very strong importance 6 1/6 (0.167)
Strong importance 5 1/5 (0.200)
Moderate to strong importance 4 1/4 (0.250)
Moderate importance 3 1/3 (0.333)
Equal to moderate importance21/2 (0.500)
Equal importance 1 1 (1.000)
Table 2. R I value corresponds to the matrix order.
Order123456789101112
R I 000.580.891.121.261.321.411.461.491.521.54
Table 3. Measurements composing the urban resilience index.
DimensionIndicatorMeasurementWeightReferences
D1
Infrastructure resilience
(0.311)
I1 Housing capacityM1 Housing area per capita (+)0.030 Norris et al., 2008 [67]; Cutter et al., 2008 [5]; Cutter et al., 2010 [69]; Scherzer et al., 2019 [72]; Yang et al., 2020 [73]; Zhao et al., 2022 [74]
I2 Evacuation capacityM2 Urban road area per capita (+)0.017 Cutter et al., 2010 [69]; ARUP 2014 [75]; Burton 2015 [20]; Baba et al., 2020 [76]; Kawakubo et al., 2020 [77]; Liu et al., 2021 [78]
M3 Length of refuge road per capita (+)0.024
I3 Transportation accessM4 Number of public vehicles per 10,000 persons (+)0.023 Burton 2015 [20]; Cai et al., 2018 [79]; Yang et al., 2020 [73]; Zhu et al., 2021 [80]; Liu et al., 2021 [78]; Javadpoor et al., 2021 [81]; Gerges et al., 2022 [82]; Serdar et al., 2022 [83]; Buck et al., 2022 [84]; Liu et al., 2022 [85]; Zhao et al., 2022 [74]
M5 Number of private cars per 10,000 persons (+)0.018
I4 Public utilitiesM6 Electricity and water supply coverage (+)0.021 Joerin et al., 2014 [86]; Hung et al., 2016 [87]; Scherzer et al., 2019 [72]; Zhang et al., 2021 [88]; Liu et al., 2021 [78]; Zhao et al., 2022 [74]
I5 Shelter capacityM7 Public space area per capita (+)0.020 Burton 2015 [20]; Hung et al., 2016 [87]; Kawakubo et al., 2020 [77]; Cai et al., 2018 [79]; Moghadas et al., 2019 [70]; Yang et al., 2020 [73]; Javadpoor et al., 2021 [81]; Buck et al., 2022 [84]
M8 Number of schools and parks per 10,000 persons (+)0.044
I6 Medical capacityM9 Number of hospital beds per 10,000 persons (+)0.037 Cimellaro et al., 2010 [89]; Cutter et al., 2014 [90]; Hung et al., 2016 [87]; Cai et al., 2018 [79]; Baba et al., 2020 [76]; Yang et al., 2020 [73]; Cardoni et al., 2021 [91]; Javadpoor et al., 2021 [81]; Gerges et al., 2022 [82]
I7 Communication capacityM10 Number of mobile phones per 10,000 persons (+)0.027 Cutter et al., 2010 [69]; ARUP 2014 [75]; Burton 2015 [20]; Yang et al., 2020 [73]; Javadpoor et al., 2021 [81]; Cardoni et al., 2021 [91]; Buck et al., 2022 [84]; Liu et al., 2022 [85]; Zhao et al., 2022 [74]
M11 Number of Internet users per 10,000 persons (+)0.021
I8 Flood resistance capacityM12 Density of drainage (+)0.033 Wang et al., 2019 [92]; Zhang et al., 2021 [88]; Zhu et al., 2021 [80]; Liu et al., 2022 [85]; Yu et al., 2023 [18]
D2 Environmental resilience
(0.191)
I9 Natural buffersM13 Proportion of natural land in built-up area (+)0.036 Cutter et al., 2014 [90]; Kawakubo et al., 2020 [77]; Abenayake et al., 2018 [93]; Moghadas et al., 2019 [70]; Scherzer et al., 2019 [72]; Buck et al., 2022 [84]; Yu et al., 2023 [18]
M14 Proportion of water and woodland area (+)0.028
I10 Urban ecosystem M15 Green area rate of built-up area (+)0.034 Joerin et al., 2014 [86]; ARUP 2014 [75]; Abenayake et al., 2018 [93]; Zhang et al., 2021 [88]; Yang et al., 2020 [73]; Zhu et al., 2021 [80]; Liu et al., 2022 [85]; Zhao et al., 2022 [74]
I11 Ecological capacityM16 The population density (−)0.040 Qin et al., 2017 [71]; Zhang et al., 2021 [88]; Yang et al., 2020 [73]; Zhu et al., 2021 [80]; Cardoni et al., 2021 [91]; Zhao et al., 2022 [74]
I12 Food securityM17 Cultivated land area per capita (+)0.055 Cutter et al., 2014 [90]; Burton 2015 [20]; Hung et al., 2016 [87]; Scherzer et al., 2019 [72]; Yang et al., 2020 [73]; Javadpoor et al., 2021 [81]; Anelli et al., 2022 [94]
D3
Socio-economic resilience
(0.306)
I13 Independent populationM18 Percentage of population aged 15–64 (+)0.033 Cutter et al., 2008 [5]; Hung et al., 2016 [87]; Qin et al., 2017 [71]; Moghadas et al., 2019 [70]; Yang et al., 2020 [73]; Ji et al., 2021 [95]; Javadpoor et al., 2021 [81]; Anelli et al., 2022 [94]; Buck et al., 2022 [84]
I14 EmploymentM19 Unemployment rate (−)0.029 Cutter et al., 2010 [69]; Qin et al., 2017 [71]; Moghadas et al., 2019 [70]; Yang et al., 2020 [73]; Ji et al., 2021 [95]; Cardoni et al., 2021 [91]; Liu et al., 2022 [85]; Zhao et al., 2022 [74]
I15 Household budget capacityM20 Average saving rate (= household savings/income) (+)0.023 Cutter et al., 2008 [5]; Hung et al., 2016 [87]; Baba et al., 2020 [76]; Yang et al., 2020 [73]; Gerges et al., 2022 [82]; Anelli et al., 2022 [94]
I16 Education levelM21 Percent population educated with high school (+)0.033 Cutter et al., 2008 [5]; Hung et al., 2016 [87]; Qin et al., 2017 [71]; Ji et al., 2021 [95]; Zhang et al., 2021 [88]; Cardoni et al., 2021 [91]; Gerges et al., 2022 [82]
I17 Education accessM22 Number of teachers per 10,000 persons (+)0.025 Yang et al., 2020 [73]; Liu, X. et al., 2021 [85]; Lu et al., 2022 [26]
I18 Health accessM23 Number of doctors per 10,000 persons (+)0.058 Norris et al., 2008 [67]; Cutter et al., 2010 [69]; Baba et al., 2020 [76]; Yang et al., 2020 [73]; Liu, X. et al., 2021 [78]; Javadpoor et al., 2021 [81]; Gerges et al., 2022 [82]; Buck et al., 2022 [84]; Zhao et al., 2022 [74]
I19 Social capitalM24 Number of NPOs and NGOs per 10,000 persons (+)0.036 Cutter et al., 2010 [69]; Sherrieb et al., 2010 [46]; Burton 2015 [20]; Yang et al., 2020 [73]; Gerges et al., 2022 [82]; Buck et al., 2022 [84]
M25 Percent population employed in social organization (+)0.030
I20 Social innovationM26 Percent population employed in creative class occupations (+) 0.041 Norris et al., 2008 [67]; Sherrieb et al., 2010 [46]; Burton 2015 [20]; Zheng et al., 2018 [25]; Scherzer et al., 2019 [72]
D4
Institutional resilience
(0.192)
I21 Risk management capacityM27 Urban risk management capacity index a (+)0.039 Zheng et al., 2018 [25]; Scherzer et al., 2019 [72]; Baba et al., 2020 [76]; Javadpoor et al., 2021 [81]
I22 Social insuranceM28 Social Insurance Index b (+)0.044 Cutter et al., 2010 [69]; Zheng et al., 2018 [25]; Yang et al., 2020 [73]; Zhu et al., 2021 [80]; Liu et al., 2021 [78]; Gerges et al., 2022 [82]; Buck et al., 2022 [84]
I23 Disaster mitigation communityM29 Communities covered by disaster prevention and mitigation plan (+)0.079 Cutter et al., 2010 [69]; Ainuddin & Routray 2012 [22]; Cutter 2016 [96]; Zhang et al., 2021 [88]; Javadpoor et al., 2021 [81]
I24 FundingM30 Percent municipal expenditures for public safety (+)0.031 Cutter 2016 [96]; Zheng et al., 2018 [25]; Scherzer et al., 2019 [72]; Zhang et al., 2021 [88]; Zhao et al., 2022 [74]
Note: a This measurement is a composite index that combines the number of casualties in traffic accidents and fire accidents; b this measurement is a composite index that combines national insurance systems, such as health insurance and unemployment insurance.
Table 4. Regression results of validation.
VariablesRegression CoefficientStandard Errorpadj. R2
Constant0.72300.03510.006 ***0.166
Resilience−1.07470.01880.020 **
Population0.34700.32200.132
*** p < 0.01, ** p < 0.05.
Table 5. The Moran’s index and p values of the urban resilience.
DimensionMoran’s Ip-ValueZ-Score
URI0.33550.0172.381
InfR0.43720.0032.927
ER0.58860.0013.779
SER0.31260.0052.792
InsR0.39550.0242.255
Table 6. Clusters of combinations of resilience and disaster risk.
Scoring and Classification
ResilienceVery high = 5High = 4Intermediate = 3Low = 2Very low = 1
Disaster risk Very high = 5High = 4Intermediate = 3Low = 2Very low = 1
Resilience to risk3, 41, 20, −1−2−3
Over-abundantSelf-adaptiveLess-adaptiveDeficientSeverely-deficient
Disclaimer/Publisher’s Note: The statements, opinions and data contained in all publications are solely those of the individual author(s) and contributor(s) and not of MDPI and/or the editor(s). MDPI and/or the editor(s) disclaim responsibility for any injury to people or property resulting from any ideas, methods, instructions or products referred to in the content.

