Abstract
The implementation of the Grain for Green Project has increased vegetation coverage and provided suitable habitats and food resources for soil fauna, thereby promoting the development of soil faunal communities. Studying seasonal variations in soil fauna communities in different vegetation areas can improve our understanding of the mechanisms that drive soil fauna recovery. We selected five typical artificially restored vegetation habitats, including Populus simonii (POS), Pinus tabulaeformis (PIT), Caragana korshinskii (CAK), Stipa bungeana (STB), and Medicago sativa (MES), and one farmland (Zea mays, FAL) habitat on the Loess Plateau. In this study, soil fauna communities and environmental factors were investigated during spring (May), summer (August), and autumn (November). Among the habitats, the STB habitat had the largest seasonal variation in soil faunal density (from 1173 ind·m−2 in May to 10,743 ind·m−2 in August), and the FAL habitat had the smallest (from 2827 ind·m−2 in August to 5550 ind·m−2 in November). Among the restored vegetation habitats, Acarina (44.89–88.56%) had the highest relative abundance of all taxa. The redundancy analysis (RDA) results showed that among the factors driving seasonal variation in soil animal communities, temperature (47.41%) was the most important, followed by precipitation (22.60%). In addition, the dominant groups, Acarina and Collembola, played an influential role in seasonal variations in soil faunal density. Temperature mainly determined the seasonal variations in soil faunal communities. Seasonal factors should be considered when conducting soil fauna research, as they contribute to biodiversity conservation and regional ecological management in the Loess Plateau.
1. Introduction
Soil fauna are important components of soil communities and contribute substantially to the regulation of soil ecosystem structure and function [1,2]. Soil macro- and mesofauna can promote litter decomposition by breaking and feeding on litter, thus affecting soil carbon and nutrient cycling (e.g., Diplopoda, Isopoda, and Amphipoda) [3,4]. Some soil macrofauna (e.g., Formicidea and Gryllotalpidae) can also modify soil pores and aggregate structures through their own activities, thereby affecting soil structure, soil water infiltration, and soil erosion processes [5,6]. Soil meso- and microfauna can affect the growth of aboveground plants by feeding on plant roots (e.g., Collembola, and Nematoda) [7,8]. Some predatory soil fauna change the species composition of soil animals by preying on other soil animals, thus indirectly affecting ecosystem processes, such as litter decomposition and nutrient cycling [9].
Soil animal communities are affected by both aboveground and belowground biotic and abiotic factors. Changes in soil physical and chemical properties (e.g., soil organic matter, soil pH, soil porosity, SWC, and nutrient content) can alter the microhabitats of soil fauna, thus affecting soil faunal community composition [10,11]. Changes in climatic conditions, such as temperature and precipitation, can also directly affect the density and composition of soil animal communities by altering the soil microclimate or indirectly by changing the availability of food and resources [12,13]. However, the sensitivity of soil macro- and mesofauna communities to changes in environmental factors (e.g., soil properties and climate) is different. Kardol et al. found that the different responses of different soil microarthropod taxa to climate change (e.g., increased CO2 concentration, increased temperature, and altered precipitation) resulted in differences in community composition [13]. Soil fauna show clear seasonal dynamics (temporal dynamics) [14,15]. In particular, in regions where seasonal changes in hydrothermal conditions are evident, the soil arthropod community changes dramatically during different seasons. In addition, seasonal variation in aboveground plant communities (different species compositions and resource inputs in different seasons) may result in seasonal variation in soil faunal communities [16,17]. The results of Wu et al. showed that soil macrofauna were more sensitive to changes in habitat and vegetation, whereas soil mesofauna were more sensitive to seasonal changes [18].
The Loess Plateau, located in north-central China, experiences serious soil erosion and has an extremely fragile ecological environment [19]. Since the implementation of the Grain for Green Project, vegetation coverage of the Loess Plateau has increased from 6.5% in the 1970s to 63% in 2018. The restoration of vegetation on the Loess Plateau has yielded rich food resources (e.g., litter and roots) and suitable habitats for soil animals, thus promoting the development of soil animal communities [20,21]. Although the ecological effects of vegetation restoration have been studied extensively, few studies have focused on the community characteristics (including soil faunal community composition, density, taxa richness, and diversity) of soil fauna as an important component of the soil food web. Considering the important role of soil fauna in soil nutrient cycling, biodiversity, and community stability, revealing the characteristics and changes in soil animal communities under different vegetation restoration conditions is important for evaluating the ecological effects of restoring farmland to forests. Clarifying the main environmental factors affecting changes in soil animal communities will aid in understanding soil ecological processes after vegetation restoration in the region and provide a scientific basis for the sustainable development of vegetation construction on the Loess Plateau.
Therefore, this study aimed to (1) investigate the soil faunal density, diversity, and community composition of restored vegetation and the community response to seasonal changes after revegetation and (2) determine the main environmental factors driving the seasonal changes in soil animal communities after vegetation restoration on the Loess Plateau.
2. Materials and Methods
2.1. Study Sites and Selection of Habitats
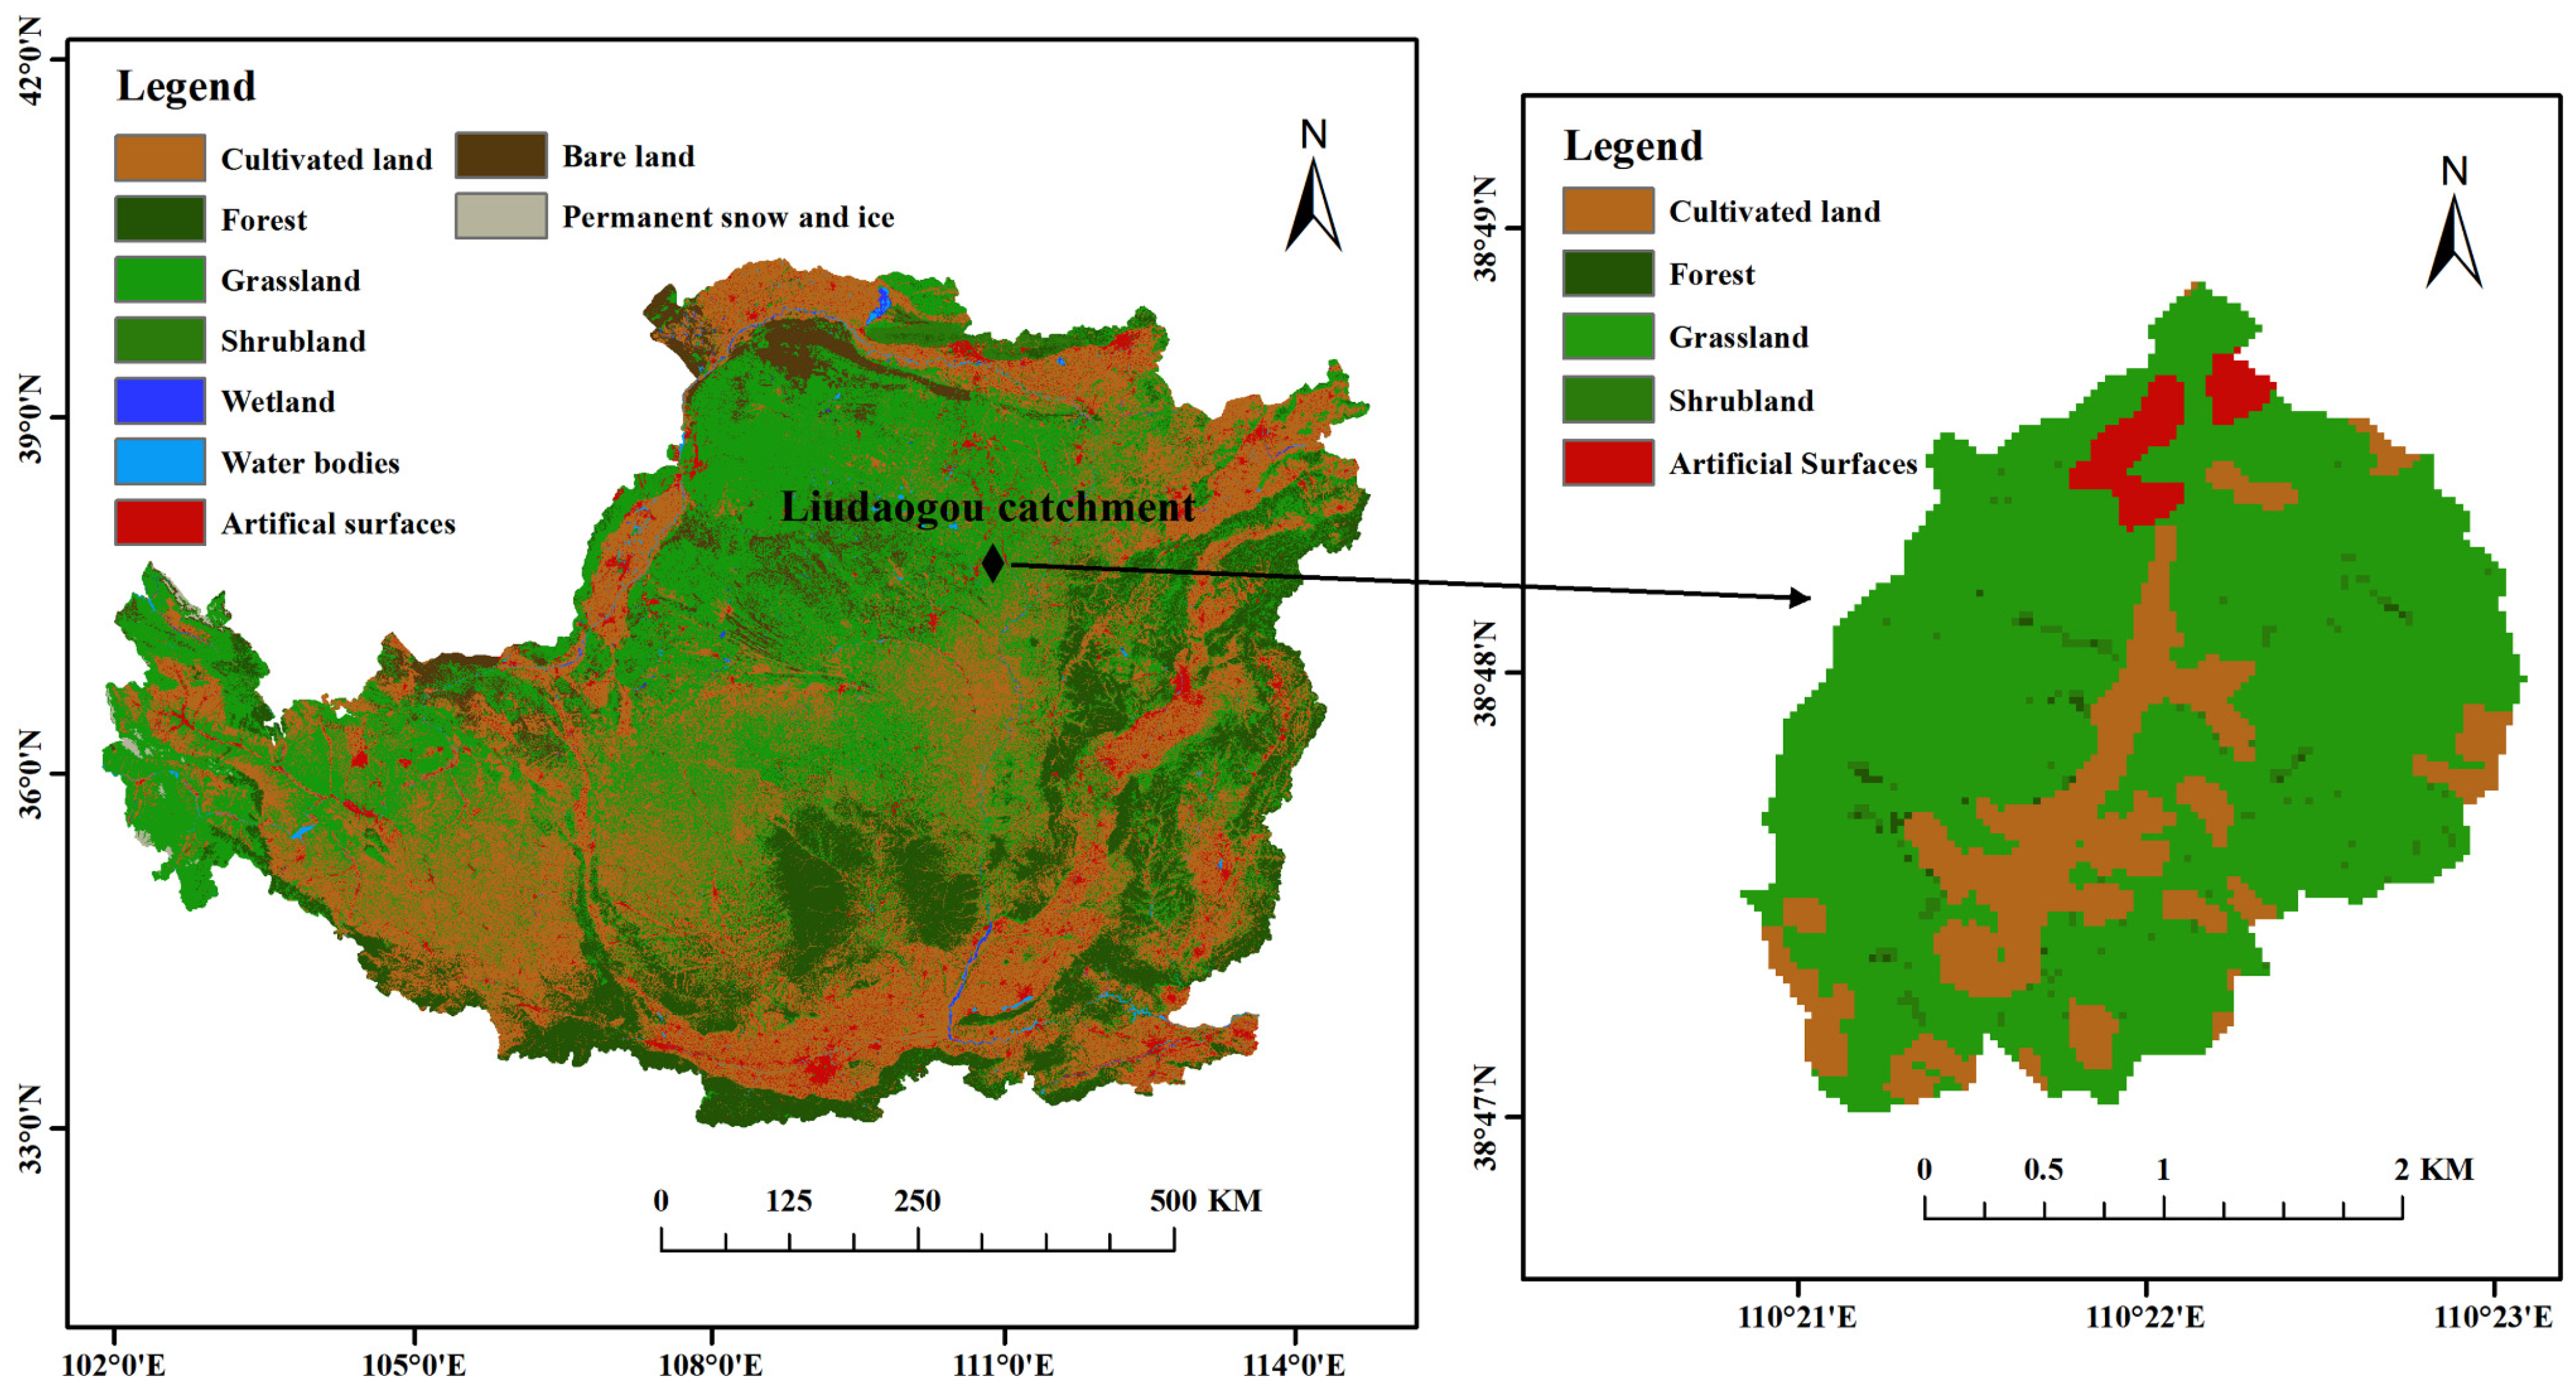
The study area is located in the Liudaogou catchment (110°21′–110°23′ E, 38°46′–38°51′ N), a typical ecological restoration area in the northern Loess Plateau, in Shenmu City, Shaanxi Province, China (Figure 1). The Liudaogou catchment is in the water–wind erosion intersection area of the Loess Plateau, with a transition from water erosion to wind erosion. The basin has a temperate, semi-arid, continental monsoon climate. The annual average temperature is 8.4 °C, and the annual average precipitation is 408.5 mm, with the precipitation mainly concentrated in June–September and a potential evapotranspiration of 785.4 mm. The frost-free period is 169 days [22]. The main soil type in the basin is arid low-calcium soil originating from low-fertility loess [23]. The main habitat types in the basin are (1) woodland: Populus simonii (POS) and Pinus tabulaeformis (PIT); (2) shrubland: Caragana korshinskii (CAK); (3) grassland: Stipa bungeana (STB) and Medicago sativa (MES); and (4) farmland: Zea mays (FAL) [22]. After a field investigation in the Liudaogou catchment, five typical artificial restoration habitat types (POS, PIT, CAK, STB, and MES) and one farmland (Zea mays, FAL) habitat were selected. Each habitat area is more than 6 ha. The habitat information is shown in Table 1.
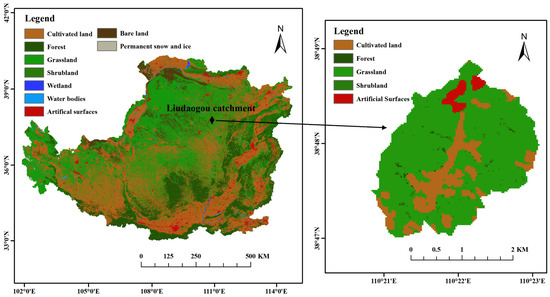
Figure 1.
Location of the study site in Liudaogou catchment, Loess Plateau region, China.

Table 1.
Overview of six habitats.
2.2. Collection and Processing of Samples
Three sample plots (10 × 10 m) were established for each habitat type, and the distance between each sample plot was greater than 50 m. Five sampling points were selected in each sample plot, and the five samples were mixed. Faunal soil samples were collected at each sampling point. Combined with the standard tropical soil biology and fertility (TSBF) method [24], an iron cuboid sampler (31.62 cm × 31.62 cm, 30 cm deep) was used to sample soil fauna. The excavated soil column was placed in a stainless-steel tray and the large soil block was gently broken to manually select large soil animals [22]. The macrofauna were collected manually and immediately stored in 75% alcohol. Three ring knives (5 cm high) with a volume of 100 cm3 were taken from each layer, and a total of 15 samples were obtained from each layer at each sample point. One soil sample was taken into a cloth bag according to the quadrature method after homogeneous mixing, and then, the cloth bag was put into an insulated box and brought back indoors for the isolation and identification of the mesofauna [25]. The mesofauna were collected using a modified Tullgren’s funnel method [26]. All soil fauna samples were identified and counted under a binocular anatomical microscope or conventional optical microscope [27]. Soil fauna were identified to the family or order level. In the data analysis, in order to unify the classification criteria, we use the order level for statistical analysis. The data from the four layers (0–5, 5–10, 10–20, and 20–30 cm) of each sample plot were combined. Three soil and soil fauna samples were collected in May, August, and November 2019.
Simultaneously, undisturbed soil was collected using a ring knife to determine the soil bulk density (SBD). The soil water content (SWC) was determined by drying. The collected soil samples were brought back to the laboratory, air-dried, ground, and sieved (1 and 0.25 mm) to determine the soil’s physical and chemical properties [22]. Soil samples were passed through a 1 mm sieve and used to determine soil ammonium nitrogen (NH4+–N, AN), nitrate nitrogen (NO3−–N, NN), Olsen phosphorus (OP), and available potassium (AK) [28]. Soil samples were passed through a 0.25 mm sieve and used to determine soil organic carbon (OC), total nitrogen (TN), and total phosphorus (TP) [29]. Soil pH was determined at a water–soil ratio of 1:2.5 [30]. The precipitation (AP) and temperature (AT) data were obtained from meteorological stations.
2.3. Statistical Analysis
The Shannon–Wiener diversity index (H), Margalef richness index (D), Simpson dominance index (C), and Pielou evenness index (J) were used to quantify the diversity of soil faunal communities [25].
Mixed effects models were used to evaluate the effects of habitat (POS, PIT, CAK, STB, MES, and FAL), season (May, August, and November), and their interactions on the soil faunal communities (H, D, C, J, density, and number of groups). In the models, nested plots served as random effects. Statistical analyses were performed using SPSS version 22.0.
Principal component analysis (PCA) was performed using Canoco 5.0 to evaluate the effects of different habitats (POS, PIT, CAK, STB, MES, and FAL) and seasons (May, August, and November) on the composition of the soil faunal community. Before PCA, log (X + 1) conversion was performed on the density (ind·m−2) of each soil faunal taxon in each plot. The comprehensive score was calculated using the factor scores of the first two axes of PCA, and the comprehensive score was further analyzed using a one-way ANOVA to evaluate the effects of habitat or season on community structure in IBM SPSS 26.0. Redundancy analysis (RDA) was used to analyze the relationship between soil faunal communities and environmental variables (SBD, SWC, pH, OC, TN, TP, NN, AN, OP, AT, and AP). Species variables had occasional zero values; thus, log (x + 1) transformations were performed [22]. Canoco 5.0 was used for the analysis.
3. Results
3.1. Seasonal Variation in Soil Faunal Density and Diversity
Seasonal variations in the density and richness of soil fauna in different habitats are shown in Table 2. In general, the average densities of soil fauna in the five typical artificial restoration vegetation habitats (POS, PIT, CAK, STB, and MES) were 4314, 4589, 5588, 4814, and 5820 ind·m−2, respectively, which were higher than that of the FAL habitat (3811 ind·m−2). The average densities of soil fauna in May, August, and November were 2202, 7082, and 5184 ind·m−2, respectively. The seasonal change in soil fauna density was greatest in STB habitats, ranging from 1173 ind·m−2 in May to 10,743 ind·m−2 in August, and least in FAL habitats, ranging from 2827 ind·m−2 in August to 5550 ind·m−2 in November. The total number of soil fauna groups in the six habitats was highest in August (Table 2).
Table 2.
Soil faunal density (mean individuals m−2 ± SE) as influenced by the different habitats and sampling time.
The diversity of the soil faunal communities (community index) in the six habitats differed significantly in the different seasons (p < 0.05), as shown in Figure 2 and Table 3. In the POS, CAK, STB, and MES habitats, the diversity index (H) was highest in May. In contrast, in the FAL habitats, the diversity index (H) was highest in August. The evenness index (J) showed the same pattern, being significantly (p < 0.05) higher in May (0.48–0.68) than in the other months (0.27–0.54) in the POS, PIT, CAK, STB, and MES habitats, with the highest value of 0.5434 obtained in August in the FAL habitat. The richness index (D) was highest in August for all habitats except the STB habitat. Significant (p < 0.05) differences in soil faunal community diversity were also observed between the habitats during the same season (Figure 2).
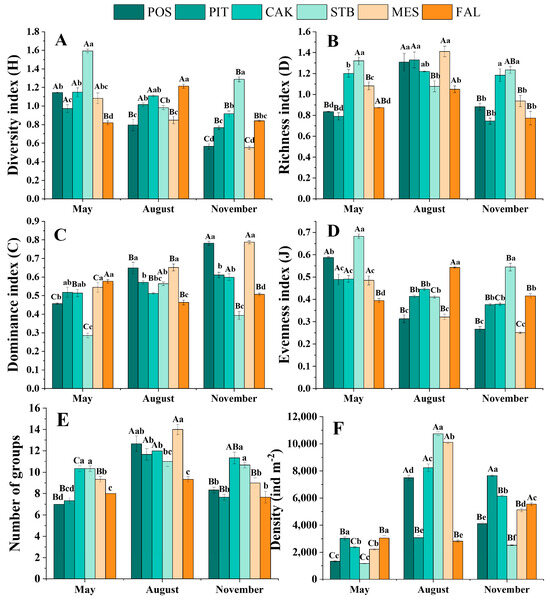
Figure 2.
Season variations of diversity index (A), richness index (B), dominance index (C), evenness index (D), number of groups (E), and density (F) for the soil faunal community (mean ± SE). Capital letters on the bars indicate significant temporal differences within habitats at the p < 0.05 level, while lowercase letters on the bars indicate spatial differences within seasons at the p < 0.05 level (Tukey test). POS, Populus simonii habitat; PIT, Pinus tabulaeformis habitat; CAK, Caragana korshinskii habitat; STB, Stipa bungeana habitat; MES, Medicago sativa habitat; FAL, farmland habitat.
Table 3.
Mixed model results for the effects of habitat, season, and their interaction on the soil faunal community.
3.2. Seasonal Variation in Soil Faunal Community Composition
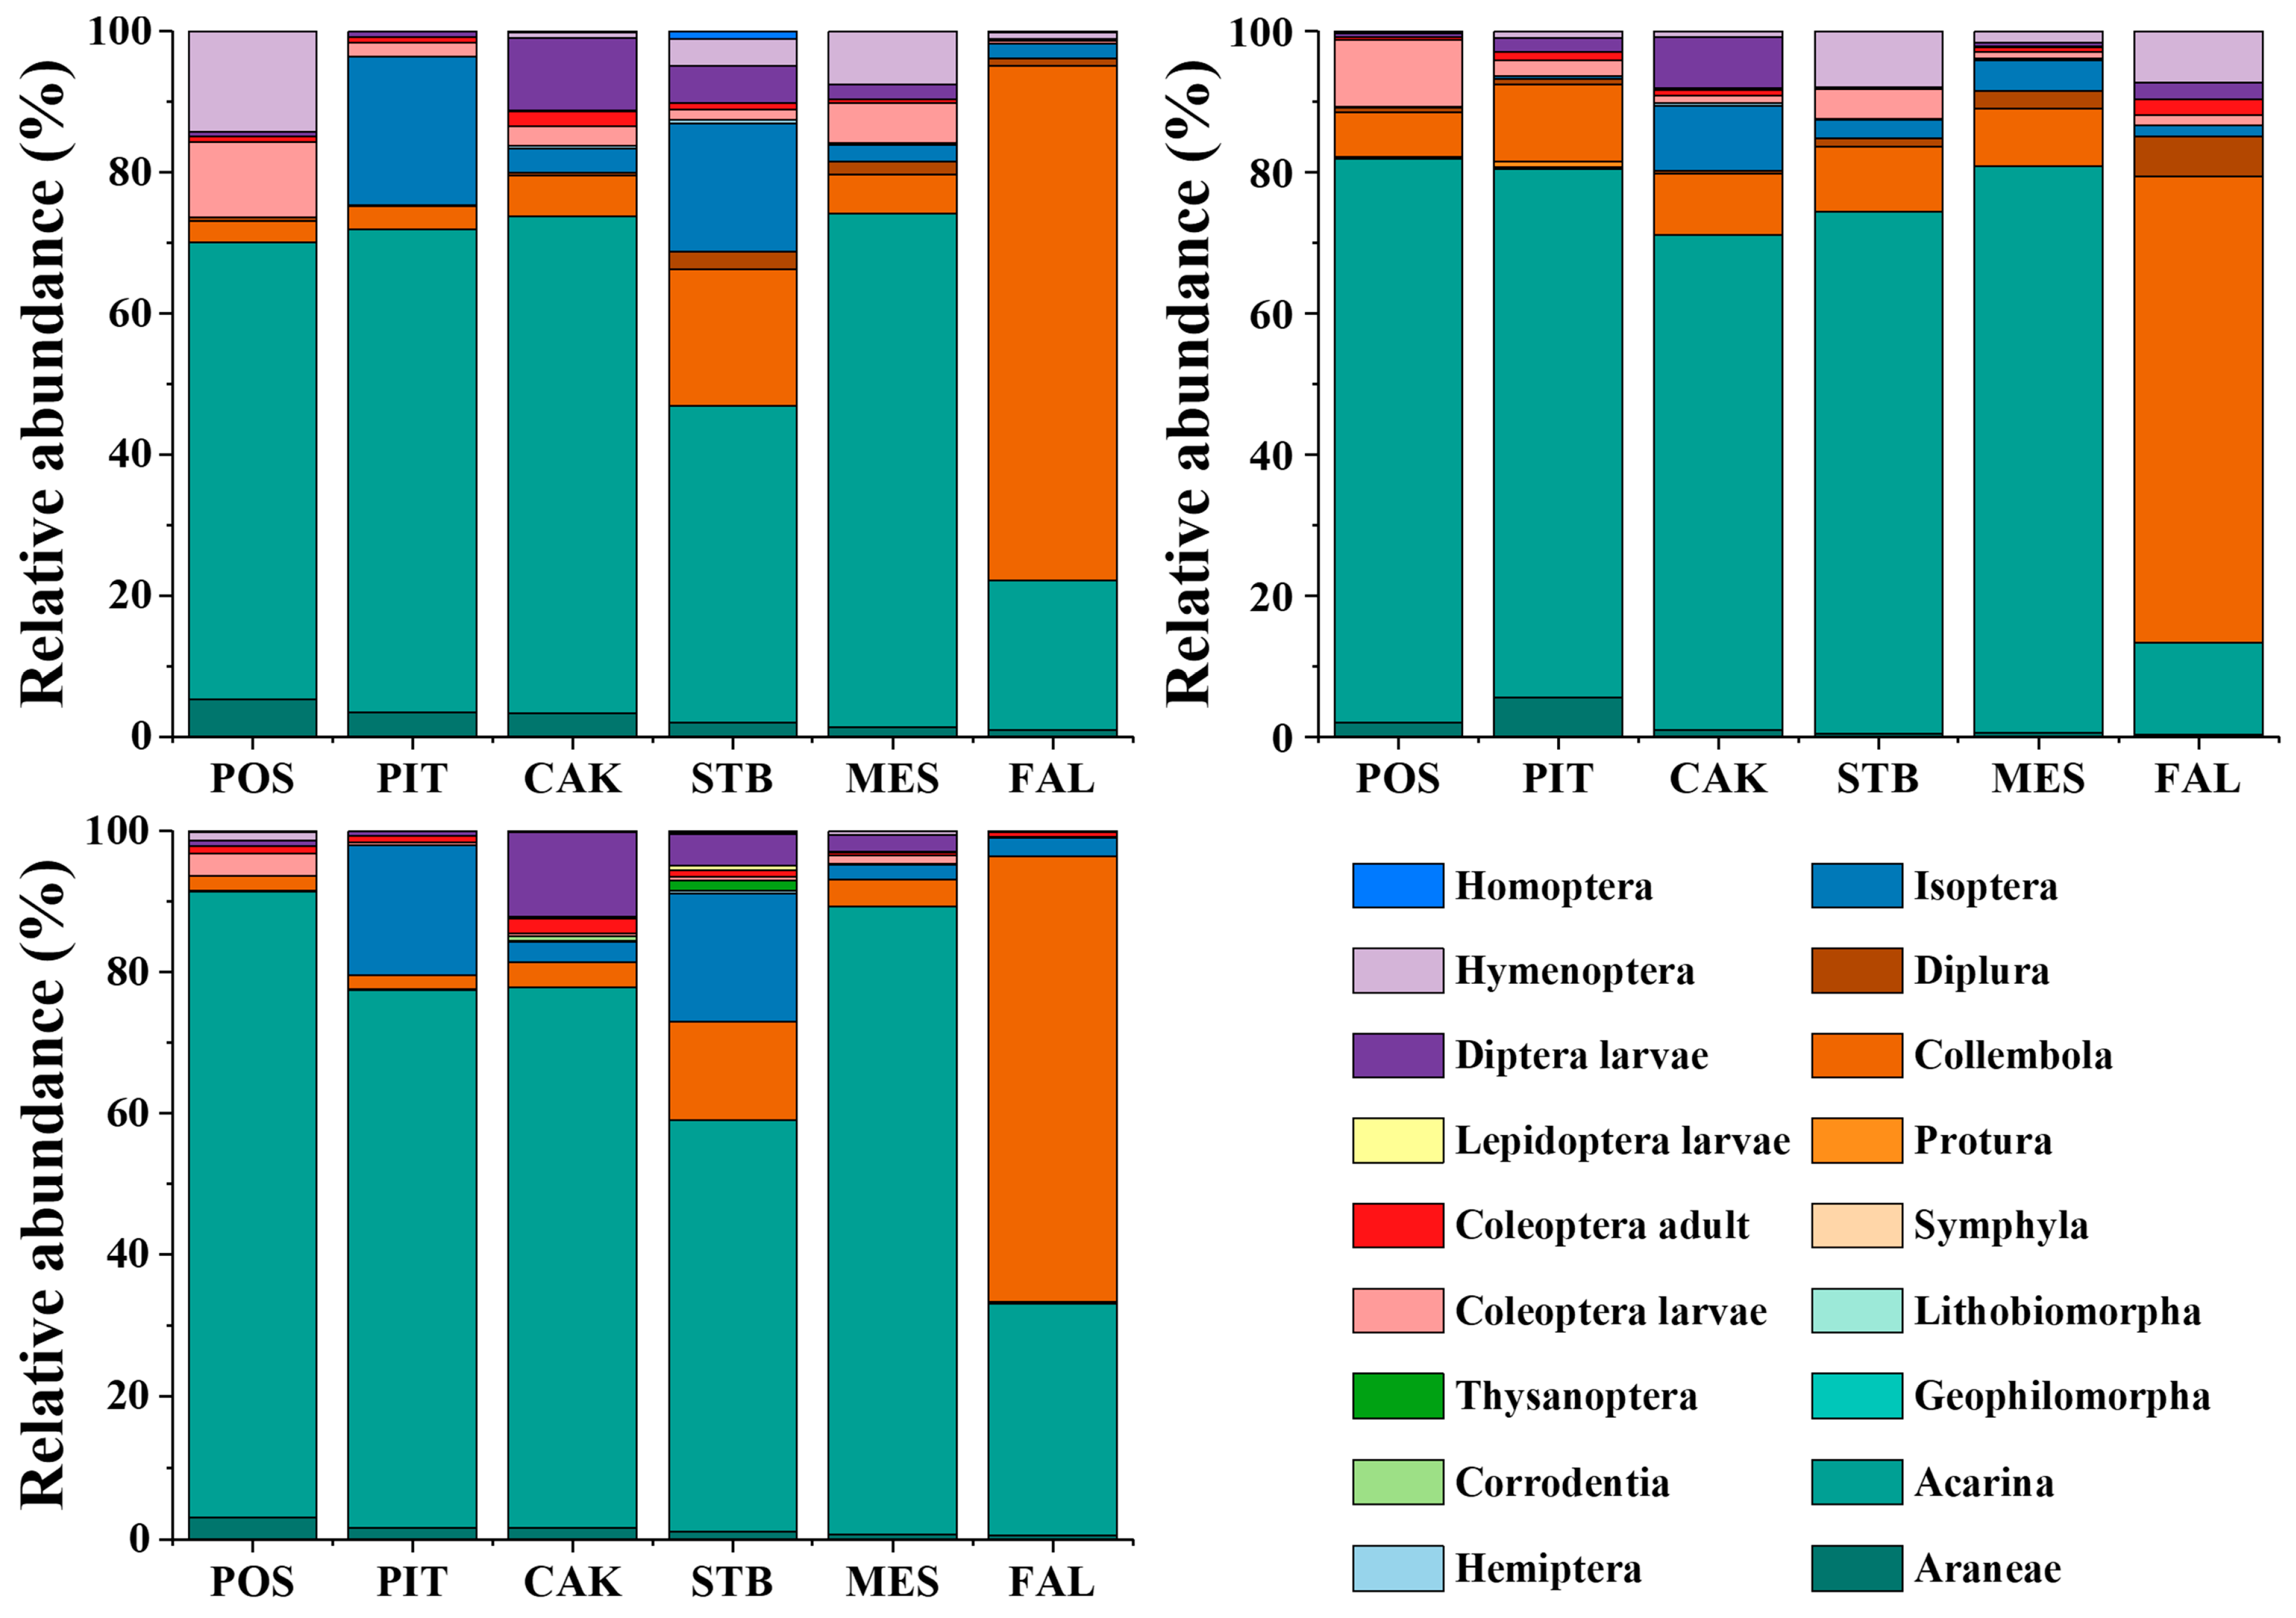
The community composition and relative abundance of soil fauna in different habitats during different seasons are shown in Table 2 and Figure 3. Acarina was the dominant taxon (>10%) in different seasons (May, August, and November) in POS, PIT, CAK, STB, and MES, and Acarina (range: 44.89–88.56%) had the highest relative abundance among all the taxa. In farmland (FAL) habitats, both Acarina and Collembola were the dominant taxa (>10%) in different seasons (May, August, and November), whereas the relative abundance of Collembola (range: 63.18–72.96%) was higher than that of Acarina (range: 12.97–32.55%). The taxa included common (1–10%) and rare (<1%) taxa.
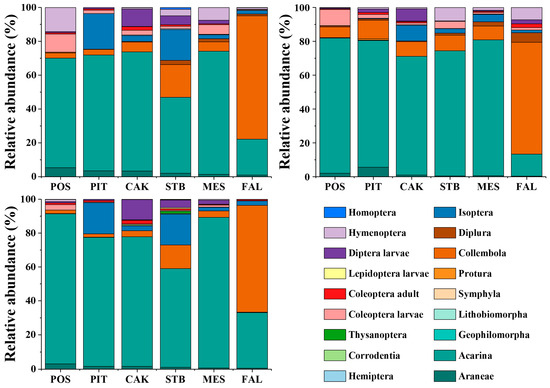
Figure 3.
The proportion of soil faunal density in a certain group to the total group density in May (Upper left), August (Upper right), and November (Bottom left). POS, Populus simonii habitat; PIT, Pinus tabulaeformis habitat; CAK, Caragana korshinskii habitat; STB, Stipa bungeana habitat; MES, Medicago sativa habitat; FAL, farmland habitat.
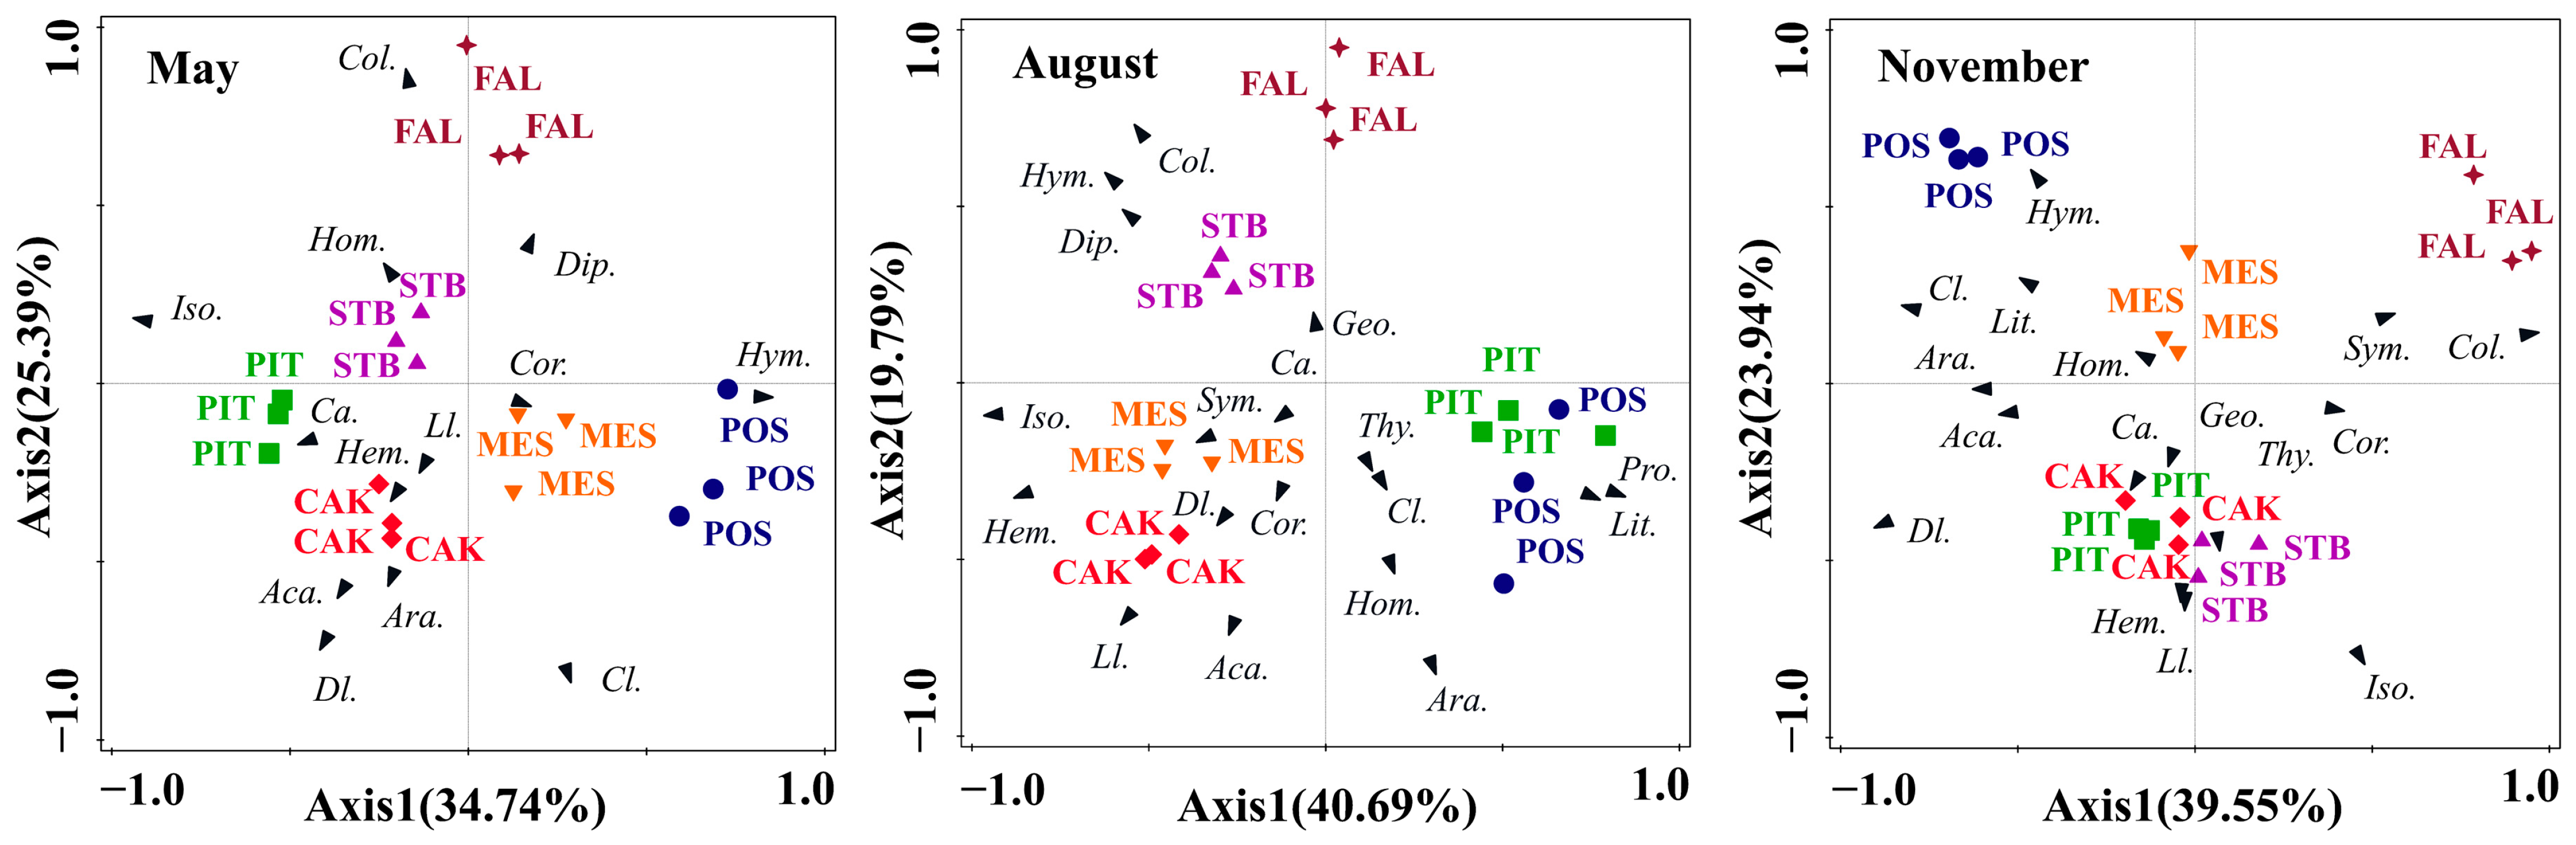
A PCA was used to study the differences in the soil faunal community composition in the six habitats (POS, PIT, CAK, STB, MES, and FAL) during the different seasons (Figure 4). The PCA results showed that the total interpretations of the first two axes in May, August, and November were 60.13%, 60.48%, and 63.49%, respectively. The results of the one-way ANOVA of the factor scores of the first two axes showed that the composition of soil faunal communities in the six habitats differed significantly (p < 0.001) in May (F = 45.43, p < 0.001), August (F = 50.15, p < 0.001), and November (F = 90.30, p < 0.001). The main soil faunal taxa that affected the differentiation of habitats along PC1 were Isoptera in May and August and Collembola in November (Figure 4). The main soil faunal taxa that affected the differentiation of habitats along PC2 in May, August, and November were Collembola, Araneae, and Isoptera, respectively (Figure 4).

Figure 4.
Principal component analysis of soil faunal communities in May, August, and November with the habitats as an overlay. Species arrows: each arrow points in the direction of the steepest increase of the values for corresponding species. POS, Populus simonii habitat; PIT, Pinus tabulaeformis habitat; CAK, Caragana korshinskii habitat; STB, Stipa bungeana habitat; MES, Medicago sativa habitat; FAL, farmland habitat. Abbreviations: Araneae (Ara.), Acarina (Aca.), Geophilomorpha (Geo.), Lithobiomorpha (Lit.) Symphyla (Sym.) Protura (Pro.), Collembola (Col.), Diplura (Dip.), Isoptera (Iso.), Hemiptera (Hem.), Corrodentia (Cor.), Thysanoptera (Thy.), Coleoptera larvae (Cl.), Coleoptera adult (Ca.), Lepidoptera larvae (Ll.), Diptera larvae (Dl.), Hymenoptera (Hym.), Homoptera (Hom.).
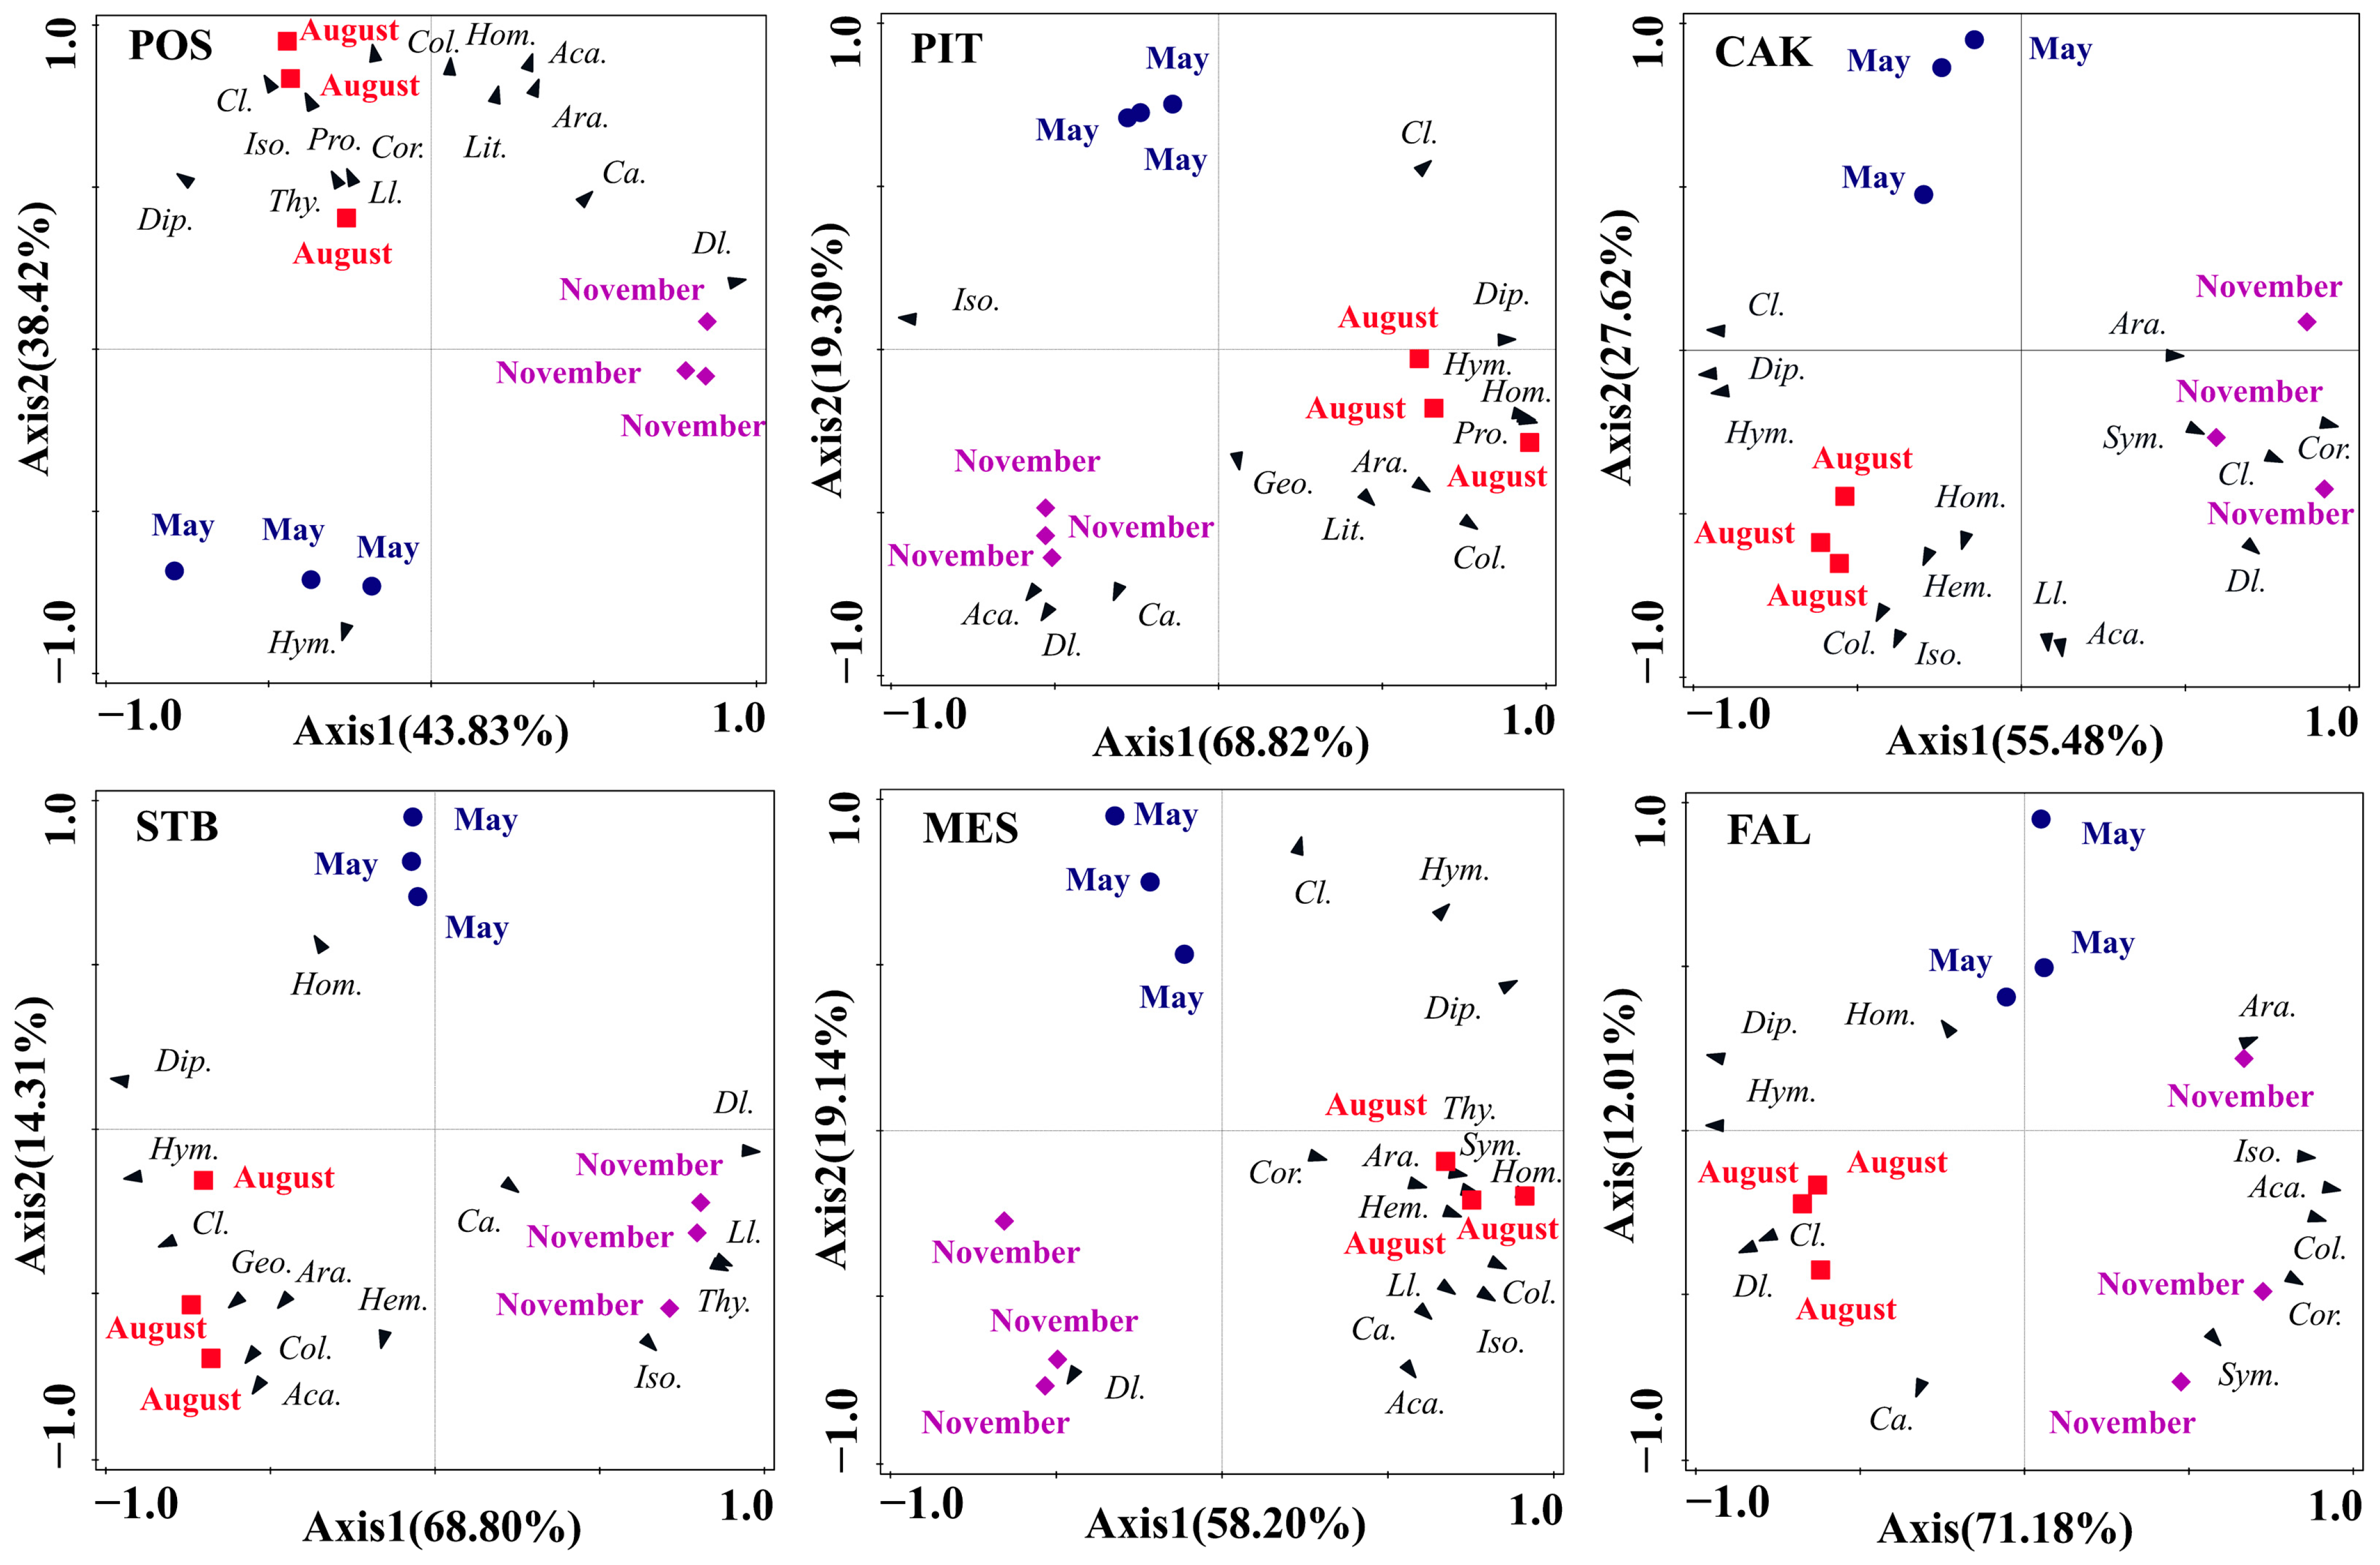
Seasonal variation in soil faunal community composition in the six habitats was analyzed using PCA (Figure 5). The total interpretation rates for the first two axes of the POS, PIT, CAK, STB, MES, and FAL habitats were 82.25%, 88.12%, 83.10%, 83.11%, 77.34%, and 83.19%, respectively. The results of a one-way ANOVA of the factor scores of the first two axes showed significant seasonal differences (p < 0.001) in soil faunal community composition in all six habitats of POS (F = 26.50, p = 0.001), PIT (F = 98.36, p < 0.001), CAK (F = 69.29, p < 0.001), STB (F = 76.85, p < 0.001), MES (F = 80.10, p < 0.001), and FAL (F = 3461.21, p < 0.001). The main soil faunal taxa that affected the differentiation of monthly samples along PC1 in the POS, PIT, MES, and FAL habitats were Diptera larvae, Isoptera, Homoptera, and Hymenoptera, respectively, whereas the CAK and STB habitats were mainly affected by Diptera (Figure 5). The main soil faunal taxa that affected the differentiation of monthly samples along PC2 in the POS, PIT, MES, and FAL habitats were Collembola, Diptera larvae, Coleoptera larvae, and Coleoptera adults, respectively, whereas Acarina mainly affected the CAK and STB habitats (Figure 5).
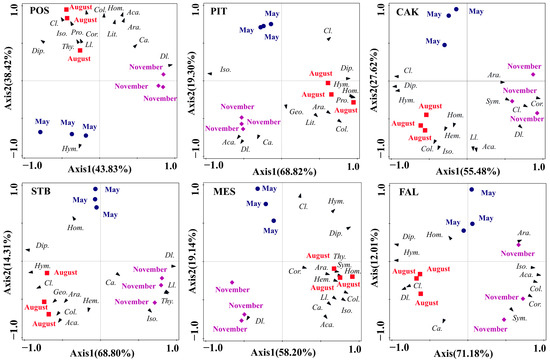
Figure 5.
Principal component analysis of the soil faunal communities in POS, PIT, CAK, STB, MES, and FAL with the sampling periods as an overlay. POS, Populus simonii habitat; PIT, Pinus tabulaeformis habitat; CAK, Caragana korshinskii habitat; STB, Stipa bungeana habitat; MES, Medicago sativa habitat; FAL, farmland habitat. Abbreviations: Araneae (Ara.), Acarina (Aca.), Geophilomorpha (Geo.), Lithobiomorpha (Lit.) Symphyla (Sym.) Protura (Pro.), Collembola (Col.), Diplura (Dip.), Isoptera (Iso.), Hemiptera (Hem.), Corrodentia (Cor.), Thysanoptera (Thy.), Coleoptera larvae (Cl.), Coleoptera adult (Ca.), Lepidoptera larvae (Ll.), Diptera larvae (Dl.), Hymenoptera (Hym.), Homoptera (Hom.).
3.3. Driving Factors of Seasonal Variation of the Soil Faunal Community
The average temperature in the study area in spring (March–May) was 11 °C, and the average precipitation was 24 mm. In summer (June–August), the average temperature was 22 °C, and the average precipitation was 312 mm. In autumn (September–November), the average temperature was 9 °C, and the average precipitation was 41 mm. Significant (p < 0.05) seasonal variations in SWC were observed in the STB, MES, and FAL habitats (Table 4). In the CAK and MES habitats, soil TP was higher in November (0.65 and 0.84 g/kg) than in May and August (0.35–0.40 g/kg and 0.43–0.45 g/kg). Soil TP in the FAL habitat was the highest in November (0.95 g/kg), while soil AN was the highest in August (6.48 mg/kg). The dynamics of soil physicochemical properties in different habitats during different seasons are presented in Table 4.
Table 4.
Quality parameters of soil in different habitats and sampling times.
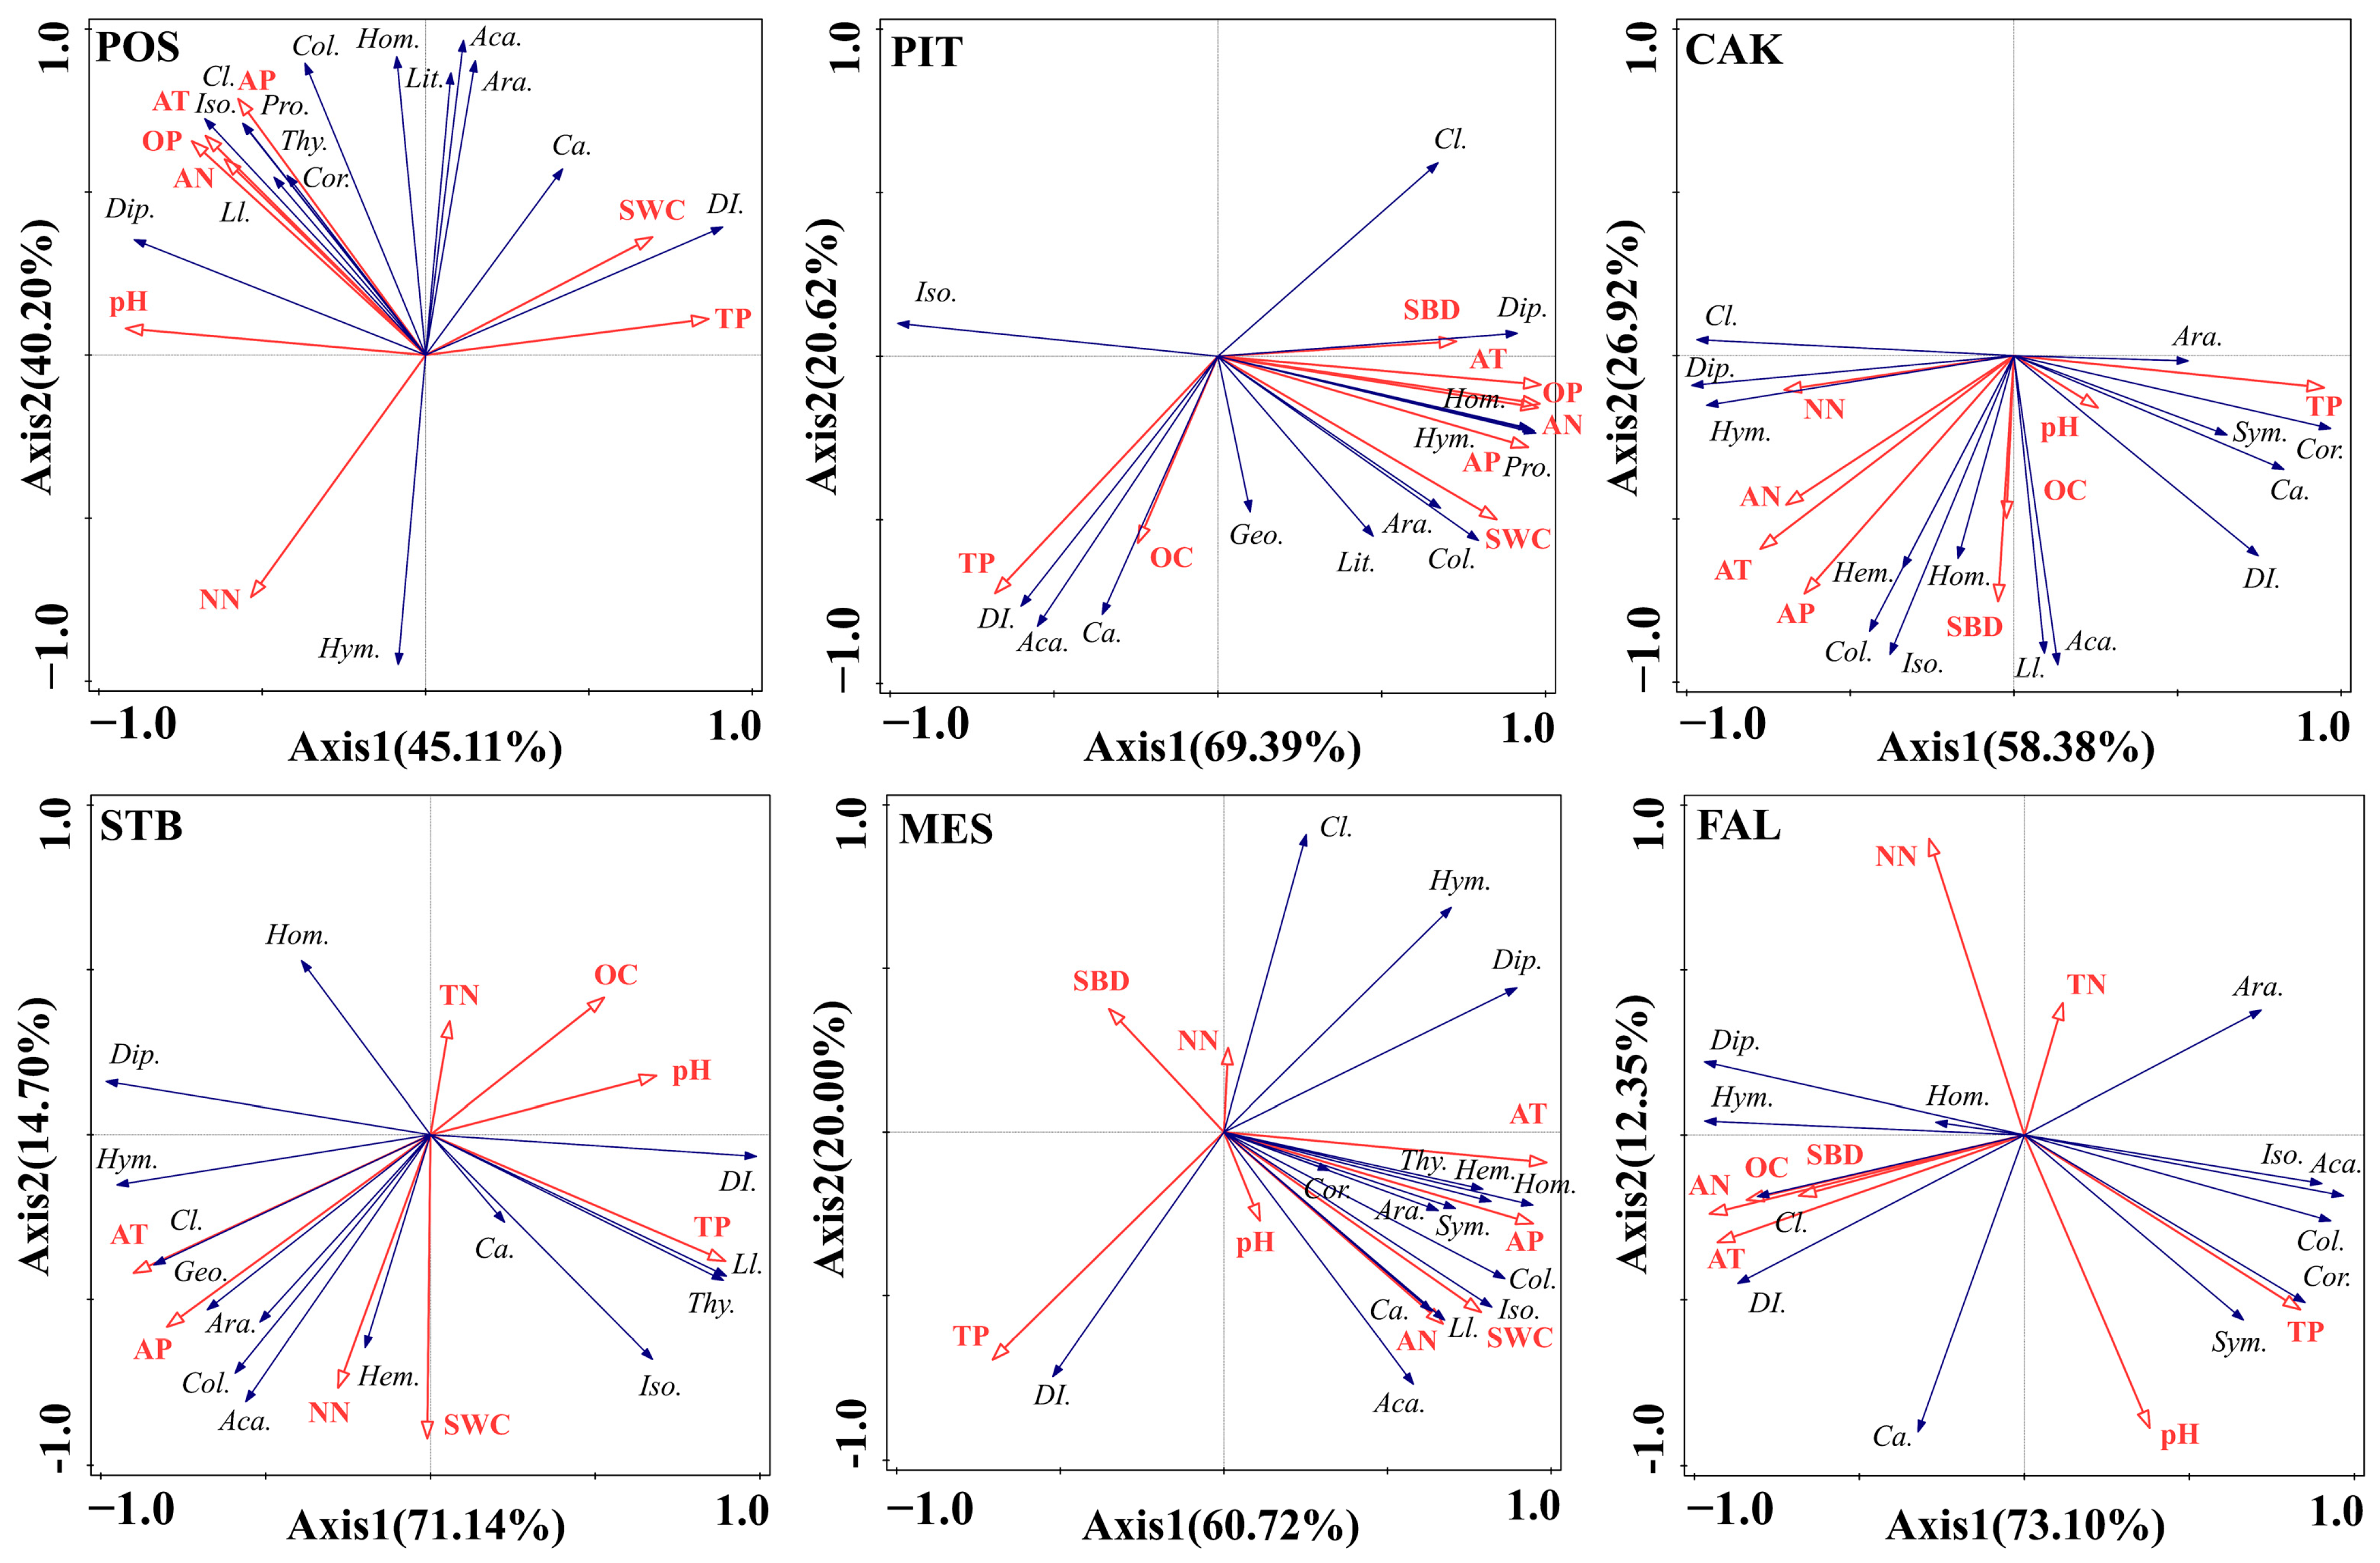
The RDA results showed that the first axis and second axis reached a highly statistically significant level (p < 0.01), indicating that the RDA responded well to the relationship between the environmental factors of the different habitats and the main taxa (Araneae, Acarina, Geophilomorpha, Lithobiomorpha, Symphyla, Protura, Collembola, Diplura, Isoptera, Hemiptera, Corrodentia, Thysanoptera, Coleoptera larvae, Coleoptera adult, Lepidoptera larvae, Diptera larvae, Hymenoptera, and Homoptera) of the soil faunal community (Figure 6). In POS habitats, differences in soil faunal community composition were mainly determined by a combination of air temperature (40.5%, F = 6.8, p = 0.002) and precipitation (41.0%, F = 20.0, p = 0.002). In the PIT and STB habitats, air temperature explained most of the variation in soil faunal community composition across habitats, with 67.5% (F = 20.7, P = 0.002) and 60.3% (F = 15.2, p = 0.002), respectively, followed by precipitation, with 20.8% (F = 16.1, p = 0.002) and 24.8% (F = 15.0, p = 0.002). In the MES habitat, air temperature explained 59.2% (F = 14.5, p = 0.002) of the variation, followed by soil TP, which explained 19.8% (F = 8.5, p = 0.002). In the CAK habitat, TP (52.9%, F = 11.2, p = 0.002) explained most of the variation in the habitat’s soil faunal community composition, followed by precipitation (24.5%, F = 9.8, p = 0.002). In contrast, in the farmland (FAL) habitat, soil AN (67.3%, F = 20.6, p = 0.002) was the most explanatory environmental factor, followed by soil TP (16.3%, F = 8.9, p = 0.002).
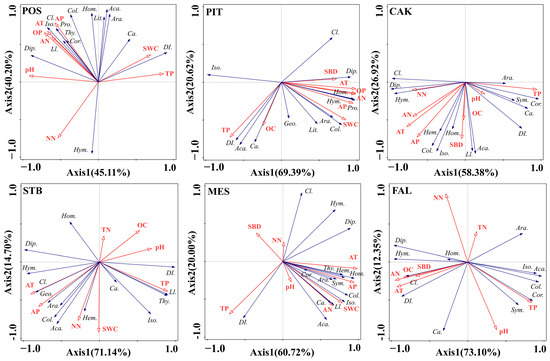
Figure 6.
Redundancy analysis (RDA) showing the relationship between soil faunal composition (blue lines) and environment factors (red lines) (POS, Populus simonii habitat; PIT, Pinus tabulaeformis habitat; CAK, Caragana korshinskii habitat; STB, Stipa bungeana habitat; MES, Medicago sativa habitat; FAL, farmland habitat). Abbreviations: soil bulk density (SBD), soil water content (SWC), soil pH (pH), soil organic carbon (OC), soil total nitrogen (TN), soil total phosphorus (TP), soil nitrate nitrogen (NN), soil ammonium nitrogen (AN), soil Olsen phosphorus (OP), temperature (AT), precipitation (AP). Araneae (Ara.), Acarina (Aca.), Geophilomorpha (Geo.), Lithobiomorpha (Lit.), Symphyla (Sym.), Protura (Pro.), Collembola (Col.), Diplura (Dip.), Isoptera (Iso.), Hemiptera (Hem.), Corrodentia (Cor.), Thysanoptera (Thy.), Coleoptera larvae (Cl.), Coleoptera adult (Ca.), Lepidoptera larvae (Ll.), Diptera larvae (Dl.), Hymenoptera (Hym.), Homoptera (Hom.).
4. Discussion
The density, richness, and community indices (H, J, C, and D) of soil fauna can objectively reflect differences in species composition and structure in different habitats [31]. The results showed that the total density, group number, and community index (H, J, C, D) of soil animal communities in each typical artificial restoration vegetation were significantly different, and showed obvious seasonal changes. Overall, the average density of soil fauna in the six habitats showed that summer (August) > fall (November) > spring (May). The study area has a semi-arid continental monsoon climate, with 70% of the precipitation concentrated in the summer (June–September) with high summer temperatures [22]. In summer (August), increased precipitation and higher temperatures were conducive to the survival and reproduction of soil fauna, resulting in the highest density and richness of soil fauna [32]. Zhu et al. found that the density and richness of soil fauna generally reached a maximum from July to September, which is consistent with changes in rainfall and temperature (in the middle and cold temperate zones) [26]. However, the seasonal variation in soil fauna in the PIT and FAL habitats showed different patterns, with the maximum soil faunal density observed in November. Seasonal fluctuations in soil fauna density were also smaller in the PIT and FAL habitats. The field survey found that the study site planted one season of maize per year (April to October) and was fallow at other times. The high intensity of disturbance and intensification during maize cultivation is detrimental to the development of soil fauna [33,34]. After fallow, soil fauna developed rapidly. Moreover, this also masks the effects of seasonal changes in temperature and precipitation on soil faunal communities [35]. PIT is a coniferous tree species with many plastids, cellulose, and tannins in the litter and responds differently to seasonal changes than broadleaf forests [32]. This leads to different seasonal changes in soil fauna communities under different vegetation types [36]. Wu et al. found that the temporal dynamics of the soil macroinvertebrate community composition and diversity were greater in deciduous broad-leaved forests than in coniferous forests [16]. The Shannon–Wiener diversity index (H) comprehensively considers the number of groups and the number of individuals in each group; the Pielou evenness index (J) focuses on the number of individuals in each group. The Margalef richness index (D) focuses on the abundance of species groups in the community; the Simpson dominance index (C) reflects the dominance of the entire species from the perspective of the community [25]. In this study, the highest soil fauna diversity index (H) and evenness index (J) appeared in May in artificially restored habitats and was the highest in August in farmland habitats. This is not the same as the month with the highest soil fauna density and number of taxa, indicating that seasonal changes in soil fauna density and seasonal changes in soil fauna community indices are not synchronized. Seasonal changes in soil fauna community indices (H, J, C, and D) are complex and diverse.
Moreover, significant seasonal differences were observed in the soil faunal community composition among the six habitats. However, the main taxa that cause seasonal changes in soil faunal community composition differ among habitats [16,32]. In addition, seasonal changes in the density of the dominant taxa (Acarina and Collembola) in these habitats were consistent with seasonal changes in the mean density of soil fauna, indicating that dominant groups played a central role in seasonal variation in the density of soil faunal communities. Soil fauna community composition and distribution characteristics are influenced by a combination of environmental factors. Soil properties such as soil organic matter, nitrogen content, and phosphorus content can affect the composition and density of soil faunal communities [37]. In the present study, temperature and precipitation were the most important limiting factors affecting the distribution of soil fauna in artificially restored vegetation on the Loess Plateau. Temperature had a high degree of explanation (40.5–67.5%) in POS, PIT, STB, and MES habitats. Similar results were obtained by Chang [38], who studied soil arthropods in semi-arid grassland ecosystems, where the activity of the dominant groups, Tenebrionidae, was mainly influenced by atmospheric temperature and rainfall, and moisture significantly affected the reproductive processes of Tenebrionidae. Aupic-Samain et al.’s research on soil arthropods showed that reducing soil moisture would greatly reduce the total density of Collembola, whereas, under adequate moisture conditions, the increase in temperature increases collembola activity (foraging, growth, and reproduction) thereby increasing collembola density [39]. Temperature is an important environmental factor that can directly affect the growth, development, and reproduction of soil organisms and influence the community characteristics of soil fauna [13,38]. Moreover, changes in temperature can indirectly affect soil fauna by influencing other factors such as plant-community composition, plant growth, soil moisture, and nutrient availability [40]. Soil fauna responded differently to temperature changes in different habitats. In some habitats, Acarina is more sensitive to temperature than Collembola [41]. Temperature may also affect soil faunal communities by influencing the interaction between species [42]. The study area is located in the semi-arid region of the northern Loess Plateau, where annual rainfall is low and is mainly concentrated in summer (June–September), making moisture an important limiting factor in the region [19]. Therefore, rainfall notably influenced soil faunal communities in typical artificial restoration vegetation. Rainfall generally enhances the growth of soil organisms; however, its effects differ for different taxa [43]. For example, precipitation increases the number of Collembola at a high Arctic site but decreases the number of mites [44].
Among the five typical artificially restored vegetation habitats (POS, PIT, CAK, STB, and MES), Acarina was the dominant group during all sampling periods (May, August, and November), and its density was the highest among all taxa. Wiwatwitaya and Takeda also found that Acarina (75.38%) was the main soil fauna group in dry evergreen forests, [45]. Wang et al.’s research on the soil fauna of subtropical forests in Fujian also showed that Acarina and Collembola were the dominant taxa in this area, and Acarina is more abundant than Collembola [46]. Wu et al. found that Acarina is abundant in deciduous broad-leaved forests, whereas Collembola is abundant in coniferous forests [32]. Overall, Acarina and Collembola remained the dominant taxa, although differences in plant-community characteristics and environmental conditions could lead to differences in the soil faunal community composition in different studies. Unlike the five typical artificially restored vegetation types, the density of Collembola was the highest among all taxa in the FAL habitat. Considering that the FAL habitat has a single crop type, a large disturbance from human activities, and almost no litter layer [22], its dominant groups are different from those of other habitats. During agricultural production, measures such as weeding and digging holes, sowing and covering the soil, applying chemical fertilizers and pesticides, harvesting crops, and returning straw to the field interfere with farmland soil fauna. Meanwhile, the destruction of soil structure by agricultural machinery and other factors significantly reduces the diversity of soil fauna. Therefore, the disturbance caused by farmland has a relatively more complex impact on soil fauna than other land uses. Fertilization typically increases soil faunal density on a global scale by affecting food resources, and the effects of fertilization depend on the specific soil fauna and fertilizer type [47].
Vegetation restoration causes significant changes in soil fauna communities, thereby increasing the complexity of material circulation and energy flow in restored ecosystems [22]. Determination of the structure, diversity, and stability of soil faunal communities and their main influencing factors under different restoration measures can help evaluate the ecological effects of returning farmland to forest and determine the evolutionary trend of soil faunal communities in the Loess Plateau based on the analysis of vegetation community structure [21]. In addition, global changes caused by human activities (e.g., nitrogen deposition, elevated carbon dioxide concentrations, increased temperatures, and changes in precipitation patterns) significantly affect terrestrial ecosystem functions and biodiversity [17,48]. Soil biodiversity is a fundamental component of terrestrial ecosystem biodiversity and is affected by global temperature changes and precipitation patterns [49,50]. Soil faunal density is influenced by changes in rainfall patterns, whereas soil diversity resists the individual and combined effects of multiple global change factors [51]. Therefore, the comprehensive response of soil faunal community characteristics to vegetation structure and global change during vegetation restoration in the Loess Plateau should be strengthened.
5. Conclusions
Revegetated habitats showed higher total densities and group numbers of soil fauna than farmland habitats. The total density and group number of soil fauna showed marked seasonal variations and were highest in the summer. In the revegetated habitats, Acarina was the dominant group in different seasons and had the highest relative density among all taxa. In addition, the dominant groups (Acarina and Collembola) played an influential role in the seasonal variations in soil faunal density. Temperature was the most important factor driving seasonal variation in soil faunal communities. This study suggests that the seasonal dynamics of soil faunal communities with climate should be emphasized when conducting soil faunal research, which will contribute to biodiversity conservation and regional ecological management in the Loess Plateau.
Author Contributions
Z.L.: Data Curation, Writing—Original Draft, Visualization. X.Y.: Writing—Review and Editing, Visualization. W.L.: Validation, Formal analysis, Investigation. R.S.: Formal analysis, Investigation. X.Z.: Resources, Project administration. T.L.: Conceptualization, Methodology, Software, Funding acquisition. M.S.: Conceptualization, Methodology, Software. M.C.: Investigation. M.G.: Investigation. All authors have read and agreed to the published version of the manuscript.
Funding
This research was supported by the Open Fund for Key Lab. of Ecological Study of Ningxia University (LDER2022Z01), the Natural Science Basic Research Program of Shaanxi Province (2023-JC-QN-0217), and the Chinese Universities Scientific Fund (2452022335).
Data Availability Statement
The original contributions presented in the study are included in the article, further inquiries can be directed to the corresponding authors.
Conflicts of Interest
The authors declare no conflicts of interest.
References
- Bardgett, R.D.; van der Putten, W.H. Belowground biodiversity and ecosystem functioning. Nature 2014, 515, 505–511. [Google Scholar] [CrossRef] [PubMed]
- Wagg, C.; Bender, S.F.; Widmer, F.; van der Heijden, M.G.A. Soil biodiversity and soil community composition determine ecosystem multifunctionality. Proc. Natl. Acad. Sci. USA 2014, 111, 5266–5270. [Google Scholar] [CrossRef] [PubMed]
- David, J.F. The role of litter-feeding macroarthropods in decomposition processes: A reappraisal of common views. Soil Biol. Biochem. 2014, 76, 109–118. [Google Scholar] [CrossRef]
- Frouz, J. Effects of soil macro- and mesofauna on litter decomposition and soil organic matter stabilization. Geoderma 2018, 332, 161–172. [Google Scholar] [CrossRef]
- Li, T.; Jia, Y.; Shao, M.a.; Shen, N. Camponotus japonicus burrowing activities exacerbate soil erosion on bare slopes. Geoderma 2019, 348, 158–167. [Google Scholar] [CrossRef]
- Li, T.; Shao, M.a.; Jia, Y.; Jia, X.; Huang, L. Small-scale observation on the effects of the burrowing activities of mole crickets on soil erosion and hydrologic processes. Agric. Ecosyst. Environ. 2018, 261, 136–143. [Google Scholar] [CrossRef]
- Bradford, M.A.; Jones, T.H.; Bardgett, R.D.; Black, H.I.J.; Boag, B.; Bonkowski, M.; Cook, R.; Eggers, T.; Gange, A.C.; Grayston, S.J.; et al. Impacts of Soil Faunal Community Composition on Model Grassland Ecosystems. Science 2002, 298, 615–618. [Google Scholar] [CrossRef] [PubMed]
- Eisenhauer, N.; Sabais, A.C.W.; Scheu, S. Collembola species composition and diversity effects on ecosystem functioning vary with plant functional group identity. Soil Biol. Biochem. 2011, 43, 1697–1704. [Google Scholar] [CrossRef]
- Lensing, J.R.; Wise, D.H. Predicted climate change alters the indirect effect of predators on an ecosystem process. Proc. Natl. Acad. Sci. USA 2006, 103, 15502–15505. [Google Scholar] [CrossRef]
- Erktan, A.; Or, D.; Scheu, S. The physical structure of soil: Determinant and consequence of trophic interactions. Soil Biol. Biochem. 2020, 148, 107876. [Google Scholar] [CrossRef]
- Gongalsky, K.B. Soil macrofauna: Study problems and perspectives. Soil Biol. Biochem. 2021, 159, 108281. [Google Scholar] [CrossRef]
- Eisenhauer, N.; Cesarz, S.; Koller, R.; Worm, K.; Reich, P.B. Global change belowground: Impacts of elevated CO2, nitrogen, and summer drought on soil food webs and biodiversity. Glob. Chang. Biol. 2012, 18, 435–447. [Google Scholar] [CrossRef]
- Kardol, P.; Reynolds, W.N.; Norby, R.J.; Classen, A.T. Climate change effects on soil microarthropod abundance and community structure. Appl. Soil Ecol. 2011, 47, 37–44. [Google Scholar] [CrossRef]
- Berg, M.P.; Bengtsson, J. Temporal and spatial variability in soil food web structure. Oikos 2007, 116, 1789–1804. [Google Scholar] [CrossRef]
- Handa, I.T.; Aerts, R.; Berendse, F.; Berg, M.P.; Bruder, A.; Butenschoen, O.; Chauvet, E.; Gessner, M.O.; Jabiol, J.; Makkonen, M.; et al. Consequences of biodiversity loss for litter decomposition across biomes. Nature 2014, 509, 218–221. [Google Scholar] [CrossRef]
- Wu, P.; Liu, S.; Liu, X. Composition and spatio-temporal changes of soil macroinvertebrates in the biodiversity hotspot of northern Hengduanshan Mountains, China. Plant Soil 2012, 357, 321–338. [Google Scholar] [CrossRef]
- Han, F.; Yu, C.; Fu, G. Non-growing/growing season non-uniform-warming increases precipitation use efficiency but reduces its temporal stability in an alpine meadow. Front. Plant Sci. 2023, 14, 1090204. [Google Scholar] [CrossRef] [PubMed]
- Wu, P.; Wang, C. Differences in spatiotemporal dynamics between soil macrofauna and mesofauna communities in forest ecosystems: The significance for soil fauna diversity monitoring. Geoderma 2019, 337, 266–272. [Google Scholar] [CrossRef]
- Gao, H.; Pang, G.; Li, Z.; Chang, S. Evaluating the potential of vegetation restoration in the Loess Plateau. Acta Geogr. Sin. 2017, 72, 863–874. [Google Scholar]
- Wang, Y.; Shao, M.a.; Liu, Z. Large-scale spatial variability of dried soil layers and related factors across the entire Loess Plateau of China. Geoderma 2010, 159, 99–108. [Google Scholar] [CrossRef]
- Zhu, Y.; Wang, Y.; Chen, L.; Li, Z. Does non-native black locust afforestation affect soil biodiversity at the regional scale? Case study of soil macroinvertebrates across the Chinese Loess Plateau. Catena 2021, 200, 105171. [Google Scholar] [CrossRef]
- Yang, X.; Shao, M.a.; Li, T.; Gan, M.; Chen, M. Community characteristics and distribution patterns of soil fauna after vegetation restoration in the northern Loess Plateau. Ecol. Indic. 2021, 122, 107236. [Google Scholar] [CrossRef]
- The Food and Agriculture Organization of the United Nations. World Reference Base for Soil Resources; World Soil Resources Reports 103; The Food and Agriculture Organization of the United Nations: Rome, Italy, 2006. [Google Scholar]
- Anderson, J.; Ingram, J. Tropical Soil Biology and Fertility: A Handbook of Methods. Soil Sci. 1994, 157, 265. [Google Scholar] [CrossRef]
- Yang, X. Geographic Distribution of Grassland Soil Fauna and Their Ecological Functions on the Loess Plateau. Ph.D. Thesis, Northwest A&F University, Yangling, China, 2023. [Google Scholar]
- Zhu, X.; Zhu, B. Diversity and abundance of soil fauna as influenced by long-term fertilization in cropland of purple soil, China. Soil Tillage Res. 2015, 146, 39–46. [Google Scholar] [CrossRef]
- Wenying, Y. Pictorial Keys to Soil Animals of China; Science Press: Beijing, China, 2000. [Google Scholar]
- Page, A.L. Methods of Soil Analysis. Part 2. Chemical and Microbiological Properties; Amer Society of Agronomy: Madison, WI, USA, 1982. [Google Scholar]
- Kachurina, O.; Zhang, H.; Raun, W.; Krenzer, E. Simultaneous determination of soil aluminum, ammonium- and nitrate-nitrogen using 1 M potassium chloride extraction. Commun. Soil Sci. Plant Anal. 2000, 31, 893–903. [Google Scholar] [CrossRef]
- Dick, W.A.; Cheng, L.; Wang, P. Soil acid and alkaline phosphatase activity as pH adjustment indicators. Soil Biol. Biochem. 2000, 32, 1915–1919. [Google Scholar] [CrossRef]
- Cao, W. Community Structure of Soil Fauna and Its Seasonal Dynaic of Wetland in Nanniwan; Yan’An University: Yan’an City, China, 2017. [Google Scholar]
- Wu, P.; Liu, X.; Liu, S.; Wang, J.; Wang, Y. Composition and spatio-temporal variation of soil microarthropods in the biodiversity hotspot of northern Hengduan Mountains, China. Eur. J. Soil Biol. 2014, 62, 30–38. [Google Scholar] [CrossRef]
- Decaëns, T.; Jiménez, J.J.; Barros, E.; Chauvel, A.; Blanchart, E.; Fragoso, C.; Lavelle, P. Soil macrofaunal communities in permanent pastures derived from tropical forest or savanna. Agric. Ecosyst. Environ. 2004, 103, 301–312. [Google Scholar] [CrossRef]
- Rossi, J.-P.; Blanchart, E. Seasonal and land-use induced variations of soil macrofauna composition in the Western Ghats, southern India. Soil Biol. Biochem. 2005, 37, 1093–1104. [Google Scholar] [CrossRef]
- Liu, Y.; Chang, L.; Zhang, S.; Gao, Q.; Xin, S. Effects of Farmland Management Measures on the Characteristics of Soil Animal Community. Chin. J. Soil Sci. 2023, 54, 989. [Google Scholar]
- Sauvadet, M.; Chauvat, M.; Brunet, N.; Bertrand, I. Can changes in litter quality drive soil fauna structure and functions? Soil Biol. Biochem. 2017, 107, 94–103. [Google Scholar] [CrossRef]
- Cui, Y.; Fang, L.; Guo, X.; Wang, X.; Zhang, Y.; Li, P.; Zhang, X. Ecoenzymatic stoichiometry and microbial nutrient limitation in rhizosphere soil in the arid area of the northern Loess Plateau, China. Soil Biol. Biochem. 2018, 116, 11–21. [Google Scholar] [CrossRef]
- Chang, H. Spatial-Temporal Distribution Characteristics of Soil Faunal Community Structure after Planting Caragana Korshinskii in Reaumuria Soongorica Shrubbery Land of Urad Desert Steppe; Ningxia University: Yinchuan, China, 2020. [Google Scholar]
- Aupic-Samain, A.; Baldy, V.; Delcourt, N.; Krogh, P.H.; Gauquelin, T.; Fernandez, C.; Santonja, M. Water availability rather than temperature control soil fauna community structure and prey–predator interactions. Funct. Ecol. 2021, 35, 1550–1559. [Google Scholar] [CrossRef]
- Schlesinger, W.; Bernhardt, E. Biogeochemistry: An Analysis of Global Change, 3rd ed.; Academic Press: Cambridge, MA, USA, 2013; 672p. [Google Scholar]
- Bokhorst, S.; Huiskes, A.; Convey, P.; van Bodegom, P.M.; Aerts, R. Climate change effects on soil arthropod communities from the Falkland Islands and the Maritime Antarctic. Soil Biol. Biochem. 2008, 40, 1547–1556. [Google Scholar] [CrossRef]
- Melillo, J.M.; McGuire, A.D.; Kicklighter, D.W.; Moore, B.; Vorosmarty, C.J.; Schloss, A.L. Global climate change and terrestrial net primary production. Nature 1993, 363, 234–240. [Google Scholar] [CrossRef]
- Blankinship, J.C.; Niklaus, P.A.; Hungate, B.A. A meta-analysis of responses of soil biota to global change. Oecologia 2011, 165, 553–565. [Google Scholar] [CrossRef]
- Coulson, S.J.; Leinaas, H.P.; Ims, R.A.; Søvik, G. Experimental manipulation of the winter surface ice layer: The effects on a High Arctic soil microarthropod community. Ecography 2000, 23, 299–306. [Google Scholar] [CrossRef]
- Wiwatwitaya, D.; Takeda, H. Seasonal changes in soil arthropod abundance in the dry evergreen forest of north-east Thailand, with special reference to collembolan communities. Ecol. Res. 2005, 20, 59–70. [Google Scholar] [CrossRef]
- Wang, S.; Ruan, H.; Wang, J.; Xu, Z.; Wu, Y. Composition structure of soil fauna community under the typical vegetations in the Wuyi Mountains, China. Acta Ecol. Sin. 2010, 30, 5174–5184. [Google Scholar]
- Zhu, Y.; Bian, H.; Ju, C.; Xu, C.; Zhou, Y.; Zhang, H.; Xu, X. Fertilization alters the abundance but not the diversity of soil fauna: A meta-analysis. Glob. Ecol. Biogeogr. 2023, 32, 482–494. [Google Scholar] [CrossRef]
- Berlinches de Gea, A.; Hautier, Y.; Geisen, S. Interactive effects of global change drivers as determinants of the link between soil biodiversity and ecosystem functioning. Glob. Chang. Biol. 2023, 29, 296–307. [Google Scholar] [CrossRef]
- Yin, R.; Qin, W.; Wang, X.; Xie, D.; Wang, H.; Zhao, H.; Zhang, Z.; He, J.-S.; Schädler, M.; Kardol, P.; et al. Experimental warming causes mismatches in alpine plant-microbe-fauna phenology. Nat. Commun. 2023, 14, 2159. [Google Scholar] [CrossRef]
- Zhang, B.; Ma, W.; Song, L.; Liang, X.; Xi, X.; Wang, Z. Nitrogen addition and experimental drought simplified arthropod network in temperate grassland. Funct. Ecol. 2023, 37, 1815–1826. [Google Scholar] [CrossRef]
- Peng, Y.; Peñuelas, J.; Vesterdal, L.; Yue, K.; Peguero, G.; Fornara, D.A.; Heděnec, P.; Steffens, C.; Wu, F. Responses of soil fauna communities to the individual and combined effects of multiple global change factors. Ecol. Lett. 2022, 25, 1961–1973. [Google Scholar] [CrossRef]

Disclaimer/Publisher’s Note: The statements, opinions and data contained in all publications are solely those of the individual author(s) and contributor(s) and not of MDPI and/or the editor(s). MDPI and/or the editor(s) disclaim responsibility for any injury to people or property resulting from any ideas, methods, instructions or products referred to in the content. |
© 2024 by the authors. Licensee MDPI, Basel, Switzerland. This article is an open access article distributed under the terms and conditions of the Creative Commons Attribution (CC BY) license (https://creativecommons.org/licenses/by/4.0/).