Article

Multi-Scenario Simulation and Eco-Environmental Effects Analysis of Land Use/Cover Change in China by an Integrated Cellular Automata and Markov Model

1
Advanced Institute of Natural Sciences, Beijing Normal University, Zhuhai 519087, China
2
School of Environment, Beijing Normal University, Beijing 100875, China
3
Key Laboratory of Coastal Water Environmental Management and Water Ecological Restoration of Guangdong Higher Education Institutes, Beijing Normal University, Zhuhai 519087, China
4
Zhixing College, Beijing Normal University, Zhuhai 519087, China
5
Research Institute of Urban Renewal, Zhuhai Institute of Urban Planning and Design, Zhuhai 519100, China
6
Department of Geography, National University of Singapore, Singapore 117570, Singapore
7
Huitong College, Beijing Normal University, Zhuhai 519087, China
*
Author to whom correspondence should be addressed.
These authors contributed equally to this work.
Land 2024, 13(4), 520; https://doi.org/10.3390/land13040520
Submission received: 11 March 2024 / Revised: 2 April 2024 / Accepted: 10 April 2024 / Published: 14 April 2024

Abstract

:
Land use transitions play a critical role in ecological environmental restoration, but they are also plagued by ecological environmental problems caused by excessive land resource development. In this study, we propose a methodological framework for unveiling the nexus profile of land use/cover change (LUCC) and eco-environmental effects. This study explored the spatiotemporal evolution patterns of LUCC over a long time series based on high-precision land use data from 1990 to 2020. Then, the ecological values (EVs) of various cities were calculated to obtain the ecological contribution rate of different land use types in the process of change. Finally, the future development trends of land use and ecological environmental quality were predicted under multiple scenarios using the cellular automata–Markov model, and scientific policy recommendations were proposed. The results showed that the expansion trajectory of the construction land in the urban agglomeration mainly expanded inwards along the mouth of the Pearl River, and the conversion of cultivated land to construction land was the most significant type of land use change. The overall ecological environmental quality of the study area showed a downwards trend, with Shenzhen exhibiting the largest decrease in EVs. Cultivated land contributed significantly to improving regional ecological environmental quality, while the land use transition types with relatively large contributions to environmental quality deterioration were conversions to construction land. Under the scenario of coordinated protection, the degree of cultivated land area reduction was significantly reduced, and the area of forestland showed a positive growth trend, with the expansion trend of construction land being reversed. These research findings can enrich the theoretical research on the sustainable development of urban agglomerations and provide reliable data support for policy-making.

1. Introduction

Urbanization and land use/cover change (LUCC) are important driving factors affecting the quality of regional ecological environments. LUCC is manifested as the transformation between different land types. In the process of urbanization, the rapid expansion of construction land leads to the continuous expansion of urban boundaries, and large amounts of forestland and agricultural land are transformed into residential and industrial land. The urban landscape pattern has undergone dramatic changes, which indirectly lead to changes in the quality of the ecological environment in different regions [1,2]. In the 1990s, inspired by the forest transition hypothesis, some scholars proposed the perspective of land use transition [3], emphasizing the changes in regional land use patterns caused by human activities. In 1995, a research plan on “Land Use and Land Cover Change” was formally proposed [4], and, since then, the academic community has begun to focus on the cross-disciplinary research of LUCC and other disciplines (ecology, meteorology, urban planning, etc.). Analyzing the spatiotemporal evolution trend of regional land use change is the basis for studying the degree and transformation of land use. Scholars often describe the spatiotemporal evolution trend of regional land use qualitatively and quantitatively, exploring the changing characteristics and spatial pattern of different land use types in a certain region during a specific period on a time and space scale and dynamically monitoring the expansion of urban land [5]. For example, by considering different environmental characteristics, the land use expansion and land use change in coastal areas can be studied [6], and LUCC studies focus on impervious surfaces and barren hills and wastelands [7]. In addition, driving factors can be interpreted after the spatiotemporal evolution trend of regional LUCC has been obtained [8]; for example, moving t-tests and random forest models were used to identify the long-term sequence of China’s industrial land transformation and find its dominant external driving factors [9].
Research on LUCC can help judge the trend of regional ecological environment change and provide scientific support for ecological restoration and regional ecological governance decision making [10]. Change in ecological environment quality is affected by many factors, including atmosphere, water environment, soil, etc., which affect the ecosystem to varying degrees [11]. In describing the quantity and spatial characteristics of regional ecological environment changes, indicators such as ecological environment quality indices (EQIs) and ecosystem service values [12] can be used to objectively reflect the overall habitat quality level of the region [13,14]. The EQI index is often used as an important reference value to measure the degree of land change in the ecological environment; the overall situation of the study area is quantitatively characterized by fuzzy assignment through expert scoring; and the impact of different land use changes on regional ecological environment quality is determined by using the ecological contribution rate index [15]. In studying the ecological effects of LUCC, scholars focus on improving landscape structure optimization and enhancing biodiversity [16,17].
Establishing effective land cover change simulation models helps to promote research on sustainable land use and more comprehensively analyze the mutual feedback relationship between human activities, land use, and the ecological environment. Scholars have conducted a large number of studies on LUCC by using multiple types of land use simulation and prediction models, including analysis and prediction involving different regions, scales, driving factors, scenarios, and other perspectives. Prediction results differ due to the use of different models, and there is still no unified standard for the rationality of prediction [18,19,20]. At present, the widely used models mainly include system dynamics models, PLUS models, Markov models, etc. [21,22,23]. For example, the soil erosion characteristics of a basin can be analyzed in multiple scenarios based on PLUS models and RUSLE models [24]; an MLP–Markov model (a multi-layer perceptron–Markov chain) can be used to predict dynamic change in land use and land vulnerability in a region and obtain estimated values for different types of land in the future [25]; and Markov models can be used to simulate regional land use change and explore the relationship between urban growth and landscape change and population growth [26]. Among the different models, the system dynamics model [27] and the Markov model [28] mainly adopt numerical simulation model analysis, which has the advantage of quantitative prediction; the CLUE-S model belongs to the class of spatial prediction models, pays more attention to spatial data information, and has the ability to predict change in spatial locations [29], but it is based on the traditional logistic regression method, which may ignore the internal autocorrelation of spatial data during spatial analysis, affecting the simulation accuracy to a certain extent [30]. As a single prediction model, it still cannot accurately judge the complexity of land use change, and it is difficult to achieve multi-scenario prediction. The PLUS model is a grid-based patch-generated land use simulation model, which can be used to explore the driving factors of land expansion and predict the patch-level evolution of land use across a landscape [23], which is conducive to exploring sustainable landscape layouts. The CA (cellular automata)–Markov model is one of the most widely used land use prediction models. This model combines the CA model and the Markov model. This model has the ability to simulate the spatial change in complex systems and has the advantage of enabling long-term prediction, that is, it has a better spatial dynamic simulation ability. This model can be used to explore the relationship between regional ecosystems and land use and carry out multi-scenario simulations [31,32].
Previous studies have provided a sufficient theoretical basis and development direction for LUCC and its ecological and environmental effects. However, in recent years, studies on LUCC and its ecological and environmental effects have mainly focused on single environmental factors or small-scale ranges, such as water, forests [33], and carbon [34], while studies on regional land use change and ecological and environmental effects at the scale of megalopolises are still lacking. Existing studies are mainly at the municipal and county levels, so it is necessary to carry out relevant studies at a larger scale. In addition, in terms of research methods, traditional mathematical characteristic analysis is widely used, but the comprehensive application of numerical–non-numerical model simulation and prediction is rare [35,36]. Therefore, it is urgent to carry out long-term studies on megalopolises and simulate the mechanism of the impact of land use change on ecological and environmental factors under different scenarios through comprehensive methods and technologies.
Since the beginning of this century, China’s urbanization process has been accelerating, and there have been extensive land use patterns and inadequate environmental carrying capacity [37], which have led to ecological and environmental problems such as soil erosion, land desertification, and a sharp shrinkage of forest and wetland resources [38]. In addition, a large amount of cultivated land is used as construction land, which also affects the country’s food security [39]. These phenomena will lead to increasingly severe contradictions between humans and land and seriously restrict sustainable development at economic and social levels. At present, China’s economy has entered a stage of high-quality development, and the spatial carrier of social and economic activities tends to be coordinated development in urban agglomerations. Therefore, answering the question of how to balance the relationship between economic development and ecological protection has become strategically important to improving the overall development level of the region. As one of the most dynamic economic regions in China, analysis of the Pearl River Delta (PRD) urban agglomeration should strengthen the study of the spatiotemporal evolution trends regarding LUCC and the resulting habitat problems as a basis for regional sustainable development and management and bring more theoretical support to regional LUCC and its ecological and environmental effects.
In this study, we propose a methodological framework to reveal the spatiotemporal evolution mechanism of LUCC and its impact on the ecological environment. Firstly, we comprehensively analyzed the spatiotemporal evolution trend of LUCC in an urban agglomeration over the past 30 years and calculated the ecological quality index for each city and the contribution of LUCC to habitat change in different periods. Secondly, we used the CA–Markov model to simulate land use status under multiple scenarios (a natural development scenario and an overall protection scenario) in 2030 and finally obtained the development trends of LUCC and its ecological environmental effects under different scenarios so as to provide policy suggestions for land consolidation and ecological protection. The above research framework can be used to monitor the changes in land use and ecological environment quality in the PRD urban agglomeration and predict future development trends, which is of great significance for analyzing the utilization and management of regional land resources and recovery strategies for the ecological environment.

2. Materials and Methods
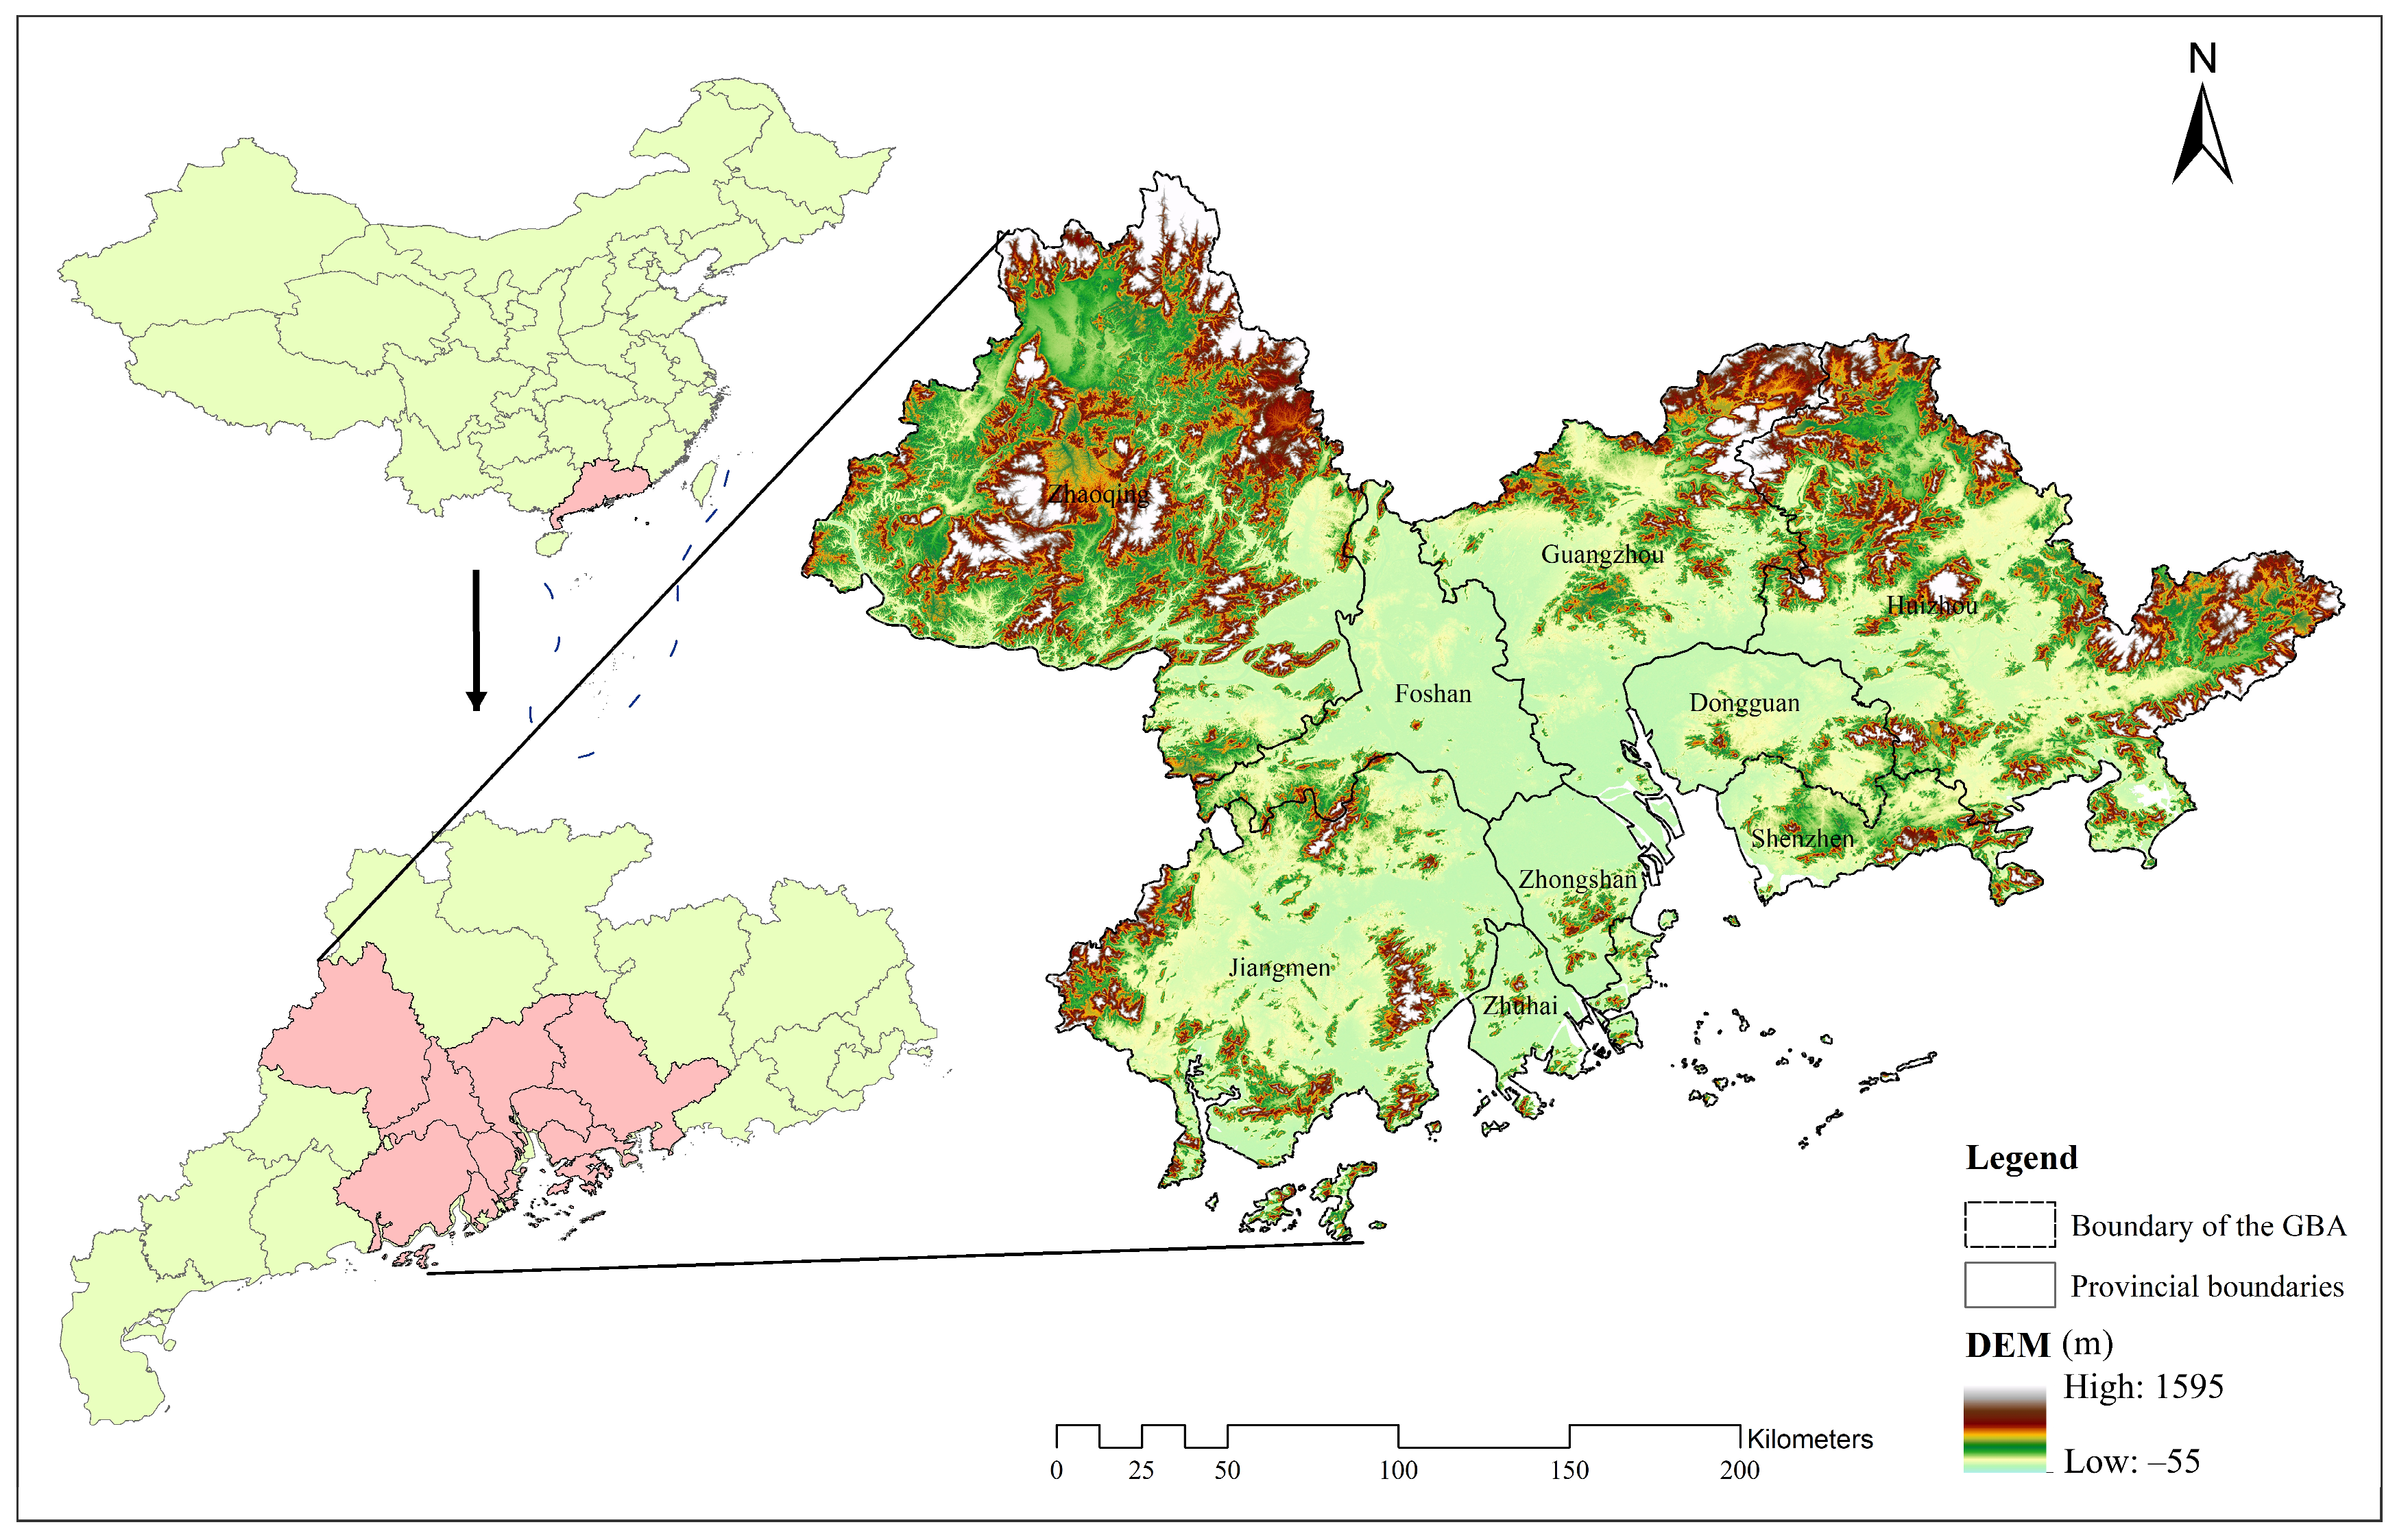
2.1. Study Area

The PRD urban agglomeration is composed of Guangzhou, Shenzhen, Zhuhai, Foshan, Dongguan, Zhongshan, Jiangmen, Huizhou, and Zhaoqing. It is adjacent to the Hong Kong and Macao Special Administrative Regions and is in the downstream area of the Pearl River in Guangdong Province. The region has obvious geographical advantages and is separated from Southeast Asia by the sea (Figure 1). From a natural perspective, the topography of the PRD urban agglomeration is complex, with hills, mountains, islands, and other features throughout the area resulting in relatively large fluctuations in elevation. The central area is a vast plain with an average elevation of no more than 100 m, including cities such as Jiangmen, Guangzhou, Foshan, Dongguan, and Zhongshan. The climate in the PRD region is a subtropical monsoon climate, with mild winters with low rainfall but hot summers. Additionally, the region has abundant rainfall and sunshine. In terms of economic development, in 2022, the total GDP of the PRD urban agglomeration exceeded CNY 10 trillion, accounting for 80.9% of the province’s total output value, and the permanent population reached 78.606 million. The industrial added value of five cities, namely, Shenzhen, Guangzhou, Foshan, Dongguan, and Huizhou, exceeded CNY 1 trillion, forming a certain radiating driving effect. The other four cities are also rapidly developing. The “New Urbanization Plan of Guangdong Province (2021–2035)” proposes that Zhuhai should drive the coordinated development of Zhongshan and Jiangmen and build an important growth pole in western Guangdong.

2.2. Data Sources

The study focused on the PRD region, consisting of nine cities, and the research period spanned 1990 to 2020, covering a 30-year period. Four phases of land use data with a resolution of 30 m were obtained from the Resource and Environmental Science Data Center of the Chinese Academy of Sciences (http://www.resdc.cn; accessed on 15 September 2022) with 10-year intervals, and the DEM data were obtained from the Geospatial Data Cloud (http://www.gscloud.cn/; accessed on 15 December 2022). The administrative boundaries of the research area were determined based on data from the National Basic Geographic Information Center (http://ngcc.sbsm.gov.cn; accessed on 15 July 2022) and were masked and preprocessed in ArcGIS 10.3. The data were reclassified into six primary categories, namely, arable land, forests, GL, water bodies, urban/rural/industrial/residential land (CTL), and unused land. The CA–Markov model, run in IDRISI, was utilized to predict land use changes, with precision verification conducted prior to prediction. The accuracy was assessed with a kappa coefficient greater than 85%, indicating good simulation results. Socioeconomic data were sourced from the statistical yearbooks of Guangdong Province, the Social Development Statistical Bulletin of Guangdong Province, and the statistical yearbooks of various cities.

2.3. Methodology

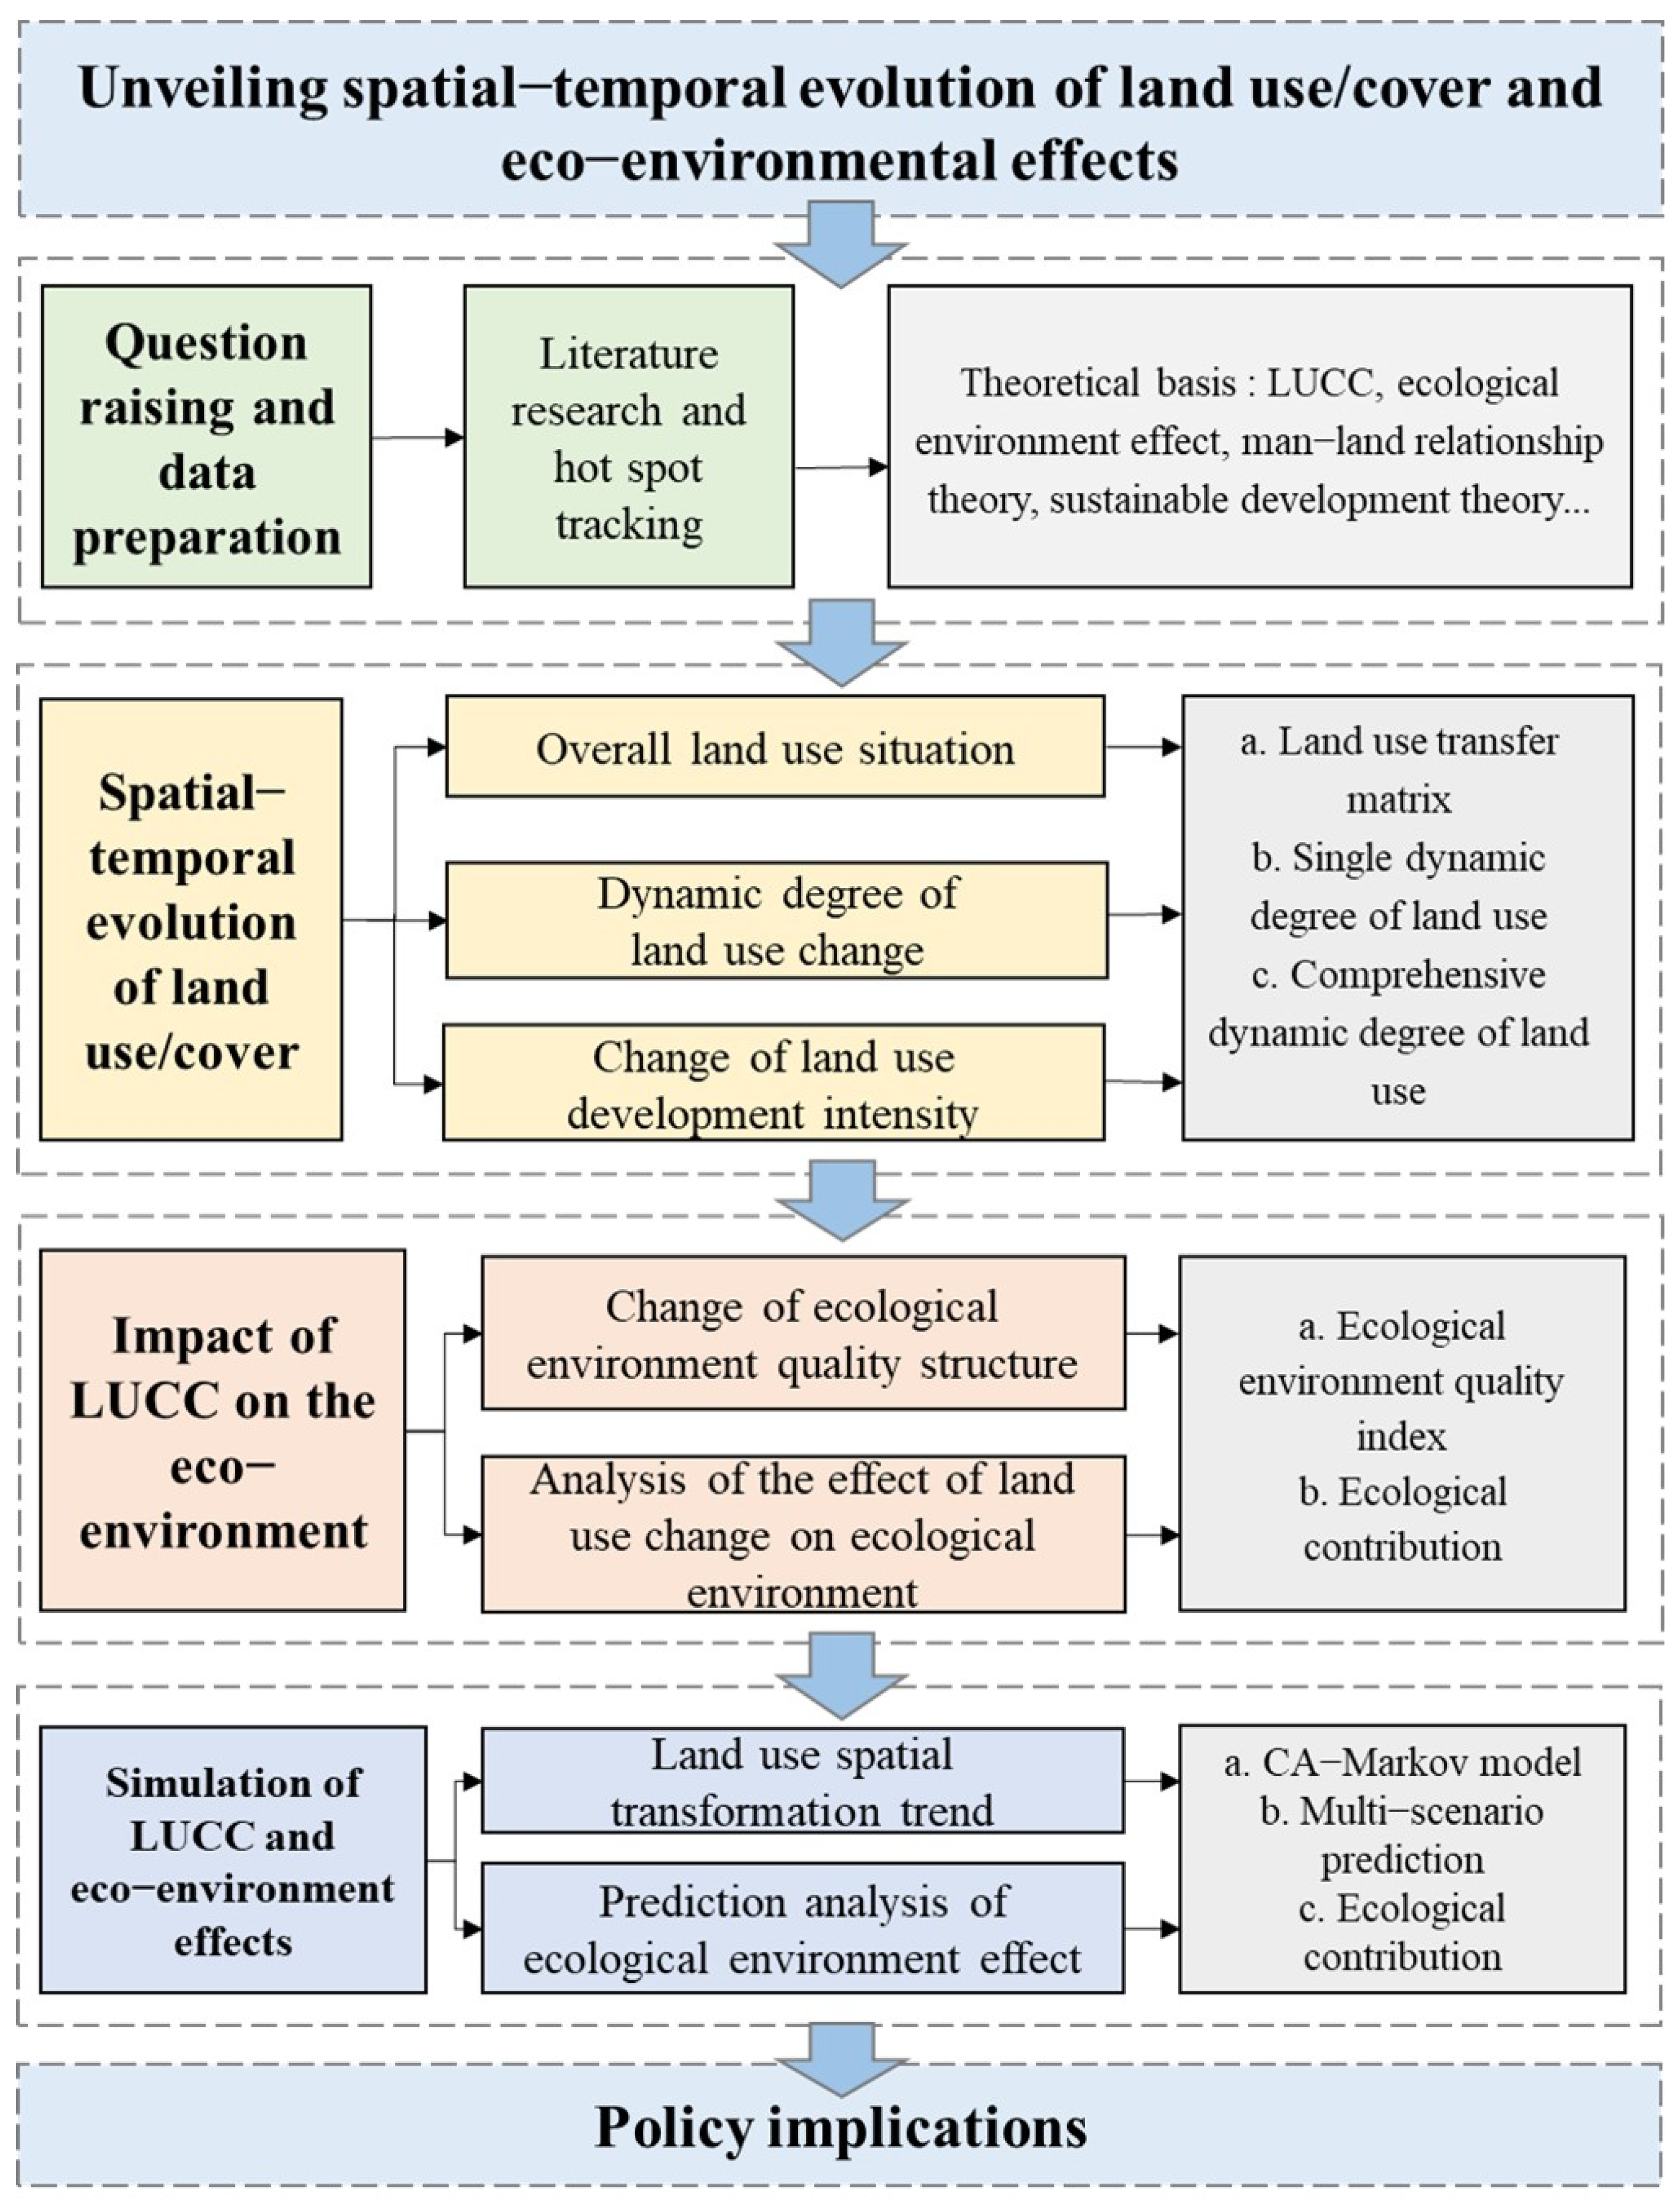
2.3.1. Methodological Framework

As more complex and comprehensive systems than single cities, adjacent urban areas may exhibit correlations with respect to their spatial development trajectories of land use. Focusing on the LUCC in cities and discussing the change trajectories of other human-made land uses, such as construction land and cultivated land, can provide explanations and references for the causes of deterioration in urban habitat quality at the level of anthropogenic factors. Moreover, when predicting future trends in ecological environmental changes, the differences between LUCCs under natural and anthropogenic intervention scenarios can be compared to obtain quantitative results on ecological environmental quality under different scenarios, thus providing a reference to promote regional sustainable development.
In this study, we proposed a methodological framework for unveiling the spatial–temporal evolution mechanism of LUCC and its impact on eco-environmental effects (Figure 2). First, we investigated the spatiotemporal evolution of land use transformation in an urban agglomeration to examine the differences in change velocity between cities and to explore the functional structural transformation. Then, we examined the effects of land use change on the ecological environment in the urban agglomeration to explore the dynamic evolution trend of ecological quality during land use transfer in the urban agglomeration. Finally, this paper focused on the simulation of LUCC and ecological environmental effects. The CA–Markov model was applied to simulate spatial pattern changes in land use in the future. Using the land use transfer matrix, the ecological environment quality index, and ecological contribution rates, we deeply analyzed the impact of land use changes on the ecological environment under different scenarios.

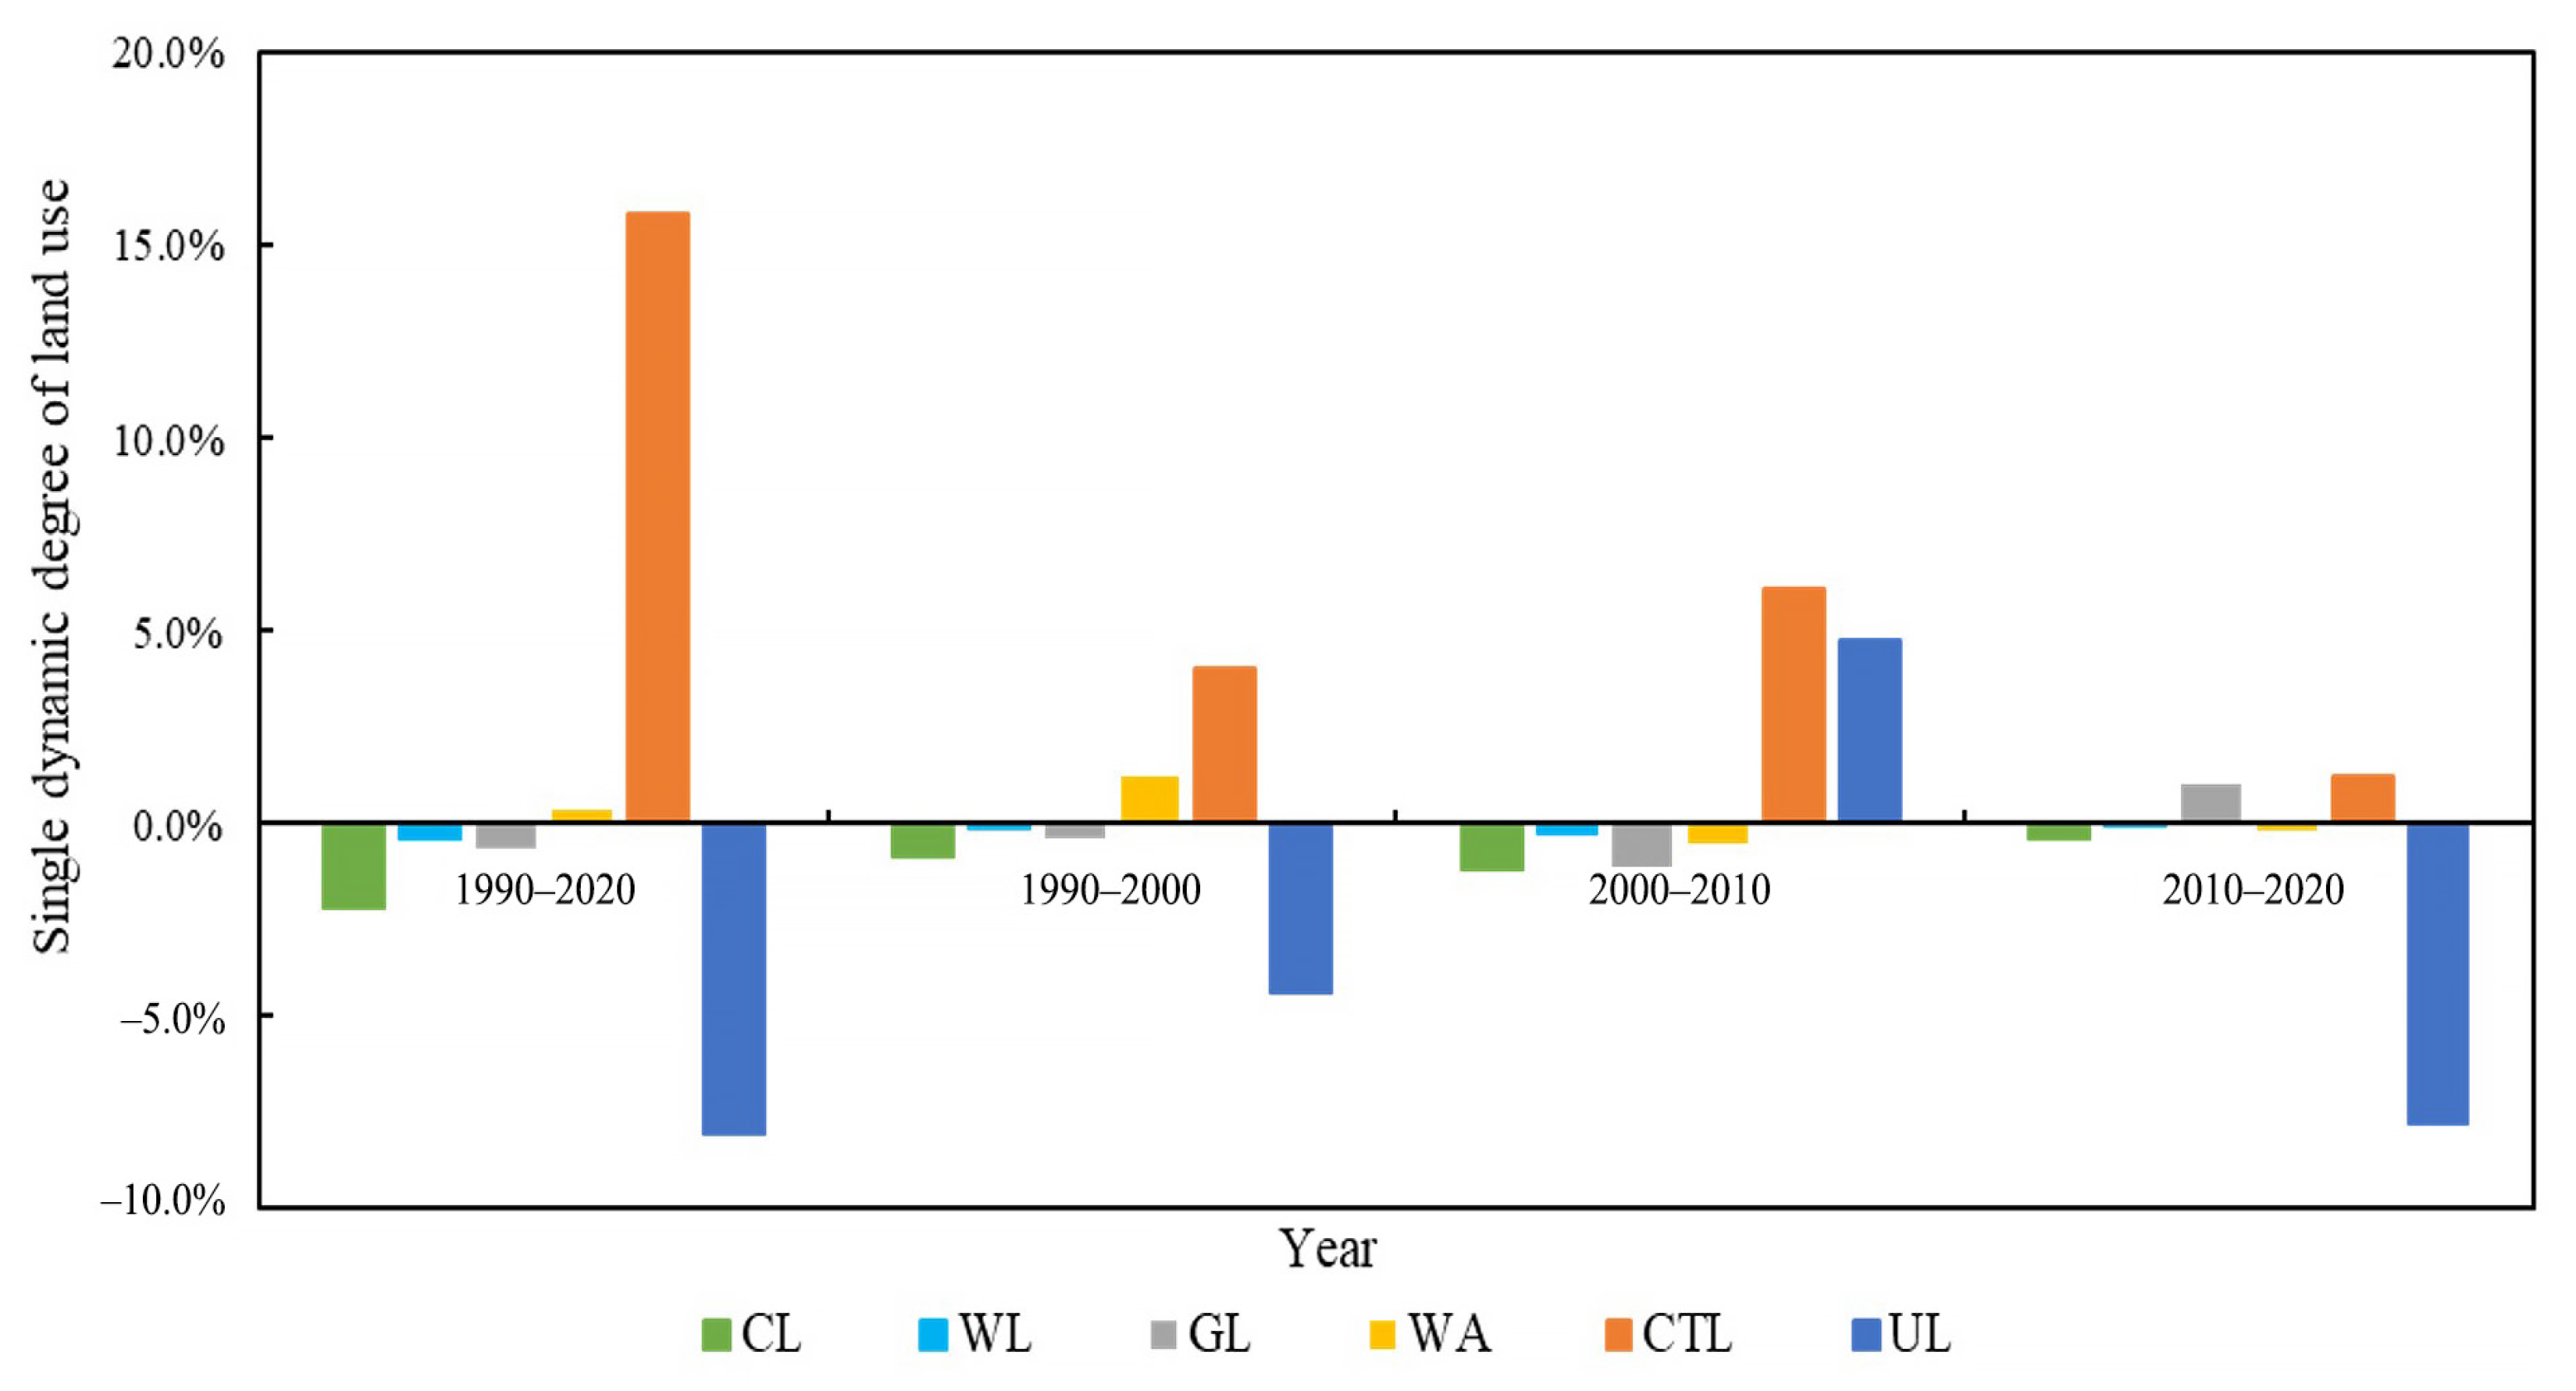
2.3.2. Land Use Dynamic Degree

The land use dynamic model is a commonly used model for tracking changes in the quantity of land resources. It can reflect the speed of changes in land usage in an urban area. Land use dynamics can be divided into two types: single dynamics and comprehensive dynamics [40,41].
A single land use dynamic (K) reflects the rate of change in the area of a single land use type over a period of time. Its calculation formula is as follows:
K = U m U n U m × 1 T × 100 %
where Um is the area of the single land use type at the beginning of the period, Un is the area of the same land use type at the end of the period, and T is the time interval between the beginning and the end of the period, usually in years.
The land use comprehensive dynamic degree (Lc) characterizes the overall annual change rate of land use within the study area [42]. The formula is as follows:
L C = i = 1 n Δ L U i j 2 i = 1 n L U i × 1 T × 100 %
where LUi is the initial size of the i-th land use type area, ΔLUij is the absolute value of the area of the i-th land use type transformed into the j-th land use type at the end of the study period, and T is the interval period.

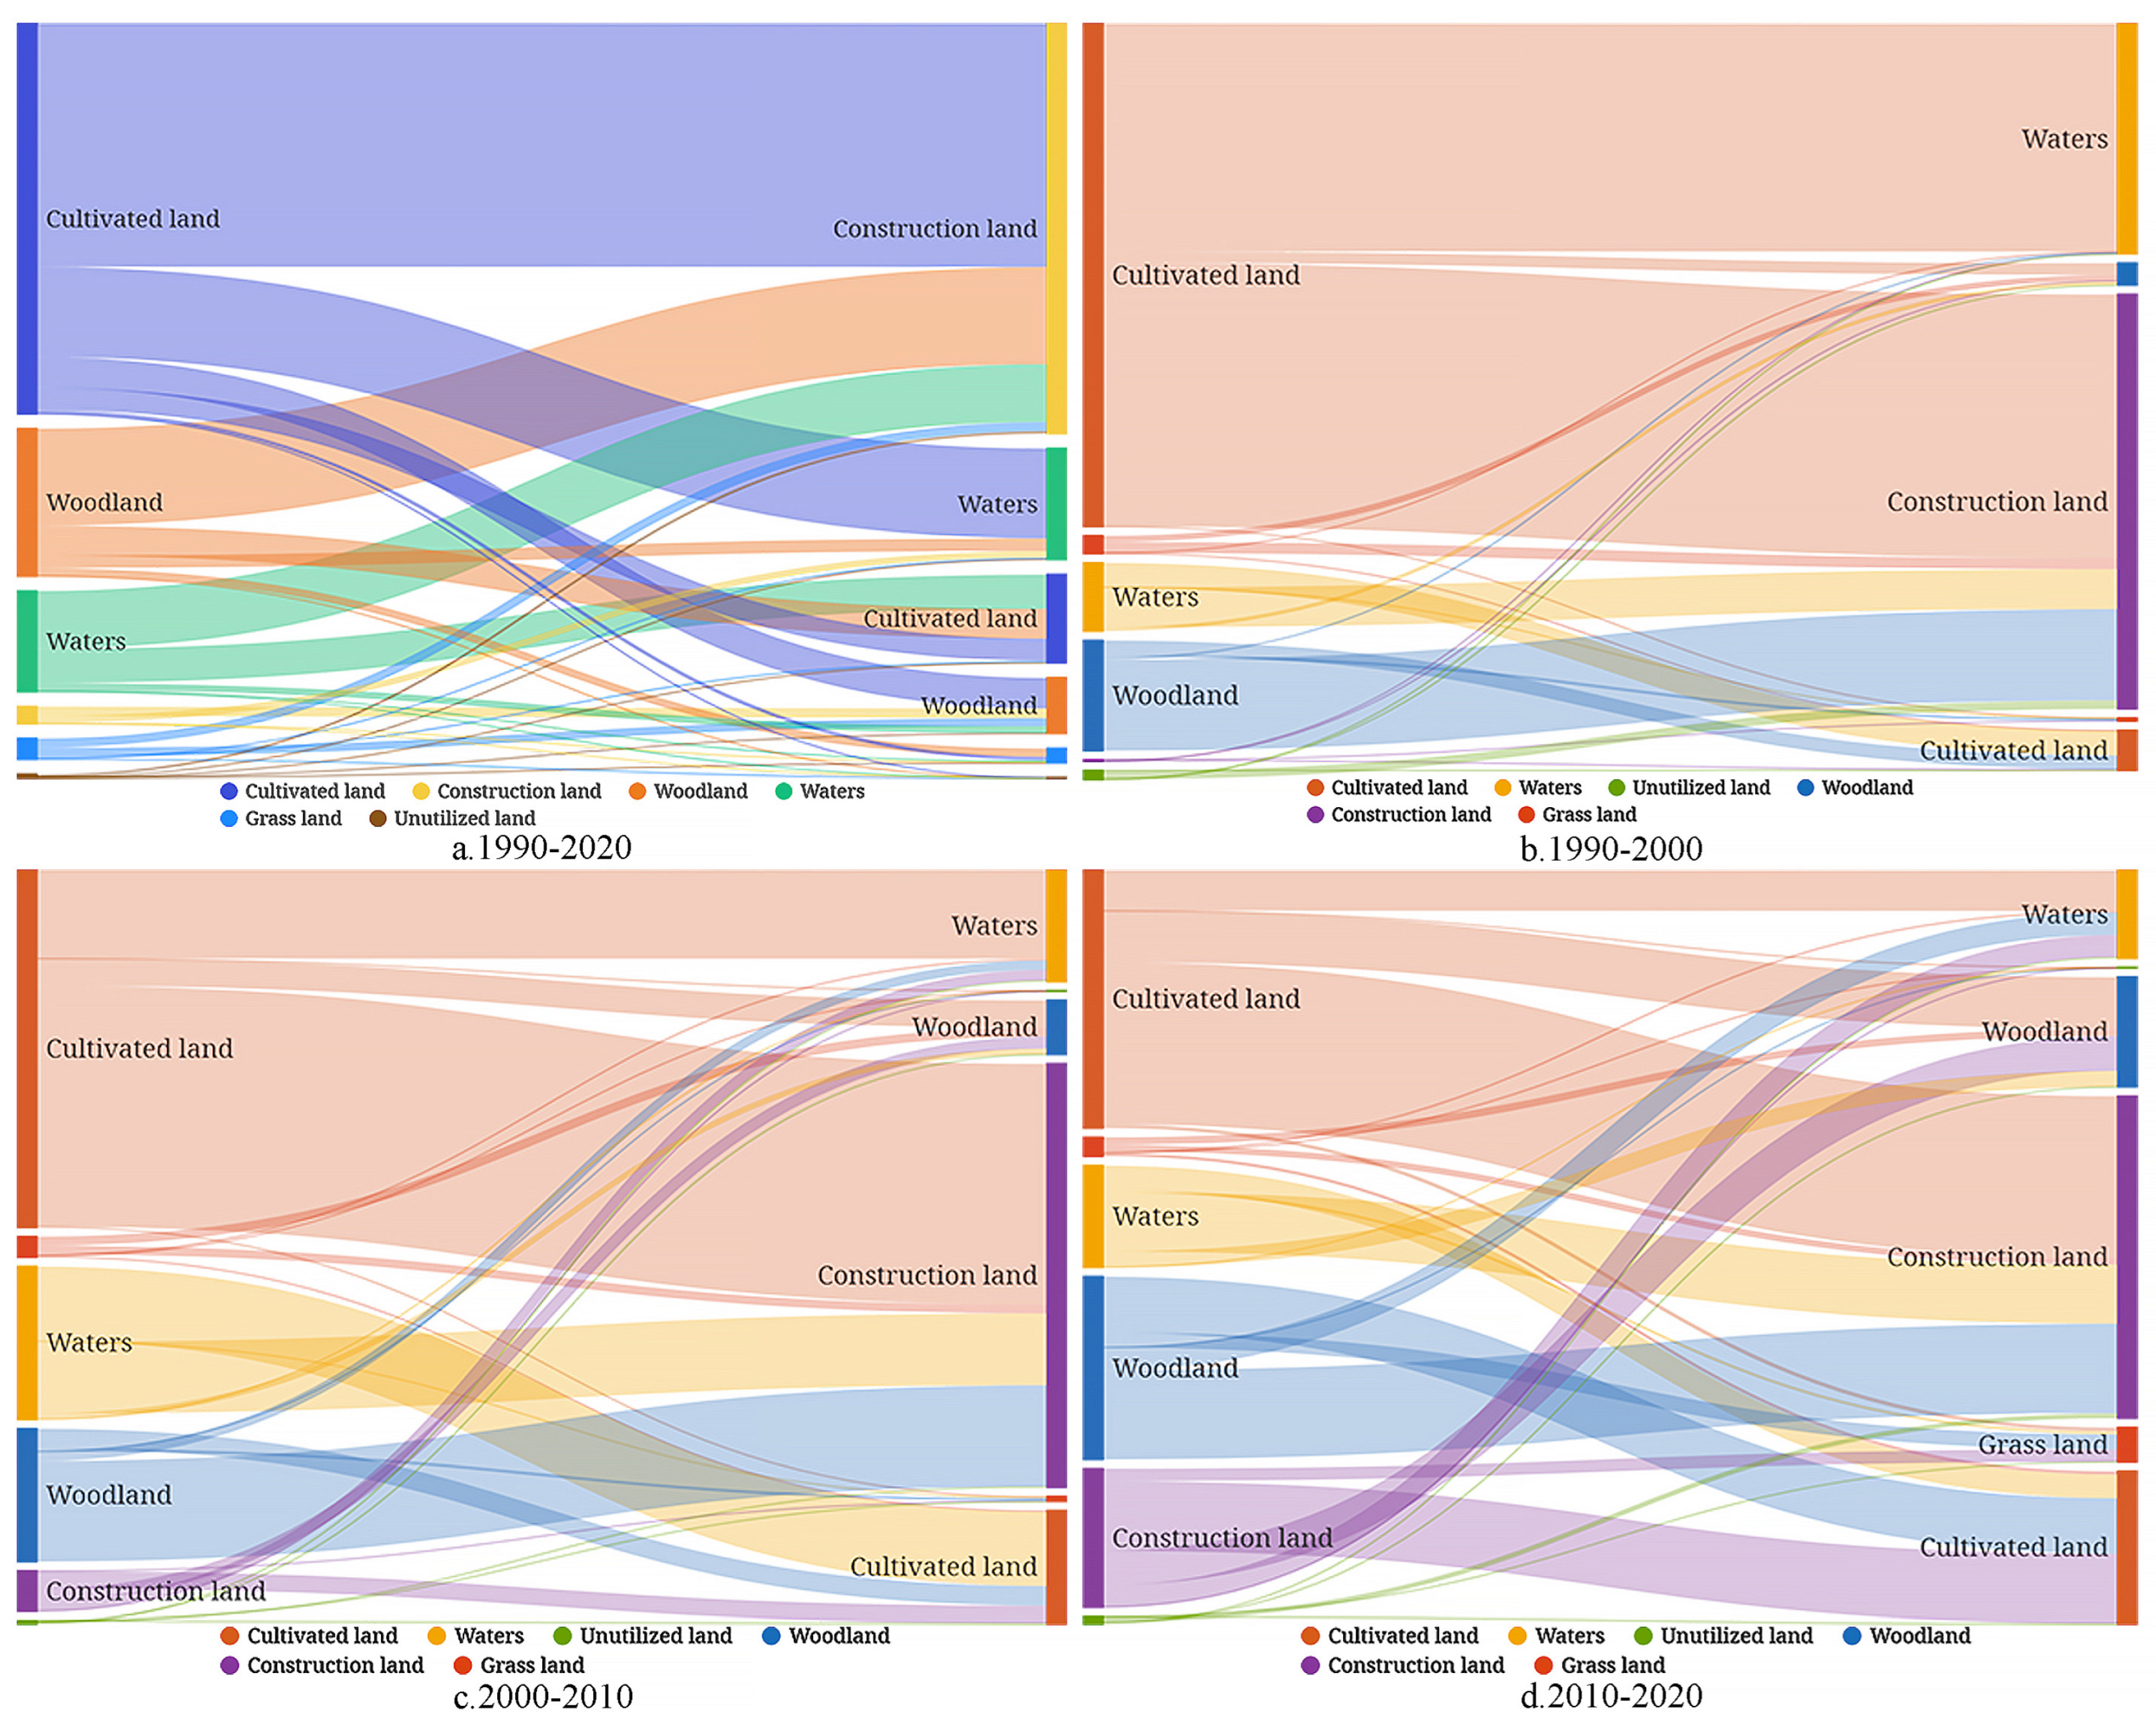
2.3.3. Land Use Transfer Matrix

Using four years of land use data from the PRD urban agglomeration and reclassifying the land use into primary categories, we conducted an intersection analysis using the ArcGIS 10.3 platform to obtain a land use transition matrix. The resulting values could be used to determine the amount of land area that underwent a transition from one land use type to another within the urban agglomeration during the study period. By analyzing the different transition areas, we determined the degree of change for different land use types. The formula for the calculation is as follows:
S i j = S 11 S 1 n S n 1 S n n
where Sij represents the land area during the study period, n represents the number of land types, i represents the initial land type, and j represents the final land type.

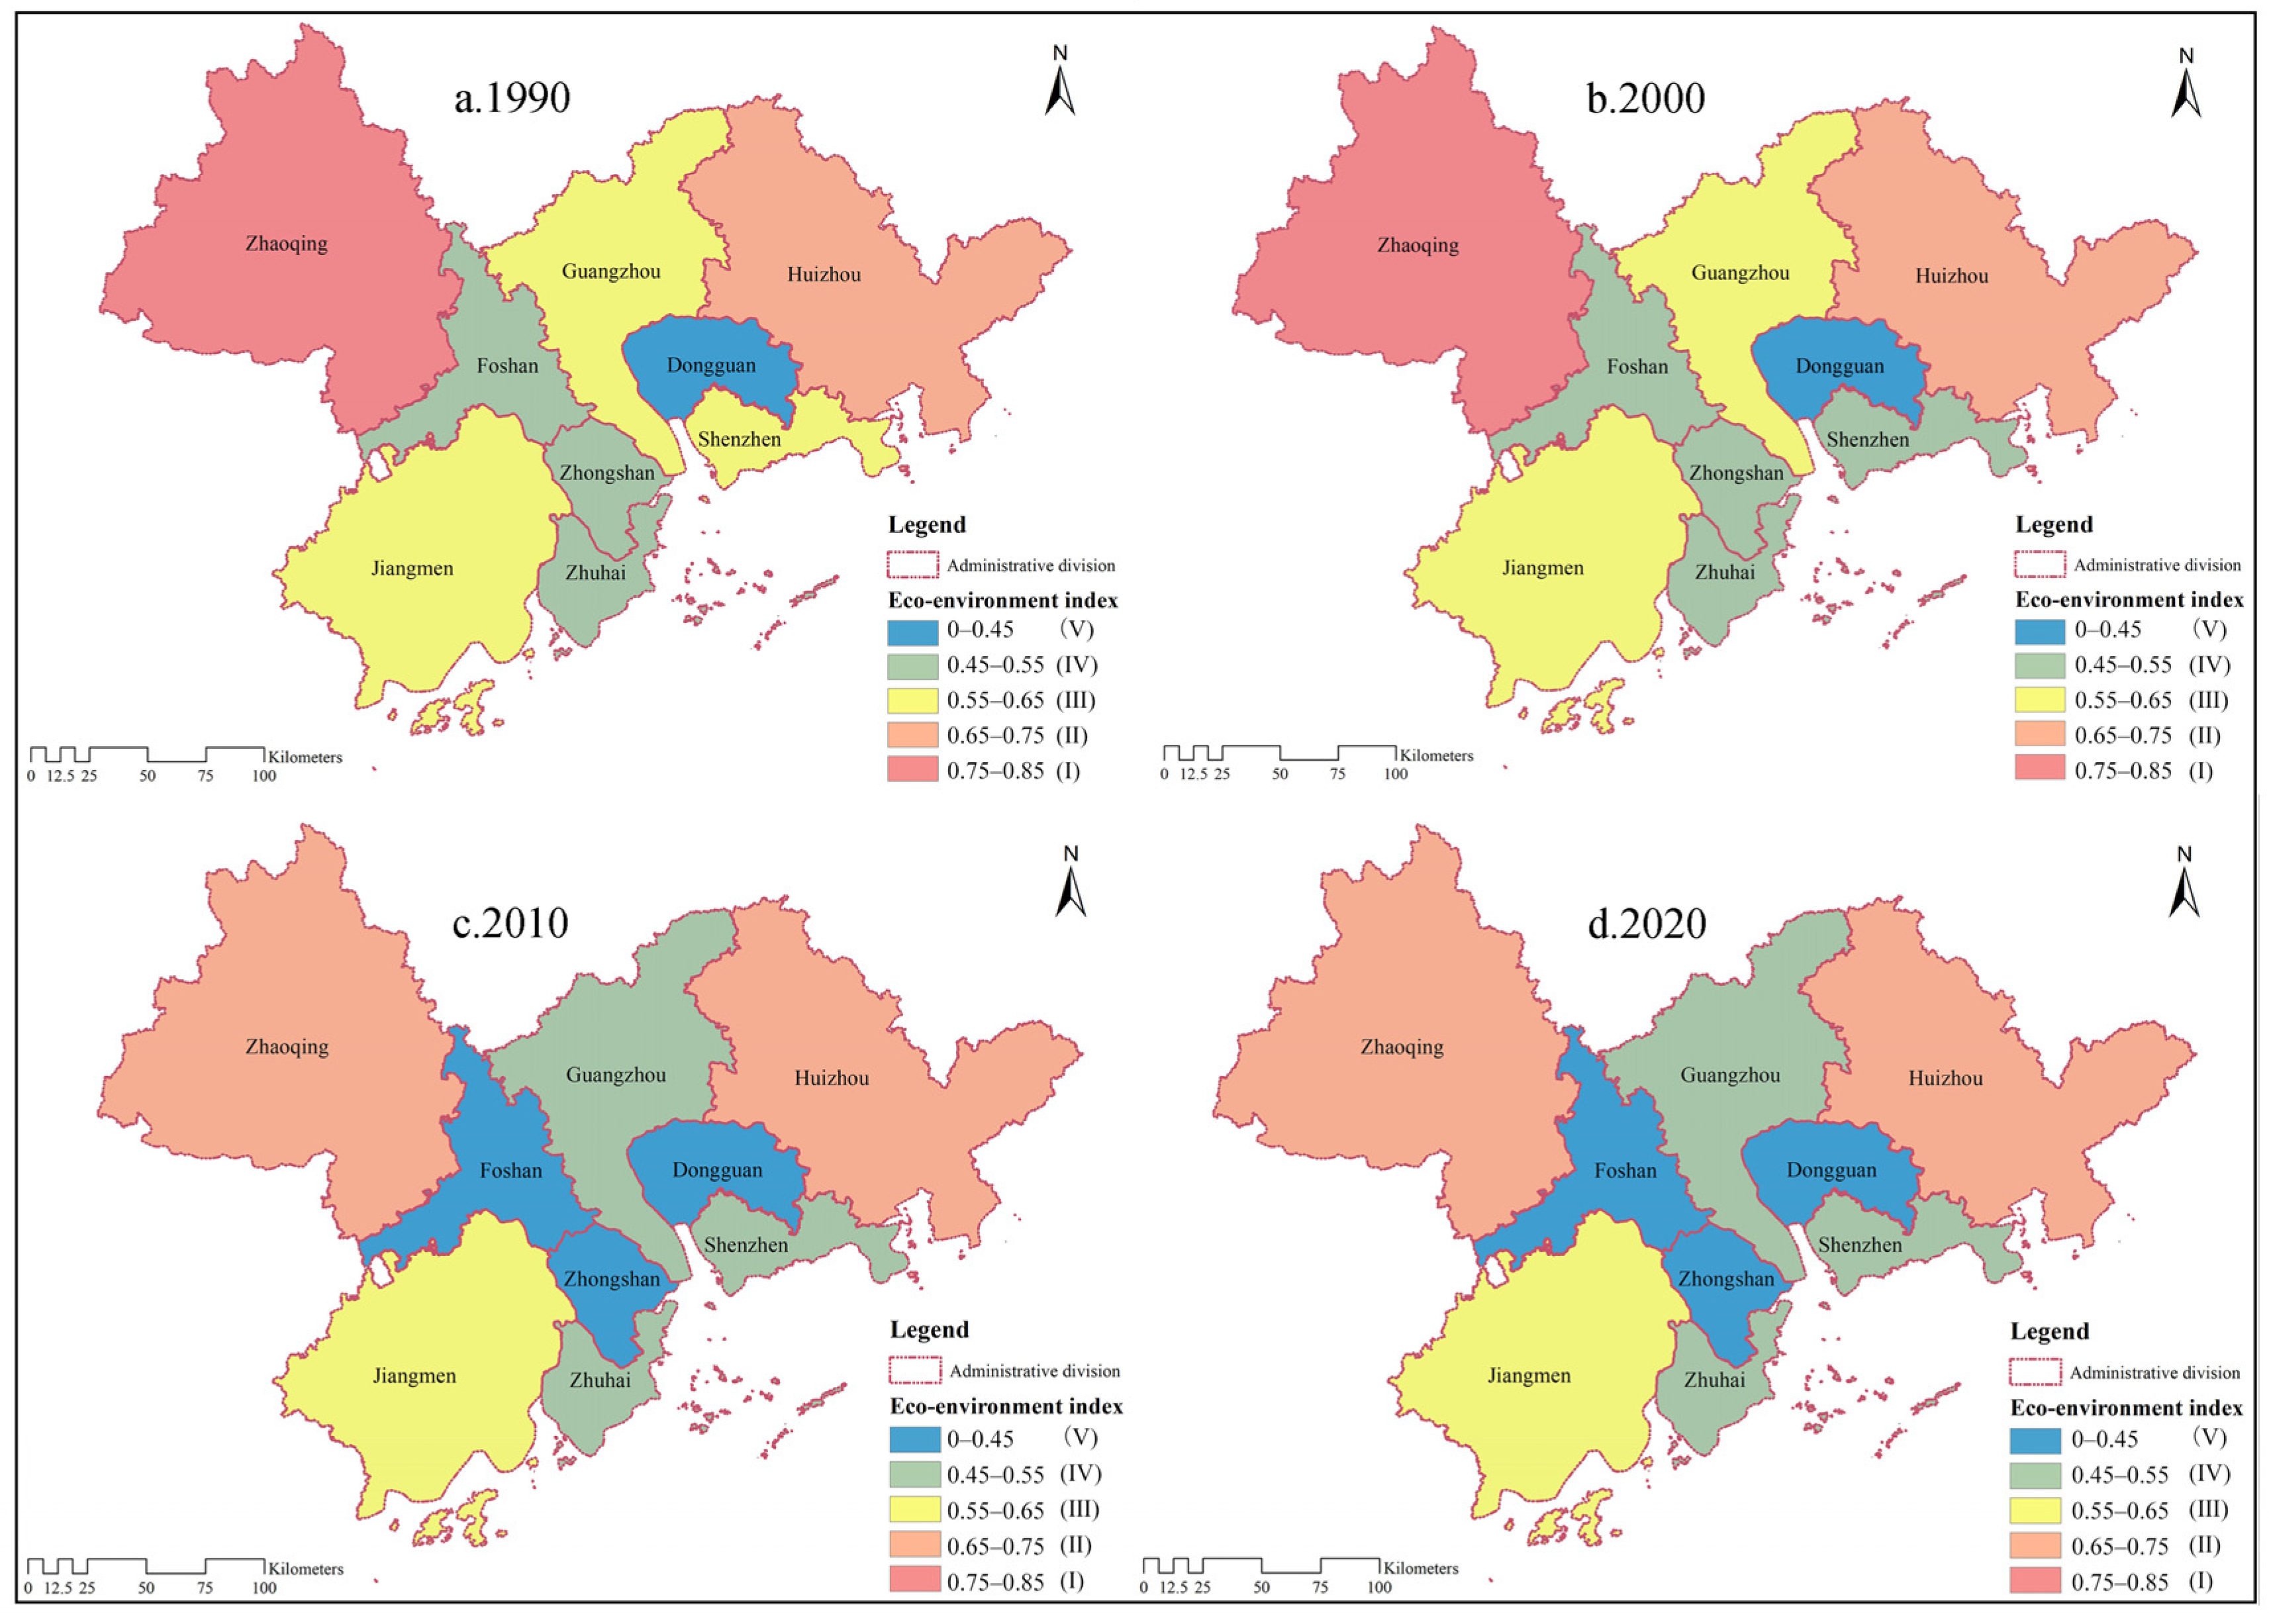
2.3.4. Ecological Environment Quality Index (EEQ)

When exploring the trends of changes in ecological and environmental quality brought about by regional land use, the EEQ index can be used to quantitatively characterize the overall and individual ecological and environmental quality of each city within the urban cluster [43]. The formula is as follows:
E V t = n = 1 i L C n G n A
where LCn and Gn represent the area of the n-th LUCC type and EV for the region during period t, respectively; i represents the number of land types in the study area; and A represents the area of the study region.
Table 1 was obtained based on expert ratings and the actual land use situation in the PRD region. To more clearly show the spatial evolution trend of urban EEQ, based on the classification of urban ecological values (EVs) in 1990, this paper used the natural breakpoint classification method to divide the index value into five categories (Li et al., 2003) [15], namely, Class V habitat (0 ≤ EV < 0.45), Class IV habitat (0.45 ≤ EV < 0.55), Class III habitat (0.55 ≤ EV < 0.65), Class II habitat (0.65 ≤ EV < 0.75), and Class I habitat (0.75 ≤ EV < 0.85). The quality of Class V habitat is the lowest, and the quality of Class I habitat is the highest.

2.3.5. Ecological Contribution Rate

The ecological contribution of the land use change index (CLEI) was used to characterize the dynamic changes in the overall EEQ of urban agglomerations caused by LUCC. Specifically, it refers to the degree of improvement or deterioration in the ecological quality of the study area caused by the conversion of a single land use type to another. The formula for calculating CLEI mainly considers the external conversion between different land use types. The calculation formula is as follows:
C L E I = ( L E t + 1 L E t ) × L C A A
where LEt+1 and LEt represent the end and beginning periods of EVs, respectively; LCA represents the area of single land use change during the study period; and A represents the total area of the region.

2.3.6. CA–Markov Model

The Markov chain is a traditional method for modelling land use change that describes a transition from the present to the future. The land use transition matrix forms the basis for predicting future changes, and by creating a probability matrix for land use transition, future trends in land use change can be efficiently predicted [44,45,46]. The formula is as follows:
S ( t + 1 ) = P i j × S ( t )
where Pij is the state transition matrix and S(t+1) and S(t) represent the state of the land use system at times t + 1 and t, respectively.
However, the Markov model lacks spatial variables and cannot explain the spatial distribution of different land use types in a study area. However, the CA model, as an infinite-dimensional dynamic system, has the ability to simulate the spatial evolution trend of a system over time by discretizing time, space, and states [47]. The formula for this model is as follows:
S t + 1   = f S t , N
where N represents the neighborhood of the cell, f represents the local spatial cell transformation rule, and S represents the cell state aggregation.
The CA–Markov model combines the advantages of both models and adds spatial features to the mathematical model, simulating the quantity change and spatial distribution characteristics of land use in a study area through a quantitative and spatial distribution feature analysis [48]. This study utilized IDRISI software as the operational platform for simulation and prediction using the CA–Markov model. The specific steps were as follows: Firstly, the raster files were classified in ArcGIS 10.3, using a reference classification system of 6 categories (CL, WL, GL, CTL, WA, and UL). The reclassified files were then converted into ASCII format. Secondly, the operation was carried out in the IDRISI software platform, where a project directory was created, and the ASCII files were converted into raster files in IDRISI format, with projection parameters set accordingly. Thirdly, the data were reclassified again in the IDRISI software to obtain Markov matrices and generate suitability maps. Through this method, we obtained the land use transition area matrix and the transition probability matrix for the years 2000 and 2010. Finally, using the CA–Markov model, simulations and predictions were conducted by setting the number of iterations for the cellular automaton to 5.
The simulation accuracy of the CA–Markov model was analyzed for the first time by comparing the land use results obtained from the platform’s simulation for the year 2020 with actual land use data for the same year and calculating the simulation accuracy. This step involved the use of the crosstab module in the IDRISI platform to calculate the kappa coefficient, where a kappa value above 0.9 is considered to meet the acceptable standard of simulation accuracy. The kappa result for the accuracy verification in this study was calculated as 0.9215, indicating a relatively ideal prediction result. Finally, based on the 2010 and 2020 grid data, multiple development scenarios were set and the land use simulation results for 2030 were predicted.

2.3.7. Dynamic Simulation Scenario Setting

Due to its close correlation with socioeconomic development and policy orientation, LUCC differs under different developmental backgrounds. Based on previous research, this study set two scenarios for simulating land use changes: the natural development scenario (NDS) and the coordinated protection scenario (CPS), aiming to predict the spatial pattern differences of land use in the study area in 2030 under different scenarios. The two scenarios were defined as follows: (1) The natural development scenario (NDS): This scenario was used as a benchmark for comparison with other scenarios. It was based on the analysis of land use changes and development trends from 2010 to 2020, without considering the impact of policy orientation in the next decade. The area transition matrix and transition probability matrix were obtained by using Markov tools, and the land use transition matrix was imported as a suitability file into the prediction tool for simulation. (2) The coordinated protection scenario (CPS): This scenario took the protection of land use types related to ecology in the PRD as the main development constraint factor and referenced the basic farmland protection principles and the ecological protection policies of “returning farmland to forest, grassland, and lake” to reasonably protect ecological land and control the conversion of forestland, GL, and WA, which are related to natural resources, to CTL. This scenario emphasized the sustainable development of the urban agglomeration. In terms of setting the conversion rate between different land use types, it did not allow forestland, GL, or WA to be converted to other land uses and it reduced the possibility of converting CL by 50% to protect agricultural land.

3. Results

3.1. Spatiotemporal Evolution Characteristics of LUCC

The overall changes in land use in the PRD over the past 30 years were more intuitively presented based on the first-level classification, as shown in Figure 3. Between 1990 and 2020, the land use changes in the PRD exhibited a trend of “four decreases and two increases”. The land use types that decreased in area included CL, WL, GL, and UL, while the land use types that increased in area included CTL and WA. Cropland experienced the largest decrease in area, with a reduction of 3807.96 km2 over 30 years, shrinking by 24.02% from 1990 to 2020. Forestland showed the second largest decrease, decreasing by 1242.69 km2 during the study period. Unused land exhibited the greatest rate of decline, decreasing by 88.28%. From 1990 to 2020, the area of CTL increased by 5166.07 km2, with a growth rate of 173.88%, while the area of WA slightly increased, with an increase of 166.3 km2, representing a growth of 4.26% compared to 1990.
From 1990 to 2000, the LUCC in the PRD mainly showed decreases in cropland, forestland, GL, and UL, while CTL and WA increased. Between 2000 and 2010, the transformation of various land use types reached its peak in terms of both quantity and rate of change over the thirty years. The significant decreases in cropland, forestland, and grassland indicated a marked deterioration in ecological environmental quality. From 2010 to 2020, the trend of land use changes significantly weakened.
From a spatial perspective, there were significant changes in land use in the PRD during the study period (Figure 4). The expansion trajectory mainly extended inwards along the Pearl River Estuary. Similarly, the WA experienced noticeable changes. In 1990, there was a large concentration of dense river networks on the west side of the estuary. However, by 2010, the river networks were encroached upon by large areas of cropland and urban land, resulting in a drastic reduction in their areas. The distribution of river networks changed from large patchy structures to a thin and dense north–south waterway pattern. In terms of cropland, it was evident that, in 2010, large areas of cropland in the central and southern parts of the PRD were encroached upon by CTL, while the changes in CL area in the western and northwestern regions were relatively minor. From the perspective of numerical changes, the pie chart in Figure 4 records the pro-portion of main land use types in the study area in every 10-year interval from 1990 to 2020. The proportion of CTL in the entire PRD increases from 6% in 1990 to 15% in 2020, while the proportion of CL decreases from 29% to 22%.
The single dynamic attitudes of the major land use types in the PRD region were used to calculate the rate of change in land use type area, as shown in Figure 5. The area of CTL showed the highest rate of change between 1990 and 2020, with a total change rate of 15.81%. The change rates for the three time periods were 4.02%, 6.08%, and 1.25%, indicating that the study area has undergone rapid urbanization over the past 30 years, with a significant increase in CTL. The second highest rate of change was observed for unused land, with change rates of −4.35%, −4.78%, and −7.75% for each time period. The increasing change rate of unused land indicated a deepening of development and utilization. The rate of change in arable land area was significantly higher than that in forestland and GL, and the total change rates for the three land use types were negative, indicating that land degradation and ecological environment deterioration have occurred in the PRD (Figures S1–S6).
The overall dynamic rate of land use in the PRD over the 30-year study period was 1.75%. Looking at the stages, the dynamic rate of land use from 1990 to 2000 was 0.31%, while the rates for the two subsequent periods, 2000–2010 and 2010–2020, were 0.49% and 0.16%, respectively. Similarly, the overall dynamic rate of land use was used to measure regional differences in dynamic change (Figure 6). The results showed that the cities near the mouth of the PRD, including Shenzhen, Zhuhai, Dongguan, Zhongshan, Foshan, and Guangzhou, had significantly higher overall dynamic rates of land use than the more peripheral cities. Among them, Dongguan had the highest overall dynamic rate, with a total dynamic rate of 3.57%, while Huizhou, Jiangmen, and Zhaoqing had lower overall dynamic rates than the other cities. Looking at the three time periods separately, from 1990 to 2010, Shenzhen had the highest overall dynamic rate, while Zhaoqing’s overall dynamic rate remained the lowest and unchanged. Between 2010 and 2020, there was a clear downwards trend in the overall dynamic rates of the nine cities in the PRD urban agglomeration, indicating a new stage in urbanization development.
Using analysis tools in ArcGIS 10.3, land use transition matrices were calculated for four time periods: 1990–2020, 1990–2000, 2000–2010, and 2010–2020. These matrices were used to create Sankey diagrams showing the changes in land use types over the 30-year period. The diagrams are shown in Figure 7.
From the 1990–2020 transition matrix, it was shown that cropland experienced the most drastic changes, with 1223.88 km2 and 419.3 km2 of cropland converted into water and forestland, respectively. Another 53.28 km2 of cropland changed to GL. In addition, 3313.35 km2 of CL was converted into CTL, highlighting the impacts of urbanization and excessive land development on CL. Forestland and GL were also affected, with 787.48 km2 and 123.56 km2 converted into CTL and 304.28 km2 of forestland and 27.14 km2 of GL converted into cropland. WA was primarily converted into cropland and CTL, with areas of 467.42 km2 and 787.48 km2, respectively. This result underscores the intensive human exploitation of land over the past 30 years.
Looking at the 1990–2000 transition matrix, cropland was the type of land most affected during this decade, with 838.36 km2 and 724.46 km2 converted into CTL and water bodies, respectively. The period of 2000–2010 was the most drastic in terms of land use change in the PRD. According to the transition matrix, CL was the most converted type of land, with 1769.84 km2 converted into CTL and 650.59 km2 converted into water bodies. Meanwhile, forestland was the most heavily logged in CTL, with 744.82 km2 of forestland having been converted. WA also experienced heavy conversion, with 527.54 km2 converted into CTL and 548.44 km2 converted into cropland, which accounted for 95.8% of all converted water bodies. From 2010 to 2020, the transition matrix showed that the area of cropland converted to CTL decreased by 51.9% compared to the previous decade, with a value of 850.68 km2.

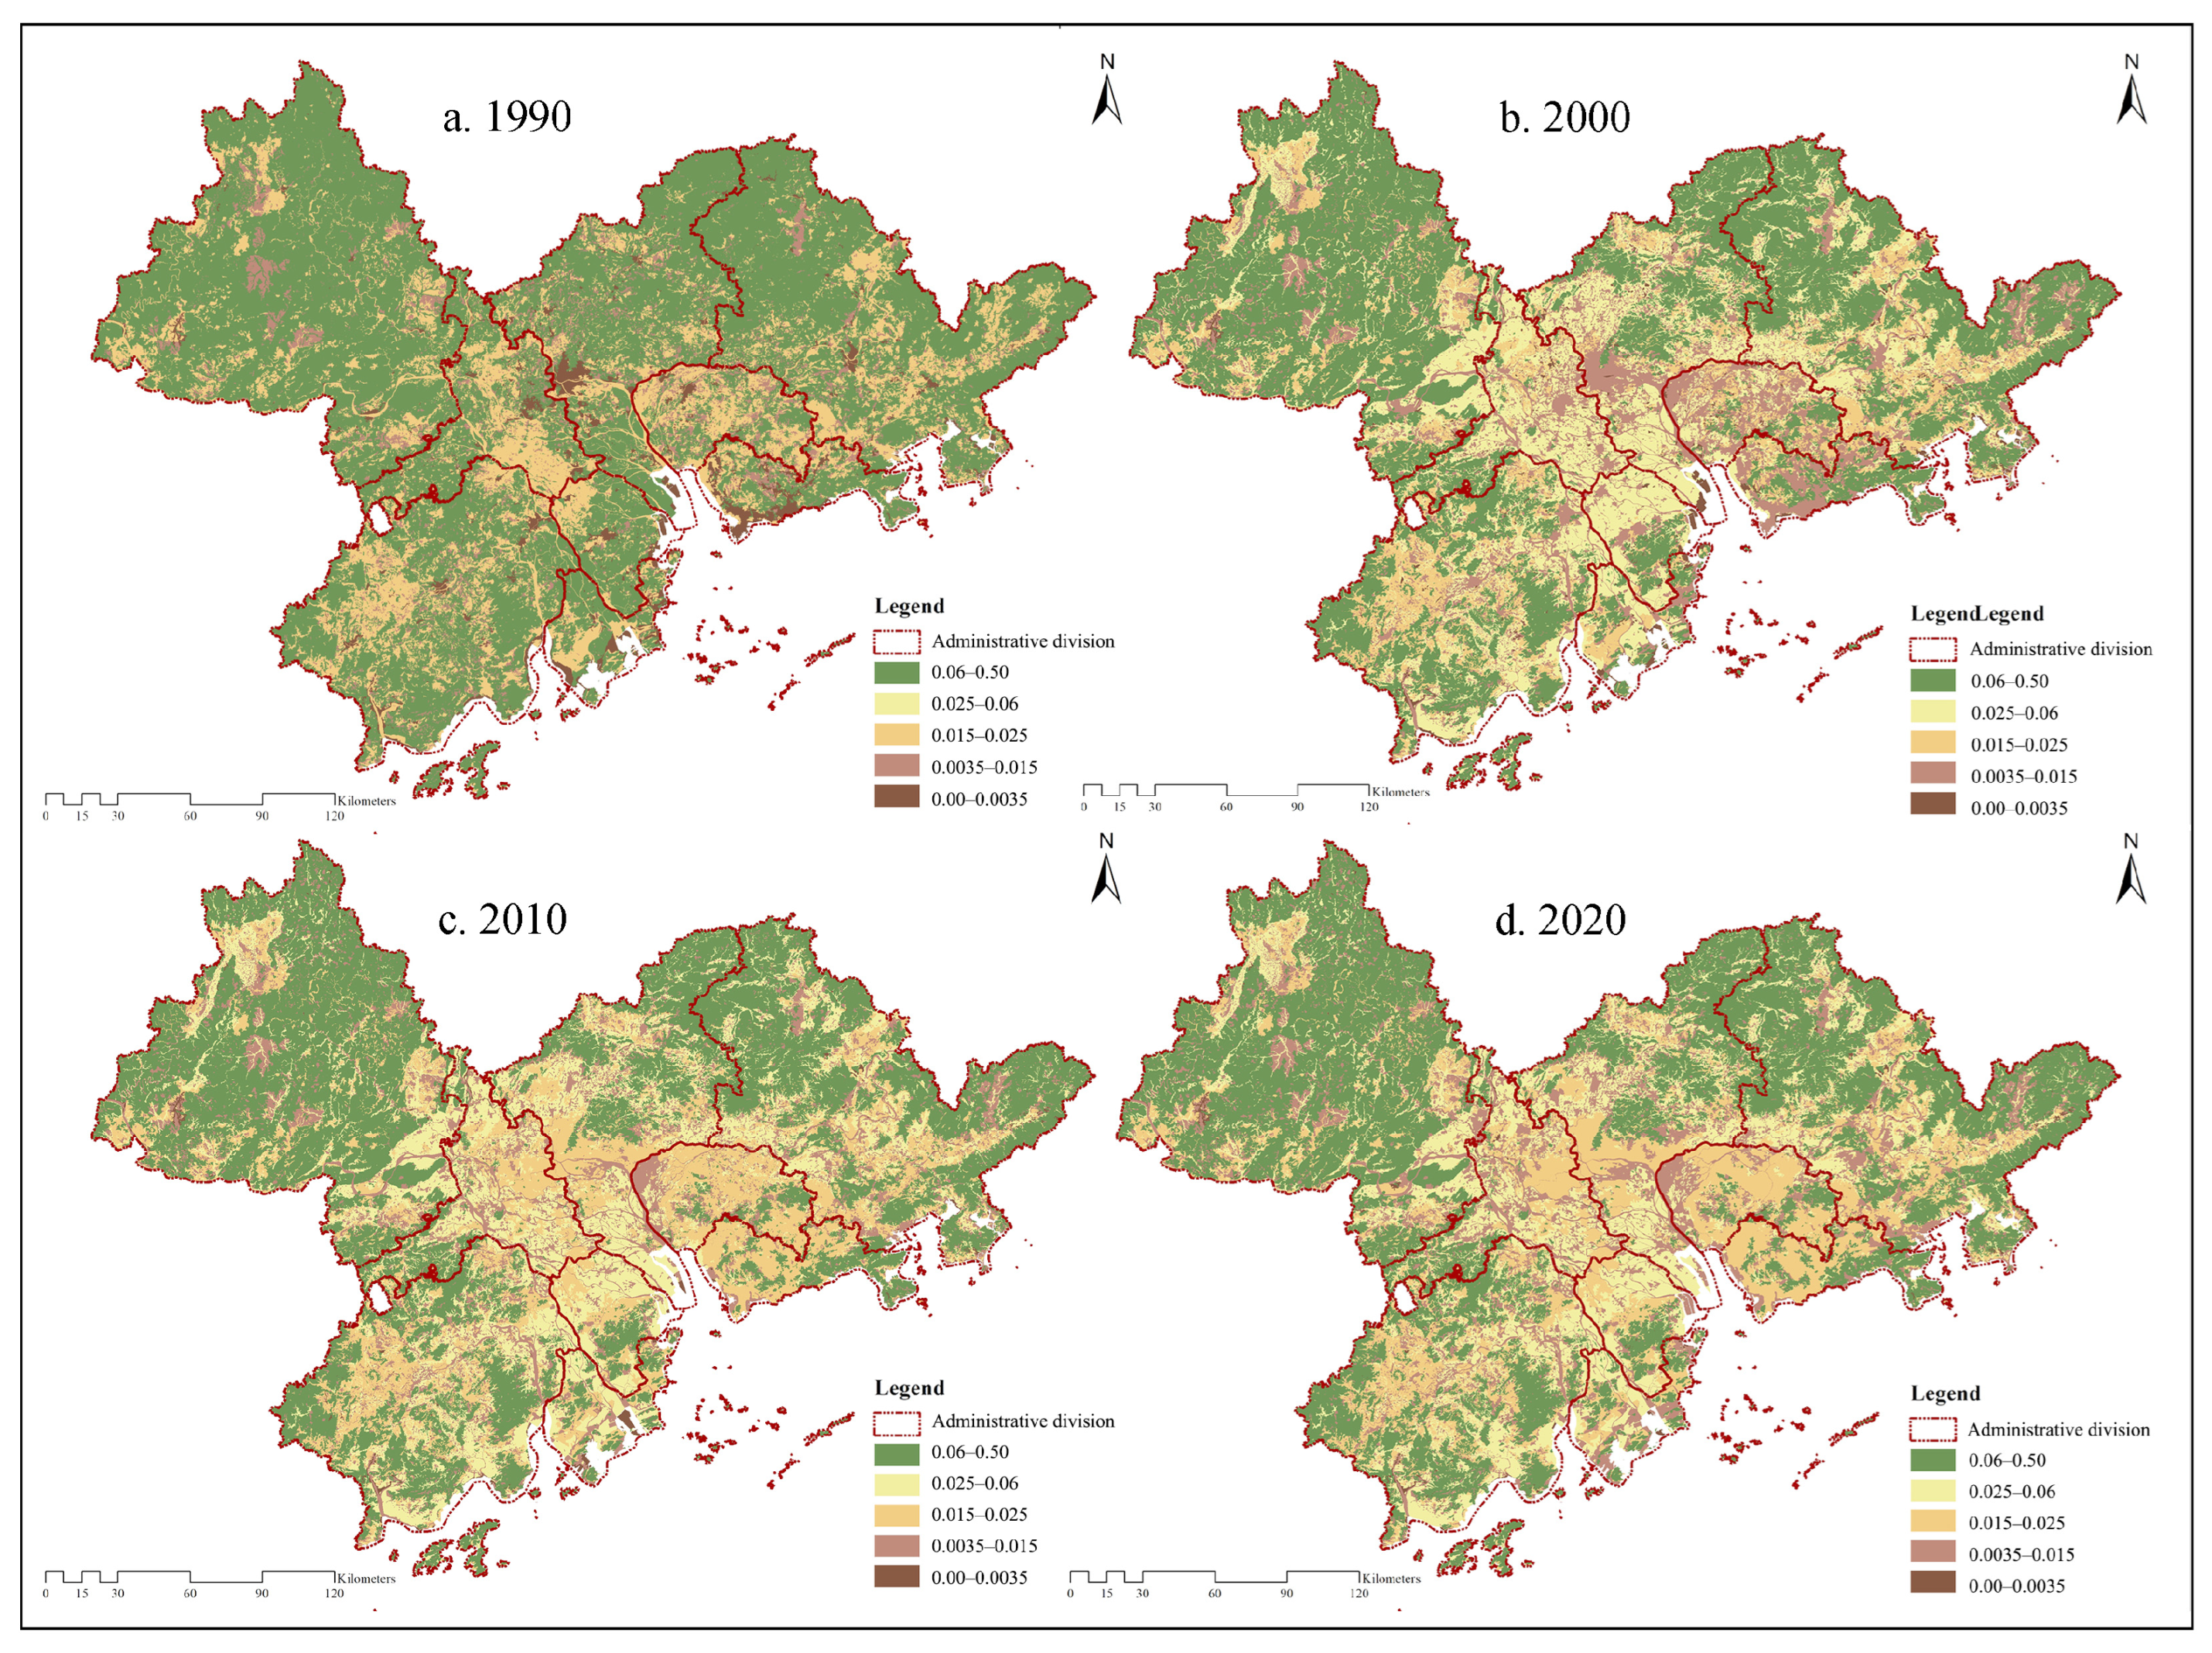
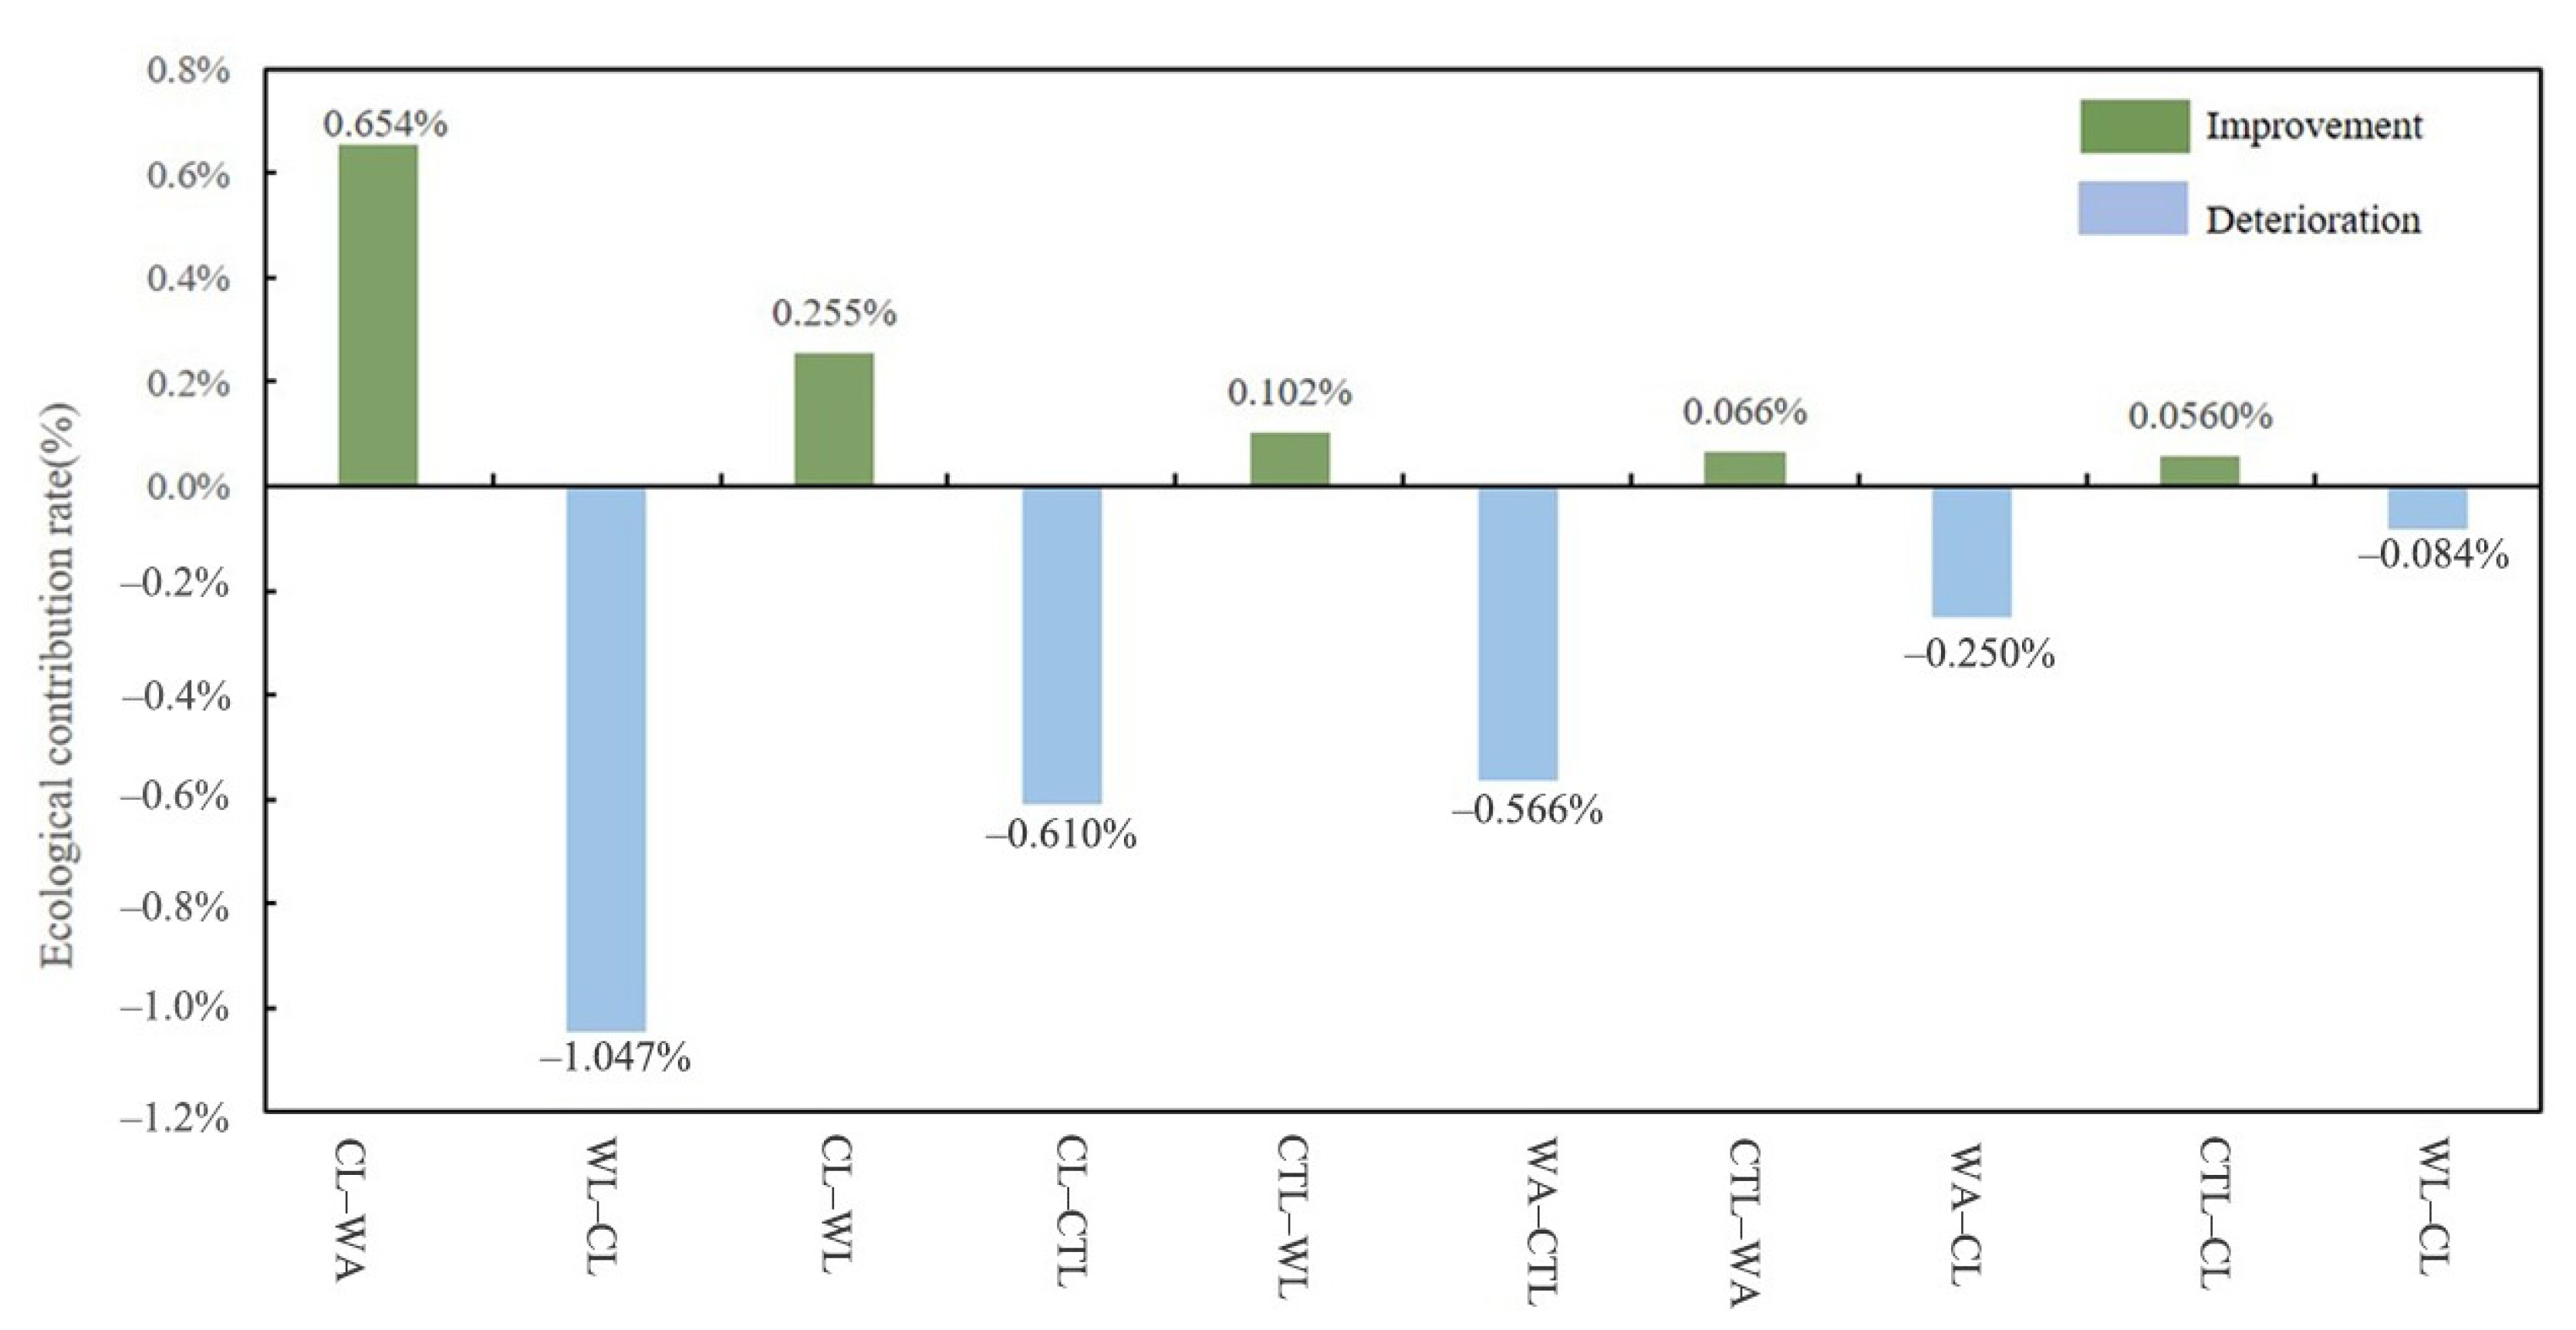
3.2. Impact of LUCC on the Ecological Environment

The EEQ index values for the PRD for 1990–2020 were calculated using the formula, and the results are shown in Table 2. The numerical results of the EVs indicated that the overall EEQ of the nine cities in the PRD exhibited a downwards trend, with Shenzhen and Dongguan experiencing the most significant declines. Zhaoqing’s EEQ consistently ranked first in the region and was relatively stable, with a value that was maintained at approximately 0.75. Dongguan’s EEQ was consistently the lowest among the cities in the urban agglomeration, and its EV fell to 0.38 in 2020—a 14.2% decrease from 1990.
The spatial distribution of the EVs of the PRD during the study period is shown in Figure 8, which indicated that, in 1990, Dongguan was the only city with a V-level habitat, while Foshan, Zhongshan, and Zhuhai were in Class IV. By 2000, the quality of Shenzhen’s habitat had decreased from Class III to Class IV. The deterioration in habitat quality was most apparent between 2000 and 2010, with Zhaoqing degrading from Class I and Guangzhou degrading to Class IV, while Foshan and Zhongshan’s habitat quality indices degraded from Class IV to Class V.
Based on the EV results, the EVs of different land use types in the second classification were calculated, and the EV results for 1990 were classified into five categories, using the natural breakpoint method, as the initial classification system for subsequent data results for 2000, 2010, and 2020, which were color-coded according to habitat quality level. The causes of changes in regional EEQ in this study were interpreted using the results of multilevel EV spatial visualization (Figure 9). The results showed that the high EVs of Zhaoqing, Jiangmen, and Huizhou were due mainly to the presence of many different types of forestland and GL within their municipal boundaries, with these land use types having higher EEQ coefficients and contributing to higher regional ecological quality index values than those of other cities. In addition, the slow expansion rate of CTL and low degree of land use intensity in these three cities also contributed to their high ecological quality index values. Dongguan has included many low-EV land use types since 2000 and relatively few high-EV land use types, which was closely related to its consistently ranking first for land use intensity in the PRD and was the main reason for its consistently low EEQ index value.
By calculating the land use transition matrix for the first- and second-level classifications of the four land use datasets, the study obtained the land area changes during the land use transition over the study period and calculated the contribution index based on the ecological contribution rate formula.
Figure 10 presents the contribution rates for the primary land use types that have caused ecological environment improvement and degradation in the PRD from 1990 to 2020, showing the top five land use transition types that have contributed to ecological environment improvement and deterioration. Observations of the ecological contribution rates for Class I land use showed that the regional EEQ declined. First, farmland made the highest contribution to the eco-environmental quality improvement of the PRD, with a contribution rate of 0.654% for farmland converted to water and 0.166% for farmland converted to forestland, accounting for 67.57% of the total improvement contribution rate. Second, CTL contributed 0.102% and 0.066% to ecological improvement when converted to forestland and water, respectively. The land use types that caused significant ecological environment deterioration in the PRD region were those that were converted to CTL, mainly forestland, farmland, and water. These factors accounted for 78.29% of the contribution rate of ecological deterioration.
To further analyze the ecological features of land use transitions, the study also analyzed the conversion of secondary land use types from 1990 to 2020 (Tables S1–S3). Table 3 shows only the changes in area and ecological contribution rates for the conversion of secondary land use types between the beginning and the end of the study period. The main reason for the improvement in EEQ in the PRD from 1990 to 2020 was the increase in forestland resources. The main factor responsible for the ecological degradation in the PRD over the past three decades was the conversion of forestland. Overall, the land use types that contributed to the deterioration of the ecological environment were low-efficiency forestland, various types of CTL, and farmland. The main reason for this trend was the indiscriminate urban and rural, industrial and mining, and residential land expansion and the previous destruction of forests and grassland, as well as the internal conversion of forestland. Among the factors contributing to the ecological degradation, the conversion of forestland into other forms of low-ecological-quality land was the most serious, including forest-to-forest conversion (691.28 km2), forest-to-construction land conversion (281.96 km2), and forest-to-urban land conversion (178.59 km2). Overall, the trend of land use changes in the PRD from 1990 to 2020 resulted in a higher rate of ecological environment deterioration than improvement, leading to a significant decline in the EEQ of the region.

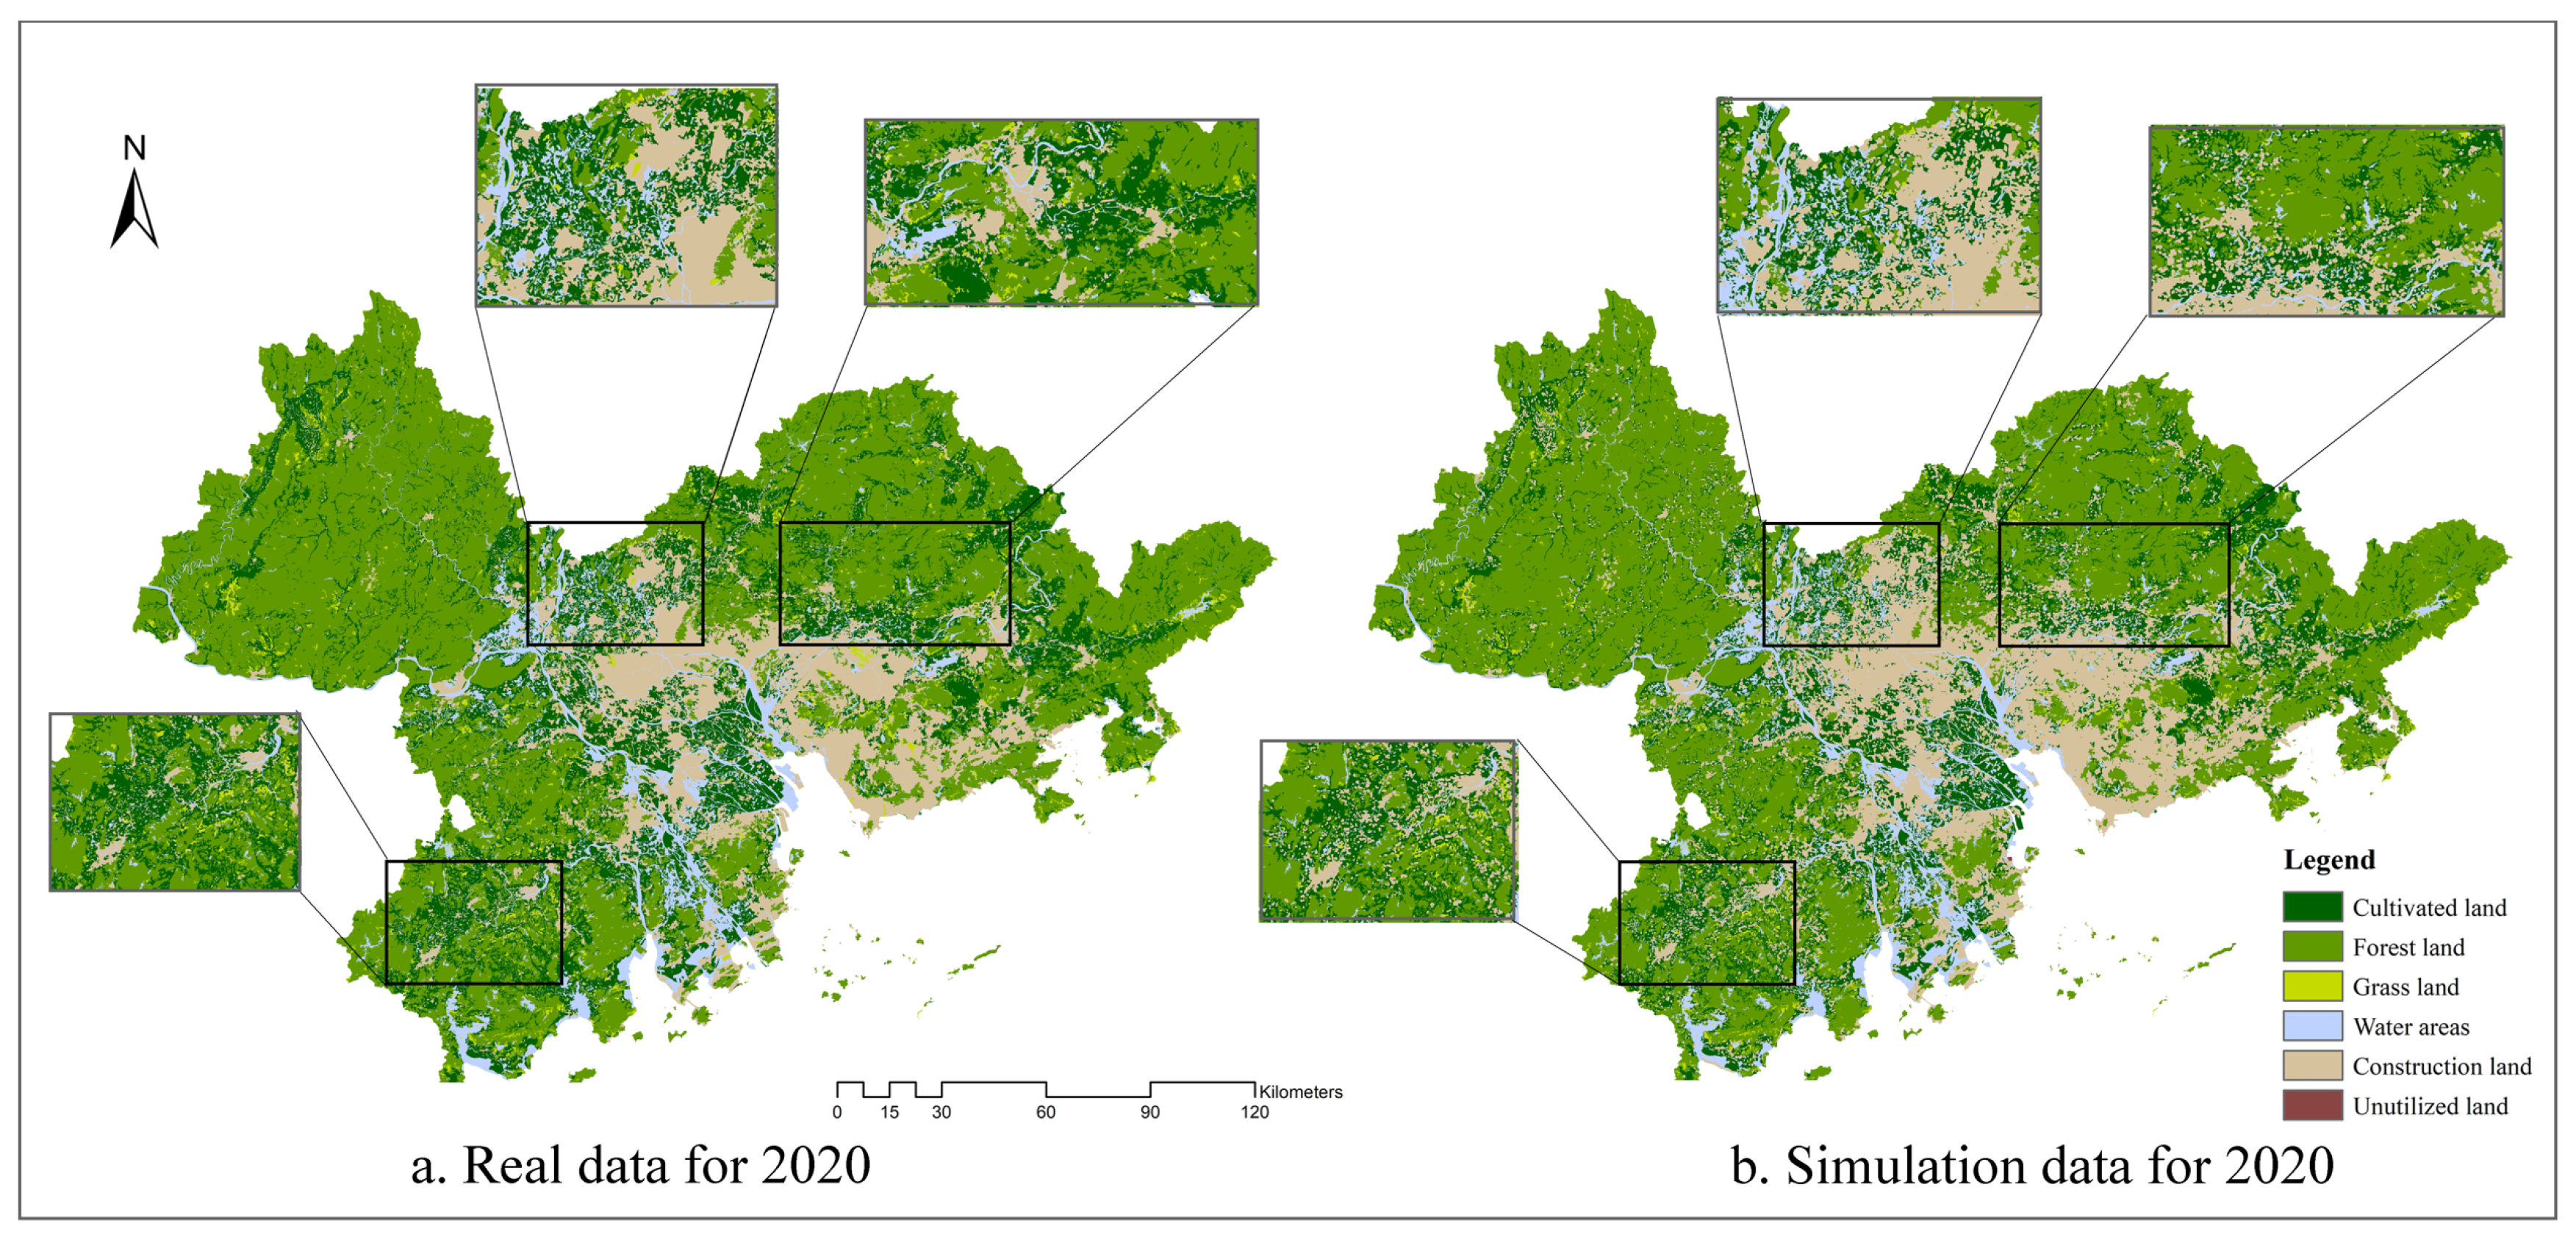
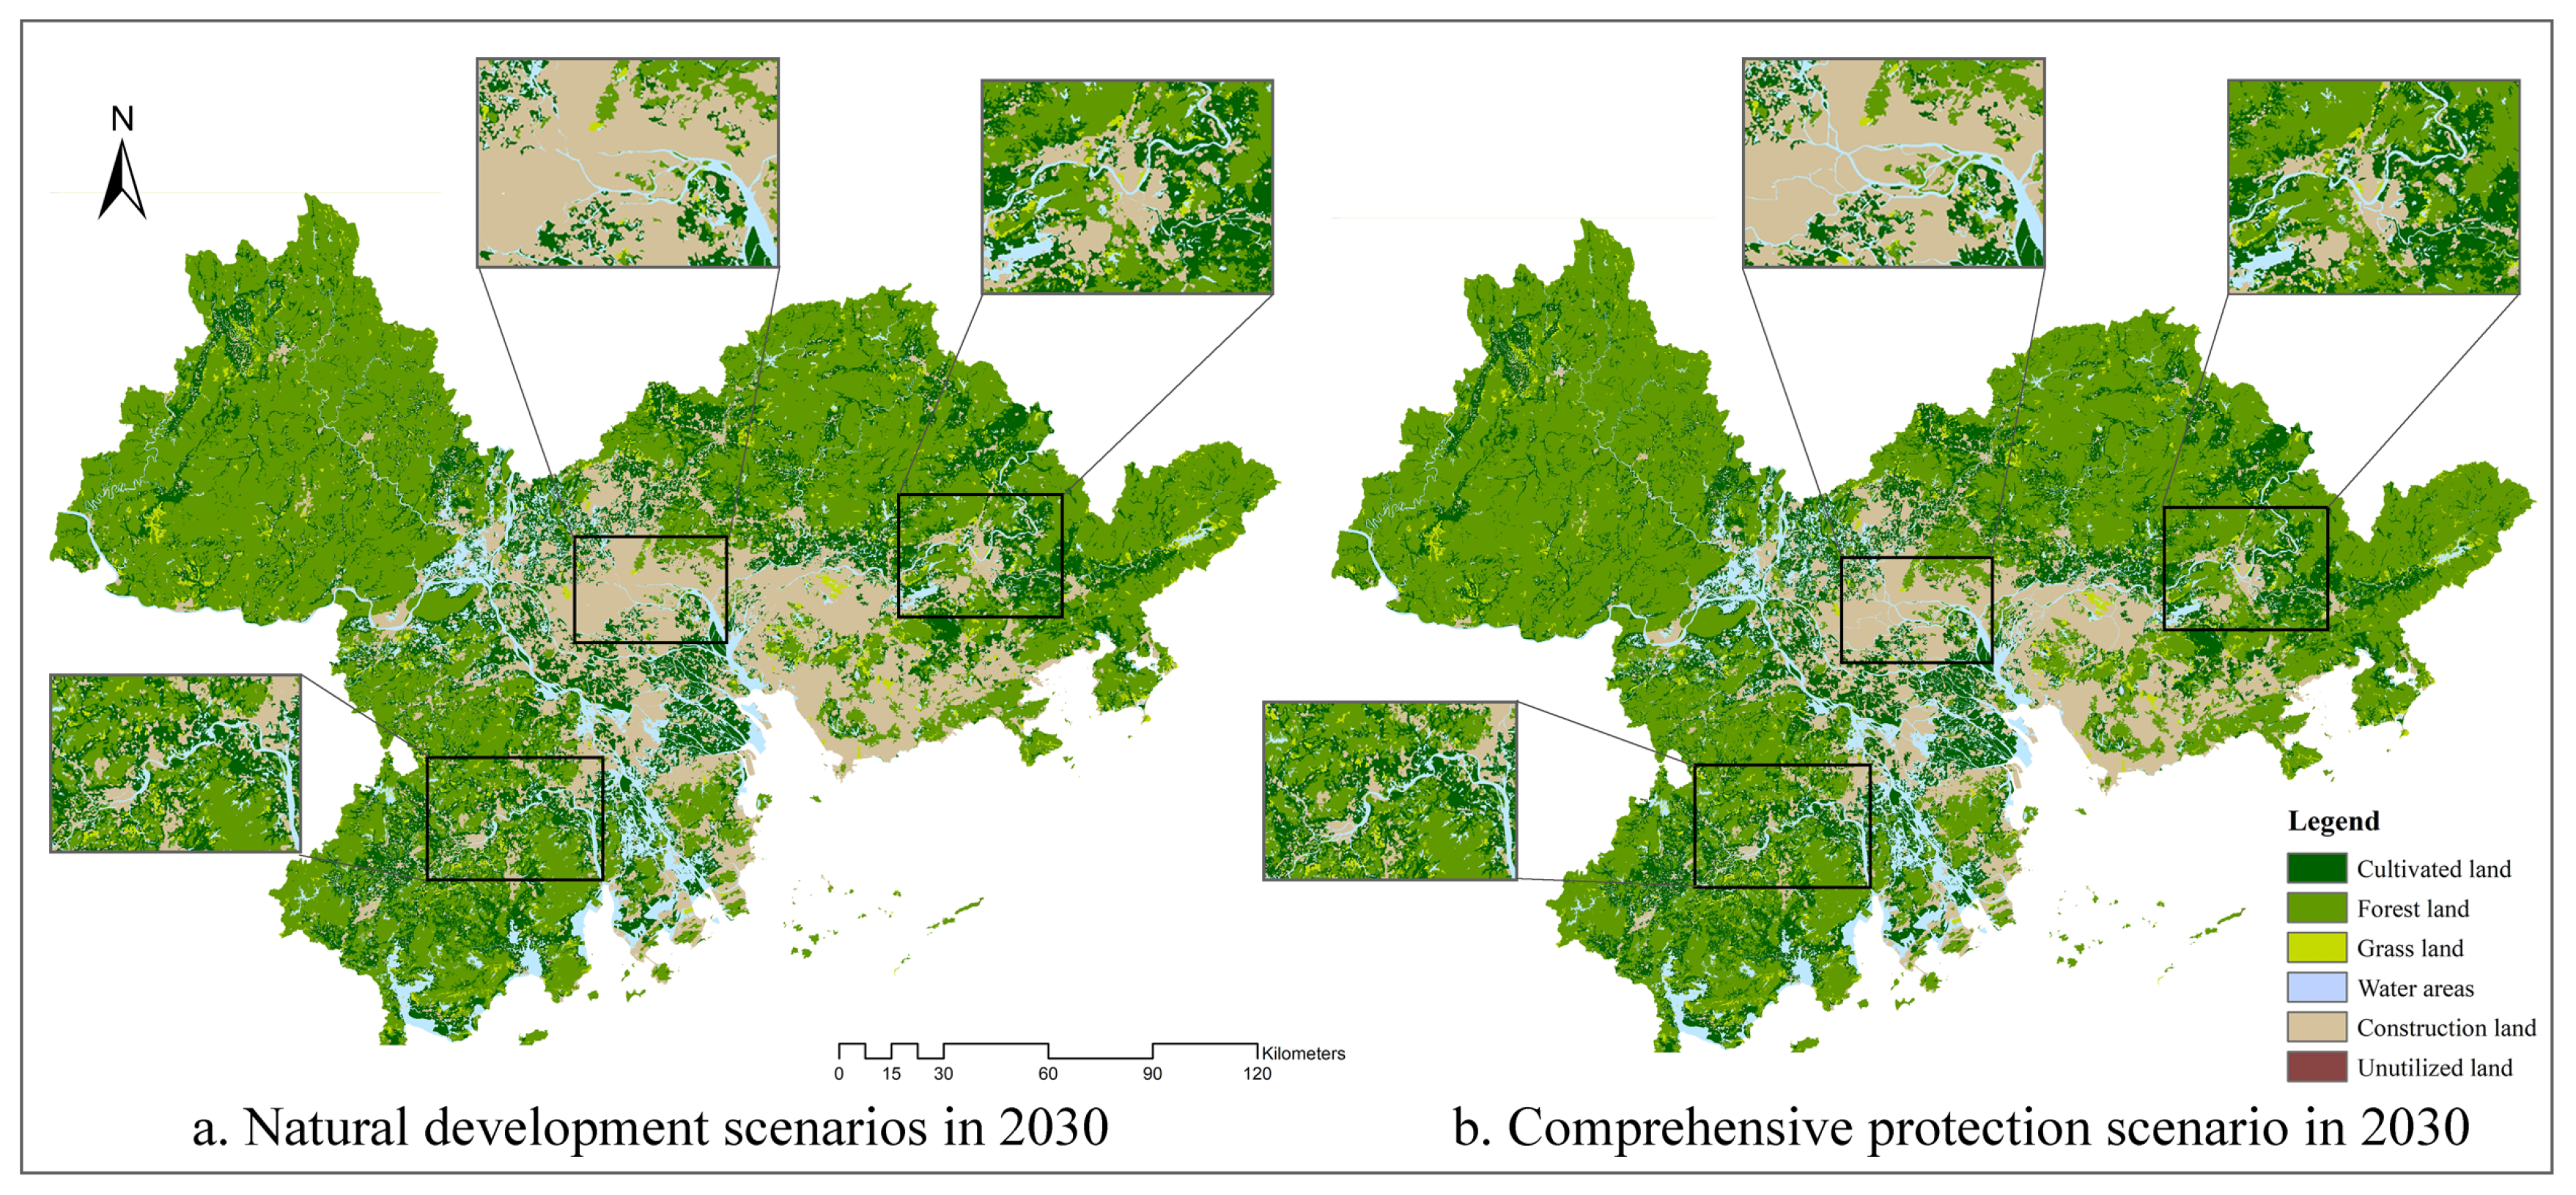
3.3. Simulation of LUCC and Eco-Environmental Effects

In this study, the simulated land use results for the urban agglomeration in 2020 were compared with the real data, and the kappa coefficient was calculated using the crosstab module in the platform. The resulting value of 0.9215 indicated that the predicted results were relatively ideal, and further multi-scenario prediction work was carried out through accuracy testing. The results of the benchmark scenario accuracy test for the land use transfer matrix are shown in Figure 11, from which it was found that the areas with larger errors were concentrated in the north and southwest of the study area. The specific performance was that the simulated expansion of CTL in the northern region was significantly greater than the real datum, while the simulated area of farmland in the southwestern and northern regions was smaller than the real datum. By comparing the areas of each type of land use in the real and simulated data, it was found that the simulation error rates for forestland and WA were within 5%, while the error rates for GL and UL were slightly higher but still met the accuracy requirements due to their small areas and similar distributions.
This study was based on land use data from 2010 and 2020 and simulated the trends of land use changes under the NDS and the CPS in 2030. The spatial changes and area changes in land use resulting from the simulation are shown in Figure 12 and Table 4. By comparing the simulated data of the two scenarios (Figure 12), it was observed that in the central area of the PRD, the CPS better preserved the dense water network structure, while in the NDS, some water network branches were occupied by CTL. In the western region, due to the restrictions on the conversion of CL, forestland, and GL, the spatial representation showed increases in forest and GL areas and a significant reduction in the encroachment of CTL on CL. This constitutes a reversal of the original spatial pattern of CTL expansion to a certain extent. In the eastern region, the spatial comparison situation was similar to that in the other regions. Under the CPS, the water network pattern was well preserved and consistent with the spatial pattern of 2020. There was a significant increase in forestland without further aggravating the level of development, whereas the expansion of CTL under the NDS was still considerable.
By comparing the area results for different scenarios simulated by the model (Table 4), it was found that in the NDS, the CL area in 2030 decreased by 633.64 km2—a decrease of 5.28% compared to 2020; the forest area decreased by 1352.14 km2—a decrease of 4.68% compared to 2020; the GL and WA increased by 195.96 km2 and 65.88 km2, respectively—increases of 19.43% and 1.64% compared to 2020; the CTL increased by 1730.7 km2—an increase of 21.62% compared to 2020; and the unused land decreased by 2.8 km2—a decrease of 40.57% compared to 2020.
Under the CPS, due to the restriction of the transfer rate of CL, the degree of CL reduction was significantly reduced, and the simulated CL area was 1.93% greater than that of the NDS. The area of forestland shrinkage was controlled and showed a positive growth trend. Meanwhile, under coordinated control, the forest area was 5.63% greater than that of the NDS. The growth rate of the GL area was lower than that of the NDS, with the GL area growth rate being 7.46% lower than that of the NDS. The growth rate of WA was higher than that of the NDS, increasing by 5.92% compared to 2020. The expansion extent of CTL was restricted due to the limitation of converting other land to CTL, and for the first time in the research period, a reduction in CTL occurred. Compared with the NDS, the CTL area of the CPS decreased by 19.21%.
To analyze the impact of LUCC on the trend of ecological environment change in the study area under different scenarios, it was first necessary to calculate the ecological EEQ for the nine PRD cities in 2020 and 2030 under the NDS and comprehensive protection scenarios using the EEQ for the first-level land use types. Since the calculation of the EV in the previous stage was based on the assignment results of the secondary land use types, it was necessary to recalculate it using the assignment system of the primary classification to ensure that the results for each year’s calculation came from the same assignment system. Based on the EEQ index for 2020–2030, the differences in the changes in the EQIs of the PRD cities under different simulation scenarios were derived.
As shown in Figure 13, under the NDS, the EEQ of all cities showed a downwards trend. Among them, Dongguan had the highest decrease rate, with an EV that decreased by 7.28% compared to 2020. Shenzhen and Foshan had the second-highest decrease rate, with EVs declining by 5.21% and 4.07%, respectively. The degree of decline in the EEQ in Guangzhou and Zhongshan was greater than 3%. Compared with the NDS, the comprehensive protection scenario showed a significant effect in restoring EEQ for all cities, except for Jiangmen, where the EV slightly decreased. The EVs of all other cities showed an upwards trend. Among them, Dongguan had the highest increase rate, with a predicted EV increase of 3.08% compared to ten years ago. Shenzhen and Zhuhai had the second-highest increase rates, with predicted EV increases of 2.59% and 2.16%, respectively.
Due to the differences in the ecological environment index valuation system obtained from the first-level land use type and the EVs used in the previous status analysis, the 2010 EVs of the nine cities in the PRD were used as the classification basis. Using natural break classification, the index values were divided into five categories: Class V habitat (0 ≤ EV < 0.35), Class IV habitat (0.35 ≤ EV < 0.38), Class III habitat (0.38 ≤ EV < 0.44), Class II habitat (0.44 ≤ EV < 0.50), and Class I habitat (0.50 ≤ EV < 0.55), where Class I is the highest level of habitat quality and Class V is the lowest. The evaluation of the distribution of EVs in different categories for both current and predicted years is depicted in Figure 14.
Analyzing the spatial distribution characteristics of EVs in different years, we found that the spatial distribution of the habitat levels in 2010 and 2020 under the first-level land use classification system was different from that under the second-level classification system. Specifically, in 2010 and 2020, Zhuhai’s habitat level deteriorated from level II to level III. In the NDS of 2030, Foshan and Shenzhen deteriorated from level IV to level V, as did Dongguan, while the habitat levels of the other cities remained consistent with the 2020 levels. However, under the CPS, the habitat quality of Foshan and Shenzhen increased from level V to level IV under policy constraints.
Comparing the EVs in the NDS with those in the comprehensive protection scenario, it was found that the city that benefitted the most from regional policies was Dongguan, with an EV that was 11.17% higher in the comprehensive protection scenario than in the NDS. Similarly, Shenzhen and Foshan showed a significant improvement in ecological quality, with increases in EVs of 8.23% and 5.42%, respectively, compared to the basic scenario. After analyzing the overall changes in land use types under different scenarios in 2030, we conducted a land use transfer matrix analysis of the predicted results of the first-level classification of land use. Using the real land use results of 2020 as the basis, we used a Sankey diagram to express the transformation between different land use types under the NDS and the overall protection scenario from 2020 to 2030. The results are shown in Figure 15.
According to the transfer matrix results from 2020 to 2030, the changes in forestland were most dramatic under the NDS. This result suggests that if policy control measures for urban expansion are not implemented, the degradation of forestland will be further exacerbated. The second most significant change was the conversion of CL. The loss of CL mainly transformed into CTL, with a conversion area of 725.15 km2. The main transformation direction for WA was also towards CTL, with 248.87 km2 of WA being encroached upon by CTL. The results show that the further expansion of CTL is the main trend of the land use changes between 2020 and 2030 under the NDS.
Under the overall protection scenario, the expansion trend of CTL was reversed, and the conversion of CTL became the main trend. CTL was converted mainly to forestland and WA. The second most significant change concerned CL. Although the main direction of the loss of CL was still towards CTL, due to the restrictions on its conversion process, the predicted transfer area by 2030 was 299.49 km2. This was a 58.7% decrease compared to the transfer area from CL to CTL under the NDS. This result validated the feasibility of the farmland protection policy in the scenario setting. Forestland, GL, and WA changed from being primarily outgoing land types to being incoming land types, and they were mainly converted from CTL. The reason for the mutual conversion between ecological lands is mainly the limitations of suitability files.
To further analyze the differences in the impact of land use transformation on the ecological environment under different scenarios, this paper calculated the main land use transformations that affected the EEQ and their ecological contribution rates during 2020–2030 in the NDS and the CPS (Figure 16).
It was observed that the ecological contribution rates in the CPS were generally more than twice as high as those in the NDS in terms of the trend of ecological environment improvement. Under the NDS, the transformation of cropland into water bodies made the greatest contribution to improving the ecological environment. In contrast, the total ecological contribution rate of the conversion of CTL into forests, water bodies, and grassland under the CPS was 0.3197%, far exceeding the total improvement contribution rate of all land types under the NDS.
Regarding the trend of ecological environment deterioration, the absolute value of the ecological contribution rate under the CPS was lower than that under the NDS. Under the NDS, the total ecological deterioration contribution rate of land use transformations from forests, water bodies, and croplands into CTL was −0.9676%. In contrast, under the CPS, only the transformation of cropland into CTL resulted in ecological deterioration, and the transformation area was only 23.23% of that under the NDS. The above data indicate that if urban expansion and urbanization are uncontrolled, natural development can effectively simulate such trends, and the results showed that the trend of land use change under this scenario will further exacerbate the negative impact on the ecological environment. Under the CPS, by intervening with ecological land (forests, grassland, and water bodies) and cropland protection policies, urban expansion was further constrained, and these measures significantly slowed the speed of ecological environment deterioration, promoting the sustainable development of the PRD urban agglomeration.

4. Discussion

This study builds upon previous research and explores the temporal and spatial patterns of LUCC in the PRD urban agglomeration. It also examines the variations in the trends of EEQ for different periods in nine cities and assesses the impact of different land use transitions on urban ecological environment quality using the ecological contribution index. Importantly, after analyzing the LUCC and its ecological benefits in the region, this study employs the CA–Markov model to predict future LUCC scenarios in the PRD urban agglomeration. Furthermore, it recalculates the ecological contribution index based on the simulated land use scenarios, offering a more effective framework to discuss the differential impacts of LUCC on the ecological environment under policy interventions.
Comparing the results of this study with previous research findings, the main data results of this study demonstrate a good consistency with the research findings from other regions in China [49,50], confirming the relative reliability of the main analytical results presented in this paper. From a national perspective, Qu et al. analyzed the transformation and coupling relationship between rural settlements and cultivated land from 1996 to 2016 using single-variable and bivariate analysis. They found that China’s cultivated land area transitioned from balanced growth to decline, with active land use transformation and a continuous decrease in cultivated land in the eastern coastal areas [51]. At the provincial and municipal level, Dong et al. analyzed the ecological environment quality of the Erhai Lake Basin from 2000 to 2020 using remote sensing ecological index (RSEI) and soil erosion indicators, concluding that the regional ecological environment has improved but with significant regional disparities. Forestland exhibited high ecological quality, while unused land and construction land showed the lowest ecological quality [52]. Li et al. [53] quantitatively analyzed the spatiotemporal evolution of production–living–ecological space and the ecological environmental effects of land use structure transformation in Shaanxi Province from 2000 to 2020. They found that during this period, the ecological land and residential land consistently increased, while agricultural land decreased. The most significant change occurred between productive farmland and ecological grassland, and the encroachment of other land types on ecological grassland was a significant factor leading to a decline in ecological environment quality [54]. These studies align with the findings of our research on LUCCs and their ecological environmental impacts in the PRD region. The expansion of urban and rural and industrial and residential land in the region from 1990 to 2020 has caused extensive conversion of farmland and forestland, leading to a significant decline in ecological environment quality, particularly in cities like Dongguan and Shenzhen, where there has been excessive expansion of construction land.
In the context of land use simulation and future ecological prediction, Gao et al. utilized the PLUS model to simulate the LUCC and associated ecological risks under various scenarios, including development driven by historical trends and simultaneous consideration of ecology and economy, in Nanjing for 2025. The research findings indicate that pursuing economic benefits alone would increase ecological risks, while the overall ecological risk in Nanjing is relatively low under the scenario of ecological protection [55]. Other articles on land use scenario simulation express similar viewpoints [18]. The conclusions drawn from the simulations and predictions in this study are consistent with those mentioned above, but also present new findings specific to different cities. By implementing a comprehensive protection scenario, the trend of expanding construction land is being reversed, demonstrating that under robust land management policies, the degradation of the ecological environment in the study area is significantly constrained. Notably, Dongguan, Foshan, and Shenzhen exhibit more apparent ecological recovery effects under the influence of policy measures, validating the feasibility of land management policies.
The scientific and effective utilization of land resources is an important and fascinating topic. Uncovering the impact of LUCC on the ecological environment is crucial for the efficient management of land resources and holds significant implications for sustainable development [53,56,57]. Effective land resource management is a key factor in ensuring the sustained and stable development of the ecological economy, and proper protection and management of land contribute to maintaining ecological balance [58,59]. The restoration capacity of ecosystems and the extent of anthropogenic intervention are focuses for the sustainable development of regional ecosystems. Currently, China’s economy and urban construction have entered a stage of high-quality development, and spatial carriers of socioeconomic activities tend towards the coordinated development of city clusters. As an important pillar of China’s economic development, the PRD has now formed the Greater Bay Area with Hong Kong and Macao. In the future, it will become an essential component of the world’s bay areas due to its unique political advantages and development potential. There is an urgent need to further enhance the regional land management capacity and ecological resilience of the PRD. This study proposes policy recommendations from three aspects: land monitoring, land use efficiency, and urban–rural integrated development.
First of all, the most direct means of protecting land at the government level is strengthening the regular monitoring of land use change. In the land use simulation analysis, this study compares the overall protection scenario and the natural development scenario. The results show that if there is a strong land control policy, the current process of ecological environment deterioration in the study area can be significantly inhibited. Dongguan City, Foshan City, and Shenzhen City will be more prominent in terms of ecological environment restoration effects after the impact of the policy, confirming the feasibility of the land control policy. In 2017, China launched a pilot project of “three lines and one area” eco-environmental regionalization and control and issued guidelines with clear objectives in 2021 [60]. Therefore, when the new construction rights or management rights of urban and rural land change, it is necessary to verify the ownership and area of land, prohibit the encroachment of basic farmland control lines and ecological protection red lines, and ensure the safety of farmland and the ecological environment. Considering the ecological restoration difficulties of other urban agglomerations, an urban agglomeration should make full use of its geographical advantages, actively build ecological corridors to protect the water environment, and improve the environmental carrying capacity of water and forest resources. It can also combine the urban traffic network to create a green and prosperous urban landscape pattern and build a safety screen with the natural ecological resources around the city.
Secondly, the overall progress of transformation of regional land is inefficient and slow, and the original idea of extensive development of urban construction has not completely changed, indicating that the overall intensive use of regional land still has a long way to go. The analytic results of this study show that the expansion of construction land (urban and rural, industrial and mining, and residential land) has led to the occupation of a large amount of cultivated land and forestland, which seriously damages the ecological environment of the PRD urban agglomeration and hinders regional sustainable development. The change rate of the construction land area in 1990–2020 was the highest, and the ecological environment quality of construction land in Dongguan, Shenzhen, and other cities declined significantly in 30 years of excessive expansion. Therefore, making good use of existing CTL is the key to controlling urban expansion. The key significance of the efficient use of stock CTLs is to develop inefficient land in the stock CTLs of urban agglomerations, including underutilized CTLs, such as abandoned factories, unfinished buildings, and old residential areas. In many areas, the area of unused land is large, and areas with a single land use function should be avoided in development, so as to prevent the ineffective expansion of residential and industrial areas. In addition to inefficient land in cities, idle land in rural areas can be used for the development of modern agricultural industry, promote the transformation of inefficient CTL into farmland, and protect agricultural resources [61]. Land that cannot be reused can be developed into an ecotourism industry according to the principle of “returning forests, grasslands, and lakes” to stimulate the economic vitality of land ecology.
In addition, another way to rationally set up industrial functions to improve land use efficiency is to promote the integration of urban agglomeration production and cities [62]. This study found that the degree of land use in the surrounding cities of the Pearl River Estuary was significantly higher than that in the peripheral cities of the study area, especially Jiangmen, Zhaoqing, and Huizhou, which were not as good as other regions in terms of urbanization and economic development. According to the characteristics of industrial development in each city, combined with the spatial structures of the development plans for the areas, the supportive relationship between living space and public services can be guaranteed, which can not only achieve the dual effect of promoting industry and sustaining the population, but also promote the coordinated development of industry, residences, culture, and ecology. However, the restrictions on CTL should not hinder the economic development of weaker areas. Actively exploring the integration of production and cities can greatly promote the symbiotic development of the economy and ecology and solve the problem of unbalanced development within urban agglomerations.

5. Conclusions

In this study, we propose a methodological framework to explore the spatiotemporal evolution mechanisms of LUCC and their impacts on the ecological environment. Taking nine cities in the PRD region as an example, we investigate the spatiotemporal patterns of LUCC from 1990 to 2020, calculate the EV of each city, determine the ecological contribution rates of different land use types during the change process, and simulate the future development trends of land use and ecological environmental quality under different scenarios using the CA–Markov model. Based on the analysis results, policy recommendations are proposed. The main conclusions are as follows:
(1)
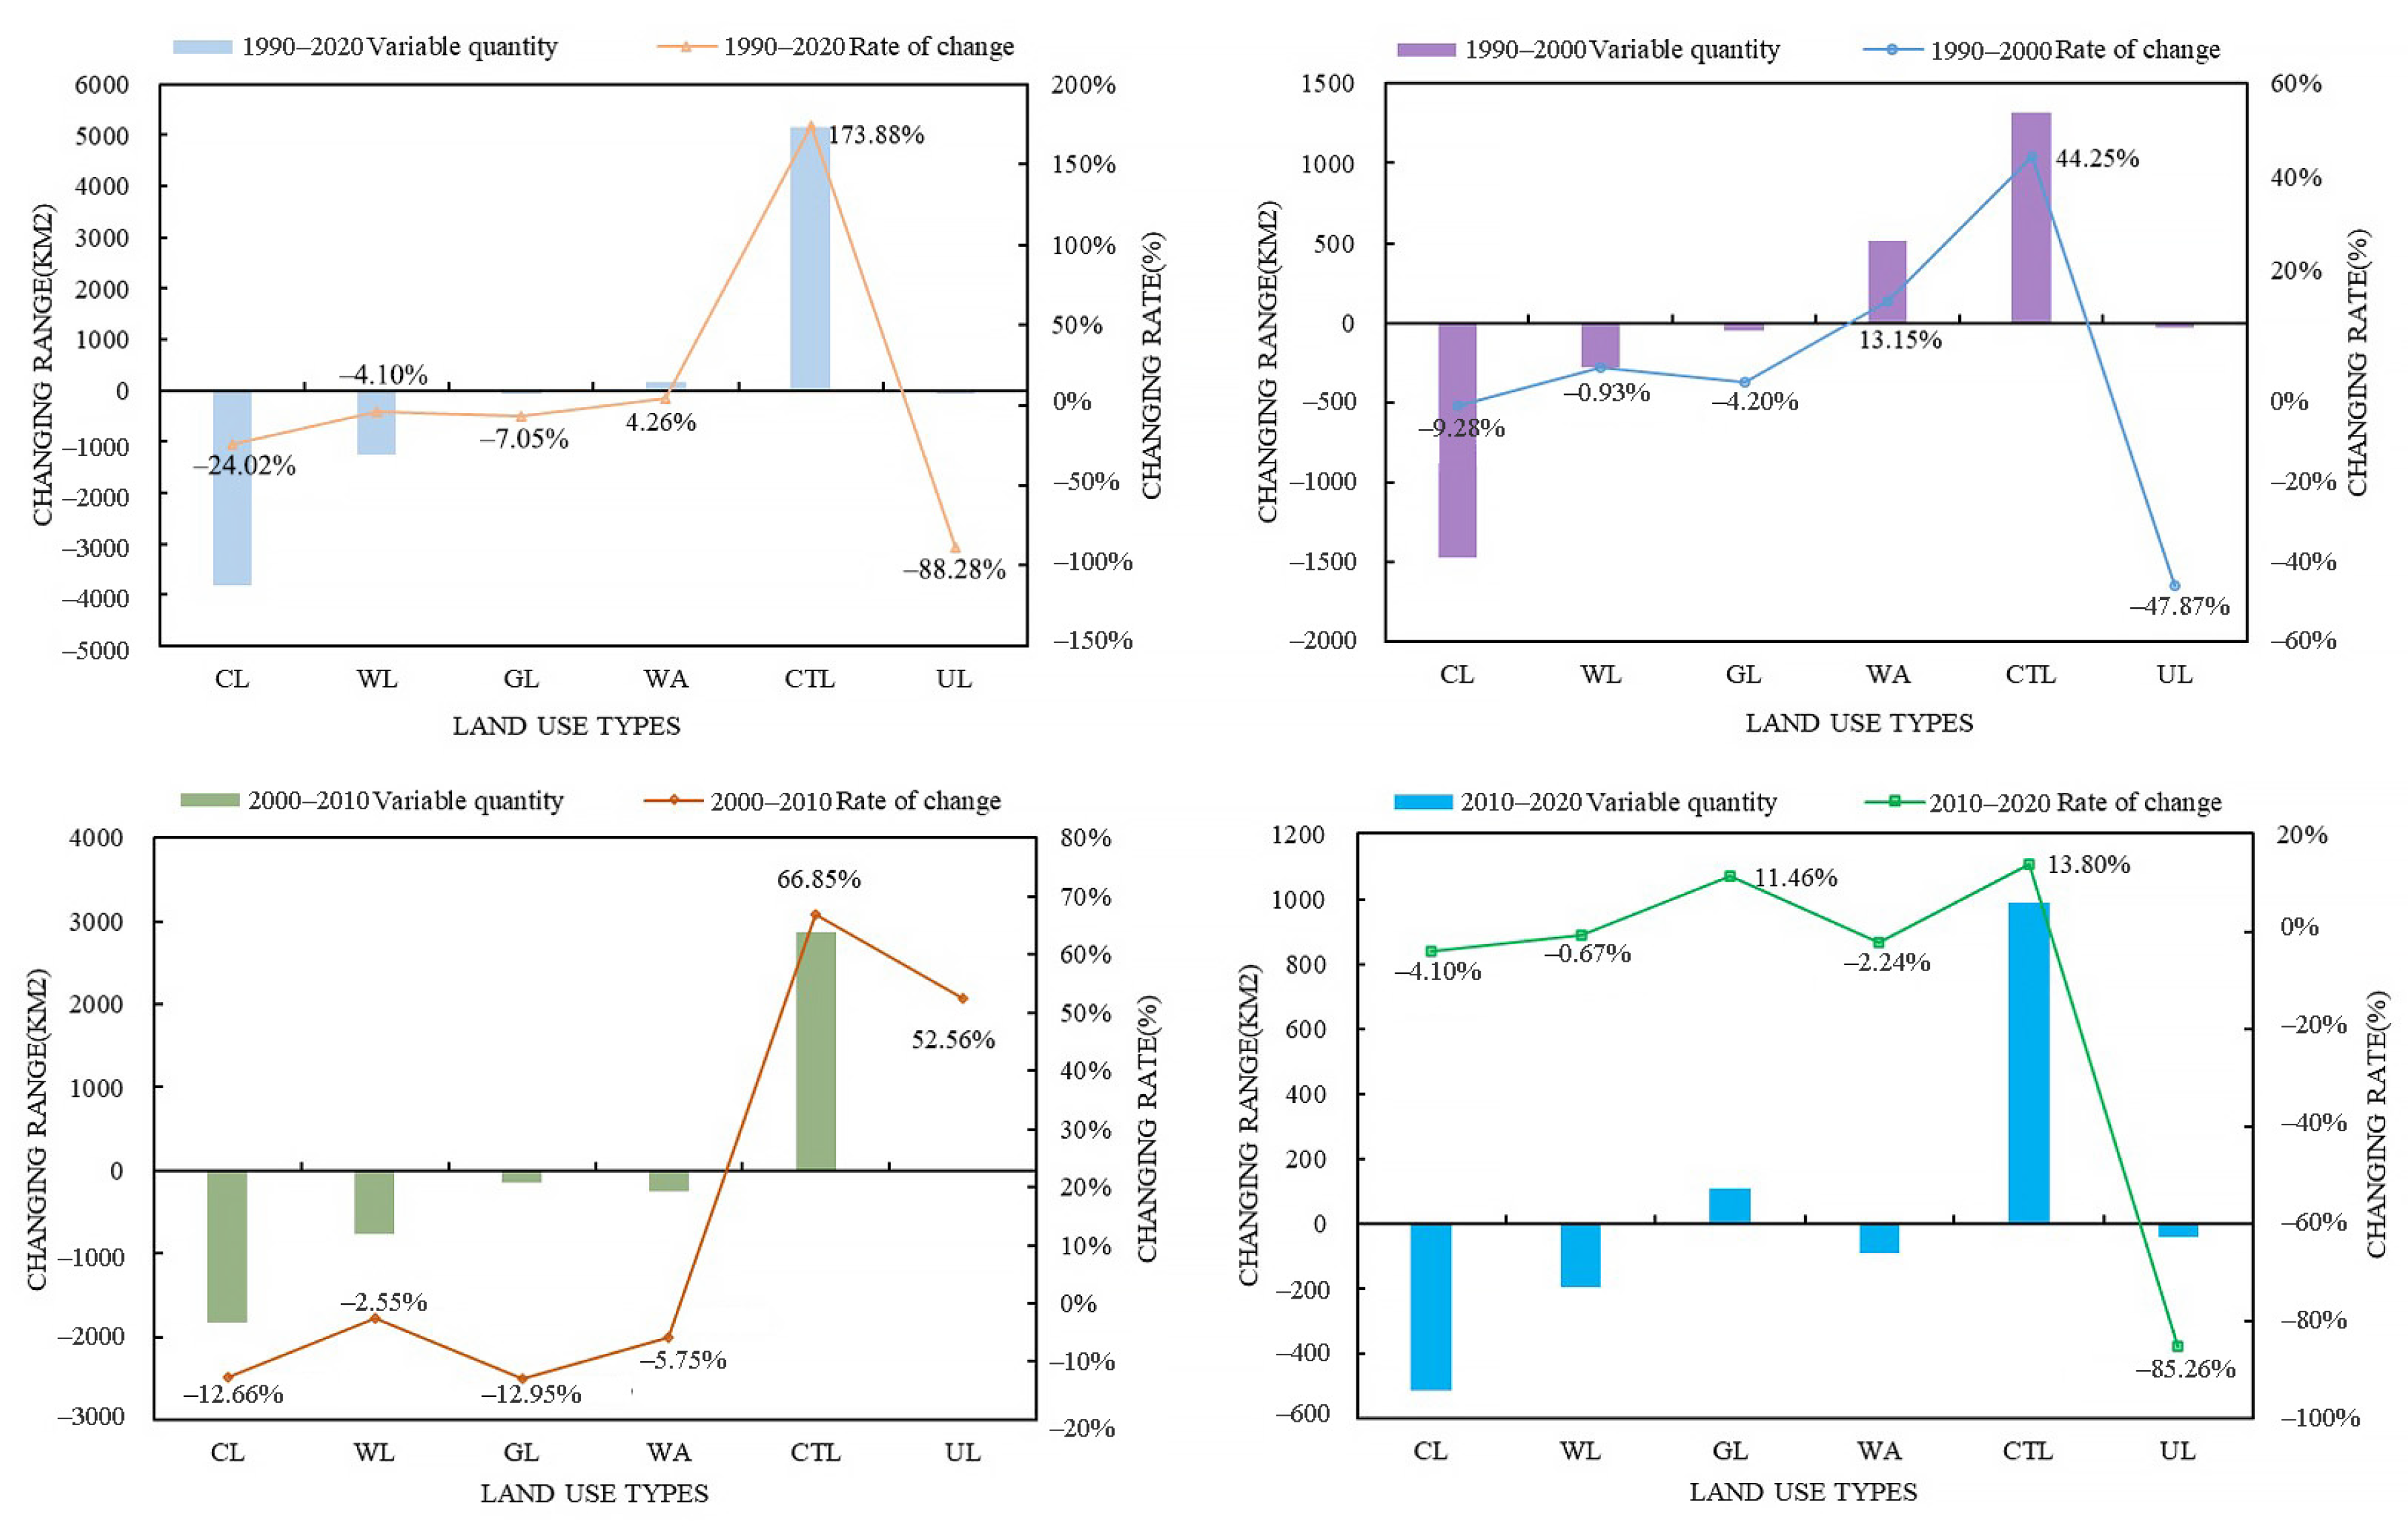
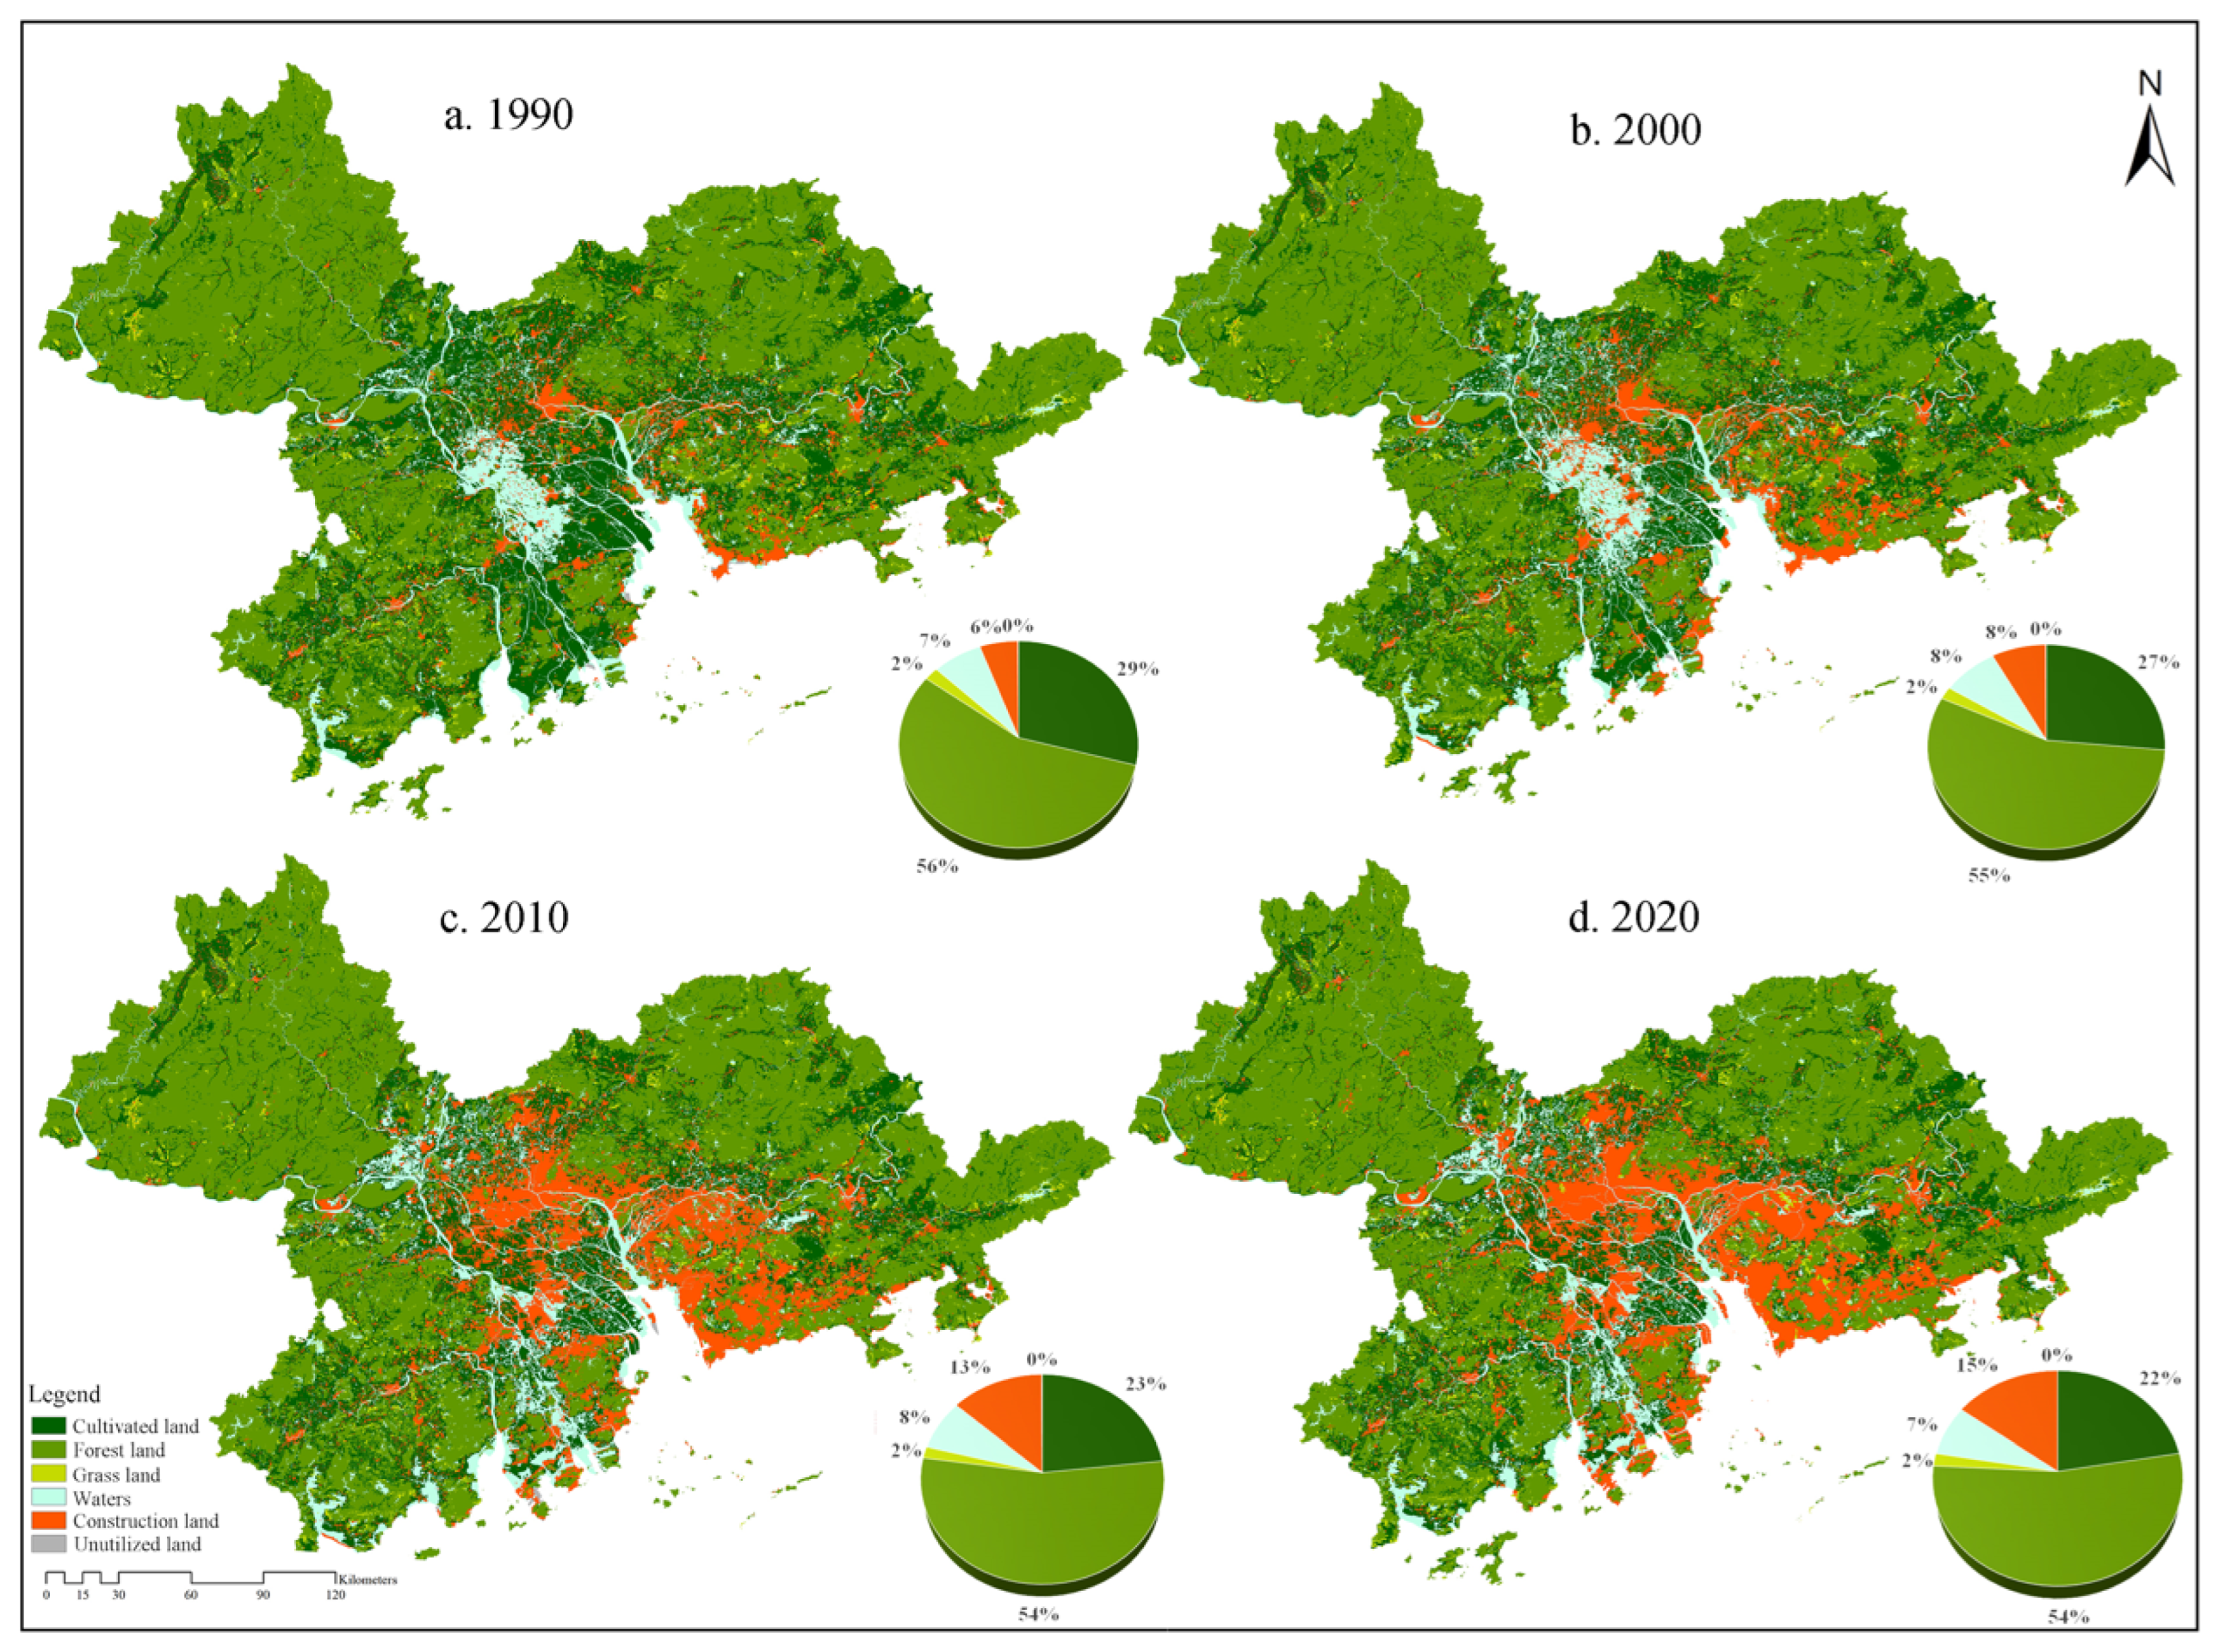
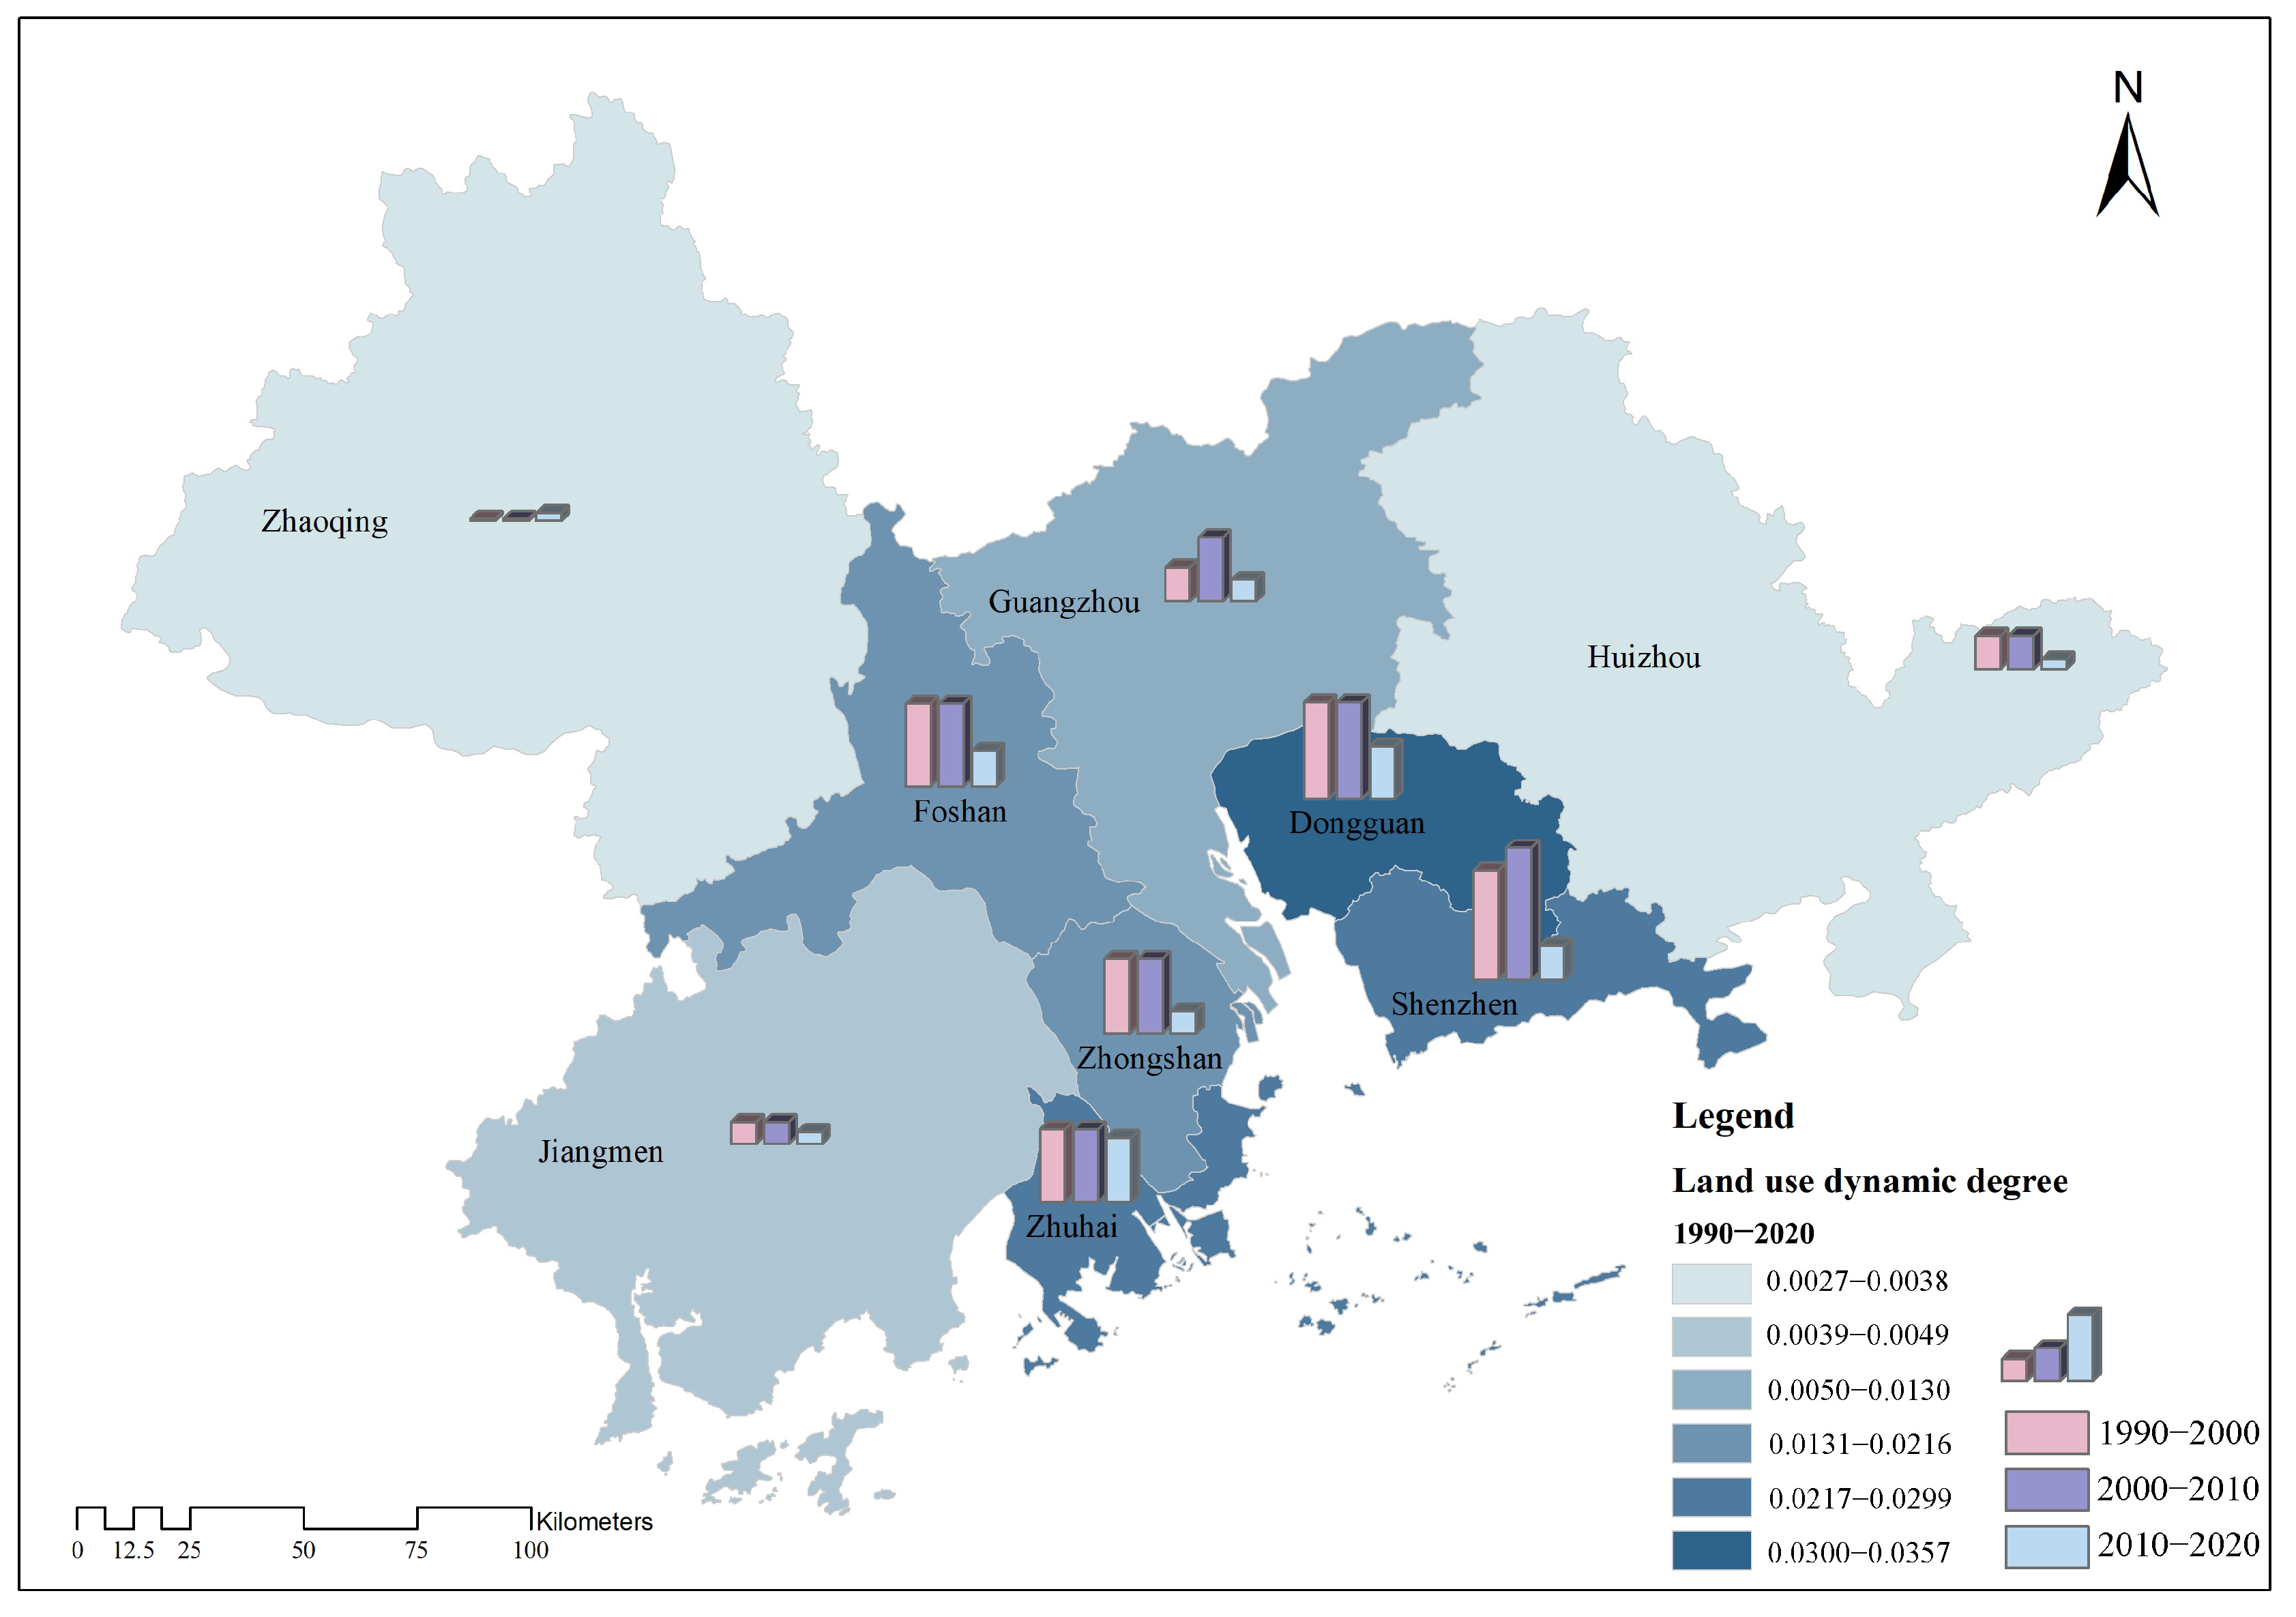
The overall trend of land use change in the PRD urban agglomeration between 1990 and 2020 was “four reductions and two increases”. The trajectory of expansion of constructed land primarily extended inwards along the Pearl River Estuary. The rate of change in CL area was significantly higher than that in forest and GL areas. Additionally, cities located closer to the PRD Estuary had significantly higher comprehensive land use dynamism than those on the periphery.
(2)
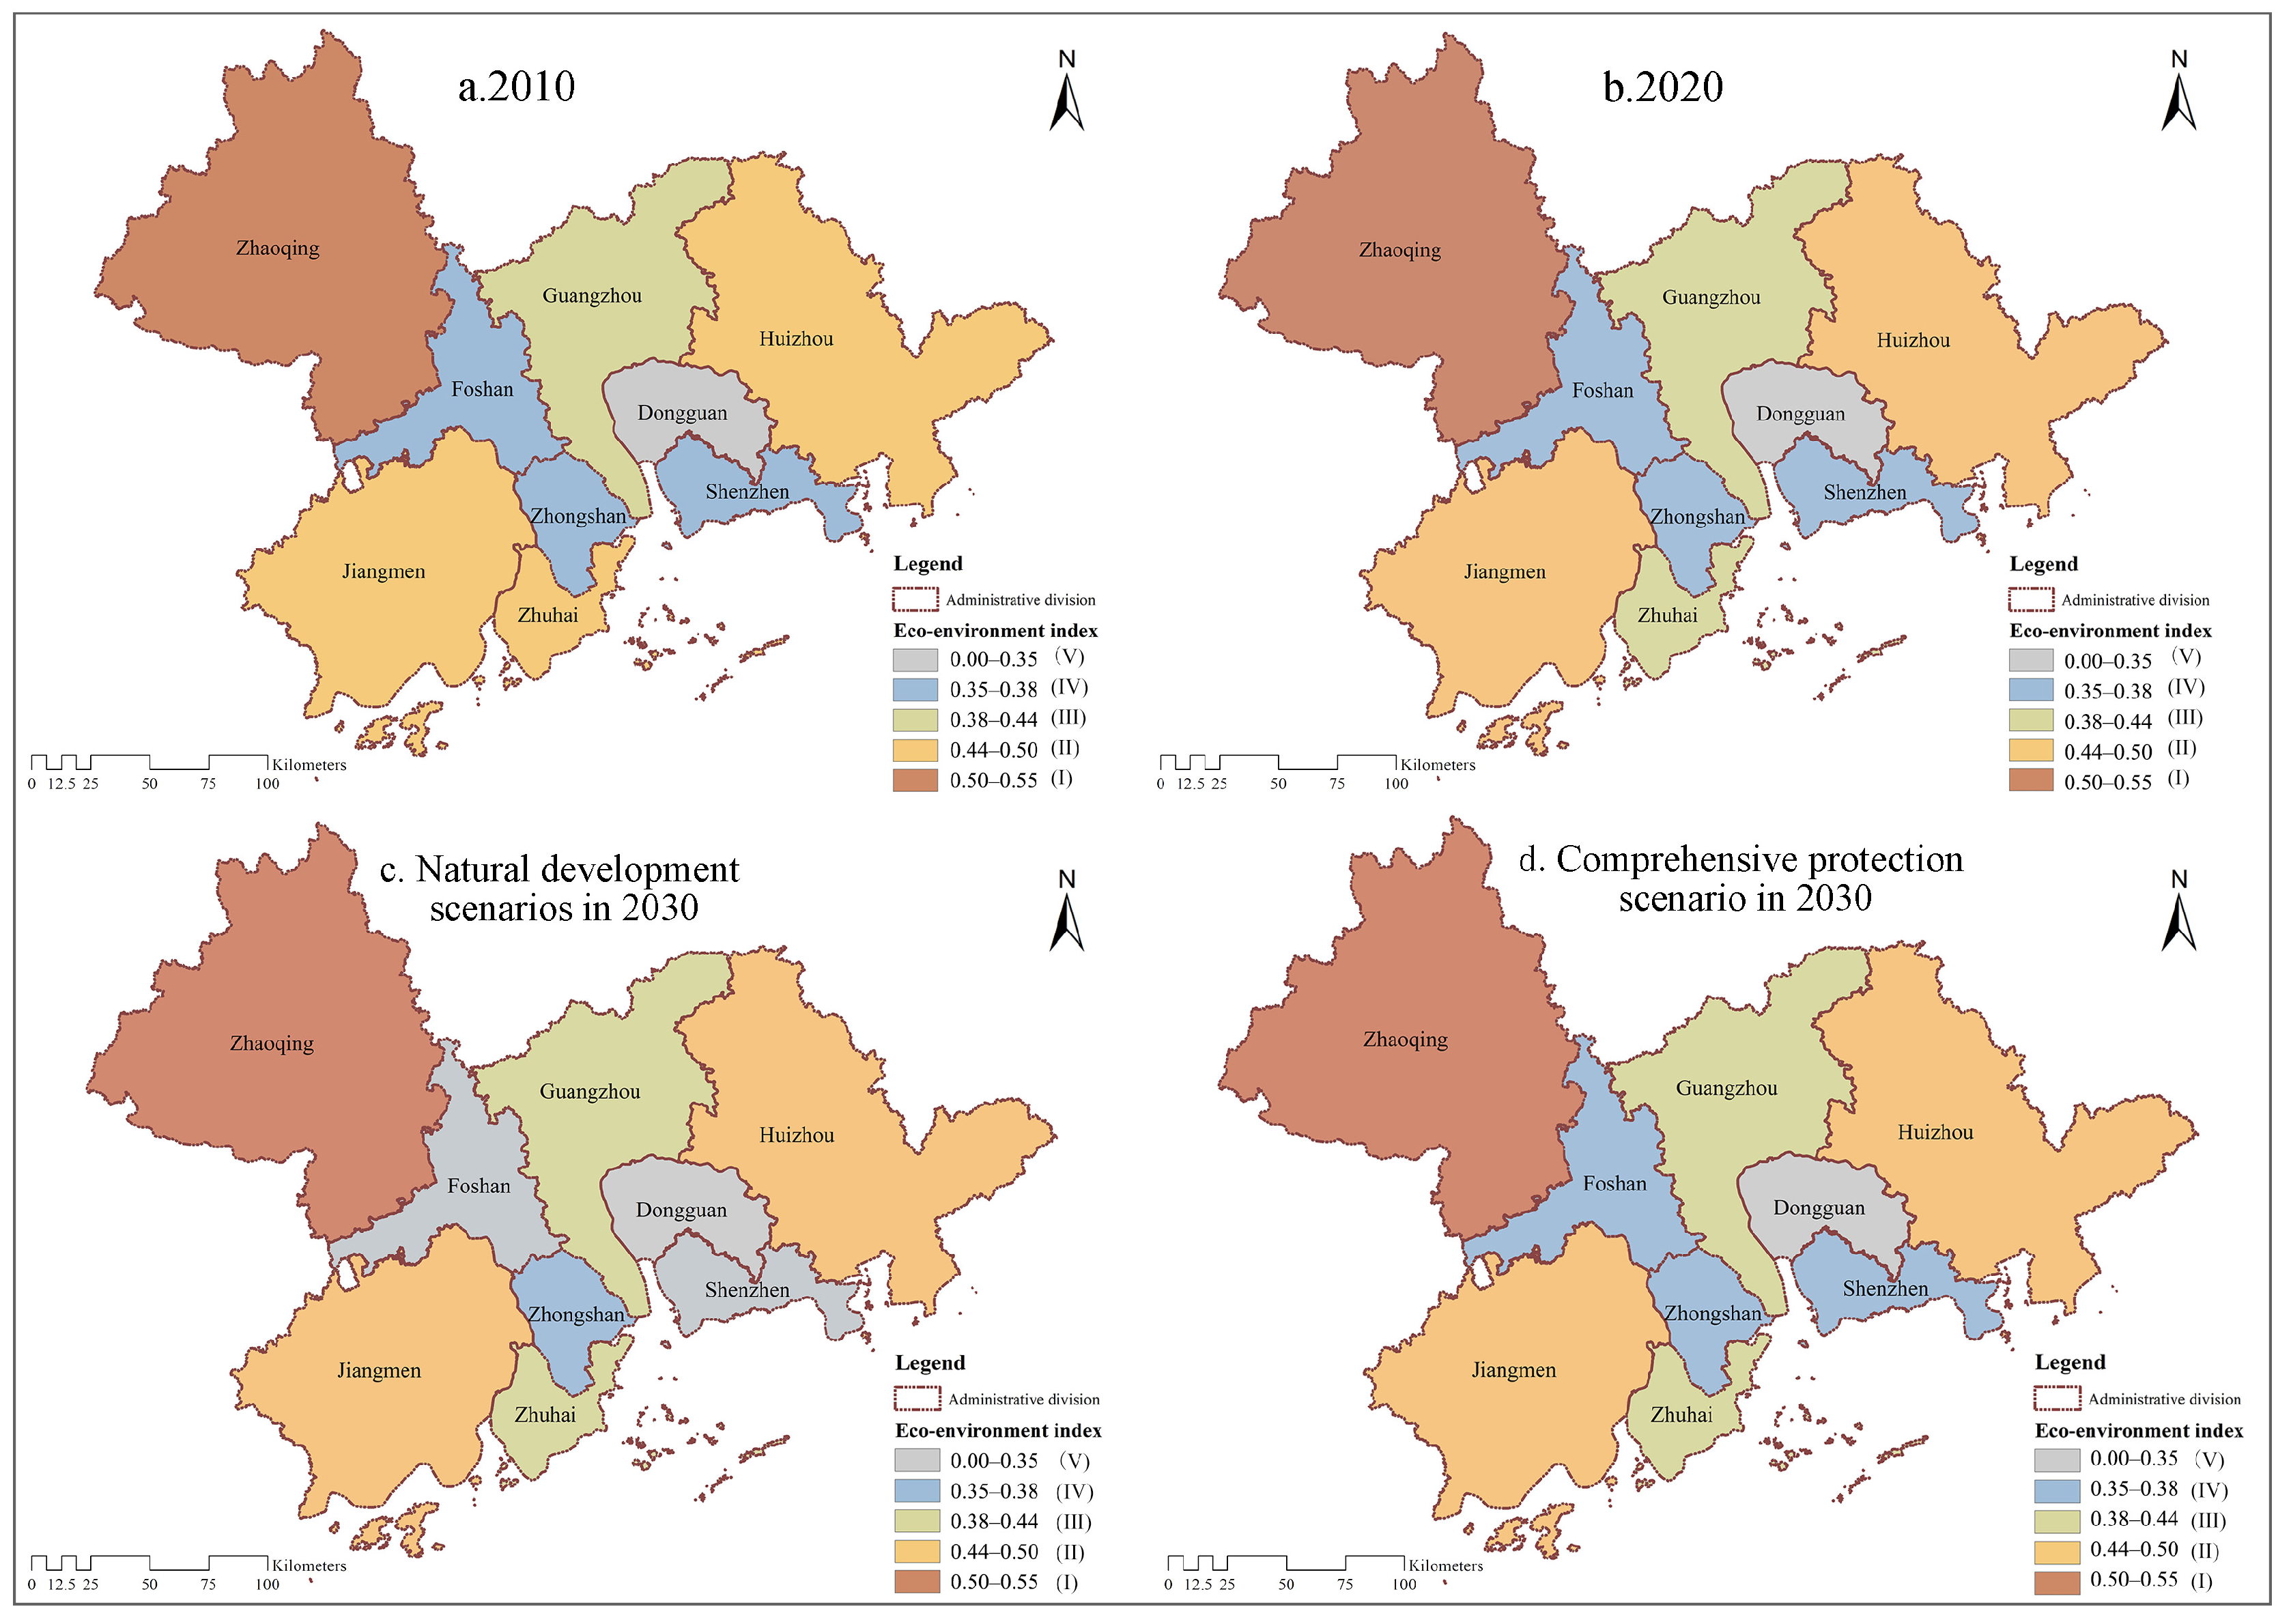
The overall EEQ in the nine cities of the PRD showed a declining trend. Shenzhen and Dongguan exhibited the most significant declines. After classifying the EVs, it was found that the deterioration in ecological quality from 2000 to 2010 was the most significant. The continuous expansion of CTL was the primary cause of Dongguan’s EEQ index being consistently the lowest. From 1990 to 2020, the trend of ecological deterioration caused by LUCC was higher than the trend of ecological improvement, and there was a clear decline in the overall EEQ in the region. Farmland made outstanding contributions to improving EEQ, followed by CTL.
(3)
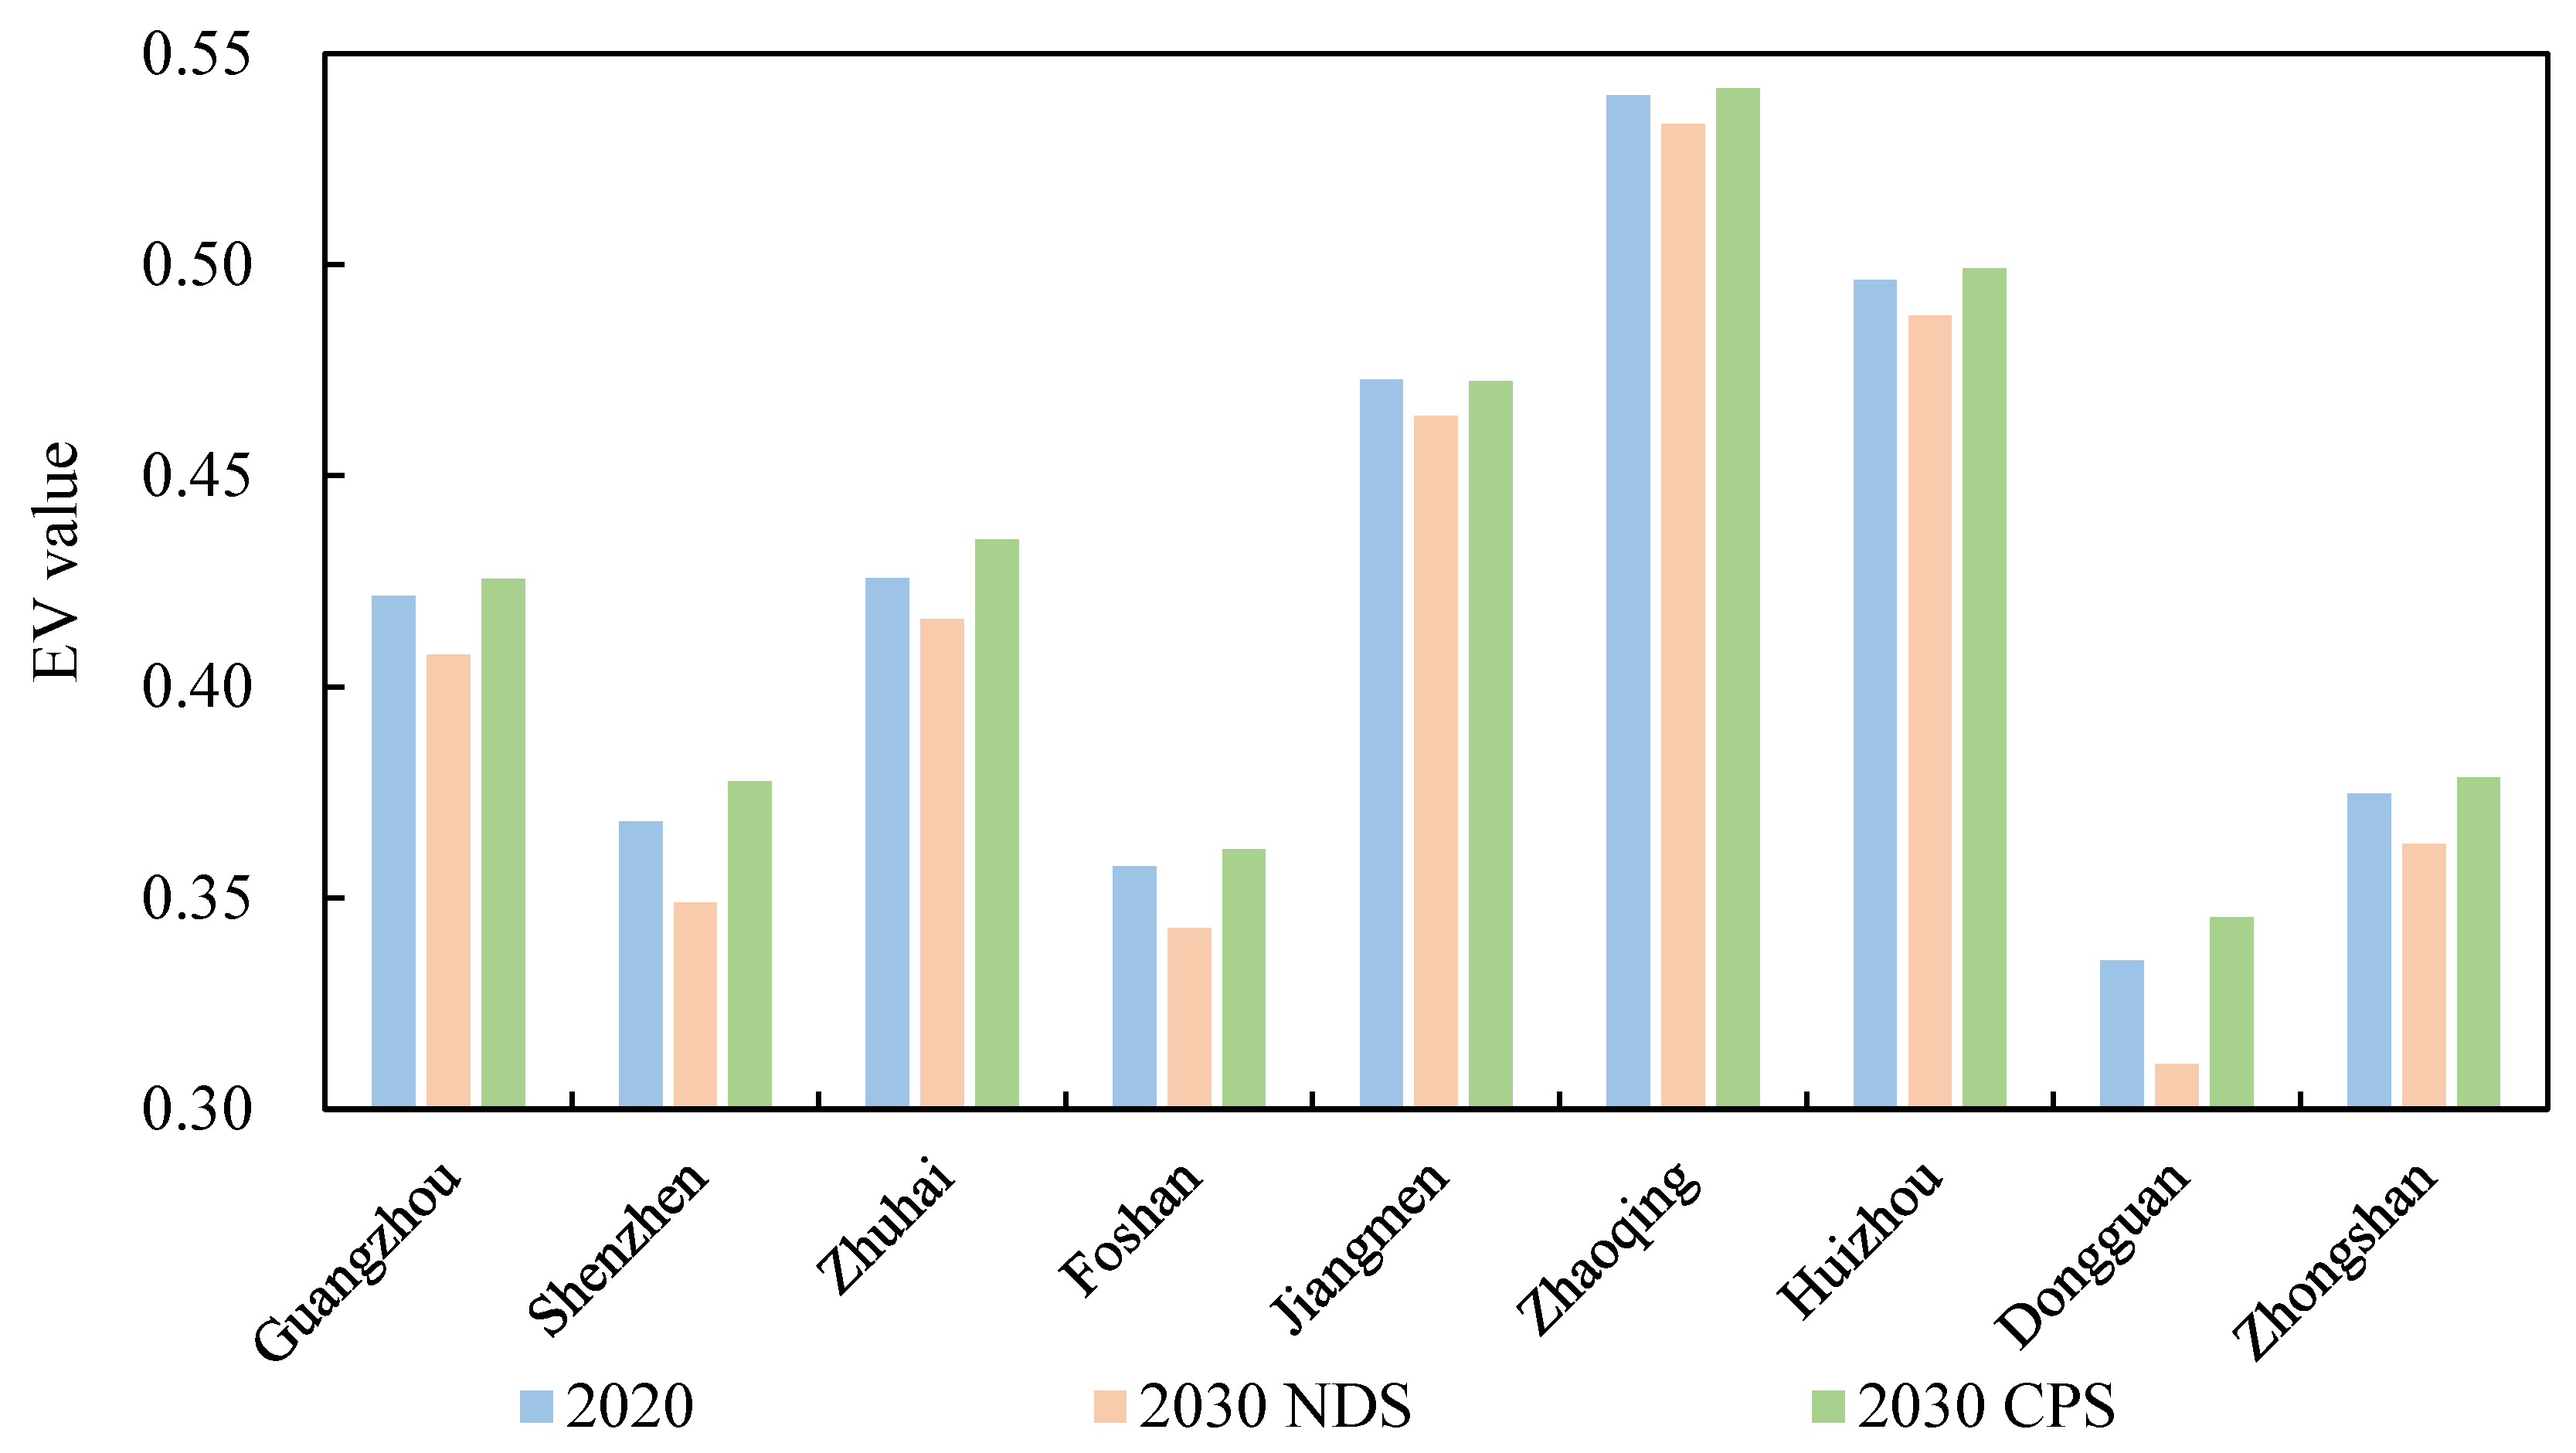
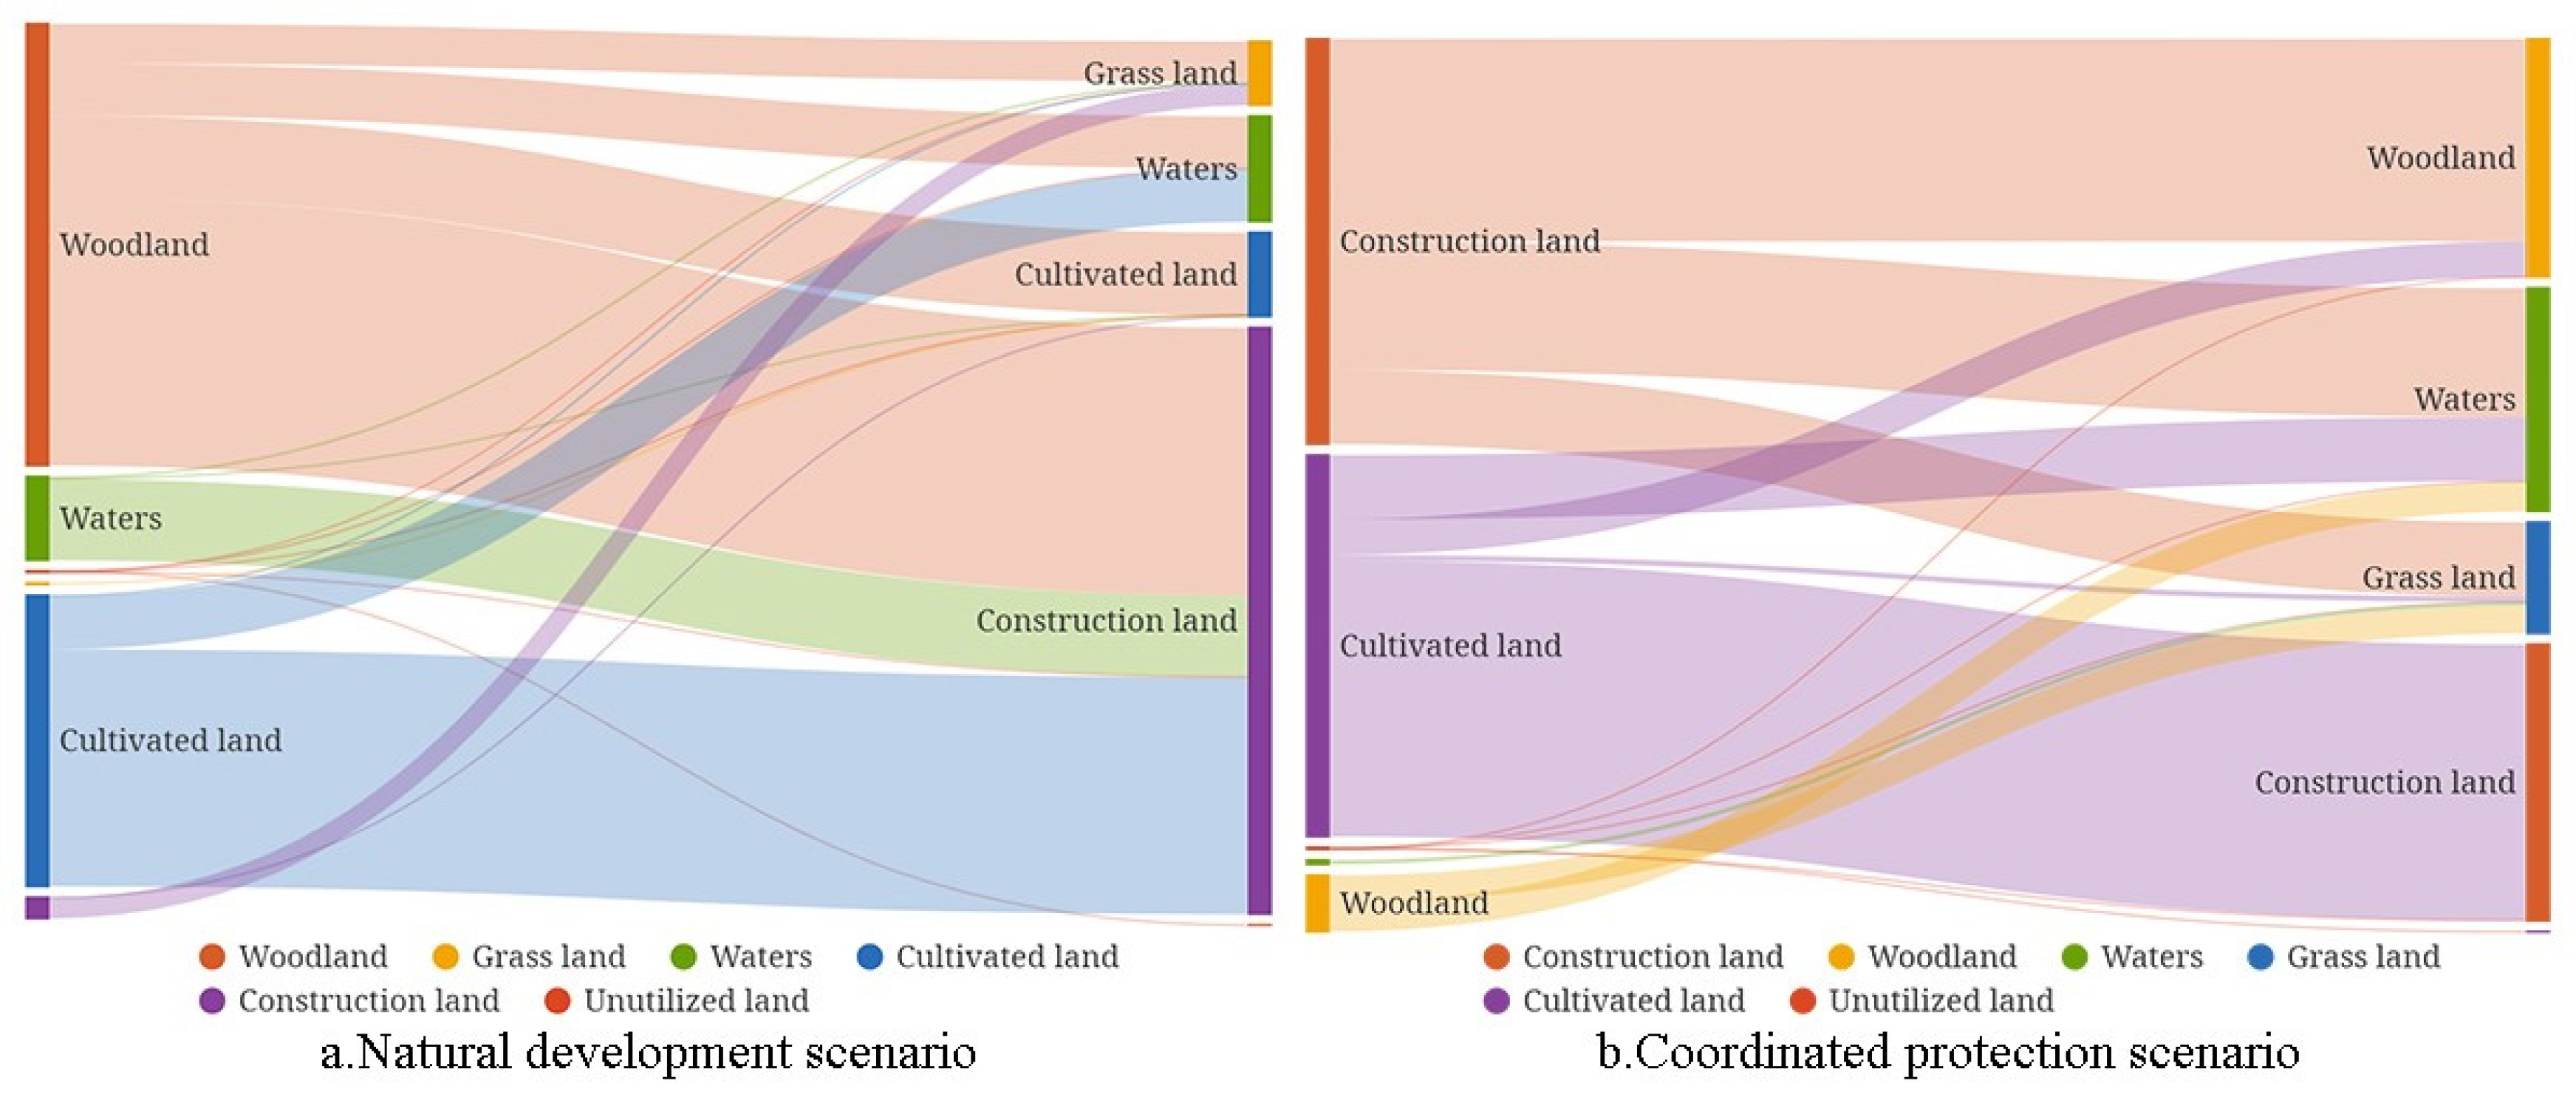
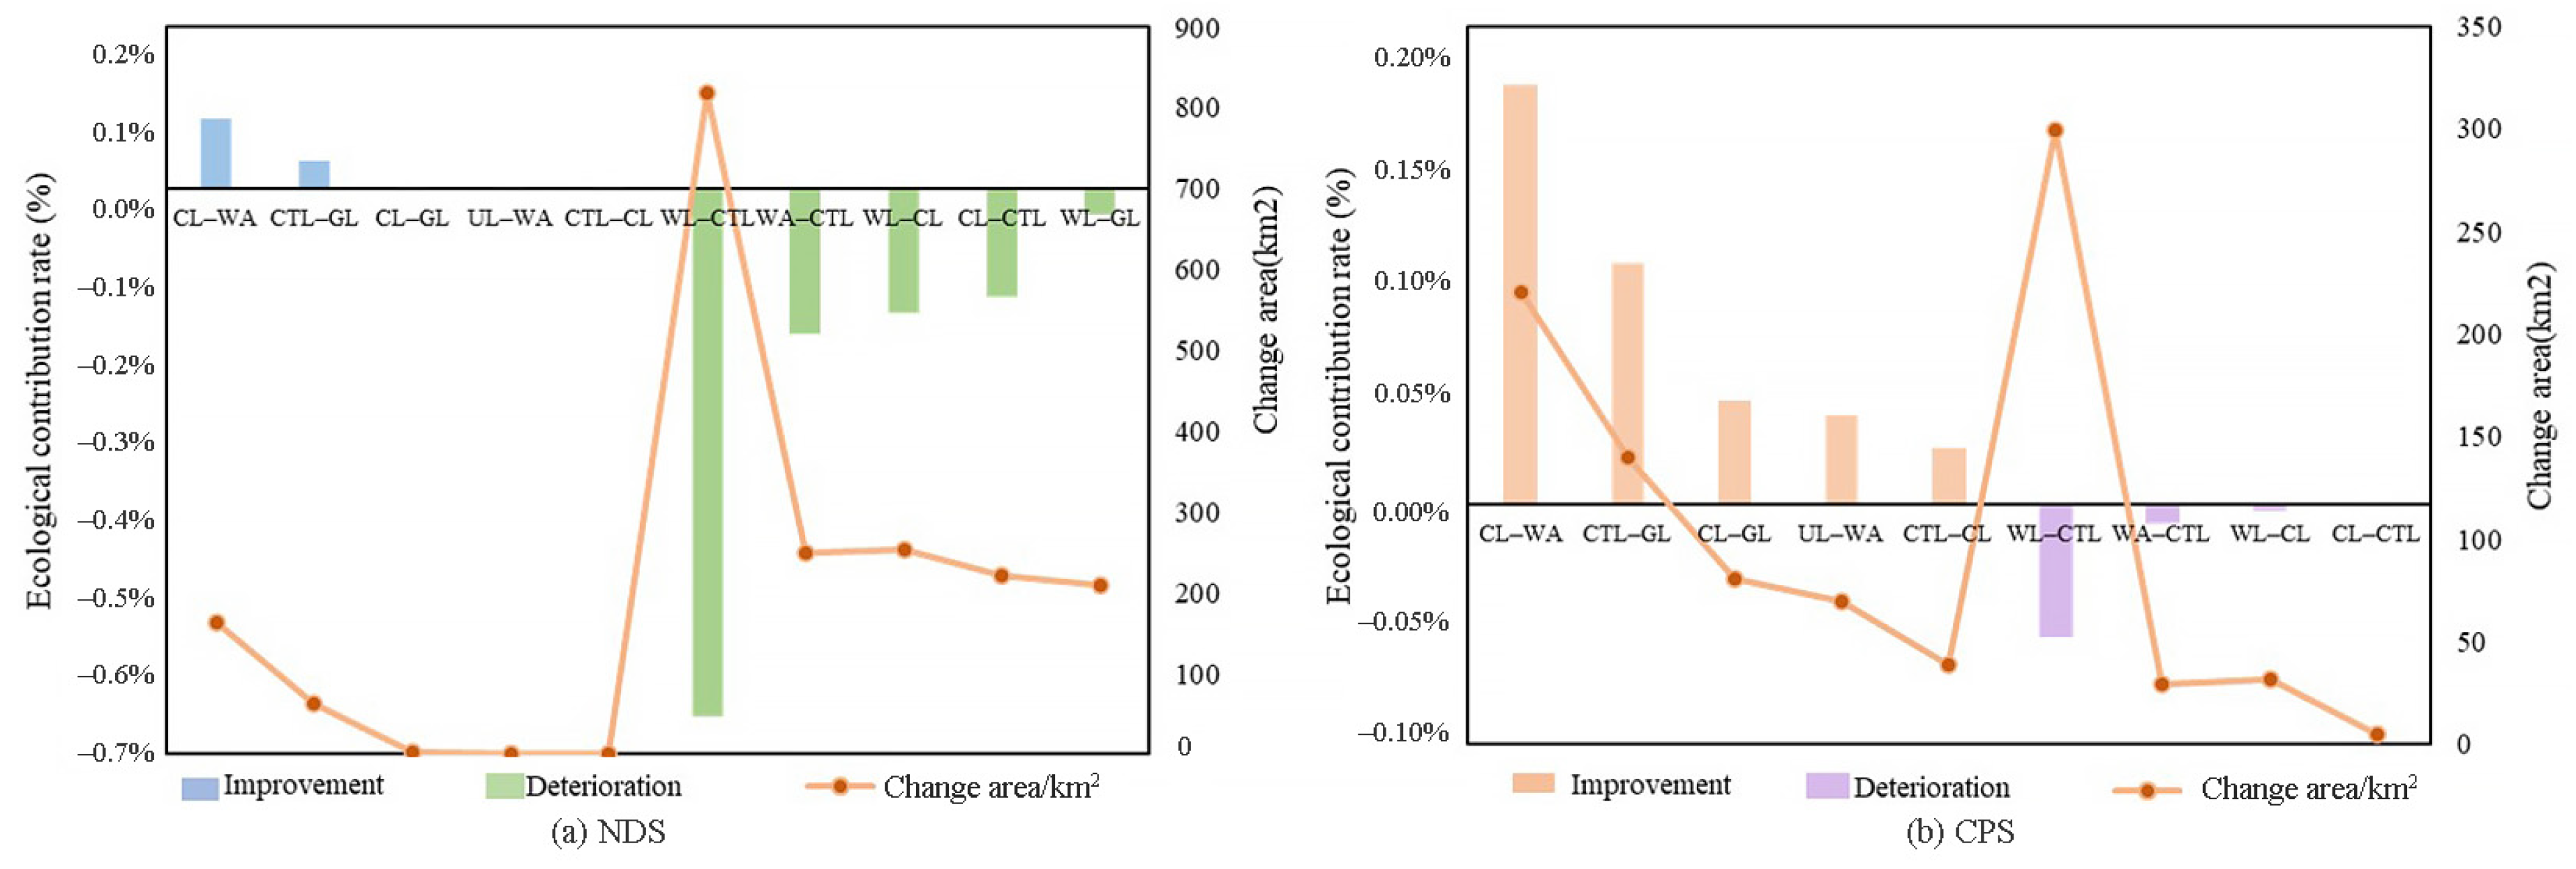
From the perspective of multi-scenario land use change simulation, the degree of reduction in the CL area under the CPS was significantly lower than that under the NDS. The shrinkage of forestland was controlled and showed a positive growth trend. Under the NDS, the change in forestland was the most severe, and the degradation of forestland was further aggravated. Under the CPS, the expansion trend of CTL was reversed. Moreover, under the NDS, the EEQ continued to decline, while under the CPS, the restoration effects of the ecological environment in various cities were apparent.
However, this study still has some limitations. For example, the focus of this research is on the scale of urban land use change, and there is a lack of research on internal changes within cities. Future studies can be conducted at the county level. Additionally, incorporating socioeconomic data can allow more accurate assessment of the economic and environmental quality of cities in the PRD and analysis of the developmental disparities among cities. Finally, future research should consider more diversified factors that constrain land use change in order to provide more targeted recommendations based on the current status of land use change and simulation results.

Supplementary Materials

The following supporting information can be downloaded at: https://www.mdpi.com/article/10.3390/land13040520/s1, Figure S1: Change of cultivated land area in the cities of the PRD from 1990 to 2020; Figure S2: Change of woodland area in the cities of the PRD from 1990 to 2020; Figure S3: Change of grassland area in the cities of the PRD from 1990 to 2020; Figure S4: Change of construction land area in the cities of the PRD from 1990 to 2020; Figure S5: Change of water area in the cities of the PRD from 1990 to 2020; Figure S6: Change of unused land in the cities of the PRD from 1990 to 2020; Table S1: The main secondary land use transformation and its ecological contribution rate affecting the ecological environment quality in the PRD from 1990 to 2000; Table S2: The main secondary land use transformation and its ecological contribution rate affecting the ecological environment quality in the PRD from 2000 to 2010. Table S3: The main secondary land use transformation and its ecological contribution rate affecting the ecological environment quality in the PRD from 2010 to 2020.

Author Contributions

Conceptualization, H.W.; Data curation, H.X., W.H., Y.Y., S.L., Y.Z., X.G., T.X. and H.W.; Funding acquisition, H.W.; Methodology, H.X., W.H. and H.W.; Formal analysis, H.X., Y.Y., W.H. and H.W.; Writing—original draft, H.W. and H.X. All authors have read and agreed to the published version of the manuscript.

Funding

This research was financially supported by the National Key Research and Development Project of China (no. 2021YFC3101700); the National Natural Science Foundation of China (no. 42201241); the Supplemental Funds for Major Scientific Research Projects of Beijing Normal University, Zhuhai (no. ZHPT2023001); and a startup fund to Huihui Wang from the Advanced Institute of Natural Sciences, Beijing Normal University, Zhuhai (no. 310432104).

Institutional Review Board Statement

Not applicable.

Informed Consent Statement

Not applicable.

Data Availability Statement

The original contributions presented in the study are included in the article and Supplementary Materials, further inquiries can be directed to the corresponding author.

Acknowledgments

The authors would like to thank the anonymous reviewers for their helpful and constructive comments.

Conflicts of Interest

The authors declare no conflicts of interest.

References

  1. Li, J.; Zhang, C.; Zhu, S. Relative contributions of climate and land-use change to ecosystem services in arid inland basins. J. Clean. Prod. 2021, 298, 126844. [Google Scholar] [CrossRef]
  2. Xie, X.; Fang, B.; Xu, H.; He, S.; Li, X. Study on the coordinated relationship between Urban Land use efficiency and ecosystem health in China. Land Use Policy 2021, 102, 105235. [Google Scholar] [CrossRef]
  3. Grainger, A. National Land Use Morphology: Patterns and Possibilities. Geography 1995, 80, 3. [Google Scholar]
  4. Turner, B.L.I.; Skole, D.L.; Sanderson, S.; Fischer, G.; Fresco, L.; Leemans, R. Land-use and land-cover change: Science/research plan. Glob. Chang. Rep. 1995, 43, 669–679. [Google Scholar] [CrossRef]
  5. Jackson, K.T. Crabg rass Frontier. In The Suburbanization of the United States; Oxford University Press: New York, NY, USA, 1985; p. 1207. [Google Scholar] [CrossRef]
  6. Misra, A.; Balaji, R. Decadal changes in the land use/land cover and shoreline along the coastal districts of southern Gujarat, India. Environ. Monit. Assess. 2015, 187, 461. [Google Scholar] [CrossRef] [PubMed]
  7. Soffianian, A.; Madanian, M. Monitoring land cover changes in isfahan province, iran using landsat satellite data. Environ. Monit. Assess. 2015, 187, 543. [Google Scholar] [CrossRef] [PubMed]
  8. Wu, J.; Luo, J.; Zhang, H.; Yu, M. Driving forces behind the spatiotemporal heterogeneity of land-use and land-cover change: A case study of the Weihe River Basin, China. J. Arid. Land 2023, 15, 253–273. [Google Scholar] [CrossRef]
  9. Cao, H.M.; Chen, W.; Tan, X.L.; Li, Q. Identification and driving mechanism of the industrial land use transition in China. Habitat Int. 2023, 138, 102848. [Google Scholar] [CrossRef]
  10. Sun, D.Z.; Liang, Y.J. Multi-scenario simulation of land use dynamic in the Loess Plateau using an improved Markov-CA model. J. Geoinf. Sci. 2021, 23, 825–836. [Google Scholar] [CrossRef]
  11. Chase, T.N.; Pielke, R.A., Sr.; Kittel, T.G.F.; Nemani, R.R.; Running, S.W. Simulated impacts of historical land cover changes on global climate in northern winter. Clim. Dyn. 2000, 16, 93–105. [Google Scholar] [CrossRef]
  12. Zhou, T.; Shen, W.; Qiu, X.; Chang, H.; Yang, H.; Yang, W. Impact evaluation of a payments for ecosystem services program on vegetation quantity and quality restoration in Inner Mongolia. J. Environ. Manag. 2022, 303, 114113. [Google Scholar] [CrossRef]
  13. Peng, J.; Xu, Y.; Cai, Y.; Xiao, H. Climatic and anthropogenic drivers of land use/cover change in fragile karst areas of southwest China since the early 1970s: A case study on the Maotiaohe watershed. Environ. Earth Sci. 2011, 64, 2107–2118. [Google Scholar] [CrossRef]
  14. Chen, S.; Feng, Y.; Tong, X.; Liu, S.; Xie, H.; Gao, C.; Lei, Z. Modeling ESV losses caused by urban expansion using cellular automata and geographically weighted regression. Sci. Total Environ. 2020, 712, 136509. [Google Scholar] [CrossRef] [PubMed]
  15. Li, X.W.; Fang, C.L.; Huang, J.C.; Mao, H.Y. Urban land use change and its regional eco-environmental effects in Arid Areas of Northwest China: A case study of Hexi Region in Gansu Province. Quat. Study 2003, 3, 280–290+348–349. (In Chinese) [Google Scholar]
  16. Du, L.; Dong, C.; Kang, X.; Qian, X.; Gu, L. Spatiotemporal evolution of land cover changes and landscape ecological risk assessment in the Yellow River Basin, 2015–2020. J. Environ. Manag. 2023, 332, 117149. [Google Scholar] [CrossRef] [PubMed]
  17. Xia, B.; Zheng, L. Ecological environmental effects and their driving factors of land use/cover change: The case study of Baiyangdian Basin, China. Processes 2022, 10, 2648. [Google Scholar] [CrossRef]
  18. Shi, Q.; Gu, C.J.; Xiao, C. Multiple scenarios analysis on land use simulation by coupling socioeconomic and ecological sustainability in Shanghai, China. Sustain. Cities Soc. 2023, 95, 104578. [Google Scholar] [CrossRef]
  19. Liu, P.; Hu, Y.; Jia, W. Land use optimization research based on FLUS model and ecosystem services–setting Jinan City as an example. Urban Clim. 2021, 40, 100984. [Google Scholar] [CrossRef]
  20. Cervelli, E.; Recchi, P.F.; di Perta, E.S.; Pindozzi, S. Land use change scenario building combining agricultural development policies, landscape-planning approaches, and ecosystem service assessment: A case study from the Campania Region (Italy). Land 2023, 12, 1865. [Google Scholar] [CrossRef]
  21. Cao, M.; Tian, Y.; Wu, K.; Chen, M.; Chen, Y.; Hu, X.; Sun, Z.; Zuo, L.; Lin, J.; Luo, L.; et al. Future land-use change and its impact on terrestrial ecosystem carbon pool evolution along the Silk Road under SDG scenarios. Sci. Bull. 2023, 68, 740–749. [Google Scholar] [CrossRef]
  22. Wang, Z.; Li, X.; Mao, Y.; Li, L.; Wang, X.; Lin, Q. Dynamic simulation of land use change and assessment of carbon storage based on climate change scenarios at the city level: A case study of Bortala, China. Ecol. Indic. 2022, 134, 108499. [Google Scholar] [CrossRef]
  23. Liang, X.; Guan, Q.; Clarke, K.C.; Liu, S.; Wang, B.; Yao, Y. Understanding the drivers of sustainable land expansion using a patch-generating land use simulation (PLUS) model: A case study in Wuhan, China. Comput. Environ. Urban Syst. 2021, 85, 101569. [Google Scholar] [CrossRef]
  24. Li, Y.; Zhang, J.; Zhu, H.; Zhou, Z.; Jiang, S.; He, S.; Zhang, Y.; Huang, Y.; Li, M.; Xing, G.; et al. Soil erosion characteristics and scenario analysis in the Yellow River Basin based on PLUS and RUSLE models. Int. J. Environ. Res. Public Health 2023, 20, 1222. [Google Scholar] [CrossRef] [PubMed]
  25. Kumar, V.; Agrawal, S. A multi-layer perceptron–Markov chain based LULC change analysis and prediction using remote sensing data in Prayagraj district, India. Environ. Monit. Assess. 2023, 195, 619. [Google Scholar] [CrossRef] [PubMed]
  26. López, E.; Bocco, G.; Mendoza, M.; Duhau, E. Predicting land-cover and land-use change in the urban fringe. Landsc. Urban Plan. 2001, 55, 271–285. [Google Scholar] [CrossRef]
  27. Shen, Q.; Chen, Q.; Tang, B.-S.; Yeung, S.; Hu, Y.; Cheung, G. A system dynamics model for the sustainable land use planning and development. Habitat Int. 2009, 33, 15–25. [Google Scholar] [CrossRef]
  28. Ghosh, P.; Mukhopadhyay, A.; Chanda, A.; Mondal, P.; Akhand, A.; Mukherjee, S.; Nayak, S.K.; Ghosh, S.; Mitra, D.; Ghosh, T. Application of Cellular automata and Markov-chain model in geospatial environmental modeling—A review. Remote Sens. Appl. Soc. Environ. 2017, 5, 64–77. [Google Scholar] [CrossRef]
  29. Verburg, P.H.; Schulp, C.J.E.; Witte, N.; Veldkamp, A. Downscaling of land use change scenarios to assess the dynamics of European landscapes. Agric. Ecosyst. Environ. 2006, 114, 39–56. [Google Scholar] [CrossRef]
  30. Wu, G.P.; Zeng, Y.N.; Feng, X.Z.; Xiao, P.F.; Wang, K. Dynamic simulation of land use change based on the improved CLUE-S model: A case study of Yongding County-Zhangjiajie. Geogr. Res. 2010, 29, 460–470. (In Chinese) [Google Scholar]
  31. Araya, Y.H.; Cabral, P. Analysis and modeling of urban land cover change in Setúbal and Sesimbra, Portugal. Remote Sens. 2010, 2, 1549–1563. [Google Scholar] [CrossRef]
  32. da Cunha, E.R.; Santos, C.A.G.; da Silva, R.M.; Bacani, V.M.; Pott, A. Future scenarios based on a CA-Markov land use and land cover simulation model for a tropical humid basin in the Cerrado/Atlantic forest ecotone of Brazil. Land Use Policy 2020, 101, 105141. [Google Scholar] [CrossRef]
  33. Huang, H.; Chen, Y.; Clinton, N.; Wang, J.; Wang, X.; Liu, C.; Gong, P.; Yang, J.; Bai, Y.; Zheng, Y.; et al. Mapping major land cover dynamics in Beijing using all Landsat images in Google Earth Engine. Remote Sens. Environ. 2017, 202, 166–176. [Google Scholar] [CrossRef]
  34. Yang, Z.; Fang, H.; Xue, X. Sustainable efficiency and CO2 reduction potential of china’s construction industry: Application of a three-stage virtual frontier SBM-DEA model. J. Asian Archit. Build. Eng. 2022, 21, 604–617. [Google Scholar] [CrossRef]
  35. Hu, P.; Li, F.; Sun, X.; Liu, Y.; Chen, X.; Hu, D. Assessment of land-use/cover changes and its ecological effect in rapidly urbanized areas—Taking Pearl River Delta urban agglomeration as a case. Sustainability 2021, 13, 5075. [Google Scholar] [CrossRef]
  36. Liu, Y.; Wu, K.; Cao, H. Land-use change and its driving factors in Henan province from 1995 to 2015. Arab. J. Geosci. 2022, 15, 3. [Google Scholar] [CrossRef]
  37. Yu, J.H.; Xin, C.L.; Feng, X.J. Study on the spatial-temporal evolution of land use and its thermal environmental effects in Chengdu. Acad. J. Archit. Geotech. Eng. 2023, 5, 43–51. [Google Scholar] [CrossRef]
  38. China News Net (CNN). State Council: Urbanization Is a Serious Problem That Emphasizes Speed Over Quality. 2017. Available online: https://www.chinanews.com.cn/gn/2017/02-04/8140866.shtml (accessed on 15 June 2023).
  39. China News Net (CNN). Building the City to Rise Again Capital Extensive Enclosure “Non-Grain” Hidden Dangers Highlighted. 2013. Available online: https://www.chinanews.com.cn/house/2013/10-25/5423282.shtml (accessed on 21 June 2023).
  40. Wang, X.L.; Bao, Y.H. Research methods of land use dynamic change. Geogr. Sci. Prog. 1999, 18, 83–89. (In Chinese) [Google Scholar]
  41. Huang, B.; Huang, J.; Pontius, R.G.J.; Tu, Z. Comparison of Intensity Analysis and the land use dynamic degrees to measure land changes outside versus inside the coastal zone of Longhai, China. Ecol. Indic. 2018, 89, 336–347. [Google Scholar] [CrossRef]
  42. Liu, J.Y.; Liu, M.L.; Zhuang, D.F.; Zhang, Z.X.; Deng, X.Z. Study on spatial pattern of land-use change in China during 1995–2000. Sci. China Ser. D Earth Sci. 2003, 46, 373–384. [Google Scholar] [CrossRef]
  43. Liu, Y.; Gao, J.; Yang, Y. A holistic approach towards assessment of severity of land degradation along the Great Wall in northern Shaanxi Province, China. Environ. Monit. Assess. 2003, 82, 187–202. [Google Scholar] [CrossRef]
  44. Xiao, R.; Yu, X.; Shi, R.; Zhang, Z.; Gao, J. Ecosystem health monitoring in the Shanghai-Hangzhou bay metropolitan area: A hidden Markov modeling approach. Environ. Int. 2019, 133, 105170. [Google Scholar] [CrossRef] [PubMed]
  45. Gharaibeh, A.; Shaamala, A.; Obeidat, R.M.; Al-Kofahi, S. Improving land-use change modeling by integrating ANN with Cellular Automata-Markov Chain model. Heliyon 2020, 6, e05092. [Google Scholar] [CrossRef] [PubMed]
  46. Okwuashi, O.; Ndehedehe, C.E. Integrating machine learning with Markov chain and cellular automata models for modelling urban land use change. Remote Sens. Appl. Soc. Environ. 2020, 21, 100461. [Google Scholar] [CrossRef]
  47. Guan, D.J.; Li, H.F.; Inohae, T.; Su, W.; Hokao, K. Modeling urban land use change by the integration of cellular automaton and Markov model. Ecol. Model. 2011, 222, 3761–3772. [Google Scholar] [CrossRef]
  48. Ye, B.Y.; Bai, Z.K. Simulating land use/cover changes of Nenjiang County based on CA-Markov model. In Proceedings of the Computer and Computing Technologies in Agriculture, Wuyishan, China, 18–20 August 2007; Volume 258, pp. 319–327. [Google Scholar]
  49. Fu, F.; Deng, S.; Wu, D.; Liu, W.; Bai, Z. Research on the spatiotemporal evolution of land use landscape pattern in a county area based on CA-Markov model. Sustain. Cities Soc. 2022, 80, 103760. [Google Scholar] [CrossRef]
  50. Li, L.; Huang, X.; Wu, D.; Yang, H. Construction of ecological security pattern adapting to future land use change in Pearl River Delta, China. Appl. Geogr. 2023, 154, 102946. [Google Scholar] [CrossRef]
  51. Qu, Y.; Jiang, G.H.; Li, Z.; Tian, Y.; Wei, S. Understanding rural land use transition and regional consolidation implications in China. Land Use Policy 2019, 82, 742–753. [Google Scholar] [CrossRef]
  52. Dong, Y.; Ma, W.; Tan, Z.; Wang, Y.; Zeng, W. Spatial and temporal variation of multiple eco-environmental indicators in Erhai Lake Basin of China under land use transitions. Environ. Sci. Pollut. Res. 2023, 30, 16236–16252. [Google Scholar] [CrossRef] [PubMed]
  53. Li, C.; Wu, J. Land use transformation and eco-environmental effects based on production-living-ecological spatial synergy: Evidence from Shaanxi Province, China. Environ. Sci. Pollut. Res. 2022, 29, 41492–41504. [Google Scholar] [CrossRef]
  54. Li, S.; Fu, M.; Tian, Y.; Xiong, Y.; Wei, C. Relationship between urban land use efficiency and economic development level in the Beijing–Tianjin–Hebei region. Land 2022, 11, 976. [Google Scholar] [CrossRef]
  55. Gao, L.; Tao, F.; Liu, R.; Wang, Z.; Leng, H.; Zhou, T. Multi-scenario simulation and ecological risk analysis of land use based on the PLUS model: A case study of Nan**g. Sustain. Cities Soc. 2022, 85, 104055. [Google Scholar] [CrossRef]
  56. Dong, G.; Zhao, F.; Chen, J.; Qu, L.; Jiang, S.; Chen, J.; Xin, X.; Shao, C. Land uses changed the dynamics and controls of carbon-water exchanges in alkali-saline Songnen Plain of Northeast China. Ecol. Indic. 2021, 133, 108353. [Google Scholar] [CrossRef]
  57. Delphin, S.; Snyder, K.A.; Tanner, S.; Musalem, K.; Marsh, S.E.; Soto, J.R. Obstacles to the development of integrated land-use planning in developing countries: The case of Paraguay. Land 2022, 11, 1339. [Google Scholar] [CrossRef]
  58. Xie, H.; Zhai, Q.; Wang, W.; Yu, J.; Lu, F.; Chen, Q. Does intensive land use promote a reduction in carbon emissions? Evidence from the Chinese industrial sector. Resour. Conserv. Recycl. 2018, 137, 167–176. [Google Scholar] [CrossRef]
  59. Xia, C.; Zhang, J.; Zhao, J.; Xue, F.; Li, Q.; Fang, K.; Shao, Z.; Li, S.; Zhou, J. Exploring potential of urban land-use management on carbon emissions—A case of Hangzhou, China. Ecol. Indic. 2023, 146, 109902. [Google Scholar] [CrossRef]
  60. China News Net (CNN). Zoning Control Ecology Is Better and Beautiful CHINA Has a Green Scale. 2022. Available online: http://www.chinanews.com.cn/gn/2022/01-18/9654903.shtml (accessed on 23 July 2023).
  61. Sklenicka, P. Classification of farmland ownership fragmentation as a cause of land degradation: A review on typology, consequences, and remedies. Land Use Policy 2016, 57, 694–701. [Google Scholar] [CrossRef]
  62. Su, L.; Jia, J.J. Empirical research about the degree of city-industry integration: A contrast of the typical cities in China. J. Interdiscip. Math. 2017, 20, 87–100. [Google Scholar] [CrossRef]
Figure 1. The location of the study area.
Land 13 00520 g001
Figure 2. The methodological framework of this study.
Land 13 00520 g002
Figure 3. The overall situation of land use change from 1990 to 2020.
Land 13 00520 g003
Figure 4. Spatial distribution characteristics of land use from 1990 to 2020.
Land 13 00520 g004
Figure 5. Single dynamic degrees of land use from 1990 to 2020.
Land 13 00520 g005
Figure 6. The comprehensive land use dynamic degrees from 1990 to 2020.
Land 13 00520 g006
Figure 7. Change characteristics of land use transfer from 1990 to 2020.
Land 13 00520 g007
Figure 8. Spatial distribution of EVs from 1990 to 2020.
Land 13 00520 g008
Figure 9. Spatial distribution of EVs for single secondary land use classification.
Land 13 00520 g009
Figure 10. The ecological contribution rate of land use types from 1990 to 2020.
Land 13 00520 g010
Figure 11. Comparison of real data and simulation results for land use in 2020.
Land 13 00520 g011
Figure 12. Comparison of multi-scenario land use simulation results for 2030.
Land 13 00520 g012
Figure 13. EEQ index trends in 2020–2030 for multiple scenarios in the PRD.
Land 13 00520 g013
Figure 14. Spatial distribution of EVs in the PRD from 1990 to 2020.
Land 13 00520 g014
Figure 15. Multi-scenario land use simulation transfer characteristics in 2030.
Land 13 00520 g015
Figure 16. Prediction of multi-scenario ecological contribution rates in 2020–2030.
Land 13 00520 g016
Table 1. Land use ecological environment index assignments.
Primary Land Use TypeSecondary Land Use TypeEcological Quality Index Assignment
No.NameNo.Name
1Cultivated land
(CL)
11Paddy field0.30
12Dry land0.25
2Woodland
(WL)
21Forestland0.95
22Shrub land0.65
23Sparse woodland0.45
24Other woodland0.40
3Grassland
(GL)
31High-coverage grassland0.75
32Medium-coverage grassland0.45
33Low-coverage grassland0.20
4Water area
(WA)
41River channel0.55
42Lakes0.75
43Reservoir pond0.55
45Foreshore0.45
46Shoaly land0.55
5Construction land
(CTL)
51Urban land0.20
52Rural settlements0.20
53Other construction land0.15
6Unutilized land
(UL)
61Sandy land0.01
64Marshland0.65
65Bare land0.05
66Bare rock texture0.01
67Other unused land0.01
99Marine, reclamation, or other unused land0.01
Table 2. Ecological environment indices of the PRD.
Cities1990200020102020
Guangzhou0.5599 0.5594 0.5451 0.5396
Shenzhen0.5951 0.5481 0.4941 0.4859
Zhuhai0.5136 0.5011 0.5202 0.4996
Foshan0.4739 0.4799 0.4217 0.4111
Jiangmen0.6046 0.6066 0.6006 0.5981
Zhaoqing0.7562 0.7531 0.7458 0.7418
Huizhou0.6721 0.6726 0.6683 0.6674
Dongguan0.4435 0.4233 0.3881 0.3803
Zhongshan0.4800 0.4813 0.4370 0.4350
Table 3. Secondary land use transformations and their ecological contribution rates affecting the EEQ.
PatternSecondary Land Use Type ChangeChange Area/km2Ecological Contribution Rate
Eco-environmental qualityPond–reservoir pond965.840.445%
Other woodland–woodland359.190.364%
Paddy fields–woodland130.580.156%
Dry land–forestland106.500.137%
Open woodland–forestland140.830.130%
Dry land–reservoir pond135.430.075%
Rural settlements–forestland35.120.049%
Paddy field–river canal92.230.042%
Rural settlements–paddy field192.340.035%
Paddy field–high-coverage grassland36.400.030%
Eco-environmental qualityForestland–other woodland691.28−0.700%
Forestland–other construction land281.96−0.415%
Forestland–urban land178.59−0.247%
Reservoir pond–urban land360.99−0.233%
Paddy field–other construction land740.05−0.204%
Paddy field–urban land1080.64−0.199%
Reservoir pond–paddy field401.91−0.185%
Forestland–paddy field129.13−0.155%
Reservoir pond–other construction land201.64−0.149%
Forestland–dry land95.69−0.123%
Table 4. Land use area changes in the PRD from 2020 to 2030 (km2).
Land Use Types20202030 (NDS)2030 (CPS)
CL12,008.4211,374.7811,594.38
WL28,872.0127,519.8729,069.42
GL1008.771204.731129.48
WA4017.834083.714255.64
CTL8004.969735.667864.98
UL6.894.104.98
Disclaimer/Publisher’s Note: The statements, opinions and data contained in all publications are solely those of the individual author(s) and contributor(s) and not of MDPI and/or the editor(s). MDPI and/or the editor(s) disclaim responsibility for any injury to people or property resulting from any ideas, methods, instructions or products referred to in the content.

