Abstract
Urban parks are important for improving the quality of living environments. Although the impact of parks on housing prices has been well documented, the effects of the COVID-19 pandemic remain vague. This paper analyzes the housing prices of neighborhoods around Meixi Lake park in Changsha, at the initial stage of the COVID-19 pandemic in June 2020 and the stable stage of the recovery period in June 2023, which demonstrates the impacts of urban parks on property pricing and housing choice based on residential transaction data. The results indicate that urban parks are given a high priority in determining people’s choices. In June 2020, the risk of epidemic transmission and noise interference lowered the price of property that is close to public parks and recreational facilities. However, good management and social services in residential areas increase housing prices. However, when the pandemic ended, the strong demand for outdoor activities led to a price rise in the properties near Meixi Lake park. People are most likely to choose houses in a neighborhood characterized by good educational facilities and a high-quality living environment. More specially, the houses with a short distance to parks and where residents can enjoy the view of a lake or mountains are preferable to any others. A residential area adjacent to a super large park paired with a small park is the most valuable consideration for property developers and housing consumers.
1. Introduction
As an essential direct impact on residents’ living experiences, in recent years, housing prices have drawn increasing research attention, especially regarding the influence of urban green spaces. Urban green space brings various benefits to a citizen’s daily life and plays an important role in improving the quality of living environments [1]. The United Nations set goals of “universal provision of safe, inclusive, accessible, and green public spaces” in the 2030 Agenda for sustainable urban and human settlement development [2]. Cities with dense populations have established various types of small parks to meet the increasing needs of outdoor activities [3]. The proximity to urban parks is an important factor affecting housing prices [4]. Residents are willing to pay more when purchasing or renting houses near parks with pleasant environments [5] and to accept additional taxes and fees for keeping the service capacity of urban green spaces [6].
It has been well documented that the relationship between housing price and the distance from residence to park is inversely proportional [7,8,9,10]. The impact of distance to park on the price of newly built houses is much greater than that of old houses [11]. However, parks cannot influence the prices of houses located out of this effective range [12]. The effective distance from a park to adjacent houses is less than 1 km. Moreover, high-quality landscape facilities significantly enhance the prices of houses nearby [13], such as visible lake scenery [14,15] and harbor scenery [16]. Large green spaces such as national forest parks also contribute to the appreciation of housing prices [4,9,11], especially the prices of older houses [17]. However, mountain scenery has no significant effect on raising the price of high-rise residential property [16]. The quality and implementation period of park planning [18], trees with high conservation value [19,20], canopy coverage area [21], visual visibility of plants [22], and rainwater collection facilities can improve the housing prices of neighboring residential areas [23]. In addition, the heterogeneity in people’s needs for urban parks related to housing is evidenced [24,25]. The impacts of landscape in central areas on housing prices have been broadly investigated. The greening of residential areas and the quality of urban parks are the main factors that affect the appreciation of housing prices. On the contrary, an increase in the distance from urban parks devalues housing prices. It has been found that with every 1 km increase in the distance from residential areas to a lake park, housing prices decrease by approximately CNY 63,400 [26]. The impacts of blue spaces on housing prices are diverse. The proximity to blue spaces significantly increases housing prices [27].
When parks are located in urban airports [28], industrial land [29,30], areas with severe water pollution [31], or air pollution [32], the housing prices in nearby residential areas will decrease. When the crime rate is relatively high, parks can have a negative impact on housing prices [33,34,35,36]. An overly developed road network in a park can cause congestion [37,38], which, in addition to the various types of noise generated by activities such as square dancing [37,39], will cause a decrease in the value of houses. Outdated facilities in a park [40], weed-infested activity areas, and garbage everywhere [39], are factors that also have a negative impact on housing prices. More fragmented (NP)-, isolated (MNN)-, or irregularly shaped (MSI) landscape spatial patterns were found to be negatively associated with the price of a single-family house [41].
Since the COVID-19 pandemic developed rapidly in the world, the ways of working, studying, and social activities were forced to change [42]. Walking or relaxing in urban green spaces can improve mental health, and presenting a suitable park design and relaxation amenities can achieve maximum psychological relaxation effects [43]. Having a balcony with a good orientation and visible green space is an important solution to help people adapt to urban life, especially during possible outbreaks of infectious diseases [44]. The rate of growth in average housing prices in most Chinese cities has been slowing down recently compared with before the outbreak of the COVID-19 pandemic. The prices of housing became more polarized and even revealed a downward trend in certain cases [45,46,47,48,49]. On the contrary, the housing prices in some neighborhoods significantly increased in terms of advantages in urban economic and medical conditions and governance [50]. The resilience after the pandemic is different across areas of cities in terms of socio-economic and geographical characteristics. There is a significant correlation among the number of nearby hospitals, the ratio of green spaces, and housing prices [51].
This paper aims to examine the initial and stable stages of the recovery after the outbreak of COVID-19 and analyze the influencing factors of housing prices in residential areas around Meixi Lake park in Changsha. The Hedonic Price Model (HPM) is the main method for exploring external factors affecting housing prices. Through regression analysis, it evaluates the quantitative impact of various characteristic variables on housing prices. Meanwhile, based on real residential market data and using comparative analysis methods, we mainly observe changes in people’s purchasing behavior from the perspective of housing prices and sales while looking for new strategies to create a healthier living environment for the future of the city.
2. Materials and Methods
2.1. Study Area and Data
2.1.1. Study Area
Changsha is the capital city of Hunan Province in the central south of China. The city areas cover multiple parks, such as Yanghu Wetland park, Songya Lake Wetland park, Meixi Lake park, West Lake park, Jianshan Lake park, Shifeng Mountain Forest park, Gushan Forest park, and Hunan Forest Botanical Garden. The housing prices and transaction data from the neighboring community near Meixi Lake park are applied for analysis. The location of Meixi Lake park in Changsha is shown in Figure 1.
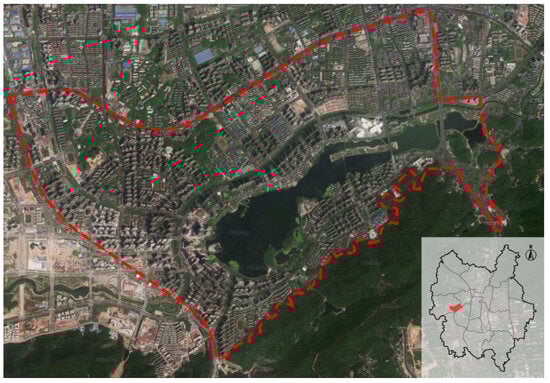
Figure 1.
Location of Meixi Lake and adjacent neighborhoods in Changsha (source: clipping of the authors from https://map.baidu.com/@12573595,3261549,12.77z/maptype%3DB_EARTH_MAP and https://hnxjxq.rednet.cn/content/2021/06/02/9427899.html (accessed on 22 March 2024)).
Meixi Lake park is located on the west bank of the Xiang River in the northwest of Yuelu District of Changsha. The area is about 200 hm2. In the past 10 years, the residential communities around Meixi Lake park have been developed along with a number of high-quality facilities regarding culture, education, commerce, technology, and medical care. Through the integration of green space and water systems, the microclimate in the region is adjusted to be more comfortable, and the heat island effect is significantly reduced. Various convenient transport services were provided for resident mobility. Many major cultural events have been conducted in this area, such as the international culture and art week, the flower art exhibition, and international lighting festival, which have greatly enriched the cultural life of the residents.
2.1.2. Data Preparation
This study mainly collected data from the Internet and field research. The information on the residential area (see Figure 2) was derived from two leading real estate information service platforms, i.e., “Anjuke” and “Lianjia” in China, including the number of transactions, average housing price, completion time, property management service costs, greening rate, and floor area ratio. Among these, the number of transactions and average price in June 2020 and June 2023 were selected for comparison analysis. In addition, the environment of each residential area was investigated based on lake and mountain scenery, social facilities, and schools around, as well as the current situation of the facilities. To determine the distance of people or vehicles from each residential community to the nearest subway station, public hospital, commercial center, Meixi Lake park, and other parks, the measurement tool in Google Maps was applied. According to the concept of building a “15-minute living circle” in China, the studied residential areas with 500 m to subway stations and parks, within 1.5 km, can reach commercial centers, hospitals, and Meixi Lake park. All satellite maps in this paper are taken from the leading map website in China, “Baidu Maps”.
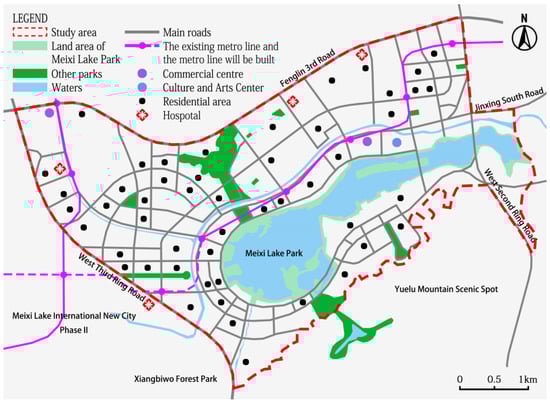
Figure 2.
Distribution of residential communities in the Meixi Lake park area (Source: Design of Xinxing Yang).
2.2. Method
The Hedonic Price Model (HPM) was introduced into the analysis of explanatory factors in pricing in 1967, which was developed as the main method to explore the external influencing factors of housing prices [52]. The effects of environmental features on housing prices are difficult to directly express. The HPM was revised to be widely applied for the monetary evaluation of ecosystem services and natural environments [4]. There are three forms of the HPM, including linear regression, semi-logarithmic regression, and logarithmic regression [2,4,12,18,22,25,53,54,55,56]. The functional forms of each model are described as follows.
The following equation describes the linear regression form, where P is the average price of the residential area (CNY/m2), α0 is the intercept, αi denotes coefficients to be estimated, Xi is the ith continuous feature variable, and ε is the error term.
The following equation describes the semi-logarithmic regression form, where αj is the coefficient to be estimated, Xj is the jth discrete attribute (dummy variable), and the meaning of the other symbols is the same as in Equation (1).
The following equation describes the logarithmic regression form, where the meanings of each symbol are the same as those in Equations (1) and (2).
The coefficient of a continuous characteristic variable directly corresponds to the price elasticity coefficient. The non-standardized regression coefficient of categorical feature variables is their semi-elastic coefficient. The semi-elastic coefficient cannot use the regression coefficient value directly, so it needs to be further derived based on the opposition of the regression coefficient, and the derived formula is expressed as follows, where θj is the semi-elastic coefficient, and the meaning of the other symbols is the same as in Equation (2).
2.3. Subsection and Quantification of Variables
The building age, floor area ratio, greening rate, residential area rate, and management service cost are selected to describe the property characteristics. The assessment of the feeling of the residential area environment mainly refers to the comprehensive evaluation of the environmental level of residential areas, including sanitary conditions and landscape construction. The management services of residential areas include various activities, such as repairing and maintaining house equipment, cleaning the environment of residential areas, and managing the order of residential areas. In this paper, property management costs are used to measure the level of property management services in residential areas.
For neighborhood facilities, the number of social services and education facilities in a radius of 500 m and the distances to public hospitals, subway stations, and commercial centers are considered in the modeling. In terms of characteristics related to the urban park, the distance to parks and recreational facilities as well as the mountain view and lake view are selected as influential factors. In addition, the distances from the center of the research area to the center of the city, completed train stations, high-speed rail stations, and airports are more than 10 km. The differences in the effect of these factors on housing prices can be ignored. So, these specific variables are not selected.
A total of 20 attribute features were selected as independent variables, of which 10 were related to urban parks. The meanings, specific quantification methods, and expected effect symbols of each variable are shown in Table 1. The data from 50 residential areas entered into the model were quantified according to Table 1, and the descriptive statistics of the specific variables are shown in Table 2.

Table 1.
Quantification and expected symbols of housing characteristic variables (source: elaboration of the authors).
Table 2.
Descriptive statistics of the variables in the HPM (source: elaboration of the authors based on data from field research, https://cs.anjuke.com/ (accessed on 22 March 2024) and https://cs.lianjia.com/ (accessed on 22 March 2024)).
3. Results and Analysis
The fitness of three regressions is shown in Table 3 and Table 4. The adjusted R2 of the logarithmic regression is greater than the linear regression and semi-logarithmic regression. This indicates that the logarithmic model has a better fit; thus, the selected independent variables can better explain the changes in housing prices in residential areas using logarithmic regression. The Durbin–Watson values (DW) were applied to test the autocorrelation in the regressions. According to the results shown in Table 3 and Table 4, the DW values of the logarithmic model are 2.102 (in the model of 2020) and 2.210 (in the model of 2023), which indicates that the residuals are basically independent. In summary, this paper ultimately chose the logarithmic model.
Table 3.
Regression statistical summary of three models (2020) (source: calculation by the authors).
Table 4.
Regression statistical summary of three models (2023) (source: calculation by the authors).
The results of the logistic regression using data from 2020 are shown in Table 5. The results of price elasticity and semi-elasticity are shown in Table 6. During the initial stage of COVID-19 in 2020, residents’ daily life experienced the most serious impacts. Table 5 shows that the effects of the distance to a hospital and the landscape view in Meixi Lake park on housing prices were significant. The quality of recreational facilities in other parks within 500 m of the residential area positively influenced housing prices. Among them, the non-standardized coefficient of the facilities in the other parks was negative since the outdoor activities in other parks with noise influence the living experience of nearby residents. Table 6 shows that for every 1% increase in property management service costs in residential areas, their housing prices increased by approximately 0.16%. For every 1% increase in driving distance from residential areas to a public hospital, the housing price increased by approximately 0.18%. The closest location to the residential area in Meixi Lake park is equipped with various landscape plants, and with each level of improvement in overall quality, the housing price of the residential area increased by approximately 7.68%. Compared with residential areas with parks within 500 m, the housing prices in residential areas without any other parks within 500 m increased by approximately 3.87%. Regarding the various recreational facilities in other parks, with each level of improvement in overall quality, the housing prices decreased by approximately 3.77%.
Table 5.
Results of the logarithmic regression (2020) (source: calculation by the authors).
Table 6.
Price elasticity and semi-elasticity of characteristics (2020) (source: calculation by the authors).
The results of the model in 2023 are shown in Table 7. The adjusted R2 value is 0.713, the DW value is 2.170, and the ANOVA significance value is 0.000. The variance inflation coefficient (VIF) values of each variable are between 1.208 and 2.035 (much less than 10), indicating that the five independent variables selected in this operation can explain the changes in housing prices in all residential areas. The independent variables are independent, and their collinearity is not severe. The price elasticity and semi-elasticity calculation results of these five independent variables are shown in Table 8.
Table 7.
Results of the logarithmic regression (2023) (source: calculation by the authors).
Table 8.
Price elasticity and semi-elasticity of the characteristics (2023) (source: calculation by the authors).
By June 2023, residents’ daily life in Changsha returned to a normal track. Table 7 shows the regression coefficients of the model based on the data from June 2023, which indicate that the effects of building age, distance to hospitals, the landscape view of Meixi Lake park, and the distance to commercial centers and Meixi Lake park were significant.
Table 8 shows that for every 1% increase in the construction time of residential buildings, the housing prices decreased by approximately 0.25%. For every 1% increase in driving distance from residential areas to commercial centers, the housing price decreased by approximately 0.13%. For every 1% increase in driving distance from residential areas to a public hospital, the housing price increased by approximately 0.28%. As the shortest walking distance from the residential area to Meixi Lake park increases by 1%, the housing prices decreased by approximately 0.12%. The closest location to the residential area in Meixi Lake park is equipped with various landscape plants, and with each level of improvement in overall quality, the housing price of the residential area increased by approximately 6.61%.
Comparing Table 5 and Table 7, the effects of distance to a hospital and the landscape view of Meixi Lake park were both significant in 2020 and 2023. Table 6 and Table 8 show that for every 1% increase in driving distance from residential areas to public hospitals, the housing price increased by approximately 0.18% in 2020 and 0.28% in 2023. With each level of improvement in overall quality, housing prices increased by approximately 7.68% in 2020 and by approximately 6.61% in 2023.
According to Figure 3, during the first wave of the COVID-19 pandemic in China, most of the residential areas with high housing prices were close to Meixi Lake park and had a good landscape view of Meixi Lake park. And the closer to Meixi Lake park the, higher the prices of residential buildings. Nevertheless, the housing prices of some residential areas with a good landscape view of Meixi Lake park decreased because they were located close to hospitals. The situation in 2023 was similar to that in 2020, with a slight upward trend.
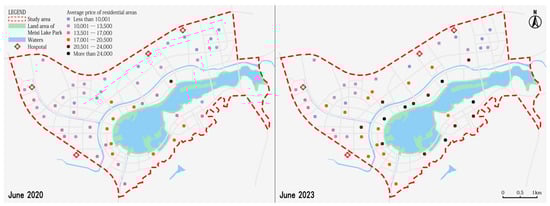
Figure 3.
Comparison of housing prices in residential areas between 2020 and 2023 (source: design by Xinxing Yang).
Table 5 shows that in 2020, the effect of other parks within 500 m of the residential areas and the quality of recreational facilities in other parks both were significant. Table 6 shows that in residential areas without parks within 500 m, their housing prices were 3.87% higher. Regarding the other parks’ recreational facilities, with each level of improvement in overall quality, the housing prices of nearby residential areas decreased by approximately 3.77%. Table 7 shows that in June 2023, the effect of distance to Meixi Lake park was significant at 5%. Table 8 shows that as the shortest walking distance from the residential area to Meixi Lake park increased by 1%, the housing prices decreased by approximately 0.12%.
In 2020, according to Figure 4, while the other factors remained consistent, if there were other parks nearby or if the recreational facilities in these parks were complete, the housing prices near residential areas would decrease. It is undeniable that after experiencing the most serious wave of COVID-19, people’s awareness of hygiene and prevention increased significantly. Even so, the parks near residential areas are still the most important places for people to have short-term outdoor activities, especially nearby parks with more complete recreational facilities. Meanwhile, parks are places where people accumulate, and the risk of contracting COVID-19 and the effects of noise on residents will also increase. Having a healthier, safer, and more comfortable environment makes housing prices higher. In 2023, according to Figure 5, with the disappearance of the COVID-19 pandemic, residents in neighboring communities preferred to visit Meixi Lake park for outdoor activities rather than the other parks around their residential area.
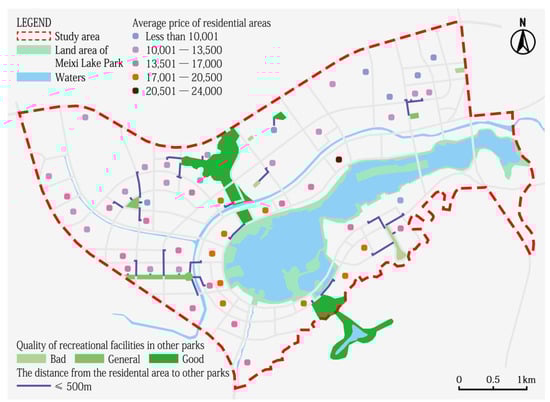
Figure 4.
Park factors affecting housing prices in residential areas in June 2020 and housing prices (source: design by Xinxing Yang).
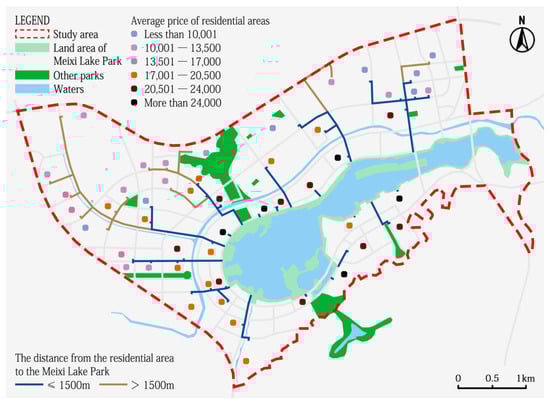
Figure 5.
Distances from all residential areas to Meixi Lake park in June 2023 and housing prices (source: design by Xinxing Yang).
In terms of other factors that affect housing prices in residential areas. In June 2020, according to Table 5, the effect of property management services on the housing prices of residential areas was significant. Under the most serious wave of the COVID-19 pandemic, more and more people chose to stay at home. At this time, the role of property management services in residential areas would become more important. Therefore, higher-quality property management services would enhance the economic value of the residential area. In June 2023, according to Table 7, the effect of building age and the distance to the commercial center on the housing prices of residential areas was significant. Following the disappearance of the COVID-19 pandemic, people started paying more attention to the quality of residential buildings. Residential buildings with younger ages are designed more reasonably and have more advanced infrastructure configurations. People’s consumption also started to increase, and urban commercial centers are one of the best shopping and activity venues for residents. All of these can enhance the economic value of residential areas.
According to Figure 6, with housing prices below 13,500 CNY/m2, more than 60 houses with good social services and other parks within 500 m of the residential area were sold. There were more than 50 houses with good education facilities, parks, and landscape views nearby. This indicates that housing consumers appreciate better social services and good schools in residential areas, as well as other parks with good scenery nearby. With housing prices from 13,500 to 20,500 CNY/m2, more than 100 houses were sold, characterized by good education facilities and parks within 500 m, the view of Meixi Lake, a short walking distance to Meixi Lake park, and high-quality recreational facilities. There were more than 50 houses with good landscape views of other parks nearby and the scenery of Yuelu Mountain.
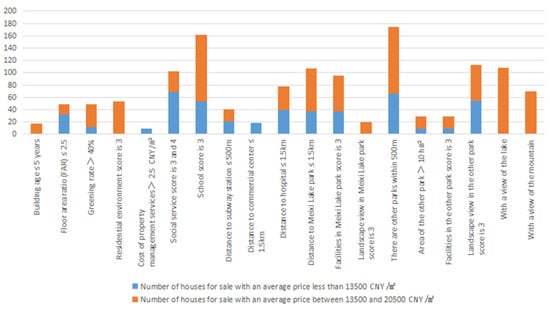
Figure 6.
Sales of houses in two price ranges under different characteristics before June 2020 (Source: elaboration by the authors).
From June 2020 to June 2023, there were more than 100 houses with a price below 13,500 CNY/m2 (see Figure 7). More than 400 houses were sold with a price from 13,500 to 20,500 CNY/m2, which were close to public hospitals and Meixi Lake park and had a landscape view of nearby parks and Meixi Lake. Among all the houses with a selling price of more than CNY 20,500 per square meter, the number of houses sold with these characteristics was more than 400 units. This includes a walking distance to Meixi Lake park of less than 1.5 km, residential areas with good schools, and the residential area with the scenery of Meixi Lake and Yuelu Mountain.
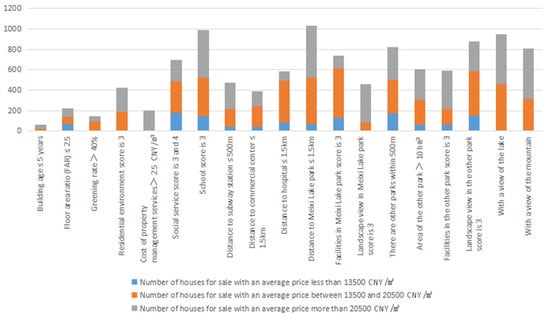
Figure 7.
Sales of houses in three price ranges under different characteristics from June 2020 to June 2023 (source: elaboration by the authors).
Overall, housing consumers appreciate schools and parks within 500 m of the residential area, good social services, landscape views of nearby parks, and a short distance to Meixi Lake park. However, the difference between 2020 and 2023 is that in the early stages of the outbreak of the epidemic, social services played a more important role in housing choices, likely related to an increase in demand for living materials at home during this period. As the epidemic ended, mountain scenery became more influential. It reflects people’s longing for a high quality of life and the pursuit of good luck.
4. Discussion
According to the statistical analysis, seven relationships between residential areas and parks were summarized (see Table 9). This classification is based on whether there are parks around the residential area, referring to the measuring methods listed in Table 1 and dividing the park size according to the park’s own scope. As depicted in Figure 3, house prices in 26 residential areas rose after the COVID-19 pandemic. Combined with Table 9, the proportion of five types of residential and park relationships is demonstrated (see Figure 8). With regard to Figure 9 the sales of houses in 24 residential areas increased after the COVID-19 pandemic, and combined with Table 9, the proportions of seven types of residential and park relationships were obtained (see Figure 10).
Table 9.
Seven types of situations between residential areas and parks (source: elaboration by the authors based on https://map.baidu.com/@12575864,3262731,12.77z/maptype%3DB_EARTH_MAP (accessed on 22 March 2024)).
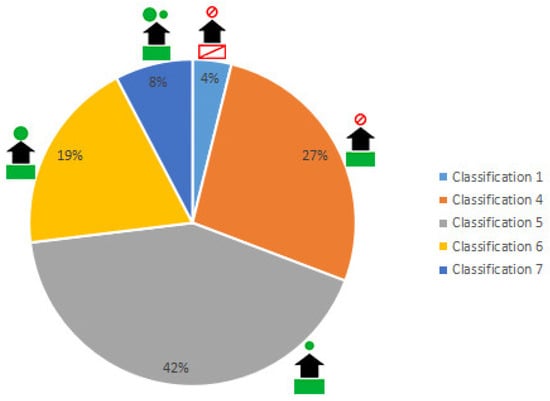
Figure 8.
The proportion of situations in parks and residential areas with rising housing prices after the COVID-19 pandemic (source: elaboration by the authors).
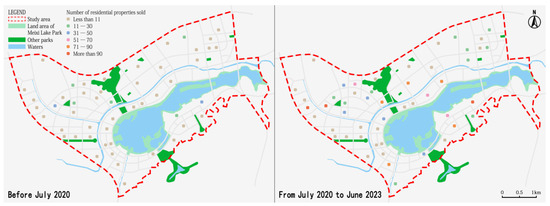
Figure 9.
Comparison of housing sales in residential areas (source: design by Xinxing Yang).
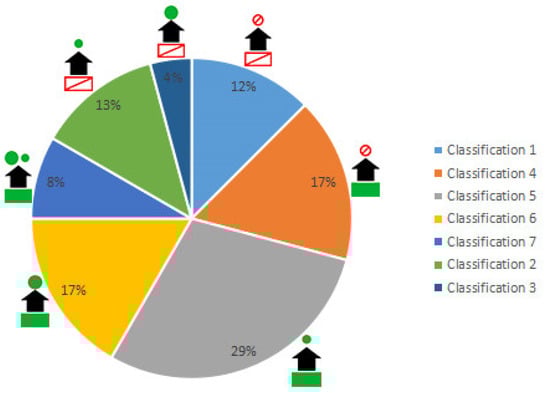
Figure 10.
The proportion of situations in parks and residential areas with increased sales of houses after the COVID-19 pandemic (source: elaboration by the authors).
As shown in Figure 9, only 1 of the 26 residential areas with rising housing prices is more than 1.5 km away from Meixi Lake park, which shows that Meixi Lake park can increase the value of houses after the COVID-19 pandemic. According to Figure 10, only three residential areas have no parks around them, indicating that urban parks are very important for residents’ daily lives. The residential areas close to both Meixi Lake park and other small parks are the major proportion in which housing prices and sales are both rising.
Overall, when only considering the influence of urban parks, the distance from the parks to residential areas is very important from the perspective of enhancing the economic value of a house. These residential areas with no more than a 1.5 km distance from Meixi Lake park are more stable in terms of housing appreciation and popularity. From the perspective of housing sales, housing consumers also prefer choosing residential areas near parks. People pay more attention to healthy lifestyles because they have just experienced COVID-19. In addition, the combination of Meixi Lake park and other small parks has obvious advantages in both increasing housing prices and meeting people’s housing preferences, which provides a practical reference value for property developers and housing consumers.
Both June 2020 and June 2023 showed that the better the landscape view, the higher the housing prices in neighboring residential areas of Meixi Lake park in Changsha. The closer houses were to a hospital, the lower the housing prices in residential areas. The housing price was relatively higher in residential communities with better schools and parks within 500 m, good landscape views around the residential area, a short distance to Meixi Lake park, and the water scenery of Meixi Lake.
In June 2020, the better property management services of residential areas might have significantly raised the housing prices; however, the parks with good recreational facilities around the residential areas would lower the housing prices. This is because people tend to gather in these parks, which poses a risk of human noise and the spread of the epidemic. Moreover, people spent more time at home, so the price of residential areas with good social services was higher.
In June 2023, people’s strong demand to go out for leisure was released when the epidemic was over. Both Meixi Lake park and the commercial center increased the housing prices of neighboring residential areas. Younger residential buildings have better design and infrastructure. Therefore, the housing prices in such residential areas were also higher. Residents were starting to pursue high-quality living environments and preferred houses with a view of mountains.
5. Conclusions
Nowadays, the demand for parks is gradually increasing. Assessing the non-market value of parks helps to efficiently organize urban space and allocate urban resources in a reasonable manner. Based on the data on housing prices and multiple attribute features of residential areas neighboring Meixi Lake park, the effects of features on housing prices were quantitatively evaluated using the HPM. At the same time, based on the actual housing sales data, the changes in people’s housing purchase behavior before and after the COVID-19 pandemic were revealed.
In recent years, many Chinese cities have actively participated in the national “Park City” program. After experiencing the COVID-19 pandemic, people pay more attention to a healthy lifestyle, so the expectations regarding property buying have also changed. Therefore, selecting a residential area around a super large park in the city, and avoiding large hospitals as much as possible, leads to polarized housing prices. The best residential area would be near a small park located in a park system with a super large park, as it could be covered by the park’s service function that fully meets residents’ daily exercise and recreational needs. Although various influences affect housing prices, having schools for all age groups and a broad view are still key considerations for all housing consumers. Residential areas with good property management services and social services are also important, as these facilities may enhance residents’ ability to cope with the risk of sudden infectious diseases in the future.
In the post-COVID-19 pandemic era, the research results of this paper have certain reference values for protecting and improving the urban ecological environment and optimizing the urban living environment. For example, building residential areas around large parks is beneficial for the spatial layout of urban natural landforms and the overall greening of the city. In the overall arrangement of various urban green spaces, the combination of large parks and small parks is an effective way to clarify the location and nature of park green spaces. In urban areas with such characteristics, the implementation of green area planning can be prioritized, and the main project can be constructed. The urban public administration can obtain economic benefits from real estate and also provide some financial support for the construction and subsequent optimization of the park system around residential areas.
There is still a great deal of future work to be conducted in this field. This paper is based on the system of Meixi Lake park and other surrounding parks. Because of the limited radiation range, it is difficult to come up with a universal conclusion applicable to all city areas. Therefore, in-depth research will be conducted in the future, while paying attention to and learning from the latest relevant research results to make up for the above shortcomings.
Author Contributions
Conceptualization, X.Y. and Q.Y.; methodology, X.Y. and S.L.; software, X.Y.; validation, X.Y. and Y.P.; formal analysis, X.Y.; investigation, X.Y.; resources, X.Y. and S.L.; data curation, X.Y.; writing—original draft preparation, X.Y.; writing—review and editing, Y.P. and X.Y.; visualization, X.Y.; supervision, T.F. and Q.Y.; project administration, S.L. All authors have read and agreed to the published version of the manuscript.
Funding
This research received no external funding.
Data Availability Statement
The data presented in this study are available upon request from the corresponding author. The data are not publicly available because of privacy restrictions.
Acknowledgments
We appreciate the constructive suggestions and comments from the editor and the anonymous reviewers.
Conflicts of Interest
The authors declare no conflicts of interest.
References
- Zambrano-Monserrate, M.A.; Ruano, M.A.; Yoong-Parraga, C.; Silva, C.A. Urban green spaces and housing prices in developing countries: A Two-stage quantile spatial regression analysis. For. Policy Econ. 2021, 125, 102420. [Google Scholar] [CrossRef]
- Dell’anna, F.; Bravi, M.; Bottero, M. Urban Green infrastructures: How much did they affect property prices in Singapore? Urban For. Urban Green. 2022, 68, 127475. [Google Scholar] [CrossRef]
- Zhou, C.; An, Y.; Zhao, J.; Xue, Y.; Fu, L. How do mini-parks serve in groups? A visit analysis of mini-park groups in the neighbourhoods of Nanjing. Cities 2022, 129, 103804. [Google Scholar] [CrossRef]
- Chwiałkowski, C.; Zydroń, A. Socio-Economic and Spatial Characteristics of Wielkopolski National Park: Application of the Hedonic Pricing Method. Sustainability 2021, 13, 5001. [Google Scholar] [CrossRef]
- Zhou, K.; Song, Y.; Tan, R. Public perception matters: Estimating homebuyers’ willingness to pay for urban park quality. Urban For. Urban Green. 2021, 64, 127275. [Google Scholar] [CrossRef]
- Kolimenakis, A.; Solomou, A.D.; Proutsos, N.; Avramidou, E.V.; Korakaki, E.; Karetsos, G.; Kontogianni, A.B.; Kontos, K.; Georgiadis, C.; Maroulis, G.; et al. Public Perceptions of the Socioeconomic Importance of Urban Green Areas in the Era of COVID-19: A Case Study of a Nationwide Survey in Greece. Land 2022, 11, 2290. [Google Scholar] [CrossRef]
- Yang, L.; Liang, Y.; He, B.; Lu, Y.; Gou, Z. COVID-19 effects on property markets: The pandemic decreases the implicit price of metro accessibility. Tunn. Undergr. Space Technol. 2022, 125, 104528. [Google Scholar] [CrossRef]
- Morancho, A.B. A hedonic valuation of urban green areas. Landsc. Urban Plan. 2003, 66, 35–41. [Google Scholar] [CrossRef]
- Tyrväinen, L.; Miettinen, A. Property Prices and Urban Forest Amenities. J. Environ. Econ. Manag. 2000, 39, 205–223. [Google Scholar] [CrossRef]
- Liebelt, V.; Bartke, S.; Schwarz, N. Urban Green Spaces and Housing Prices: An Alternative Perspective. Sustainability 2019, 11, 3707. [Google Scholar] [CrossRef]
- Trojanek, R.; Gluszak, M.; Tanas, J. The effect of urban green spaces on house prices in warsaw. Int. J. Strat. Prop. Manag. 2018, 22, 358–371. [Google Scholar] [CrossRef]
- Daams, M.N.; Sijtsma, F.J.; Veneri, P. Mixed monetary and non-monetary valuation of attractive urban green space: A case study using Amsterdam house prices. Ecol. Econ. 2019, 166, 106430. [Google Scholar] [CrossRef]
- Su, S.; He, S.; Sun, C.; Zhang, H.; Hu, L.; Kang, M. Do landscape amenities impact private housing rental prices? A hierarchical hedonic modeling approach based on semantic and sentimental analysis of online housing advertisements across five Chinese megacities. Urban For. Urban Green. 2021, 58, 126968. [Google Scholar] [CrossRef]
- Luttik, J. The value of trees, water and open space as reflected by house prices in the Netherlands. Landsc. Urban Plan. 2000, 48, 161–167. [Google Scholar] [CrossRef]
- Michael, T.; Vicky, L.; Michael, J. Residential Real Estateprices: A Room with a View. J. Real Estate Res. 2002, 23, 129–137. [Google Scholar]
- Jim, C.; Chen, W.Y. External effects of neighbourhood parks and landscape elements on high-rise residential value. Land Use Policy 2010, 27, 662–670. [Google Scholar] [CrossRef]
- Yoon, H. When and where do we see the proximity effect of a new park? –A case study of the Dream Forest in Seoul, Korea. J. Environ. Plan. Manag. 2018, 61, 1113–1136. [Google Scholar] [CrossRef]
- Kim, H.-S.; Lee, G.-E.; Lee, J.-S.; Choi, Y. Understanding the local impact of urban park plans and park typology on housing price: A case study of the Busan metropolitan region, Korea. Landsc. Urban Plan. 2019, 184, 1–11. [Google Scholar] [CrossRef]
- Belcher, R.N.; Chisholm, R.A. Tropical Vegetation and Residential Property Value: A Hedonic Pricing Analysis in Singapore. Ecol. Econ. 2018, 149, 149–159. [Google Scholar] [CrossRef]
- Belcher, R.N.; Suen, E.; Menz, S.; Schroepfer, T. Shared landscapes increase condominium unit selling price in a high-density city. Landsc. Urban Plan. 2019, 192, 103644. [Google Scholar] [CrossRef]
- Donovan, G.H.; Prestemon, J.P.; Butry, D.T.; Kaminski, A.R.; Monleon, V.J. The politics of urban trees: Tree planting is associated with gentrification in Portland, Oregon. For. Policy Econ. 2021, 124, 102387. [Google Scholar] [CrossRef] [PubMed]
- Wu, C.; Du, Y.; Li, S.; Liu, P.; Ye, X. Does visual contact with green space impact housing pricesʔ An integrated approach of machine learning and hedonic modeling based on the perception of green space. Land Use Policy 2022, 115, 106048. [Google Scholar] [CrossRef]
- Sohn, W.; Kim, H.W.; Kim, J.-H.; Li, M.-H. The capitalized amenity of green infrastructure in single-family housing values: An application of the spatial hedonic pricing method. Urban For. Urban Green. 2020, 49, 126643. [Google Scholar] [CrossRef]
- Zhang, Y.; Zhang, T.; Zeng, Y.; Yu, C.; Zheng, S. The rising and heterogeneous demand for urban green space by Chinese urban residents: Evidence from Beijing. J. Clean. Prod. 2021, 313, 127781. [Google Scholar] [CrossRef]
- Cui, N.; Gu, H.; Shen, T.; Feng, C. The Impact of Micro-Level Influencing Factors on Home Value: A Housing Price-Rent Comparison. Sustainability 2018, 10, 4343. [Google Scholar] [CrossRef]
- Mao, D.; Wu, Y.; Yuan, Z.; Lu, Y.; Hu, X.; Que, S. Impact Analysis of Ecological Landscape on Housing Price in Changsha City. Econ. Geogr. 2018, 38, 76–82. [Google Scholar] [CrossRef]
- Huang, T.; He, Q.; Yang, D.; Ouyang, X. Evaluating the Impact of Urban Blue Space Accessibility on Housing Price: A Spatial Quantile Regression Approach Applied in Changsha, China. Front. Environ. Sci. 2021, 9, 696626. [Google Scholar] [CrossRef]
- Espey, M.; Lopez, H. The Impact of Airport Noise and Proximity on Residential Property Values. Growth Chang. 2000, 31, 408–419. [Google Scholar] [CrossRef]
- Panduro, T.E.; Veie, K.L. Classification and valuation of urban green spaces—A hedonic house price valuation. Landsc. Urban Plan. 2013, 120, 119–128. [Google Scholar] [CrossRef]
- Leggett, C.G.; Bockstael, N.E. Evidence of the Effects of Water Quality on Residential Land Prices. J. Environ. Econ. Manag. 2000, 39, 121–144. [Google Scholar] [CrossRef]
- Kim, C.W.; Phipps, T.T.; Anselin, L. Measuring the benefits of air quality improvement: A spatial hedonic approach. J. Environ. Econ. Manag. 2003, 45, 24–39. [Google Scholar] [CrossRef]
- Gallagher, D.R.; Jackson, S.E. Promoting community involvement at brownfields sites in socio-economically disadvantaged neighbourhoods. J. Environ. Plan. Manag. 2008, 51, 615–630. [Google Scholar] [CrossRef]
- Hobden, D.W.; E Laughton, G.; E Morgan, K. Green space borders—A tangible benefit? Evidence from four neighbourhoods in Surrey, British Columbia, 1980–2001. Land Use Policy 2004, 21, 129–138. [Google Scholar] [CrossRef]
- Troy, A.; Grove, J.M. Property values, parks, and crime: A hedonic analysis in Baltimore, MD. Landsc. Urban Plan. 2008, 87, 233–245. [Google Scholar] [CrossRef]
- Iqbal, A.; Ceccato, V. Does crime in parks affect apartment prices? J. Scand. Stud. Criminol. Crime Prev. 2015, 16, 97–121. [Google Scholar] [CrossRef]
- Iqbal, A.; Wilhelmsson, M. Park proximity, crime and apartment prices. Int. J. Hous. Mark. Anal. 2018, 11, 669–686. [Google Scholar] [CrossRef]
- Crompton, J.L. The impact of parks on property values: Empirical evidence from the past two decades in the United States. Manag. Leis. 2005, 10, 203–218. [Google Scholar] [CrossRef]
- Liu, L.; Meng, L.; Zhang, R. Does Easy Accessibility to Urban Parks Always Raise Home Values? J. Hous. Econ. 2024, 63, 101981. [Google Scholar] [CrossRef]
- Xiao, Y.; Hui, E.C.; Wen, H. The housing market impacts of human activities in public spaces: The case of the square dancing. Urban For. Urban Green. 2020, 54, 126769. [Google Scholar] [CrossRef]
- Cheshire, P.; Sheppard, S. On the Price of Land and the Value of Amenities. In The Economics of Land Use; Routledge: London, UK, 2017; pp. 315–335. [Google Scholar] [CrossRef]
- Kim, J.-H.; Li, W.; Newman, G.; Kil, S.-H.; Park, S.Y. The influence of urban landscape spatial patterns on single-family housing prices. Environ. Plan. B Urban Anal. City Sci. 2016, 45, 26–43. [Google Scholar] [CrossRef]
- Tajani, F.; Di Liddo, F.; Guarini, M.R.; Ranieri, R.; Anelli, D. An Assessment Methodology for the Evaluation of the Impacts of the COVID-19 Pandemic on the Italian Housing Market Demand. Buildings 2021, 11, 592. [Google Scholar] [CrossRef]
- Sari, M.; Fatimah, I.S.; Pratiwi, P.I.; Sulistyantara, B. Psychological Effects of Walking and Relaxed Sitting in Urban Greenspaces During Post-pandemic: A Case Study in Bogor City, Indonesia. J. Contemp. Urban Aff. 2023, 7, 1–17. [Google Scholar] [CrossRef]
- Rosa-Jimenez, C.; Jaime-Segura, C. Living Space Needs of Small Housing in the Post-Pandemic Era: Malaga as a case study. J. Contemp. Urban Aff. 2021, 6, 51–58. [Google Scholar] [CrossRef]
- Cheung, K.S.; Yiu, C.Y.; Xiong, C. Housing Market in the Time of Pandemic: A Price Gradient Analysis from the COVID-19 Epicentre in China. J. Risk Financial Manag. 2021, 14, 108. [Google Scholar] [CrossRef]
- Zhai, W.; Peng, Z.-R. Where to buy a house in the United States amid COVID-19? Environ. Plan. A Econ. Space 2020, 53, 9–11. [Google Scholar] [CrossRef]
- Chen, Y.; Luo, Z. Hedonic Pricing of Houses in Megacities Pre- and Post-COVID-19: A Case Study of Shanghai, China. Sustainability 2022, 14, 11021. [Google Scholar] [CrossRef]
- Ionascu, E. Romanian Housing Market before and during the COVID-19 Pandemic. In Innovative Models to Revive the Global Economy; Sciendo: Boston, MA, USA, 2020; pp. 96–105. [Google Scholar] [CrossRef]
- Slišković, T.; Sekur, T.; Beg, M. The COVID-19 Pandemic Effects on the Housing Market of the Northern and Pannonian Croatia. In Proceedings of the 11th International Scientific Symposium Region, Entrepreneurship, Development (RED 2022), Osijek, Hrvatska, 9–11 June 2022; pp. 708–727. [Google Scholar]
- Yang, M.; Zhou, J. The impact of COVID-19 on the housing market: Evidence from the Yangtze river delta region in China. Appl. Econ. Lett. 2022, 29, 409–412. [Google Scholar] [CrossRef]
- Li, M.; Peng, Y.; Wu, Y.; Xu, J.; Tan, T.; Guo, H.; Lu, W.; Yeh, A.G.O.; Xue, F. Role of the Built Environment in the Recovery From COVID-19: Evidence From a GIS-Based Natural Experiment on the City Blocks in Wuhan, China. Front. Built Environ. 2022, 7. [Google Scholar] [CrossRef]
- Coulson, E. Monograph on Hedonic Estimation and Housing Markets; Penn State University: State College, PA, USA, 2008. [Google Scholar]
- Soltani, A.; Pettit, C.J.; Heydari, M.; Aghaei, F. Housing price variations using spatio-temporal data mining techniques. J. Hous. Built Environ. 2021, 36, 1199–1227. [Google Scholar] [CrossRef]
- Huang, T.; He, Q.; Ouyang, X. The Capitalization Effect of Natural Amenities on Housing Price in Urban China: New Evidence From Changsha. Front. Environ. Sci. 2022, 10, 833831. [Google Scholar] [CrossRef]
- Heyman, A.V.; Sommervoll, D.E. House prices and relative location. Cities 2019, 95, 102373. [Google Scholar] [CrossRef]
- Hoover, F.-A.; Price, J.; Hopton, M. Examining the effects of green infrastructure on residential sales prices in Omaha, Nebraska. Urban For. Urban Green. 2020, 54, 126778. [Google Scholar] [CrossRef] [PubMed]


Disclaimer/Publisher’s Note: The statements, opinions and data contained in all publications are solely those of the individual author(s) and contributor(s) and not of MDPI and/or the editor(s). MDPI and/or the editor(s) disclaim responsibility for any injury to people or property resulting from any ideas, methods, instructions or products referred to in the content. |
© 2024 by the authors. Licensee MDPI, Basel, Switzerland. This article is an open access article distributed under the terms and conditions of the Creative Commons Attribution (CC BY) license (https://creativecommons.org/licenses/by/4.0/).