Abstract
In recent years, an increasing number of Chinese cities have experienced population decline, impacting the urban economy, public services, and paid use of state-owned land (PUL). This paper employs a coupled coordination degree model and the gray correlation coefficient method to examine the relationship between the rate of population change from 1990 to 2020, the rate of PUL change from 2000 to 2020, and the coupled coordination of economy and public services. The study arrives at several conclusions: (1) Cities with declining populations exhibit a lower PUL rate than those without population shrinkage, indicating reduced activity in the land market. (2) Population growth plays a significant role in the coordinated development of the urban economy and public services, fostering urbanization. (3) The economy and public services in shrinking cities rely heavily on revenue generated from the transfer of PUL rights to support their coordinated development. This research provides an insightful comparison between shrinking and non-shrinking cities by integrating the unique compensated land transfer system in China with the critical variable of population change.
1. Introduction
Despite the rapid growth of the world’s population, urban shrinkage remains a widespread phenomenon globally [1]. In the 21st century, the aging population and ongoing urban regional emission reduction plans have made urban shrinkage a significant factor and challenge in urban planning and regional development [2,3]. The defining characteristic of a shrinking city is a decline in population [4]. Researchers worldwide have made various interpretations of urban population shrinkage. Oswalt suggested that a city with a population loss of more than one-tenth of the total population or more than 1% annual average population loss is considered to be shrinking [5]. Turok and Mykhnenko argue that a city is considered to be shrinking if its population growth rate is lower than the national average [6]. Wiechmann defines a shrinking city as an area experiencing population loss for more than two consecutive years [7]. In conclusion, population change is the most significant and commonly used indicator of urban population shrinkage [8], and it represents an important stage in the urban development cycle [9]. The aging population is a key factor contributing to population shrinkage, as younger labor forces are typically concentrated in developed cities, resulting in an aging population and subsequent shrinkage in less developed areas [10]. In addition to demographic factors, economic structural factors, social factors, and institutional factors are also equally important. This paper calculates the population change rate of each prefecture-level city between each population census and defines cities with a negative population change rate as shrinking cities of each period of study based on the results of the fourth, fifth, sixth, and seventh population censuses.
A shrinking population significantly impacts the economy and public services of cities [11]. Shrinking cities face challenges in developing new jobs and enhancing public services via innovation and industrial restructuring, leading to the migration of labor forces to prosperous markets and resulting in population loss. A decrease in the urban population leads to the loss of social capital and participation in social activities, directly contributing to a decrease in regional economic vitality and capital investment. The decline in regional economic vitality further prompts many enterprises to relocate from shrinking cities, exacerbating the reduction in economic and public service levels. Consequently, shrinking cities have a negative effect on the economy and public services, leading to a decline in both [12,13].
The rapid development of urbanization is one of the precursors of population contraction in cities. The urbanization rate in developed countries such as the United Kingdom, the United States, Germany, and France has exceeded 50% since 1990. However, at the beginning of the 20th century, some cities in these countries ended the process of rapid urbanization, and there were a series of problems, such as urban population decline, economic recession, and a sharp increase in unemployment. For example, Leipzig, Germany, lost more than 100,000 people, accounting for 20% of the total population from 1951 to 1998 [14]. There are many other cities in this situation, most of which are located in the area with better urbanization development, for example the city of Hakodate in Japan, Detroit and Pittsburgh in the United States, and Leksa in Finland, etc.
Since the implementation of reform and opening up, China’s urbanization process has been steadily gaining momentum. Urbanization has promoted some cities to effectively absorb resources and grow, but some cities are affected by the Matthew effect and lose their internal attraction under the influence of unbalanced regional development and the “siphon effect”, resulting in population loss [15]. According to data from China’s National Bureau of Statistics, between 1978 and 2019, the urban population surged from 172 million to 848 million, reflecting a significant increase in urbanization levels from 17.9% to 60.6% [16]. Cities situated in the eastern region and along the coastline have experienced rapid growth [17], characterized by distinct urban functional zoning and a heightened degree of urbanization [18]. Notable examples include Beijing, Shanghai, and Shenzhen. Concurrently, there are numerous cities with a slower pace of development [19], leading to a progressive widening of disparities with first-tier cities and thereby contributing to an imbalanced urban development landscape. Developed cities typically exhibit higher levels of economic advancement and efficiency in public service provision [20,21], whereas remote cities contend with notably reduced accessibility to public services. This unequal distribution of economic and public services development across cities influences disparities in economic income and residents’ quality of life in urban areas. Thus, population mobility is indirectly affected [22].
The problem of urban population contraction not only exists in developed countries and regions with good urbanization development but also appears in China with a rapid urbanization process, which has become an important turning point in China’s urbanization development [23]. A majority of the shrinking cities in China belong to the third-tier or fourth-tier category, characterized by poor industrial competitiveness. Deteriorating competitiveness within key industries inhibits the sustainable development of these cities [24]. Consequently, shrinking cities find themselves in potential competition with prosperous cities in their pursuit of rapid urbanization [22] as they strive to attract labor. The labor force represents the fundamental power and foundation for regional economic growth, as well as the primary recipients and demanders of public services and land. The creation of effective demand and the stimulation of foreign trade are important and vital forces that promote capital accumulation and employment expansion [25]. Therefore, to a certain extent, population distribution and mobility impact social and economic development in cities, as well as the extent of land transfers. On the other hand, social and economic development significantly influences population trends and mobility [26]. There are many factors driving urban population decline, but the most common are resource scarcity, economic slowdown, and the decline in the quality of life in the urban landscape [27]. At present, the level of economic development remains the most influential factor determining the overall decline in China’s urban population [12]. Not only the economic level but also the public services level has become an important prerequisite for population mobility with the improvement in residents’ standard of life quality. The deterioration of the cultural environment, quality of life, and social welfare highlights the signs of population shrinkage in various cities. A healthy living environment, equal public services, and the reduction in relative poverty have become basic drivers of migration [27]. Therefore, the comprehensive level and coordinated development degree of urban economy and public services are important symbols to identify whether a city is a city with a shrinking population.
The coupling coordination degree between the economy and public services represents the level of coordinated development of the urban economy and public services, which is an important factor influencing urban sustainable development. However, there is currently no research analyzing the correlation between the coordination degree of these two systems and other indicators. Therefore, this study aims to calculate the coupling coordination degree and investigate its correlation with the population change rate, which is often used as an index for determining shrinking cities. Based on this, we propose Hypothesis 1: There is a strong correlation between the population change rate and the coupling coordination degree of the economy and public services.
The state of a city is strongly correlated with land usage as well as population density and economic activity. Research has shown that educational and cultural facilities facilitate the transformation of land use, and sports and leisure facilities often attract increasing economic activity [28]. Since the beginning of the 21st century, the process of land marketization in China has accelerated, and the level of urban land marketization has consistently increased [29]. It is a significant strategy for Chinese local governments to promote urban development by obtaining windfall profits via the transfer of land use rights, using land transfer fees to support urban economic development, and facilitating the establishment of public service facilities [30]. The paid use of state-owned land (PUL) is a crucial aspect of the regional urbanization process in China’s unique economic context. Via land sales over the past few decades, the Chinese government has laid a strong foundation for the rapid growth of the overall economy and has played a significant role in various aspects of urban development [31].
There are various methods of land transfer in China, which can be categorized into two primary types: paid use and free use. Paid use is primarily employed for commercial, industrial, and service business activities, while free use is primarily used for constructing schools, hospitals, libraries, and other public service facilities that contribute to social welfare. In terms of urban public services, the rapid use of land can drive regional economic growth, industrialization, and improvements in transportation, among other aspects, making it crucial for sustainable urban development [32]. In terms of economy, the paid transfer of land can promote the diversification of land use and industrial agglomeration. The empirical results show that specialized agglomeration of producer services and diversified agglomeration promotes urban GDP [33].
The methods of paid land use mainly include public bidding, auctions, listing quotations, and agreement transfers. Lands transferred via these methods are primarily utilized for high-yield projects such as commercial and real estate ventures. Land transferred via agreements generally involves lower prices and a less competitive and open market [34]. However, research indicates that the marketization levels of the three transfer methods (public bidding, auction, and listing) are similar and relatively high [35]. Consequently, areas with higher land transfer rates are shown to possess higher levels of maturity and marketization in their land market [36]. Key cities, such as those in the southeastern coastal areas and provincial capitals, are the main focal points of the PUL rate. At the same time, the distribution of land marketization level is generally consistent with the regional economic development level and population distribution [37].
To investigate the relationships between land transfer with Chinese characteristics and between the level of coordinated economic and public services development in shrinking cities, this paper examines the correlation between the rate of PUL and the degree of coordination between the economy and public services. As a result, the paper proposes the second hypothesis: There is a certain correlation between the rate of PUL and the degree of coupling coordination between the economy and public services in shrinking cities.
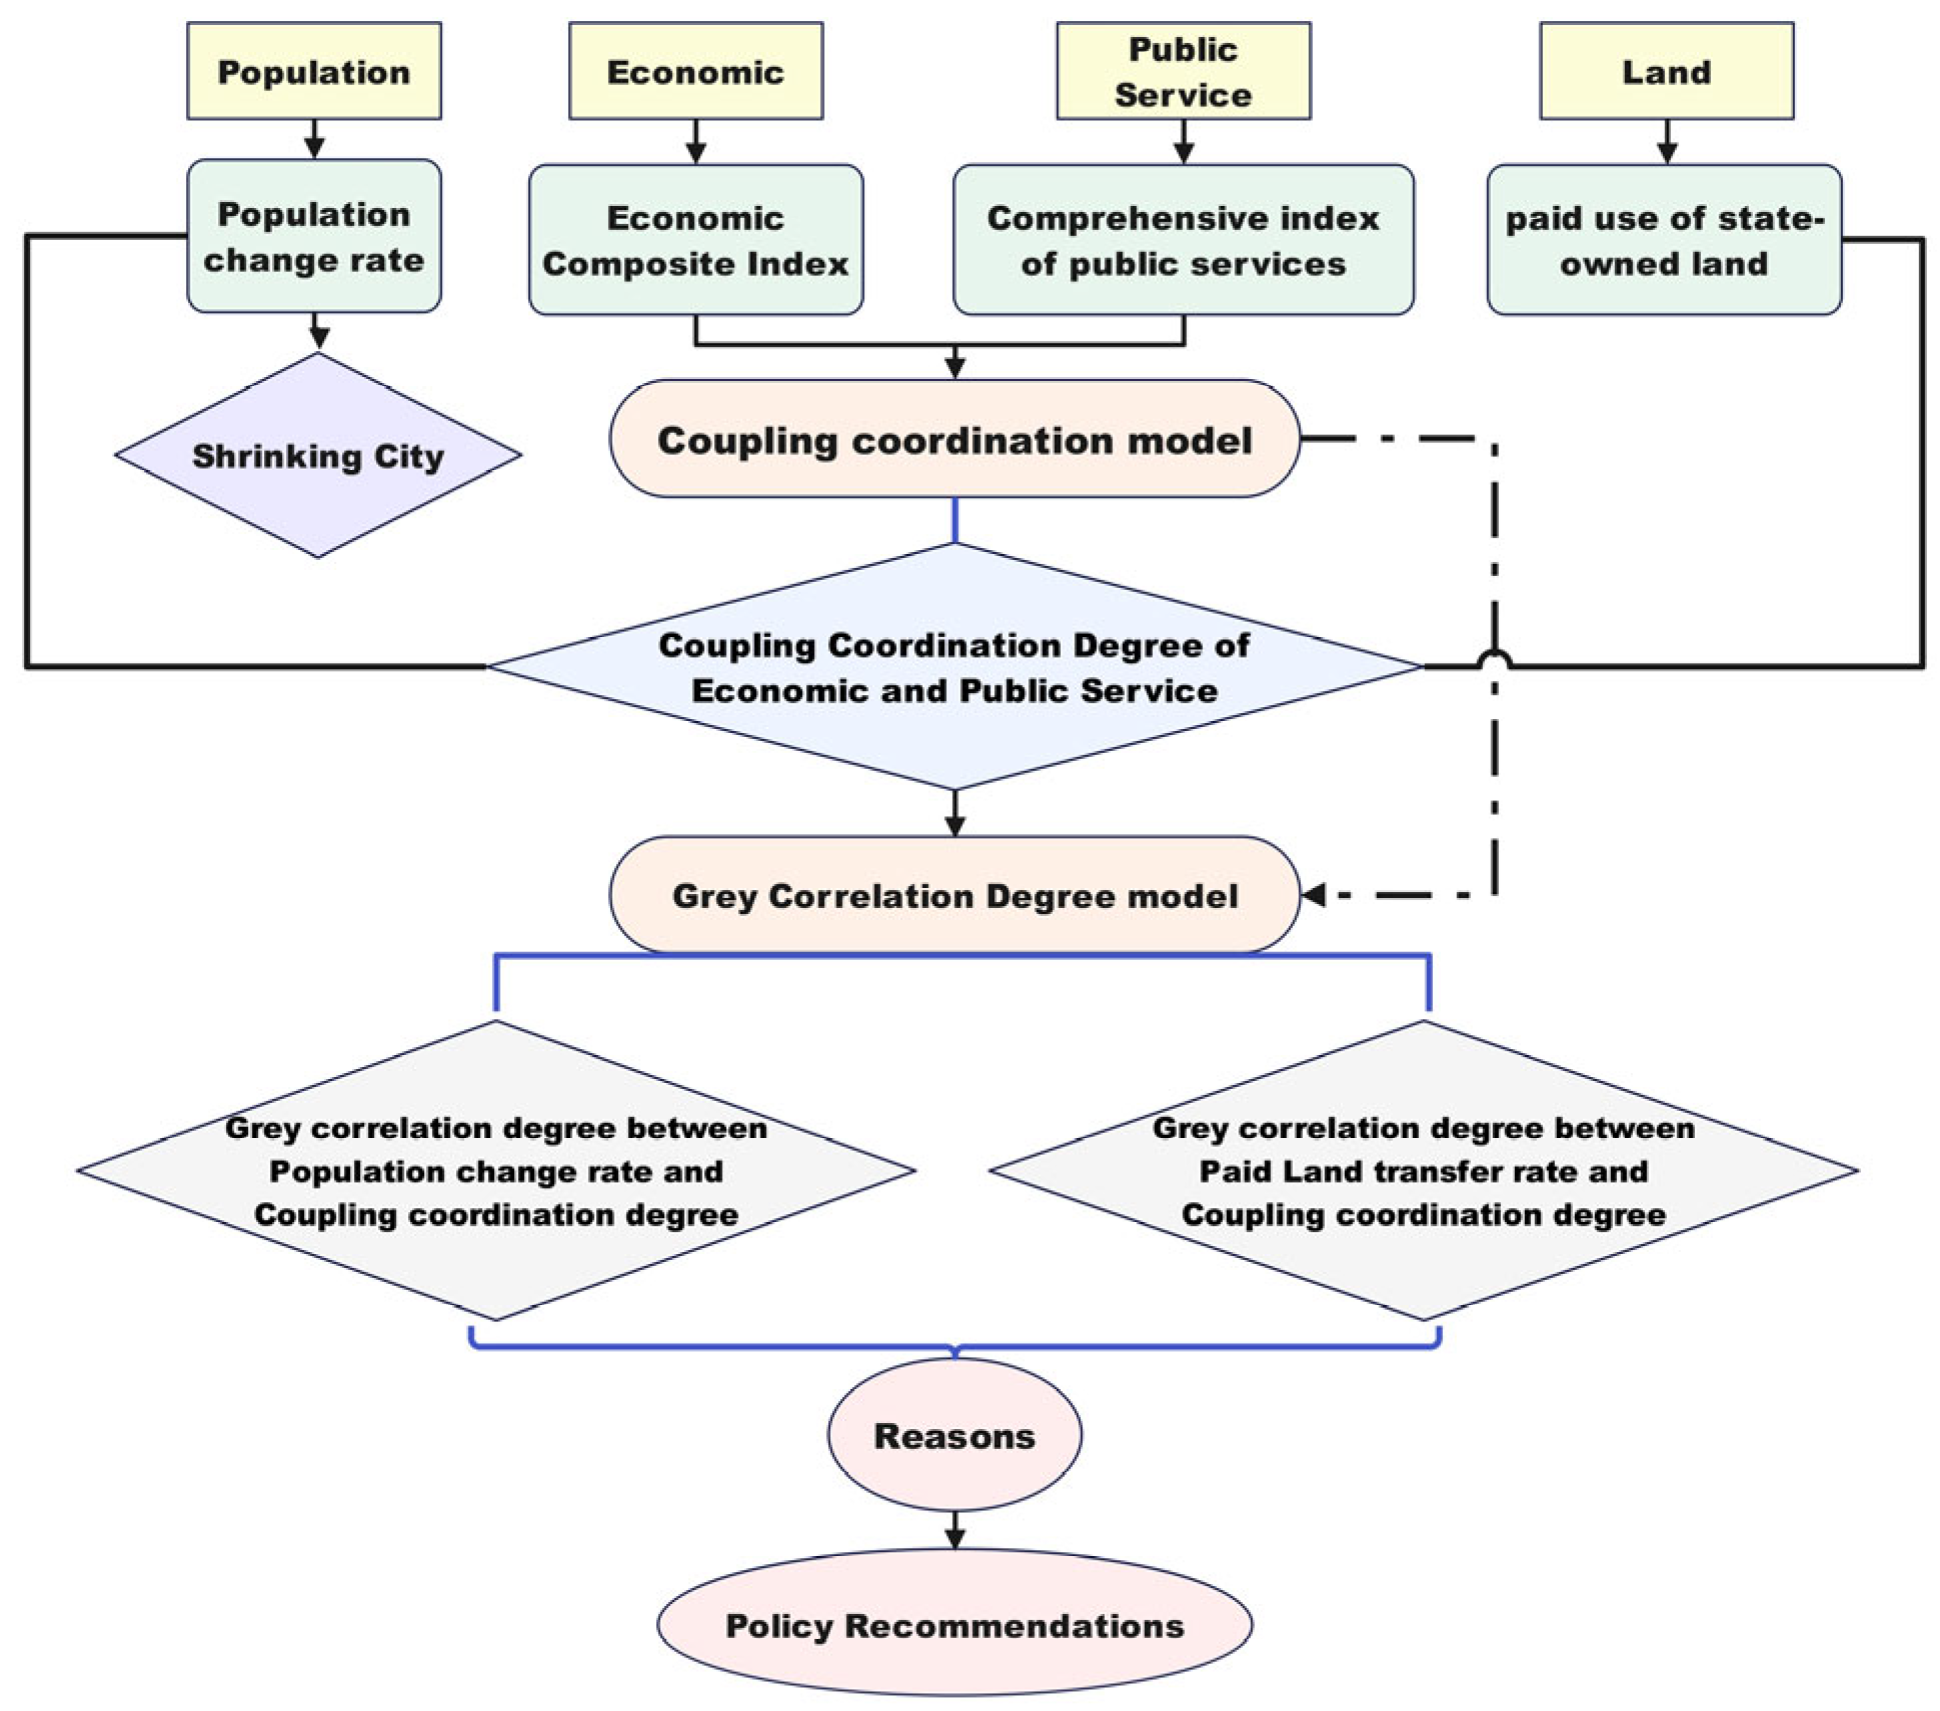
The two types of correlation intensities are analyzed (Figure 1), and the distribution of intensity between them is explored. The following are the primary scientific concerns this study addresses: (1) the strength of the correlation between the population change rate and the coordinated development of the urban economy and public services, (2) the strength of the correlation between the rate of paid land use transfer and the coordinated development of the urban economy and public services, and (3) the connection between the two.
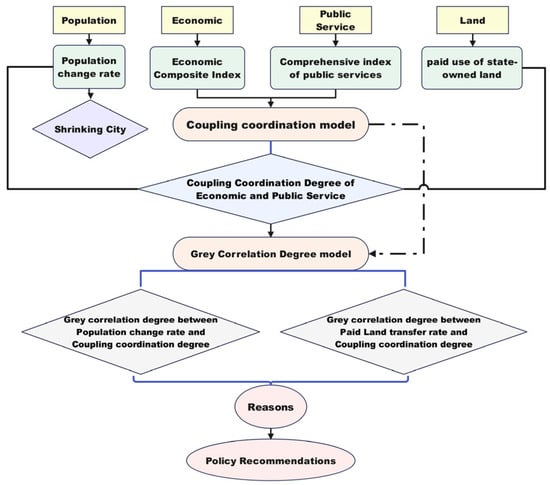
Figure 1.
Framework.
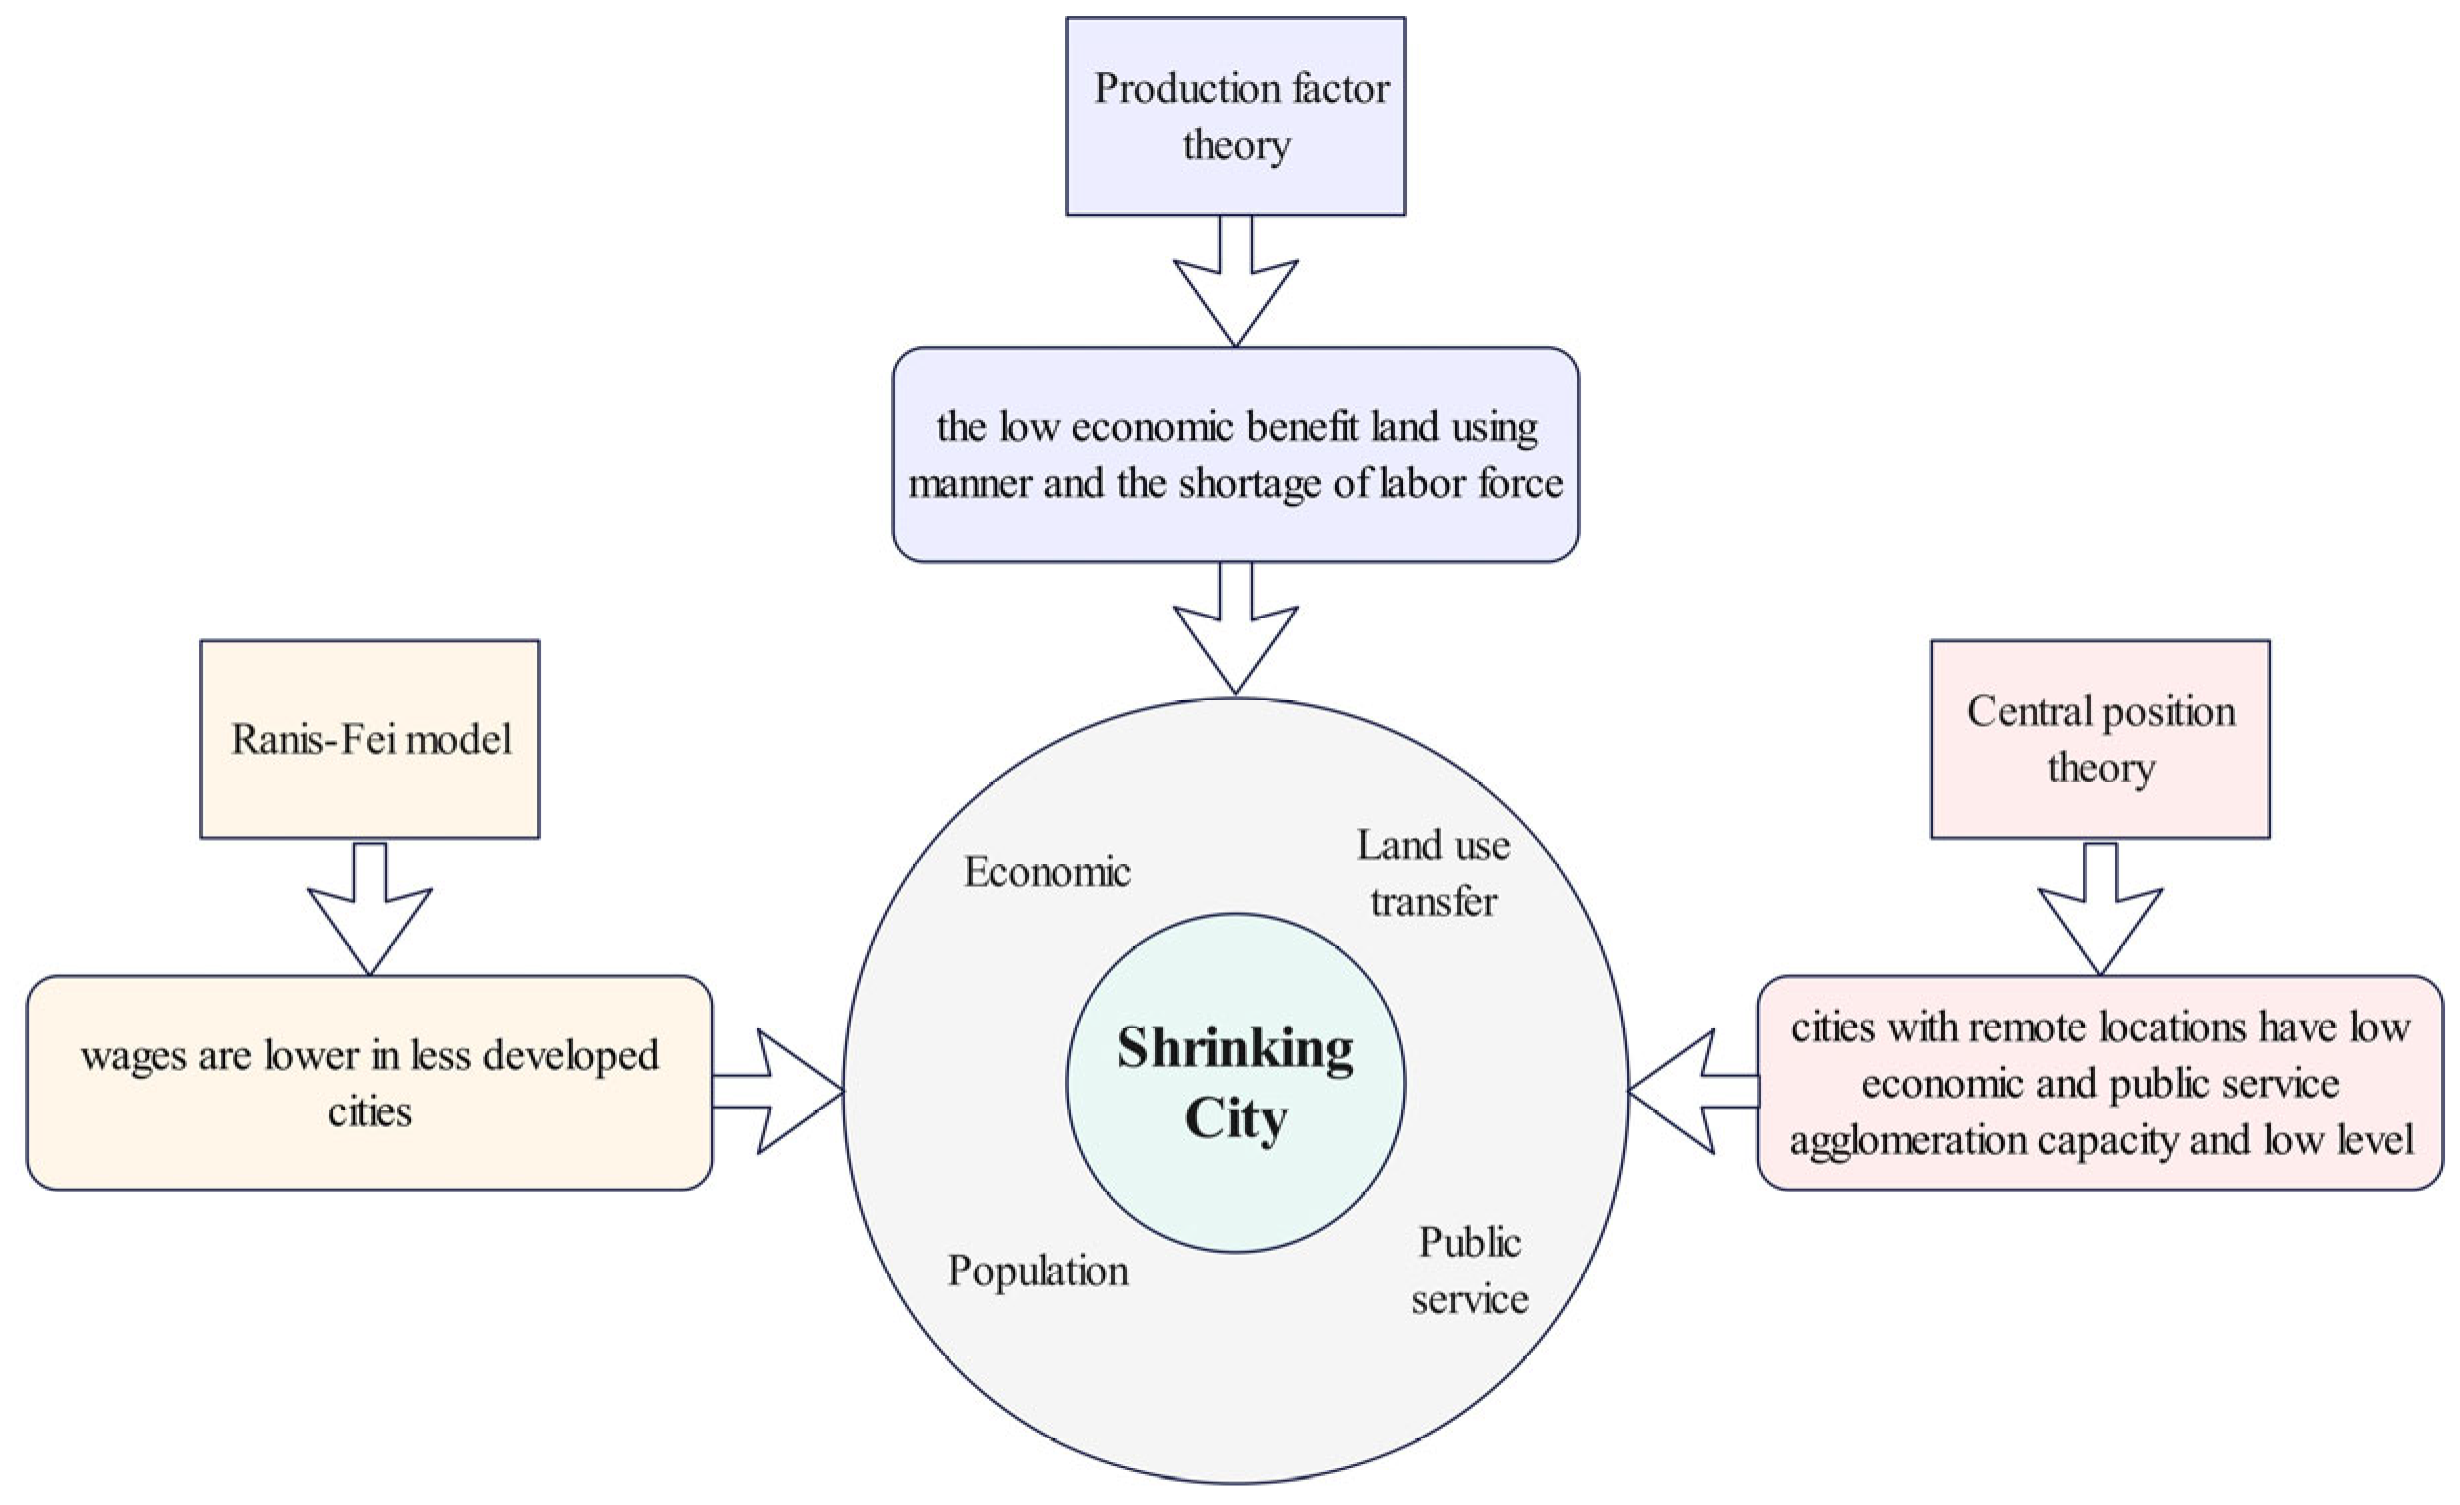
2. Theoretical Framework
The Ranis–Fei model, the centrality theory in geography, and the production factor theory in population economics are the primary applicable theories in this study. In the Wealth of Nations, published in 1776, Adam Smith clearly pointed out that the clearest sign of the prosperity of a nation is the growth of the number of inhabitants. For a city, the growth of population is an important factor for economic development. As a result, the population of economically developed cities tends to rise continuously while the population of economically backward cities shrinks.
“Land is the mother of wealth, while labor is the father of wealth and the active factor”, said the economist Pedy in his anthology of economic works. This Production factor theory shows that the land use manner and the number of laborers are important factors in promoting economic development. The way of land use affects the density and distribution of infrastructure and public services facilities and then affects economic activities and population mobility [28].
In 1961, John C. H. Fei and Gustav Ranis improved the Lewis model and proposed the Ranis–Fei model. They argue that the reason for the initial movement of the population from the agricultural sector to the industrial sector is the higher wages in the industrial sector. People move into the industrial sector in order to earn higher wages. A further rise in wages in the industrial sector is bound to further drive rural–urban migration. Therefore, the population of the cities with poor economic development levels will tend to flow to the cities with high economic development levels, which will cause the population contraction of the cities with low economic development levels.
These economically developed cities are also called central cities, which are often located in the center of the region or in important geographical locations along the coast. This important conclusion comes from the central position theory in geography. Many scholars have investigated the relationship between urban centrality and economic as well as public service levels based on this important theory. Cities located in the lower reaches of rivers tend to have higher urban centrality, a higher economic level, and a larger population, such as Shenzhen and Shanghai. Because central cities have better commercial agglomeration, factors that require long-term development, such as education, medical care, and consumption, are easier to distribute here, and thus central cities have a higher level of economic and public services. There is also a very significant correlation between urban population mobility and centrality. Population mobility mainly occurs in high-grade cities or between high and low cities, which reflects the high centrality and huge radiation effect of high-grade city distribution [38]. The high economic and public services level of high-grade cities will attract the population of surrounding low-grade cities, which will cause the population contraction of low-grade cities.
Based on the above theories, this paper will further explore the relationship between population contraction, economy, and public services level, as well as the spatial distribution relationship of each factor, by combining China’s unique land transfer mode and adding the important factor of economic benefits brought by paid land transfer (Figure 2).
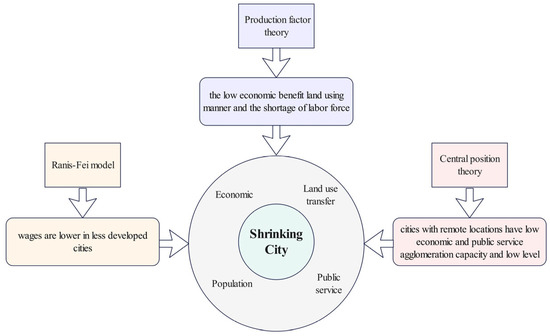
Figure 2.
Theoretical framework.
3. Research Methods and Data
3.1. Selection of Indicators
To ensure the rationality of the research, this paper includes only cities with complete data from 1990 to 2020 for analysis, for a total of 250 cities.
Since the establishment of the People’s Republic of China, seven population censuses have been conducted in China; these censuses included various demographic aspects, such as the national population, regional population, gender, age, education, urban and rural population, floating population, and the population of Hong Kong, Macao, Taiwan, and foreign nationals included in the census [39]. This study focuses on the permanent resident population statistics of the fourth (1990), fifth (2000), sixth (2010), and seventh (2020) periods in China, with the goal of calculating the population change rate of each prefecture-level city.
In Formula (1), represents the population change rate of city i 15, is the target period, represents the base period, denotes the number of permanent residents in city i in the target period, and denotes the number of permanent residents in city i in the base period. If = 0, it means that the population of the city has not changed in this stage; if > 0, it means that the population of the city has increased in this stage; if < 0, it means that the population of the city has decreased in this stage, and this city is defined as the city with population contraction in this stage.
The PUL rate effectively reflects the level of local land marketization, which in turn influences high-quality economic development [40]. It allows for an analysis of local economic prosperity and the development of public services. This study calculates the PUL area and the total state-owned land area for each prefecture-level city during the two periods of 2000–2010 and 2010–2020 and subsequently determines the PUL rate [41]. The calculation results are subsequently used to classify the PUL rates of 250 cities into four levels based on the equal proportion method.
The economy serves as a significant driving force for cities to achieve sustainable development [42]. Against the backdrop of population contraction, economic level often directly influences population movements, contributing to the uneven distribution of population across regions with varying economic levels. Regional economic growth can stimulate per capita income growth, thereby increasing the population size [43]. GDP per capita has implications for social equity and equality. The economic situation shown by the per capita data can show the overall and average economic situation of a region in a more objective and balanced manner. Therefore, the per capita GDP and average salary of employees are chosen as the two indicators for constructing the economic system in this study, aiming to objectively and comprehensively reflect the overall and average economic situation of each prefecture-level city in 1990, 2000, 2010, and 2020.
Public services is an essential component of a city for achieving high-quality and sustainable development [44]. The level of local public service is closely related to the economic level of a region and often plays a significant supporting role [45]. This study selected indicators such as local general public budget expenditure, number of hospital beds, number of public primary and secondary schools, number of buses and trolley buses under operation at year end, and number of library books in the years 1990, 2000, 2010, and 2020 to represent the level of regional public services (Table 1).

Table 1.
Description of indicator construction.
3.2. Research Methods
This study explores the relationship between population change and the PUL, as well as the coordination degree between the economy and public services in prefecture-level cities in China during the period from 1990 to 2020 under the backdrop of urban shrinkage. First, the study period was divided into one period every ten years, and the population change rate and PUL rate of each prefecture-level city were calculated.
3.2.1. Degree of Coupling Coordination
(1) System composite index calculation
To facilitate subsequent research and calculations, this paper adopts the entropy method to calculate the comprehensive indices of two major systems, the economy, and public services, before using the coupling coordination degree model [48]. To obtain objective weights and avoid subjective influence, the objective weight of the index (Table 2) was calculated using the entropy method [49,50]. The calculation steps are as follows:
Table 2.
Index weight.
Step 1: First, the indicators were standardized.
When the indicator was positive, its standardized formula was
When the indicator was negative, its standardized formula was
where represents the maximum value of the j TH indicator, and represents the data of the first indicator of the first sample in the original data. represents the first indicator of the i TH in the standardized data.
Step 2: After some index values are standardized, the values may be 0 or negative. To unify and facilitate the calculation, the standardized values were translated to eliminate the above situations.
where H is the amplitude of the index translation, which is generally taken as 0.01. represents the data of the first indicator of the first sample in the translated data.
Step 3: Use the specific gravity method to nondimensionalize the data.
where represents the data of the j th indicator of the j th sample in the dimensionless data.
Step 4: Calculate the entropy value of the j th index:
Step 5: The difference coefficient of the j th indicator (j = 1,2, …… p) is
Step 6: The weight of the j th indicator (j = 1,2, …… p) is
(2) Calculation of the coupling coordination degree
There is usually an interactive relationship between economic and social systems, and coordinated development directly affects the sustainable development of cities [51], which is an important factor affecting population mobility.
The coupling correlation degree (C) and the coupling coordination degree (D) of the two major subsystems can be estimated using Equations (9) and (10), respectively. The coupling correlation degree C reflects the degree of interaction between the economy and public services, but it does not assess the coordination level between the two. Therefore, the coupling coordination degree D is introduced to evaluate the level of coordinated development between the two.
In Equation (9), the coupling correlation degree (Table 3) represents the degree to which two subsystems influence each other via their respective coupling factors. The state is divided according to the value of [52].
Table 3.
Coupling correlation degree state.
In Equation (10), the coupling coordination degree (Table 4) D refers to the interactive coupling degree of two subsystems. T is the comprehensive evaluation index reflecting the overall synergistic effect of the two subsystems, and T = θ × U + γ × G, where θ + γ = 1 and θ and γ are the weights of the two subsystems. In this paper, the economy and public services are regarded as equal without difference, so the weight θ = weight γ = 0.5 [53]. The degree is divided according to the value of C [54].
Table 4.
Coupling coordination degree.
3.2.2. Gray Relational Degree
(1) Theoretical introduction
The gray correlation degree effectively reflects the strength of the correlation between factors and the system, and it is suitable for data with strong variability and no typical distribution law, such as population change rate and PUL rate [55,56].
This paper adopts the gray correlation degree based on the perspective of similarity [57] to calculate and analyze the gray correlation strength of the population change rate and the PUL rate on the coupling coordination degree of the economy and public services.
(2) Counting process
Step 1: Initialization of the raw data.
To eliminate the respective effective factors of each data point, the data are first normalized by means of the equalization process.
′(k) represents the i th indicator, the data of the k th sample, ′(k) represents the i th indicator, and the standardized data of the k th sample. represents the average value of the i th indicator data.
Step 2: Calculate the absolute difference between the comparison sequence and the reference sequence.
where (k) represents the absolute difference.
Step 3: The gray coefficient of the index system.
where ξ is a constant, ξ is equal to 0.5 in this paper, and (k), (k)) is the gray correlation coefficient.
Based on the calculation results, the association strength of 250 cities is categorized into four levels using the equal proportion method.
3.2.3. Spatial Autocorrelation
Moran’s I is the spatial autocorrelation coefficient, and this paper uses ArcGIS to conduct Global Moran’s I test to investigate the existence of spatial autocorrelation [58]. The value range of Moran’s I is [−1, 1]. When its value is greater than 0, it indicates a positive spatial correlation; that is, the clustering trend of “high-high, low-low” among adjacent elements is presented. When the value is less than 0, it indicates a negative spatial correlation; that is, the adjacent elements show a trend of “high-low, low-high” mutual distribution; when its value is close to 0, it indicates a spatially random distribution and does not show correlation.
The Local Moran’s I is a decomposition of the Global Moran’s I, which can be used to identify different types of spatial agglomeration or dispersion phenomena such as high-value agglomerations, low-value agglomerations, high–low outliers, and low–high outliers that exist in the study area.
3.3. Data Sources
Population data from the fourth, fifth, sixth, and seventh national population censuses; economic and public services data from the China City Statistical Yearbook; land transfer data from the China Land Market Network.
4. Results Analysis
4.1. Shrinking City Distribution
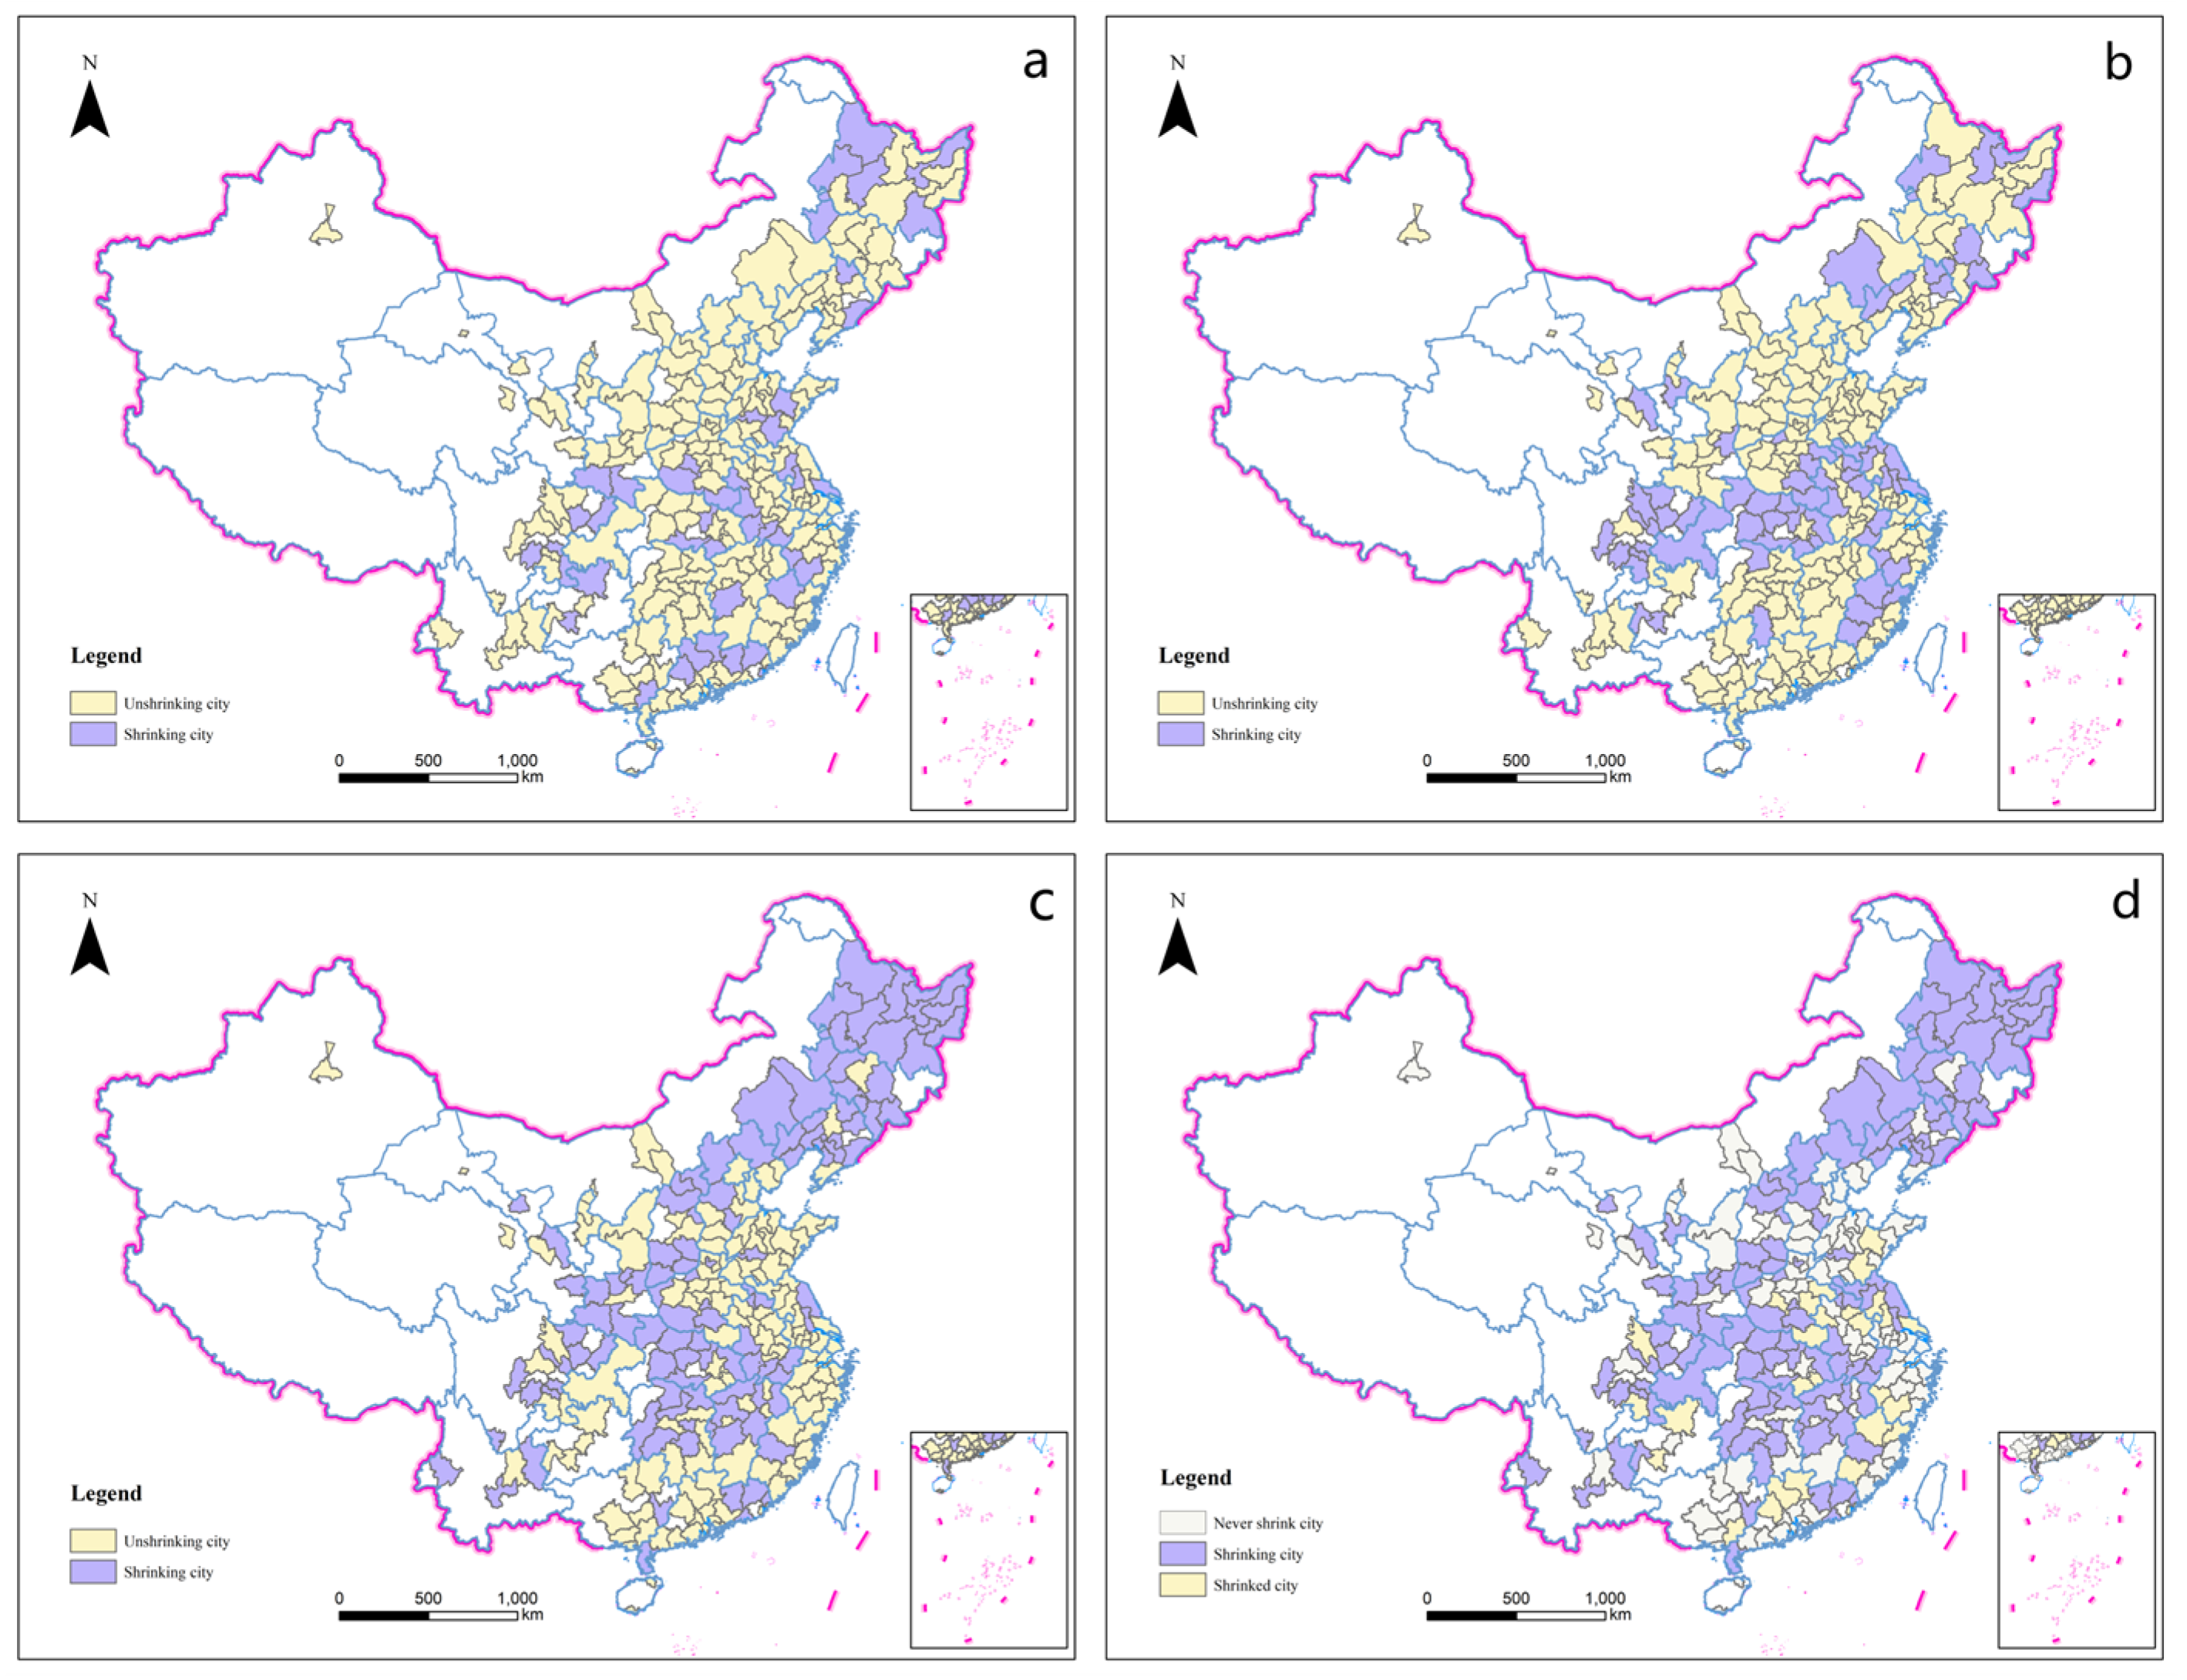
From 1990 to 2020, China’s population distribution became more uneven, leading to an increase in the number of shrinking cities. The concentration of shrinking cities is primarily observed in northeast China and in the middle and lower reaches of the Yangtze River, during which the city gradually spread to surrounding areas (Figure 3).
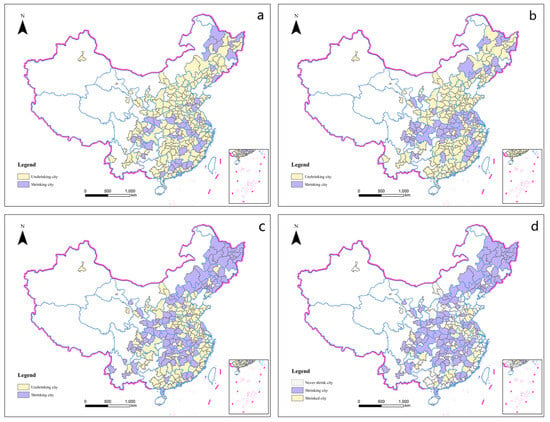
Figure 3.
Shrinking city profile from 1990 to 2020. ((a) 1990–2000. (b) 2000–2010. (c) 2010–2020. (d) the whole period from 1990 to 2020).
During the period from 1990 to 2000, only 45 cities experienced contraction, with the majority located in southern China (Figure 3a). Between 2000 and 2010, 67 cities exhibited shrinkage, and the shrinking cities were distributed in the east–west direction in the middle and lower reaches of the Yangtze River, forming a large-scale shrinking area (Figure 3b). During the period from 2010 to 2020, the number of shrinking cities increased rapidly to 111, with a significant increase in the northern region (Figure 3c). Shrinking cities in the southern region displayed a decreasing trend from coastal to inland areas while shrinking cities in the northern region were concentrated in the northeast and extended to the northwest. The shrinking cities in China transcend the boundary between the southern and northern regions, connecting with each other in the central region and revealing a scattered distribution pattern from the middle to the surrounding areas.
From 1990 to 2020, there was a noticeable trend toward shrinking cities (Figure 3d). Throughout the study period, only urban clusters in economically developed areas consistently avoided population loss, while some cities located near larger urban centers managed to experience population recovery in the later period.
Remark 1.
Made based on the standard map GS (2020) No. 4630 of the standard map services website of the Ministry of Natural Resources, the base map boundary is not modified.
4.2. PUL Rate
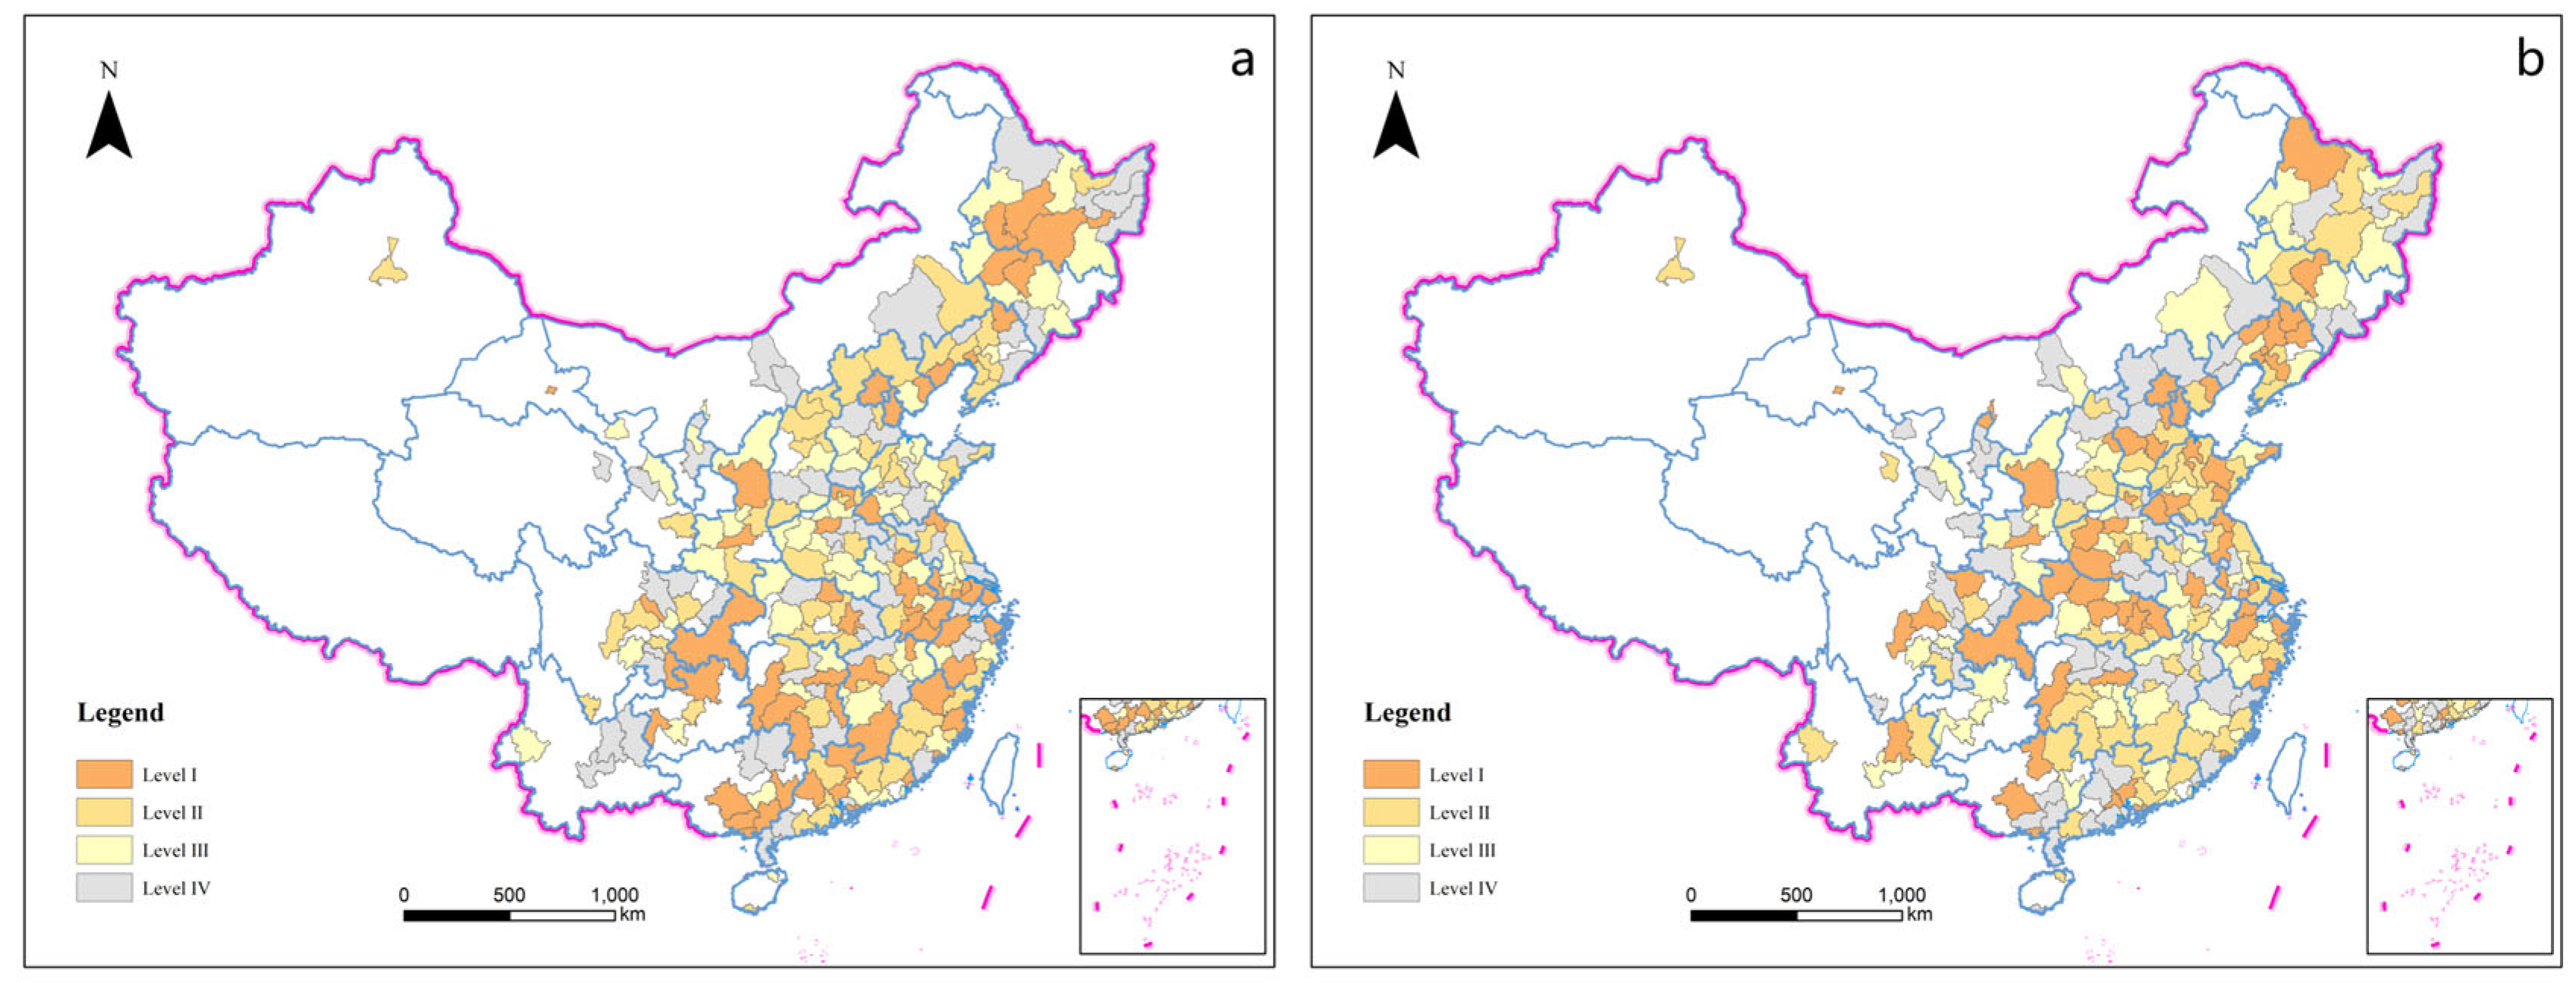
Within the PUL rates of prefecture-level cities during the periods of 2000–2010 and 2010–2020, these rates were categorized into four levels based on the equal proportion method (refer to Figure 4).
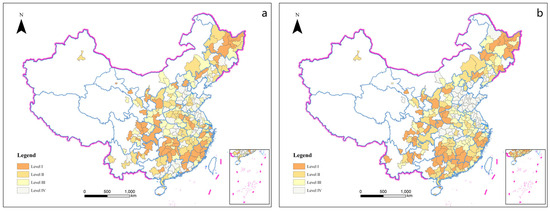
Figure 4.
PUL rate profile from 2000 to 2020. ((a) 2000–2010. (b) 2010–2020).
From 2000 to 2010, cities with higher transfer rates were scattered, with the highest value observed in the vicinity of Bohai Bay. The PUL rates gradually decreased from the eastern coastal areas to the western regions. While the PUL rates of shrinking cities in northeast China and the middle and lower parts of the Yangtze River were generally low, some of these cities exhibited high PUL rates. Among the 63 cities with the highest PUL rate, 12 of them are shrinking cities. Twenty-one shrinking cities are in the lowest level of PUL rate (Figure 4a).
During the 2010–2020 period, the highest PUL rate was observed in Shijiazhuang city, Hebei Province. In general, the southern region exhibited lower PUL rates than the northern region, although there were still cities near Bohai Bay with higher PUL rates. Compared with other cities, urban agglomerations near Beijing and Shanghai had significantly greater PUL rates, with these cities showing a concentrated distribution of high PUL rates. There was a decrease in the divestment rate of shrinking cities in Northeast China and in the middle and lower parts of the Yangtze River compared to that in the previous stage, resulting in fewer cities with higher divestment rates. Among the 63 cities with the highest PUL rate, 20 are shrinking cities. Thirty-six shrinking cities are found in the lowest level of PUL rate (Figure 4b).
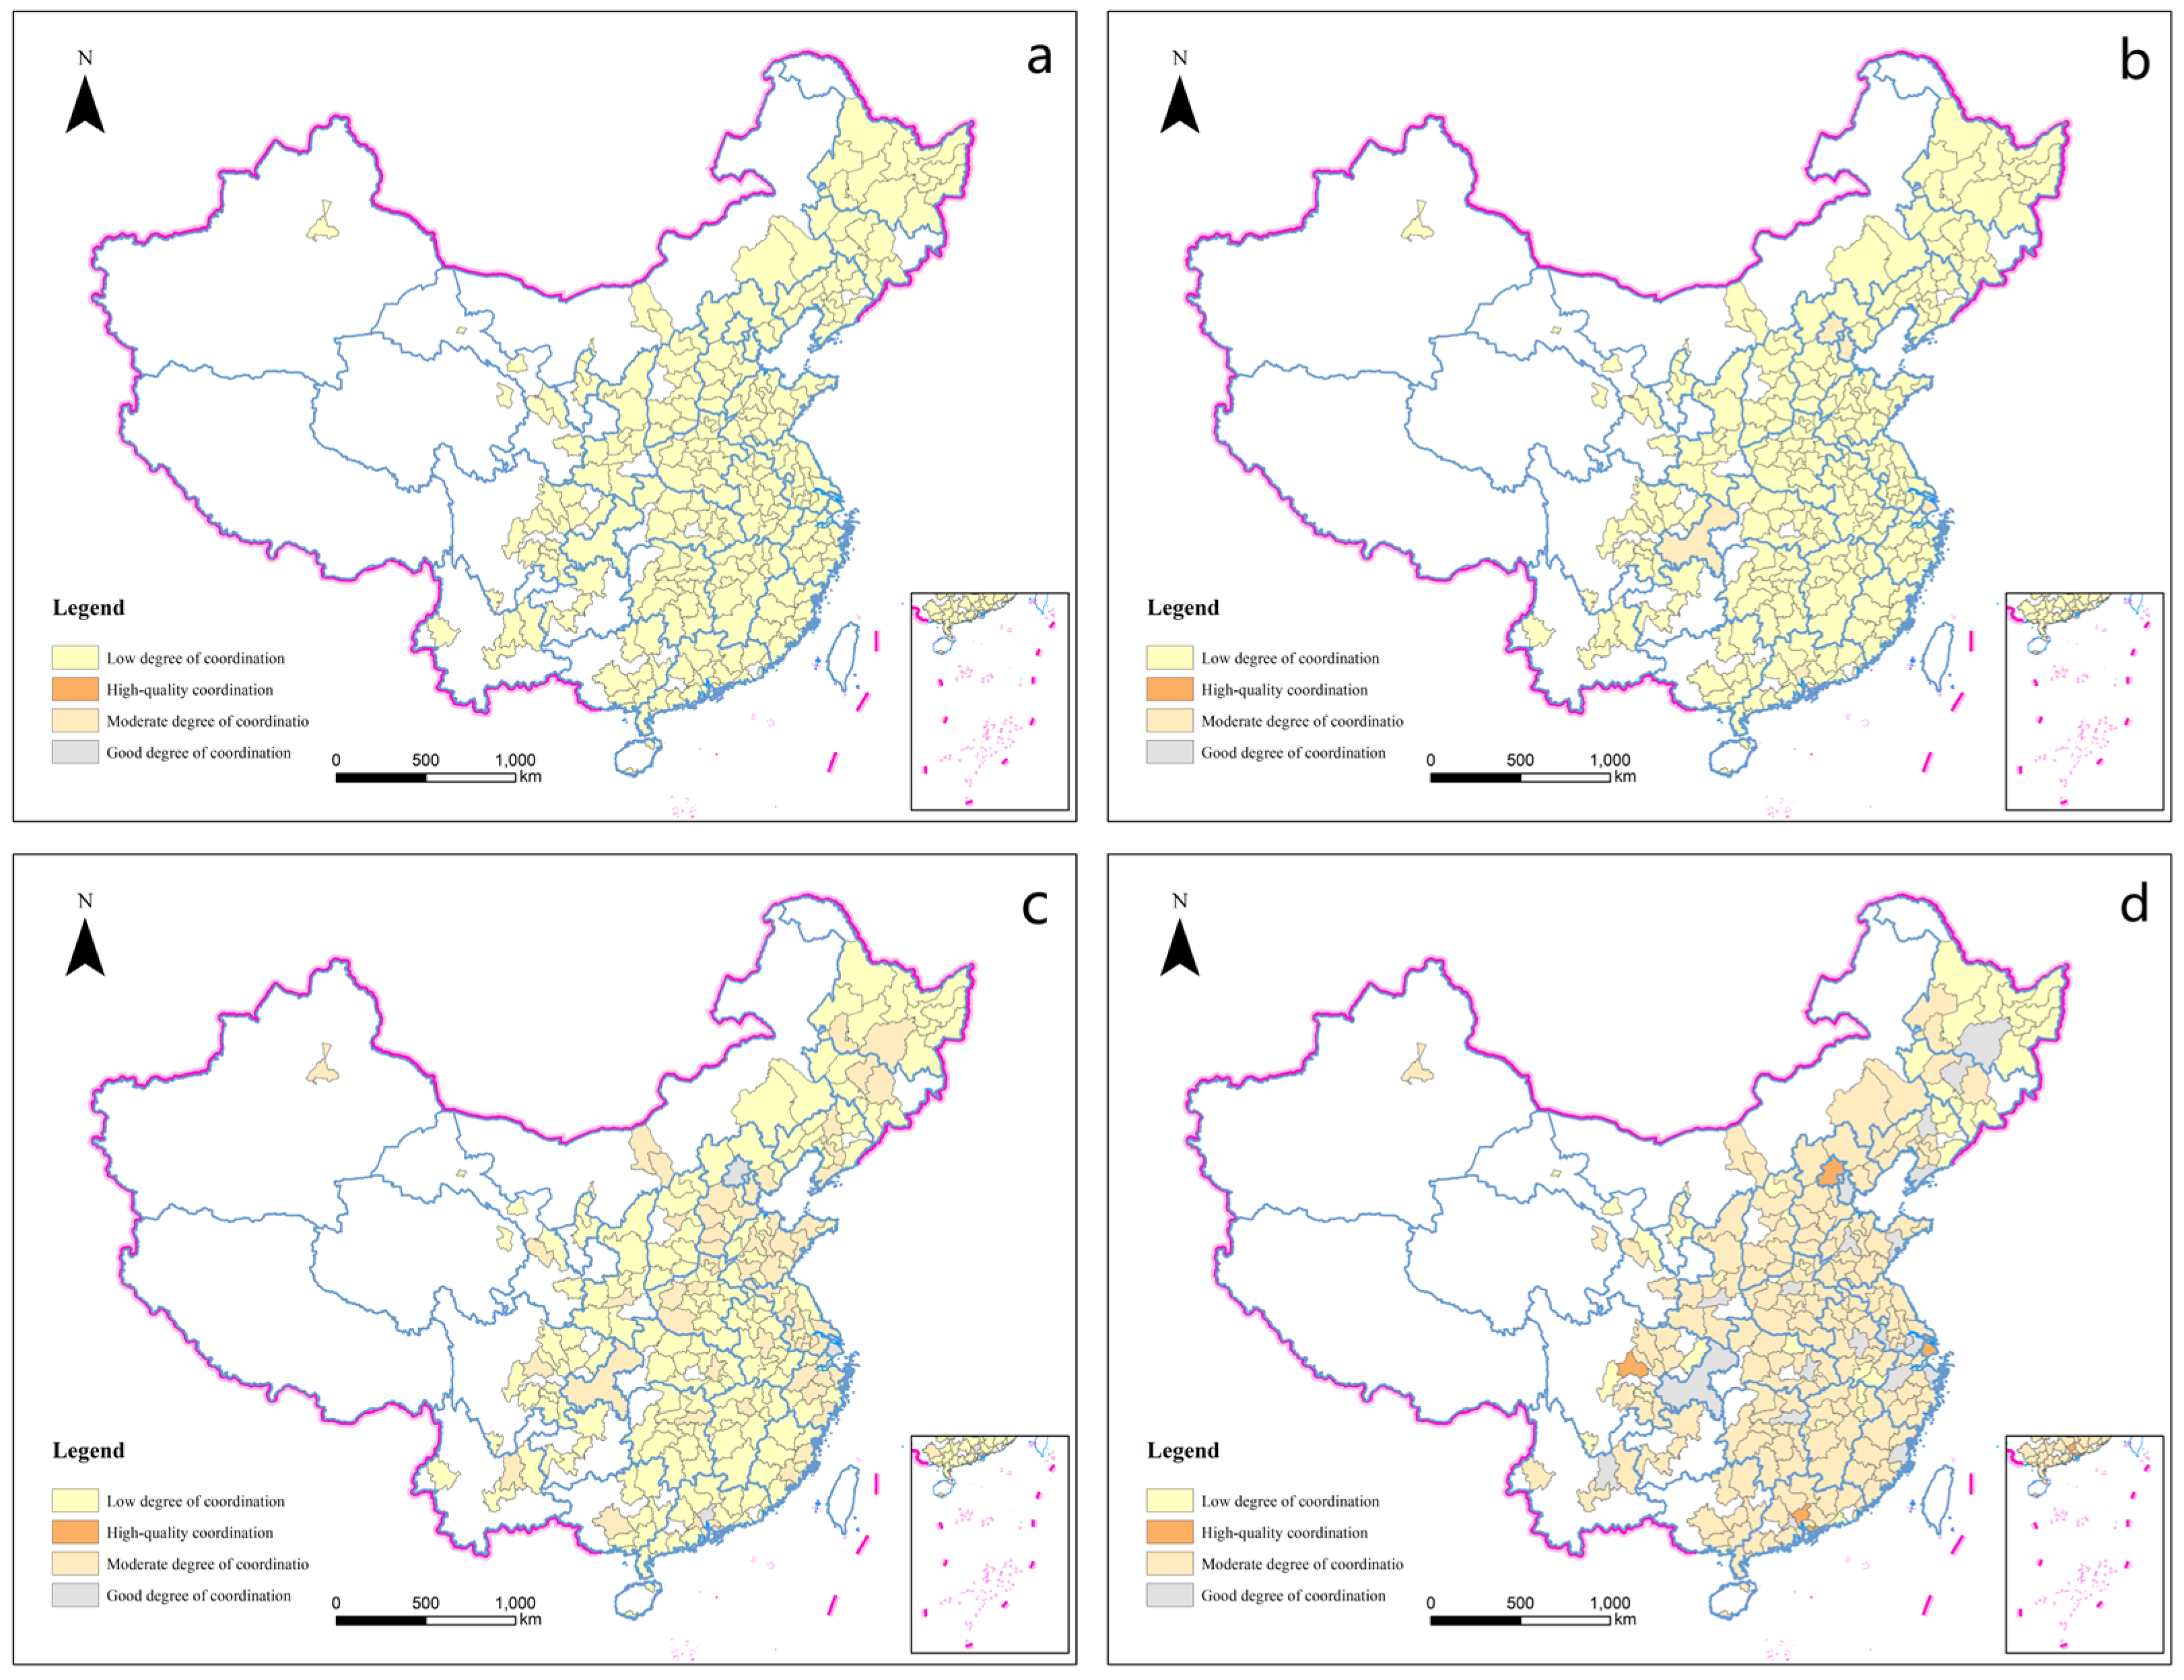
4.3. Coupling and Coordination Degree of the Economy and Public Services
Furthermore, the overall coordination degree of the range of study improved from 2000 to 2020. The eastern region demonstrated the highest coordination degree. Conversely, the western region had a lower overall coordination degree, with the majority of shrinking cities also displaying low coupling coordination degrees (refer to Figure 5).
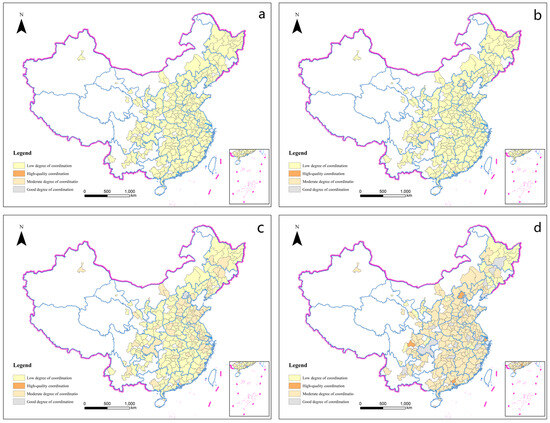
Figure 5.
Coupling coordination degree profile from 1990 to 2020. ((a) 1990. (b) 2000. (c) 2010. (d) 2020).
In 1990, all cities had a low degree of coordination (Figure 5a). According to the computation of economic and public services data of prefecture-level cities in China in 2000, it was evident that the degree of coupling and coordination between the economy and public services in these cities was generally low. There are six cities with moderate degree of coordination, all of which are developed cities in the east or along the coast, and only one is a shrinking city (Figure 5b). This indicates that during that period, China’s economy and society were generally characterized by low levels of coordinated development and insignificant regional disparities. Cities with declining populations also demonstrated a low degree of coordination between the economy and public services.
In 2010, there were merely four cities, with Beijing, Shanghai, Shenzhen, and Guangzhou reaching a good degree of coordination, and they are all unshrinking cities. But cities with a high degree of coordination were still not observed. It is evident that 60 cities in China have achieved a moderate coordination degree, and only 5 cities are shrinking cities in this period (Figure 5c). This highlights the significantly higher economic and public service levels in major prosperous cities than in other cities, while most shrinking cities at this stage still exhibited a low degree of coordination. The differences in coordination degrees among prefecture-level cities gradually became more apparent.
By 2020, 5 cities, Beijing, Shanghai, Shenzhen, Chengdu, and Guangzhou, reached a high degree of coordination, and they are all unshrinking cities. Among the 21 cities with good degree of coordination, only 1 city is a shrinking city at this stage. The number of cities with a moderate degree of coordination reaches 183, of which 77 are shrinking cities. Only 44 cities with a low degree of coordination in this period. All of them with a low degree of coordination in each period of this study. And 31 of them are shrinking cities (Figure 5d).
From 1990 to 2020, amidst the backdrop of overall improvement in national coordination degrees, Beijing, Shanghai, and other first-tier cities consistently maintained the highest level of coordination degree in each stage. Conversely, most shrinking cities consistently demonstrated the lowest coordination degree.
4.4. Gray Correlation Strength
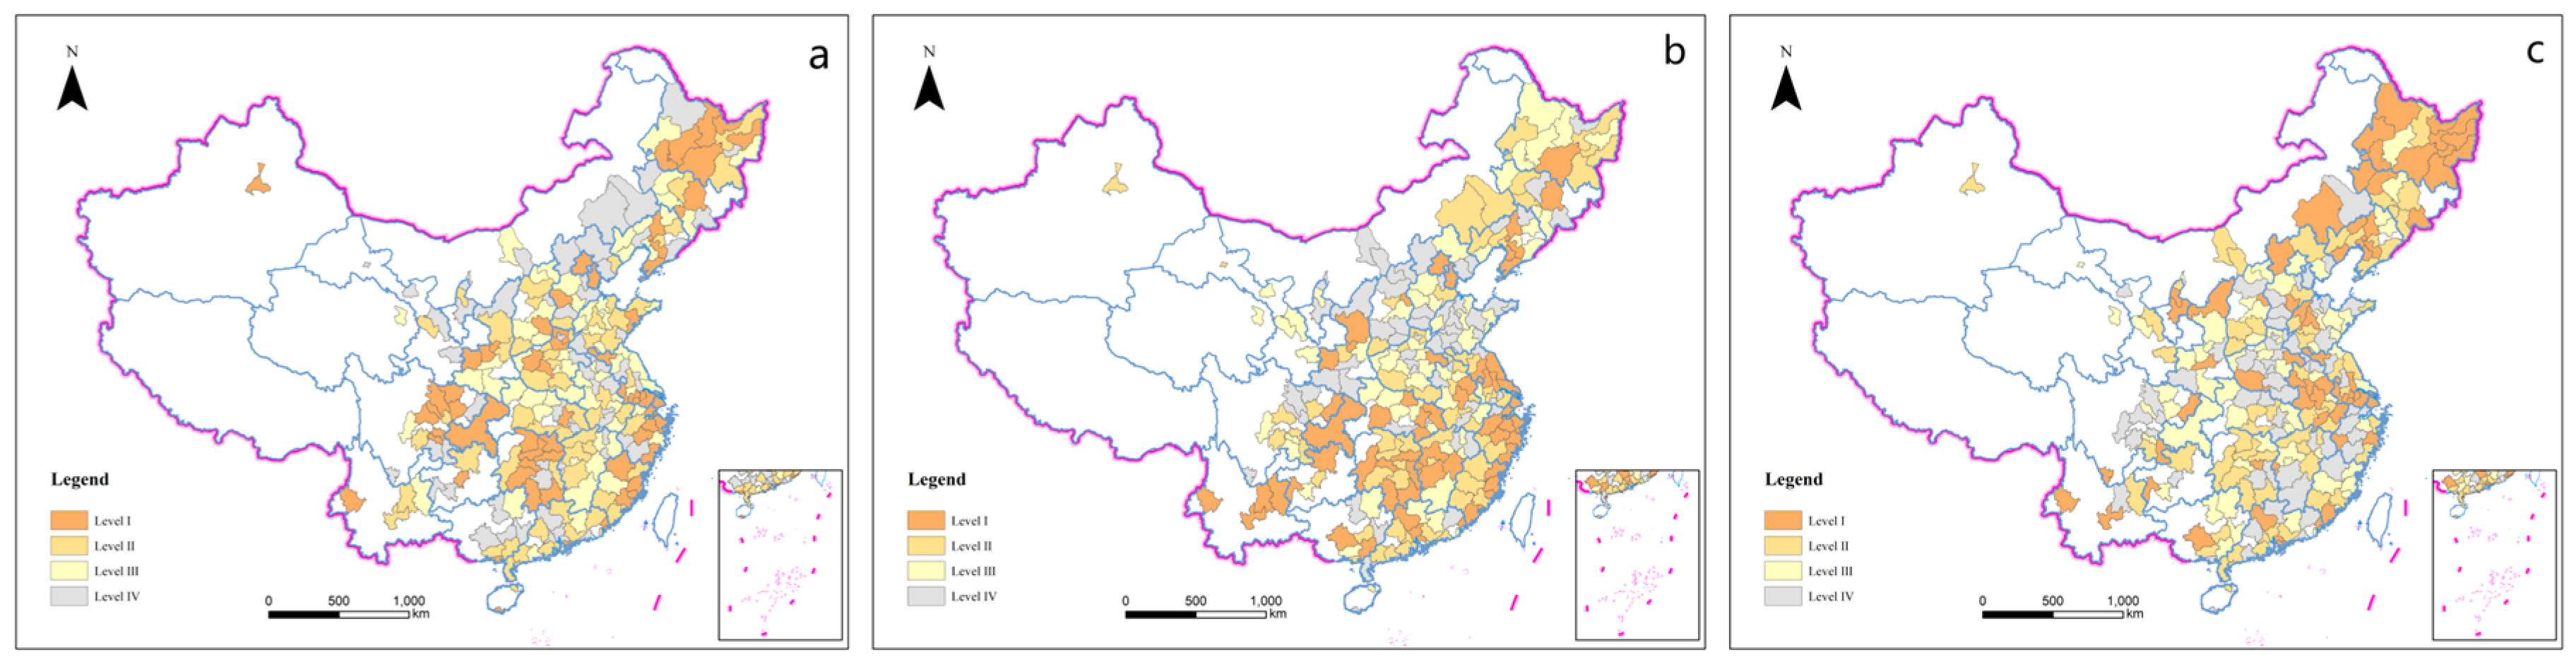
4.4.1. Gray Correlation between the Population Change Rate and Degree of Coupling Coordination between Economy and Public Services
The correlation strength in the northern region continuously decreases, while that in the southern region experiences a constant increase. In the study period from 1990 to 2000 and 2000–2010, only 11 of the 63 cities with the highest correlation strength were shrinking cities (Figure 6a,b). In the 2010–2020 study period, 21 shrinking cities were among the 63 most correlated (Figure 6c).
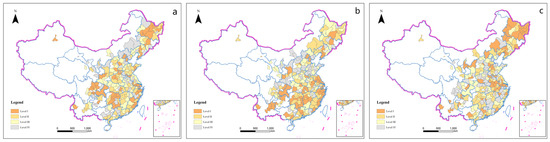
Figure 6.
Gray correlation level profile from 2000 to 2020. ((a) 2000. (b) 2010. (c) 2020).
The study’s findings revealed that the correlation strength between the population change rate and the coupling coordination degree of economy–public services in shrinking cities increased from 2000 to 2010 but declined from 2010 to 2020 (Figure 6). In the strongest correlation grade, the number of shrinking cities increases, which indicates that the restrictive effect of population contraction on the coordinated development of the economy and public services is gradually reduced. Indicating that the influence and determining the role of the population change rate on the coupling coordination degree between the economy and public services in each prefecture-level city is gradually diminishing.
4.4.2. Gray Correlation between the PUL Rate and the Coupling Coordination Degree of Economy–Public Services
In contrast to the gray correlation results of the population change rate and the coupling coordination degree of economy–public services mentioned earlier, the gray correlation between the national PUL rate and the coupling coordination degree of economy–public services exhibited an overall upward trend from 2010 to 2020 (Figure 7).
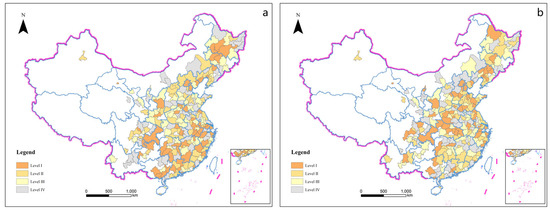
Figure 7.
Gray correlation level profile from 2010 to 2020. ((a) 2010. (b) 2020).
In 2010, a scattered pattern of high correlation degrees was observed throughout the country, with no concentrated areas. A small portion of the low correlation degrees were concentrated in the northeast region, with additional low correlation degrees found in cities in the southern region. A medium degree of correlation was distributed around cities with high degrees of correlation, which were primarily concentrated in the central region. The number of cities in the northern region with medium correlation degrees exceeded that in the southern region. In this stage, 18 of the 63 cities with the strongest association strength are shrinking cities (Figure 7a).
By 2020, cities with high correlation degrees were predominantly distributed in the northeast and southern regions. The correlation degrees of the southwest region and first-tier cities such as Beijing and Shanghai were lower than those of most other cities. The correlation strength of shrinking cities in the middle and lower reaches of the Yangtze River gradually decreased from the eastern coastal areas to the western areas. In this stage, 32 of the 63 cities with the strongest association strength are shrinking cities (Figure 7b). Overall, the correlation degree of the entire country increased during this period, but shrinking cities remained the urban agglomeration with the strongest correlation degree.
It is evident that with the ongoing decline in the shrinking urban population, the benefits derived from PUL, as a crucial regional economic source, played a significant role in the coordinated development of the local economy and public services, with the correlation deepening over time.
4.5. Spatial Autocorrelation
4.5.1. Global Moran’s I
As time goes by, the global spatial autocorrelation of population change rate is gradually significant. From the random distribution in 1990–2000 to the agglomeration distribution in 2000–2010 and 2010–2020, the global mean’s I is gradually increasing, the Z value is also growing larger and larger, and the agglomeration phenomenon is becoming more and more significant, showing a strong positive correlation in space.
Compared with the Global Moran’s I of population change rate, the Global Moran’s I and Z of PUL rate in the two periods have a smaller increase, but the initial value is higher. Since the p-value is always less than 0.001, with the increase in the Global Moran’s I and Z, the spatial agglomeration phenomenon is further strengthened and reflects a strong positive correlation (Table 5).
Table 5.
Global Moran’s I.
4.5.2. Anselin Local Moran’s I
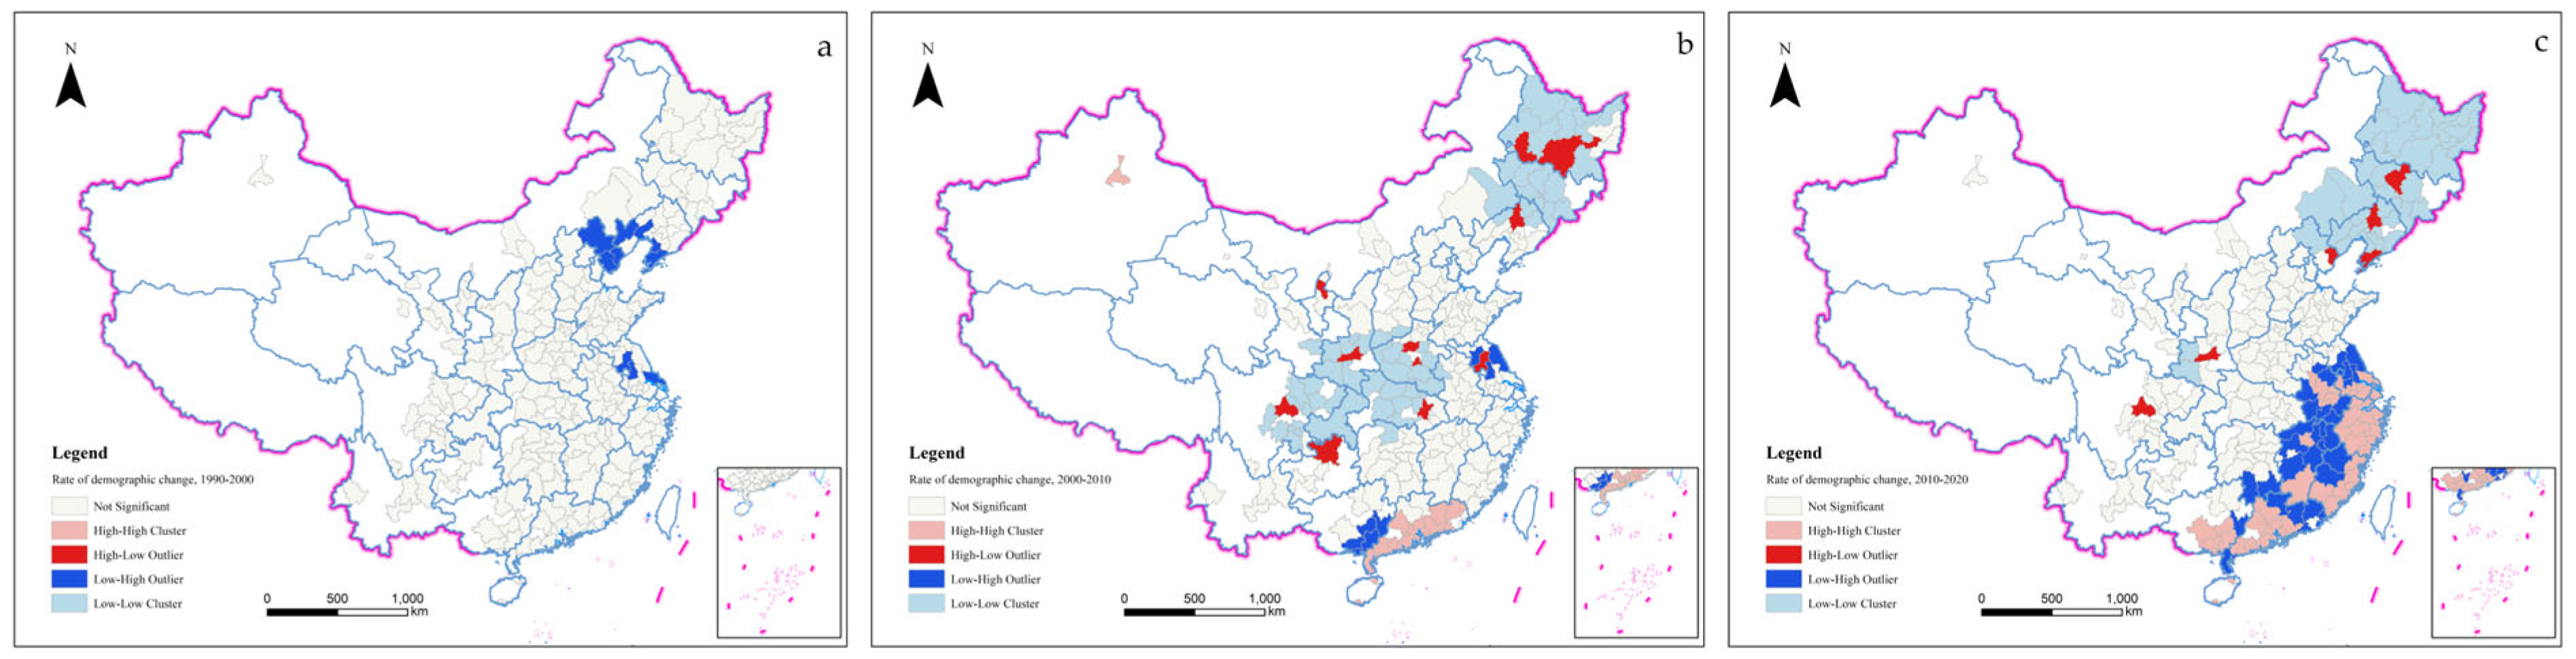
Across the board of the spatial agglomeration or dispersion phenomena in the three research periods of 1990–2000 (Figure 8a), 2000–2010 (Figure 8b), and 2010–2020 (Figure 8c), the types of spatial agglomeration or dispersion phenomena are gradually diversified and show obvious agglomeration phenomenon. Low–low clusters are concentrated in northeast China and the middle reaches of the Yangtze River, which is the concentrated distribution area of shrinking cities. High–low outliers are scattered in northeast China and the middle reaches of the Yangtze River. The high–low outlier is distributed in the southern coastal region, and most of the cities in this region are unshrinking cities. The low–high outlier is adjacent to the high–high cluster and is only distributed in the southern region, and most of the cities in this region are shrinking cities.
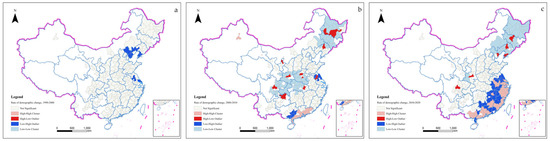
Figure 8.
Local spatial autocorrelation distribution of population change rate from 1990 to 2020. ((a) 1990–2000. (b) 2000–2010. (c) 2010–2020).
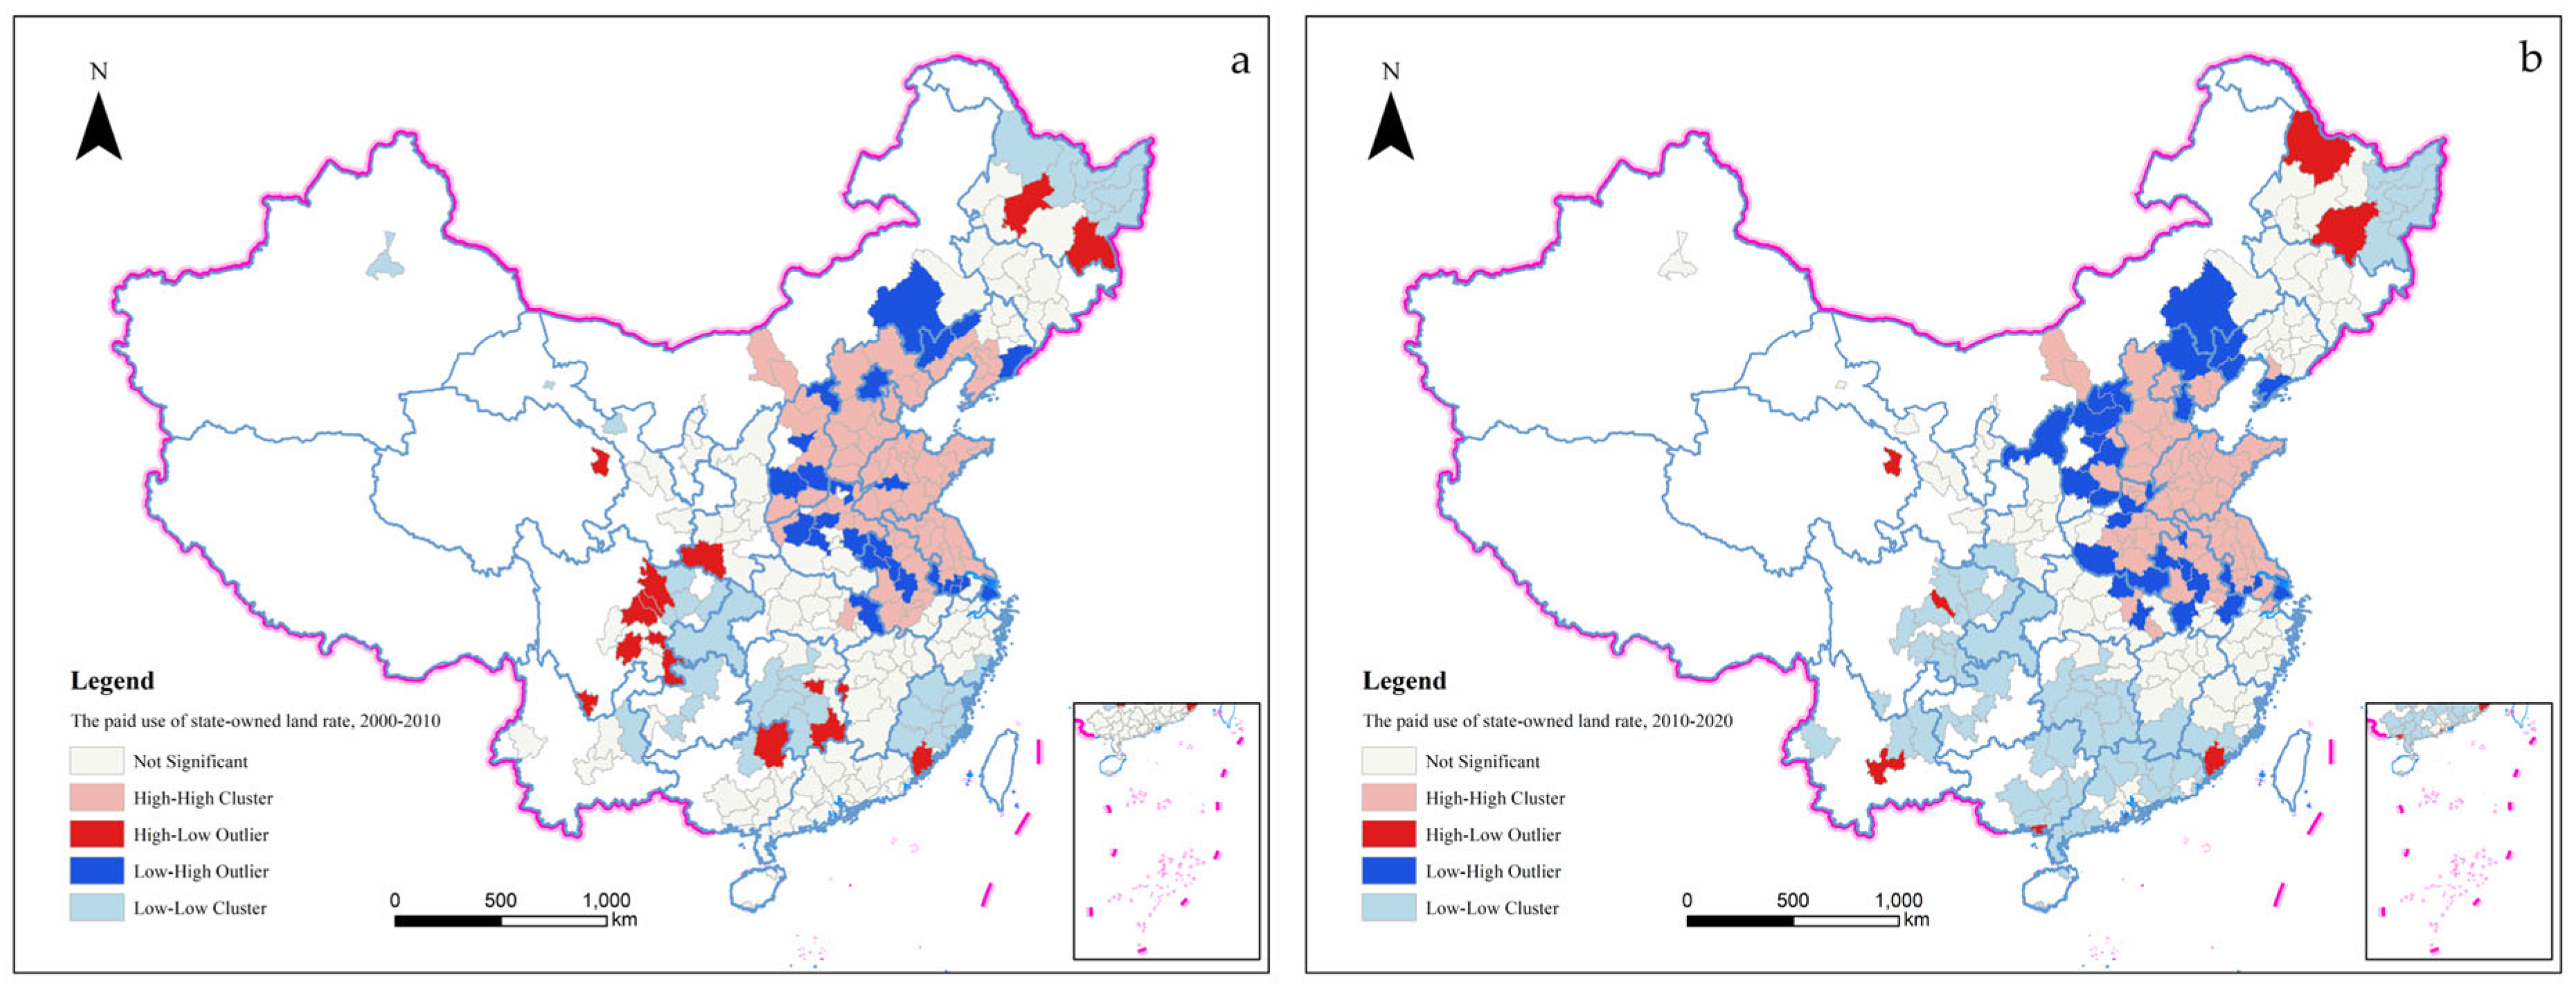
The distribution of spatial local spatial autocorrelation of PUL rates in 2000–2010 (Figure 9a) and 2010–2020 (Figure 9b) has little variation. The low–low cluster is distributed in northeast China, and the middle and lower reaches of the Yangtze River, and its range expands slowly over time. The high–low outliers were scattered in northeast China, and the middle and lower reaches of the Yangtze River, and the number decreased significantly with time. high–high clusters are distributed in the eastern region, and their number and range do not change significantly. The low–high outlier areas are distributed close to the high–high areas, and their number and range have increased significantly from 2010 to 2020.
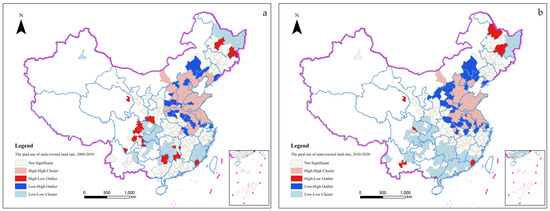
Figure 9.
Local spatial autocorrelation distribution of PUL rate from 2000 to 2020. ((a) 2000–2010. (b) 2010–2020).
4.5.3. Hot Spot Analysis
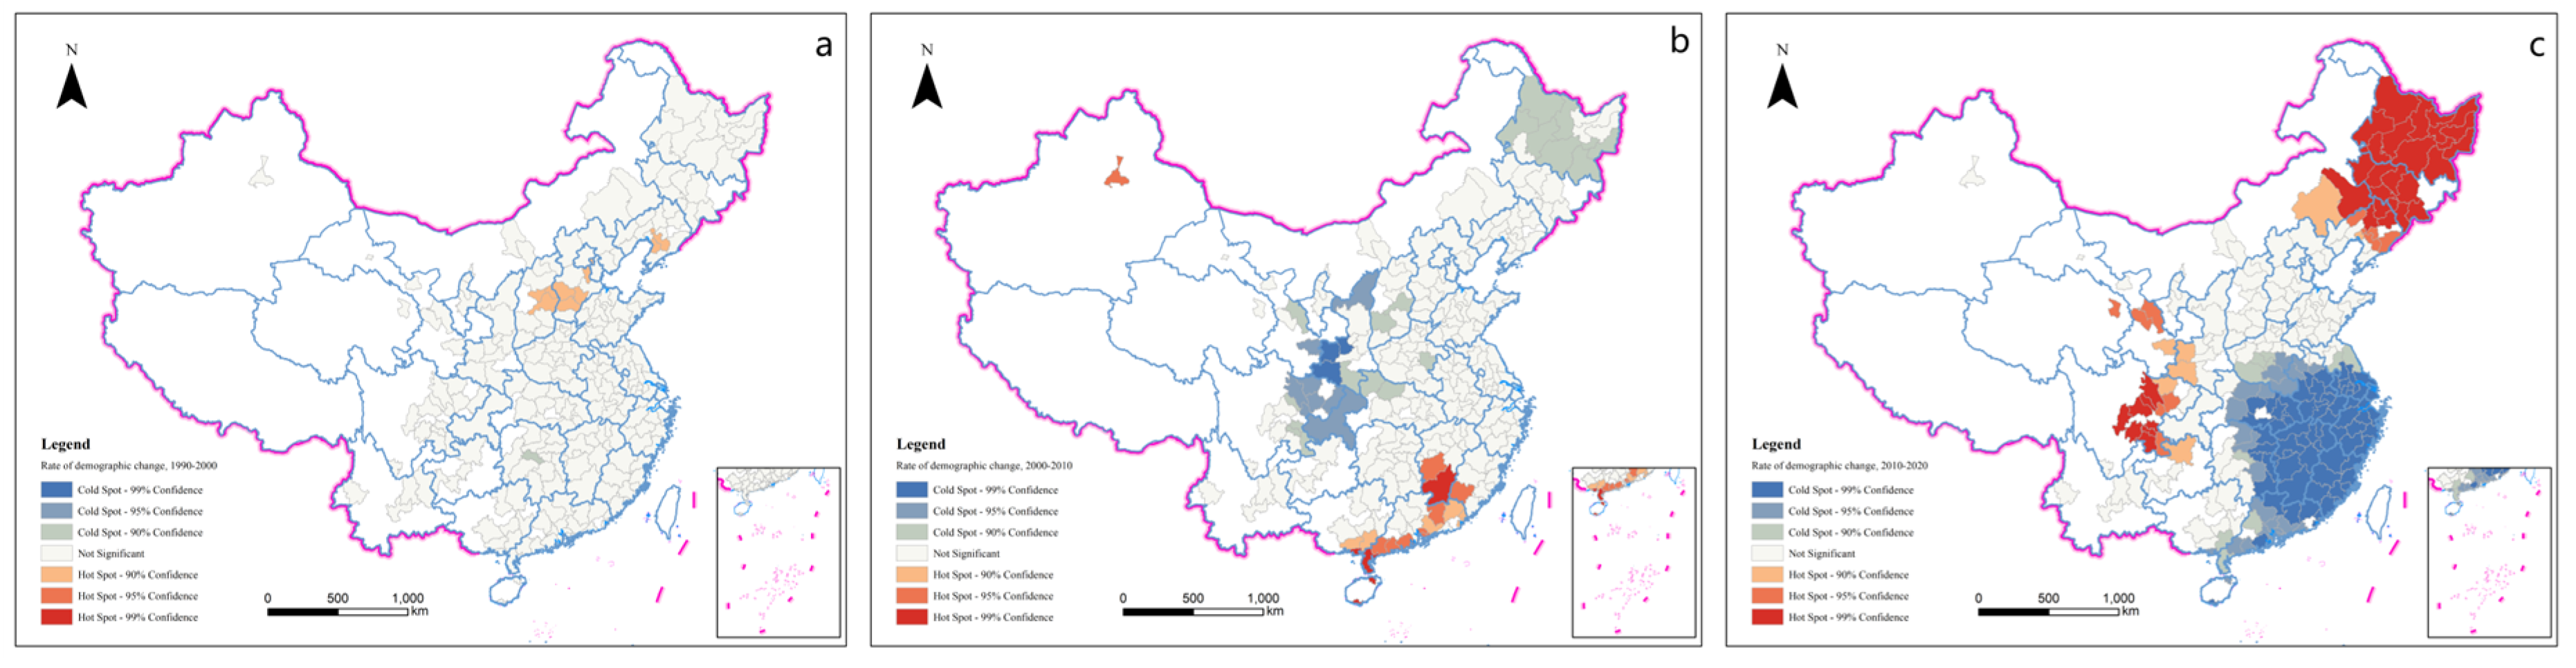
As time goes by, it can be found that the agglomeration phenomenon of population change rate is gradually significant, and the change is most obvious in the period from 2010 to 2020 (Figure 10). The high value is distributed in the northeast area, and a small part is distributed in the middle reaches of the Yangtze River, and its distribution range gradually moves northward. The low-value concentration is distributed in the southeast, and its distribution range moves from the middle reaches of the Yangtze River to the southeast. During the study period from 2010 to 2020 (Figure 10c), the high value and the low value of the population change rate showed a significant agglomeration phenomenon, respectively.
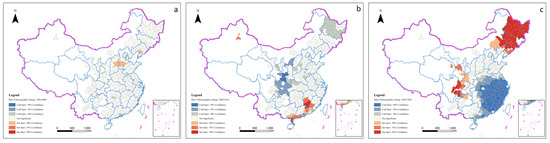
Figure 10.
Hot spot analysis of population change rate from 1990 to 2020. ((a) 1990–2000. (b) 2000–2010. (c) 2010–2020).
The high-value concentration of the PUL rate is very significant and has little change, and it is distributed in the eastern region, and the distribution range is large. The low-value agglomeration phenomenon changes significantly. During the period from 2010 to 2020 (Figure 11b), the low-value agglomeration phenomenon is concentrated in the southwest region, but the low-value agglomeration phenomenon is less significant than the high-value agglomeration phenomenon (Figure 11).
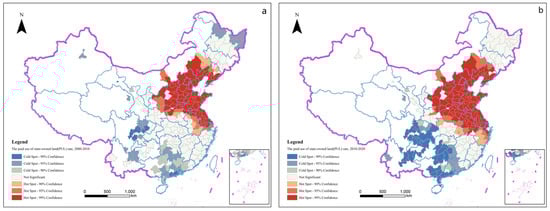
Figure 11.
Hot spot analysis of PUL rate from 2000 to 2020. ((a) 2000–2010. (b) 2010–2020).
5. Discussion
5.1. The Influence Mechanism of Population and Land Use Policy on Urban Economy–Public Services
According to the above analysis of the distribution of shrinking cities, it can be seen that shrinking cities, as well as economically developed coastal cities, predominantly exist outside of first-tier cities such as Beijing and Shanghai. This is attributable to the varying rates of development among cities at different administrative levels in China following the reform and opening up. Megacities are experiencing rapid urban expansion and economic growth, resulting in rapid progress in high-quality urban development. Conversely, small cities undergo slower urban expansion and economic development processes, leading to slower progress in high-quality urban development [59]. Moreover, compared to rural and remote cities, large cities offer better accessibility and higher levels of public services, resulting in more job opportunities and better wages and benefits [60]. Consequently, the labor force continues to increase in developed cities but declines in rural areas [61].
Both economic openness and human capital have a positive impact on economic growth, with a significant overall effect [62]. A decrease in population growth is the main factor affecting economic development [63], and an increase in the labor force is vital for regional economic growth and the provision of public services. A growing population not only brings labor resources but also generates market and consumption potential, attracting secondary and tertiary industries to engage in commercial operation projects by acquiring land use rights in the local area.
From the above analysis, it can be seen that in 1990–2000 and 2000–2010, the intensity of gray correlation between the population change rate and the coupling correlation degree of economy–public services in most shrinking cities is high, while the intensity decreases in 2010–2020. This is due to the promoting effect of population contraction on public services is limited and effective only in the initial stage in shrinking cities [64]. As urban shrinkage persists, the PUL rate in these cities stimulates the economic cycle of the market and creates new investment opportunities in larger cities. It also guides the development of supporting public service facilities. In shrinking cities, where the PUL rate is low, market activity decreases accordingly, making it difficult to generate new jobs. A decrease in the population leads to a reduction in economic output and a decreased demand for public services.
Land output can rapidly enhance a city’s economic level. Cities in the east or along the coast have diverse economies and thriving industries, making the agglomeration phenomenon more significant when the PUL values are high. However, comparing the two periods of 2000–2010 and 2010–2020, it can be found that the strength of association in shrinking cities increases, rather than that in shrinking cities decreases. Due to the small population and limited mobility of shrinking cities, their economic development and construction of public services heavily rely on the income generated from land. The two are closely interrelated. For the coordinated development of the economy and public services, the PUL rate can quickly and significantly drive changes in economic growth. As time goes by, the correlation between the PUL rate and economic–public services coupling coordination degree decreases significantly in shrinking cities. The opposite is true for unshrinking cities. However, the correlation between the population of shrinking cities and the coupling coordination degree of economy–public services is more complex. The correlation of shrinking cities in northeastern regions continues to weaken, while that of shrinking cities in southern regions shows a trend of strengthening. The population of unshrinking cities is increasingly correlated with the degree of economic-public services coupling coordination. This is because the PUL rate of land in these cities has already been high, and it has not been able to exert a strong stimulating effect on the urban economy. Changes in population dynamics bring about changes in the economy and demand for public services in these cities, thereby forming new stimulating factors and further strengthening the correlation.
5.2. Policy Suggestions
Based on the aforementioned research findings and discussions, this paper presents the following suggestions for shrinking cities to enhance the coordinated development of their economy and public services.
Initially, in cities exhibiting a strong correlation between the coupling coordination degree of economy–public services and the PUL rate, it is crucial to develop a diversified economy, expand avenues for economic growth, reduce dependence on land use for economic benefit, and enhance the sustainability and resilience of the urban economy.
Additionally, for cities displaying a high correlation between the coupling coordination degree of economy–public services and the population change rate, it is recommended that relevant welfare policies be formulated to attract talent and labor, stimulate population inflow, and increase the number of permanent residents. Additionally, the development of the artificial intelligence industry should be prioritized to prevent the economic and public services development slowdown resulting from population decline, thereby promoting sustainable urban growth. Ultimately, certain first-tier cities can opt to decentralize noncore enterprises or emerging industries and relocate them to shrinking cities. This approach aims to strengthen economic exchanges and circulation between large cities and shrinking cities, as well as facilitate the redistribution of the concentrated labor force.
5.3. Limitations
Considering the limitations of this study, several aspects warrant improvement in future research.
First of all, the study’s data collection focused primarily on cities located east of the Hu Line, resulting in a lack of comprehensive and in-depth analysis of western cities, minority areas, and island cities. The research scope was confined to prefecture-level cities with readily available data nationwide, which may provide more precise conclusions than provincial-level studies. In addition, in this study, the analysis included the PUL rate as one of the key indicators, calculated based on the actual urban land area. Future research could enhance the analysis by incorporating land transfer fees as an additional factor, allowing for a more comprehensive examination of shrinking cities in relation to land finance dynamics. Moreover, the study employed the gray correlation model to assess correlation strength, which is suitable for the available research data. However, this approach may not adequately capture the temporal and spatial characteristics and distribution patterns of each shrinking city. For subsequent research, exploring the use of geographical detectors or other methods could facilitate a more in-depth analysis of these aspects. Furthermore, this study only considers the fluctuation of the population of each city and does not consider the population structure, education level, occupation distribution, and other factors. But the factors that affect the development of urban economies and public services are complex, such as the size of the young population. Therefore, the impact of changes in population structure, health status, trends, and other factors on the development of the economy and public services should be fully considered in the follow-up research.
6. Conclusions
This study computed the population change rate for 250 prefecture-level cities between 2000 and 2020 based on data from the fourth, fifth, sixth, and seventh national population censuses. The analysis identified 111 shrinking cities and calculated the PUL rates for the periods 2000–2010 and 2010–2020, presenting a national overview. The gray correlation model was used to determine the correlation intensity between the population change rate and the PUL rate and between the coupling coordination degree of the economy and public services in each prefecture-level city, revealing the relationship with shrinking cities.
First, the rate of population change in shrinking cities is lower than that in unshrinking cities, and land market activity is also lower in shrinking cities than in unshrinking cities. Second, the rate of population change is closely linked to the coordination degree between the economy and public services. However, the strength of this correlation steadily decreases. In the past decade, most shrinking cities had weaker associations than unshrinking cities. Population growth significantly influences the coordinated development of the urban economy and public services, driving urbanization. Lastly, the rate of population change is closely connected to the coordination degree between the economy and public services. Shrinkage in cities depends more on the revenue generated from selling paid land use rights to foster coordinated development of the economy and public services.
The findings of this study can serve as valuable policy references for planning populations and economic mobility between cities.
Author Contributions
Conceptualization, Z.F.; methodology, X.S. (Xinyu Shan) and Z.F.; Software, X.S. (Xinyu Shan) and Z.L.; validation, X.S. (Xinyu Shan) and Z.L.; formal analysis, X.S. (Xinyu Shan); investigation, X.S. (Xinyu Shan) and Z.L.; resources, Z.F.; data curation, X.S. (Xinyu Shan); writing—original draft preparation, X.S. (Xinyu Shan); writing—review and editing, Z.F., X.S. (Xinyu Shan) and X.W.; visualization, Z.F.; supervision, X.W., Z.F. and K.W.; project administration, Z.F. and X.S. (Xinyi Shao); funding acquisition, X.S. (Xinyi Shao) All authors have read and agreed to the published version of the manuscript.
Funding
National Natural Science Foundation of China project: 42371279; China University of Geosciences (Beijing) University Student Innovation and Entrepreneurship Training Program: 202311415062.
Data Availability Statement
Data are contained within the article.
Conflicts of Interest
The authors declare no conflict of interest.
References
- Herrmann, D.L.; Shuster, W.D.; Mayer, A.L.; Garmestani, A.S. Sustainability for Shrinking Cities. Sustainability 2016, 8, 911. [Google Scholar] [CrossRef]
- Zheng, X.; Luo, Y.; Su, B.; He, P.; Guo, C.; Tian, Y.; Han, S.; Chen, C.; Wang, Y.; Liu, J.; et al. Developmental Gerontology and Active Population Aging in China. China CDC Wkly. 2023, 5, 184–187. [Google Scholar] [CrossRef]
- Yan, D.; Li, P. Can Regional Integration Reduce Urban Carbon Emission? An Empirical Study Based on the Yangtze River Delta, China. Int. J. Environ. Res. Public Health 2023, 20, 1395. [Google Scholar] [CrossRef]
- Zhang, Y.J.; Fu, Y.; Kong, X.S.; Zhang, F. Prefecture-level city shrinkage on the regional dimension in China: Spatiotemporal change and internal relations. Sustain. Cities Soc. 2019, 47, 101490. [Google Scholar] [CrossRef]
- Oswalt, P.; Beyer, E.; Hagemann, A.; Rieniets, T. Atlas of Shrinking Cities; Hatje Cantz Publishers: Stuttgart, Germany, 2006. [Google Scholar]
- Turok, I.; Mykhnenko, V. The trajectories of European cities, 1960–2005. Cities 2007, 24, 165–182. [Google Scholar] [CrossRef]
- Wiechmann, T. Errors Expected Aligning Urban Strategy with Demographic Uncertainty in Shrinking Cities. Int. Plan. Stud. 2008, 13, 431–446. [Google Scholar] [CrossRef]
- Alves, D.; Barreira, A.P.; Guimarães, M.H.; Panagopoulos, T. Historical trajectories of currently shrinking Portuguese cities: A typology of urban shrinkage. Cities 2016, 52, 20–29. [Google Scholar] [CrossRef]
- Levitt, T. EXPLOIT the Product Life Cycle. Harv. Bus. Rev. 1965, 43, 81–94. [Google Scholar]
- Wang, Y.P.; Fukuda, H. Sustainable Urban Regeneration for Shrinking Cities: A Case from Japan. Sustainability 2019, 11, 1505. [Google Scholar] [CrossRef]
- Ojasalo, J.; Kauppinen, S. Public Value in Public Service Ecosystems. J. Nonprofit Public Sect. Mark. 2024, 36, 179–207. [Google Scholar] [CrossRef]
- Guan, D.; He, X.; Hu, X. Quantitative identification and evolution trend simulation of shrinking cities at the county scale, China. Sustain. Cities Soc. 2021, 65, 102611. [Google Scholar] [CrossRef]
- Khmara, Y. On the road to urban degrowth economics? Learning from the experience of C40 cities, doughnut cities, Transition Towns, and shrinking cities. Cities 2023, 136, 104259. [Google Scholar] [CrossRef]
- Nedden, M.Z. Leipzig—Eine wachsende Stadt in einem schrumpfenden Umland. Disp. Plan. Rev. 2010, 46, 95–99. [Google Scholar] [CrossRef]
- Wang, X.; Li, Z.; Feng, Z. Classification of Shrinking Cities in China Based on Self-Organizing Feature Map. Land 2022, 11, 1525. [Google Scholar] [CrossRef]
- Liang, L.; Chen, M.; Lu, D. Revisiting the Relationship Between Urbanization and Economic Development in China Since the Reform and Opening-up. Chin. Geogr. Sci. 2022, 32, 1–15. [Google Scholar] [CrossRef]
- Chen, J.; Fleisher, B.M. Regional Income Inequality and Economic Growth in China. J. Comp. Econ. 1996, 22, 141–164. [Google Scholar] [CrossRef]
- Guo, S.; Ma, H. Can the Spatial Function Division of Urbanization Promote Regional Coordinated Development? Evidence from the Yangtze River Economic Belt in China. Sustainability 2022, 14, 7115. [Google Scholar] [CrossRef]
- Qiao, B.Y.; Martinez-Vazquez, J.; Xu, Y.S. The tradeoff between growth and equity in decentralization policy: China’s experience. J. Dev. Econ. 2008, 86, 112–128. [Google Scholar] [CrossRef]
- Shi, J.; Dai, X.; Duan, K.; Li, J. Exploring the performances and determinants of public service provision in 35 major cities in China from the perspectives of efficiency and effectiveness. Soc. Econ. Plan. Sci. 2023, 85, 101441. [Google Scholar] [CrossRef]
- Li, Z.; He, S.; Su, S.; Li, G.; Chen, F. Public Services Equalization in Urbanizing China: Indicators, Spatiotemporal Dynamics and Implications on Regional Economic Disparities. Soc. Indic. Res. 2020, 152, 1–65. [Google Scholar] [CrossRef]
- Deng, T.T.; Wang, D.D.; Yang, Y.; Yang, H. Shrinking cities in growing China: Did high speed rail further aggravate urban shrinkage? Cities 2019, 86, 210–219. [Google Scholar] [CrossRef]
- Wang, Y.; Lin, M.; Gao, J.; Zhou, Z. Fading Attraction of the Shrinking City: An Empirical Study from an Urban Resource Perspective. Sustainability 2021, 13, 11550. [Google Scholar] [CrossRef]
- Listyaningrum, N.; Lestari, S.F.; Riyanto, I.A.; Cahyadi, A.; Sulistyo, B. Strengthening Local Potential for Sustainable Economic Development in Bengkulu City. IOP Conf. Ser. Earth Environ. Sci. 2019, 338, 01201. [Google Scholar] [CrossRef]
- Harvey, D. Population, Resources, and the Ideology of Science. Econ. Geogr. 1974, 50, 256–277. [Google Scholar] [CrossRef]
- Guo, F.; Qu, X.; Ma, Y.; Tong, L. Spatiotemporal pattern evolution and influencing factors of shrinking cities: Evidence from China. Cities 2021, 119, 103391. [Google Scholar] [CrossRef]
- Wang, M.; Yang, S.; Gao, H.; Abudu, K. The Characteristics, Influencing Factors, and Push-Pull Mechanism of Shrinking Counties: A Case Study of Shandong Province, China. Sustainability 2021, 13, 2402. [Google Scholar] [CrossRef]
- Li, Z.; Jiao, L.; Zhan, B.; Xu, G.; Liu, J. Understanding the pattern and mechanism of spatial concentration of urban land use, population and economic activities: A case study in Wuhan, China. Geo-Spat. Inf. Sci. 2021, 24, 678–694. [Google Scholar] [CrossRef]
- Liu, T.; Cao, G.Z.; Yan, Y.; Wang, R.Y. Urban land marketization in China: Central policy, local initiative, and market mechanism. Land Use Policy 2016, 57, 265–276. [Google Scholar] [CrossRef]
- Tong, D.; Chu, J.; MacLachlan, I.; Qiu, J.; Shi, T. Modelling the Impacts of land finance on urban expansion: Evidence from Chinese cities. Appl. Geogr. 2023, 153, 102896. [Google Scholar] [CrossRef]
- Gyourko, J.; Shen, Y.; Wu, J.; Zhang, R. Land finance in China: Analysis and review. China Econ. Rev. 2022, 76, 101868. [Google Scholar] [CrossRef]
- He, C.; Huang, Z.; Wang, R. Land use change and economic growth in urban China: A structural equation analysis. Urban Stud. 2014, 51, 2880–2898. [Google Scholar] [CrossRef]
- Xie, R.; Yao, S.L.; Han, F.; Fang, J.Y. Land Finance, Producer Services Agglomeration, and Green Total Factor Productivity. Int. Reg. Sci. Rev. 2019, 42, 550–579. [Google Scholar] [CrossRef]
- Cai, H.B.; Henderson, J.V.; Zhang, Q.H. China’s land market auctions: Evidence of corruption? Rand J. Econ. 2013, 44, 488–521. [Google Scholar] [CrossRef] [PubMed]
- Lu, X.-H.; Jiang, X.; Gong, M.-Q. How land transfer marketization influence on green total factor productivity from the approach of industrial structure? Evidence from China. Land Use Policy 2020, 95, 104610. [Google Scholar] [CrossRef]
- Shen, L.; Zhang, L.; Bao, H.; Wong, S.; Du, X.; Wei, X. An Empirical Study on the Mismatch Phenomenon in Utilizing Urban Land Resources in China. Land 2023, 12, 1196. [Google Scholar] [CrossRef]
- Fan, X.; Qiu, S.; Sun, Y. Land finance dependence and urban land marketization in China: The perspective of strategic choice of local governments on land transfer. Land Use Policy 2020, 99, 105023. [Google Scholar] [CrossRef]
- Luo, J.; Chen, S.; Sun, X.; Zhu, Y.; Zeng, J.; Chen, G. Analysis of city centrality based on entropy weight TOPSIS and population mobility: A case study of cities in the Yangtze River Economic Belt. J. Geogr. Sci. 2020, 30, 515–534. [Google Scholar] [CrossRef]
- Office of the Leading Group of the Seventh National Population Census of The State Council. Main Data of the Seventh National population Census in 2020; China Statistics Press: Beijing, China, 2021. [Google Scholar]
- Zhong, W.; Zheng, M. How the Marketization of Land Transfer Affects High-Quality Economic Development: Empirical Evidence from 284 Prefecture-Level Cities in China. Sustainability 2022, 14, 12639. [Google Scholar] [CrossRef]
- Zhang, Y.; Deng, C.; Xie, B.; Hu, J.; Lei, G. Development stage evaluation of land markets in Hunan Province based on an entropy weight and matter-element model. Resour. Sci. 2015, 37, 45–51. [Google Scholar]
- Tian, Y.; Sun, C.W. Comprehensive carrying capacity, economic growth and the sustainable development of urban areas: A case study of the Yangtze River Economic Belt. J. Clean. Prod. 2018, 195, 486–496. [Google Scholar] [CrossRef]
- Kogut, E.L.; Langoni, C.G. Population growth, income distribution and economic development. Int. Labour Rev. 1975, 111, 321. [Google Scholar] [CrossRef]
- Qiu, Z.; Wang, Y.; Bao, L.; Yun, B.; Lu, J. Sustainability of Chinese Village Development in a New Perspective: Planning Principle of Rural Public Service Facilities Based on “Function-Space” Synergistic Mechanism. Sustainability 2022, 14, 8544. [Google Scholar] [CrossRef]
- Luo, D.; Liang, L.; Wang, Z.; Chen, L.; Zhang, F. Exploration of coupling effects in the Economy–Society–Environment system in urban areas: Case study of the Yangtze River Delta Urban Agglomeration. Ecol. Indic. 2021, 128, 107858. [Google Scholar]
- Sun, J.; Zhai, N.; Mu, H.; Miao, J.; Li, W.; Li, M. Assessment of urban resilience and subsystem coupling coordination in the Beijing-Tianjin-Hebei urban agglomeration. Sustain. Cities Soc. 2024, 100, 105058. [Google Scholar] [CrossRef]
- Ding, L.; Xu, Z.; You, L.; Wu, Z. Assessing equal rights in obtaining urban public primary school services with case studies of Hangzhou in China. Habitat Int. 2022, 119, 102474. [Google Scholar] [CrossRef]
- Su, L.; Jia, J. Coupling Coordination Degree of City-Industry Integration in Shanghai Based on Entropy Evaluation Method. Math. Probl. Eng. 2022, 2022, 7985899. [Google Scholar] [CrossRef]
- Li, B.; Li, T.; Yu, M.; Chen, M. Can equalization of public services narrow the regional disparities in China? A spatial econometrics approach. China Econ. Rev. 2017, 44, 67–78. [Google Scholar] [CrossRef]
- Shannon, C.E. A mathematical theory of communication. Bell Syst. Tech. J. 1948, 27, 379–423. [Google Scholar] [CrossRef]
- Xing, L.; Xue, M.G.; Hu, M.S. Dynamic simulation and assessment of the coupling coordination degree of the economy–resource–environment system: Case of Wuhan City in China. J. Environ. Manag. 2019, 30, 474–487. [Google Scholar] [CrossRef]
- Tang, H.; Chen, Y.; Ao, R.; Shen, X.; Shi, G. Spatial–Temporal Characteristics and Driving Factors of the Coupling Coordination between Population Health and Economic Development in China. Sustainability 2022, 14, 10513. [Google Scholar] [CrossRef]
- Xie, Z.; Zhang, Y.; Fang, Z. The Space–Time Evolution of the Coupling and Coordinated Development of Public Cultural Services and Cultural Industries: A Case Study of 31 Regions in China. Sustainability 2022, 14, 15463. [Google Scholar] [CrossRef]
- Yang, N.; Lv, T.; Cui, H. A Study on the Coupling and Coordination Relationship of Science and Technology Innovation, Higher Education, and Clean Energy Based on the Entropy Weight and Gray Correlation Analysis Method. Int. J. Energy Res. 2023, 2023, 9122778. [Google Scholar] [CrossRef]
- Huang, X.; Zhan, D. Prediction of Population Aging in Beijing and Analysis of Its Influencing Factors—Based on Grey GM (1,1) and Grey Correlation Degree Analysis. Oper. Res. Fuzziology 2022, 12, 564–572. [Google Scholar] [CrossRef]
- Li, J. Grey Correlation Analysis of Economic Growth and Cultural Industry Competitiveness. Complexity 2021, 2021, 5594080. [Google Scholar] [CrossRef]
- Luo, D.; Wang, S.H.; Li, Y. The Properties and Applications of an Improved Grey Absolute Relational Mode. Adv. Appl. Math. 2022, 11, 7109–7114. [Google Scholar] [CrossRef]
- Polidoro, M.; de Oliveira, D.C. Prevalence and Spatial Autocorrelation of Tuberculosis in Indigenous People in Brazil, 2002–2022. J. Racial Ethn. Health Disparities 2024. [Google Scholar] [CrossRef]
- Zhang, Z.X.; Wen, Q.K.; Liu, F.; Zhao, X.L.; Liu, B.; Xu, J.Y.; Yi, L.; Hu, S.G.; Wang, X.; Zuo, L.J.; et al. Urban expansion in China and its effect on cultivated land before and after initiating “Reform and Open Policy”. Sci. China Earth Sci. 2016, 59, 1930–1945. [Google Scholar] [CrossRef]
- Wiśniewski, R.; Stępniak, M.; Szejgiec-Kolenda, B. Accessibility of public services in the age of ageing and shrinking population: Are regions following trends. Geogr. Ann. Ser. B Human Geogr. 2021, 103, 55–74. [Google Scholar] [CrossRef]
- Filipović, S.; Ignjatović, J. The effects of Chinese population policy on the labour market. Population 2023, 61, 69–89. [Google Scholar] [CrossRef]
- Lyu, S.; Chen, Z.; Pan, S.; Liu, L. Market integration and economic growth. PLoS ONE 2023, 18, e0294467. [Google Scholar] [CrossRef]
- Li, W.; Yi, P. Assessment of city sustainability—Coupling coordinated development among economy, society and environment. J. Clean. Prod. 2020, 256, 120453. [Google Scholar] [CrossRef]
- Zhang, S.; Wang, L.; Wu, X. Population Shrinkage, Public Service Levels, and Heterogeneity in Resource-Based Cities: Case Study of 112 Cities in China. Sustainability 2022, 14, 15910. [Google Scholar] [CrossRef]


Disclaimer/Publisher’s Note: The statements, opinions and data contained in all publications are solely those of the individual author(s) and contributor(s) and not of MDPI and/or the editor(s). MDPI and/or the editor(s) disclaim responsibility for any injury to people or property resulting from any ideas, methods, instructions or products referred to in the content. |
© 2024 by the authors. Licensee MDPI, Basel, Switzerland. This article is an open access article distributed under the terms and conditions of the Creative Commons Attribution (CC BY) license (https://creativecommons.org/licenses/by/4.0/).