
Planning for Deer-Hunting Management at the Local and Regional Scales: Reconciling Economic, Social and Ecological Functions


Abstract
:1. Introduction
2. Materials and Methods
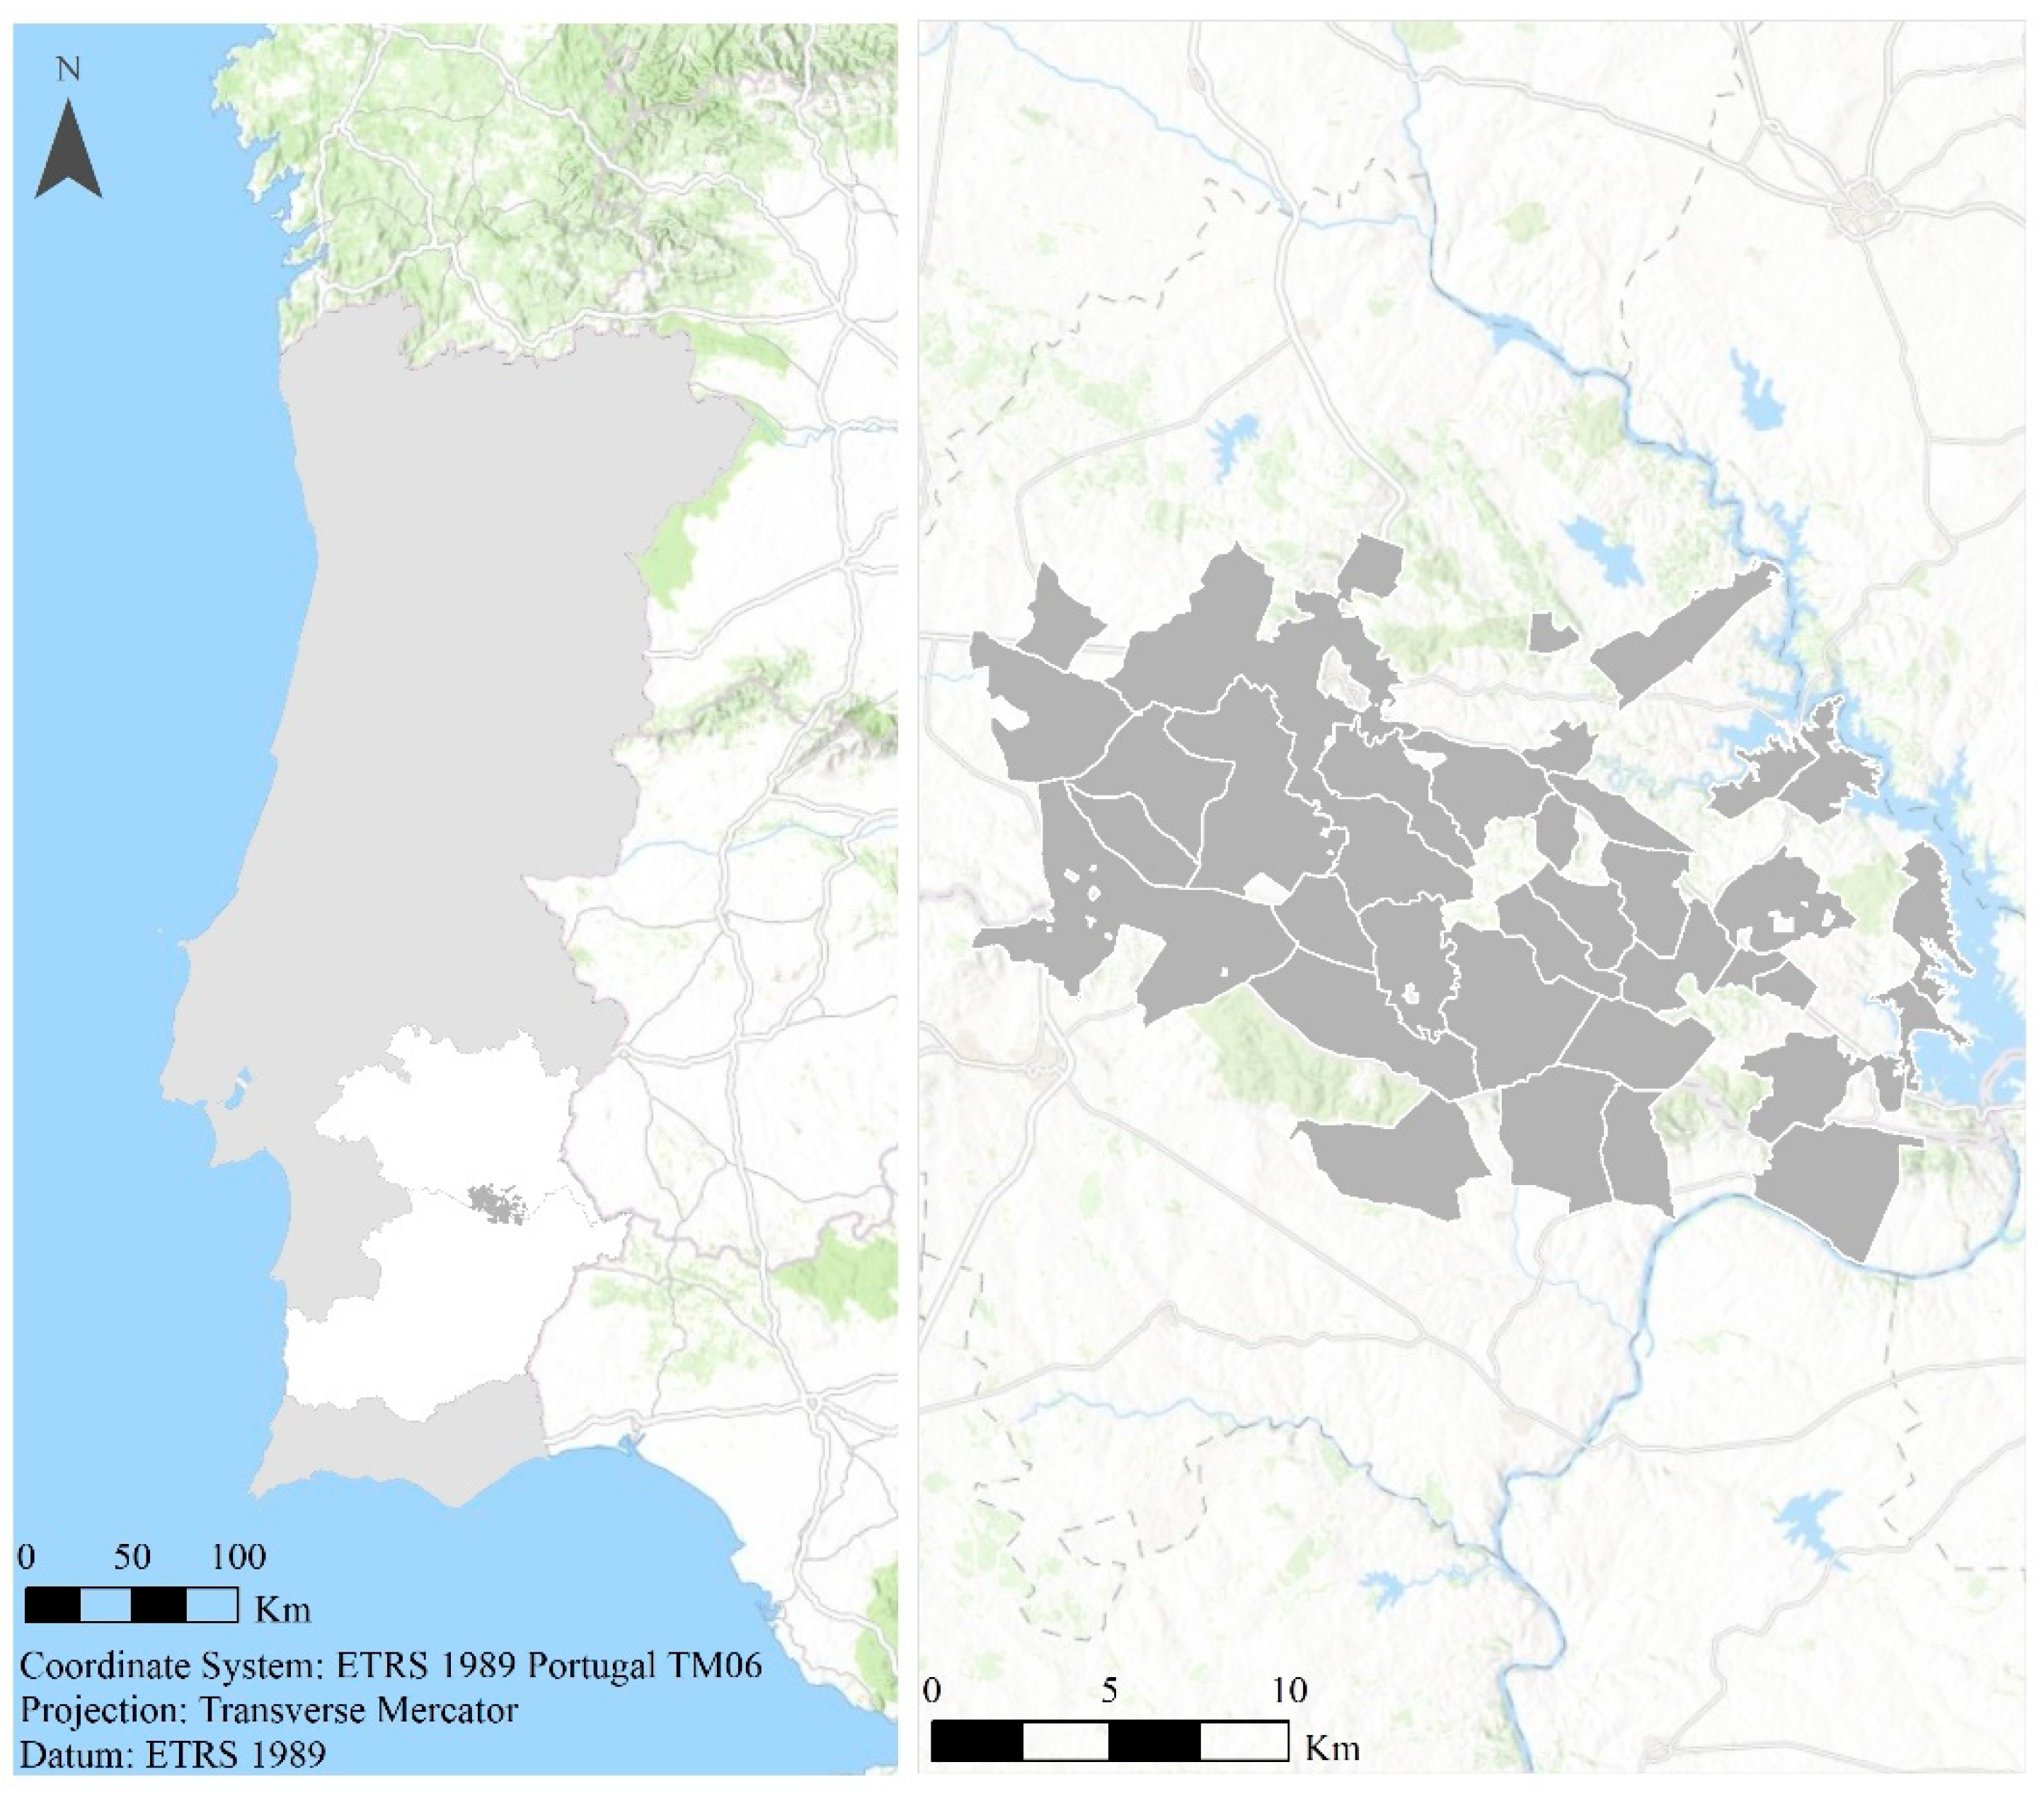
2.1. Study Area
2.2. Data Collection
2.2.1. Spatial Metrics
2.2.2. Habitat Suitability Evaluation
2.2.3. Game Managers’ Perceptions of Damage to Agroforestry Crops Caused by Deer
2.3. Data Analysis
3. Results
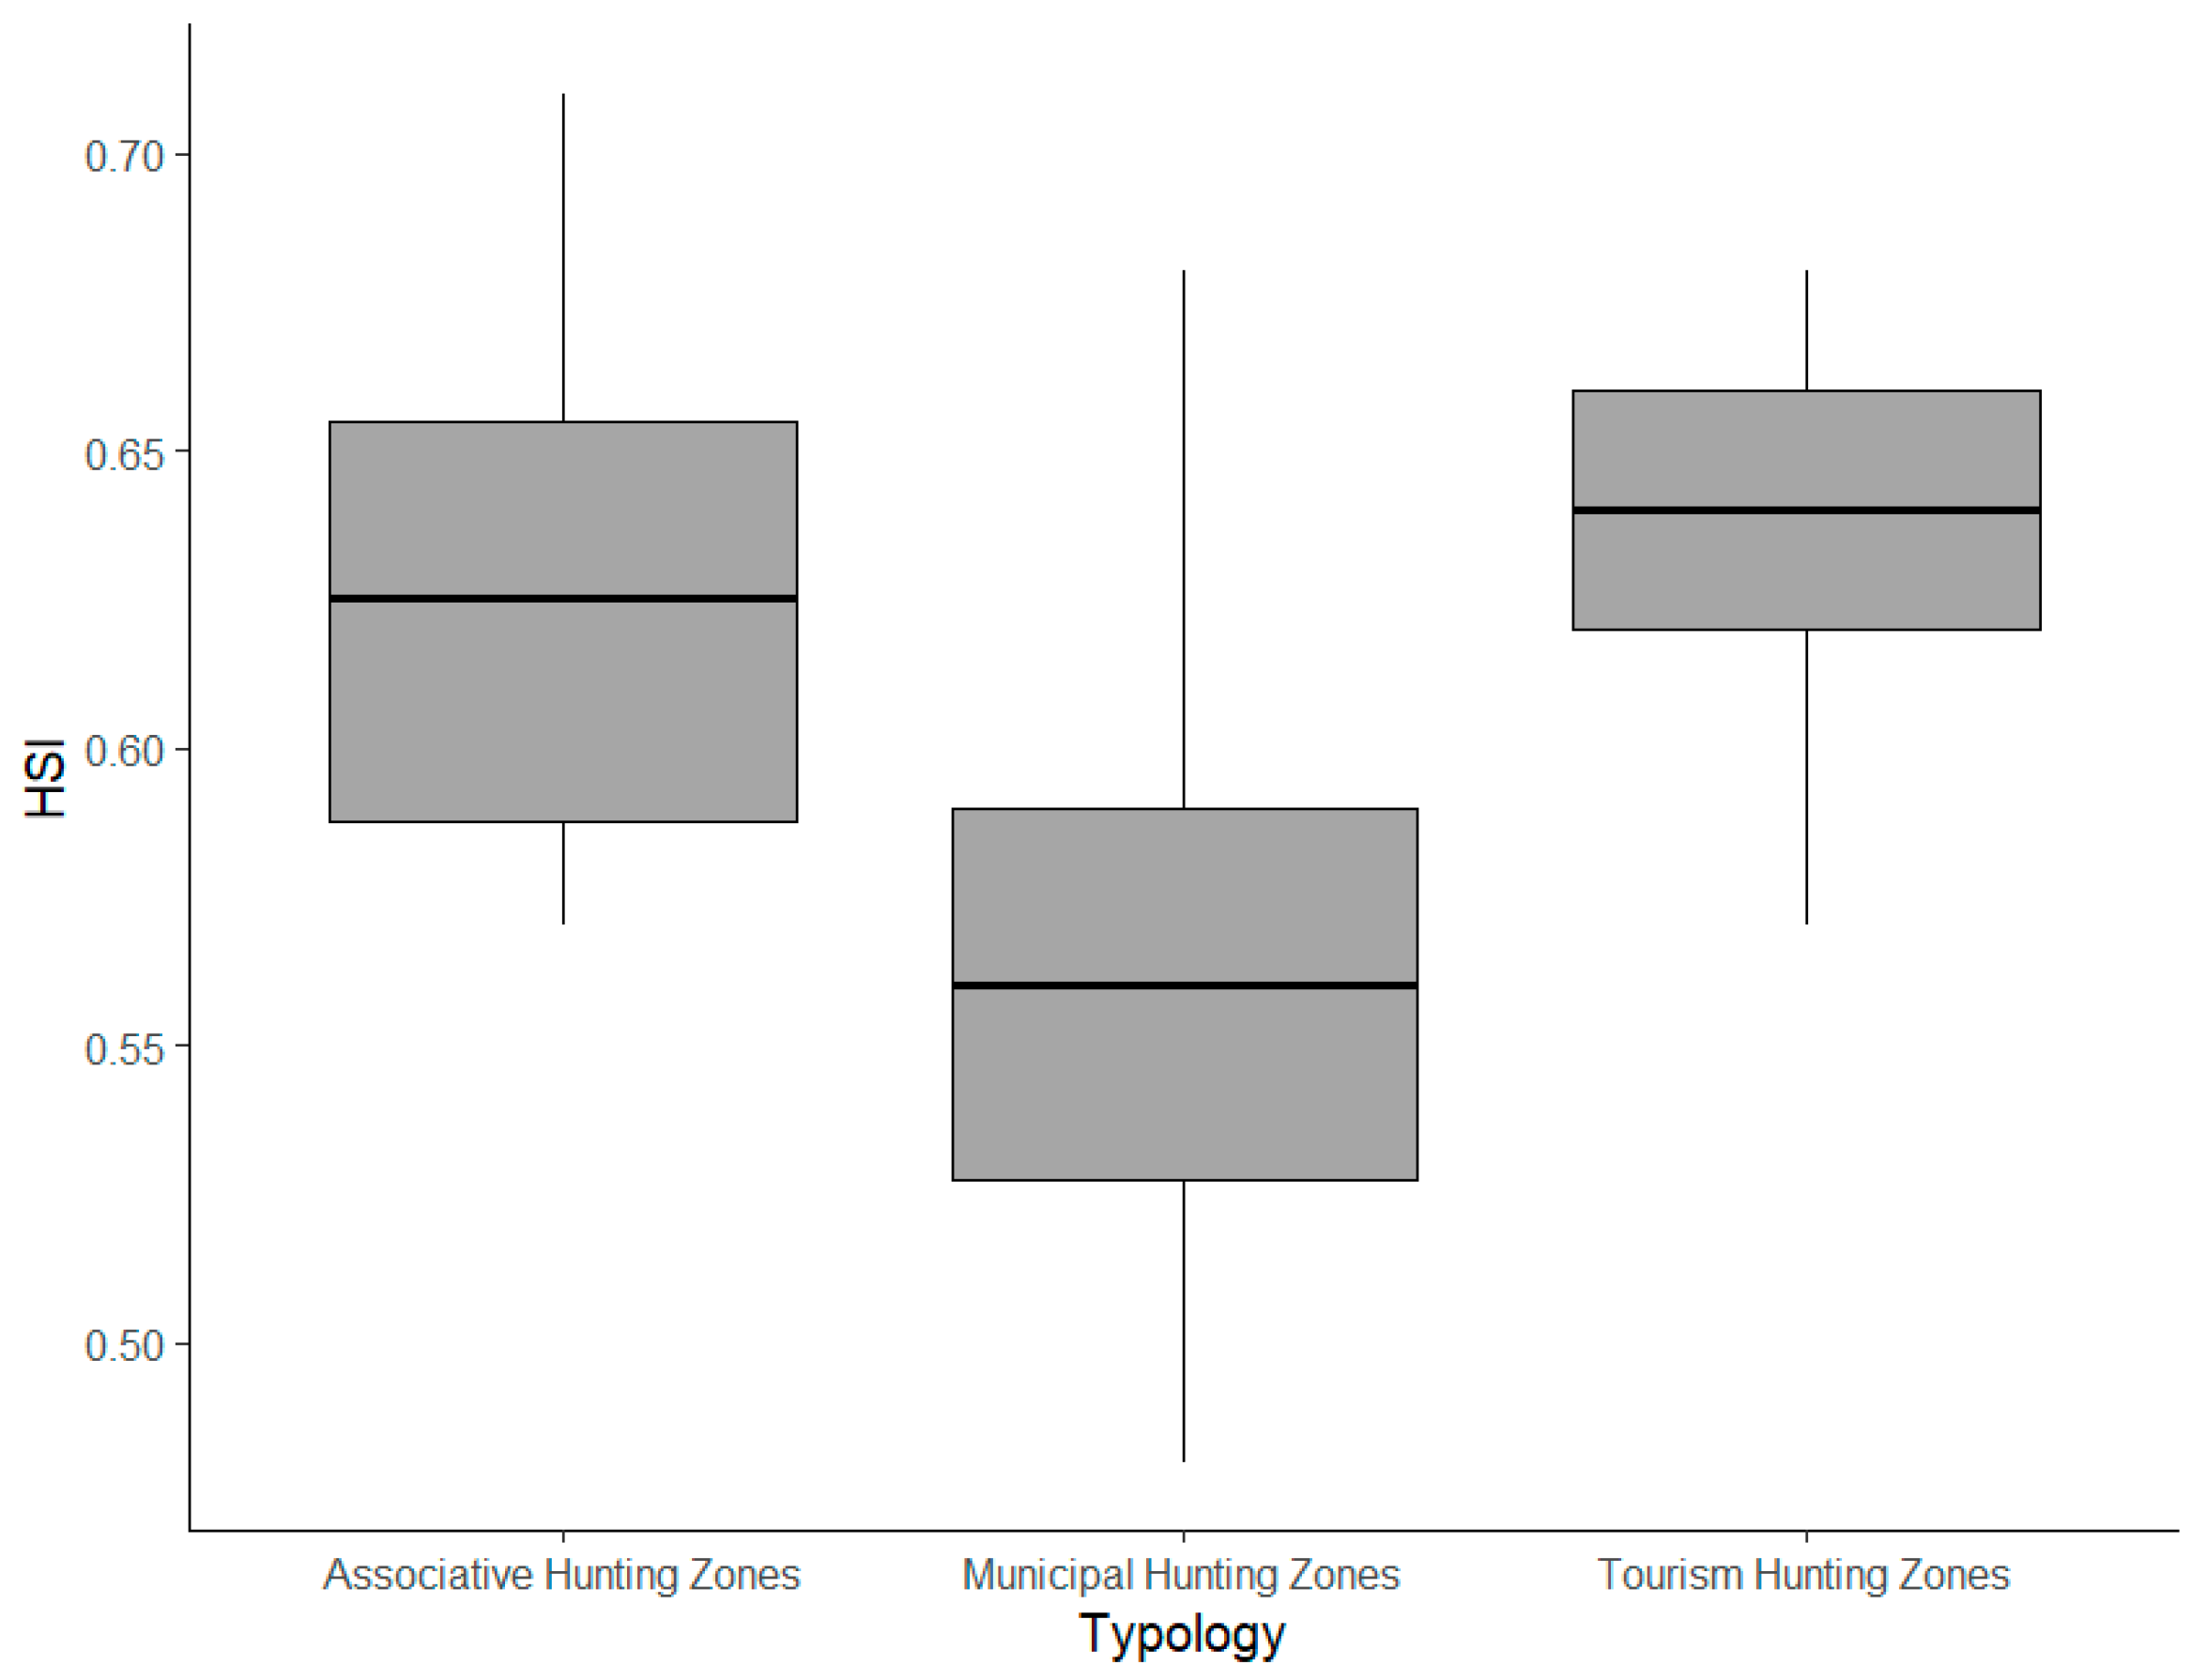
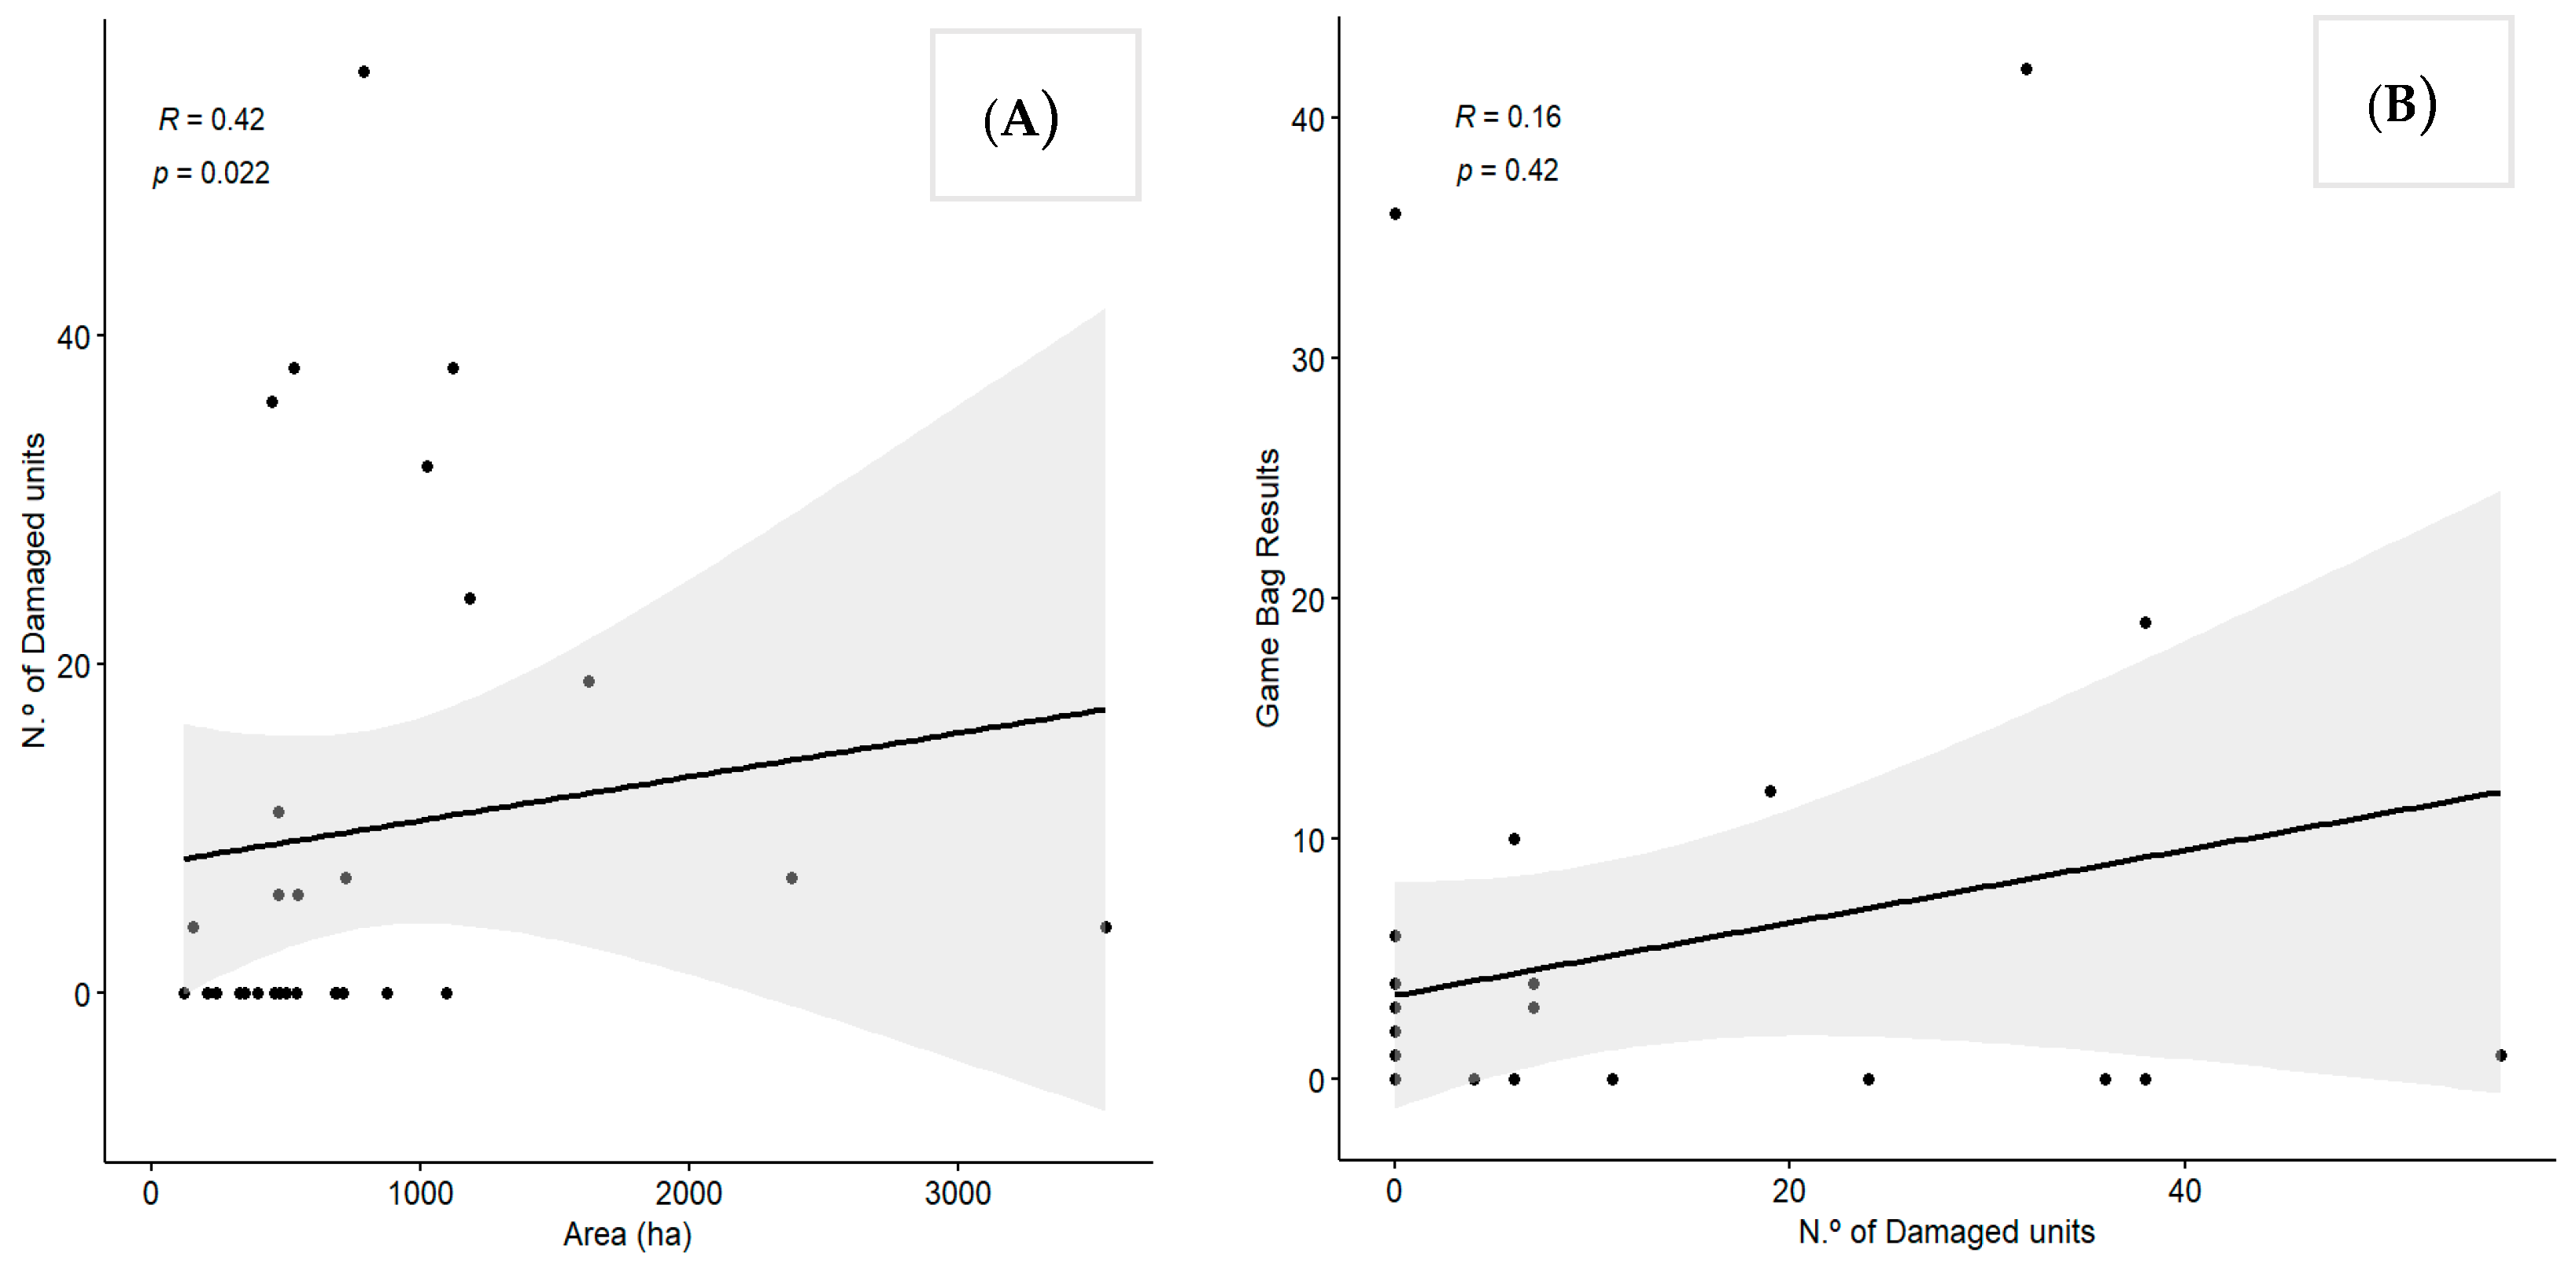
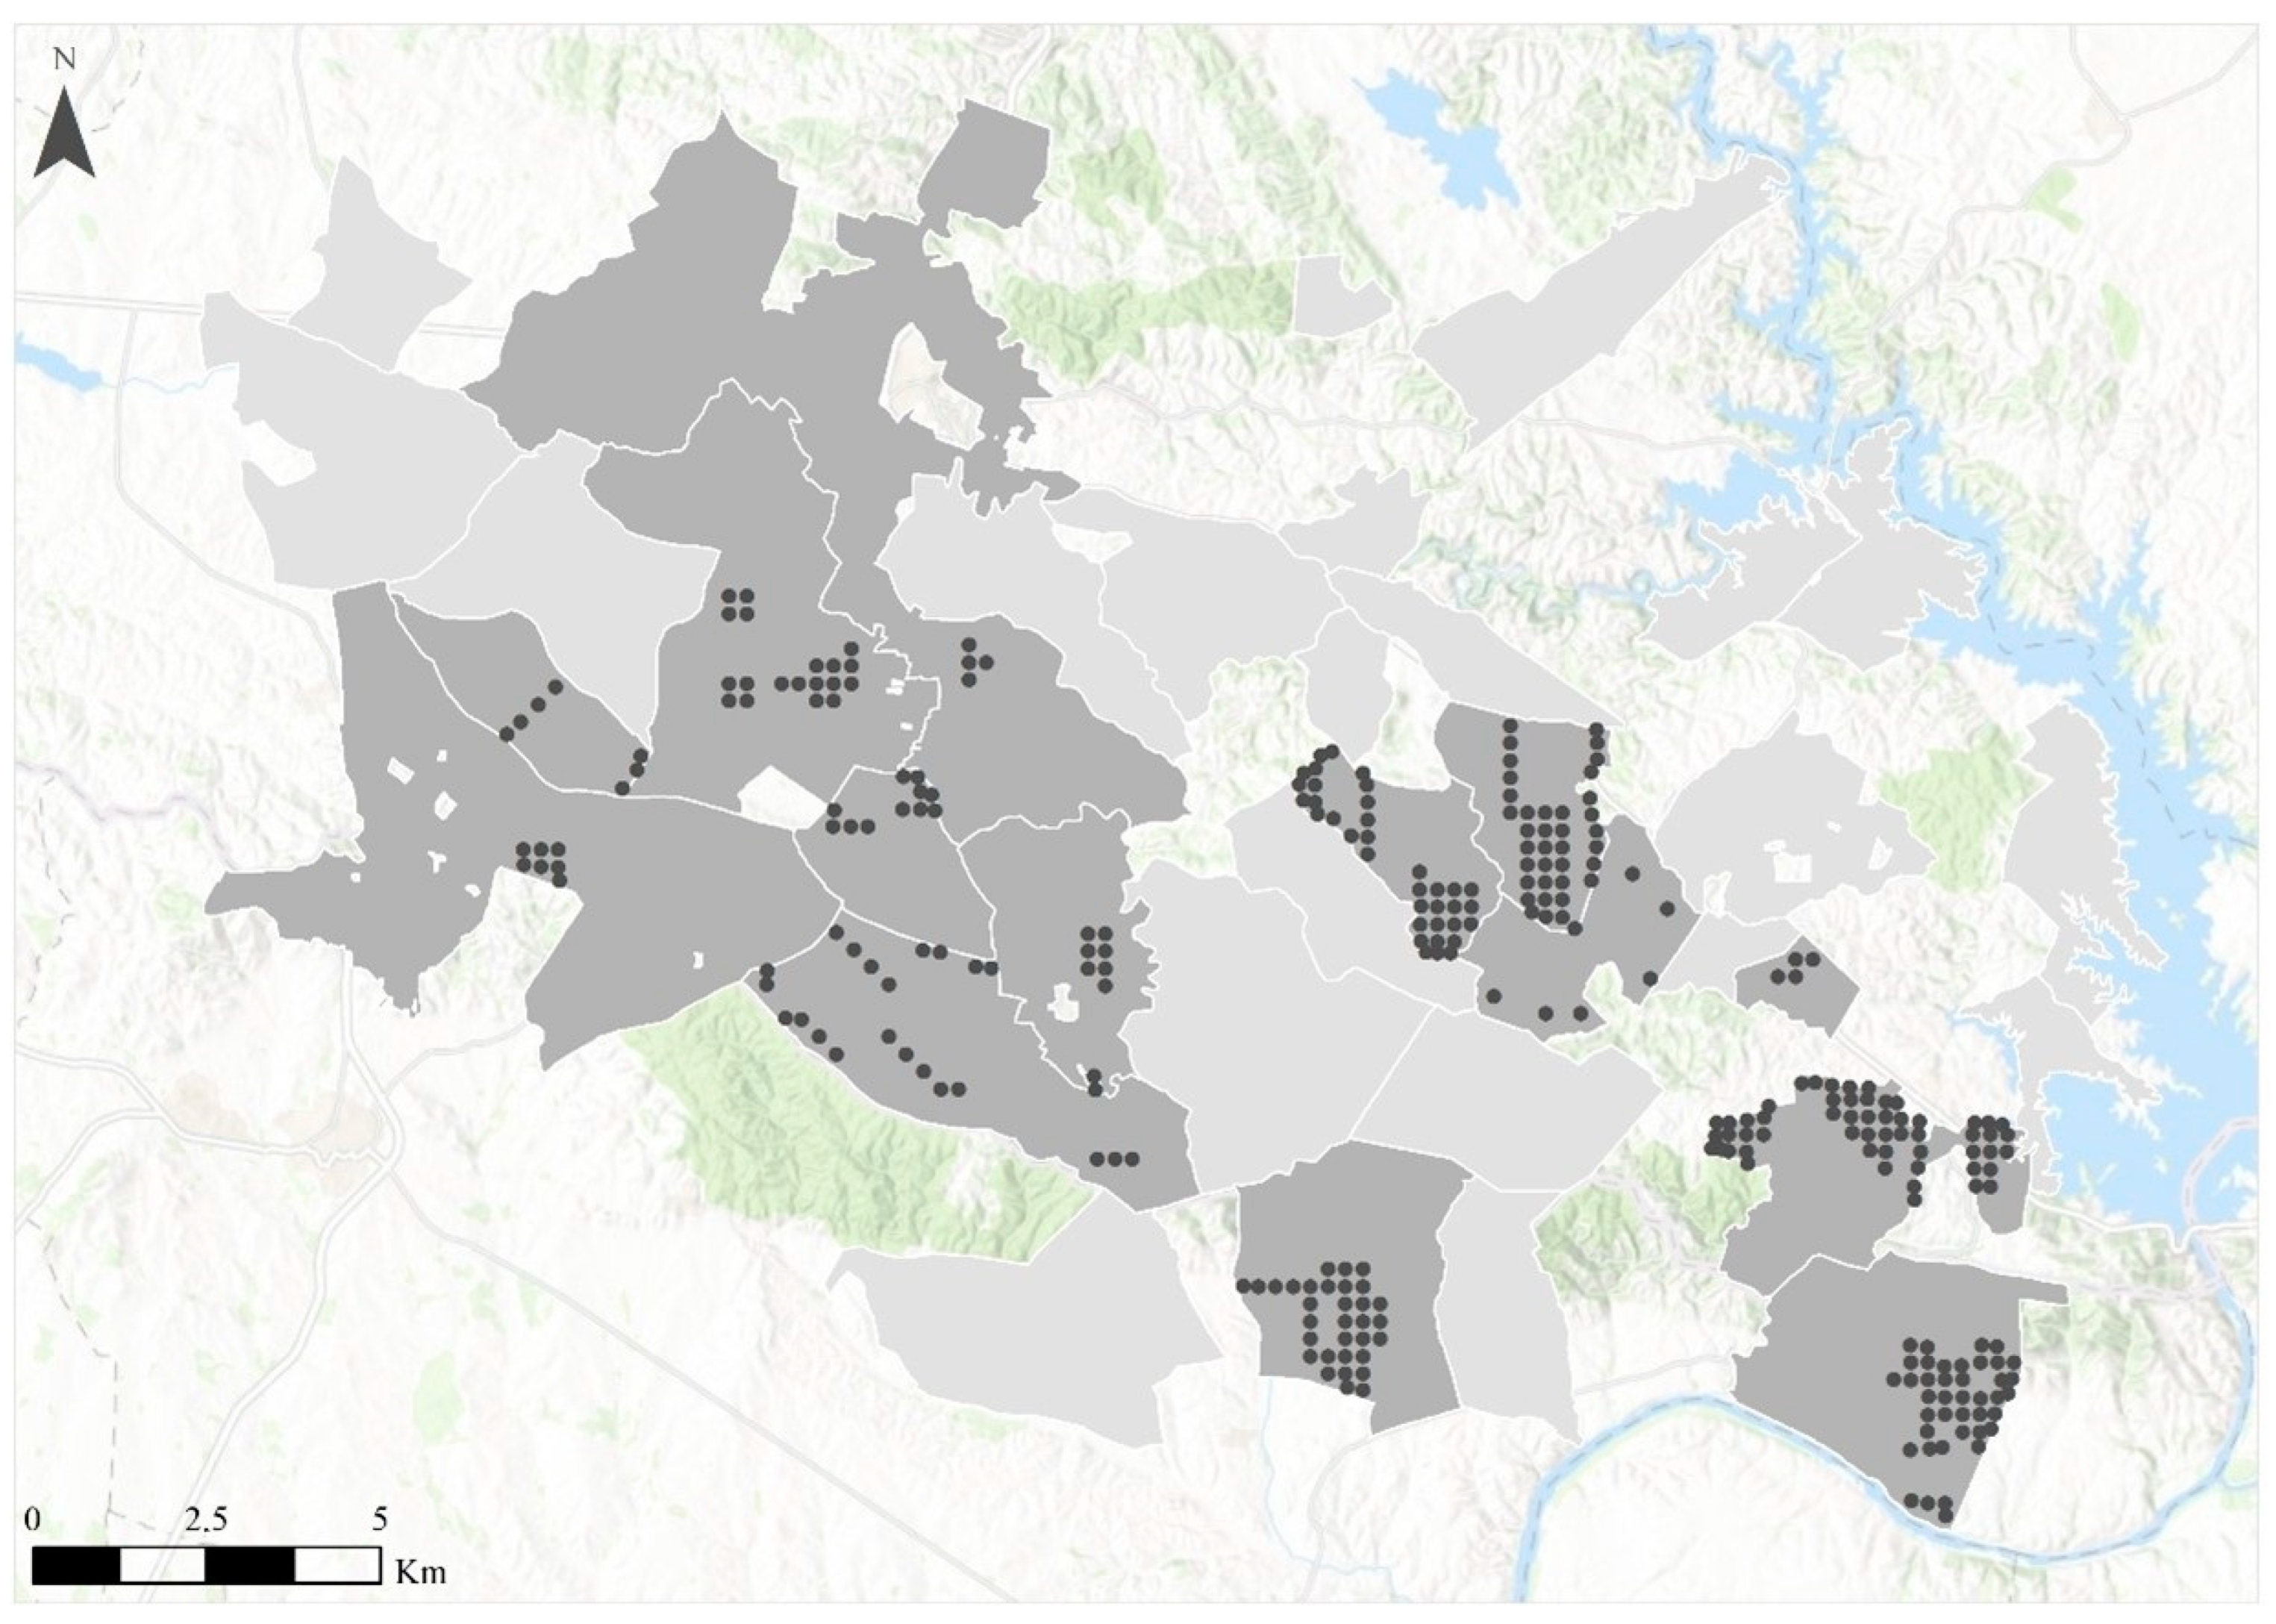
3.1. Management Units’ Characterization and Their Relationship with Crop Damage
3.2. Factors Affecting Crop Damage in the Study Area
4. Discussion
4.1. Hunting Zones’ Characterization and Hunting Functionality Interplay
4.2. Crop Damage Analysis and Management Implications
4.2.1. Planning for Deer Management at a Local Scale
4.2.2. Planning for Deer Management at a Regional Scale
5. Conclusions
Author Contributions
Funding
Institutional Review Board Statement
Data Availability Statement
Acknowledgments
Conflicts of Interest
Appendix A
Habitat Suitability Index for Red and Fallow Deer

| Vital Requirements | Variables | Code |
|---|---|---|
| Food | Herb stratum composition | Tc |
| Shrub stratum composition | Mc | |
| Shrub degree of coverage | Mg | |
| Shrub height | Mh | |
| Tree stratum composition | Ac | |
| Tree degree of cover | Ag | |
| Thermal refuge | Tree height | Ah |
| Tree degree of cover | Ag | |
| Refuge | Shrub height | Mh |
| Shrub degree of cover | Mg | |
| Tree degree of cover | Ag | |
| Breeding | Shrub height | Mh |
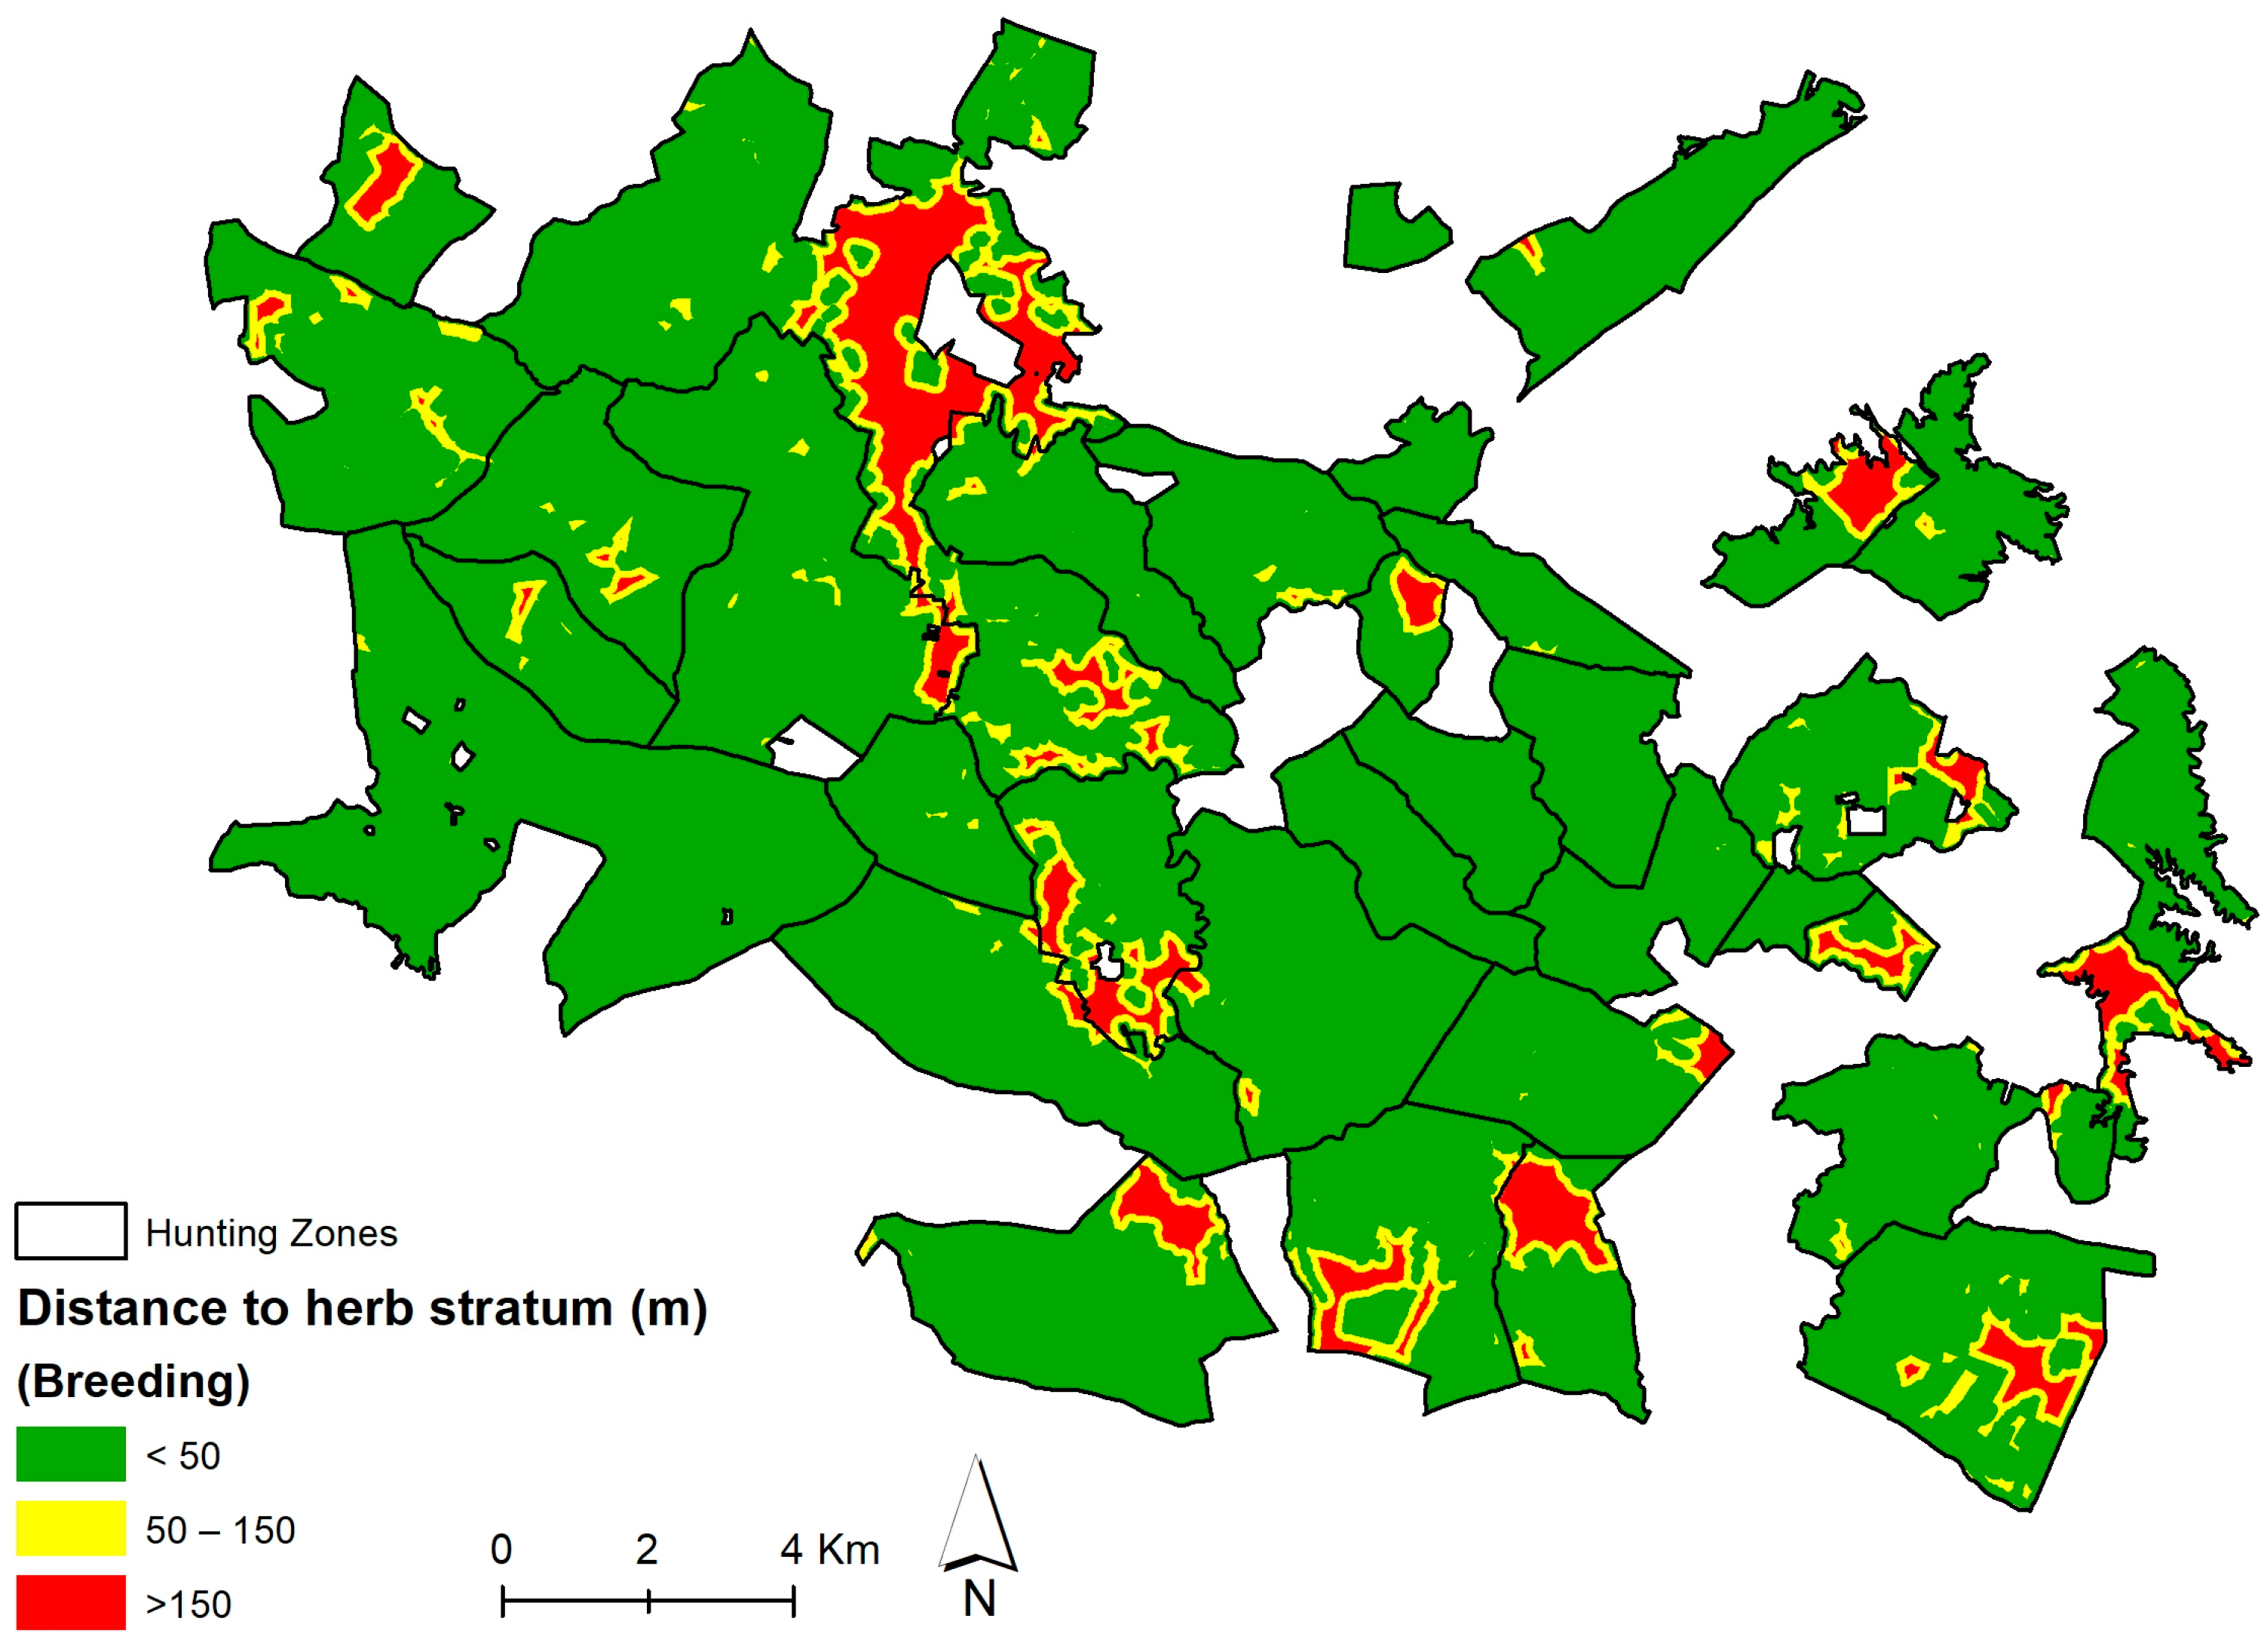
| Distance to herb stratum | Dh | |
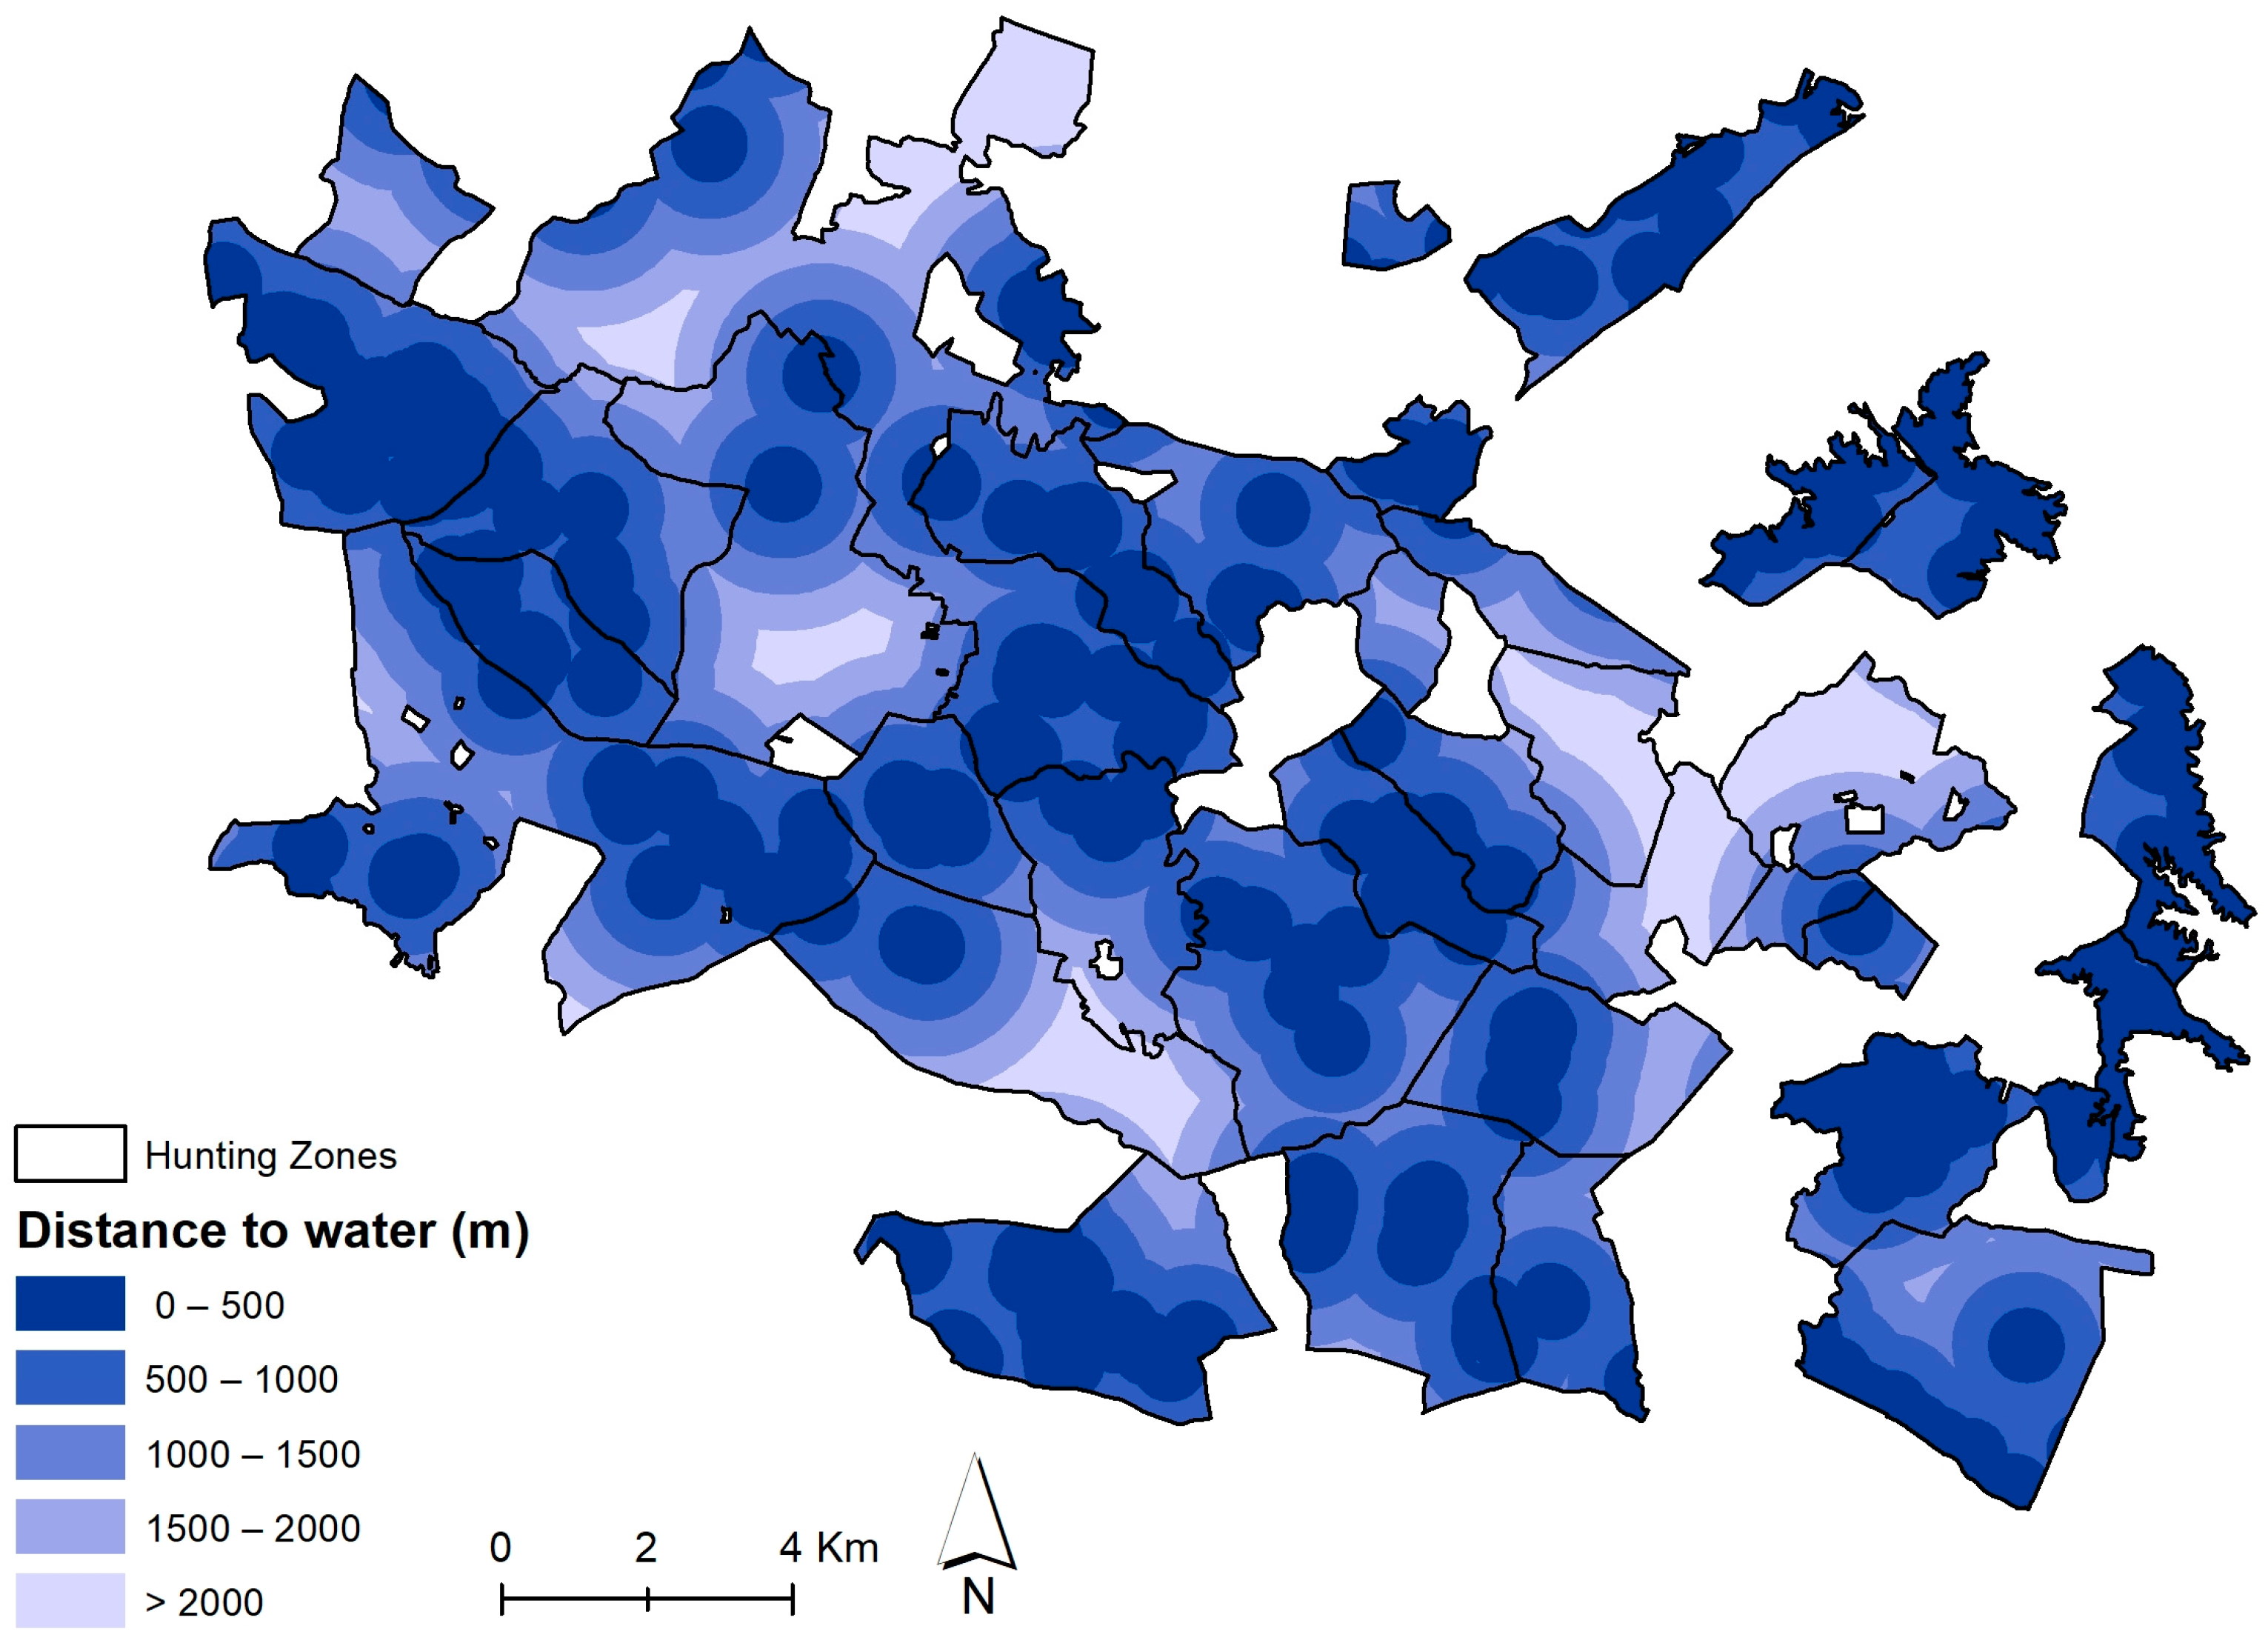
| Distance to water | AGd | |
| Water | Distance to water | AGd |
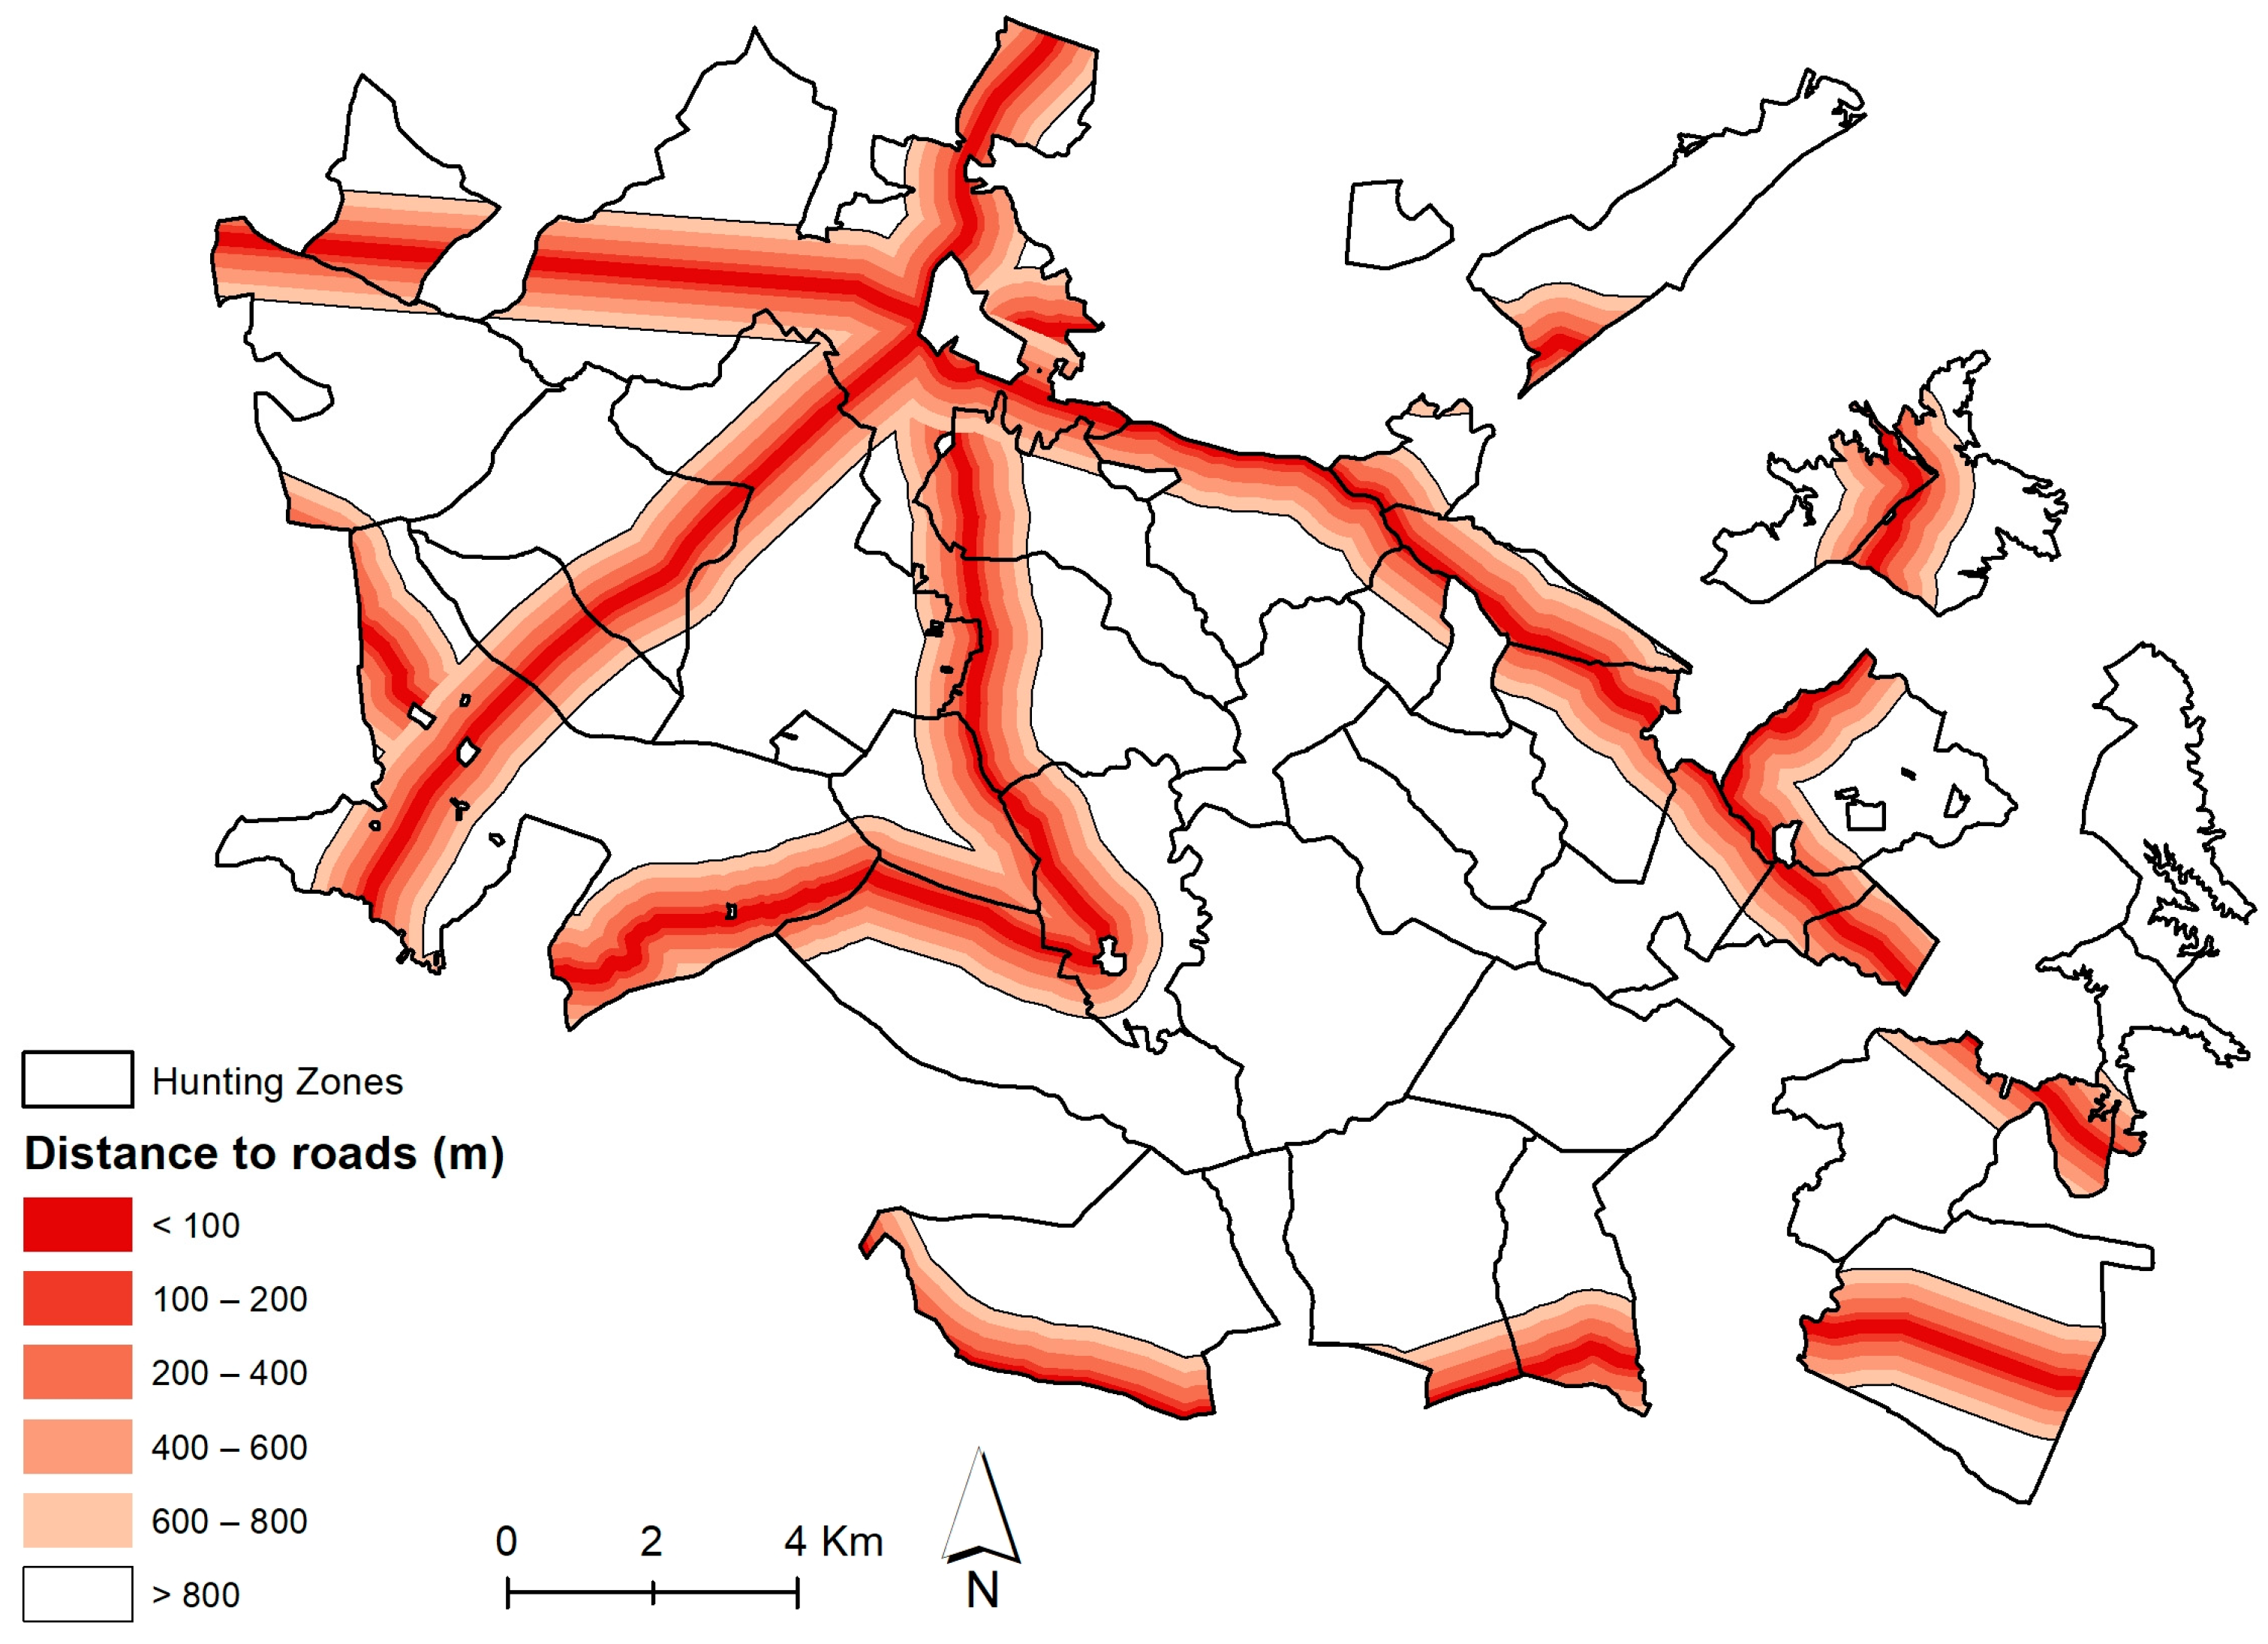
| Tranquility | Distance to roads | RVd |
| Road density | RVds | |
| Distance to population clusters and rural complexes | AHd | |
| Population clusters and rural complexes density | AHds | |
| Grazing (species) | Pt |
| Code | Expression | |
|---|---|---|
| Habitat Suitability Index | HSI | HSI = (3Val + Vct + 3Vre + Vr + Vag + 2Vt)/11 |
| Partial indices | ||
| Food | Val | Val = (3Valh + Valm)/4 + Vala |
| Valh = Tc | ||
| Valm = (Mc2·Mg·Mh)1/4 Vala = (Pt2·Ac)1/3 | ||
| Thermal refuge | Vct | Vct = (Ah·Ag)1/2 |
| Refuge | Vre | Vre = Mh + Ag |
| Reproduction | Vr | Vr = (Mh + Dh + AGd)/3 |
| Water | Vag | Vag = AGd |
| Tranquility | Vt | Vt = (RVd·RVds·AHd·AHds·Pt)1/5 |
| Herb Stratum Composition (Valh) | Coefficient |
|---|---|
| Improved pastures | 1 |
| Temporary cultures (irrigated and non-irrigated) | 0.75 |
| Temporary cultures and/or improved pastures associated to vineyards | 0.75 |
| Temporary cultures and/or improved pastures associated to olive groves | 0.50 |
| Quercus suber agroforestry systems | 0.5 |
| Quercus rotundifolia agroforestry systems | 0.5 |
| Quercus suber agroforestry systems with Quercus rotundifolia | 0.5 |
| Quercus suber forests | 0.25 |
| Quercus rotundifolia forests | 0.25 |
| Eucalyptus spp. forests | 0.25 |
| Other broad-leaved forests | 0.25 |
| Pinus pinaster forests | 0.25 |
| Pinus pinea forests | 0.25 |
| Absence | 0 |
| Shrub Stratum Composition (Mc) | Coefficient |
|---|---|
| Quercus suber forests | 1 |
| Quercus rotundifolia forests | 1 |
| Other broad-leaved forests | 1 |
| Quercus suber agroforestry systems | 1 |
| Quercus rotundifolia agroforestry systems | 1 |
| Quercus suber agroforestry systems with Quercus rotundifolia | 1 |
| Olive groves | 0.75 |
| Scrubs | 0.5 |
| Pinus pinaster forests | 0.25 |
| Pinus pinea forests | 0.25 |
| Eucalyptus spp. forests | 0.125 |
| Absence | 0 |
| Shrub Stratum Cover (Mg) | Coefficient |
|---|---|
| Quercus suber forests | 1 |
| Quercus rotundifolia forests | 1 |
| Other broad-leaved forests | 1 |
| Pinus pinaster forests | 1 |
| Pinus pinea forests | 1 |
| Eucalyptus spp. forests | 1 |
| Scrubs | 0.75 |
| Olive groves | 0.75 |
| Quercus suber agroforestry systems | 0.50 |
| Quercus rotundifolia agroforestry systems | 0.50 |
| Quercus suber agroforestry systems with Quercus rotundifolia | 0.50 |
| Shrub Stratum Height (Mh) | Coefficient |
|---|---|
| 0–1.0 m | 1 |
| 1.0–1.5 m | 0.5 |
| >1.5 m | 0.125 |
| Tree Stratum Composition (Ac) | Coefficient |
|---|---|
| Quercus suber forests | 1 |
| Quercus rotundifolia forests | 1 |
| Other broad-leaved forests | 1 |
| Quercus suber agroforestry systems | 1 |
| Quercus rotundifolia agroforestry systems | 1 |
| Quercus suber agroforestry systems with Quercus rotundifolia | 1 |
| Olive groves | 0.75 |
| Pinus pinaster forests | 0.25 |
| Pinus pinea forests | 0.25 |
| Eucalyptus spp. forests | 0.125 |
| Tree Stratum Cover (Ag) | Coefficient |
|---|---|
| Quercus suber forests | 1 |
| Quercus rotundifolia forests | 1 |
| Other broad-leaved forests | 1 |
| Pinus pinaster forests | 1 |
| Pinus pinea forests | 1 |
| Eucalyptus spp. forests | 1 |
| Olive groves | 0.75 |
| Quercus suber agroforestry systems | 0.5 |
| Quercus rotundifolia agroforestry systems | 0.5 |
| Quercus suber agroforestry systems with Quercus rotundifolia | 0.5 |
| Tree Stratum Height (Ah) | Coefficient |
|---|---|
| 0–2.0 m | 1 |
| 2.0–5.0 m | 0.5 |
| >5.0 m | 0.125 |
| Shrub Stratum Height (Refuge) (Mh) | Coefficient |
|---|---|
| <1.0 m | 1 |
| 1.0–1.5 m | 0.75 |
| 1.5–1.8 m | 0.5 |
| >1.8 m | 0 |
| Shrub Stratum Height (Breeding) (Mh) | Coefficient |
|---|---|
| <1.0 m without trees | 0 |
| <1.0 m with trees | 0.50 |
| 1.0–1.5 m | 1 |
| >1.5 m | 0.50 |
| Distance to Water (Breeding) (AGd) | Coefficient |
|---|---|
| <150 m | 1 |
| 150–300 m | 0.5 |
| >300 m | 0 |
| Distance to Herb Stratum (Breeding) (Dh) | Coefficient |
|---|---|
| <50 m | 1 |
| 50–150 m | 0.5 |
| >150 m | 0 |
| Distance to Water (AGd) | Coefficient |
|---|---|
| 0–500 m | 1 |
| 500–1000 m | 0.75 |
| 1000–1500 m | 0.50 |
| 1500–2000 m | 0.25 |
| >2000 m | 0 |
| Distance to Roads (RVd) | Coefficient | |
|---|---|---|
| National Roads (EN) and Principal Routes (IP) | Municipal Roads (EM) | |
| <100 m | 0.00 | 0.00 |
| 100–200 m | 0.00 | 0.00 |
| 200–400 m | 0.25 | 0.33 |
| 400–600 m | 0.50 | 0.67 |
| 600–800 m | 0.75 | 1.00 |
| >800 m | 1.00 | |
| Distance to Population Clusters and Rural Complexes (AHd) | Coefficient | |
|---|---|---|
| Large Population Clusters and Rural Complexes | Small Population Clusters | |
| 0–500 m | 0.00 | 0.00 |
| 500–1000 m | 0.00 | 0.17 |
| 1000–1200 m | 0.20 | 0.47 |
| 1200–1400 m | 0.40 | 0.60 |
| 1400–1600 m | 0.60 | 0.73 |
| 1600–1800 m | 0.80 | 0.87 |
| >1800 m | 1.00 | 1.00 |
| Grazing | Coefficient |
|---|---|
| None | 1 |
| Cattle or pigs | 0.75 |
| Sheep | 0.5 |
| Goats | 0.25 |


References
- Paixão, R.; Godinho, S.; Santos, P. Is the Nature 2000 Network Associated with Small-Game Bag Results? Eur. J. Wildl. Res. 2009, 55, 553–559. [Google Scholar] [CrossRef]
- Paiva, R.; Reis, P.; Coelho, I.S. Valor Económico Da Caça Em Portugal; Instituto Nacional de Investigação Agrária e Veterinária, I.P. (INIAV), Ed.; SILVA LUSITANA, Research institute in Oeiras e São Julião da Barra, Portugal: Oeiras, Portugal, 2017; ISBN 978-972-579-044-1. [Google Scholar]
- Sánchez-García, C.; Urda, V.; Lambarri, M.; Prieto, I.; Andueza, A.; Villanueva, L.F. Evaluation of the Economics of Sport Hunting in Spain through Regional Surveys. Int. J. Environ. Stud. 2021, 78, 517–531. [Google Scholar] [CrossRef]
- Di Minin, E.; Clements, H.S.; Correia, R.A.; Cortés-Capano, G.; Fink, C.; Haukka, A.; Hausmann, A.; Kulkarni, R.; Bradshaw, C.J.A. Consequences of Recreational Hunting for Biodiversity Conservation and Livelihoods. One Earth 2021, 4, 238–253. [Google Scholar] [CrossRef]
- Arnett, E.B.; Southwick, R. Economic and Social Benefits of Hunting in North America. Int. J. Environ. Stud. 2015, 72, 734–745. [Google Scholar] [CrossRef]
- Hudson, R.J.; Drew, K.R.; Baskin, L.M. Wildlife Production Systems. Economic Utilisation of Wild Ungulates; Cambridge University Press: Cambridge, UK, 1989. [Google Scholar]
- t’Sas-Rolfes, M.; Emslie, R.; Adcock, K.; Knight, M. Legal Hunting for Conservation of Highly Threatened Species: The Case of African Rhinos. Conserv. Lett. 2022, 15, e12877. [Google Scholar] [CrossRef]
- Alves, R.R.N.; Souto, W.M.S.; Fernandes-Ferreira, H.; Bezerra, D.M.M.; Barboza, R.R.D.; Vieira, W.L.S. The Importance of Hunting in Human Societies. In Ethnozoology Animals in our Lives; Elsevier Inc.: Amsterdam, The Netherlands, 2018; pp. 95–118. ISBN 9780128099148. [Google Scholar]
- Ralph, E.D. Xenophon on Hunting; Edwin Mellen Press: Lewiston, NY, USA, 2001; Volume 13, ISBN 0773475788. [Google Scholar]
- Sokos, C.K.; Peterson, M.N.; Birtsas, P.K.; Hasanagas, N.D. Insights for Contemporary Hunting from Ancient Hellenic Culture. Wildl. Soc. Bull. 2014, 38, 451–457. [Google Scholar] [CrossRef]
- Alfonso, X.I.; de Castilla, R.; Argote de Molina, G. Libro de La Monteria Que Mando Escrevir El Muy Alto y Muy Poderoso Rey Don Alonso de Castilla y de Leon, Último de Este Nombre; Andrea Pescioni: Sevilla, Spain, 1582. [Google Scholar]
- Buceta, J.M.A. Livro Da Montaria de D. João I de Portugal (1415–1433); Universidad de Valladolid: Valladolid, Spain, 2009. [Google Scholar]
- Burgoyne, J. Imagining Nature and Nobility in Law and Literature: Siete Partidas (Alfonso X), Libro de La Montería (Alfonso XI), and Libro de La Caza (Juan Manuel). Roman. Q. 2019, 66, 114–123. [Google Scholar] [CrossRef]
- Gasset, J.O. Prólogo a Veinte Años de Caza Mayor Del Conde de Yebes; Universidad de Castilla-La Mancha Cuenca: Cuenca, Spain, 1999; ISBN 9788489958913. [Google Scholar]
- Almeida, J.D. Almeida, J.D. A Caça Em Portugal Através Dos Tempos. In A caça em Portugal; Costa, C.E., Ed.; Editorial Estampa: Lisboa, Portugal, 1963; Volume 1, pp. 43–70. [Google Scholar]
- Buzón, R. La Caza y Los Toros, de José Ortega y Gasset; Editorial Renacimiento, Ed.; Revista de Estudios Taurinos: Sevilla, Spain, 2022; Volume 51, ISBN 9788419231833. [Google Scholar]
- Apollonio, M.; Andersen, R.; Putman, R. European Ungulates and Their Management in the 21st Century; Apollonio, M., Andersen, R., Putman, R., Eds.; Cambridge University Press: Cambridge, UK, 2010; ISBN 0521760615. [Google Scholar]
- Krausman, P.R.; Cain, J.W. Wildlife Management and Conservation: Contemporary Principles and Practices, 2nd ed.; JHU Press: Baltimore, MD, USA, 2022; ISBN 9781421443973. [Google Scholar]
- Fischer, A.; Kereži, V.; Arroyo, B.; Mateos-Delibes, M.; Tadie, D.; Lowassa, A.; Krange, O.; Skogen, K. (De)Legitimising Hunting—Discourses over the Morality of Hunting in Europe and Eastern Africa. Land. Use Policy 2013, 32, 261–270. [Google Scholar] [CrossRef]
- Fischer, A.; Sandström, C.; Delibes-Mateos, M.; Arroyo, B.; Tadie, D.; Randall, D.; Hailu, F.; Lowassa, A.; Msuha, M.; Kereži, V.; et al. On the Multifunctionality of Hunting—An Institutional Analysis of Eight Cases from Europe and Africa. J. Environ. Plan. Manag. 2013, 56, 531–552. [Google Scholar] [CrossRef]
- Meisingset, E.L.; Loe, L.E.; Brekkum, Ø.; Bischof, R.; Rivrud, I.M.; Lande, U.S.; Zimmermann, B.; Veiberg, V.; Mysterud, A. Spatial Mismatch between Management Units and Movement Ecology of a Partially Migratory Ungulate. J. Appl. Ecol. 2018, 55, 745–753. [Google Scholar] [CrossRef]
- Vingada, J.; Fonseca, C.; Cancela, J.; Ferreira, J.; Eira, C. Ungulates and Their Management in Portugal. In European Ungulates and Their Management in the 21st Century; Apollonio, M., Andersen, R., Putman, R., Eds.; Cambridge University Press: Cambridge, UK, 2010; pp. 392–418. [Google Scholar]
- Miguel Bugalho, O. Veado Na Tapada Real de Vila Viçosa; Fundação da Casa de Bragança: Lisboa, Portugal, 2002. [Google Scholar]
- Mendonça, M. Livro de Montaria Feito Por El-Rei D.João I Rei de Portugal; Mar de Letras Ed.: Lisboa, Portugal, 2003. [Google Scholar]
- Carvalho, J.; Queirós, J.; Bugalho, M.; Cortez, P.; Santos, J. Cervus elaphus Veado. In Livro Vermelho dos Mamíferos de Portugal Continental; Mathias, M., Fonseca, C., Rodrigues, L., Grilo, C., Lopes-Fernandes, M., Palmeirim, J., Santos-Reis, M., Alves, P., Cabral, J., Ferreira, M., et al., Eds.; FCiências.ID, ICNF: Lisboa, Portugal, 2023. [Google Scholar]
- Mathias, M.D.L.; Fonseca, C.; Rodrigues, L.; Grilo, C.; Lopes-Fernandes, M.; Palmeirim, J.M.; Santos-Reis, M.; Alves, P.C.; Cabral, J.A.; Ferreira, M.; et al. Livro Vermelho Dos Mamíferos de Portugal Continental; FCiências.ID, ICNF: Lisboa, Portugal, 2023. [Google Scholar]
- Milner, J.M.; Bonenfant, C.; Mysterud, A.; Gaillard, J.M.; Csányi, S.; Stenseth, N.C. Temporal and Spatial Development of Red Deer Harvesting in Europe: Biological and Cultural Factors. J. Appl. Ecol. 2006, 43, 721–734. [Google Scholar] [CrossRef]
- Figueiredo, A.M.; Valente, A.M.; Barros, T.; Carvalho, J.; Silva, D.A.M.; Fonseca, C.; de Carvalho, L.M.; Torres, R.T. What Does the Wolf Eat? Assessing the Diet of the Endangered Iberian Wolf (Canis Lupus Signatus) in Northeast Portugal. PLoS ONE 2020, 15, e0230433. [Google Scholar] [CrossRef] [PubMed]
- Lei de Bases Gerais Da Caça, Lei n.o 173/99, de 21 de Setembro. Available online: https://diariodarepublica.pt/dr/legislacao-consolidada/lei/1999-34536275 (accessed on 1 February 2024).
- Costa, J.C.; Aguiar, C.; Capelo, J.; Lousã, M.; Neto, C. Biogeografia de Portugal Continental. Quercetea 1998, 5–56. Available online: https://bibliotecadigital.ipb.pt/handle/10198/714 (accessed on 1 February 2024).
- Rivas-Martínez, S. Avances En Geobotánica. In Discurso de Apertura Del Curso Académico de La Real Academia Nacional de Farmacia Del Año; Real Academia Nacional de Farmacia, Instituto de España: Madrid, Spain, 2005. [Google Scholar]
- Rivas-Martínez, S.; Penas, A.; Diaz-González, T.E.; Río, S.; Cantó, P.; Herrero, L.; Gomes, C.P.; Costa, J.C. Biogeography of Spain and Portugal. Preliminary Typological Synopsis. Int. J. Geobot. Res. 2014, 4, 1–64. [Google Scholar]
- Archibold, O.W. Mediterranean Ecosystems. In Ecology of World Vegetation; Springer: Dordrecht, The Netherlands, 2012; pp. 131–164. [Google Scholar]
- Environmental Systems Research Institute. ESRI 2011 ArcGIS Desktop: Release 10; Environmental Systems Research Institute: Redlands, CA, USA, 2011. [Google Scholar]
- Direção-Geral do Território. 2019 Especificações Técnicas Da Carta de Uso e Ocupação Do Solo (COS) de Portugal Continental Para 2018; Direção-Geral do Território: Lisbon, Portugal, 2019. [Google Scholar]
- U.S. Fish and Wildlife Service Division of Ecological Services. Standards for the Development of Habitat Suitability Index Models; Division of Ecological Services, U.S.F. and W.S. Department of the I.W.D.C., Ed.; U.S. Fish and Wildlife Service: Washington, DC, USA, 1981.
- Carmo, P.L.; Romão, C.O.; Santos, A.M. Contribuição Metodológica Para a Avaliação de Potencialidades Cinegéticas; Instituto Superior de Agronomia, Universidade de Lisboa: Lisboa, Portugal, 1986. [Google Scholar]
- Bugalho, M.N.; Milne, J.A. The Composition of the Diet of Red Deer (Cervus elaphus) in a Mediterranean Environment: A Case of Summer Nutritional Constraint? For. Ecol. Manag. 2003, 181, 23–29. [Google Scholar] [CrossRef]
- Azorit, C.; Tellado, S.; Oya, A.; Moro, J. Seasonal and Specific Diet Variations in Sympatric Red and Fallow Deer of Southern Spain: A Preliminary Approach to Feeding Behaviour. Anim. Prod. Sci. 2012, 52, 720. [Google Scholar] [CrossRef]
- Bellu, A.; Bugalho, M.N.; Monteiro-Henriques, T.; Costa, J.C.; Rego, F.C. Habitat Use at Fine Spatial Scale: How Does Patch Clustering Criteria Explain the Use of Meadows by Red Deer? Eur. J. Wildl. Res. 2012, 58, 645–654. [Google Scholar] [CrossRef]
- Alves, J.; Alves da Silva, A.; Soares, A.M.V.M.; Fonseca, C. Spatial and Temporal Habitat Use and Selection by Red Deer: The Use of Direct and Indirect Methods. Mamm. Biol. 2014, 79, 338–348. [Google Scholar] [CrossRef]
- Carvalho, J.; Torres, R.T.; Acevedo, P.; Santos, J.P.V.; Barros, T.; Serrano, E.; Fonseca, C. Propagule Pressure and Land Cover Changes as Main Drivers of Red and Roe Deer Expansion in Mainland Portugal. Divers. Distrib. 2018, 24, 551–564. [Google Scholar] [CrossRef]
- Reimoser, F.; Putman, R. Impacts of Wild Ungulates on Vegetation: Costs and Benefits. In Ungulate Management in Europe Problems and Practices; Putman, R., Apollonio, M., Andersen, R., Eds.; Cambridge University Press: Cambridge, UK, 2011; pp. 144–191. ISBN 978-0-521-76059-1. [Google Scholar]
- Jarnemo, A.; Nilsson, L.; Wikenros, C. Home Range Sizes of Red Deer in Relation to Habitat Composition: A Review and Implications for Management in Sweden. Eur. J. Wildl. Res. 2023, 69, 92. [Google Scholar] [CrossRef]
- IBM Corp. Released 2021 IBM Corp. Released 2021. IBM SPSS Statistics for Windows, Version 28.0; IBM Corp: Armonk, NY, USA, 2021. [Google Scholar]
- Posit Team. RStudio: Integrated Development Environment for R. Posit Software; PBC: Boston, MA, USA, 2023; Available online: http://www.posit.co/ (accessed on 25 February 2024).
- Torres, R.T.; Santos, J.; Fonseca, C. Factors Influencing Red Deer Occurrence at the Southern Edge of Their Range: A Mediterranean Ecosystem. Mamm. Biol. 2014, 79, 52–57. [Google Scholar] [CrossRef]
- Ferreira, G.F.; Gonçalves, C.A.; Pinheiro, C.A.; Gomes, P.C.; Ilhéu, M.; Neves, N.; Ribeiro, N.; Santos, P. Plano Específico de Ordenamento Florestal Para o Alentejo; Universidade de Évora: Évora, Portugal, 2001. [Google Scholar]
- Pinto-Correia, T.; Mira-Potes, J. Livro Verde Dos. Montados; ICAAM—Instituto de Ciências Agrárias e Ambientais Mediterrânicas, Universidade de Évora: Évora, Portugal, 2013. [Google Scholar]
- Jost, L. Partitioning Diversity into Independent Alpha and Beta Components. Ecology 2007, 88, 2427–2439. [Google Scholar] [CrossRef] [PubMed]
- Janiszewski, P.; Cilulko-Dolega, J. Behavior and Spatial Use of Enclosures by Does and Fawns of Farmed Fallow Deer in Postnatal Period. J. Vet. Behav. 2019, 31, 5–9. [Google Scholar] [CrossRef]
- Jakes, A.F.; Jones, P.F.; Paige, L.C.; Seidler, R.G.; Huijser, M.P. A Fence Runs through It: A Call for Greater Attention to the Influence of Fences on Wildlife and Ecosystems. Biol. Conserv. 2018, 227, 310–318. [Google Scholar] [CrossRef]
- Xu, W.; Dejid, N.; Herrmann, V.; Sawyer, H.; Middleton, A.D. Barrier Behaviour Analysis (BaBA) Reveals Extensive Effects of Fencing on Wide-ranging Ungulates. J. Appl. Ecol. 2021, 58, 690–698. [Google Scholar] [CrossRef]
- Shaw, J.H. Introduction to Wildlife Management; McGraw-Hill, Inc.: New York, NY, USA, 1986. [Google Scholar]
- Acevedo, P.; Ruiz-Fons, F.; Vicente, J.; Reyes-García, A.R.; Alzaga, V.; Gortázar, C. Estimating Red Deer Abundance in a Wide Range of Management Situations in Mediterranean Habitats. J. Zool. 2008, 276, 37–47. [Google Scholar] [CrossRef]
- Vicente, J.; Höfle, U.; Fernández-De-Mera, I.G.; Gortazar, C. The Importance of Parasite Life History and Host Density in Predicting the Impact of Infections in Red Deer. Oecologia 2007, 152, 655–664. [Google Scholar] [CrossRef] [PubMed]
- Valente, A.; Valente, J.; Fonseca, C.; Torres, R. The Success of Species Reintroductions: A Case Study of Red Deer in Portugal Two Decades after Reintroduction. Int. J. Biodivers. Sci. Ecosyst. Serv. Manag. 2017, 13, 134–138. [Google Scholar] [CrossRef]
- Valente, A.M.; Acevedo, P.; Figueiredo, A.M.; Martins, R.; Fonseca, C.; Torres, R.T.; Delibes-Mateos, M. Dear Deer? Maybe for Now. People’s Perception on Red Deer (Cervus elaphus) Populations in Portugal. Sci. Total Environ. 2020, 748, 141400. [Google Scholar] [CrossRef]
- Carranza, J. Ciervo—Cervus elaphus. In En: Enciclopedia Virtual de los Vertebrados Españoles; Salvador, A., Barja, I., Eds.; Museo Nacional de Ciencias Naturales: Madrid, Spain, 2017; Available online: http://www.vertebradosibericos.org/ (accessed on 2 February 2024).
- Gebert, C.; Verheyden-Tixier, H. Variations of Diet Composition of Red Deer (Cervus elaphus) in Europe. Mamm. Rev. 2001, 31, 189–201. [Google Scholar] [CrossRef]
- Ramos, J.A.; Bugalho, M.N.; Cortez, P.; Iason, G.R. Selection of Trees for Rubbing by Red and Roe Deer in Forest Plantations. For. Ecol. Manag. 2006, 222, 39–45. [Google Scholar] [CrossRef]
- Monzón, A.; Vaz da Silva, S.; Manso, F.T. Integrating the Deer (Cervus elaphus) in the Portuguese Forests: Impacts and New Challenges for Forest Certification. For. Ecol. Manag. 2012, 267, 1–6. [Google Scholar] [CrossRef]
- Duarte, J.; Farfán, M.A.; Fa, J.E.; Vargas, J.M. Deer Populations Inhabiting Urban Areas in the South of Spain: Habitat and Conflicts. Eur. J. Wildl. Res. 2015, 61, 365–377. [Google Scholar] [CrossRef]
- Ferretti, F.; Lovari, S.; Mancino, V.; Burrini, L.; Rossa, M. Food Habits of Wolves and Selection of Wild Ungulates in a Prey-Rich Mediterranean Coastal Area. Mamm. Biol. 2019, 99, 119–127. [Google Scholar] [CrossRef]
- Simard, M.A.; Dussault, C.; Huot, J.; Côté, S.D. Is Hunting an Effective Tool to Control Overabundant Deer? A Test Using an Experimental Approach. J. Wildl. Manag. 2013, 77, 254–269. [Google Scholar] [CrossRef]
- Torres-Porras, J.; Carranza, J.; Pérez-González, J.; Mateos, C.; Alarcos, S. The Tragedy of the Commons: Unsustainable Population Structure of Iberian Red Deer in Hunting Estates. Eur. J. Wildl. Res. 2014, 60, 351–357. [Google Scholar] [CrossRef]
- Hardin, G. The Tragedy of the Commons. American. Science 1968, 162, 1243–1248. [Google Scholar] [CrossRef]
- Jordan, A.J.; Wurzel, R.; Zito, A. New Instruments for Environmental Governance; FranKk Cass: London, UK, 2003. [Google Scholar]
- Vedung, E. Policy Instruments: Typologies and Theories. In Carrots, Sticks and Sermons; Bemelmans-Videc, M.L., Rist, R.C., Vedung, E., Eds.; Routledge: New York, NY, USA, 2017; pp. 21–58. [Google Scholar]
- Federation Departementale des chasseurs des Vosges. 3° Schema Departamental de Gestion Cynegetique Des Vosges Période 2022–2028; La Voivre: Vosges, France, 2022. [Google Scholar]
- Godinho, S.; Mestre, F.; Ferreira, J.P.; Machado, R.; Santos, P. Effectiveness of habitat management in the recovery of low-density populations of wild rabbit. Eur. J. Wid Res. 2013, 59, 847–858. [Google Scholar] [CrossRef]


| Typology | Number of Management Units | Number of Management Units Negatively Impacted by Damage | HSI | GBR/100 ha | Area ha |
|---|---|---|---|---|---|
| Tourism | 21 (60.0%) | 10 (71.4%) | 0.64 | 2.38 | 791 |
| Associative | 6 (17.1%) | 1 (7.1%) | 0.63 | 0.08 | 722 |
| Municipal | 8 (22.9%) | 3 (21.4%) | 0.57 | 0.03 | 729 |
| Total | 35 (100%) | 14 (100%) | |||
| Open/fenced | |||||
| Open | 30 (85.7%) | 14 (100%) | 0.61 | 0.47 | 779 |
| Fenced | 5 (14.3%) | 0 (0%) | 0.64 | 3.89 | 695 |
| Total | 35 (100%) | 14 (100%) |
| Models | R | R2 | R2 Adjusted | SE | Durbin-Watson |
|---|---|---|---|---|---|
| 1 | 0.296 a | 0.088 | 0.076 | 2.593 | |
| 2 | 0.391 b | 0.153 | 0.132 | 2.513 | |
| 3 | 0.445 c | 0.198 | 0.168 | 2.461 | |
| 4 | 0.501 d | 0.251 | 0.212 | 2.394 | |
| 5 | 0.478 e | 0.229 | 0.199 | 2.414 | 1.777 |
Disclaimer/Publisher’s Note: The statements, opinions and data contained in all publications are solely those of the individual author(s) and contributor(s) and not of MDPI and/or the editor(s). MDPI and/or the editor(s) disclaim responsibility for any injury to people or property resulting from any ideas, methods, instructions or products referred to in the content. |
© 2024 by the authors. Licensee MDPI, Basel, Switzerland. This article is an open access article distributed under the terms and conditions of the Creative Commons Attribution (CC BY) license (https://creativecommons.org/licenses/by/4.0/).
Share and Cite
Bicho, C.; Machado, R.; Alpizar-Jara, R.; Santos, P. Planning for Deer-Hunting Management at the Local and Regional Scales: Reconciling Economic, Social and Ecological Functions. Land 2024, 13, 525. https://doi.org/10.3390/land13040525
Bicho C, Machado R, Alpizar-Jara R, Santos P. Planning for Deer-Hunting Management at the Local and Regional Scales: Reconciling Economic, Social and Ecological Functions. Land. 2024; 13(4):525. https://doi.org/10.3390/land13040525
Chicago/Turabian StyleBicho, Cláudio, Rui Machado, Russell Alpizar-Jara, and Pedro Santos. 2024. "Planning for Deer-Hunting Management at the Local and Regional Scales: Reconciling Economic, Social and Ecological Functions" Land 13, no. 4: 525. https://doi.org/10.3390/land13040525