Article

Research on the Impact of Climate Change and Human Activities on the NDVI of Arid Areas—A Case Study of the Shiyang River Basin

1
State Key Laboratory of Simulation and Regulation of Water Cycle in River Basin, China Institute of Water Resources and Hydropower Research, Beijing 100038, China
2
State Key Laboratory of Hydraulic Engineering Simulation and Safety, Tianjin University, Tianjin 300072, China
*
Author to whom correspondence should be addressed.
Land 2024, 13(4), 533; https://doi.org/10.3390/land13040533
Submission received: 22 March 2024 / Revised: 8 April 2024 / Accepted: 15 April 2024 / Published: 17 April 2024

Abstract

:
Arid zone ecosystems, integral to terrestrial systems, exhibit relatively low stability and are prone to influences from human activities and climate change. To elucidate the influence on the ecological environment of the arid zone by climate change and human activities, the paper takes normalized difference vegetation index (NDVI) as an evaluation index of the ecosystem and uses trend analysis to evaluation of NDVI variation characteristics in the Shiyang River Basin (SRB) from 1990 to 2020. Simultaneously using methods such as partial correlation analysis and residual analysis to evaluate the impact of climate change and human activities on NDVI changes. This study yielded several key findings: (1) The NDVI in the SRB exhibits an increasing trend of 0.034/10a in the interannual variation. (2) The relation cooperatives between NDVI and the deviation of precipitation and temperature in the SRB range from −0.735 to 0.770 and −0.602 to 0.773, respectively. (3) The changes in land use and groundwater depth in the SRB have a certain impact on NDVI changes. (4) The proportion of areas with significant contributions (contribution rate greater than 60%) from climate change and human activities to NDVI change is 33.5% and 22.5%, respectively.

1. Introduction

Vegetation, as a link between soil [1], water, and atmosphere, plays an vital role in regulating the water–carbon balance [2], material and energy exchange [3], climate change (CC), and maintaining the stability of ecosystems [4]. Vegetation stands out as a vital component in ecosystems, as well as a significant role in global CC. Especially in arid zones, vegetation is of great significance in effectively preventing desertification, maintaining oasis ecosystems, and keeping regional ecosystems stable. In the inland river basins of arid regions in China, vegetation growth is an important factor in maintaining basin stability. The Shiyang River Basin (SRB), as one of the three major inland rivers in arid areas of China, is situated between the Badain Jaran Desert and the Tengger Desert, effectively preventing the convergence of the two major deserts. It has formed a natural ecological barrier between these two deserts, playing a vital role in eco-protection [5]. Plant growth in the SRB plays a vital role in averting desertification and halting the encroachment of the two deserts [6]. Consequently, to effectively assess regional ecosystem status and stability, vegetation monitoring has increased. With advancements in remote sensing technology, numerous studies now use high-resolution, long-term data to analyze vegetation changes [7,8]. The normalized difference vegetation index (NDVI), a quantitative indicator that characterizes the condition of vegetation growth and coverage, has been an important tool for analyzing the dynamic history of vegetation change, monitoring the current situation and predicting the future [9,10]. Therefore, using remote sensing technology to monitor and analyze regional NDVI has become a mainstream research method at present.
Vegetation growth is usually influenced by regional environmental conditions. CC, such as precipitation and temperature [11,12], as well as human activities (HA), including land-use and land-cover change (LUCC) and groundwater [13,14,15], significantly affect the dynamics of vegetation. A considerable proportion of current research concentrates on global vegetation changes and factors influencing them [16,17], and with specific attention to regions like China and its semi-arid areas [15,18,19].
CC, population increases, agriculture, and LUCC have emerged as key factors affecting global vegetation change [16,20,21,22,23,24]. The studies reveal a close connection between vegetation growth and precipitation [25,26], particularly in arid regions where NDVI positively correlates with precipitation, displaying spatial consistency. Additionally, NDVI changes are influenced by temperature [11]. In arid areas, the association between NDVI and temperature is weaker compared to that with precipitation [27,28]. A growing body of research is examining how HA affect vegetation beyond CC [29,30]. The intensified impact of HA is primarily observed in land-use changes resulting from urbanization and farmland expansion [31,32], as well as alterations in groundwater depth (GD) due to HA. LUCC contribute directly to shifts in regional vegetation status, influencing NDVI. Furthermore, over-exploitation of groundwater lead to decreased GD, indirectly affecting vegetation growth. The GD is crucial for vegetation water use, influencing both plant root growth and water use efficiency. Maintaining a reasonable GD is essential for healthy vegetation growth, as an excessive increase can disrupt the environment for plant growth.
In light of the significant role that HA and CC play in dynamic vegetation changes, quantifying their impact is crucial in understanding their driving mechanisms [33,34]. It is possible to effectively solve this problem by using residual analysis methods, which can quantify the contribution of CC and HA to vegetation variance [35,36,37]. While research on the influences of CC and HA on NDVI in arid zones abound [29,38], it is often LUCC that is considered when considering the contributions of HA [39,40]. Unfortunately, the impacts of changes in GD resulting from HA are frequently overlooked in arid zones [41]. In regions with low precipitation, GD becomes a crucial variable determining vegetation establishment and mortality [42]. Additionally, GD, influenced by the recharge of shallow aquifers from vegetation transpiration and ecological diversion contributions, plays a non-negligible role in influencing NDVI changes. Groundwater, as a vital factor for vegetation growth [43,44], further contributes to the overall dynamics of NDVI.
To thoroughly examine the trends and influencing factors of NDVI in the SRB over the last three decades, this study is on account of the NDVI data of the SRB, precipitation and temperature data, LUCC data and the groundwater monitoring, and addresses four main questions: (1) Trends of NDVI in SRB in the last 30 years. (2) The correlation between temperature and precipitation on NDVI changes in the SRB. (3) The relationship between HA and NDVI changes, especially the impacts of changes in LUCC and groundwater depth on NDVI. (4) Contribution and spatial distribution of CC and HA to NDVI change.

2. Materials and Methods
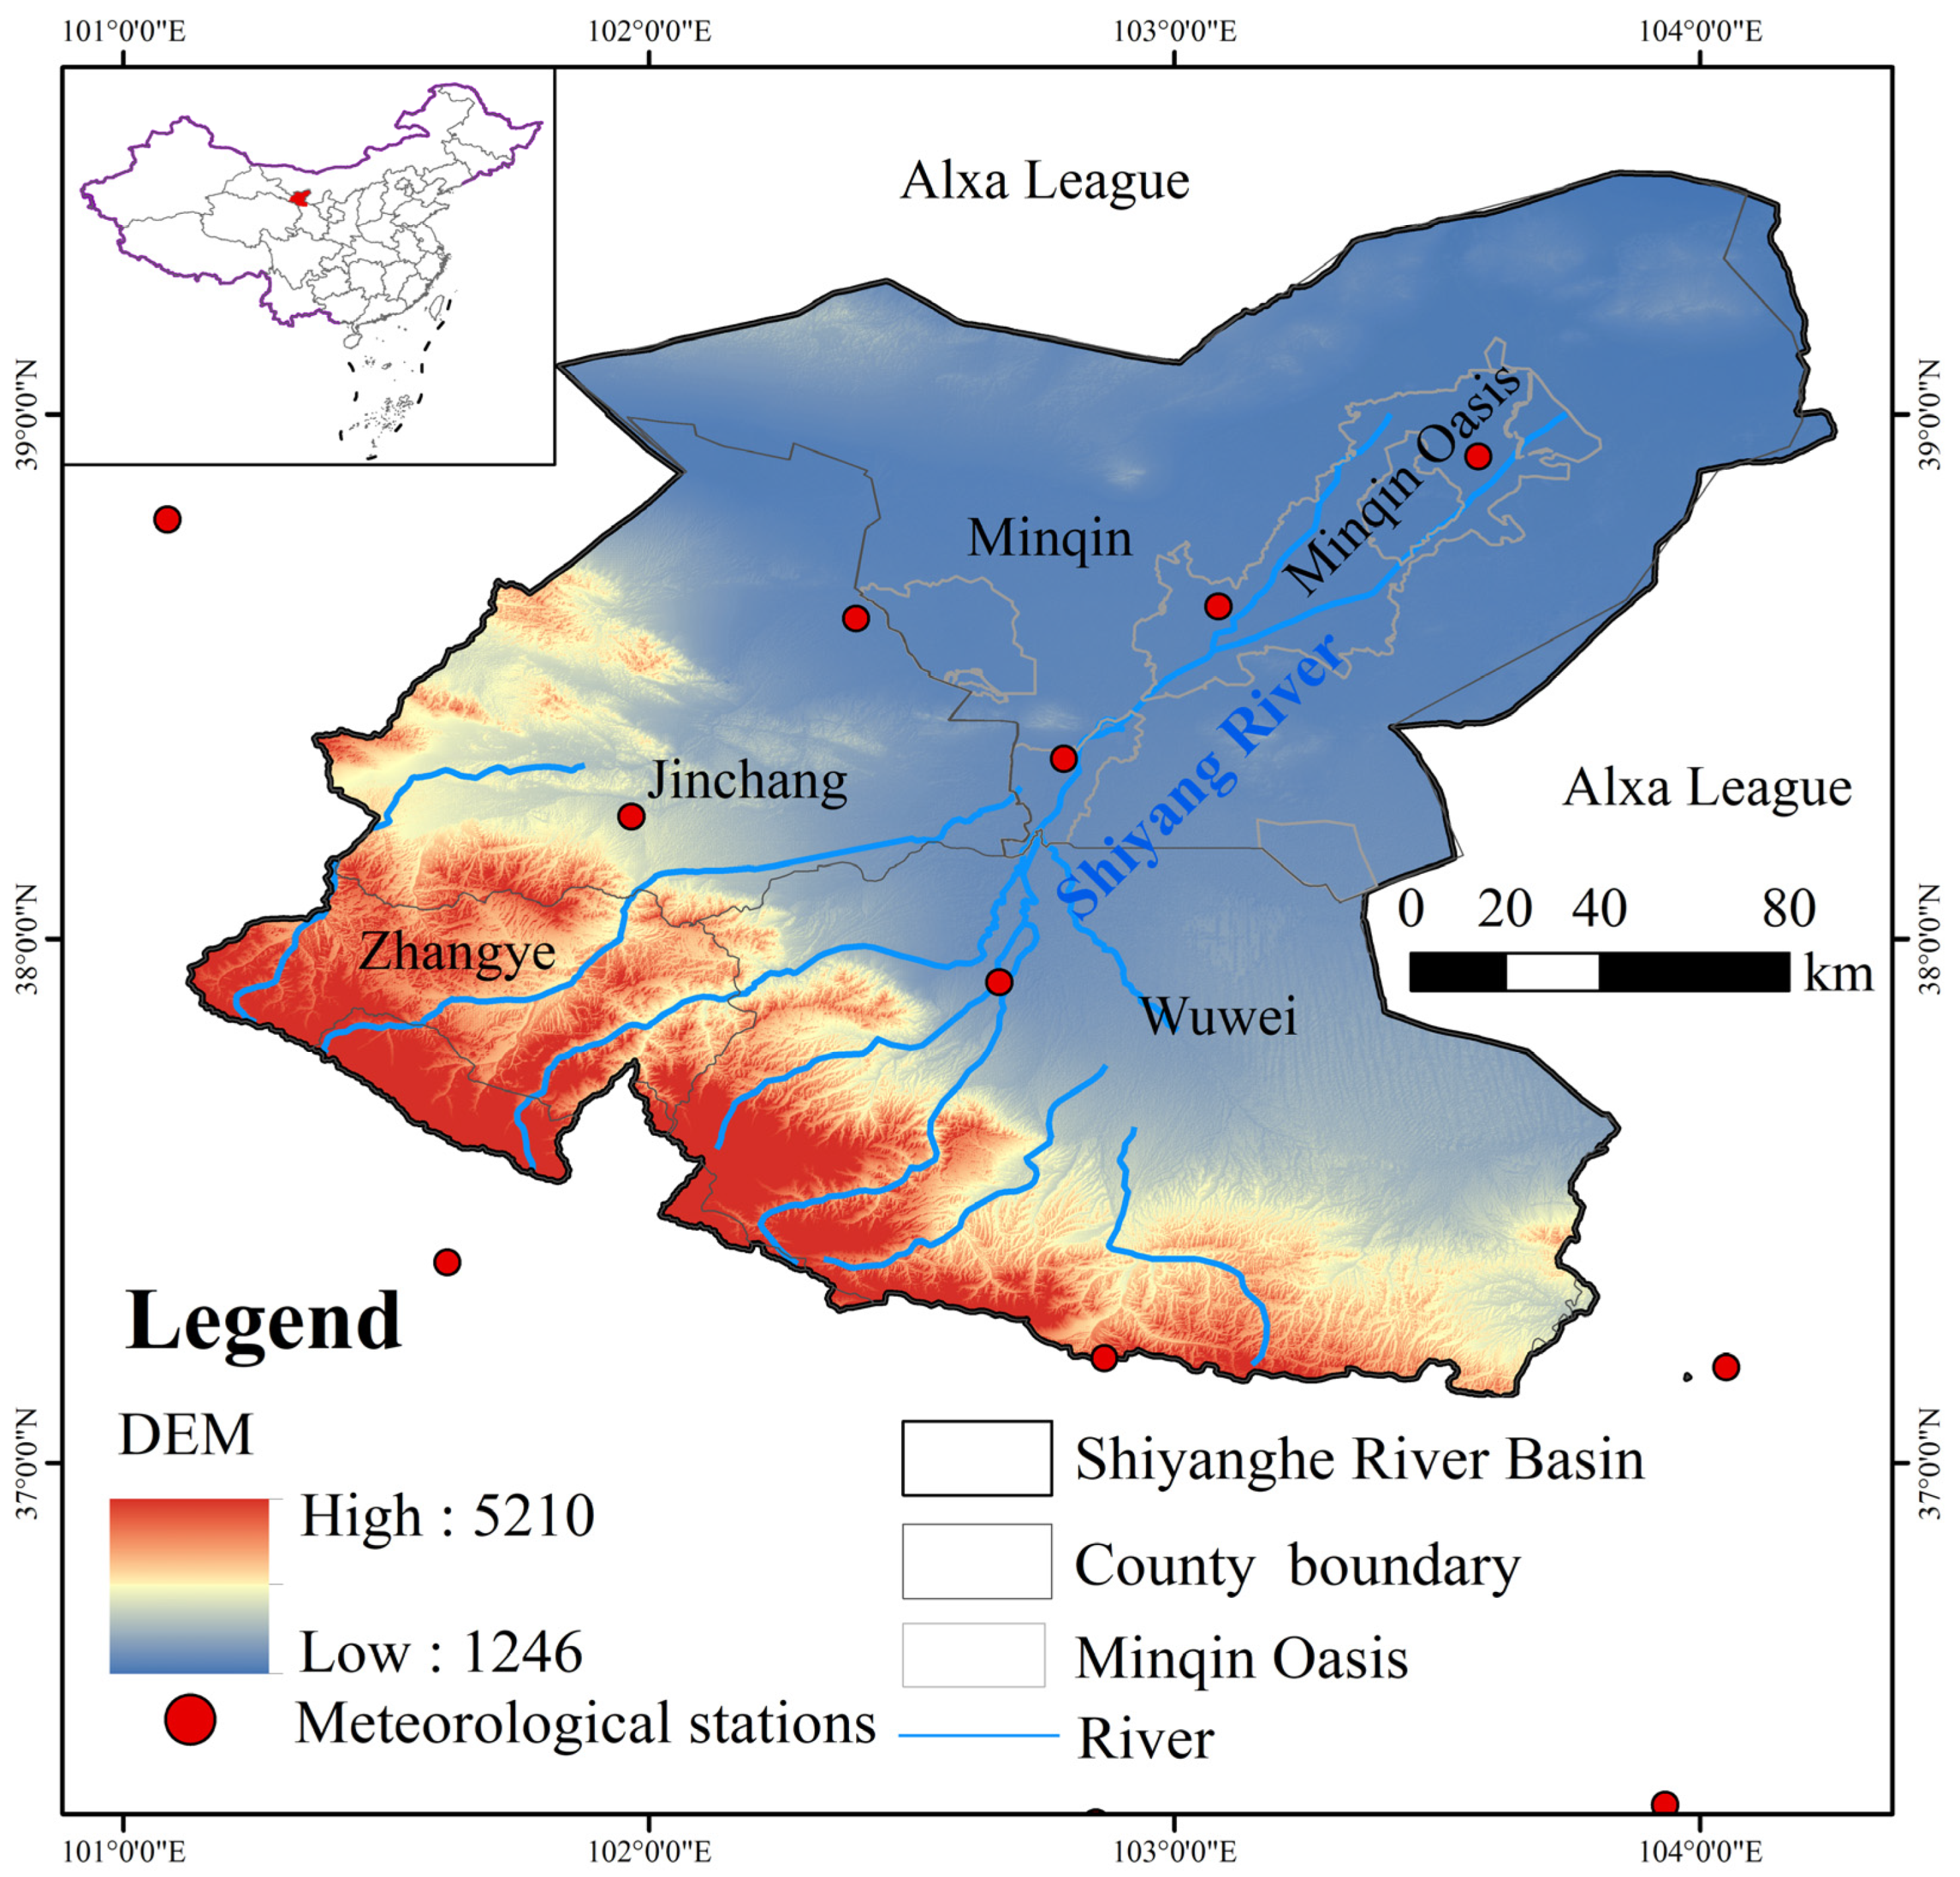
2.1. Study Area

The SRB is situated in central Gansu Province, northwestern China, spanning 101°41′ E–104°16′ E and 36°29′ N–39°27′ N (Figure 1). The Shiyang River, Gansu Province’s third-largest inland river in the Hexi Corridor, is positioned between the Badain Jaran Desert and Tengger Deserts. The total area of the SRB is approximately 41,600 km2 [45]. The altitude of the SRB gradually decreases from south to north, and the rainfall has the same changing characteristics. The average annual rainfall in the upper regions reaches 600 mm, while the average annual rainfall in the lower regions is only 50 mm. The evaporation varies from 700 to 2600 mm from south to north. The SRB area has a concentrated population with high density, primarily engaged in irrigated agriculture and heavily reliant on groundwater. The excessive exploitation and utilization of water resources has led to the deterioration of aquatic ecosystems, degradation of water quality, and disruption of ecological balance, which have become urgent problems to be solved [46]. Intensive HA in the SRB have contributed to vegetation degradation and land desertification.

2.2. Data

(1)
NDVI data spanning 1990–2020, derived from Landsat 5 Thematic Mapper (TM) and Landsat 8 Operational Land Imager (OLI), was employed in the study.
(2)
The study acquired daily precipitation and temperature data (1990–2020) from eight meteorological stations near the study and sourced from the website: http://www.cma.gov.cn (accessed on 12 May 2023). Additionally, China’s 1 km resolution monthly precipitation dataset (1901–2022) and average air temperature dataset (1901–2022), released by the National Scientific Data Center for the Tibetan Plateau (NSCDPT), were obtained for the same period [47,48].
(3)
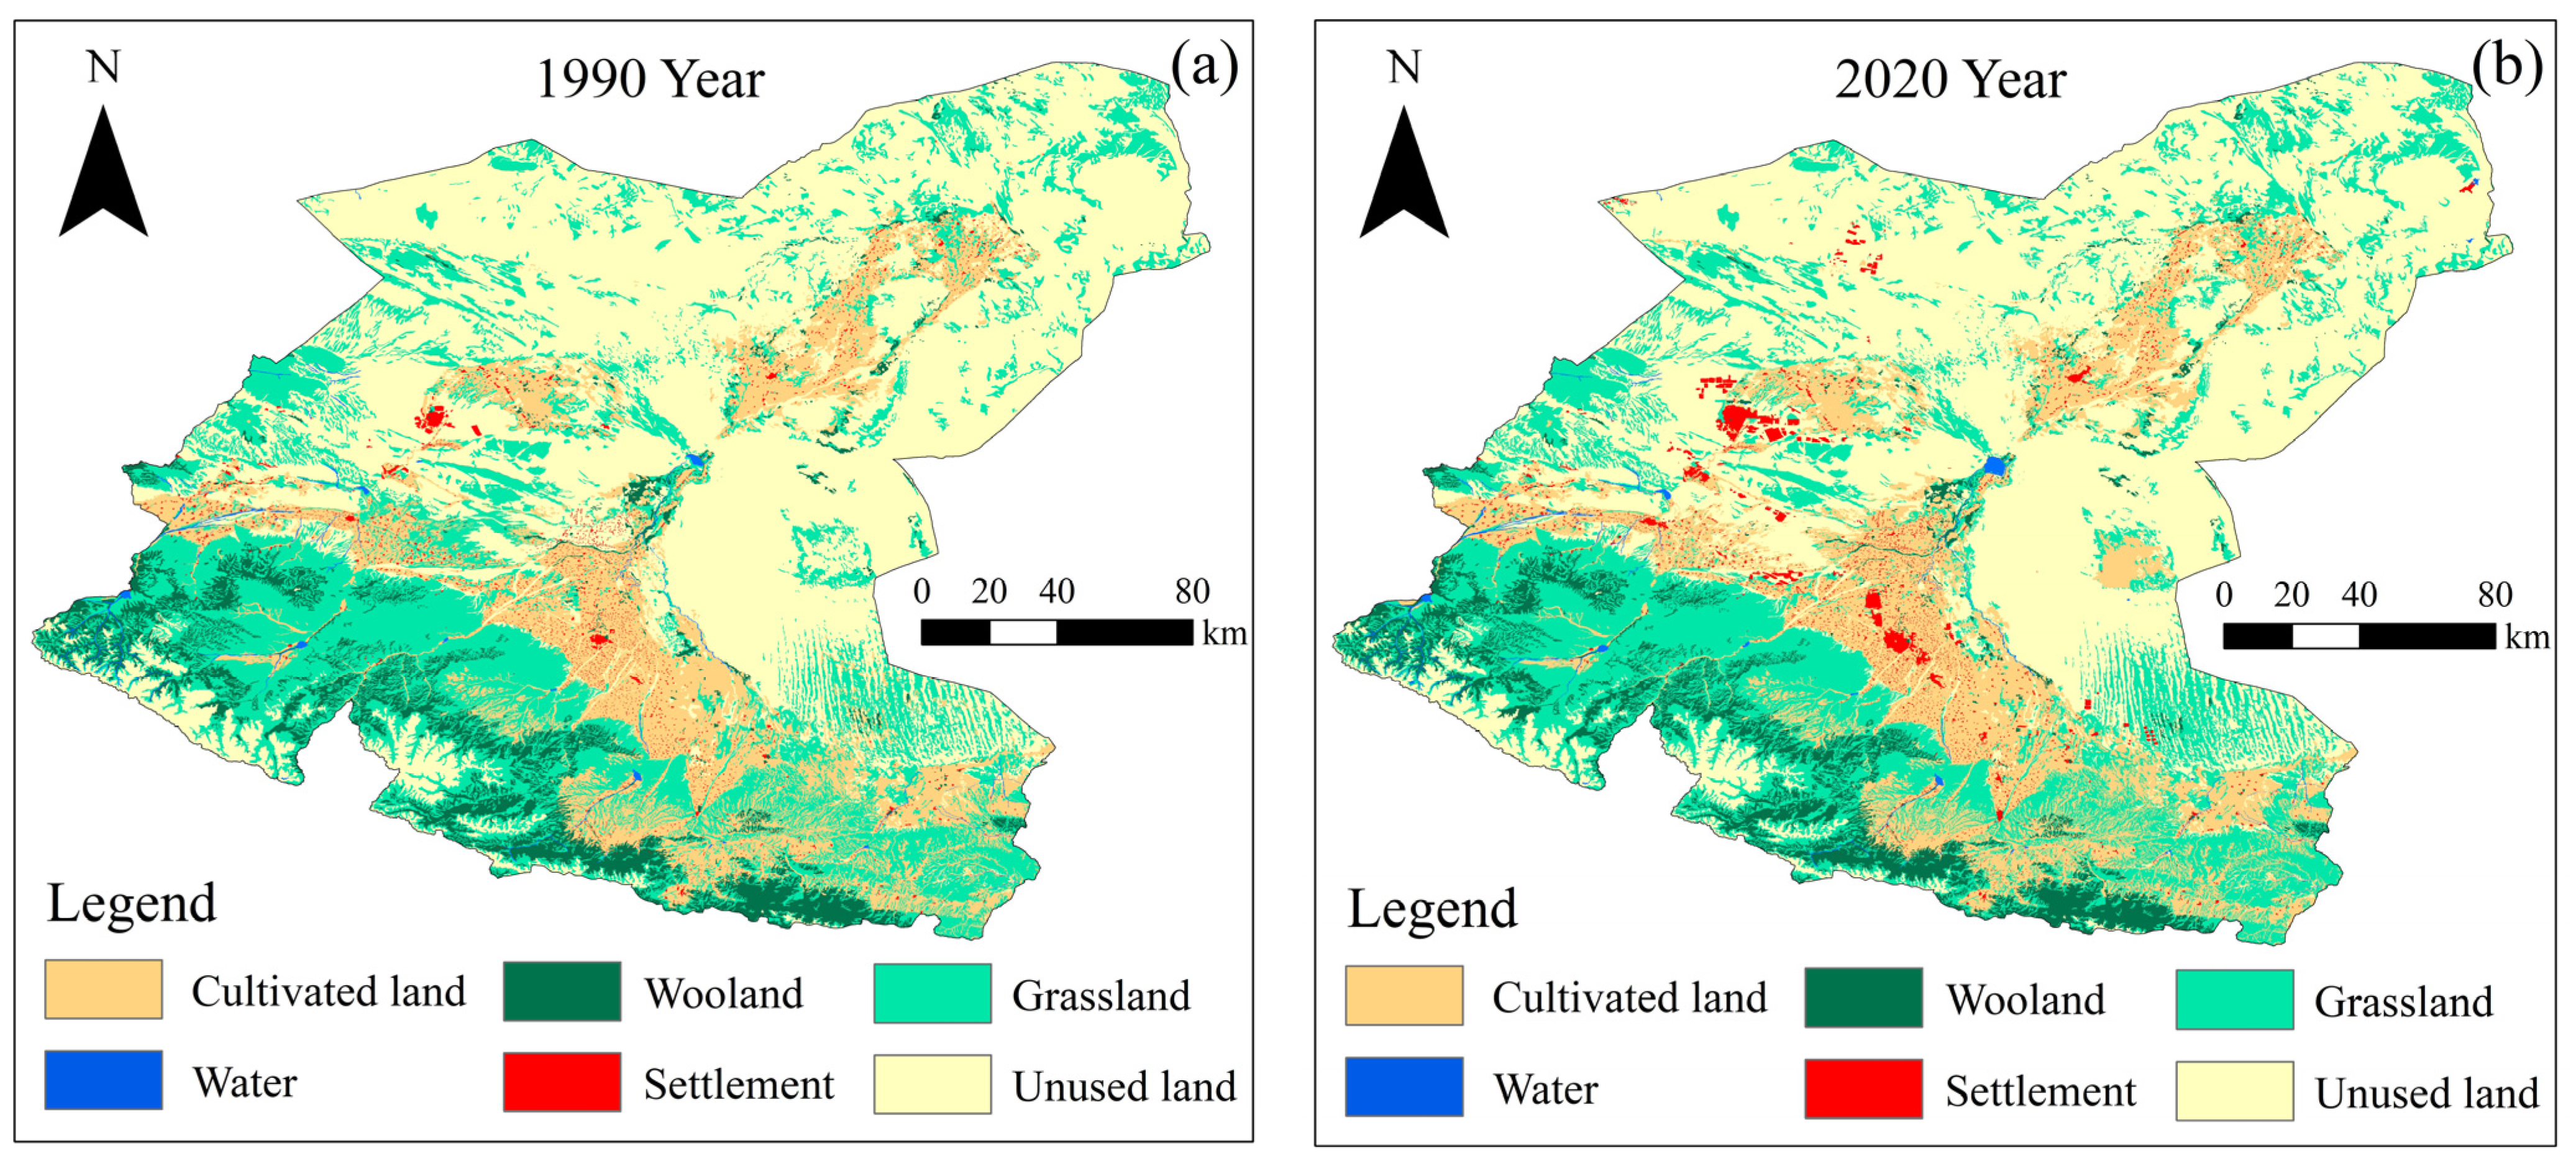
SRB’s LUCC data at 30 m spatial resolution from 1990 to 2020, sourced from the website: http://www.resdc.cn (accessed on 20 May 2023).
(4)
Monthly measurement data from 73 machine wells in the lower SRB (1999–2018) were acquired in the study to depict GD changes in the lower SRB oasis spanning the past 20 years.

2.3. Methods

2.3.1. Data Processing

The NDVI is an index that can assess and monitor surface vegetation conditions through satellite remote sensing data. NDVI is usually calculated using the red (RED) and near-infrared (NIR) bands [49]. The formula is as follows:
NDVI = (NIRRED)/(NIR + RED)
For further analysis, the annual NDVI value for each pixel is acquired using the maximum value synthesis technique

2.3.2. NDVI Trend Analysis

The Mann–Kendall (MK) test can be used to analyze trends and changes in climate, hydrology, environment in time series data [50,51,52]. The study used slope values to analyze changes in NDVI trends [53]:
S l o p e = M e d i a n x j x i j i , j > i
Based on the raster scale, the slope of NDVI in SRB from 1990 to 2020 was measured by using the Slope estimation method, and the Slope represents the average rate of change and trend of NDVI. When Slope > 0, the series shows an increasing trend.

2.3.3. Partial Correlation Analysis

The partial correlation coefficient can be used to test conditional independence, and is utilized in this study to depict the connection between NDVI and precipitation (temperature) after controlling temperature (precipitation). The formula is as follows [54]:
R a b ( c ) = R a b R a c R b c 1 R a c 2 1 R b c 2
where a, b, and c represent NDVI, temperature, and precipitation, respectively, and Rab(c) represents the bias correlation coefficient of NDVI and temperature.

2.3.4. Relative Contribution Analysis

Residual analysis, frequently employed in vegetation change attribution studies, quantitatively assesses the influence of both CC and HA on vegetation dynamics [55,56]. This study analyzes the impact of CC on NDVI changes using precipitation and temperature as factors [57]. Additionally, it quantifies the contribution of HA to NDVI changes using the following formula:
N D V I P = α × T + β × P + γ N D V I H = N D V I O N D V I P
where NDVIO, NDVIP, and NDVIH represent the observed value, predicted values under CC, and predicted values under HA, respectively. α, β, and γ represent the model parameters. T and P represent temperature and precipitation. The specific calculation method is shown in Table 1.

3. Results

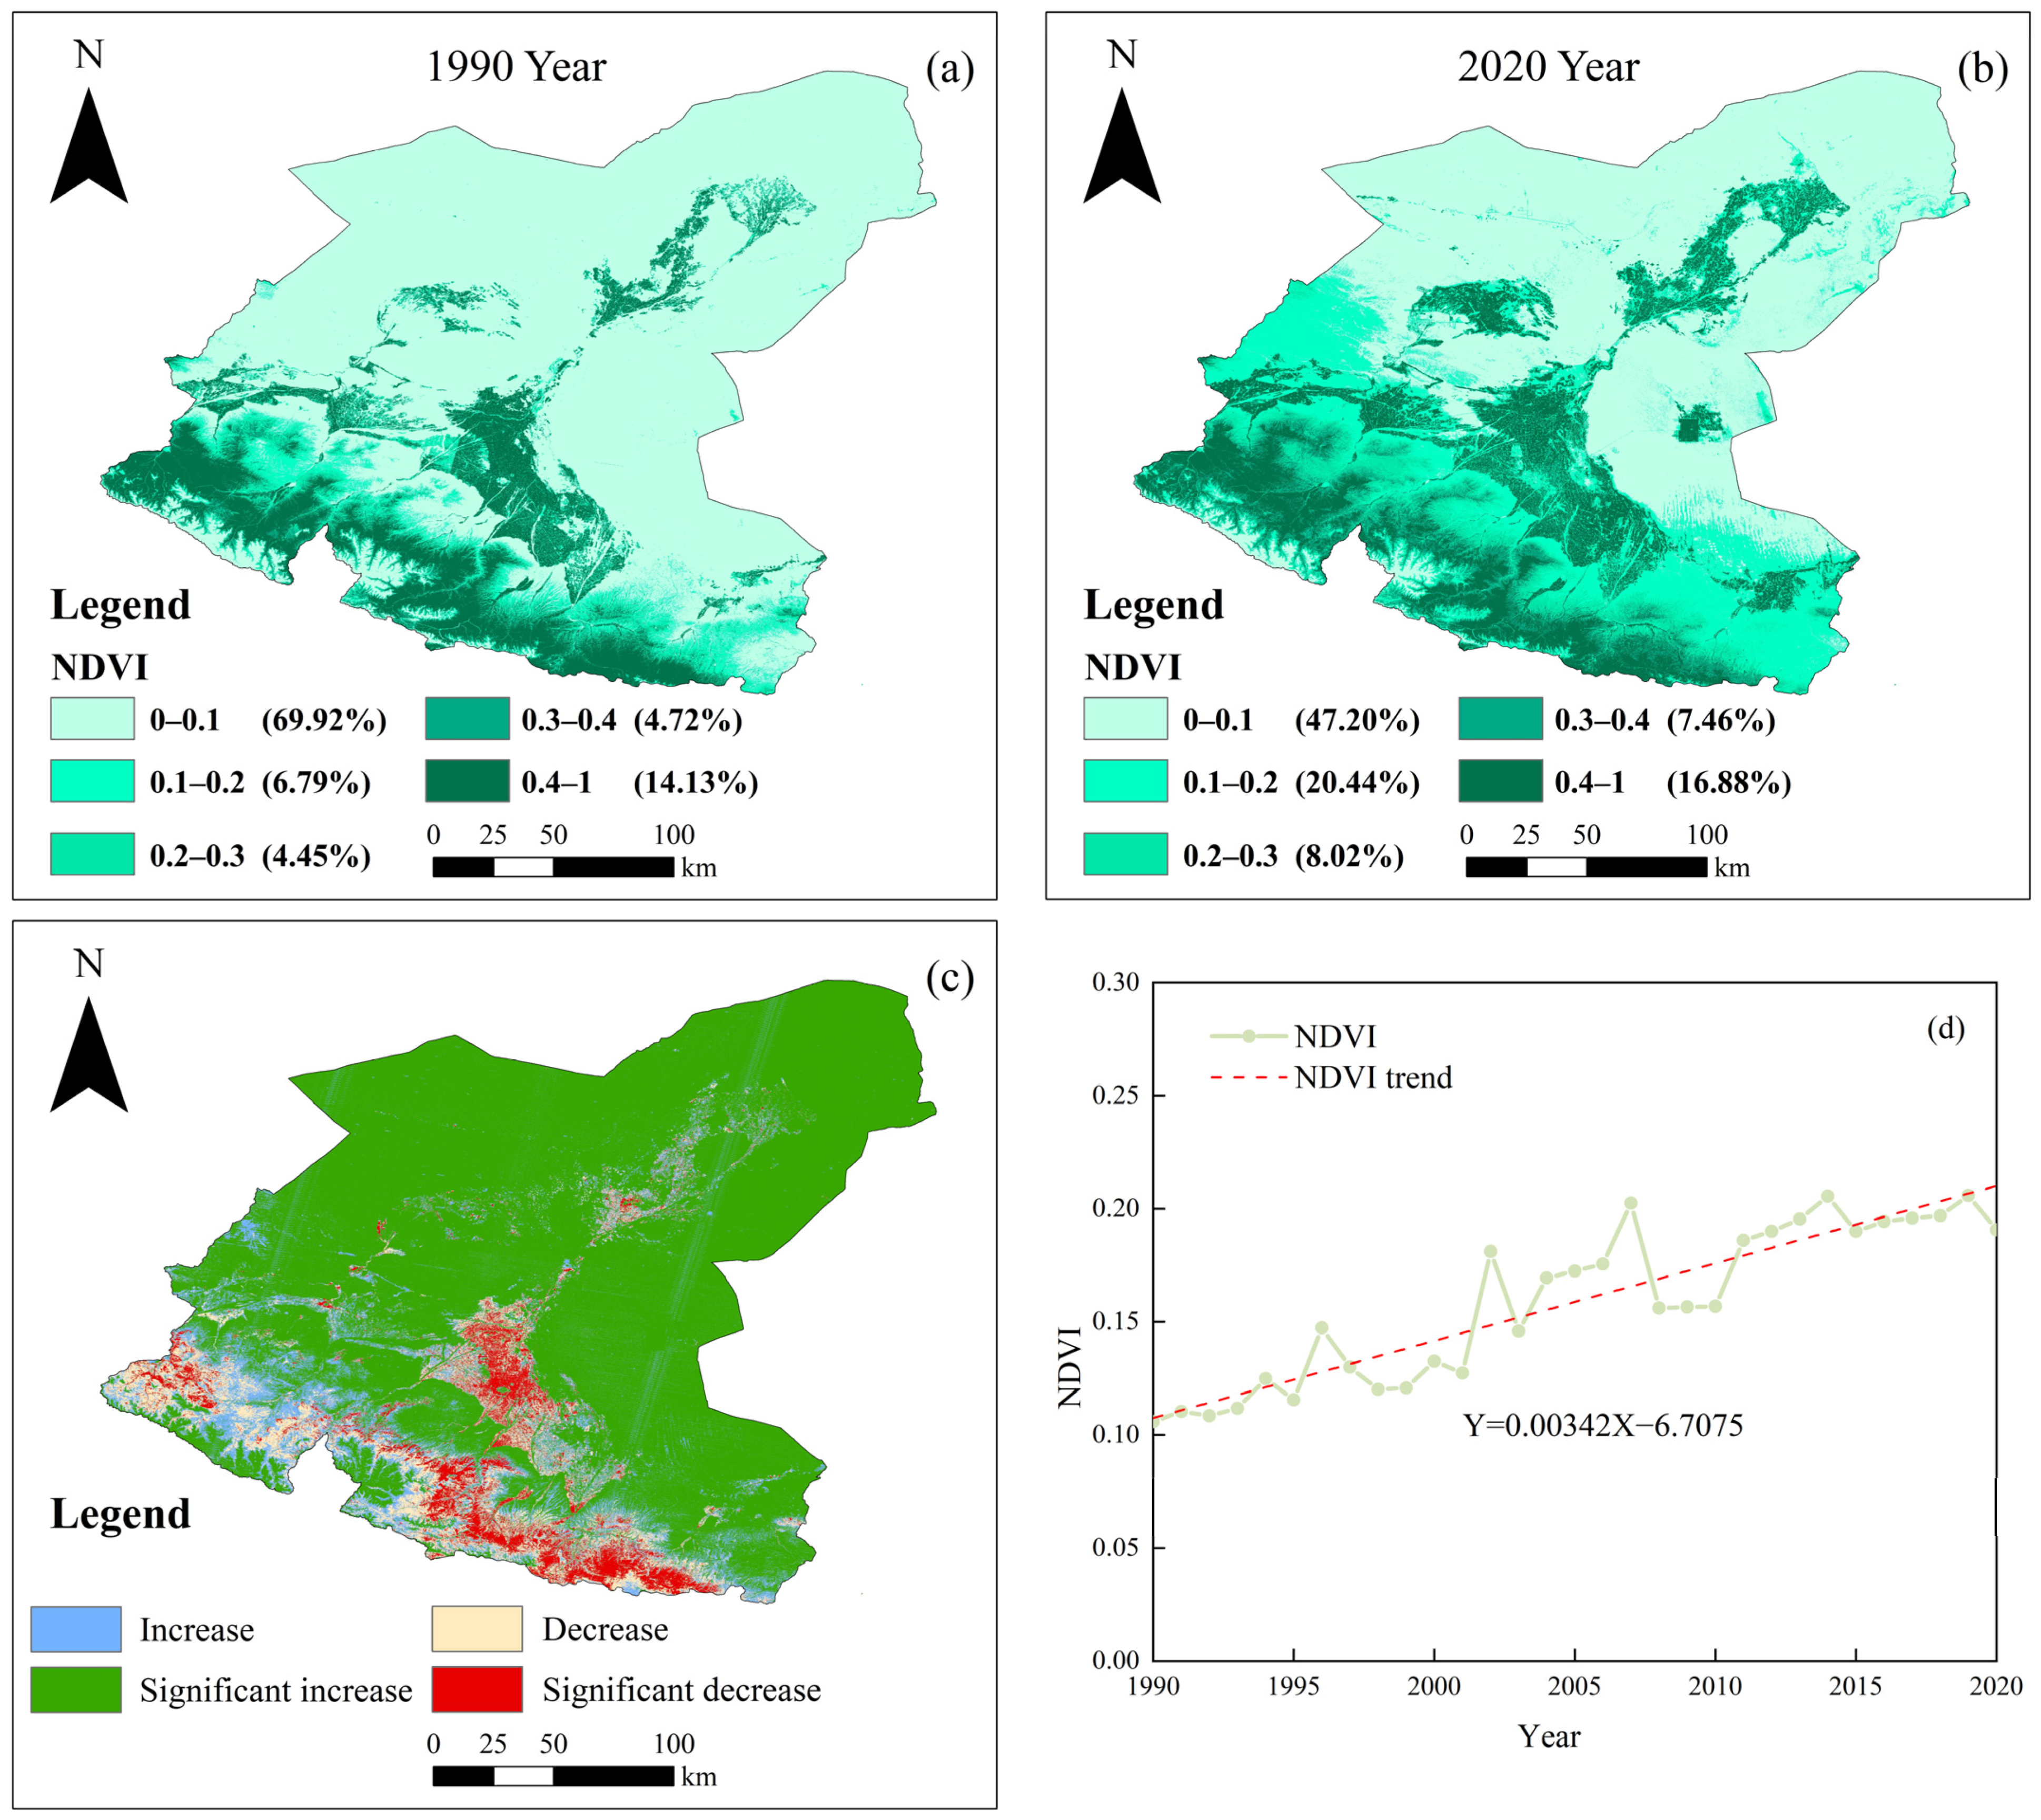
3.1. Characteristics of Spatial and Temporal Variations in NDVI

The NDVI changed significantly from 1990–2020 in the SRB (Figure 2). Spatially, the NDVI shows progressive downward tendency from the southwest upstream to the northeast downstream direction. The upper reaches of the SRB extend into the Qilian Mountains, featuring predominantly forest and grassland vegetation that contributes to extensive coverage. Conversely, the downstream region is primarily characterized by the Minqin Oasis and surrounding desert areas, exhibiting sparse vegetation and a low NDVI.
Analyzing the proportion of NDVI in the SRB in 1990 and 2020, the proportion of NDVI (0–0.1) decreased significantly from 69.92% in 1990 to 47.20% in 2020, while the proportion of NDVI (0.1–0.2) increased significantly from 6.79% in 1990 to 20.44% in 2020, and other NDVI intervals also increased. Analyzing the NDVI trend in 1990–2020 (Figure 2c), the proportion of NDVI-increasing areas in the SRB is as high as 86.4%, with 74.3% of the areas significantly increasing, mainly in the middle and lower regions. The proportion of NDVI-decreasing areas is 13.6%, with 5% significantly decreasing, mainly in the middle regions in the Liangzhou District of Wuwei City and the southern part influenced by HA, where vegetation ecology deteriorated and NDVI decreased.
In terms of inter-annual changes (Figure 2d), the NDVI of SRB increased from 0.106 in 1990 to 0.19 in 2020, showing a gradual growth tendency of 0.034/10a.

3.2. Relationship between NDVI and Climate Change

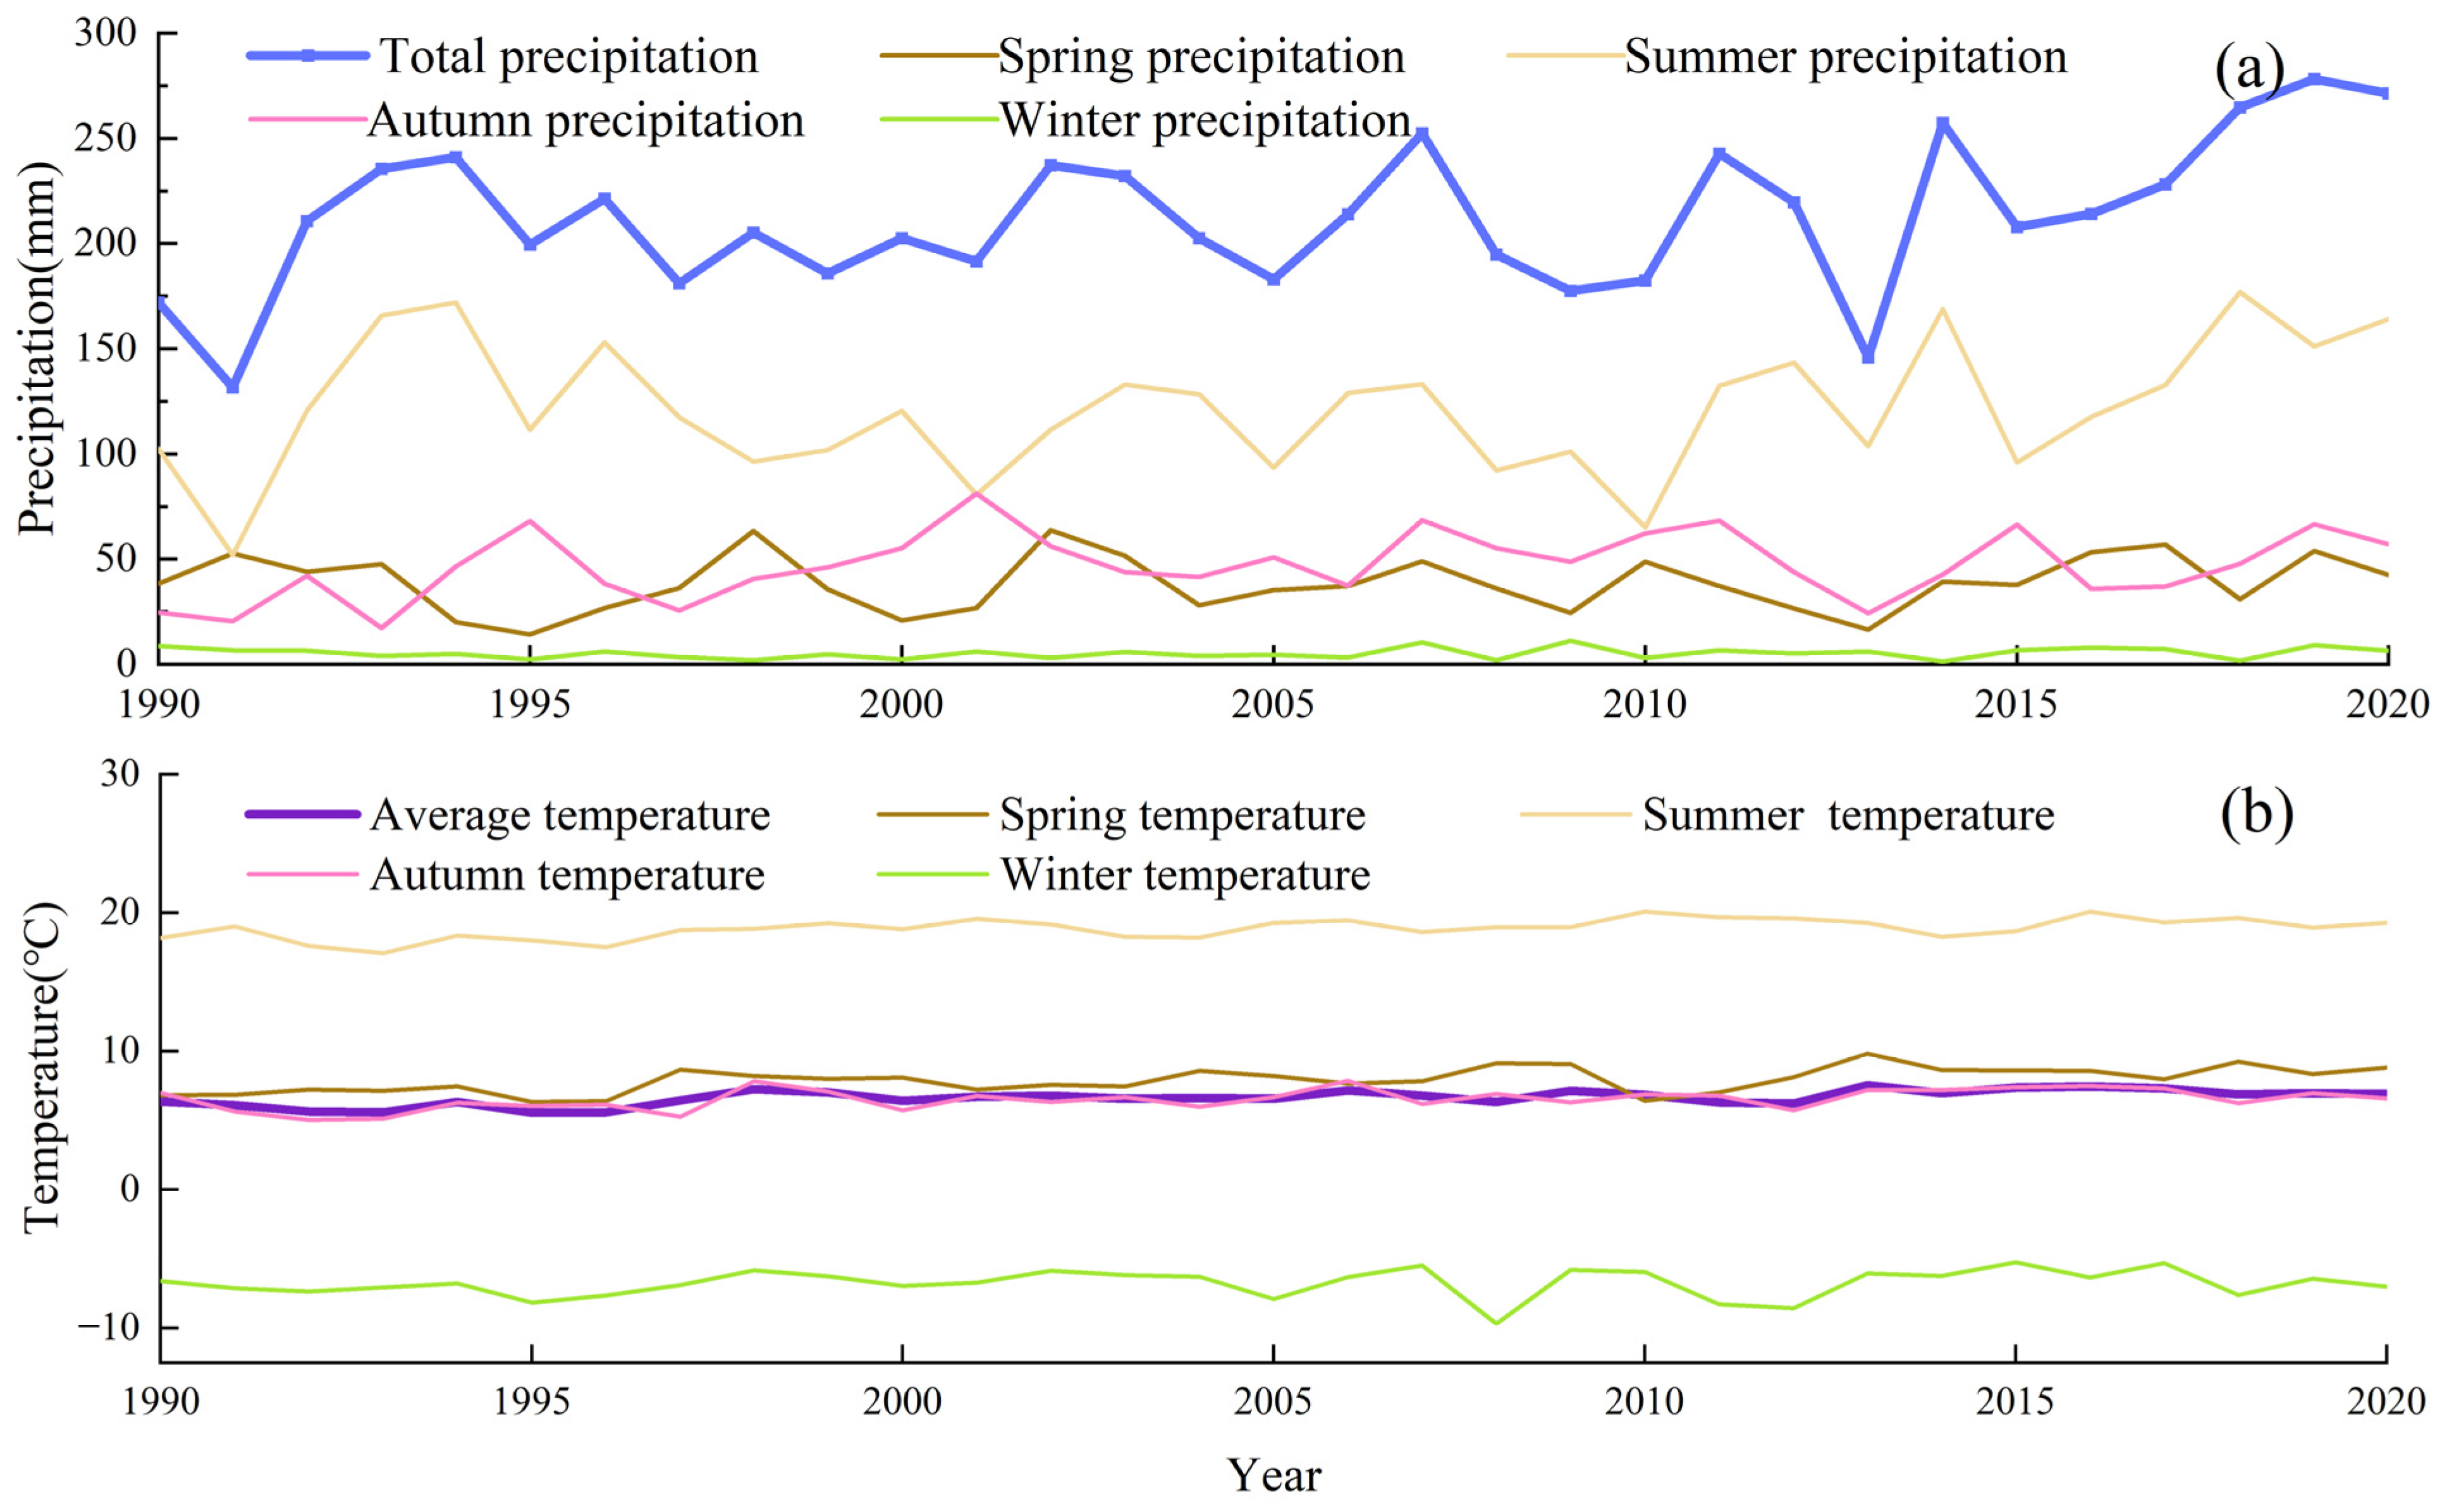
3.2.1. Changes in Precipitation and Temperature

Precipitation in the SRB has generally exhibited an upward trend in the last 30 years (Figure 3a). The average annual precipitation is 212.4 mm, and seasonal variations are significant, with summer contributing 57.2% of the annual precipitation, followed by fall with 22.2%. The average values for spring, summer, fall, and winter rainfall in the past 30 years were 38.6 mm, 121.5 mm, 47.1 mm, and 5.3 mm, respectively.
Temperature changes in the SRB have been relatively stable (Figure 3b). The multi-year average temperature is maintained between 5.5–7.5 °C. There is a notable temperature difference between the seasons, with summer having the highest average at 18.9 °C and winter the lowest at −6.76 °C. The average temperatures in spring and summer are close, with values of 7.9 °C and 6.5 °C, respectively.

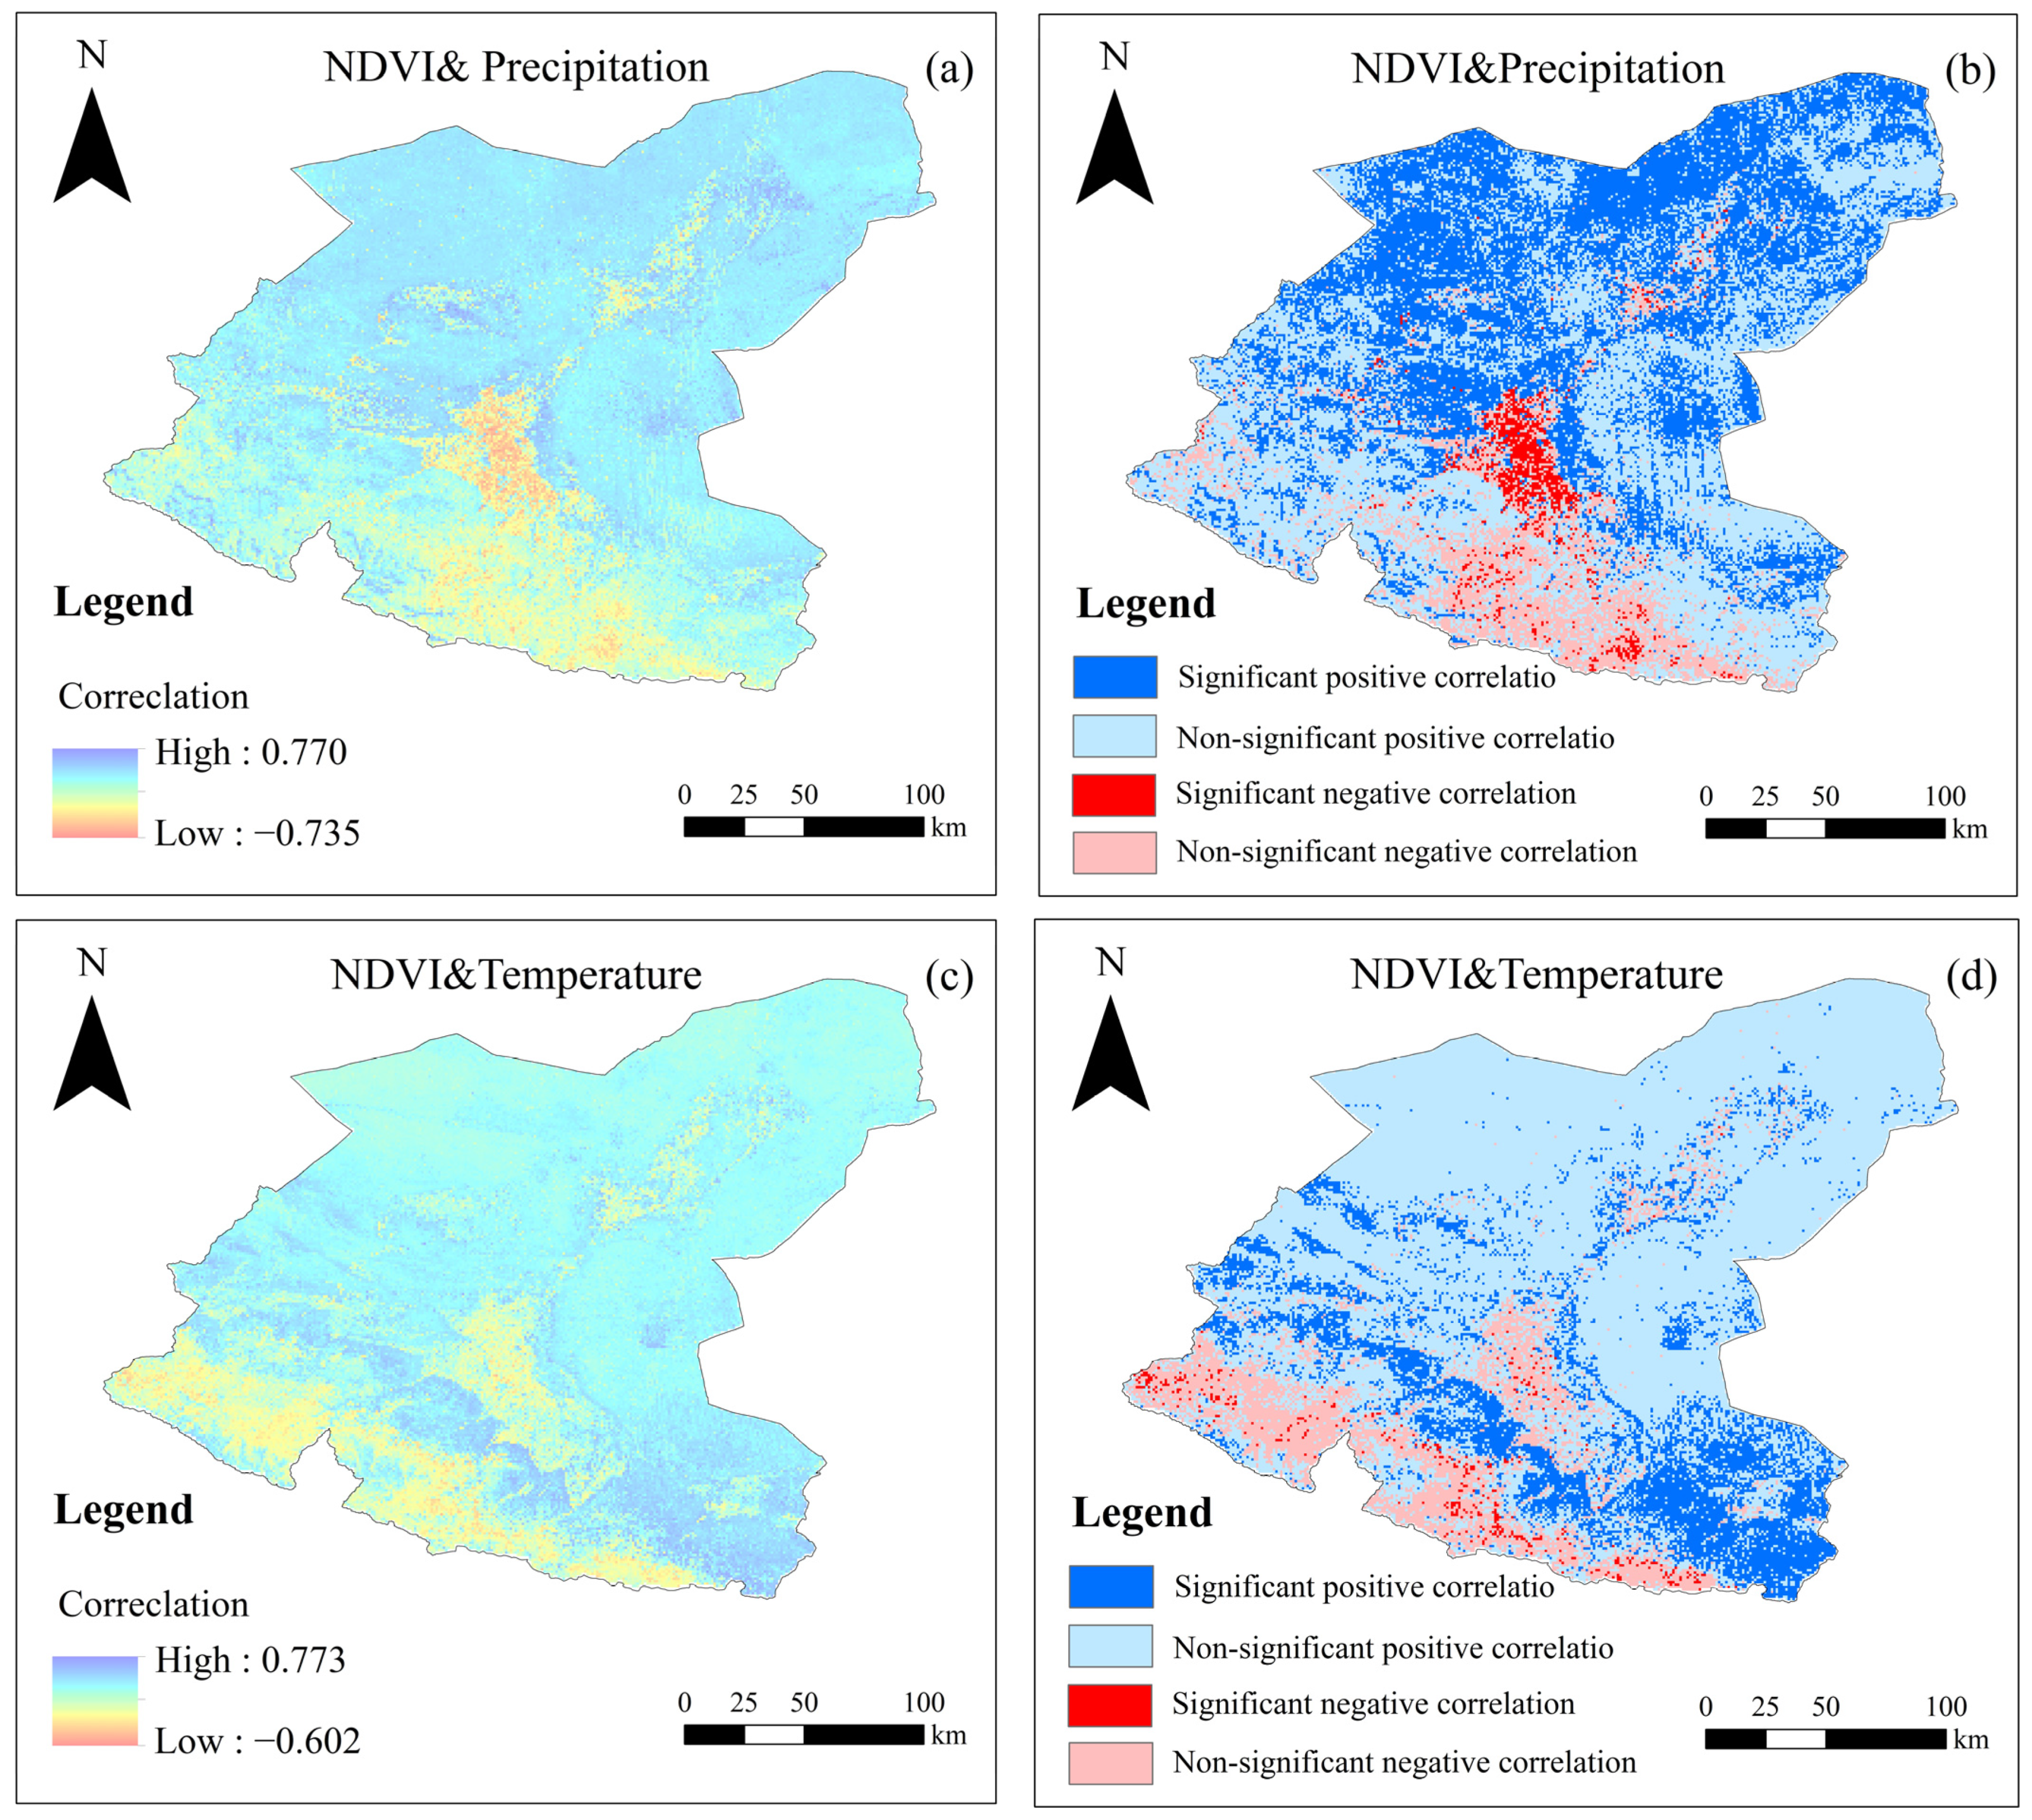
3.2.2. Partial Correlation of Precipitation and Temperature with NDVI

This study uses Formula (3) to calculate the partial correlation of precipitation and temperature with NDVI in the SRB (Figure 4).
The partial correlation coefficients between precipitation and NDVI, controlled for temperature, ranged from −0.735 to 0.770 (Figure 4a). Positive correlations between precipitation and NDVI covered 85.7% of the area, with 39.2% showing significant positive correlation (Figure 4b). This positive correlation was primarily observed in the lower and central regions of the SRB, far from human settlements and less impacted by HA. Areas with negative correlation between precipitation and NDVI accounted for 14.3%, primarily in the upper and middle reaches, and with stronger significance in areas with frequent HA.
Under the influence of precipitation, temperature, and NDVI bias, correlation coefficients in the SRB ranged from −0.602 to 0.773 (Figure 4c). Positive correlation between temperature and NDVI covered 86.8% of the region, primarily in the central and downstream regions of the SRB. Negative correlation between temperature and NDVI was 13.2%, mainly in the upper and middle reaches. Areas with significance positive relationships were mostly located in the east and west of the middle reaches, accounting for 17.8% (Figure 4d); only 0.9% of this area showed significant negative correlation.
The study suggests a stronger correlation between precipitation and NDVI in SRB compared to that between temperature and NDVI. While the percentage of regions with positive association among precipitation, temperature, and NDVI are similar (85.7% and 86.8%), the region with a significantly positive correlation is notably more extensive for precipitation and NDVI (39.2%) than for temperature and NDVI (13.2%).

3.3. Relationship between NDVI and Human Activities

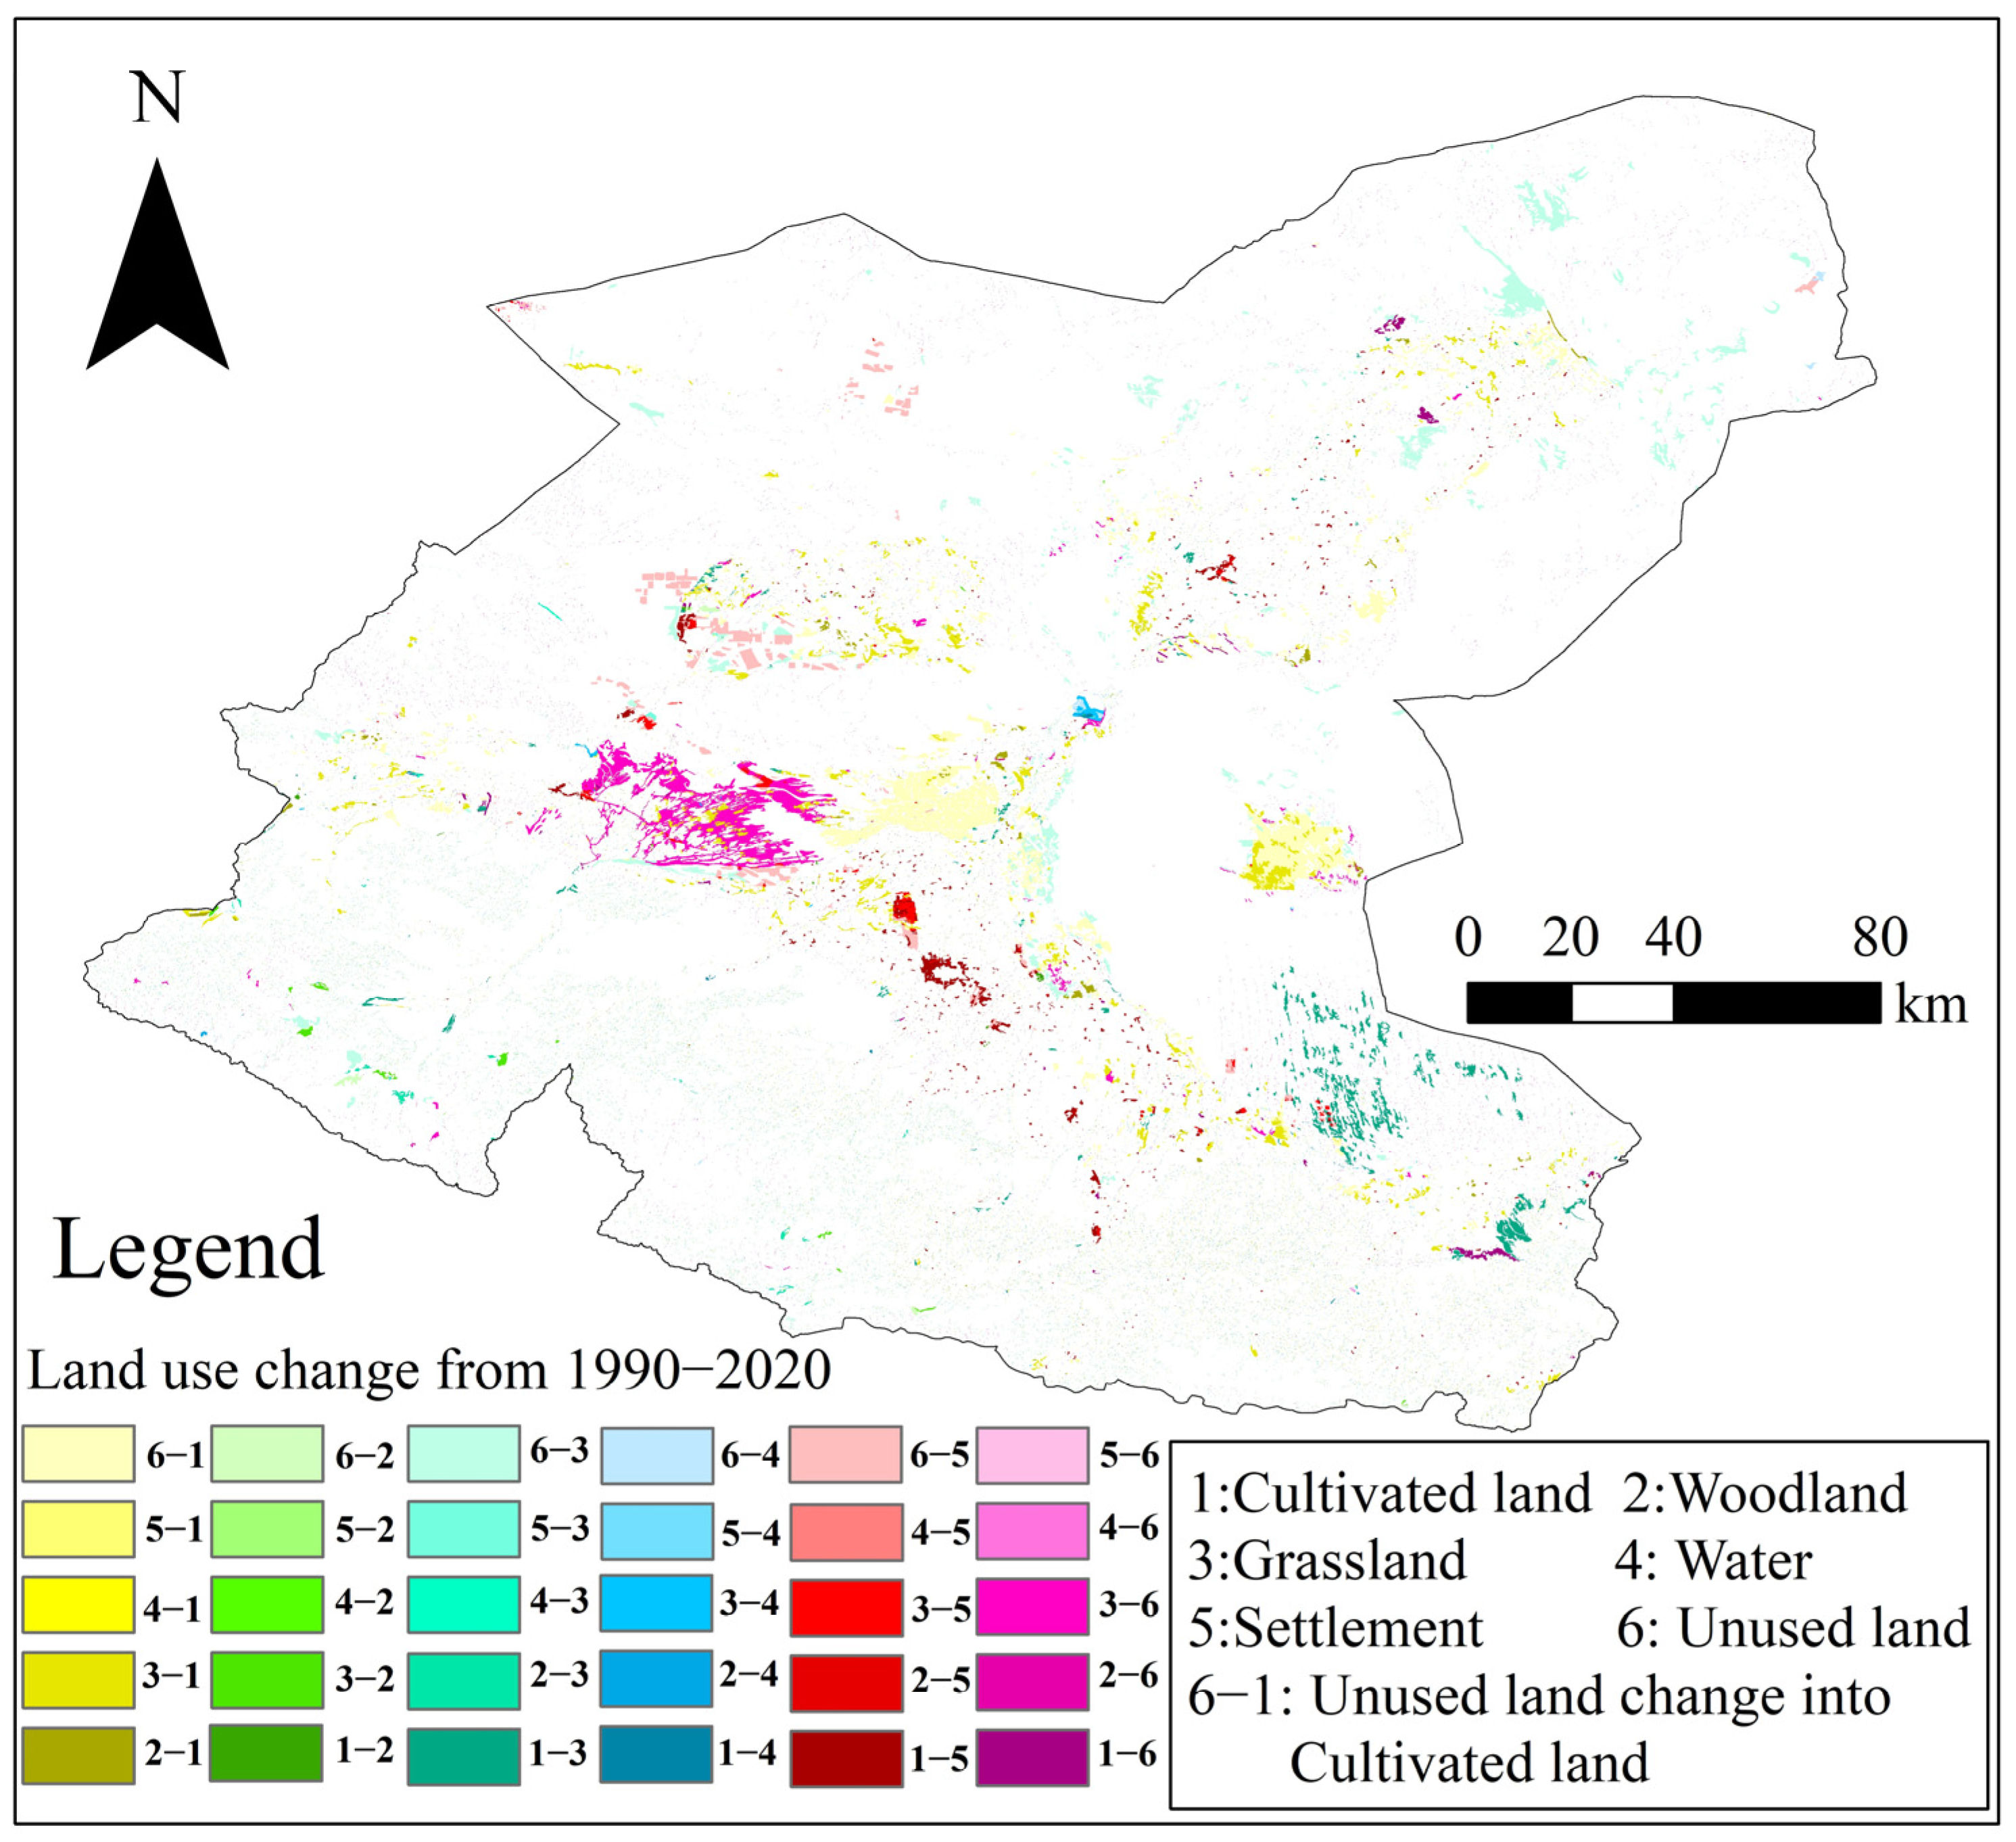
3.3.1. Relationship between LUCC and NDVI

The basic composition, spatial distribution, and transformation of land use types in the SRB were analyzed for the years from 1990 to 2020.
The land use composition and spatial characteristics of the SRB are shown in Figure 5. The upper reaches consist mainly of grassland and woodland, while the middle reaches are primarily cultivated land. The lower reaches predominantly comprise cultivated land and unused land. Unused land constitutes the largest share at approximately 47%, followed by grassland at 27%, cultivated land at 18%, and the combined area of woodland, residential areas, and water areas making up less than 10%. The distribution of land use types significantly shapes NDVI in the SRB. Extensive grassland and woodland in the upper reaches contribute to a higher NDVI, while cultivated land in the Minqin Oasis, spanning the middle and lower reaches, similarly influences NDVI size. The unused land surrounding the oasis, however, results in a lower NDVI.
In the SRB between 1990 and 2020, significant changes occurred, including an increase in cultivated and settlement areas and a decrease in unused land (Table 2). Cultivated land expanded by 599.44 km2, primarily derived from the conversion unused land and grassland (602.98 km2 and 316.25 km2, respectively). Settlement areas grew by 286.59 km2, primarily converted from unused and cultivated land (155.38 km2 and 109.58 km2, respectively). Unused land decreased by 786.4 km2, predominantly converted to cultivated land and grassland (602.98 km2 and 391.04 km2, respectively), with 155.38 km2 transformed into residential land.
The grassland area remained relatively stable, but underwent frequent conversions with other land use types, exerting a significant impact in the SRB. Changes in woodland and water areas were less pronounced, with fewer conversions with other land use types throughout the period.
Considering shifts in land use types, the expansion of cultivated land and reduction in unused land have contributed to the rise in NDVI. Conversely, a notable surge in settlement areas corresponds to a marked decline in NDVI, particularly evident in midstream regions where HA exert a more pronounced influence.

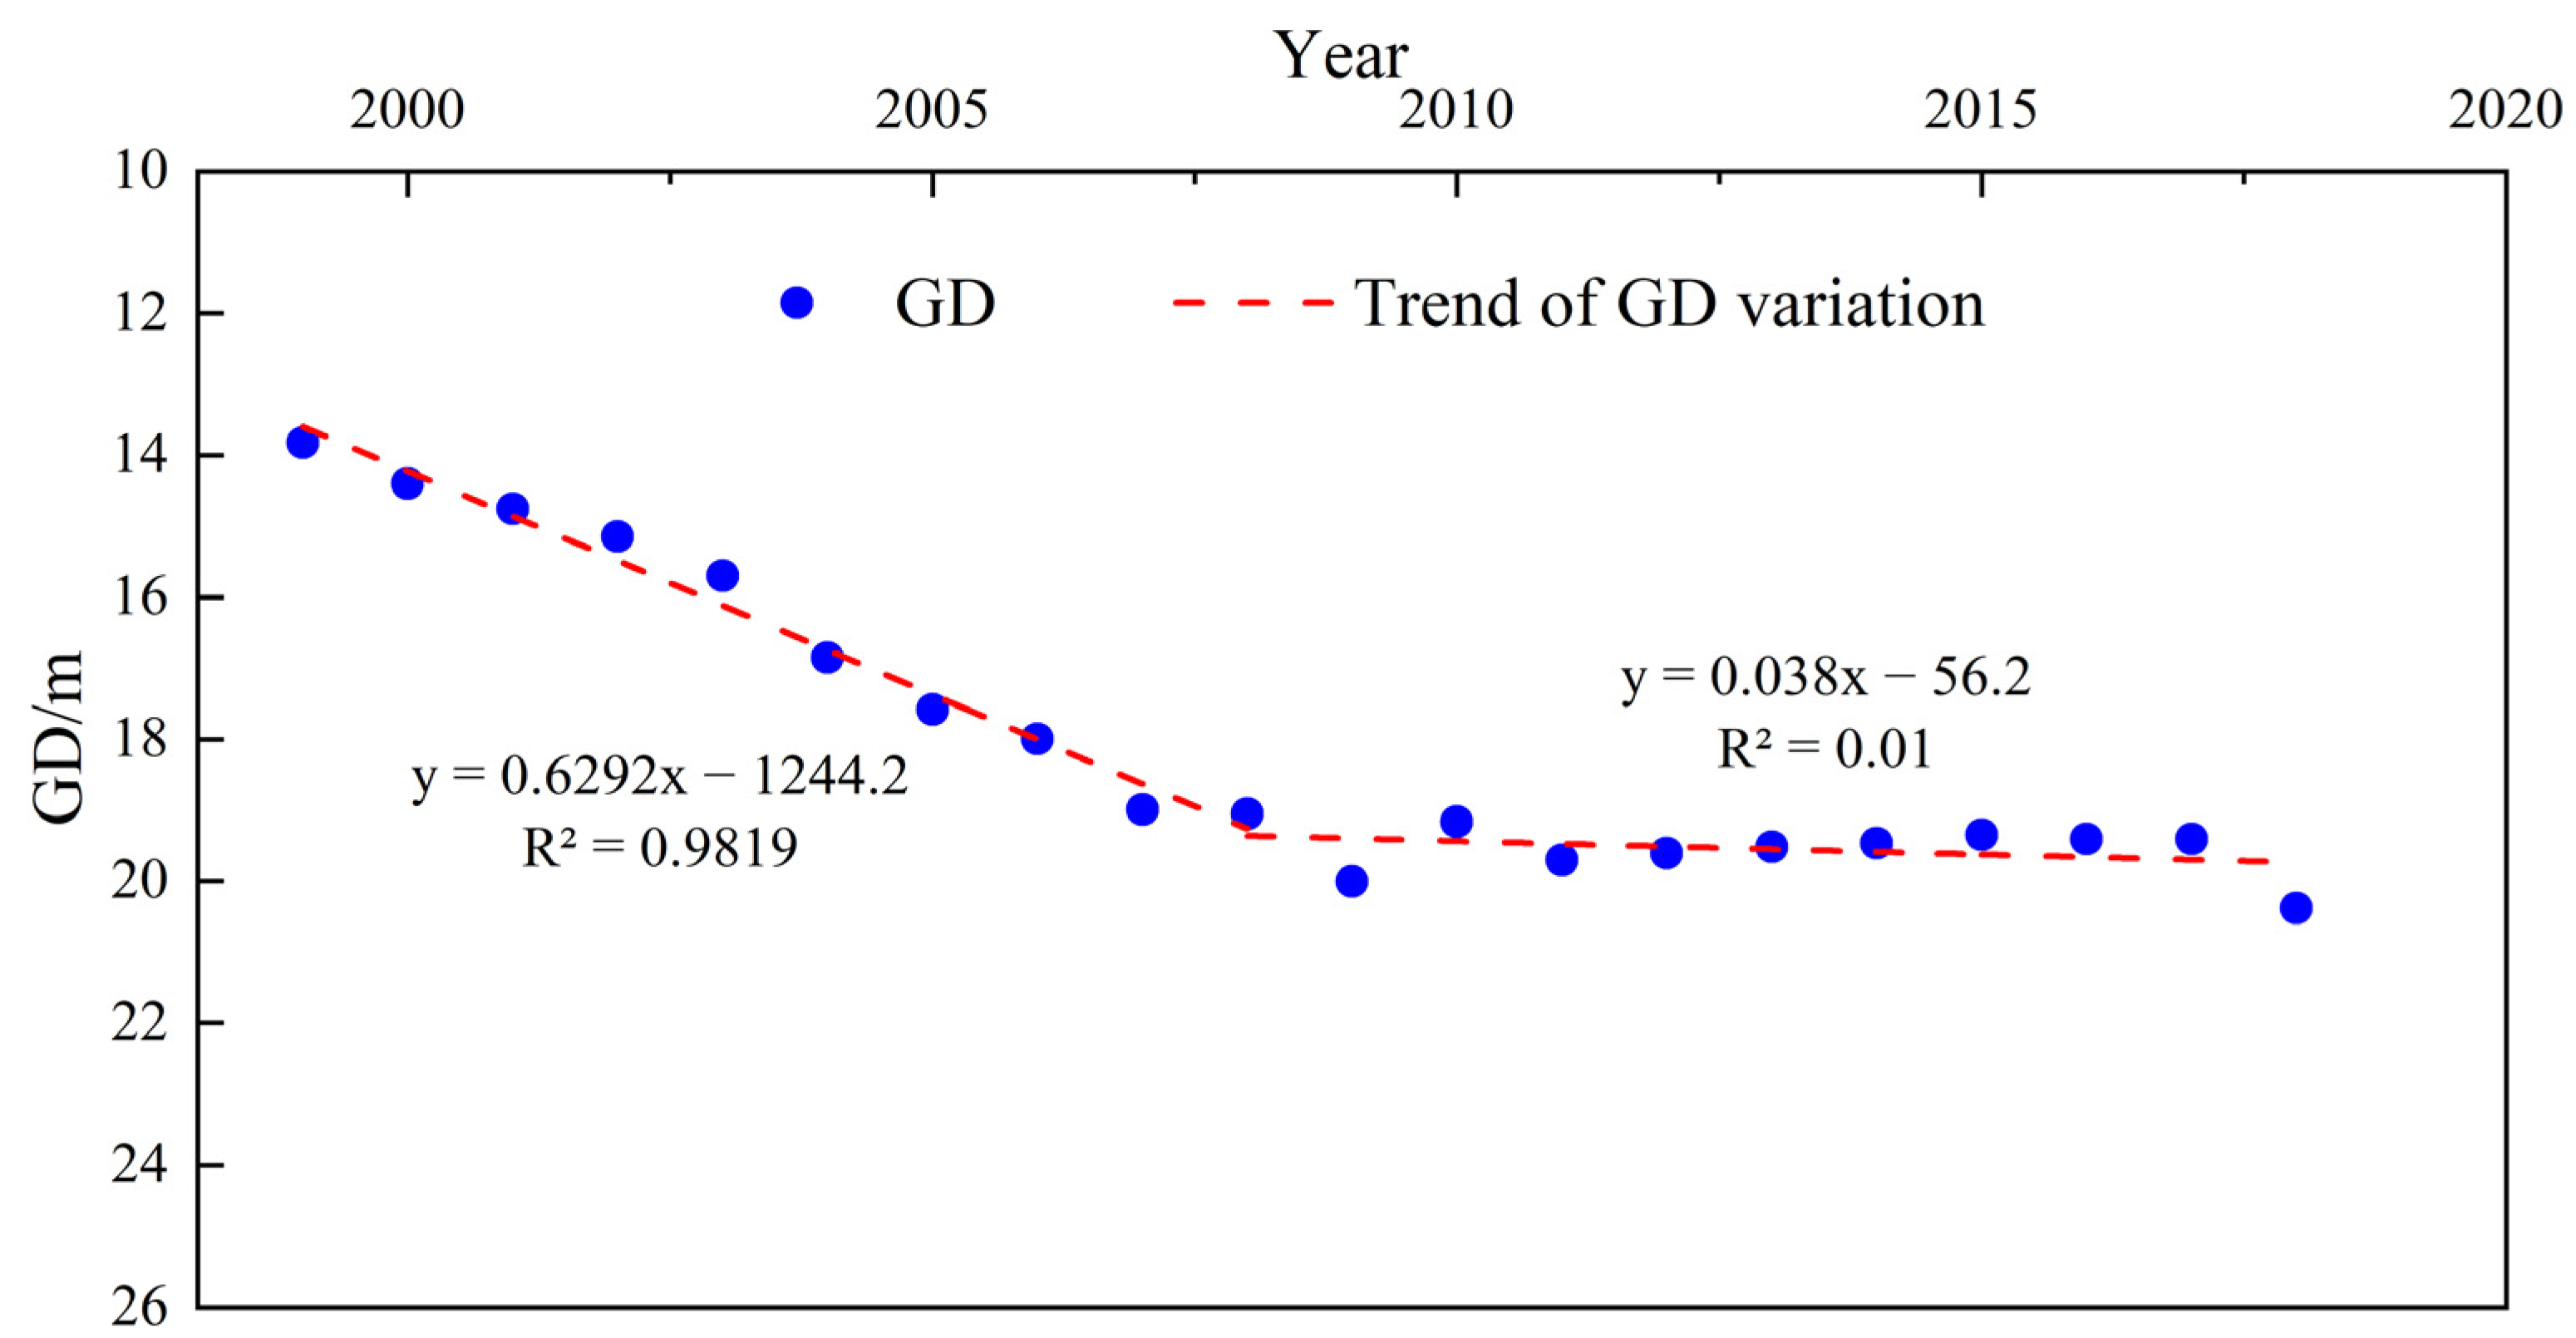
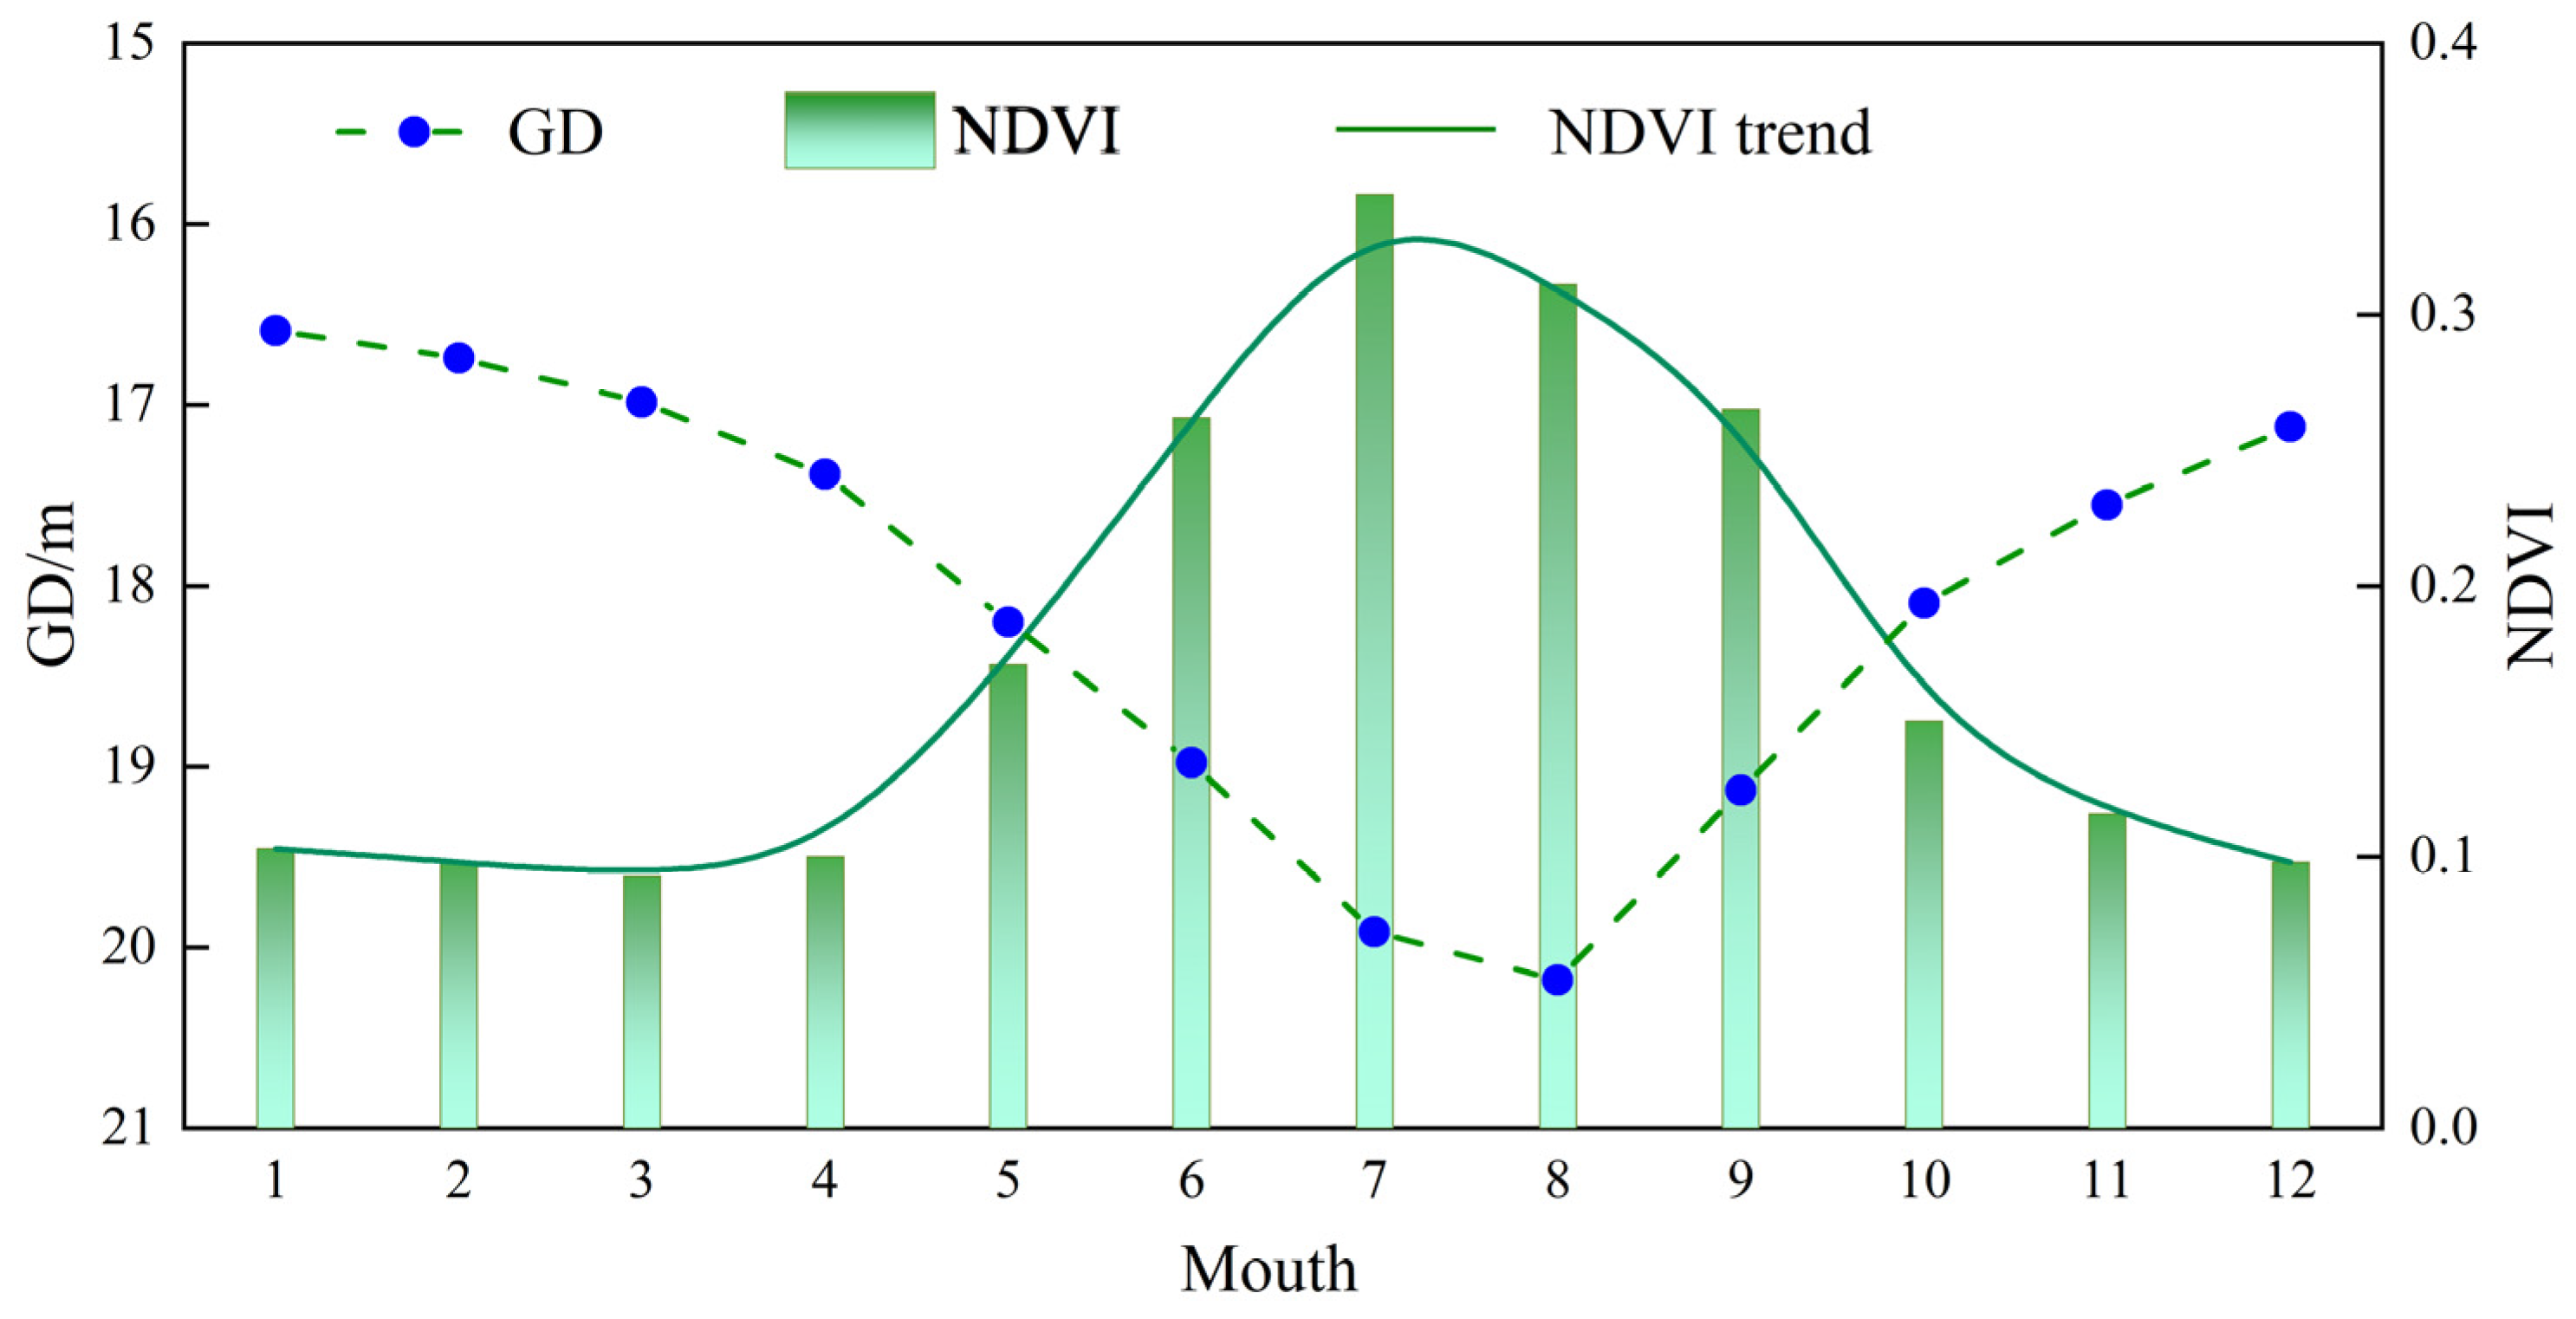
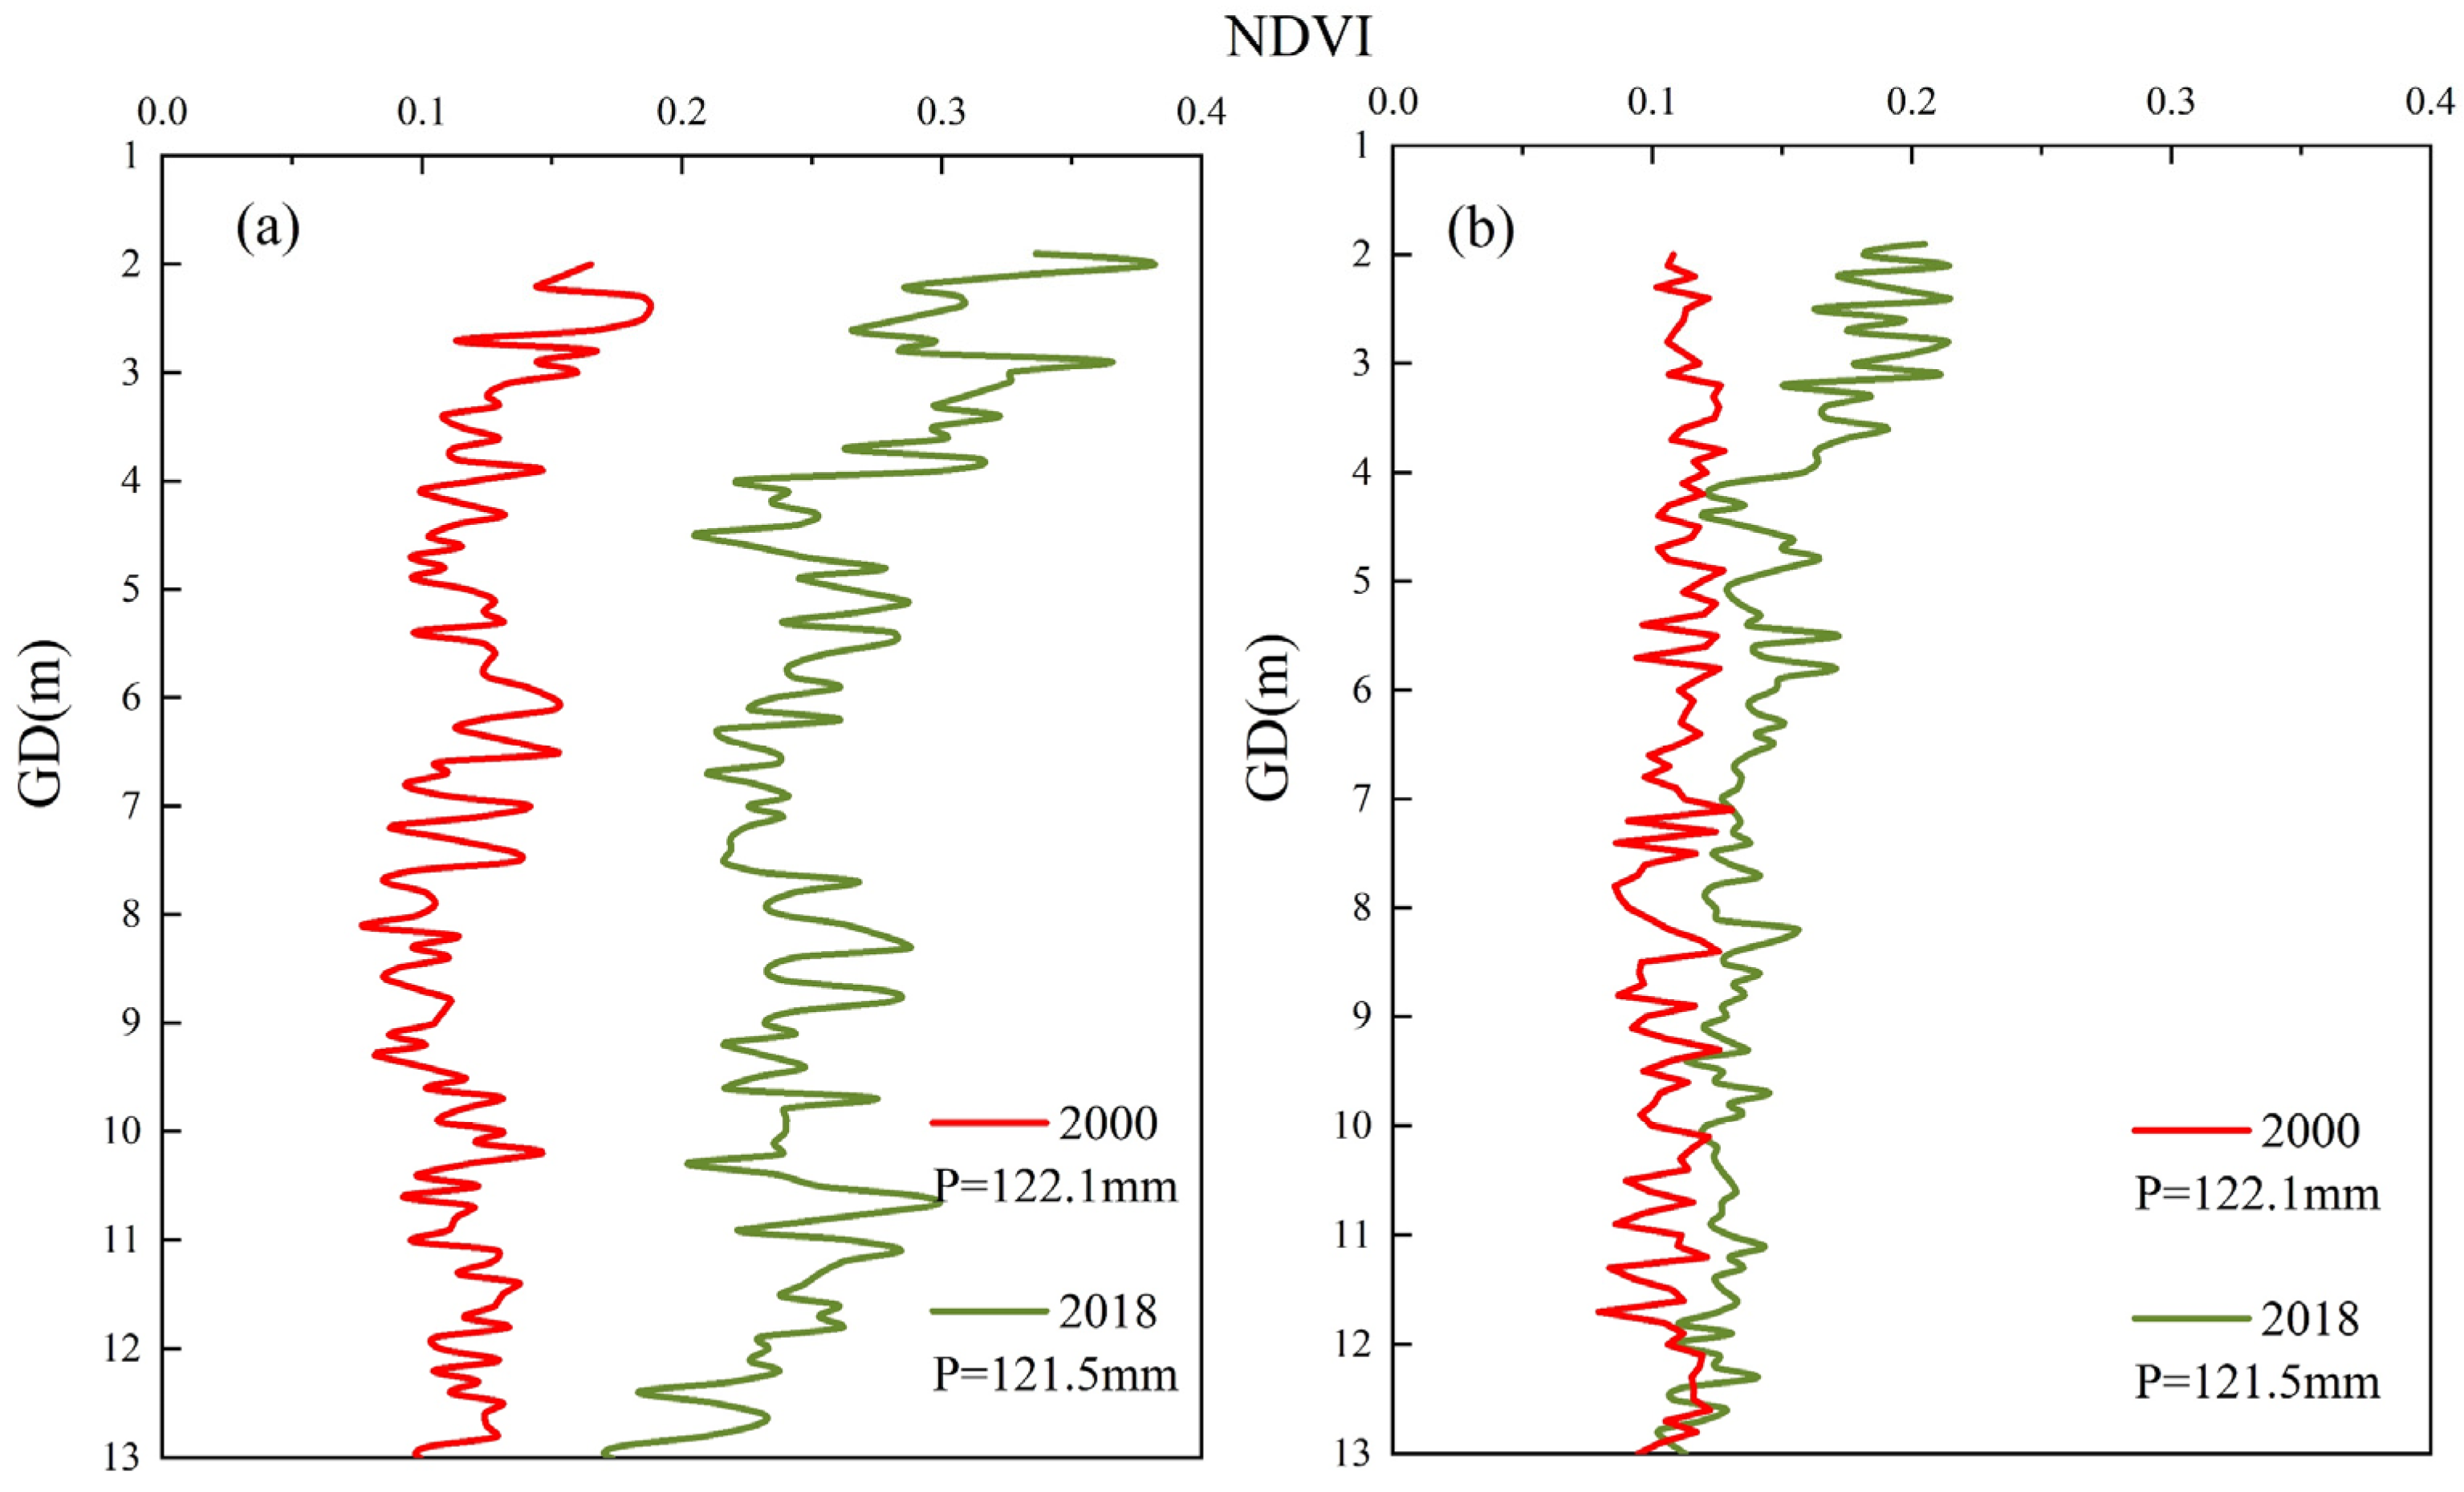
3.3.2. Relationship between Groundwater Depth and NDVI

Based on the groundwater level observation data of Minqin Oasis downstream of the SRB from 1999 to 2018, the GD exhibits a trend of decreasing and then stabilizing (Figure 6). Between 1999 and 2008, the GD rose from 13.82 m to 19.05 m, indicating an increase of 5.23 m at a rate of 0.6292 m/a. The rising trend during this period can be expressed by the equation y = 0.6292x. From 2008 to 2018, the GD showed more stable fluctuations, primarily ranging between 19.05 m and 20.38 m. The rapid decline in GD from 2000 to 2010 can be attributed to the expansion of cultivated land, the increase in plantation forests, and a rise in the number of wells.
The study analyzed intra-annual fluctuations in GD and NDVI, uncovering a consistent annual pattern for both indicators (Figure 7). From May to October, cultivated land necessitate irrigation for vegetation growth. During this period, due to excessive groundwater exploitation and robust vegetation growth, both GD and NDVI consistently achieved elevated levels, reaching their peaks in July and August. Specifically, the average GD declined to 20.05 m, while the average NDVI increased to 0.33 during these two months. This synchronization is linked to intensive groundwater extraction for farmland cultivation, particularly through artificial irrigation, resulting in the overexploitation of groundwater and changes in GD.
The study focused on areas with a GD of less than 13 m, and statistics were computed at 0.1 m intervals, and the change curve of NDVI versus GD was plotted (Figure 8).
Figure 8a depicts the NDVI and GD change curve in its natural state, while Figure 8b illustrates the NDVI and GD change curve after removing cultivated land. In arid regions, natural vegetation ecology heavily relies on groundwater and is notably influenced by it. NDVI exhibits varying trends across different GD intervals, showing a decreasing fluctuation pattern as GD increases. The average NDVI at GD of 0–4 m surpasses the NDVI in areas below 4 m, indicating that, within the oasis range, vegetation relies more on GD deeper than 4 m.
In its natural state from 2000 to 2018, NDVI experienced a significant increase (average increase of 0.133). However, the increase in NDVI for natural vegetation after removing cultivated land was less pronounced (average increase of 0.032), especially in areas with a GD greater than 4 m, where NDVI changes were smaller. This suggests that while expanding cultivated land can enhance NDVI, it concurrently leads to increased GD, significantly impacting the growth of other natural vegetation.

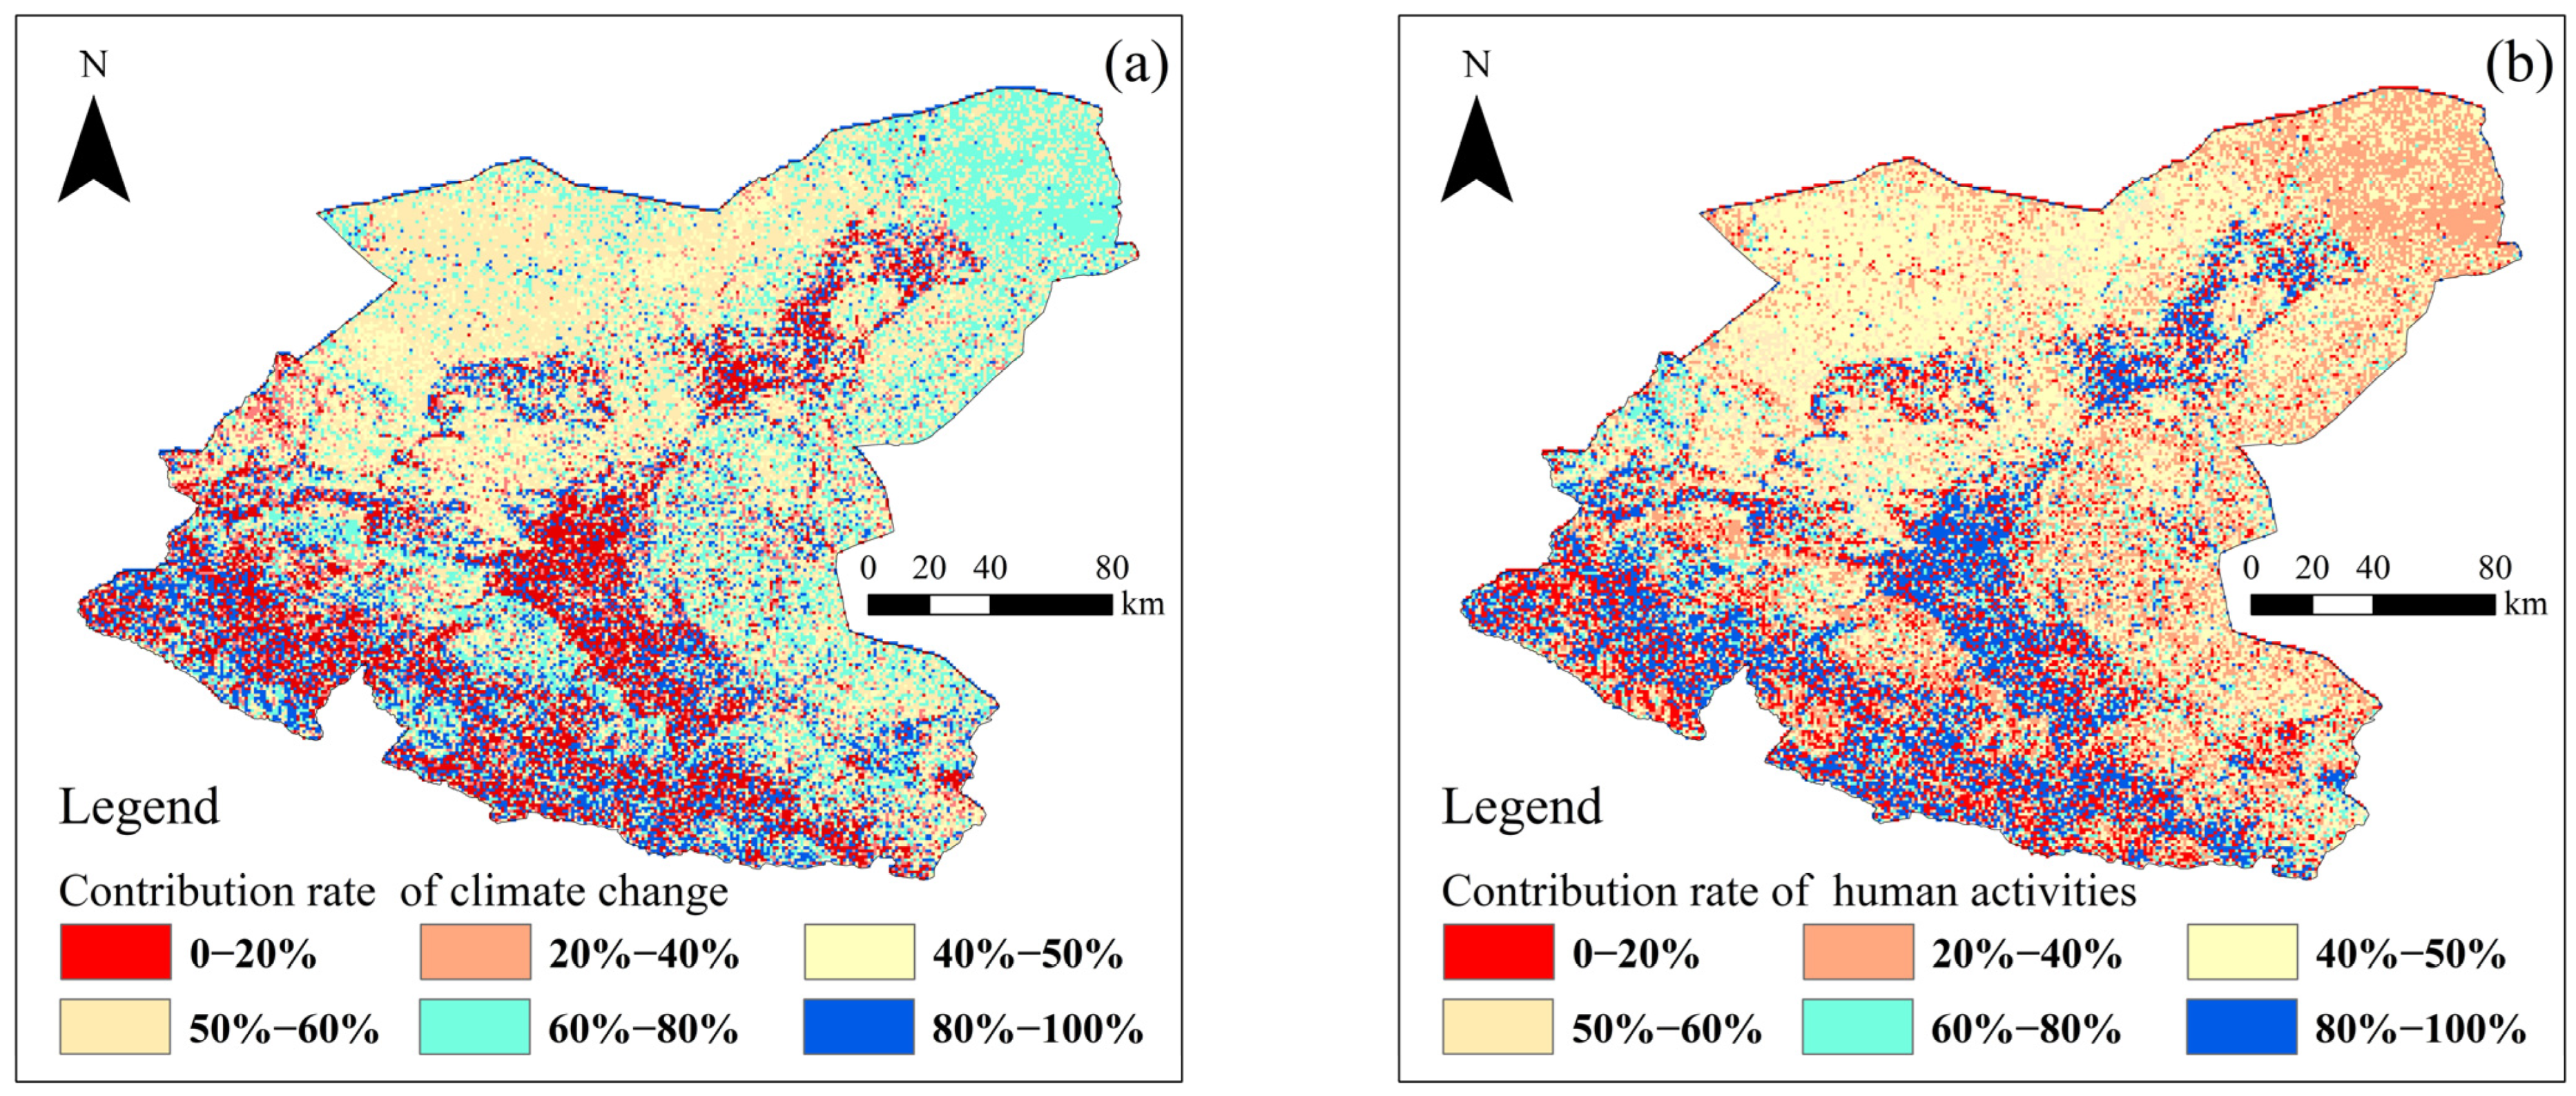
3.4. Contribution of Climate Change and Human Activities to NDVI Change

NDVI changes in the SRB result from the combined influence of CC and HA. By quantifying their contribution to changes in vegetation NDVI changes reveals the following findings (Table 3): The largest percentage of the region, at 29.2%, falls within the interval of 50–60% contribution of CC to NDVI change. The area with a contribution rate exceeding 60% (33.5% of the total) surpasses the area with a contribution rate below 40% (22.5% of the total). In terms of HA, the area within the 40–50% contribution range to NDVI change also holds the highest share at 29.2%. However, the region contributing less than 40% (33.5%) is more extensive than the region with a contribution rate exceeding 60% (22.5%). Consequently, the region in the SRB where CC predominantly drives NDVI changes surpasses the influence of HA.
Spatially (Figure 9), areas where CC contributes more than 60% to NDVI are predominantly situated in regions distanced from HA, such as the upstream of the SRB, plains in the middle reaches, and peripheral desert areas around the Minqin Oasis downstream.
Conversely, the areas where HA account for above 60% of the NDVI changes are mainly concentrated in pre-mountain alluvial fan plains, the middle reaches of SRB, and the downstream Minqin oasis region. Analyzing the spatial change trend of NDVI, a decreasing pattern is observed in the upstream east and west sides, as well as in the midstream Wuwei urban area and the downstream Minqin oasis. This highlights that HA are a significant contributing factor to the decrease in NDVI.
Despite CC promoting NDVI increase, robust HA can still alter the ecological environment in localized areas.

4. Discussion

4.1. Relationship between Climate Change and NDVI

This study reveals a positive correlation between precipitation, temperature, and NDVI changes in the SRB. From 1990 to 2020, precipitation and temperature accounted for 85.7% and 86.8%, respectively, in positively correlated proportions with NDVI across the SRB (Figure 4a,c). Prior research has underscored the significant impact of precipitation and temperature on regional NDVI changes [58,59]. However, these effects differ markedly between humid and arid areas [60,61,62]. In arid regions, such as the SRB, there is a positive correlation between precipitation, temperature, and NDVI changes, aligning with our findings [63,64].
Being a typical arid area, the SRB experiences improved NDVI due to increased soil moisture content and enhanced plant water use efficiency through precipitation. Additionally, temperature contributes by boosting vegetation photosynthesis and extending the growth period [65]. In humid areas, increased precipitation hinders vegetation from absorbing solar energy for growth and photosynthesis, while rising temperatures accelerate surface evapotranspiration, indirectly leading to insufficient soil moisture and inhibiting vegetation growth. Therefore, the two meteorological factors exhibit a negative correlation with NDVI in humid areas [66,67]. Our study confirms that in the SRB, precipitation and temperature positively impact vegetation growth, promoting an increase in NDVI.
Furthermore, this study found that precipitation (39.2%) in the SRB has a more significant promoting effect on NDVI than temperature (17.8%) (Figure 4b,d). Although the literature points out clear responses of vegetation growth to both precipitation and temperature, there is controversy over whether precipitation or temperature dominates vegetation growth, mainly reflecting regional differences. Some studies indicate that in arid areas, precipitation has a more significant impact on vegetation growth [68,69]. In arid regions, where vegetation growth demands higher water, increased precipitation can lead to better growth [64]. Other research findings suggest a more obvious impact of temperature [70,71]. In southwest China, temperature changes usually have a greater impact than precipitation on NDVI [66]. The areas where precipitation significantly contributes to NDVI in the SRB are predominantly embodied in the central and lower zones, with less rainfall and mostly dominated by desert vegetation, showing a higher dependence on precipitation. The areas where temperature significantly promotes NDVI are mainly concentrated in the piedmont plains, with abundant rainfall and mostly grassland, where vegetation growth is more sensitive to temperature changes. The proportion of desert vegetation is higher in the central and downstream areas of the SRB. Overall, precipitation has a more significant impact on NDVI changes in the SRB.

4.2. Relationship between Human Activities and NDVI

The impacts of vegetation change are complex, Aside from the influences of CC, the impacts of HA cannot be ignored [72], particularly the vegetation changes resulting from alterations in land use [14]. Over the past 30 years, HA in the SRB have intensified, not only affecting the water recycling process [73], but also playing an essential role in the process of changing the surface land use type [74], which seriously affects the ecological environment of the SRB. In the SRB, the decline in NDVI is primarily attributed to escalating HA (Figure 2c), Ongoing intensive HA persistently inflict harm on the regional vegetation ecology [75].
Vegetation ecological changes are significantly influenced by LUCC. Therefore, this study explores the impact of HA on vegetation changes from the perspective of LUCC. During the process of transforming land use types, urbanization and the subsequent expansion of cultivated land primarily induce alterations in the spatial pattern of vegetation [14], which is more obvious in the SRB. Over the past 30 years, LUCC in the SRB have been mainly due to increases in the area of cultivated land (an increase of 599.44 km2) and in the area of settlement (an increase of 286.59 km2) (Figure 5 and Table 2). The increase of arable land is mainly focused in the oasis areas in the central zones where the intensity of HA is greater, in the irrigation area of the east, and in Minqin Oasis (Figure 10). The area of settlement increased by 286.59 km2, with the area increased by 82.1%. The spatial consistency between the increase of settlement area and the increase of cultivated arable land is highly consistent, and the expansion of settlement will inevitably cause the reclamation of the surrounding cultivated land. Besides, the rapid development of economy and population has to some extent caused vegetation degradation. The increase in the area of cultivated land and settlement result in degradation of grassland as well as desert vegetation, and also causing degradation of forests [76,77]. Similar characteristics exist in the SRB; due to vegetation degradation, the NDVI in the east and west upper reaches of the SRB and the artificial oasis areas in the central and lower regions decreased significantly (Figure 2c). HA has an significant impact on the ecologically fragile arid zone [78], and to a certain extent, it will cause further exacerbation of the ecological environment [79,80].
HA are not only reflected in the process of LUCC; the change of groundwater should not be ignored [81]. In arid regions, the role of groundwater is pivotal for the survival of vegetation [41,82,83,84]. Changes in groundwater will cause deterioration of vegetation ecological ecosystem [85]. In the Minqin Oasis, where the intensity of HA is high, its GD has risen by 5.23 m in the last 20 years (Figure 6). In the meantime, as the GD continues to increase, it is difficult to meet the water conditions for natural vegetation growth, leading to vegetation degradation, and only farmland is able to grow stably with continuous irrigation by human beings, which also leads to the shrinking of the overall NDVI value (Figure 8).

5. Conclusions

This investigation examined the spatial and temporal characteristics of NDVI in the SRB from 1990 to 2020, and assessed the impacts of CC (temperature and precipitation) and HA (LUCC and GD) on the changes of NDVI. The results showed that NDVI in the SRB showed a fluctuating and increasing trend, and the vegetation condition improved. From the perspective of CC, temperature and precipitation increased, providing favorable conditions for ecological restoration in the SRB, and from the correlation and significance characteristics of temperature and rainfall with NDVI, precipitation had a more significant effect on NDVI. Meanwhile, the increase in the area of cultivated land and settlement and the GD by HA led to the decrease of NDVI to a certain extent. Comparison of the contributions of CC and HA to NDVI changes in the SRB revealed that CC contributes more to NDVI changes. The results of the study provide suggestions and support for ecological protection, water resources development, and utilization in inland river basins in arid areas. However, the effects of HA and CC on NDVI changes are not only limited to temperature, precipitation, LUCC, and GD, and more factors affecting NDVI changes in inland river basins in the arid zone need to be analyzed and further discussed in the future.

Author Contributions

Conceptualization, Y.W. and X.L.; methodology, X.L. and Y.Z.; formal analysis, X.L. and J.Z.; investigation, X.L. and Y.L.; resources, S.H. and K.L.; data curation, X.L.; writing—original draft preparation, J.Z. and X.L.; writing—review and editing, Y.Z., J.Z. and X.L.; visualization, X.L. and Y.W.; supervision, Y.W. and Y.Z; project administration, Y.W.; funding acquisition, Y.W., Y.Z. and J.Z. All authors have read and agreed to the published version of the manuscript.

Funding

The research was supported by the National key Research and Development Program of China (Grant No. 2021YFC3200205), the National Natural Sciences Foundation of China (No. 52109044, 52025093 and 51979284) and China Institute of Water Resources and Hydropower Research Project (HTWR0145B05202100000).

Data Availability Statement

The raw data supporting the conclusions of this article will be made available by the authors on request.

Acknowledgments

We are very grateful to the Editor’s comments and suggestions. The provided comments have contributed substantially to improve the paper.

Conflicts of Interest

All the authors declare that they have no conflict of interest.

References

  1. Davis, E.; Trant, A.J.; Hermanutz, L.; Whitaker, D.J.S.U. Plant-Environment Interactions in the Low Arctic Torngat Mountains of Labrador. Ecosystems 2021, 24, 1038–1058. [Google Scholar] [CrossRef]
  2. Wei, X.; Yang, J.; Luo, P.; Lin, L.; Lin, K.; Guan, J. Assessment of the variation and influencing factors of vegetation NPP and carbon sink capacity under different natural conditions. Ecol. Indic. 2022, 138, 108834. [Google Scholar] [CrossRef]
  3. Baldocchi, D.; Kelliher, F.M.; Black, T.A.; Jarvis, P. Climate and vegetation controls on boreal zone energy exchange. Glob. Chang. Biol. 2000, 6, 69–83. [Google Scholar] [CrossRef] [PubMed]
  4. Zhao, J.; Huang, S.; Huang, Q.; Wang, H.; Leng, G.; Peng, J.; Dong, H. Copula-Based Abrupt Variations Detection in the Relationship of Seasonal Vegetation-Climate in the Jing River Basin, China. Remote Sens. 2019, 11, 1628. [Google Scholar] [CrossRef]
  5. Liu, M.; Nie, Z.; Liu, X.; Wang, L.; Cao, L. Change in groundwater table depth caused by natural change and human activities during the past 40 years in the Shiyang River Basin, northwest China. Sci. Total Environ. 2024, 906, 167722. [Google Scholar] [CrossRef] [PubMed]
  6. Zhang, C.; Li, Y. Verification of watershed vegetation restoration policies, arid China. Sci. Rep. 2016, 6, 30740. [Google Scholar] [CrossRef] [PubMed]
  7. Nie, Q.; Xu, J.; Ji, M.; Cao, L.; Yang, Y.; Hong, Y. The Vegetation Coverage Dynamic Coupling with Climatic Factors in Northeast China Transect. Environ. Manag. 2012, 50, 405–417. [Google Scholar] [CrossRef]
  8. Edwards, R.; Treitz, P. Vegetation Greening Trends at Two Sites in the Canadian Arctic: 1984–2015. Arct. Antarct. Alp. Res. 2017, 49, 601–619. [Google Scholar] [CrossRef]
  9. Spruce, J.P.; Sader, S.; Ryan, R.E.; Smoot, J.; Kuper, P.; Ross, K.; Prados, D.; Russell, J.; Gasser, G.; McKellip, R.; et al. Assessment of MODIS NDVI time series data products for detecting forest defoliation by gypsy moth outbreaks. Remote Sens. Environ. 2011, 115, 427–437. [Google Scholar] [CrossRef]
  10. Li, Z.; Fox, J.M. Mapping rubber tree growth in mainland Southeast Asia using time-series MODIS 250 m NDVI and statistical data. Appl. Geogr. 2012, 32, 420–432. [Google Scholar] [CrossRef]
  11. Sharma, M.; Bangotra, P.; Gautam, A.S.; Gautam, S. Sensitivity of normalized difference vegetation index (NDVI) to land surface temperature, soil moisture and precipitation over district Gautam Buddh Nagar, UP, India. Stoch. Environ. Res. Risk Assess. 2022, 36, 1779–1789. [Google Scholar] [CrossRef] [PubMed]
  12. Zhang, X.; Jin, X. Vegetation dynamics and responses to climate change and anthropogenic activities in the Three-River Headwaters Region, China. Ecol. Indic. 2021, 131, 108223. [Google Scholar] [CrossRef]
  13. Ren, Y.; Zhang, F.; Zhao, C.; Cheng, Z. Attribution of climate change and human activities to vegetation NDVI in Jilin Province, China during 1998–2020. Ecol. Indic. 2023, 153, 110415. [Google Scholar] [CrossRef]
  14. Wang, J.; Wang, K.; Zhang, M.; Zhang, C. Impacts of climate change and human activities on vegetation cover in hilly southern China. Ecol. Eng. 2015, 81, 451–461. [Google Scholar] [CrossRef]
  15. Gong, X.; Du, S.; Li, F.; Ding, Y. Study of mesoscale NDVI prediction models in arid and semiarid regions of China under changing environments. Ecol. Indic. 2021, 131, 108198. [Google Scholar] [CrossRef]
  16. Jiang, L.; Liu, Y.; Wu, S.; Yang, C. Analyzing ecological environment change and associated driving factors in China based on NDVI time series data. Ecol. Indic. 2021, 129, 107933. [Google Scholar] [CrossRef]
  17. Rahman, I.U.; Hart, R.E.; Afzal, A.; Iqbal, Z.; Bussmann, R.W.; Ijaz, F.; Khan, M.A.; Ali, H.; Rahman, S.U.; Hashem, A.; et al. Vegetation–environment interactions: Plant species distribution and community assembly in mixed coniferous forests of Northwestern Himalayas. Sci. Rep. 2023, 13, 17228. [Google Scholar] [CrossRef] [PubMed]
  18. Ren, H.; Wen, Z.; Liu, Y.; Lin, Z.; Han, P.; Shi, H.; Wang, Z.; Su, T. Vegetation response to changes in climate across different climate zones in China. Ecol. Indic. 2023, 155, 110932. [Google Scholar] [CrossRef]
  19. Zhang, Y.; Wang, X.; Li, C.; Cai, Y.; Yang, Z.; Yi, Y. NDVI dynamics under changing meteorological factors in a shallow lake in future metropolitan, semiarid area in North China. Sci. Rep. 2018, 8, 15971. [Google Scholar] [CrossRef]
  20. Liu, R.; Xiao, L.; Liu, Z.; Dai, J. Quantifying the relative impacts of climate and human activities on vegetation changes at the regional scale. Ecol. Indic. 2018, 93, 91–99. [Google Scholar] [CrossRef]
  21. Gu, Y.; Pang, B.; Qiao, X.; Xu, D.; Li, W.; Yan, Y.; Dou, H.; Ao, W.; Wang, W.; Zou, C.; et al. Vegetation dynamics in response to climate change and human activities in the Hulun Lake basin from 1981 to 2019. Ecol. Indic. 2022, 136, 108700. [Google Scholar] [CrossRef]
  22. Zhang, X.; Huang, X. Human disturbance caused stronger influences on global vegetation change than climate change. PeerJ 2019, 7, e7763. [Google Scholar] [CrossRef] [PubMed]
  23. Zhu, Z.; Piao, S.; Myneni, R.B.; Huang, M.; Zeng, Z.; Canadell, J.G.; Ciais, P.; Sitch, S.; Friedlingstein, P.; Arneth, A.; et al. Greening of the Earth and its drivers. Nat. Clim. Chang. 2016, 6, 791–795. [Google Scholar] [CrossRef]
  24. Zheng, H.; Miao, C.; Li, X.; Kong, D.; Gou, J.; Wu, J.; Zhang, S. Effects of Vegetation Changes and Multiple Environmental Factors on Evapotranspiration Across China Over the Past 34 Years. Earth’s Future 2022, 10, e2021EF002564. [Google Scholar] [CrossRef]
  25. Kalisa, W.; Igbawua, T.; Henchiri, M.; Ali, S.; Zhang, S.; Bai, Y.; Zhang, J. Assessment of climate impact on vegetation dynamics over East Africa from 1982 to 2015. Sci. Rep. 2019, 9, 16865. [Google Scholar] [CrossRef]
  26. Yang, X.; Li, X.; Wang, X.; Ding, F.; Chen, F.; Wang, J.; Zhang, X.; Zhang, Y. Meta-analysis of the correlation between vegetation and precipitation in the temperate deserts of the Northern Hemisphere over the last 40 years. Ecol. Indic. 2022, 142, 109269. [Google Scholar] [CrossRef]
  27. du Plessis, W.P. Linear regression relationships between NDVI, vegetation and rainfall in Etosha National Park, Namibia. J. Arid. Environ. 1999, 42, 235–260. [Google Scholar] [CrossRef]
  28. Wang, J.; Price, K.P.; Rich, P.M. Spatial patterns of NDVI in response to precipitation and temperature in the central Great Plains. Int. J. Remote Sens. 2001, 22, 3827–3844. [Google Scholar] [CrossRef]
  29. Chen, T.; Bao, A.M.; Jiapaer, G.; Guo, H.; Zheng, G.X.; Jiang, L.L.; Chang, C.; Tuerhanjiang, L. Disentangling the relative impacts of climate change and human activities on arid and semiarid grasslands in Central Asia during 1982–2015. Sci. Total Environ. 2019, 653, 1311–1325. [Google Scholar] [CrossRef]
  30. Shi, S.; Yu, J.; Wang, F.; Wang, P.; Zhang, Y.; Jin, K. Quantitative contributions of climate change and human activities to vegetation changes over multiple time scales on the Loess Plateau. Sci. Total Environ. 2021, 755, 142419. [Google Scholar] [CrossRef]
  31. Cai, H.; Yang, X.; Wang, K.; Xiao, Z. Is Forest Restoration in the Southwest China Karst Promoted Mainly by Climate Change or Human-Induced Factors? Remote Sens. 2014, 6, 9895–9910. [Google Scholar] [CrossRef]
  32. Mishra, N.B.; Mainali, K.P. Greening and browning of the Himalaya: Spatial patterns and the role of climatic change and human drivers. Sci. Total Environ. 2017, 587–588, 326–339. [Google Scholar] [CrossRef] [PubMed]
  33. Shuangshuang, L.; Saini, Y.; Xianfeng, L.; Yanxu, L.; Mimi, S.J.R.S. NDVI-Based Analysis on the Influence of Climate Change and Human Activities on Vegetation Restoration in the Shaanxi-Gansu-Ningxia Region, Central China. Remote Sens. 2015, 7, 11163–11182. [Google Scholar] [CrossRef]
  34. Liu, Y.; Li, Z.; Chen, Y.; Li, Y.; Li, H.; Xia, Q.; Kayumba, P.M. Evaluation of consistency among three NDVI products applied to High Mountain Asia in 2000–2015. Remote Sens. Environ. 2022, 269, 112821. [Google Scholar] [CrossRef]
  35. Zheng, K.; Wei, J.-Z.; Pei, J.-Y.; Cheng, H.; Zhang, X.-L.; Huang, F.-Q.; Li, F.-M.; Ye, J.-S. Impacts of climate change and human activities on grassland vegetation variation in the Chinese Loess Plateau. Sci. Total Environ. 2019, 660, 236–244. [Google Scholar] [CrossRef] [PubMed]
  36. Yang, S.; Liu, J.; Wang, C.; Zhang, T.; Dong, X.; Liu, Y. Vegetation dynamics influenced by climate change and human activities in the Hanjiang River Basin, central China. Ecol. Indic. 2022, 145, 109586. [Google Scholar] [CrossRef]
  37. Zhu, L.; Sun, S.; Li, Y.; Liu, X.; Hu, K. Effects of climate change and anthropogenic activity on the vegetation greening in the Liaohe River Basin of northeastern China. Ecol. Indic. 2023, 148, 110105. [Google Scholar] [CrossRef]
  38. Zhang, W.; Luo, G.; Chen, C.; Ochege, F.U.; Hellwich, O.; Zheng, H.; Hamdi, R.; Wu, S. Quantifying the contribution of climate change and human activities to biophysical parameters in an arid region. Ecol. Indic. 2021, 129, 107996. [Google Scholar] [CrossRef]
  39. Liu, D.; Yu, C.; Zhao, F. Response of the water use efficiency of natural vegetation to drought in Northeast China. J. Geogr. Sci. 2018, 28, 611–628. [Google Scholar] [CrossRef]
  40. Han, J.-C.; Huang, Y.; Zhang, H.; Wu, X. Characterization of elevation and land cover dependent trends of NDVI variations in the Hexi region, northwest China. J. Environ. Manag. 2019, 232, 1037–1048. [Google Scholar] [CrossRef]
  41. Glanville, K.; Sheldon, F.; Butler, D.; Capon, S. Effects and significance of groundwater for vegetation: A systematic review. Sci. Total Environ. 2023, 875, 162577. [Google Scholar] [CrossRef] [PubMed]
  42. Han, M.; Zhao, C.; Feng, G.; Disse, M.; Shi, F.; Li, J. An eco-hydrological approach to predicting regional vegetation and groundwater response to ecological water conveyance in dryland riparian ecosystems. Quat. Int. 2015, 380–381, 224–236. [Google Scholar] [CrossRef]
  43. Huang, F.; Chunyu, X.; Zhang, D.; Chen, X.; Ochoa, C.G. A framework to assess the impact of ecological water conveyance on groundwater-dependent terrestrial ecosystems in arid inland river basins. Sci. Total Environ. 2020, 709, 136155. [Google Scholar] [CrossRef]
  44. Loheide, S.P.; Deitchman, R.S.; Cooper, D.J.; Wolf, E.C.; Hammersmark, C.T.; Lundquist, J.D. A framework for understanding the hydroecology of impacted wet meadows in the Sierra Nevada and Cascade Ranges, California, USA. Hydrogeol. J. 2009, 17, 229–246. [Google Scholar] [CrossRef]
  45. Ma, Z.; Kang, S.; Zhang, L.; Tong, L.; Su, X. Analysis of impacts of climate variability and human activity on streamflow for a river basin in arid region of northwest China. J. Hydrol. 2008, 352, 239–249. [Google Scholar] [CrossRef]
  46. Gu, J.J.; Guo, P.; Huang, G.H. Achieving the objective of ecological planning for arid inland river basin under uncertainty based on ecological risk assessment. Stoch. Environ. Res. Risk Assess. 2016, 30, 1485–1501. [Google Scholar] [CrossRef]
  47. Shouzhang, P. 1-km Monthly Mean Temperature Dataset for China (1901–2022); National Tibetan Plateau Data Center: Beijing, China, 2020. [Google Scholar] [CrossRef]
  48. Shouzhang, P. 1-km Monthly Precipitation Dataset for China (1901–2022); National Tibetan Plateau Data Center: Beijing, China, 2020. [Google Scholar] [CrossRef]
  49. Roy, D.P.; Kovalskyy, V.; Zhang, H.K.; Vermote, E.F.; Yan, L.; Kumar, S.S.; Egorov, A. Characterization of Landsat-7 to Landsat-8 reflective wavelength and normalized difference vegetation index continuity. Remote Sens. Environ. 2016, 185, 57–70. [Google Scholar] [CrossRef]
  50. Mann, H.B. Nonparametric Tests Against Trend. Econometrica 1945, 13, 245–259. [Google Scholar] [CrossRef]
  51. Kendall, M.G. Rank correlation methods. Br. J. Psychol. 1990, 25, 86–91. [Google Scholar] [CrossRef]
  52. Shadmani, M.; Marofi, S.; Roknian, M. Trend Analysis in Reference Evapotranspiration Using Mann-Kendall and Spearman’s Rho Tests in Arid Regions of Iran. Water Resour. Manag. 2012, 26, 211–224. [Google Scholar] [CrossRef]
  53. Sen, P.K. Estimates of the Regression Coefficient Based on Kendall’s Tau. J. Am. Stat. Assoc. 1968, 63, 1379–1389. [Google Scholar] [CrossRef]
  54. Jiao, W.; Wang, L.; Smith, W.K.; Chang, Q.; Wang, H.; D’Odorico, P. Observed increasing water constraint on vegetation growth over the last three decades. Nat. Commun. 2021, 12, 3777. [Google Scholar] [CrossRef] [PubMed]
  55. Ren, Z.; Tian, Z.; Wei, H.; Liu, Y.; Yu, Y. Spatiotemporal evolution and driving mechanisms of vegetation in the Yellow River Basin, China during 2000–2020. Ecol. Indic. 2022, 138, 108832. [Google Scholar] [CrossRef]
  56. Mumtaz, F.; Li, J.; Liu, Q.; Arshad, A.; Dong, Y.; Liu, C.; Zhao, J.; Bashir, B.; Gu, C.; Wang, X.; et al. Spatio-temporal dynamics of land use transitions associated with human activities over Eurasian Steppe: Evidence from improved residual analysis. Sci. Total Environ. 2023, 905, 166940. [Google Scholar] [CrossRef] [PubMed]
  57. Wang, J.; Xie, Y.; Wang, X.; Guo, K. Driving Factors of Recent Vegetation Changes in Hexi Region, Northwest China Based on A New Classification Framework. Remote Sens. 2020, 12, 1758. [Google Scholar] [CrossRef]
  58. Li, F.; Ren, J.; Wu, S.; Zhao, H.; Zhang, N. Comparison of Regional Winter Wheat Mapping Results from Different Similarity Measurement Indicators of NDVI Time Series and Their Optimized Thresholds. Remote Sens. 2021, 13, 1162. [Google Scholar] [CrossRef]
  59. Li, P.; Wang, J.; Liu, M.; Xue, Z.; Bagherzadeh, A.; Liu, M. Spatio-temporal variation characteristics of NDVI and its response to climate on the Loess Plateau from 1985 to 2015. Catena 2021, 203, 105331. [Google Scholar] [CrossRef]
  60. Castro Sardiña, L.; Irisarri, G.; Texeira, M. Climate factors rather than human activities controlled NDVI trends across wet meadow areas in the Andes Centrales of Argentina. J. Arid. Environ. 2023, 214, 104983. [Google Scholar] [CrossRef]
  61. Hussien, K.; Kebede, A.; Mekuriaw, A.; Beza, S.A.; Erena, S.H. Spatiotemporal trends of NDVI and its response to climate variability in the Abbay River Basin, Ethiopia. Heliyon 2023, 9, e14113. [Google Scholar] [CrossRef]
  62. Kong, D.; Zhang, Q.; Singh, V.P.; Shi, P. Seasonal vegetation response to climate change in the Northern Hemisphere (1982–2013). Glob. Planet. Chang. 2017, 148, 1–8. [Google Scholar] [CrossRef]
  63. Gang, C.; Zhou, W.; Chen, Y.; Wang, Z.; Sun, Z.; Li, J.; Qi, J.; Odeh, I. Quantitative assessment of the contributions of climate change and human activities on global grassland degradation. Environ. Earth Sci. 2014, 72, 4273–4282. [Google Scholar] [CrossRef]
  64. Zhang, Y.; Gao, J.; Liu, L.; Wang, Z.; Ding, M.; Yang, X. NDVI-based vegetation changes and their responses to climate change from 1982 to 2011: A case study in the Koshi River Basin in the middle Himalayas. Glob. Planet. Chang. 2013, 108, 139–148. [Google Scholar] [CrossRef]
  65. Dragoni, D.; Schmid, H.P.; Wayson, C.A.; Potter, H.; Grimmond, C.S.B.; Randolph, J.C. Evidence of increased net ecosystem productivity associated with a longer vegetated season in a deciduous forest in south-central Indiana, USA. Glob. Change Biol. 2011, 17, 886–897. [Google Scholar] [CrossRef]
  66. Wang, J.; Meng, J.J.; Cai, Y.L. Assessing vegetation dynamics impacted by climate change in the southwestern karst region of China with AVHRR NDVI and AVHRR NPP time-series. Environ. Geol. 2008, 54, 1185–1195. [Google Scholar] [CrossRef]
  67. Hou, W.; Gao, J.; Wu, S.; Dai, E. Interannual Variations in Growing-Season NDVI and Its Correlation with Climate Variables in the Southwestern Karst Region of China. Remote Sens. 2015, 7, 11105–11124. [Google Scholar] [CrossRef]
  68. Xie, B.; Jia, X.; Qin, Z.; Shen, J.; Chang, Q. Vegetation dynamics and climate change on the Loess Plateau, China: 1982–2011. Reg. Environ. Chang. 2016, 16, 1583–1594. [Google Scholar] [CrossRef]
  69. Yin, J.; Yao, M.; Yuan, Z.; Yu, G.; Li, X.; Qi, L. Spatial-temporal variations in vegetation and their responses to climatic and anthropogenic factors in upper reaches of the Yangtze River during 2000 to 2019. Watershed Ecol. Environ. 2023, 5, 114–124. [Google Scholar] [CrossRef]
  70. Hua, W.; Chen, H.; Zhou, L.; Xie, Z.; Qin, M.; Li, X.; Ma, H.; Huang, Q.; Sun, S. Observational Quantification of Climatic and Human Influences on Vegetation Greening in China. Remote Sens. 2017, 9, 425. [Google Scholar] [CrossRef]
  71. Diecong, C.; Jingyang, C.; Yujiao, D.; Yaodong, D.; Jiechun, W.; Jie, X. Spatiotemporal variation of NDVI and its response to climatic factors in Guangdong Province. Sustainability 2023, 15, 4375. [Google Scholar] [CrossRef]
  72. Luo, L.; Ma, W.; Zhuang, Y.; Zhang, Y.; Yi, S.; Xu, J.; Long, Y.; Ma, D.; Zhang, Z. The impacts of climate change and human activities on alpine vegetation and permafrost in the Qinghai-Tibet Engineering Corridor. Ecol. Indic. 2018, 93, 24–35. [Google Scholar] [CrossRef]
  73. Meng, G.; Zhu, G.; Liu, J.; Zhao, K.; Lu, S.; Li, R.; Qiu, D.; Jiao, Y.; Chen, L.; Sun, N. GRACE Data Quantify Water Storage Changes in the Shiyang River Basin, an Inland River in the Arid Zone. Remote Sens. 2023, 15, 3209. [Google Scholar] [CrossRef]
  74. Wang, Q.; Guan, Q.; Sun, Y.; Du, Q.; Xiao, X.; Luo, H.; Zhang, J.; Mi, J. Simulation of future land use/cover change (LUCC) in typical watersheds of arid regions under multiple scenarios. J. Environ. Manag. 2023, 335. [Google Scholar] [CrossRef] [PubMed]
  75. Gong, X.; Li, Y.; Wang, X.; Zhang, Z.; Lian, J.; Ma, L.; Chen, Y.; Li, M.; Si, H.; Cao, W. Quantitative assessment of the contributions of climate change and human activities on vegetation degradation and restoration in typical ecologically fragile areas of China. Ecol. Indic. 2022, 144, 109536. [Google Scholar] [CrossRef]
  76. Wang, J.; Xie, Y.; Wang, X.; Dong, J.; Bie, Q. Detecting Patterns of Vegetation Gradual Changes (2001–2017) in Shiyang River Basin, Based on a Novel Framework. Remote Sens. 2019, 11, 2475. [Google Scholar] [CrossRef]
  77. Li, J.; Chunyu, X.; Huang, F. Land Use Pattern Changes and the Driving Forces in the Shiyang River Basin from 2000 to 2018. Sustainability 2023, 15, 154. [Google Scholar] [CrossRef]
  78. Yu, Y.; Pi, Y.; Yu, X.; Ta, Z.; Sun, L.; Disse, M.; Zeng, F.; Li, Y.; Chen, X.; Yu, R. Climate change, water resources and sustainable development in the arid and semi-arid lands of Central Asia in the past 30 years. J. Arid. Land. 2019, 11, 1–14. [Google Scholar] [CrossRef]
  79. Zhang, J.-S.; Zhang, Y.-Q.; Pu, R.-F.; Chen, R.-S.; Cheng, Z.-S.; Wang, M.-Q. Safety analysis of water resources and eco-environment in Shiyang River Basin. Chin. Geogr. Sci. 2005, 15, 238–244. [Google Scholar] [CrossRef]
  80. Li, X.; Xiao, D.; He, X.; Chen, W.; Song, D. Factors associated with farmland area changes in arid regions: A case study of the Shiyang River basin, northwestern China. Front. Ecol. Environ. 2007, 5, 139–144. [Google Scholar] [CrossRef]
  81. Zomlot, Z.; Verbeiren, B.; Huysmans, M.; Batelaan, O. Trajectory analysis of land use and land cover maps to improve spatial–temporal patterns, and impact assessment on groundwater recharge. J. Hydrol. 2017, 554, 558–569. [Google Scholar] [CrossRef]
  82. Calow, R.C.; Robins, N.S.; Macdonald, A.M.; Macdonald, D.M.J.; Gibbs, B.R.; Orpen, W.R.G.; Mtembezeka, P.; Andrews, A.J.; Appiah, S.O. Groundwater Management in Drought-prone Areas of Africa. Int. J. Water Resour. Dev. 1997, 13, 241–262. [Google Scholar] [CrossRef]
  83. Li, X.Y.; Xiao, D.N. Dynamics of water resources and land use in oases in middle and lower reaches of Shiyang River watershed, Northwest China. Adv. Water Sci. 2005, 16, 643–648. [Google Scholar]
  84. Zhang, R.; Wu, J.; Yang, Y.; Peng, X.; Li, C.; Zhao, Q. A method to determine optimum ecological groundwater table depth in semi-arid areas. Ecol. Indic. 2022, 139, 108915. [Google Scholar] [CrossRef]
  85. Liu, M.; Nie, Z.L.; Cao, L.; Wang, L.F.; Lu, H.X.; Wang, Z.; Zhu, P.C.J. Comprehensive evaluation on the ecological function of groundwater in the Shiyang River watershed. J. Groundw. Sci. Eng. 2021, 9, 326–340. [Google Scholar] [CrossRef]
Figure 1. Overview of the study area.
Land 13 00533 g001
Figure 2. Characteristics of spatial and temporal changes of Normalized Difference Vegetation Index (NDVI) in the Shiyang River Basin (SRB): (a) NDVI spatial distribution in 1900, (b) NDVI spatial distribution in 2020, (c) NDVI spatial variation characteristics, (d) NDVI interannual variation characteristics.
Land 13 00533 g002
Figure 3. Precipitation and temperature changes in the Shiyang River Basin (SRB) from 1990 to 2020: (a) precipitation changes, (b) temperature changes.
Land 13 00533 g003
Figure 4. Partial correlations and significance characteristics of precipitation and temperature with Normalized Difference Vegetation Index (NDVI) in the Shiyang River Basin (SRB): (a) the correlation between NDVI and precipitation, (b) the significance level of NDVI and precipitation, (c) the correlation between NDVI and temperature, (d) the significance level of NDVI and temperature.
Land 13 00533 g004
Figure 5. Map of land use types in the Shiyang River Basin (SRB): (a) land use types in 1990, (b) land use types in 2020.
Land 13 00533 g005
Figure 6. Inter-annual changes in groundwater depth (GD).
Land 13 00533 g006
Figure 7. Intra-annual changes in groundwater depth (GD) and Normalized Difference Vegetation Index (NDVI).
Land 13 00533 g007
Figure 8. Curve of Normalized Difference Vegetation Index (NDVI) versus groundwater depth (GD) variations: (a) natural state, (b) remove cultivated land.
Land 13 00533 g008
Figure 9. The contribution rates of climate change (CC) and human activities (HA) to the variability of normalized differential vegetation index (NDVI): (a) the contribution rate of climate change, (b) the contribution rate of human activities.
Land 13 00533 g009
Figure 10. Spatial map of land-use and land-cover change (LUCC) in the Shiyang River Basin (SRB) from 1990 to 2020.
Land 13 00533 g010
Table 1. Method for calculating the relative contribution rate.
Slope (NDVIO)Influence FactorsDetermination of
Influencing Factors
Contribution of Drivers (%)
Slope (NDVIP)Slope
(NDVIH)
CCHA
>0H&P>0>0 S l o p e   ( N D V I P ) S l o p e   ( N D V I O ) S l o p e   ( N D V I H ) S l o p e   ( N D V I O )
H<0>00100
P>0<01000
<0H&P<0<0 S l o p e   ( N D V I P ) S l o p e   ( N D V I O ) S l o p e   ( N D V I H ) S l o p e   ( N D V I O )
H>0<00100
P<0>01000
Table 2. Land use types transfer matrix in the Shiyang River Basin (SRB) from 1990 to 2020 (km2).
Land Use Types2020
Cultivated LandWoodlandGrasslandWaterSettlementUnused LandTotal
1990Cultivated land6291.10 8.42 204.79 5.19 109.58 46.98 6666.06
Woodland39.38 2526.11 48.72 2.29 5.79 4.97 2627.26
Grassland316.25 53.03 10,368.10 12.18 33.03 334.55 11,117.14
Water1.81 1.28 3.56 141.24 0.68 1.18 149.75
Settlement13.97 0.38 2.40 0.08 331.01 1.04 348.88
Unused land602.98 16.19 391.04 9.53 155.38 18,490.20 19,665.32
Total7265.49 2605.41 11,018.61 170.51 635.47 18,878.92 40,574.41
Table 3. Area share of climate change (CC) and human activity (HA) contribution to Normalized Difference Vegetation Index (NDVI) change from 1990 to 2020.
Pixel Ratio
Contribution rate0–20%20–40%40–50%50–60%60–80%80–100%
Climate change13.2%9.3%14.8%29.2%19.7%13.8%
Human activity13.8%19.7%29.2%14.8%9.3%13.2%
Disclaimer/Publisher’s Note: The statements, opinions and data contained in all publications are solely those of the individual author(s) and contributor(s) and not of MDPI and/or the editor(s). MDPI and/or the editor(s) disclaim responsibility for any injury to people or property resulting from any ideas, methods, instructions or products referred to in the content.

