Abstract
New Hanover County, North Carolina, has been experiencing rapid population growth and is expected to continue this growth, leading to increased land use and development in the area. The county is also threatened by sea level rise (SLR) and its effects because of its coastal location and frequent occurrences of major storms and hurricanes. This study used a land change modeler to map the land cover change throughout the county over a period of 20 years, and predicted land cover distribution in the area in the years 2030 and 2050. Statistics revealed that the developed land in the area increased by 85 km2 between 2000 and 2010, and by 60 km2 between 2010 and 2020. Such land is predicted to increase by another 73 km2 by 2030, and 63 km2 by 2050. This increase in development is expected to occur mainly in the central area of the county and along the barrier islands. Modeling of SLR illustrated that the northwestern part of New Hanover County along the Cape Fear River, as well as the beach towns located on the barrier islands, are estimated be the most affected locations. Results indicate that sections of major highways throughout the county, including I-140 near downtown Wilmington and US-421 in Carolina Beach, may be inundated by SLR, which might delay residents during mandatory evacuations for emergency situations such as hurricanes. Some routes may be unusable, leading to traffic congestion on other routes, which may impede some residents from reaching safety before the emergency. Wrightsville Beach and Carolina Beach are estimated to have the highest levels of inundation, with 71.17% and 40.58% of their land being inundated under the most extreme SLR scenario of 3 m, respectively. The use of the present research approach may provide a practical, quick, and low-cost method in modeling rapidly growing urban areas along the eastern United States coastline and locating areas at potential risk of future SLR inundation.
1. Introduction
The issue of sea level rise (SLR) has become of increasing concern worldwide as its possible effects become more understood. There are many causes that are driving SLR, but perhaps the most studied driving force behind SLR is global climate change. The Intergovernmental Panel on Climate Change (IPCC) has released six reports since 1990 to provide knowledge and the latest scientific information on climate change, including its potential impacts and risks, as well as the mitigation and adaptation actions that must be taken by the entire world [1]. Based on the IPCC (2023) report, the ocean surface temperatures from 2011 to 2020 were estimated to be 1.1 °C higher than between 1850 and 1900 and have risen faster since 1970 than during any other 50-year period over the last 2000 years. The average rate of SLR has also been increasing; between 1901 and 1971, the average rate of SLR was about 1.3 mm/year, and this rate increased to 1.9 mm/year between 1971 and 2006, and further increased to 3.7 mm/year between 2006 and 2018 [1]. SLR is partially attributed to human-induced climate change, so the magnitude and rate of SLR will depend on greenhouse gas emissions, with higher levels of emissions leading to greater and faster rates. The global mean sea level (GMSL) will rise by 2–3 m over the next 2000 years if warming does not exceed 1.5 °C, but sea levels may rise 2–6 m if warming reaches 2.5 °C [1]. At the current rate of 1.5 °C of warming, continued SLR and extreme sea level events of increased frequency and magnitude are expected in the near term, which will threaten many coastal regions and cause the submergence and loss of many coastal ecosystems [1].
Actual rates of SLR will vary around the world based on local and regional factors [2]. Various studies have shown that the North American east coast is expected to have significant impacts as sea levels rise, partially because North America is still settling from post-glacial rebound from the Pleistocene Epoch [3]. Land subsidence has also contributed to regional SLR in the southern Chesapeake Bay Region [4], It is expected that by 2050, SLR will rise from 0.25 to 0.3 m for the contiguous United States [2]. The east and Gulf coasts of America particularly are expected to see higher levels of sea rise compared to other parts of the country, with the east coast specifically expected to see 0–5 cm higher levels than the rest of the contiguous United States [2]. The coastal region of North Carolina is expected to see significant effects from SLR. Stations across the coast of NC have been experiencing a rise in mean sea level of about 2.88 mm/year over the last 20 years [5]. This coastal strip of NC has anticipated SLR increases from 0.2 m (low) to 3 m (extreme), with intermediate projections between 0.3 and 1 m by 2100, indicating that many coastal communities in this area may be at increased risk of the effects of SLR [3]. The northeastern areas of North Carolina have been heavily studied for their expected response to SLR by other researchers, but the southeastern areas of North Carolina, including New Hanover County, have not received the same attention.
The coastal zone of NC has seen especially great population increases in the last few decades. This zone witnessed a population increase of about 17.5% between 1990 and 2000 [6]. About 74% of this coastal population lived within 2 miles of an ocean or estuary shoreline in 2000, and this number does not include seasonal visitors to the region, which strains coastal resources even more [6]. New Hanover County is one of NC’s coastal counties that has been experiencing rapid population growth in recent years. In 1940, the population of the county was slightly over 50,000 people, and by 2016, the population had more than quadrupled to over 200,000 people. The entire tri-county area of New Hanover, Brunswick, and Pender counties is one of the fastest growing regions in the United States and is expected to grow another 90% by 2040 [7]. About 66% of that growth is expected to occur just in New Hanover County [7]. New Hanover County also includes the beach towns of Wrightsville Beach, Carolina Beach, and Kure Beach. Each of these towns attracts many tourists every year, particularly in the summer months, which can greatly increase the number of people that are in the county using land and resources. The increased population of the county, combined with the high rates of tourism in parts of the county, has led to constant land use changes for the area. As part of the North Carolina coast, this county is also vulnerable to SLR, which may severely impact residential areas, tourist accommodations and recreational activities that draw people to the county.
Monitoring rates of population growth is important because rates of land use change often share a direct relationship with population growth [8]. Land use change and population growth need to be monitored especially in coastal areas because these ecosystems are fragile, and the land is vulnerable to SLR. Land use change in coastal zones often increases impervious surfaces, impairs water quality, disrupts natural habitats, and alters the aesthetic views that draw in tourism [6]. Because North Carolina’s coastal regions are growing in population, land use change is also accelerating. This change is already affecting the natural processes of the region; some parts of the North Carolina coastline have been experiencing shoreline loss rates of 5–12 m per year [9]. However, with the launch of Landsat in 1972, it has become much easier to study and make direct measurements on land cover and understand what effects changes in land use are having [8].
Various studies have been completed with the purpose of monitoring land use and land cover (LULC) changes in different parts of the world, and some studies have also incorporated predictions of how LULC will look in the future. Models of land cover change improve our understanding of land use alterations by human activity and provide vital information for decision-makers and policymakers so they can incorporate sustainable development practices [10]. One of these models is the TerrSet-Land Change Modeler (LCM) (clarklabs.org, accessed on 5 March 2024), which has been used in previous studies around the world to monitor and predict land change [10]. The main objective of the present study is to integrate the TerrSet LCM with other geospatial models to investigate the past LULC patterns of New Hanover County and predict the change in the land cover types for the county in 2030 and in 2050. Various SLR scenarios will also be applied to the future LULC maps to determine if the areas likely to become populated are suitable for development regarding SLR.
2. Study Area
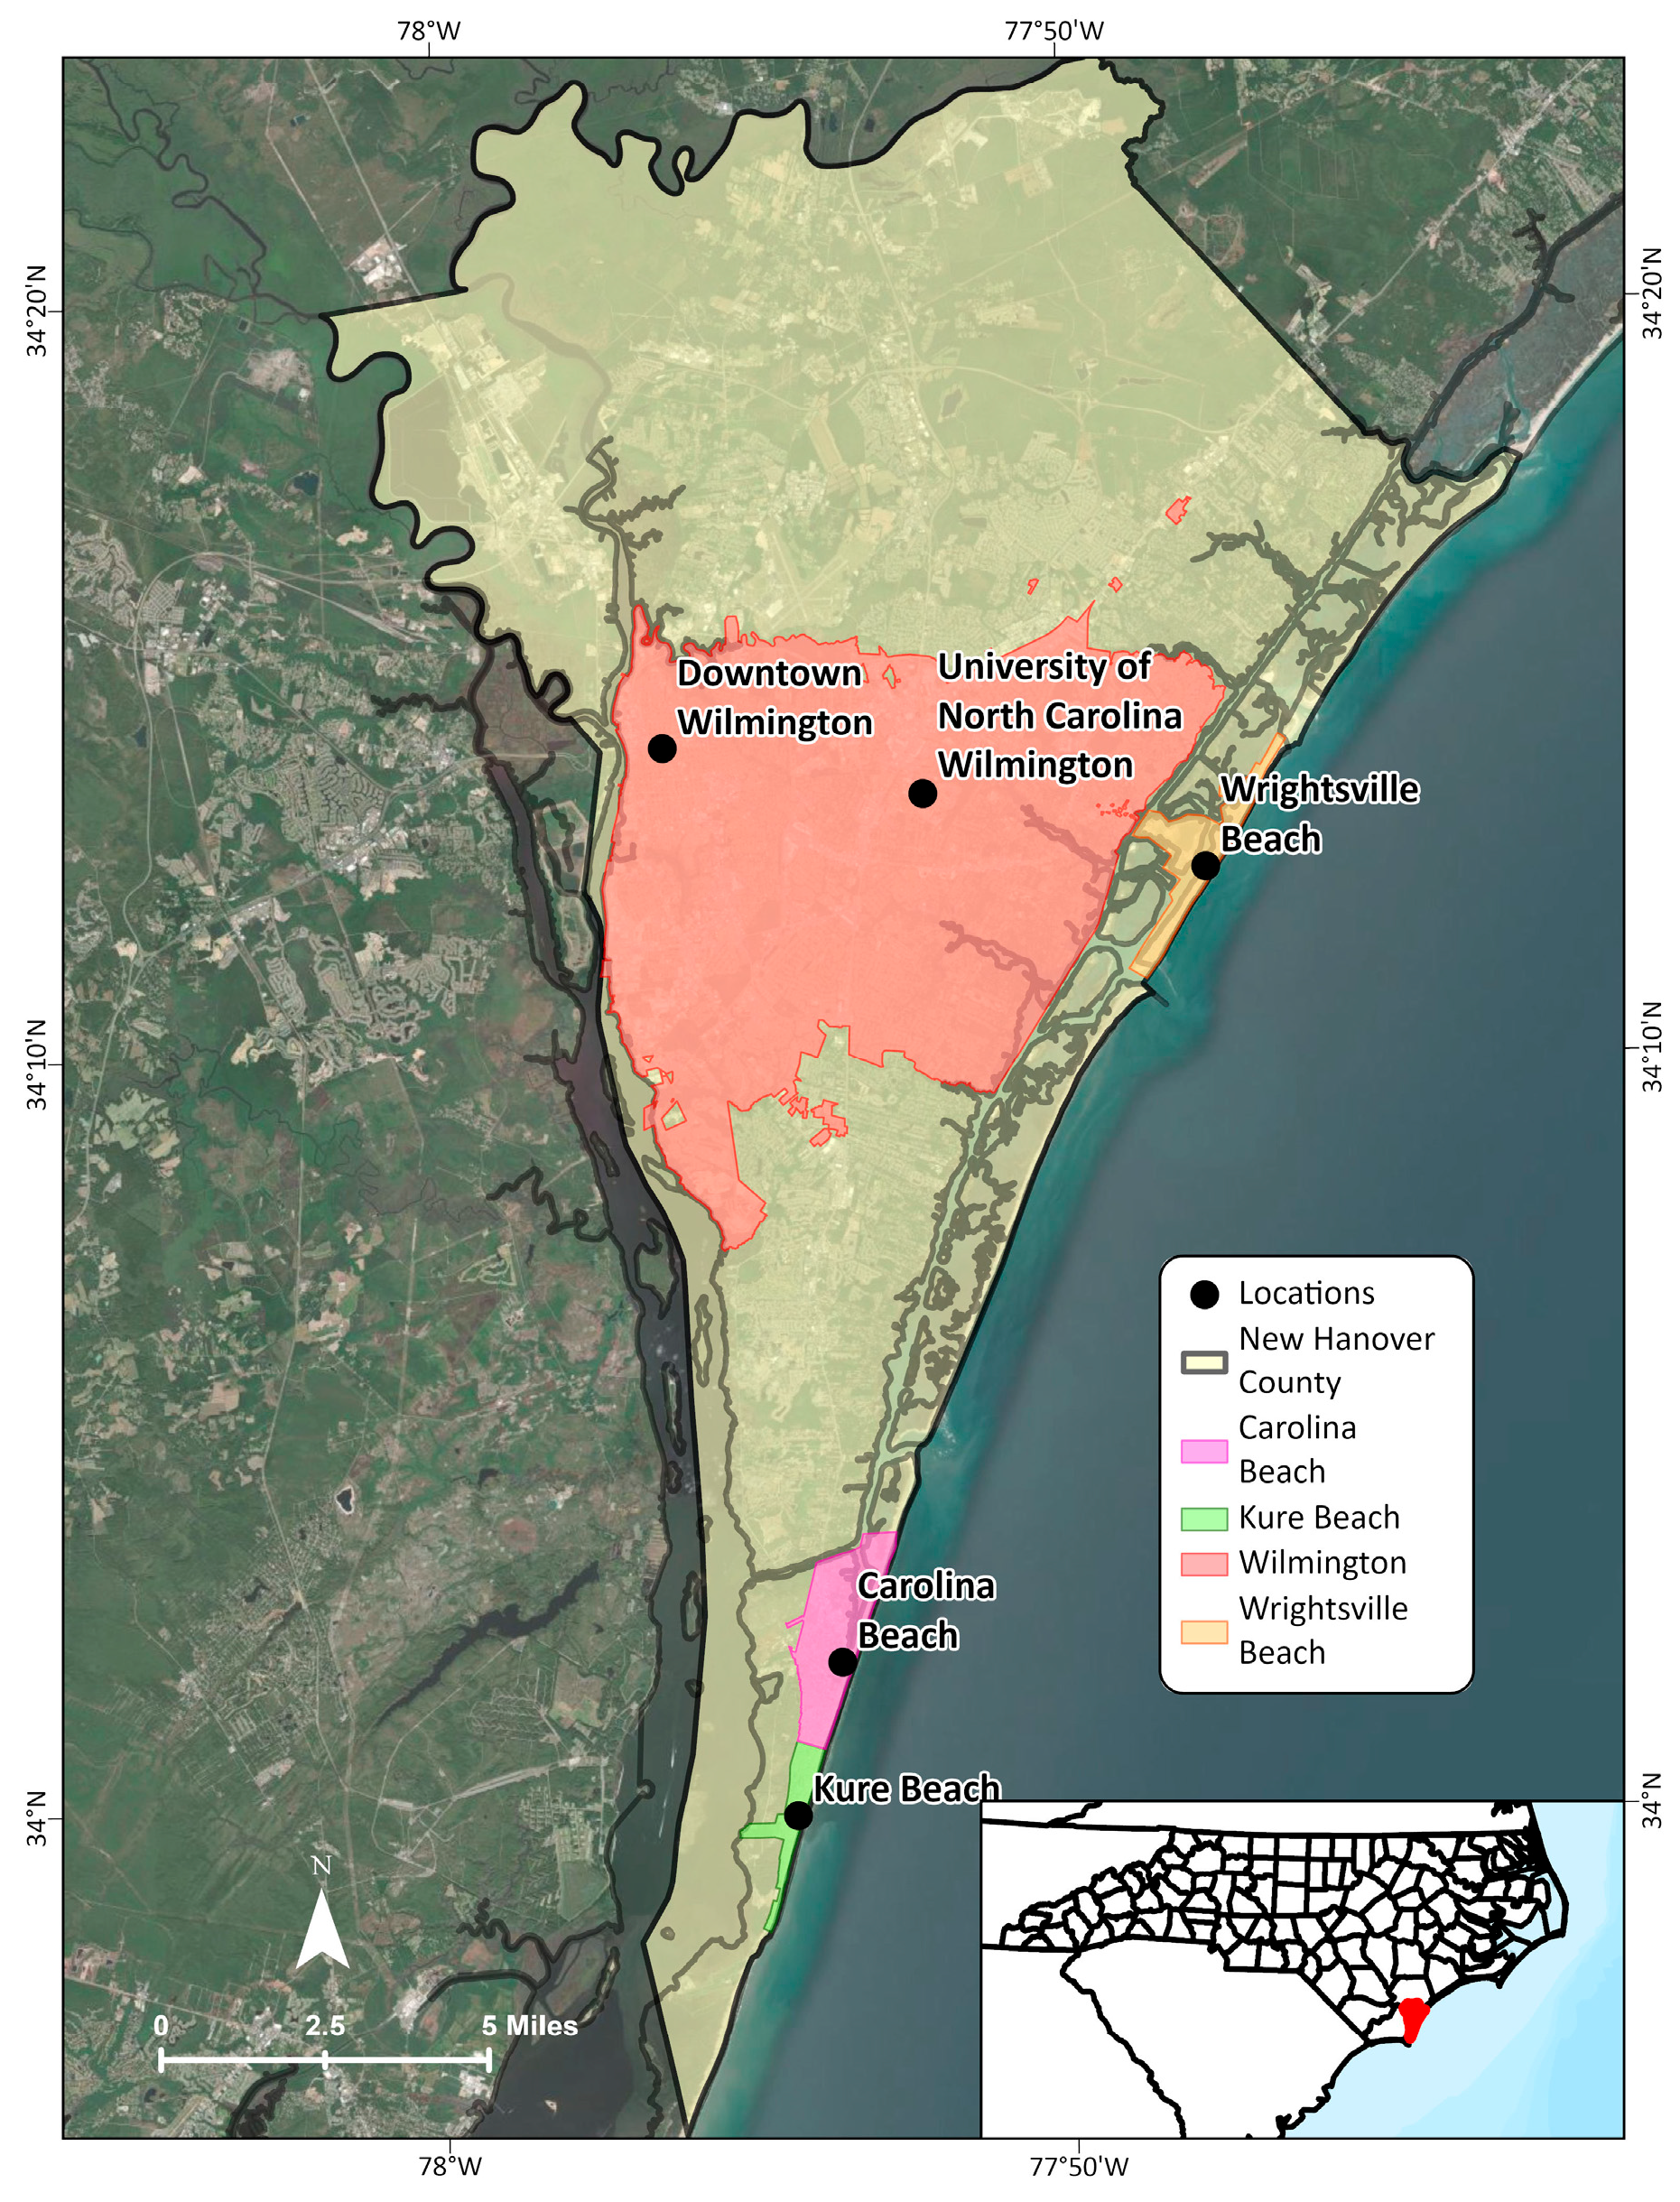
New Hanover County is located in the southern eastern tip of the state of NC and has a land area of 498.05 km2. It includes a mainland and barrier islands that make up the eastern part of the county (Figure 1). The county is bordered by the Cape Fear River on the west and the Atlantic Ocean on the east. The city of Wilmington is located in the center of the county, with several beach towns directly on the coast, including Wrightsville Beach, Carolina Beach and Kure Beach. New Hanover County falls into the Koppen-Geiger climate zone Cfa, which is temperate without a dry season, and with a hot summer [11] (Beck et al., 2018).

Figure 1.
A map of the study area showing New Hanover County, North Carolina.
The county also is part of the Atlantic Coastal Plain geologic region, and consists of three main rock units: Qp, Kp, and Tec. [12]. The Qp unit consists of quaternary rocks and undivided surficial deposits that are primarily made up of sand and clay (Survey, 1985). The Kp unit is made of Cretaceous rocks and is part of the PeeDee Formation, which includes sand, clay, and limestone [12]. Finally, the Tec unit comprises tertiary rocks and is part of the Comfort Member Formation, which contains mostly limestone and dolomite, and the New Hanover Member Formation, which contains pebble conglomerates [12].
3. Data and Methodology
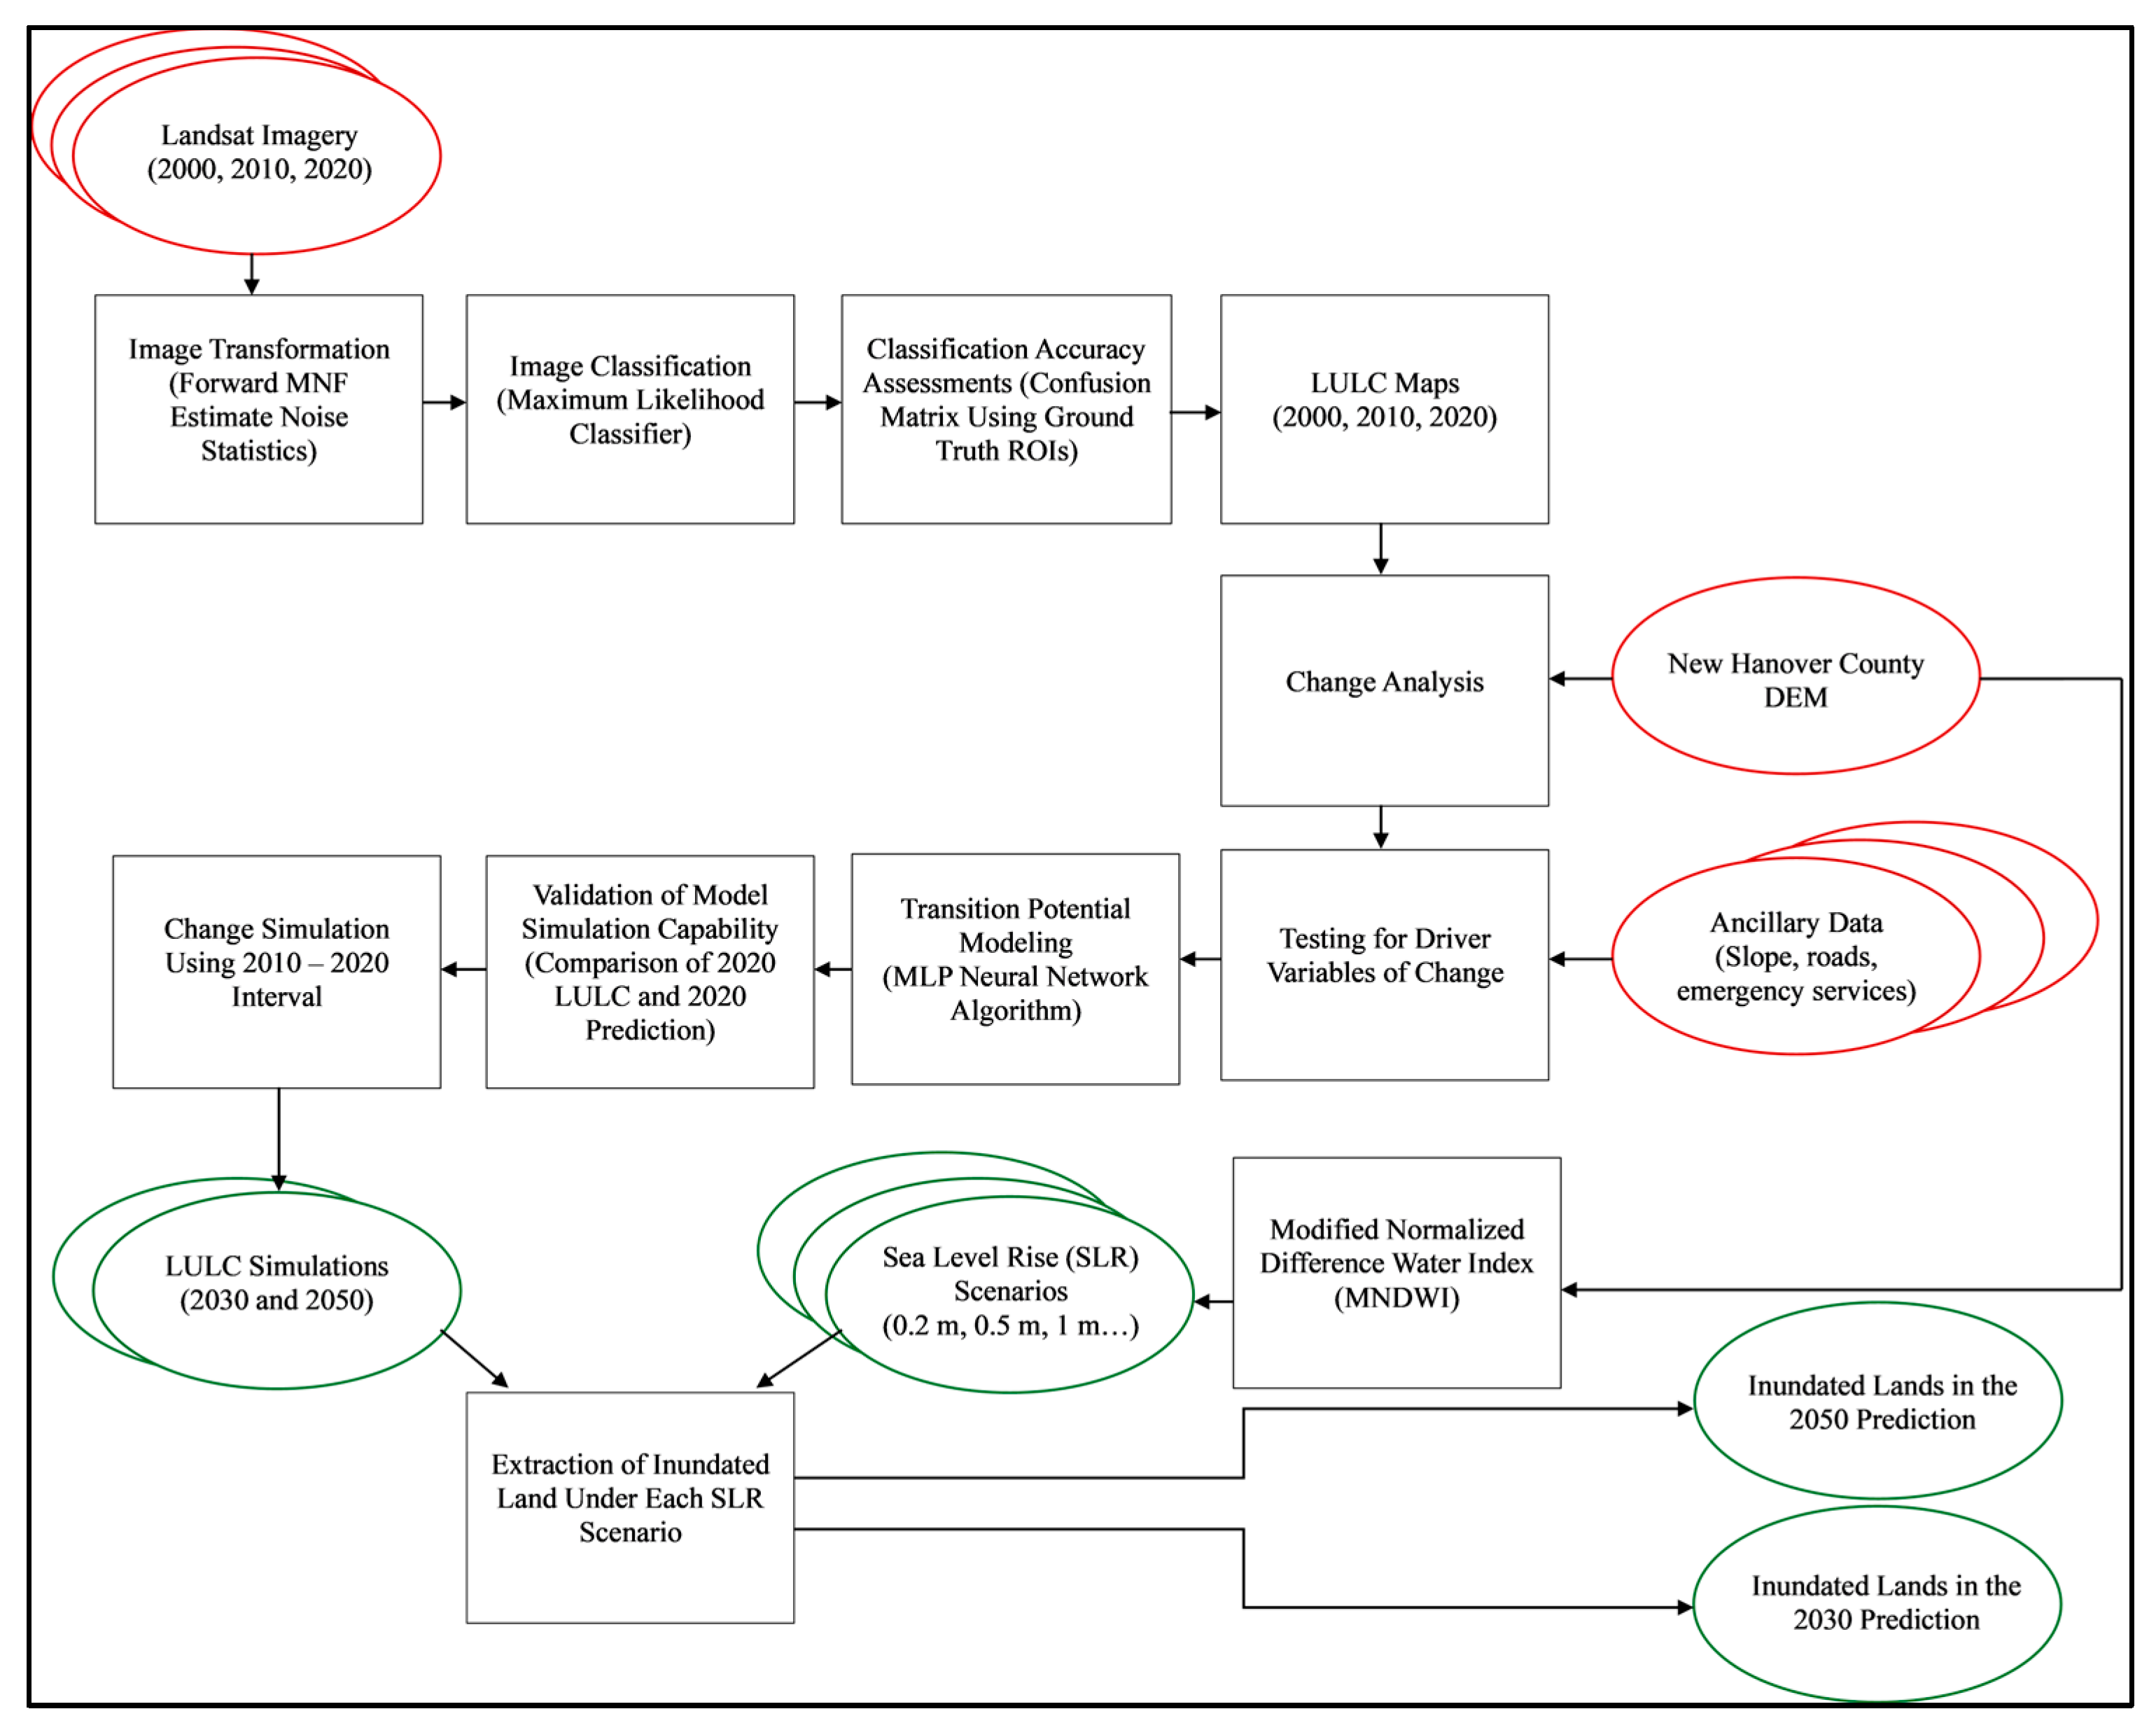
Various data and modeling approaches were utilized in the present work. A simplified workflow of the data and methods used is outlined in Figure 2.

Figure 2.
A simplified workflow of the data and methods used in this study.
3.1. Data Collection and Preparation
The LULC maps for three separate years (2000, 2010 and 2020) were generated for New Hanover County to be used for the LCM. Cloud-free satellite images from Landsat 5 and 8 with a spatial resolution of 30 m, for the county, were obtained from the United States Geological Survey (USGS) (https://earthexplorer.usgs.gov/, accessed 14 September 2023) (Table 1). The Landsat (LS) images were obtained for the wet season (October–November) and covered a period of 20 years to ensure the study area had time to undergo changes in land use/cover.

Table 1.
The satellite and imagery data for each Landsat image used for classification.
The LS images were classified using a hybrid spectral clustering technique. Prior to classifying, each image was processed by using the Minimum Noise Fraction (MNF) transform, a process that is commonly used to reduce the image spectral dimensionality [13]. Most reflectance information needed when classifying an image is provided by the first few bands of the image, meaning information from the remaining bands mainly contributes noise [14]. The Forward MNF Estimate Noise Statistics transform was used to process each image, creating an Eigenvalue graph showing how much information each band contributed to the image, as well as the MNF image itself. Based on the Eigenvalue graphs produced, bands 1–4 for the 2000 and 2010 images and bands 1–5 for the 2020 images were used during classification.
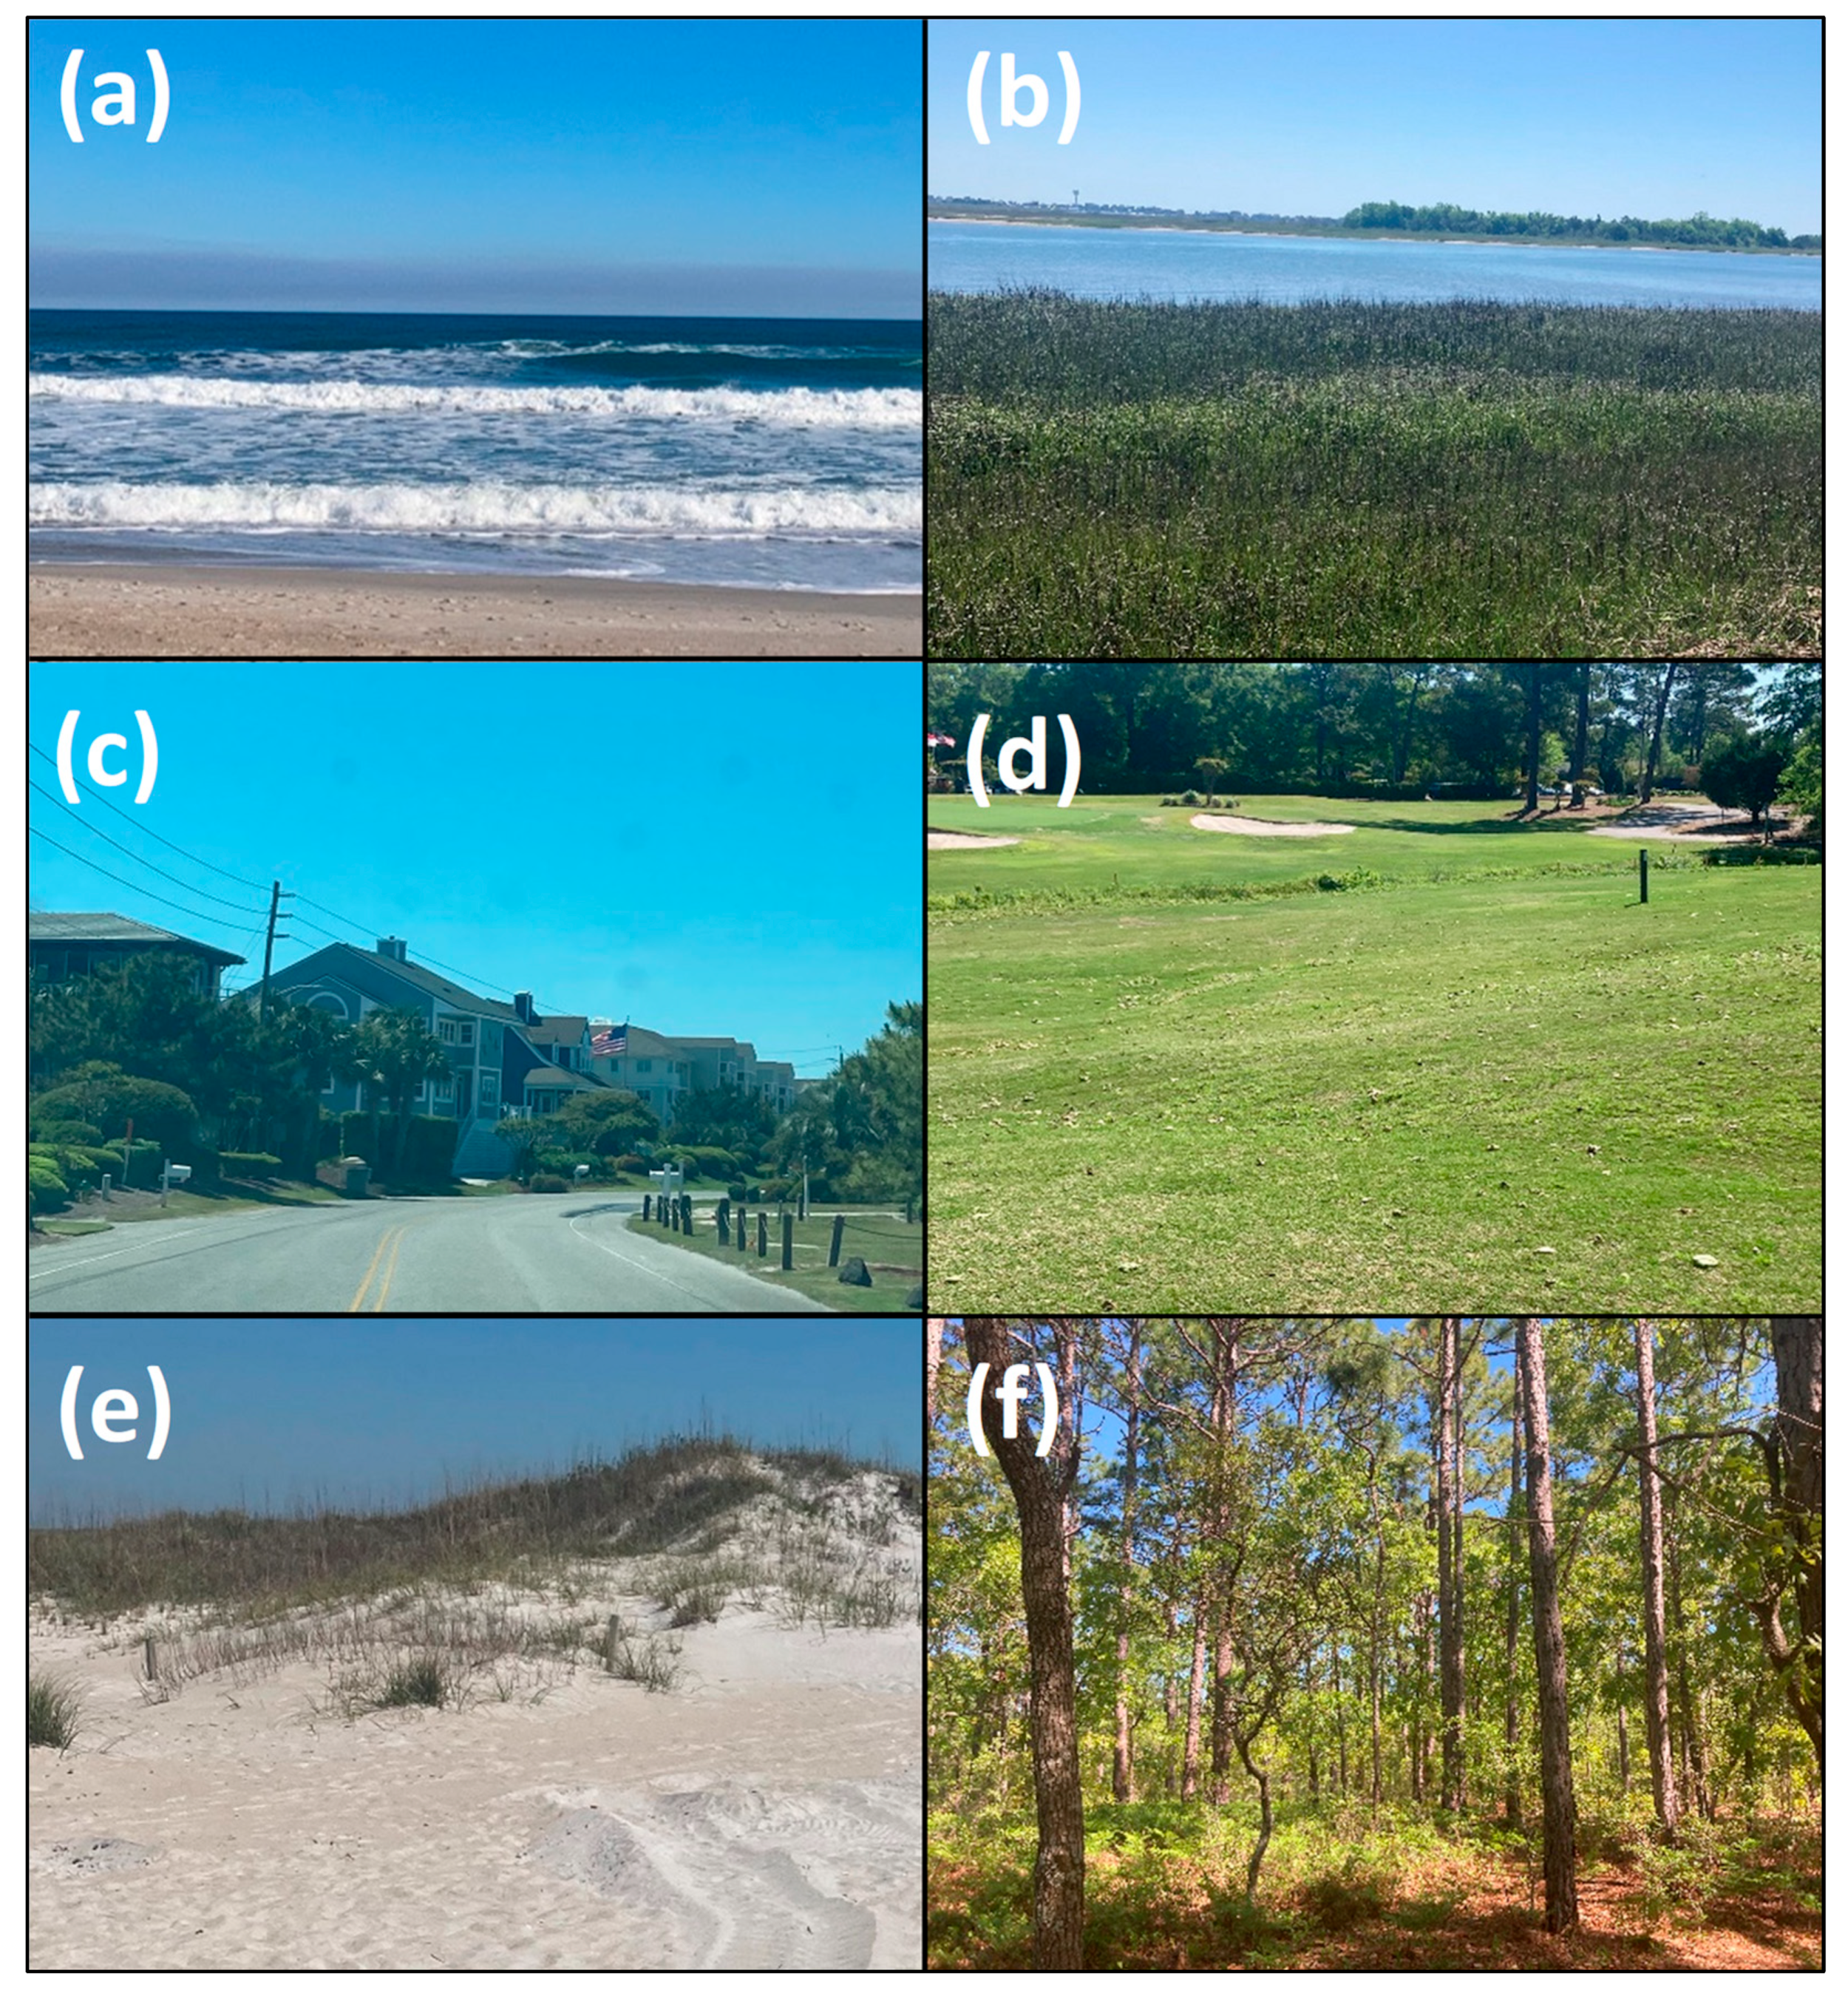
Land cover classification was then performed on the MNF images using the Maximum Likelihood classifier. Training sites were created for the dominant land cover in the study area, including water, wetlands, developed area, bare ground, sand, and vegetation (Figure 3).
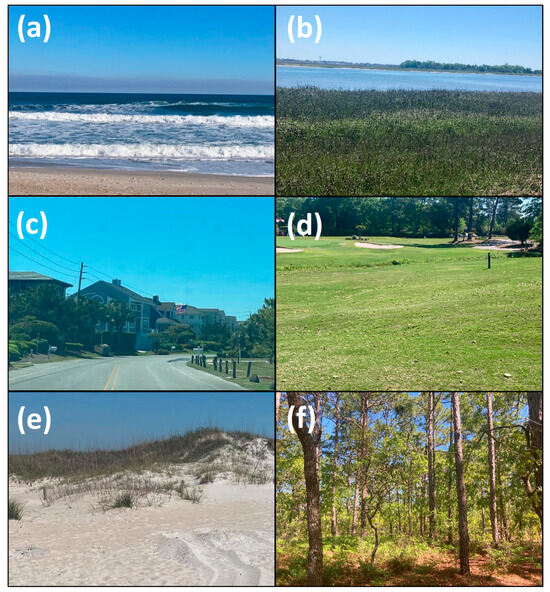
Figure 3.
The land covers used when classifying the Landsat imagery: water (a), wetlands (b), developed area (c), bare ground (d), sand (e), and vegetation (f).
It is important to note that vegetation is defined in this study as any area of vegetation denser than sparse grasslands but does not include wetlands or marshlands, such as forests and shrublands, while bare ground was defined as any area of little to no vegetation that is not primarily composed of sand, including sparse grasslands. The final LULC maps were validated through accuracy assessments, where sample pixels to use in the accuracy assessments were collected in Google Earth Pro, using the historical imagery tool. Two hundred sites were collected for each land cover type and each image year, and were evenly distributed across the study area. The accuracy of the output classification was determined by the ratio of classified points to classified images using the confusion matrix.
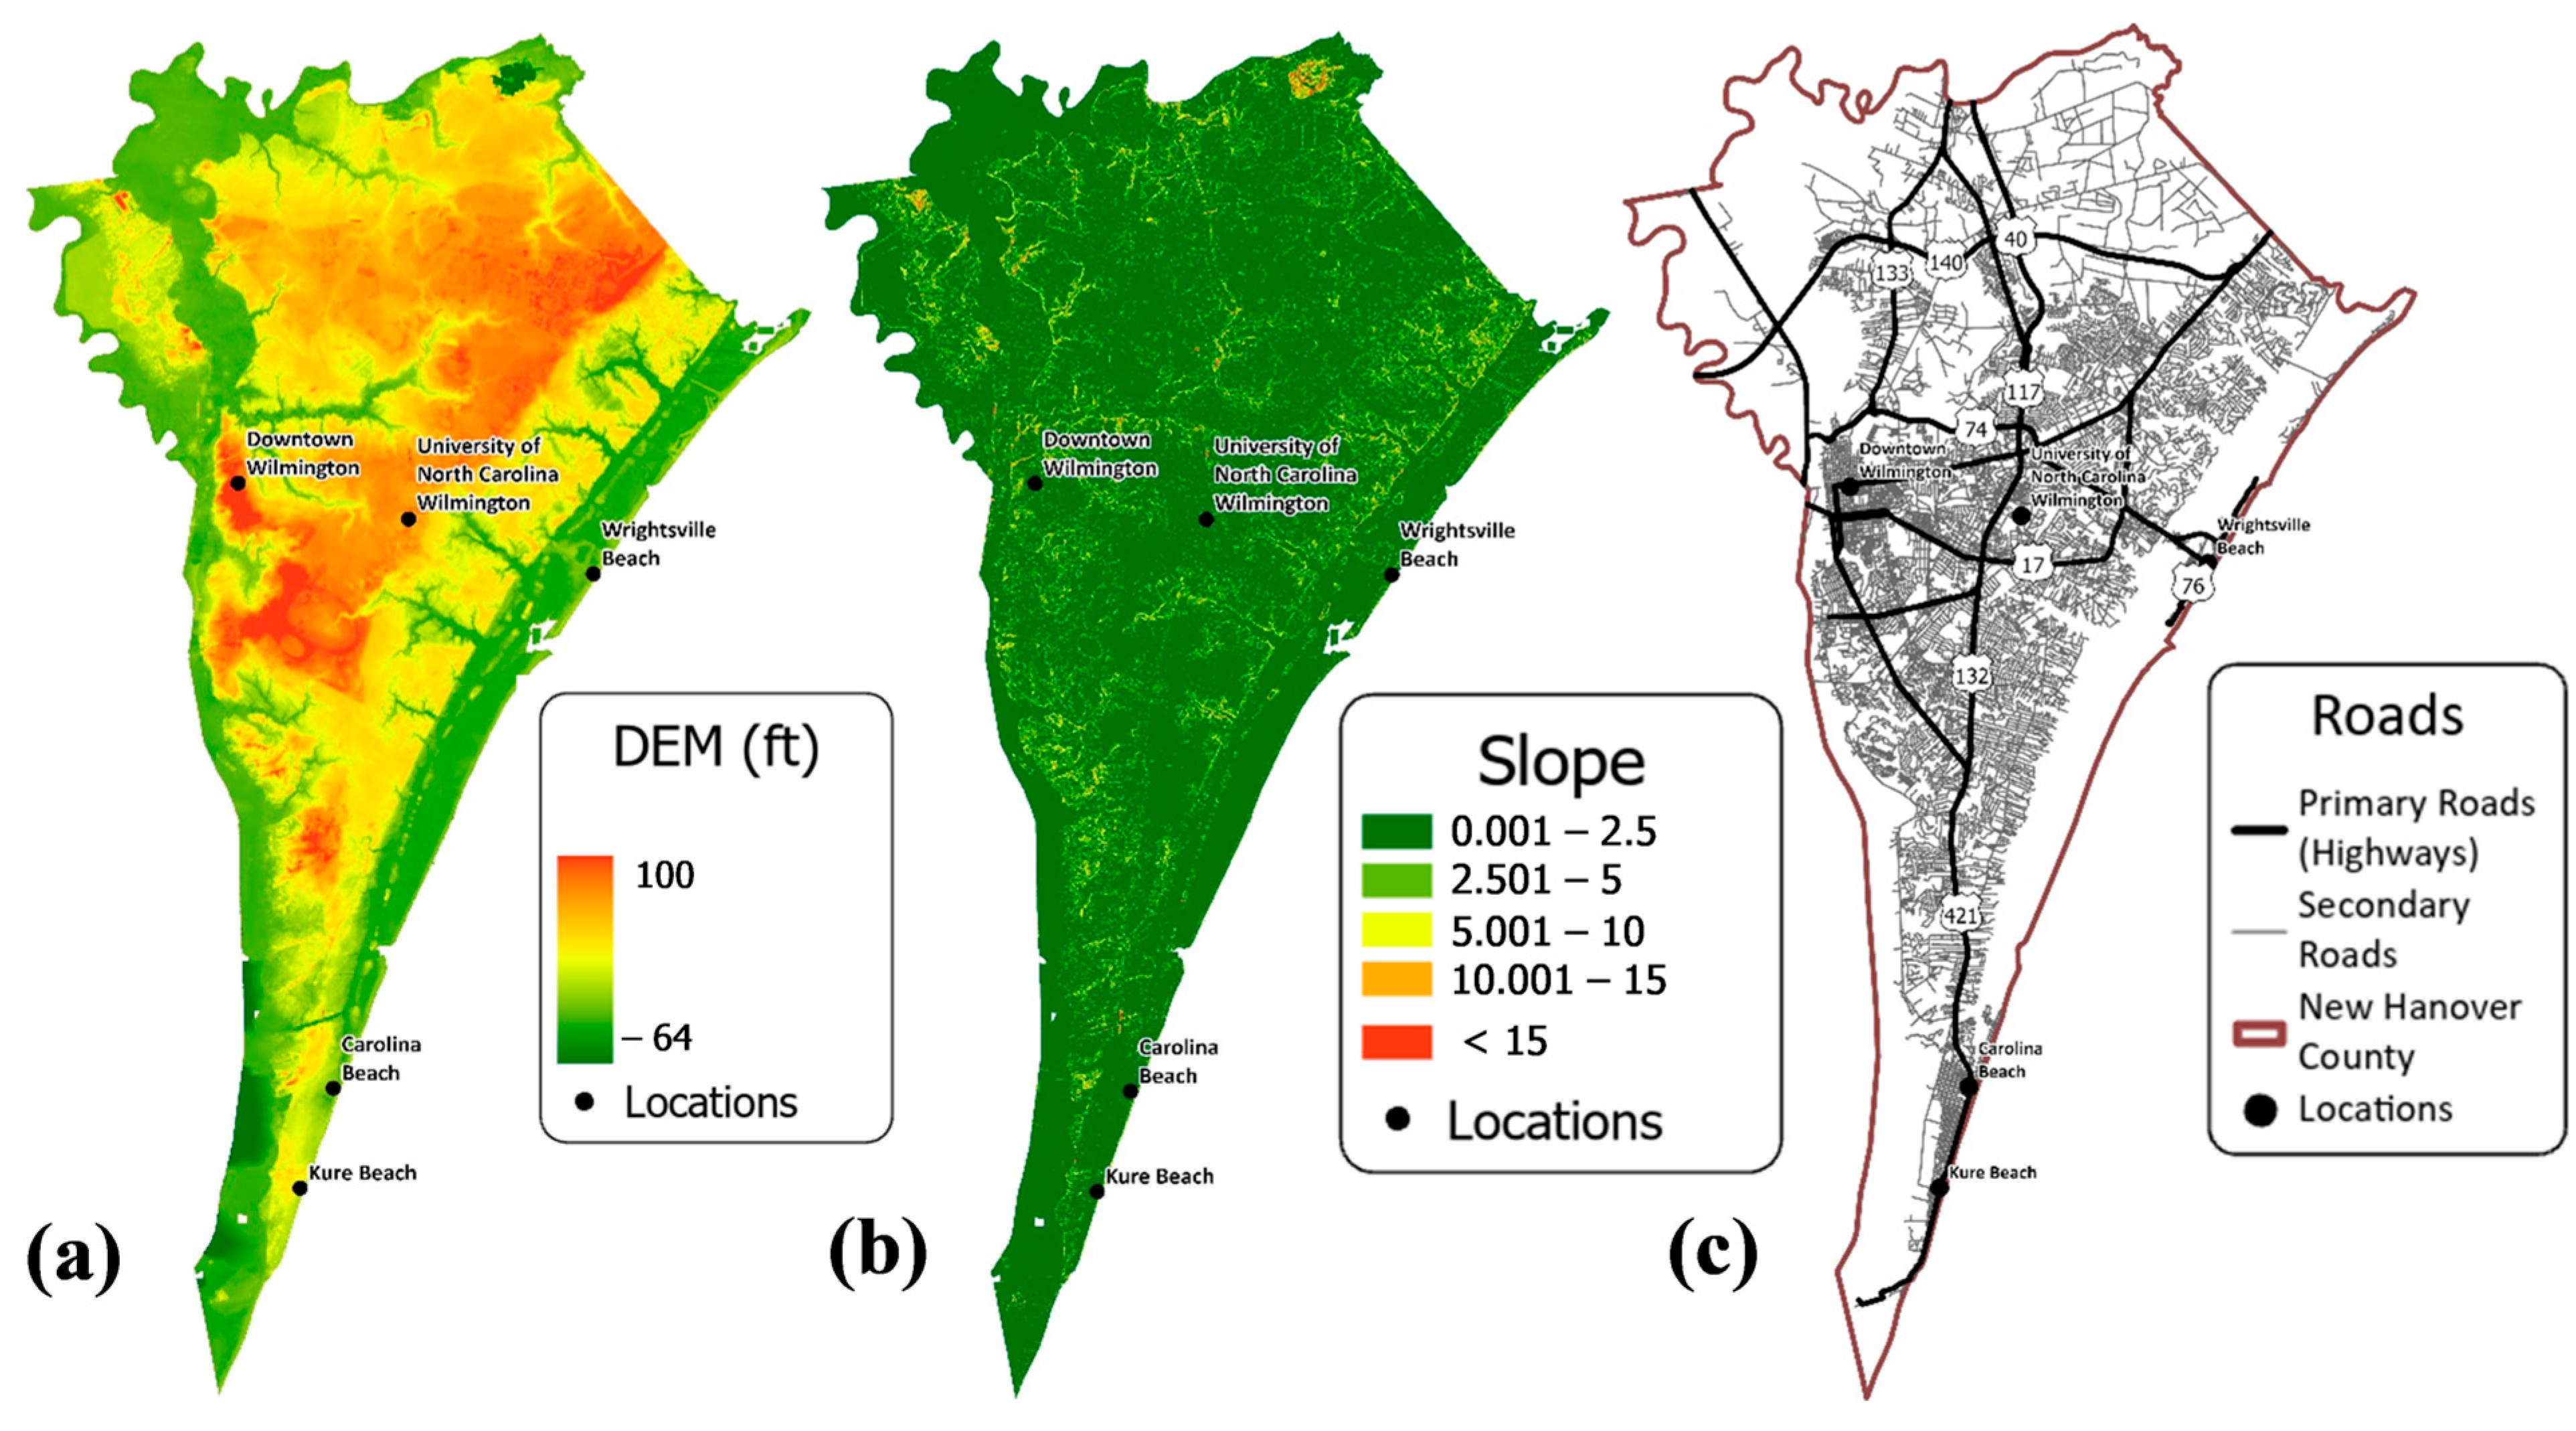
A digital elevation model (DEM) and road network for the county were also included in the LCM. DEM data for New Hanover County was obtained from the North Carolina State University Libraries website (https://www.lib.ncsu.edu/gis/elevation, accessed on 1 September 2023) with a spatial resolution of 20 feet (~6 m) (Figure 4). The DEM dataset was also used to derive the surface gradient (slope) layer for the county (Figure 4). Road network data were obtained for the state from NC OneMap (https://www.nconemap.gov/, accessed on 1 September 2023), and the data for New Hanover County were extracted (Figure 4).

Figure 4.
The Digital Elevation Model (DEM) (a), slope (b), and road network (c) maps of New Hanover County.
3.2. Land Change Modeler (LCM)
The LCM module of TerrSet, which was adopted in this study, consists of the following main stages: a change analysis, a transition potential modeling, and a change prediction and model validation.
3.2.1. Change Analysis
The change analysis stage identifies all transitions of land cover classes between two different years [15,16]. In this case, the change analysis was performed between the LULC maps of 2000 and 2010. First, all transitions between land covers were identified, and net changes for each land cover were calculated to understand how each class had changed in area through the 10-year period. Then, transitions between developed land cover and all other land cover types, specifically, were extracted, as this study was primarily concerned with changes in development.
3.2.2. Transition Potential Modeling
The transition potential modeling section of the LCM is used to determine the driver variables, or variables that influence change from other land cover classes to developed land [15,16]. Multiple variables were assessed, and the most influential variables were chosen to create the transition potential maps, which show the potential and likelihood for one land cover type to transition to another [15,16]. Variables for testing were chosen based on common driver variables explained by [16], and on variables used in other studies that utilized the LCM discovered through literature review. Variable influence was shown in a report after each test alongside how accurately the transition was modeled. After extensive examination, the following variables were used in one or more transitions: DEM, slope, distance to roads, distance to existing development, distance to water, distance to bare ground, distance to public water sources, distance to public municipal stormwater systems and distance to emergency services. The existing development, water and bare ground data were derived from the 2000 LULC map. Each distance variable was created by producing a Boolean image with the chosen variable pixels being assigned as 1, and all other pixels being assigned as 0. These Boolean images were then run through the Distance module in TerrSet, which produces a continuous surface map of Euclidean distance values from the chosen variable [15,16]. The transition potential maps were then created using the multi-layer perceptron neural network (MLP) method, which is effective when studying complex, non-linear relationships for a small number of transitions [15,16]. This method is a type of artificial neural network (ANN) that uses sample pixels that have gone through the designated transition to train the model to produce the transition potential maps [15,16,17].
3.2.3. Change Prediction and Validation
The change prediction stage of the LCM produces both a hard and a soft prediction map. The hard prediction is an actual LULC map that gives only a single scenario result and is based on a competitive land allocation model, while the soft prediction is a map of vulnerability to change for the given set of transitions [15,16]. The soft prediction results are considered to be more useful because the map aggregates all transition potentials and provides a comprehensive assessment of change potential; it shows the degree to which an area has the right conditions to facilitate change [15,16]. The hard prediction map was created using the Markov Chain analysis. The Markov Chain model is commonly used when monitoring trends in LULC, as well as in ecological modeling [10,18]. The Markov series can represent any point in time “n”, and the algorithm’s random nature is shown in the equation:
Fx(X(tn + 1) ≤ xn + 1|X(tn) = xn, X(tn − 1) = xn − 1, X(t1) = Fx(X(tn + 1) ≤ xn + 1)|X(tn) = xn)
tn represents the most recent LULC used in the model, and tn + 1 represents any point in the future prediction. This model estimates how much land is estimated to change from one land cover class to another from the latest date provided to the predicted date [10] (Hamad et al., 2018). The Markov Chain functions by using the immediate state of its inputs along with a spatially representative base of potential pixel transformations to create a prediction simulation [18]. LULC maps are used as arbitrary variables that transit in sequential steps through a set of probability-ordered states [19].
The final five transition potential maps were used to create a prediction LULC map of 2020 with the purpose of validating the LCM. In the validation section of the LCM, the quality of the hard prediction map is compared to a classified LULC map of the same area from the same year [15,16]. The validation map indicates that a large portion of the exact pixel transformation predictions were inaccurate, but they were still modeled in areas where change actually occurred. This can be verified by using the Receiver Operating Characteristic (ROC) analysis on the soft prediction map. The ROC analysis is commonly used to determine how well a continuous surface has predicted locations given the distribution of a Boolean variable [15,16]. A ROC value of 50% or less indicates that the model cannot accurately predict real-world situations, while values greater than 50% imply that the model has a better prediction capability [20,21]. In the present work, the ROC value produced from the analysis of the Boolean map and the soft prediction was 70%, which indicates a high statistical similarity between the maps and therefore adequate model performance. Ref. [21] also modeled various urban growth scenarios for the Miami metropolitan area using the TerrSet LCM, and received ROC values ranging between 75 and 83%, while Ref. [18] received values between 86 and 88% when modeling urban growth in the eastern Nile Delta area. With the LCM’s performance validated, prediction maps for 2030 and 2050 could be produced. A change analysis was performed for the 2010 and 2020 LULC maps, and transitions involving developed land were again extracted. Transition potential maps of the same five transitions were created for this period using the same variables as those for the 2000 to 2010 model. Distance variables specific to the year were re-created to represent the state of the variables in 2010.
3.3. SLR Scenarios
A total of seven SLR scenarios were modeled for New Hanover County. These scenarios were 0.2 m, 0.5 m, 1 m, 1.5 m, 2 m, 2.5 m, and 3 m of SLR which were based on the SLR predictions for coastal North Carolina from [3] that explained the lowest SLR estimate for North Carolina as 0.2 m, and the most extreme SLR estimate as 3 m by 2100. The ground surface that fell into these SLR levels and their associated land cover were extracted to show what areas of the county would be inundated under each scenario, and which land cover would be affected the most by each SLR scenario in 2030 and 2050. The scenarios were modeled using the Modified Normalized Difference Water Index (MNDWI), the DEM layer, and the generated LULC prediction layers for 2030 and 2050. An MNDWI was created using spectral indices and a Decision Tree algorithm to mainly separate surface land from water areas to extract surface inundation levels.
4. Results
4.1. LULC Maps and Accuracy Assessments
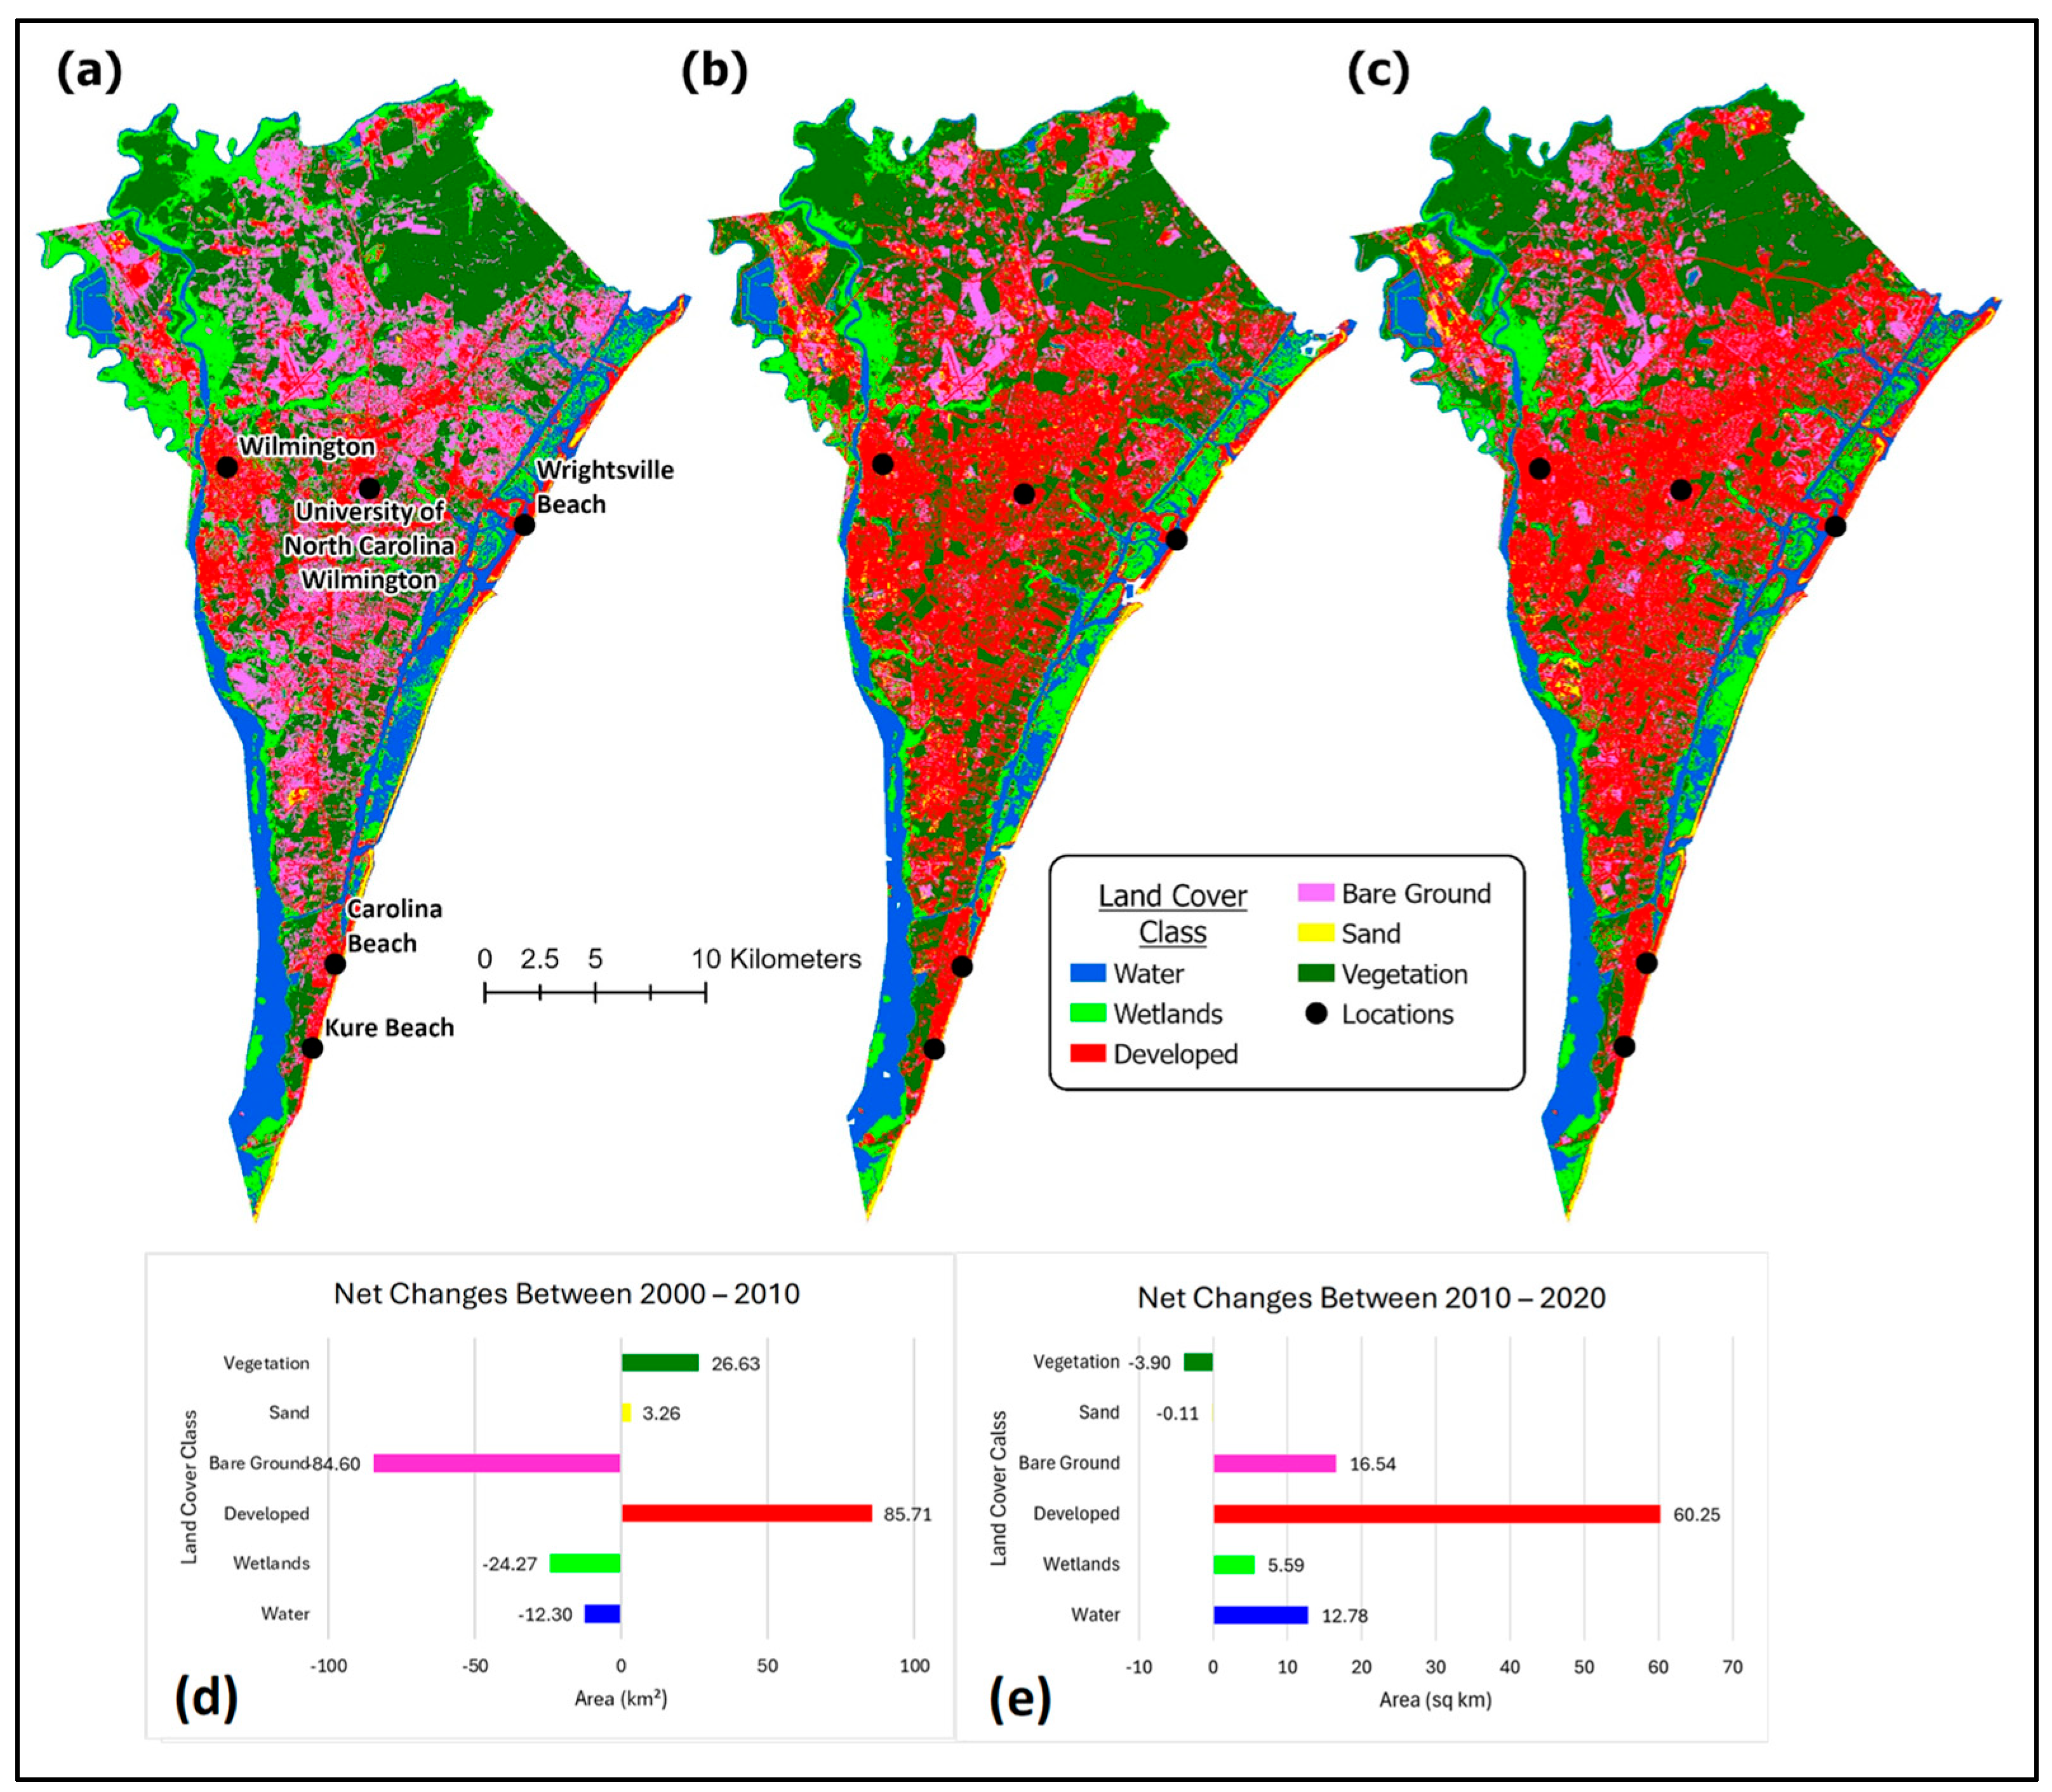
The entire study area of New Hanover County saw the most increase in developed land cover throughout the study period (2000–2020) (Figure 5). Developed land had a net increase of 85.71 km2 between 2000 and 2010, with much of this change clustered in the center area of the county. There were also noticeable transitions of bare ground land to developed land in the northern central section centered around major roads. The net change graph of the transition from 2000 to 2010 confirms the decrease in bare ground land, with a net loss of 84.6 km2. Vegetated land cover also experienced a net increase, of 26.63 km2. Considerable areas of increased vegetation appeared in the northwestern corner of the study area, which had large sections of wetlands in 2000 that transformed to vegetation by 2010, which could have contributed to the net loss of 24.27 km2 of wetlands in this period.

Figure 5.
The generated LULC maps for 2000 (a), 2010 (b), and 2020 (c), with the net changes for each land cover class between the time periods 2000 to 2010 (d) and 2010 to 2020 (e).
Between 2010 and 2020, developed land again increased significantly, with a net increase of 60.25 km2. This development seemed to be focused at the center of the county again, with the pre-existing developed land expanding outward. The 2010 LULC map shows areas of vegetation between developed lands in the central area, and these vegetated areas appeared to be minimized by more development in 2020. Notably, bare ground experienced a net increase of 16.54 km2 in this time period, visible in the expansion of pre-existing bare ground lands near the Wilmington International Airport (ILM) and in the northern central parts of the county.
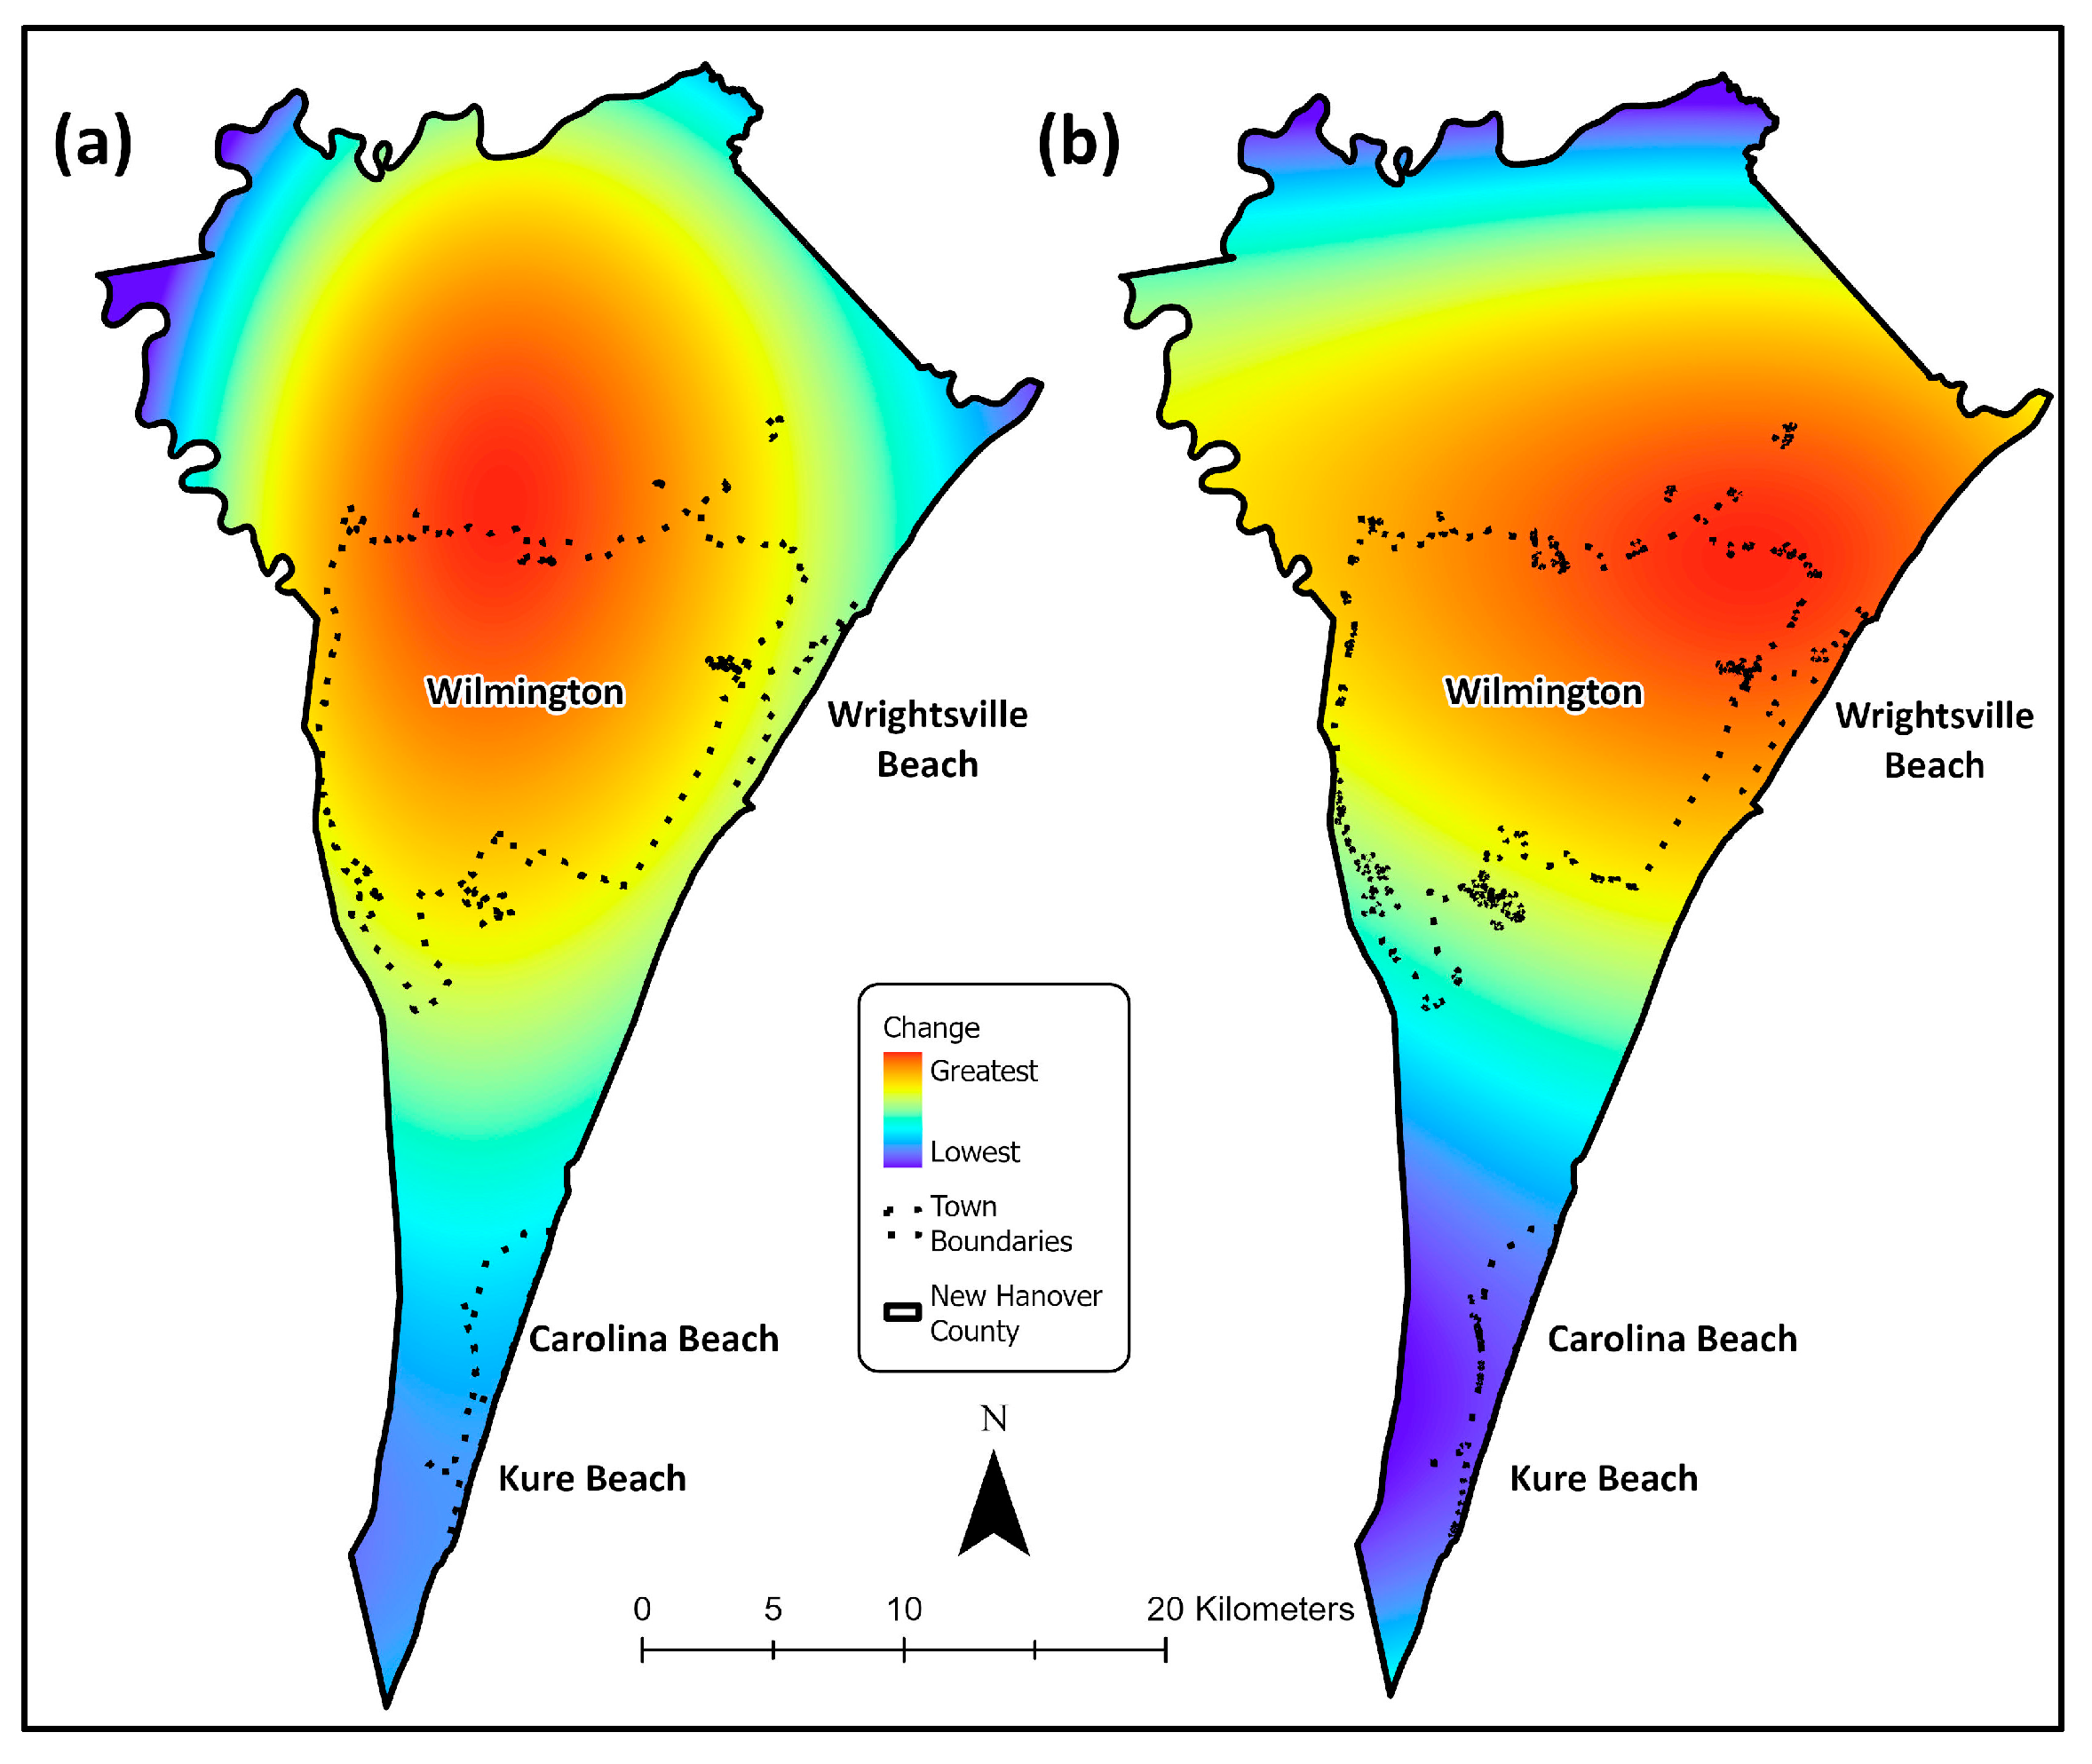
The primary areas of change in development can also be verified by the spatial trend of change maps that can be produced in the LCM (Figure 6). These maps show where change to or from a specific land cover is generalized [16]. The spatial trend of change between 2000 and 2010 was focused in the center of the county, in the Wilmington area, but shifted to be closer to the coastline between 2010 and 2020. During both transitions, the lowest amount of change was located around the borders of New Hanover County.

Figure 6.
The spatial trend of change from all other land cover types to developed land between 2000 and 2010 (a) and 2010 and 2020 (b).
The accuracy assessments conducted on each LULC map after classification indicated high overall accuracies of 84.87% for 2000, 93.42% for 2010, and 88.67% for 2020. The high accuracy of each LULC map implied strong correlation between the LS-derived classification maps and ground truth data, meaning the LULC maps could be used in further modeling and analysis with the LCM.
4.2. 2030 and 2050 Prediction Maps
The predicted change maps created in the LCM using the Markov Chain indicate that developed land is expected to continue to increase significantly throughout New Hanover by 2030 and 2050. Analysis of the net change between 2030 and 2050 shows that developed land is the only category expected to see a net increase; every other land cover is expected to experience net losses. Visual interpretation of the prediction maps shows developed areas continuing to increase in central parts of the county in Wilmington as they did between 2000 and 2020. Small sections of land that had still been designated as bare ground and vegetation around Wilmington in 2020 are expected to be minimized significantly and transformed to developed land by 2030, and the remaining vegetated and bare ground lands in 2030 may mostly be converted to developed land by 2050. The net increase expected in developed land cover between 2030 and 2050 is 63.66 km2. The disappearance of bare ground and vegetated lands is evident in the net change graph as well, with these categories experiencing net losses of 10.70 km2 and 36.67 km2, respectively.
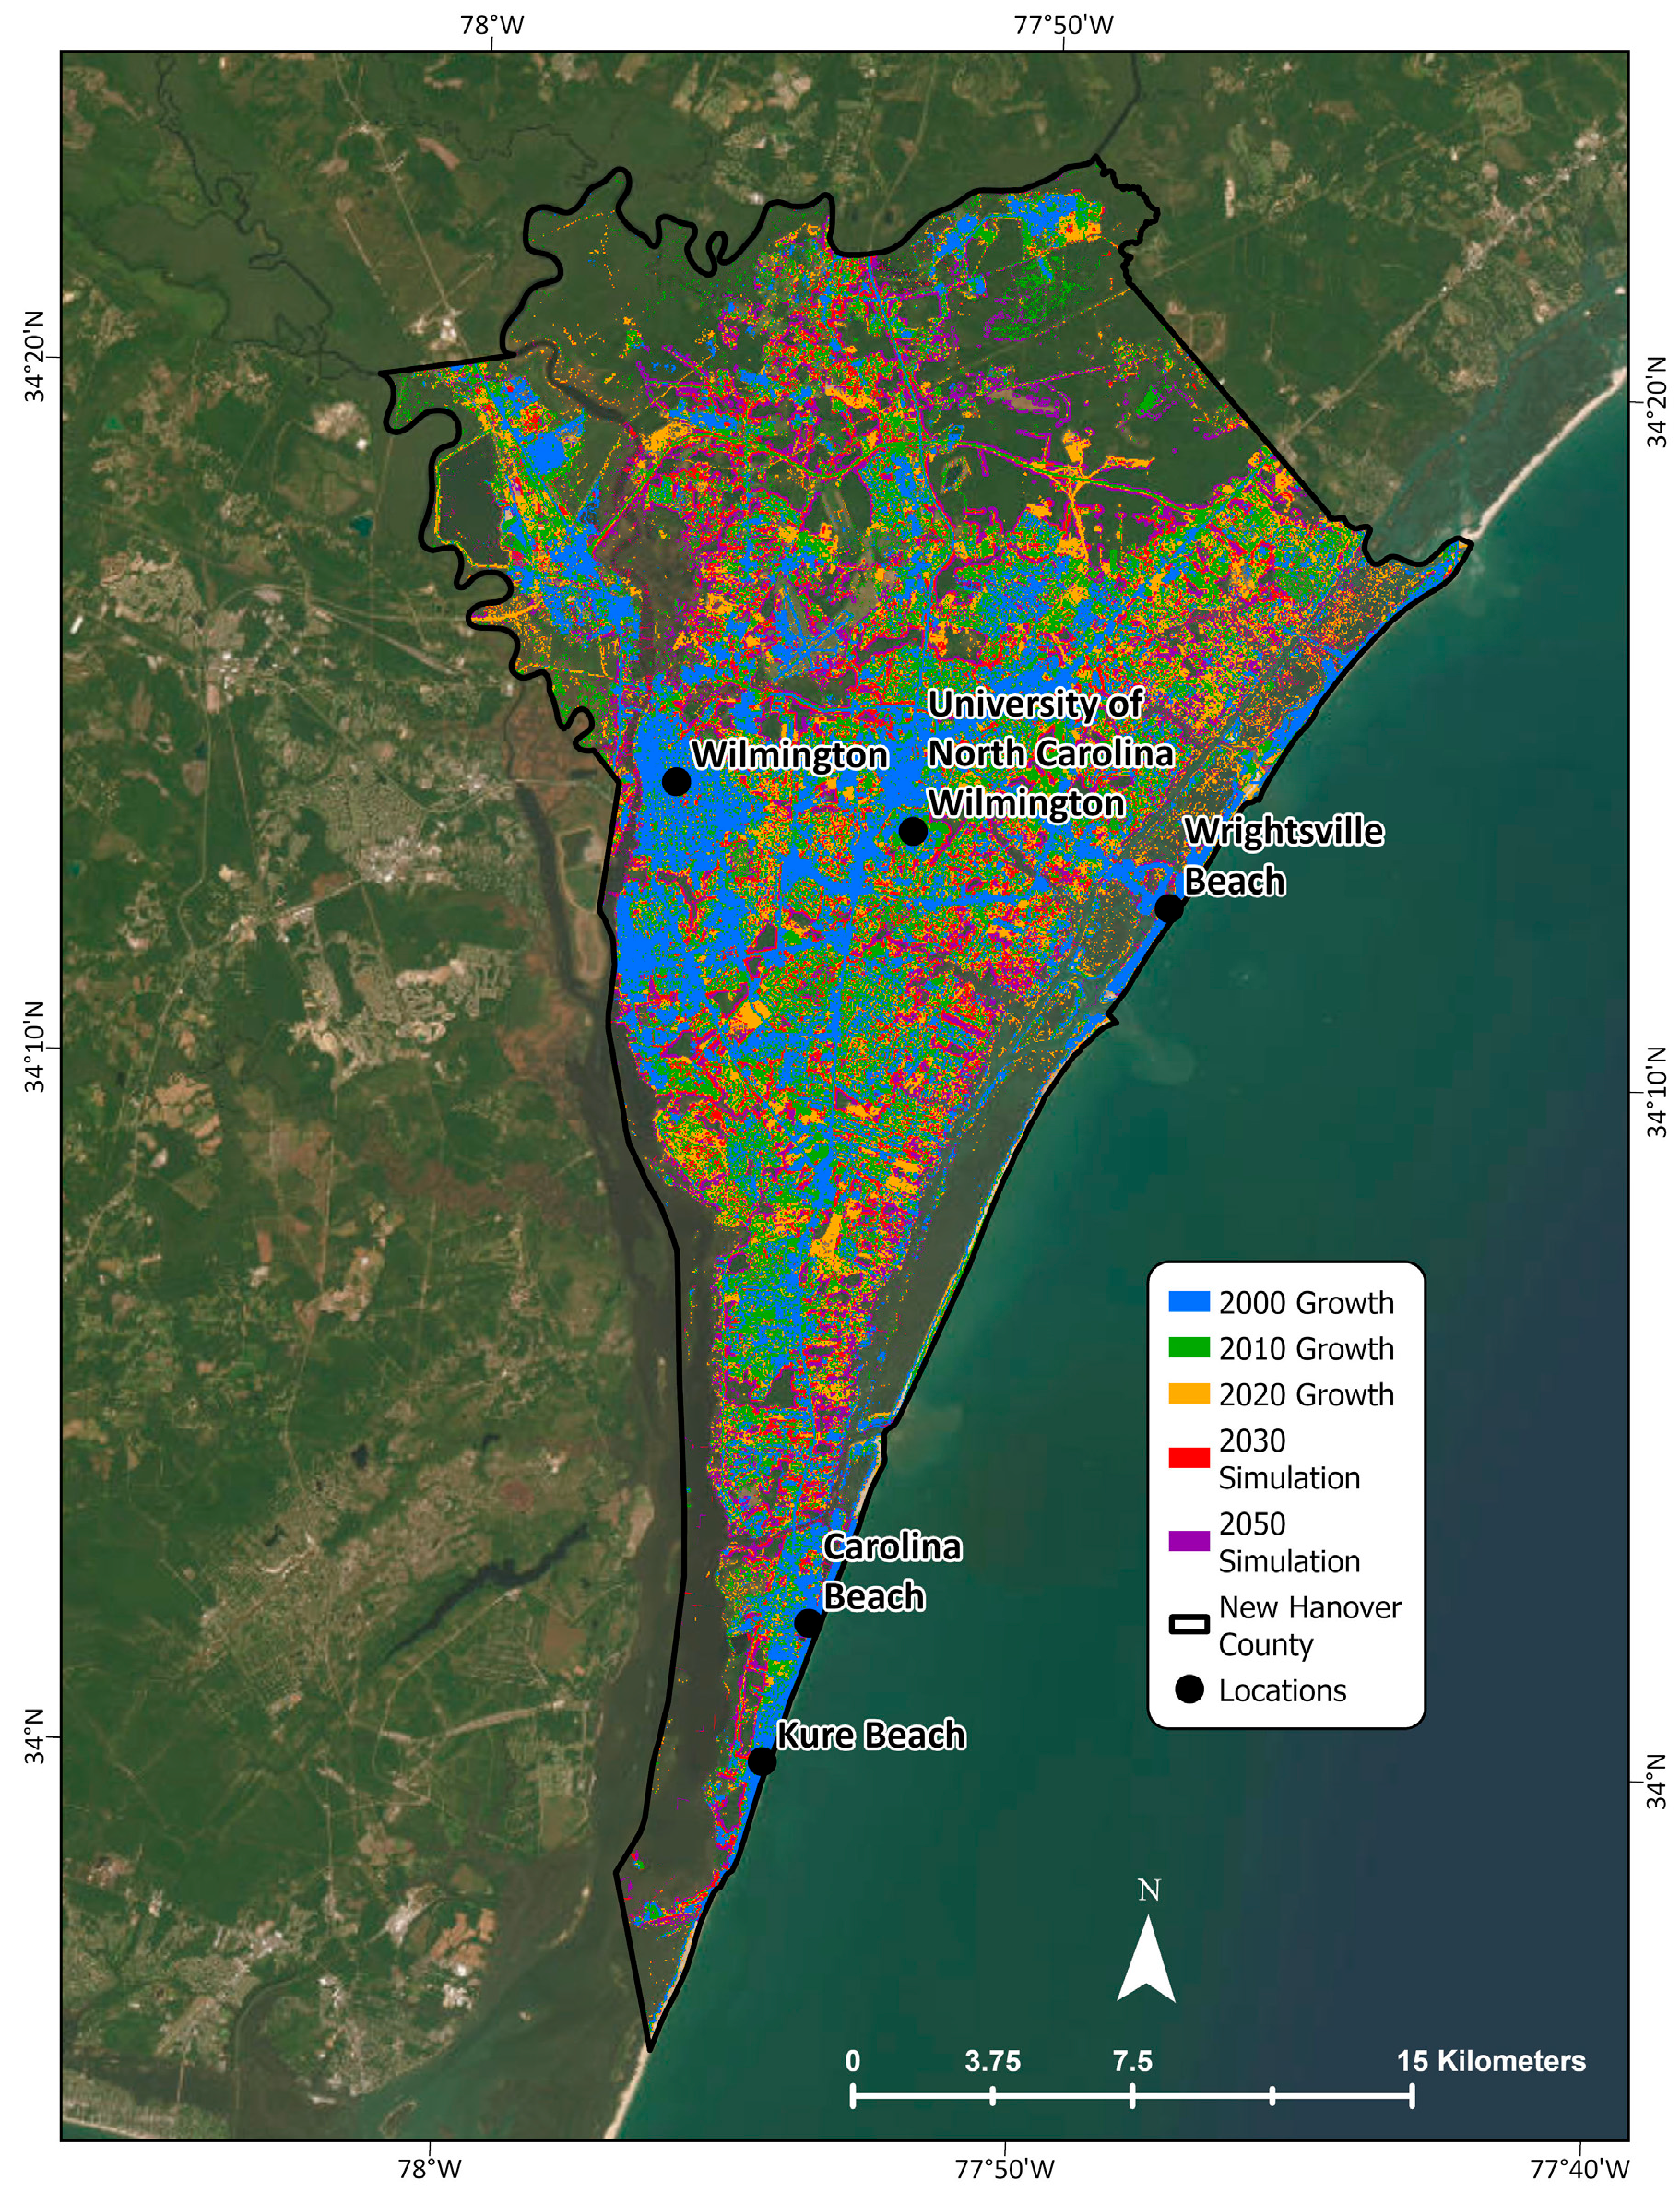
Comparison of overall area values of each land cover between the classified 2020 LULC map and the predicted 2030 and 2050 maps confirms rapid urbanization and development in New Hanover County. Developed land increases by 55.6% (136.79 km2) from 2020 to 2050, while vegetation, sand, bare ground, wetlands, and water all decrease by 39.05% (76.44 km2), 60.92% (5.97 km2), 46.36% (29.13 km2), 30.57% (22.25 km2) and 15.5% (11.11 km2), respectively. The distribution of development can be clearly seen in Figure 7, which shows the actual increases in development in 2000, 2010, and 2020, and the predicted development in 2030 and 2050. Development expands outward from existing urban areas between 2000, 2010, and 2020 and is predicted to continue this pattern through 2030 and 2050, with the addition of predicted development along the major roads and highways located in the north central part of New Hanover County.

Figure 7.
Actual and simulated development throughout New Hanover County, showing development has expanded outward from existing developed areas and is expected to continue this pattern.
A soft prediction map was also generated for 2030 and 2050 to show areas likely to transition from one land cover to developed land cover. This prediction is favored when determining large regions that are at risk of transition compared to the hard prediction, which is restrictive because it shows change by individual pixels. The soft prediction map shows that areas with high potential to transition are primarily located in the northwestern section of the county and appear to be surrounding major roads and pre-existing developed land. There are also areas with high potential to transition to developed land along the east and west sides of the county, near the Cape Fear River and along the barrier islands that make up the west coast of the county. This supports the hard prediction results showing areas of land cover change throughout the northwestern portion of New Hanover County, around major roads, and pre-existing developed land, and along the Cape Fear River and barrier islands.
4.3. SLR Scenarios
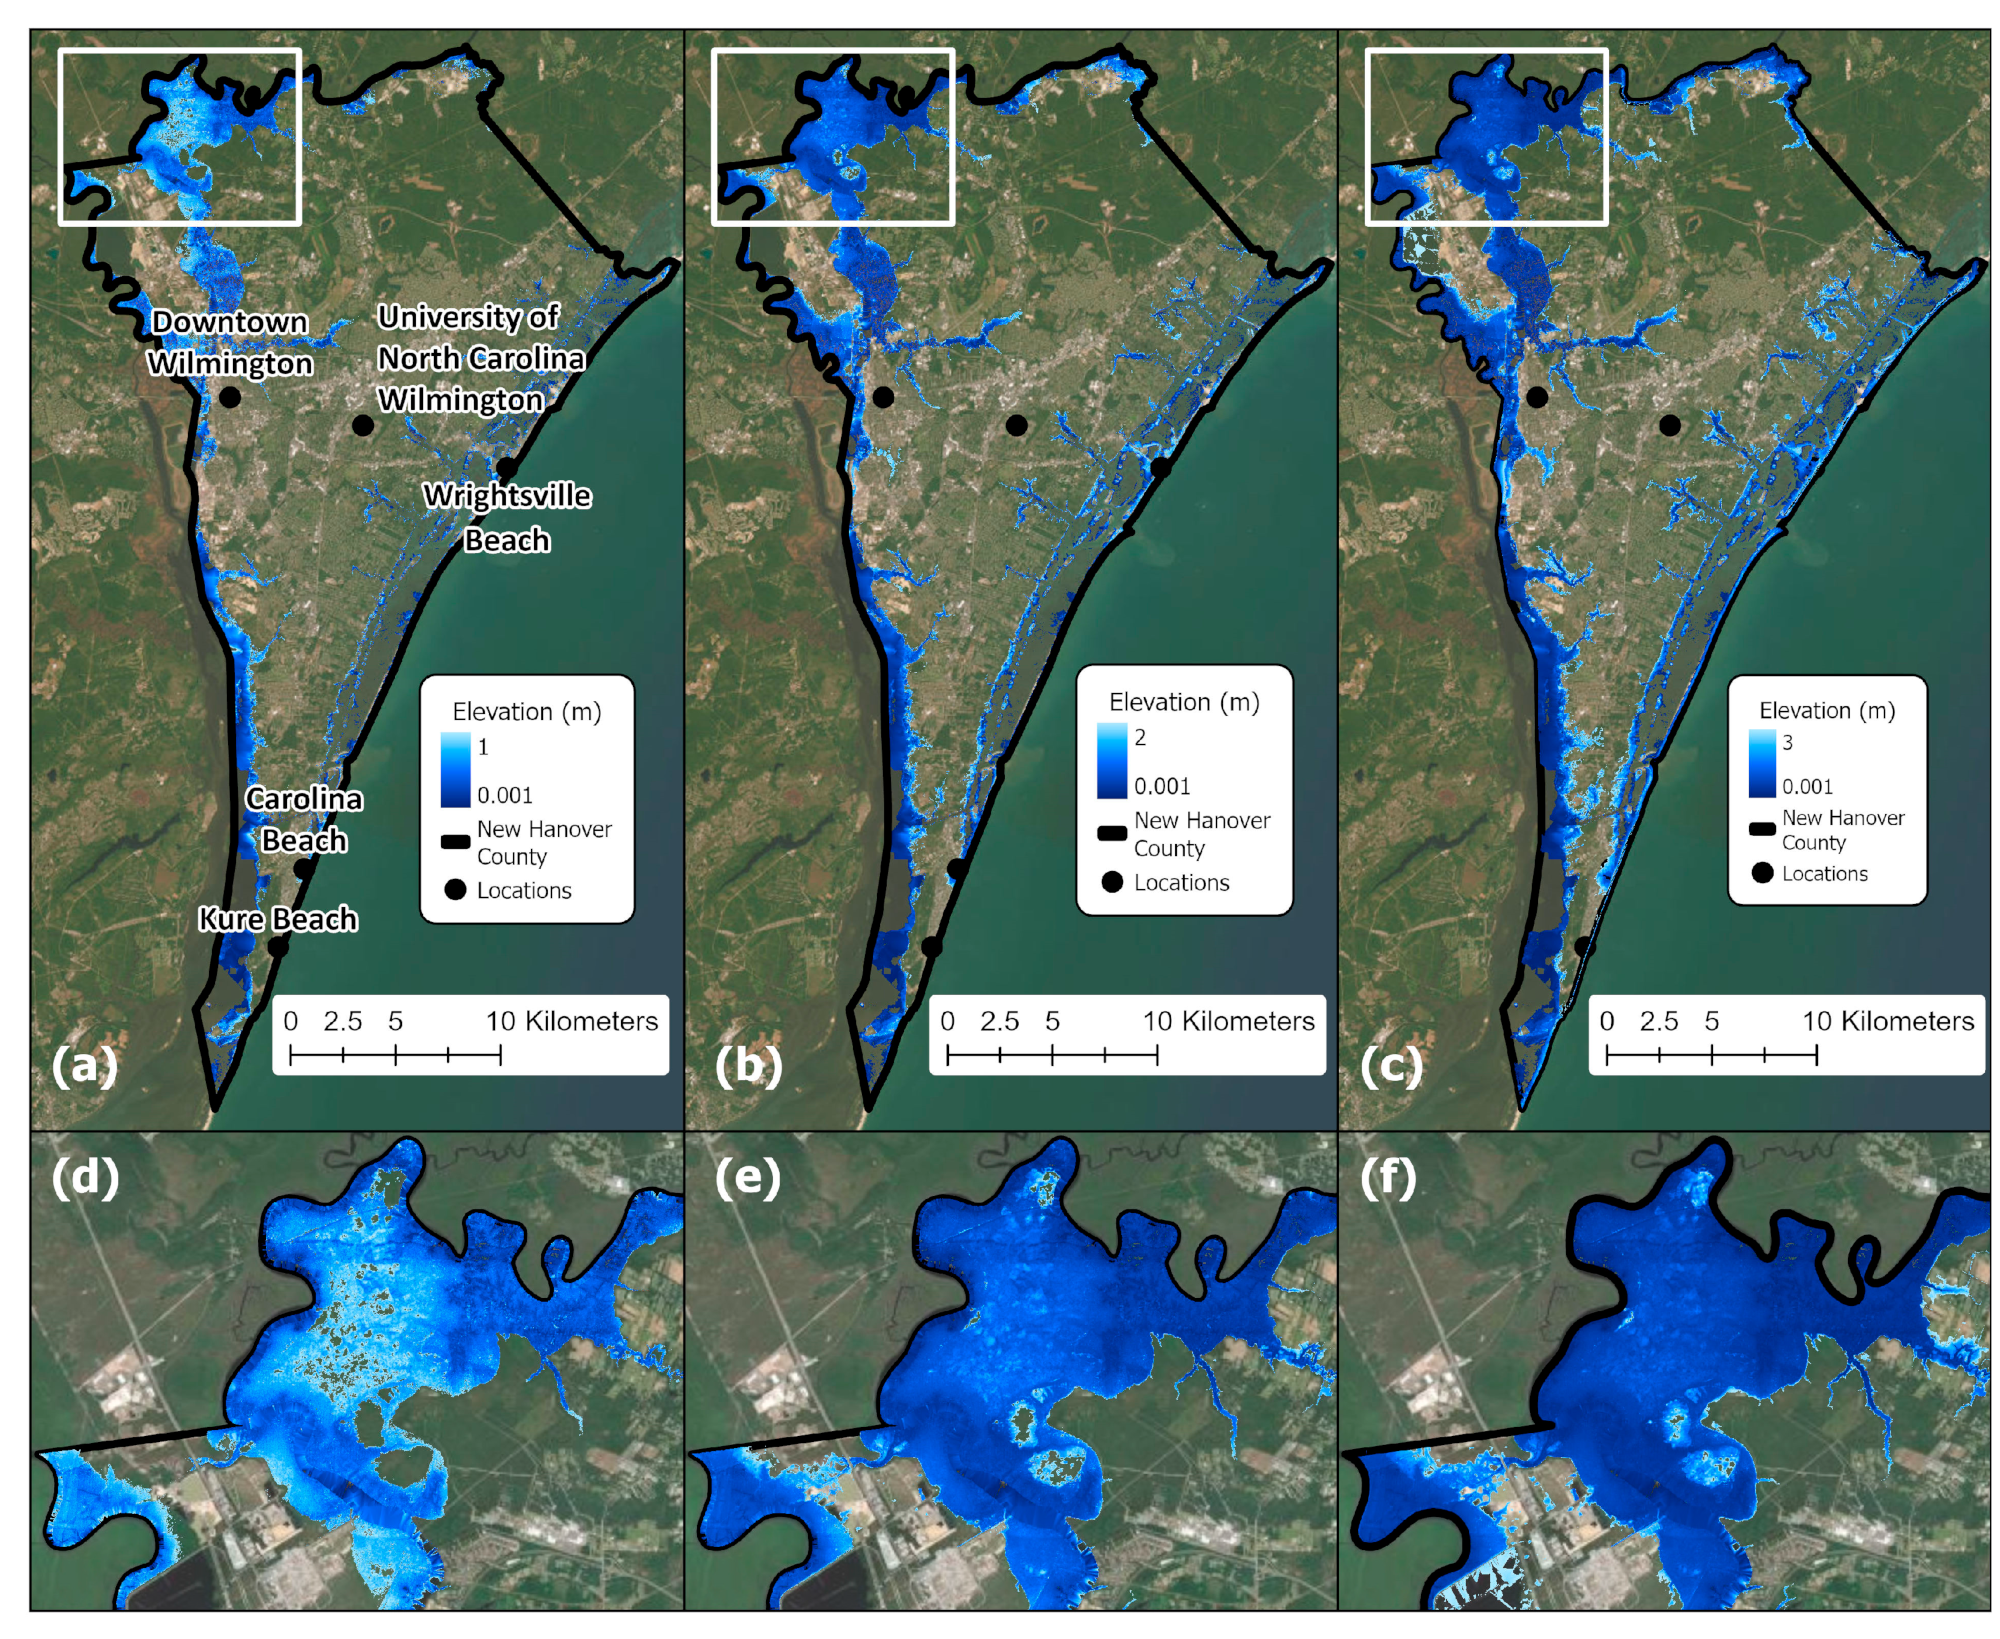
The SLR scenarios modeled for New Hanover County were 0.2 m, 0.5 m, 1 m, 1.5 m, 2 m, 2.5 m, and 3 m of SLR (Figure 8). All ground surface that fell into each scenario and associated land cover data were extracted to show the areas of the county that were predicted to be inundated under each scenario, and which land cover was expected to be affected the most by each SLR scenario in 2030 and 2050.
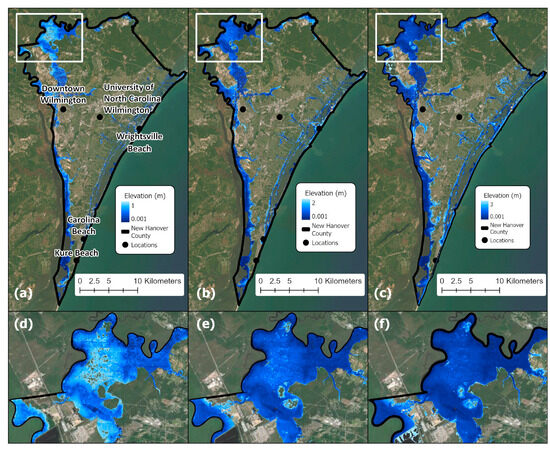
Figure 8.
Modeled SLR scenarios for New Hanover County. The entire county under the 1 m (a) and 2 m (b) and 3 m (c) scenarios. A closeup look at the northwestern section of the study area for the three SLR scenarios (d), (e) and (f), respectively.
4.4. Predicted Inundated Areas and LULC Types for 2030
The land inundation maps for the 2030 prediction show that flooding is expected to be focused mainly along the entire extent of the barrier islands, along the Cape Fear River in the western part of New Hanover County, and along the North Cape Fear River in the northwestern portion of the county (Figure 9). As the SLR scenarios increase, the inundated areas of the county appear to move inland from the eastern coast of the county and the north and southwestern portions of the county along the Cape Fear River. The northernmost section of New Hanover County also starts to become inundated, affecting wetlands and vegetated areas. Data revealed that the wetlands, vegetation, and developed areas are expected to continue to be the most affected parts of the county, while sand surfaces and bare ground are affected to a much lesser extent.
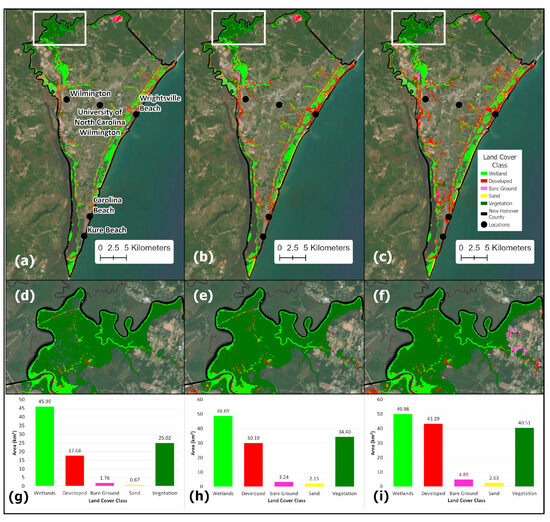
Figure 9.
Types and distributions of LULC that are projected to be inundated in 2030 by SLR for the entire New Hanover County at 1 m (a), 2 m (b) and 3 m (c), with a closeup look at the inundated LULC types in the northwestern section of the county under the same three SLR levels (d,e,f), respectively. Estimated areas of inundation for each land cover type under the given three scenario (g,h,i), respectively.
Under the moderate SLR scenario of 1 m, the wetlands class is expected to be affected the most, with 45.99 km2 of its land cover being inundated, which is 74.34% of all wetland area in the 2030 prediction (Figure 9). Inundation of wetlands appears to primarily be at the southern tip of New Hanover County and near Wilmington along the Cape Fear River, with small areas of inundation along the barrier islands. Vegetated land may be affected less, with 25.02 km2 of vegetation inundated, or 16.04% of all vegetated lands predicted to exist in 2030. Inundated vegetation seems to be focused along the northern boundaries of the county near the North Cape Fear River. Developed land is estimated to be inundated by 17.68 km2, which amounts to 5.54% of all developed land predicted to exist. Developed land is expected to be primarily inundated along the Cape Fear River near Wilmington and across the entire extent of the barrier islands of New Hanover County, as well as in a small area in the north central section of the county.
Under 2 m of SLR, the inundated wetland land cover is expected to grow slightly, while the inundated vegetated land cover is predicted to grow considerably (Figure 9). Wetlands are predicted to have 48.69 km2 of land inundated, or 78.70% of all wetlands. Inundated wetlands continue to be focused along the barrier islands and the northern and southern parts of the Cape Fear River. Inundated vegetation is expected to increase to 34.40 km2, or 22.06% of all vegetated lands. This is a possible increase of 6% in inundated vegetation land cover, but overall, it is still considerably less than the percentage of affected wetlands. Potential increases in inundated vegetation can be seen in the northwestern section of the county, as well as in areas in the northern central part of the county. The inundation of developed land cover is estimated to increase to 30.19 km2, which is 9.49% of all developed land. Inundated developed land may increase by more than double, but this area of land is still fairly small compared to the total in developed land predicted to exist in 2030. The inundated developed land under the 2 m scenario appears to extend outward from the inundated developed land under the 1 m scenario.
The most extreme SLR scenario of 3 m shows large portions of the northwestern section of New Hanover County as possibly being inundated (Figure 9). The inundation of wetlands is expected to increase to 49.98 km2, which is a slight increase to 80.79% of all predicted wetlands. Possible further growth in inundated wetlands can be seen along the southern part of the Cape Fear River, towards the northern section of the river, and along the barrier islands. Vegetation is predicted to have 40.51 km2 of its land inundated, or 25.98% of all vegetated land in 2030. Growth in inundated vegetation is again predicted to occur in the northwestern and northern central areas of the county. Finally, inundated developed land may increase to 43.29 km2, or 13.56% of all developed land in 2030. Most of the inundated developed land appears to be located near the Cape Fear River in Wilmington, along the communities in the barrier islands, and in a small part of the north central section of New Hanover.
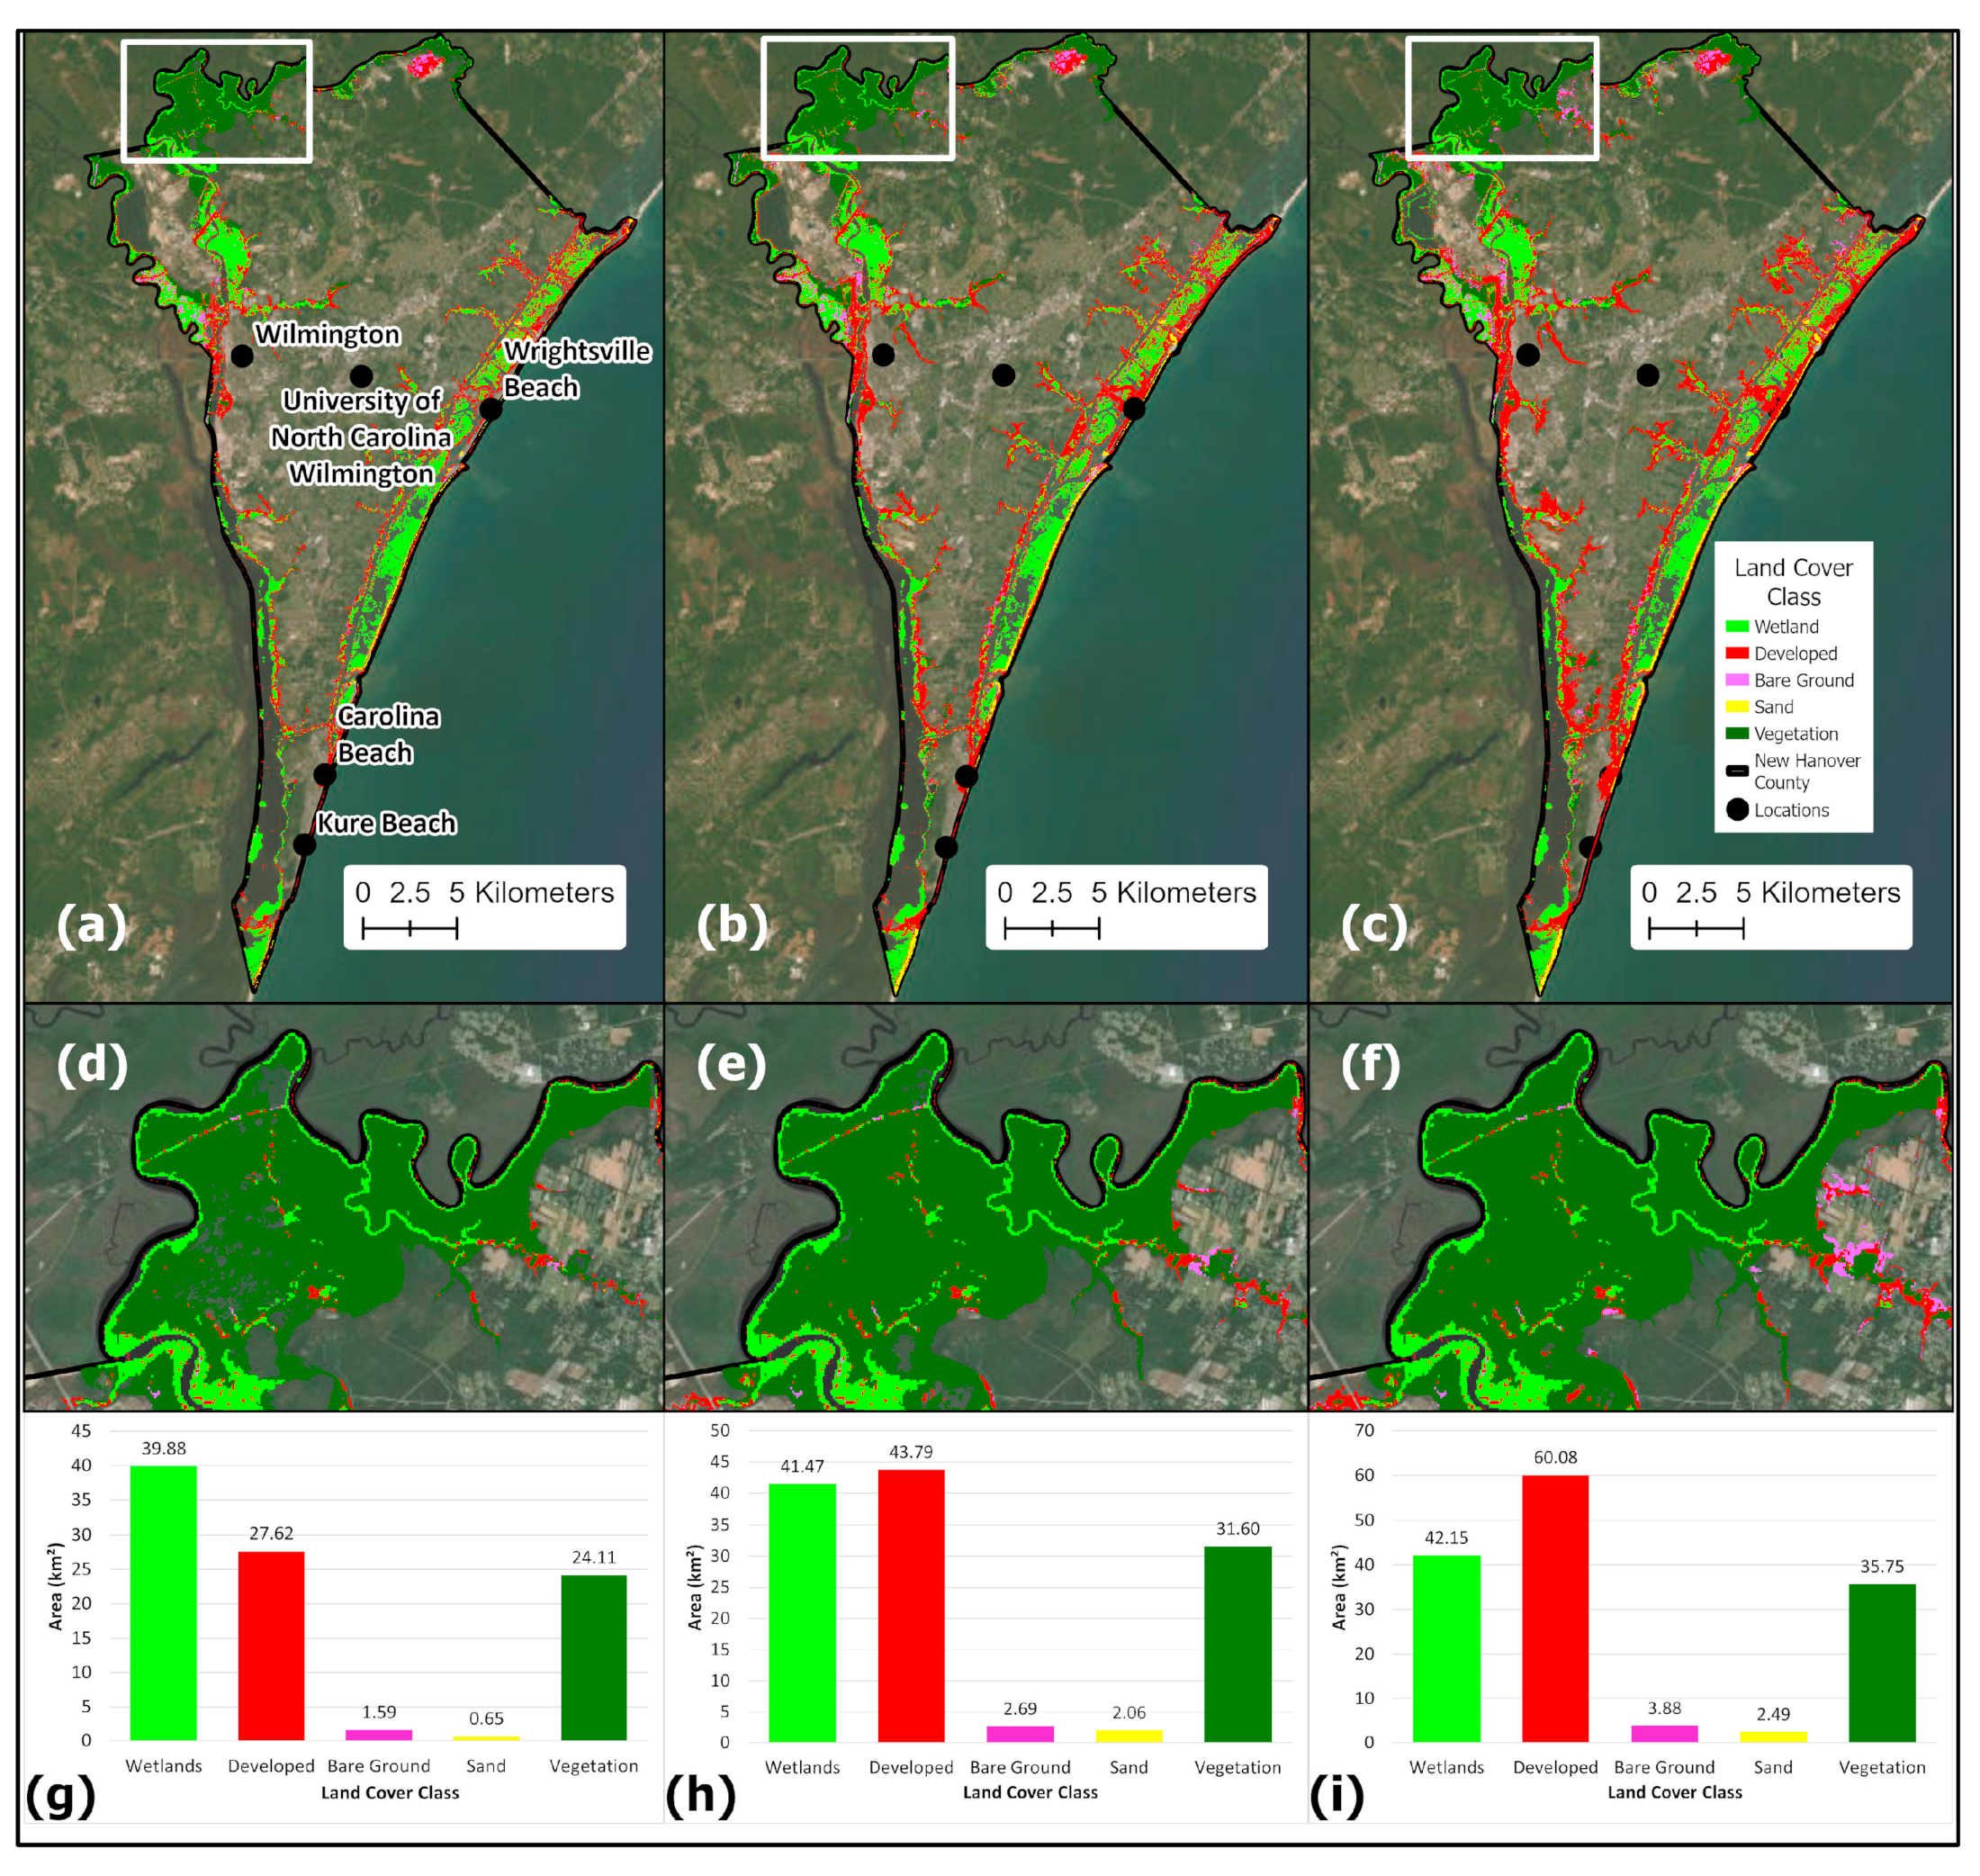
4.5. Predicted Inundated Areas and LULC Types for 2050
For the year 2050, the land inundation maps show that areas of the east coast of New Hanover County and along the Cape Fear River may begin to be flooded under the 1 m SLR scenario (Figure 10). Wetlands, vegetation, and developed land are again predicted to be affected the most by SLR, while bare ground and sand land covers are expected to experience relatively minimal inundation. Under the 1 m SLR scenario, wetlands are again predicted to be the most affected land cover, followed by vegetation and developed land (Figure 10). Wetlands may have a smaller area of their land cover inundated under 1 m of SLR in 2050 compared to 2030, with 39.88 km2 inundated, which equates to 78.91% of all wetland area because the total area of wetlands is expected to decrease between 2030 and 2050. Inundated vegetation is predicted to be 24.11 km2, or 20.21% of all vegetated land in 2050, which is slightly greater than the amount of inundated vegetated land that was predicted to exist in 2030 under 1 m of SLR. Inundated developed land is expected to increase from 17.68 km2 in 2030 to 27.62 km2 in 2050 under the 1 m scenario, or 7.21% of the total in developed land. These inundated developed lands again seem to be primarily located along the Cape Fear River near Wilmington and along the barrier island communities.
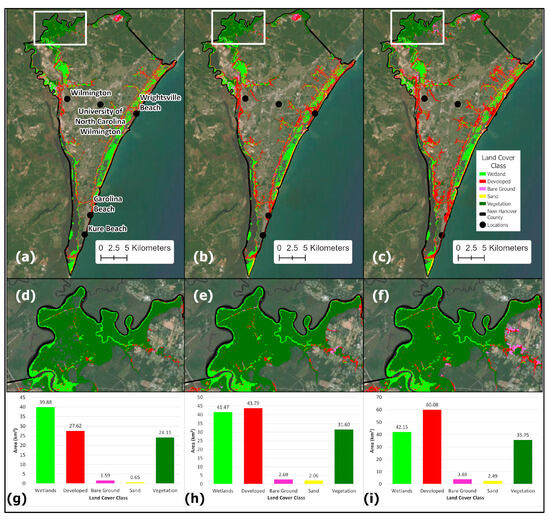
Figure 10.
Examples of the inundation maps created by intersecting the SLR scenarios with the 2050 LULC prediction. The examples show the entire extent of the county, an inset of the northwestern section of the county, and a graph showing the areas of inundation for each land cover under the given scenario. Scenarios shown include 1 m (a,d,g), 2 m (b,e,h), and 3 m (c,f,i).
The area of inundated wetlands more than doubles under 2 m of SLR, to 41.47 km2, which is 82.06% of all wetland area predicted to exist in 2050 (Figure 10). These inundated wetlands are focused along the Cape Fear River near Wilmington and along the barrier islands. Inundated vegetation is expected to increase to 31.60 km2, or 26.49% of all vegetated land cover. The inundated vegetation appears to again be concentrated in the northwestern section of New Hanover County. The inundation of developed land increases to 43.79 km2 under the 2 m SLR scenario, which equates to 11.44% of all developed land. The inundated developed lands are now predicted to be the most affected land cover, appearing to expand outward from the developed land that would be inundated under the 1 m SLR scenario, near Wilmington and along the barrier islands, as well as in the northern central part of New Hanover.
Under the most extreme SLR scenario of 3 m, inundated wetlands are predicted to cover 42.15 km2 (Figure 10). This equates to 83.40%, and can clearly be seen at the southern tip of the county, along the Cape Fear River and along the county’s barrier islands. Inundated vegetation cover is estimated to increase to 35.75 km2, equating to 29.97% of all vegetation cover expected to exist in 2050. The increase in inundated vegetation cover seems to still be concentrated in the northwestern part of the county. Developed land is again expected to be the most affected land cover, and inundated developed land is predicted to increase to 60.08 km2, or 15.69% of all developed land under the 3 m SLR scenario in 2050. Visual analysis shows that inundation seems to have expanded further into the city of Wilmington, and into the barrier island communities, particularly Wrightsville Beach and Carolina Beach.
4.6. Town Inundation
New Hanover County includes the city of Wilmington, as well as the beach towns of Wrightsville Beach, Carolina Beach, and Kure Beach (obtained from NC OneMap at https://www.nconemap.gov/, accessed on 1 February 2024). All four of these communities are expected to be affected by SLR to varying degrees under each SLR scenario. Percentages of how much land of each town would be inundated were calculated (Table 2).
Table 2.
The percentages of land that may be inundated in each town in New Hanover County under the chosen SLR scenarios.
The results of analyzing how much of each town would be inundated under the chosen SLR scenarios show that Wrightsville Beach and Carolina Beach are expected to be the most affected, followed by the city of Wilmington and then the town of Kure Beach (Table 2). Under the most extreme SLR scenario, 3 m, Wrightsville Beach is predicted to have almost three quarters of its land area inundated, or 71.17%. Carolina Beach is predicted to have 40.58% of its land inundated, and the unincorporated areas of New Hanover County may have over 28% of their land inundated. The city of Wilmington is estimated to have 10.67% of its land area inundated, and Kure Beach is predicted to have 9.04% of its land area inundated. Wrightsville Beach, Carolina Beach, and the unincorporated areas of New Hanover may be the most affected communities under the SLR scenarios, and further analysis shows that under the most extreme scenario of 3 m, the developed land cover is expected to be most affected in Wrightsville and Carolina Beach, while the vegetation land cover in addition to developed land is predicted to be the most affected in the unincorporated areas of the county.
4.7. Hurricane Evacuation Route Inundation
Since New Hanover County is located on the Atlantic Coast, it is susceptible to hurricanes, as much of the North American east coast is. Because of this, many coastal communities have designated evacuation routes that residents are encouraged to use in the event of a recommended or mandatory evacuation. Evacuation routes for New Hanover County include the major highways of the county, such as Interstate 40 and US Route 17. Portions of these highways could become inundated under various SLR scenarios, which would endanger local residents who may need to evacuate in emergency situations such as hurricanes.
Evacuation route data were obtained from the North Carolina Department of Transportation (https://www.ncdot.gov/Pages/default.aspx, accessed on 19 April 2024) in the form of state roadways, and the highways that run through New Hanover County were extracted. Highway evacuation routes were confirmed by a map of evacuation routes on the New Hanover County website (https://www.nhcgov.com/, accessed on 19 April 2024). Based on the data extracted, the longest highways in the county are US-421, US-117, and US-17, with lengths of 60.48 km, 40.22 km, and 38.69 km, respectively. However, only US-421 is expected to be moderately affected by even the most extreme SLR scenario. US-421 extends from the northwestern section of the county to the southern end of the peninsula, and its predicted inundated portions are located mainly in the southern part of the county near Carolina Beach and Fort Fisher. The total predicted inundated sections of US-421 cover 7.53 km (12.45%). US-117 is located in the northern central part of New Hanover, but may only be affected by inundation for 0.17 km (0.42%) where it enters the county in the north near Castle Hayne. US-17 crosses through the county from the northeastern area to the eastern central area, and may be affected by inundation primarily in the eastern central part of the county for 1.42 km (3.68%). The only highway that is predicted not to be affected under the 3 m SLR scenario is NC-140.
When analyzing the percentages of roadways that are expected to be inundated, US-76, US-421 TRK, US-74, and I-140 are the highways that are estimated to be the most affected. US-76 runs primarily through the southern portion of Wrightsville Beach for 4.87 km and may be almost completely inundated under the 3 m scenario, with about 4.87 km (99.96%) of the highway predicted to be inundated. US-421 TRK runs for 1.59 km near downtown Wilmington, and under the 3 m scenario, 0.74 km (46.32%) of this highway is predicted to be inundated. US-74 crosses east to west through the entirety of New Hanover County for 34.18 km, and 11.43 km (33.44%) of this roadway is estimated to be inundated under the 3 m scenario. Finally, I-140 extends for 29.45 km through the northern part of the county, and 8.41 km (28.56%) of I-140 is predicted to be inundated under the 3 m scenario (Figure 11).
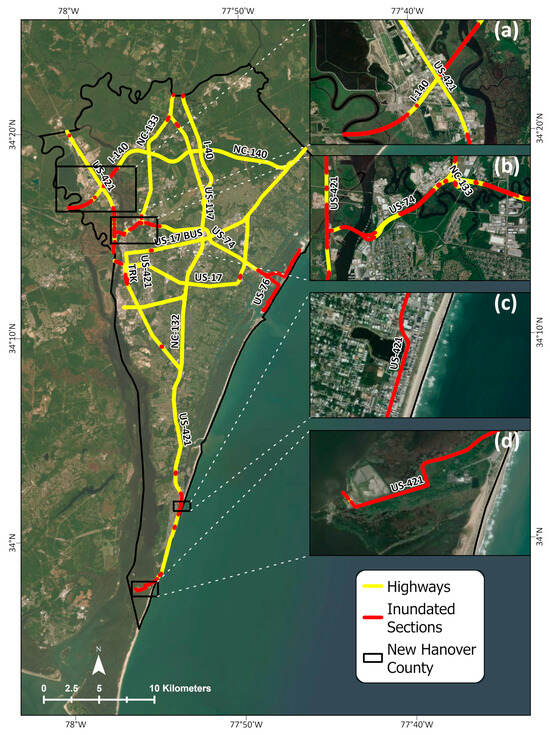
Figure 11.
The sections of major highways that may be at risk of inundation under 3 m of SLR. Closeup look showing sites that may be areas of routes that would be especially important during an evacuation including I-140 in the northwestern part of the county (a), US-74 near downtown Wilmington (b), US-421 in Carolina Beach (c) and near Fort Fisher (d).
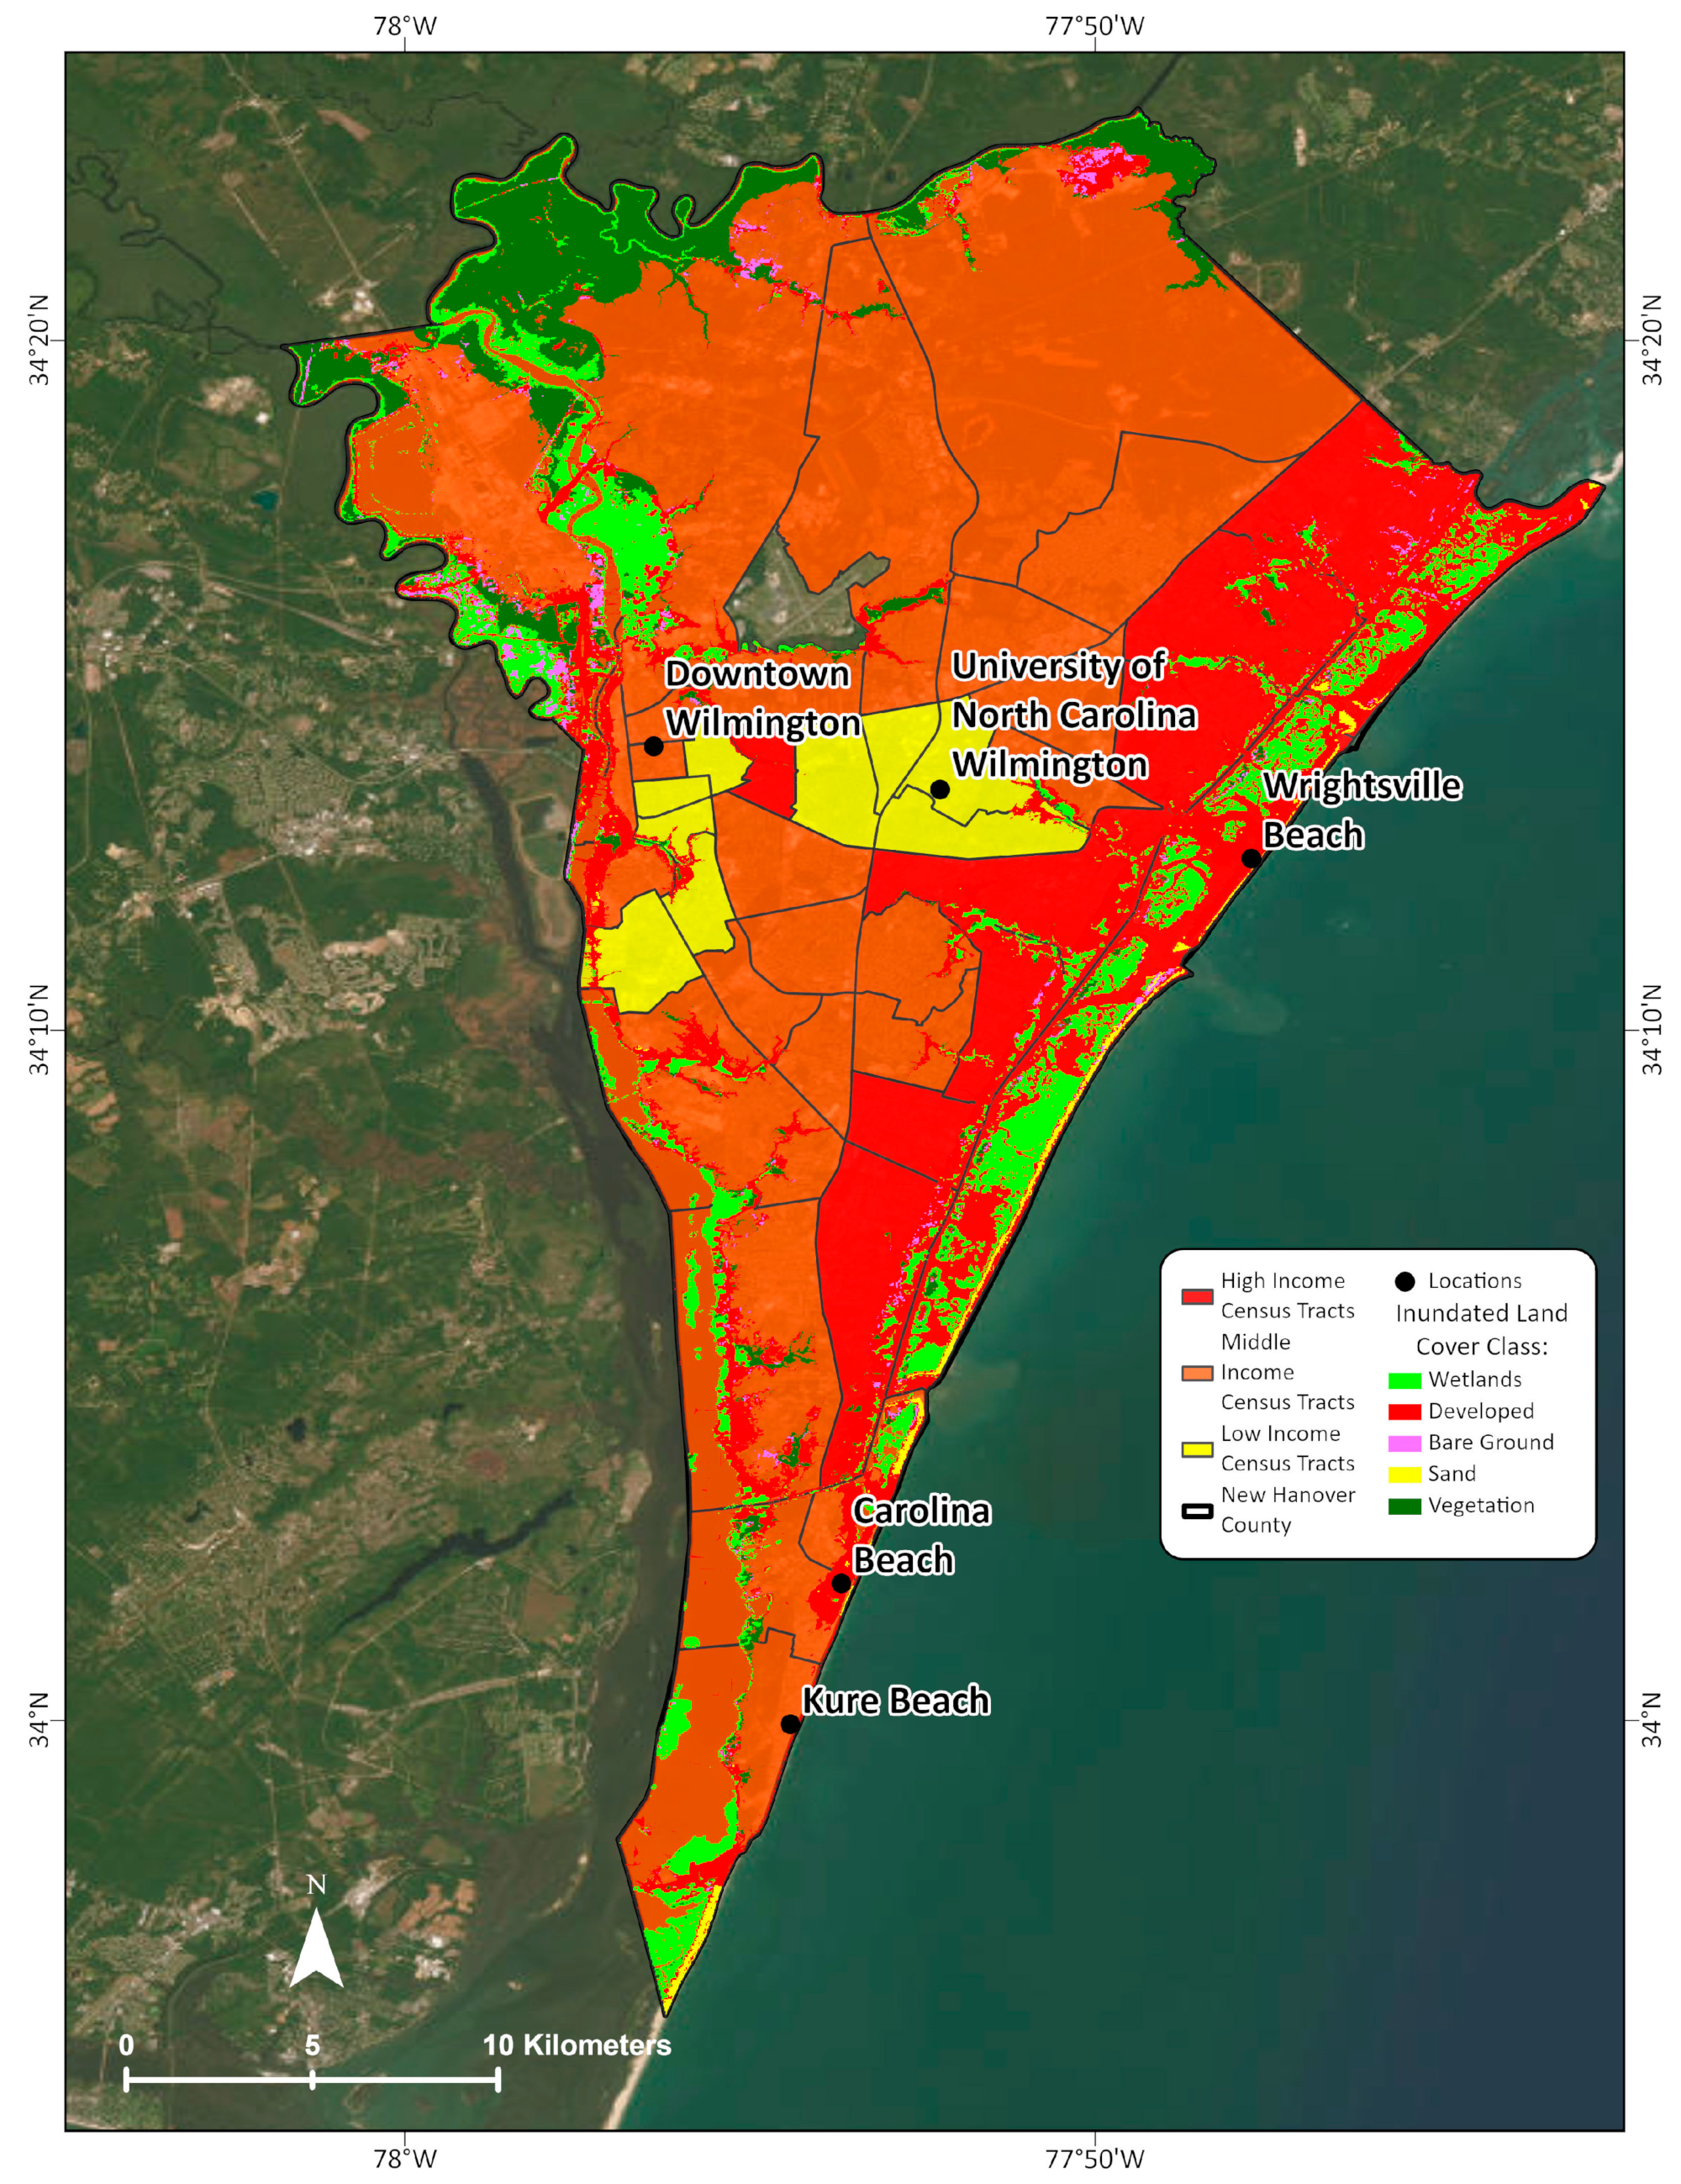
4.8. Inundation by Income Class
New Hanover County can be separated into income groups based on median household income, and it is important to understand which income groups may be more affected by inundation by SLR, as lower income groups may have a harder time adapting to the effects of SLR. Census tracts were downloaded for all of North Carolina in the form of a TIGER/Line shapefile from the U.S. Census Bureau (https://data.gov/, accessed on 12 February 2024). The census tracts for New Hanover County were extracted and separated into low-, middle-, and high-income groups based on median income data for each tract obtained from the Census Reporter (https://censusreporter.org/, accessed 12 February 2024). Low-income groups included median household incomes between USD 20,000 and USD 50,000, middle income groups included median household incomes between USD 50,000 and USD 100,000, and high-income groups included median household incomes greater than USD 100,000. The census tracts of these income groups were intersected with the inundated land under the 3 m SLR scenario in 2050 (Figure 12). The results showed that census tracts of the middle-income group would be affected the most severely, followed by the high-income class and finally the low-income class.

Figure 12.
The census tracts of New Hanover County by income group and the land that may be inundated in 2050 under the 3 m SLR scenario.
The low-income census tracts are centered in New Hanover County in the Wilmington area. The total area of this income group is 33.76 km2, and 1.81 km2 of this land is susceptible to inundation under the most extreme SLR scenario of 3 m, which equates to only 5.35% of all low-income areas. Inundated areas are primarily located near the Cape Fear River and along an inlet that extends into the county near Masonboro Island.
The middle-income census tracts make up most of the county’s area at 394.99 km2, with 93.40 km2 of this land being inundated under 3 m of SLR, or 23.65% of all middle-income areas. The middle-income areas spread throughout all of New Hanover County from north to south along the western and central areas of the county. The inundated areas are focused in the northwestern and southern areas of the county. Wetlands, developed lands, bare ground, sand and vegetated lands may all be affected by inundation in the middle-income areas. Possible inundated wetlands are distributed in the northern and southern middle-income areas and comprise 56.30% of all inundated wetlands in the 3 m SLR scenario, or 23.73 km2. The developed areas that are inundated are also distributed evenly through the middle-income census tracts in the western part of New Hanover County and are 52.71% of all inundated developed lands, or 31.67 km2. Inundated bare ground is primarily located in the northwestern portion of the county and comprises most inundated bare ground in this scenario at 76.55%, or 2.97 km2. Sand inundation in the middle-income tracts is mostly located in the Carolina Beach area and is 0.97 km2, which is 2.49% of all inundated sand in the scenario. Finally, vegetated lands that are inundated are concentrated in the middle-income tracts in the northwestern corner of the county and comprise the majority of all inundated vegetation at 34.06 km2, or 95.27%.
The high-income census tracts are located in the eastern portion of New Hanover County along the barrier islands and Atlantic coast, and cover 134.08 km2 of the county, with 48.07 km2 of this land predicted to be inundated under 3 m of SLR. This equates to about 35.85% of all high-income areas. Wetlands and developed land are expected to be affected the most by inundation in the high-income areas, at 17.91 km2 and 26.45 km2, respectively. This equates to 42.49% of all predicted wetlands and 44.02% of all predicted developed land inundated under the 3 m SLR scenario for 2050. These areas appear to be focused along the coastline of the mainland and the barrier islands throughout the high-income tracts. Predicted inundated bare ground land has an area of 0.85 km2, or 21.91% of all predicted inundated bare ground, and appears to be focused along the mainland coastline and the barrier islands. Sand inundation is expected to be 1.52 km2, which makes up the majority of predicted inundated sand at 61.04% and appears to be concentrated along the barrier islands. Finally, vegetated lands are predicted to be minimally affected by inundation in the high-income areas and mostly seem to be located in the mainland sections of the high-income tracts. Possible inundated vegetated land in high-income areas comprises 3.72% of all predicted inundated vegetation in this scenario, or 1.33 km2.
5. Discussion
The generated LULC map for New Hanover County shows that major areas of development in the county are currently located in the center of the county in Wilmington, and along the barrier islands that line the eastern part of the county and include the beach towns of Wrightsville, Carolina, and Kure Beach. Development is predicted to expand out of these main areas by 2030 and 2050. Land that is currently mapped as bare ground or vegetation in these areas appears to be mostly converted into developed areas by these prediction years. Along the barrier islands, there also appears to be some conversion of wetlands into developed areas. The northern portion of the county is currently dominated by vegetation and bare ground land, with small areas of development around major roads, but these developed areas are also expected to expand out by 2030 and further by 2050.
The inundated areas of the county are mainly located along the coastline and the Cape Fear River along with its tributaries. Large portions of the areas along the coastline are already developed land, and development is predicted to expand out. Along the Cape Fear River, much of the land is mapped as wetlands and vegetation, and there are portions of developed land in these regions as well. The modeled SLR in this study displays how these regions could be threatened by inundation in the near future. Existing developed areas are at risk, and any new development that expands out from these areas may also be at risk. Based on the inundation maps, any future development for the county needs to be focused in the northern central area, or in the center of the county. However, there are limited areas left in the central part of the county for new development.
This work indicated that Wrightsville and Carolina Beach are expected to be most affected by future SLR, supporting the idea that SLR threatens the coastal communities of North Carolina [3]. As the scenarios progress in water height, the percentages of these towns that are predicted to be inundated steadily increase. In Wrightsville Beach, the inner boundaries of the barrier islands are primarily developed and include residential homes as well as private and public boat docks. Harbor Island, which is located between the barrier islands of Wrightsville Beach and the mainland of New Hanover County, is also mostly developed land, and is composed of residential areas, docks, and several local restaurants and shops. The inner boundaries of the barrier islands and Harbor Island both become increasingly inundated as the sea level rises, threatening homes and businesses in these areas. The south end of Wrightsville Beach’s primary barrier island near the Masonboro Inlet also becomes progressively more inundated, threatening the beach and any coastal ecosystems on this part of the island.
Carolina Beach is mainly threatened by SLR in its northern area. Carolina Beach includes a bay that breaks off the Snow’s Cut waterway, and this bay is lined with wetlands, residential homes, boating docks and access points, and commercial businesses including restaurants and yacht clubs. The inundated areas of Carolina Beach are primarily located on the land surrounding this bay, meaning these structures and wetlands are all susceptible to inundation from sea level rise. Throughout Kure Beach, Wilmington, and unincorporated New Hanover County, there are also areas of land that could possibly become inundated, which threatens public beaches, residential zones, and commercial areas. Tourism is a large driver of economic growth in this county [22,23,24], particularly in its beach towns, which means inundation of land that includes commercial businesses, residential rentals, and open beach areas could decrease the numbers of tourists that are drawn to the region, potentially harming New Hanover County economically.
The results of this study should be used by policymakers and planners to determine suitable areas for future development in New Hanover County based on how development patterns seem to be moving and how these patterns may be affected by future SLR, and possible sustainable development practices that could be employed to strengthen and preserve the area [10]. This study can also be used to understand which parts of the county that have already been developed are at risk of inundation by sea level rise, which could displace anyone who retains a permanent residence in New Hanover County, as well as rental homes, commercial businesses, and other attractions that draw in large numbers of tourists, helping to support the county’s economy. Understanding how these areas may be affected will allow county officials and policymakers to plan how to protect these lands in the future. Some New Hanover County beaches, specifically Wrightsville and Carolina Beach, already have taken some precautionary actions by regularly completing beach nourishment projects [25,26], but further action may need to be taken as sea levels continue to rise.
This study is also valuable in understanding how SLR may affect residents of the county during future hurricanes and major storms. New Hanover County is susceptible to hurricanes and tropical storms because of its location along the United States east coast, and has experienced considerable damage from past storms. The latest major storm to impact the area was Hurricane Florence in the fall of 2018, and it caused an estimated USD 17 billion in damage to the state of North Carolina [27]. The University of North Carolina Wilmington sustained USD 140 million in damages alone [27]. The effects of the storm were felt throughout the entire county through flooding, road closures, and damage to infrastructure. According to the derived inundation maps for New Hanover County, all emergency shelters (https://www.nhcgov.com/, accessed on 12 February 2024) should be safe and capable of withstanding SLR up to 3 m. However, the evacuation routes that are recommended for residents to use may be affected in certain locations. US Route 421 runs through the county down to its most southern point, near historic Fort Fisher, and to the Fort Fisher Ferry, which provides transportation to the nearby town of Southport in Brunswick County, NC. While this ferry would most likely not be utilized during a major storm, it could serve as an evacuation route for some before a storm arrives. However, under certain SLR scenarios, portions of Route 421 may be inundated, hindering any access to the Fort Fisher Ferry. Another section of Route 421 that runs through Carolina Beach directly next to Carolina Beach Lake may become inundated. This threatens any residents of Carolina Beach south of this area and all residents of Kure Beach, as Route 421 is the main road that connects to the New Hanover County mainland and would be used by these residents in the event of an evacuation.
Portions of I-140 in the northwestern section of New Hanover County are also vulnerable to inundation. Sections of this highway appear to be inundated under certain scenarios, which could mean I-140 would not be a safe evacuation route, leading residents to use other highways and causing congested traffic, slowing residents down from arriving at safe locations. Also, portions of US-74 between downtown Wilmington and Wilmington International Airport appear to be inundated, meaning this route may not be safe either, leading to further traffic congestion on other evacuation routes.
US-76 runs through the southern end of Wrightsville Beach, and is predicted to be almost completely inundated under the 3 m SLR scenario. This highway is the primary road that connects the barrier island that Wrightsville Beach is located on to the New Hanover mainland, so it would be the primary route for residents or tourists in Wrightsville Beach to use during an evacuation. If this roadway were to become inundated, there would be no safe route for these residents/tourists to use during an emergency, which could threaten thousands of people.
Individual response and adaptation to SLR effects can vary within a county’s population based on the household/individual’s income class. Those with higher incomes may be able to respond better and faster to SLR effects because they have the financial resources to do so. Separating New Hanover County into low-, middle-, and high-income classes shows that the highest income groups are mostly along the coast and barrier islands of the county, while the low-income groups are centered around downtown Wilmington. Middle-income groups fill the rest of the county in the northern and southern areas. Since inundation from SLR is predicted to be focused along the barrier islands, the high-income groups of New Hanover County may be affected the most. Middle-income groups may also be affected, as they mostly line the areas along the Cape Fear River and its tributaries, which may also be affected by SLR. Small portions of the low-income areas may still be affected, but minimally.
It is also important to note the environmental impacts that further development of New Hanover County could have on its land. Large portions of the northern part of the county are currently vegetated and agricultural lands, and destruction of these lands for development could have serious consequences. Deforestation processes in these lands may release any carbon currently stored in their vegetation [28,29], potentially contributing to a decrease in the local air quality of the region [30]. Expansion of development on the barrier islands could destroy any remaining coastal ecosystems present [6], and further decrease the land’s natural resilience to major storms [31,32].
Despite the useful information gained from this work, there are some limitations that must be considered. Among these limitations is the transition potential of models that were created for each driver variable in the LCM, which assume that the variables will stay constant and cannot account for any major changes that may occur, such as new government policies being enacted or natural disasters that may take place. Also, eastern North Carolina is prone to hurricanes because of its location on the Atlantic coast of the United States, and any devastating hurricanes or other major storms could damage coastal areas and destroy currently developed lands, which would significantly impact future development patterns. In addition, the distribution of roads was also found to be a major driver variable in new development, and this model cannot account for any new roads that may be built, which would also impact development patterns. This study also does not account for any protected lands in the county, such as national or state parks or protected wetlands, and assumes that all land is capable of being developed. Excluding these lands from the LCM could affect the future land cover predictions. Future work expanded from this study could involve the exclusion of protected lands in the LCM, as well as the testing of socioeconomic variables as driver variables of change, which were omitted from this work.
6. Conclusions
The present study demonstrates the benefits of integrating remote sensing and GIS technologies and processes when studying the trends in land cover, particularly in developed areas, and how these applications can be beneficial to local government officials, planners, and other decision-makers. New Hanover County, North Carolina, has seen rapid population growth; the county’s population more than quadrupled between 1940 and 2016. This research indicated that development in New Hanover County has been focused in the center area of the county, as well as along the barrier islands on the Atlantic coast. Development is predicted to increase in density in the center of the county, but also to begin spreading along the main highways that run through the northern parts of New Hanover County. The developed land is predicted to continue increasing, while all other land cover types are predicted to consistently decrease by 2030 and further by 2050. SLR is expected to mainly affect the county along the Atlantic coast, but also along parts of the Cape Fear River and its tributaries. Large portions of the northwestern section of the county are predicted to become inundated as well. The land cover types that may be most affected by SLR include the vegetation, wetlands, and developed areas. The wetlands and developed areas are predicted to be mostly affected along the barrier islands and the southern parts of the county along the Cape Fear River. However, the vegetation cover is estimated to mainly be affected in the northwestern part of the county along the Northeast Cape Fear River.
The towns of New Hanover County may also be affected by SLR by varying levels. Wrightsville and Carolina Beach are expected to be the most affected, having about 71.17% and 40.58%, respectively, of their lands predicted to be inundated under the most extreme SLR scenario of 3 m. The developed land cover class may be the most affected in both towns, threatening the homes of permanent residents and seasonal accommodations and local businesses, which play a large role in the economies of these towns. Major highways of the county may also be affected by SLR, particularly in Carolina Beach and along the Cape Fear River in the western part of the county, near the downtown Wilmington area. Portions of these highways may become inundated from SLR, which threatens the safety of residents in emergency situations such as hurricanes. The number of usable evacuation routes could be limited, and the usable routes could become more congested, slowing how quickly residents can move to safe areas.
Based on the modeled SLR scenarios, future development in New Hanover County should be focused on the north central part of the county, as this area is less susceptible to SLR and also has not been as densely developed as other parts of the county already have been. The results of this study support this idea and should be considered by policymakers when planning the future of New Hanover County.
Author Contributions
C.H. and E.G. equally developed and designed the research framework, processed, and analyzed the data, and created the figures and wrote the manuscript. A.N.L. and Y.Y. assisted in reviewing and editing. All authors have read and agreed to the published version of the manuscript.
Funding
This research received no external funding.
Data Availability Statement
https://figshare.com/s/07d8eb6d085e432f5c19, accessed on 19 April 2024.
Acknowledgments
The authors would like to thank the UNCW Department of Earth and Ocean Sciences and the UNCW Space & Drone Remote Sensing Laboratory (SDRS). The authors would like to thank Amr Fahil of Tanta University for his help with references, and Philip Cross for his help in data collection. The authors also appreciate the anonymous reviewers and the journal editor who helped to improve the quality of this paper.
Conflicts of Interest
The authors declare no conflicts of interest.
References
- Calvin, K.; Dasgupta, D.; Krinner, G.; Mukherji, A.; Thorne, P.W.; Trisos, C.; Romero, J.; Aldunce, P.; Barrett, K.; Blanco, G.; et al. IPCC, 2023: Climate Change 2023: Synthesis Report. Contribution of Working Groups I, II and III to the Sixth Assessment Report of the Intergovernmental Panel on Climate Change; Core Writing Team, Lee, H., Romero, J., Eds.; First; Intergovernmental Panel on Climate Change (IPCC): Geneva, Switzerland, 2023. [Google Scholar]
- Sweet, W.; Hamlington, B.; Kopp, R.E.; Weaver, C.; Barnard, P.L.; Bekaert, D.; Brooks, W.; Craghan, M.; Dusek, G.; Frederikse, T.; et al. Global and Regional Sea Level Rise Scenarios for the United States; NASA: Washington, DC, USA, 2022. [Google Scholar]
- Johnston, J.; Cassalho, F.; Miesse, T.; Ferreira, C.M. Projecting the Effects of Land Subsidence and Sea Level Rise on Storm Surge Flooding in Coastal North Carolina. Sci. Rep. 2021, 11, 21679. [Google Scholar] [CrossRef] [PubMed]
- Eggleston, J.; Pope, J. Land Subsidence and Relative Sea-Level Rise in the Southern Chesapeake Bay Region; US Geological Survey: Reston, VA, USA, 2013; p. 1392. [Google Scholar]
- Zervas, C.E. North Carolina Bathymetry/Topography Sea Level Rise Project: Determination of Sea Level Trends; NOAA: Silver Spring, MD, USA, 2004. [Google Scholar]
- Crawford, T.W. Where Does the Coast Sprawl the Most? Trajectories of Residential Development and Sprawl in Coastal North Carolina, 1971–2000. Landsc. Urban Plan. 2007, 83, 294–307. [Google Scholar] [CrossRef]
- New Hanover County New Hanover County, NC, Comprehensive Plan 2016. 2016. Available online: https://www.nhcgov.com/1088/Comprehensive-Plans (accessed on 17 September 2023).
- Houghton, R.A. The Worldwide Extent of Land-Use Change. BioScience 1994, 44, 305–313. [Google Scholar] [CrossRef]
- White, S.A.; Wang, Y. Utilizing DEMs Derived from LIDAR Data to Analyze Morphologic Change in the North Carolina Coastline. Remote Sens. Environ. 2003, 85, 39–47. [Google Scholar] [CrossRef]
- Hamad, R.; Balzter, H.; Kolo, K. Predicting Land Use/Land Cover Changes Using a CA-Markov Model under Two Different Scenarios. Sustainability 2018, 10, 3421. [Google Scholar] [CrossRef]
- Beck, H.E.; Zimmermann, N.E.; McVicar, T.R.; Vergopolan, N.; Berg, A.; Wood, E.F. Present and Future Köppen-Geiger Climate Classification Maps at 1-Km Resolution. Sci. Data 2018, 5, 180214. [Google Scholar] [CrossRef] [PubMed]
- North Carolina Geological Survey. Geologic Map of North Carolina: North Carolina Department of Natural Resources and Community Development, Geological Survey Section, Scale 1:500,000; North Carolina Geological Survey: Raleigh, NC, USA, 1985. [Google Scholar]
- Berman, M.; Phatak, A.; Traylen, A. Some Invariance Properties of the Minimum Noise Fraction Transform. Chemom. Intell. Lab. Syst. 2012, 117, 189–199. [Google Scholar] [CrossRef]
- Vermillion, S.C.; Sader, S.A. Use of the Minimum Noise Fraction (MNF) Transform to Analyze Airborne Visible/Infrared Imaging Spectrometer (AVIRIS) Data of Northern Forest Types. AVIRIS Workshop; Volume 7. 1999. Available online: https://www.google.com/url?sa=t&source=web&rct=j&opi=89978449&url=https://www.oca.eu/Bijaoui/doc_ab/cardon/62.pdf&ved=2ahUKEwjXpa2rw6yGAxWr6skDHUjNC5AQFnoECCAQAQ&usg=AOvVaw39a8b0QMktAmlt4Fq0FrDs (accessed on 29 June 2023).
- Eastman, J.R. TerrSet Geospatial Monitoring and Modeling System Manual; Clark University: Worcester, MA, USA, 2016. [Google Scholar]
- Eastman, J.R. TerrSet Geospatial Monitoring and Modeling System Tutorial; Clark University: Worcester, MA, USA, 2020. [Google Scholar]
- Mas, J.F.; Flores, J.J. The Application of Artificial Neural Networks to the Analysis of Remotely Sensed Data. Int. J. Remote Sens. 2008, 29, 617–663. [Google Scholar] [CrossRef]
- Bratley, K.; Ghoneim, E. Modeling Urban Encroachment on the Agricultural Land of the Eastern Nile Delta Using Remote Sensing and a GIS-Based Markov Chain Model. Land 2018, 7, 114. [Google Scholar] [CrossRef]
- Appiah, D.; Forkuo, E.; Bugri, J.; Apreku, T. Geospatial Analysis of Land Use and Land Cover Transitions from 1986–2014 in a Peri-Urban Ghana. Geosciences 2017, 7, 125. [Google Scholar] [CrossRef]
- Islam, K.; Rahman, M.F.; Jashimuddin, M. Modeling Land Use Change Using Cellular Automata and Artificial Neural Network: The Case of Chunati Wildlife Sanctuary, Bangladesh. Ecol. Indic. 2018, 88, 439–453. [Google Scholar] [CrossRef]
- Rifat, S.A.A.; Liu, W. Predicting Future Urban Growth Scenarios and Potential Urban Flood Exposure Using Artificial Neural Network-Markov Chain Model in Miami Metropolitan Area. Land Use Policy 2022, 114, 105994. [Google Scholar] [CrossRef]
- Town of Carolina Beach, 2020, Town of Carolina Beach, NC, CAMA Land Use Plan. Wilmington, NC, USA. 2020. Available online: https://www.carolinabeach.org/government/departments/planning-development (accessed on 17 September 2023).
- Town of Kure Beach, 2022, Town of Kure Beach, NC, 2022 Comprehensive Land Use Plan. 2022. Available online: https://www.townofkurebeach.org/planning-and-zoning/land-use-plan (accessed on 17 September 2023).
- Town of Wrightsville Beach, 2018, Town of Wrightsville Beach CAMA Land Use Plan Update. 2018. Available online: https://www.townofwrightsvillebeach.com/439/CAMA-Land-Use-Plan-2019 (accessed on 17 September 2023).
- Cooney, B.C.; Forrest, K.D.; Miller, J.R.; Moeller, F.U.; Parker, J.K. Beach Nourishment: Global Perspectives and Local Applications to the North Carolina Coastline. 2003. Available online: https://www.google.com/url?sa=t&source=web&rct=j&opi=89978449&url=https://tamug-ir.tdl.org/server/api/core/bitstreams/0e89c479-bea4-4f17-9435-1a332495eff7/content&ved=2ahUKEwjs1NyhxayGAxX348kDHZjbBqMQFnoECBEQAQ&usg=AOvVaw3ob1rSfuebSw3tzef3oHoq (accessed on 30 March 2024).
- Qiu, Y.; Gopalakrishnan, S. Shoreline Defense Against Climate Change and Capitalized Impact of Beach Nourishment. SSRN Electron. J. 2018, 92, 13–147. [Google Scholar] [CrossRef]
- Nunn, S. 2 Years Ago, Florence Walloped Wilmington. Is Recovery Done? Are We Better Prepared for Next Big Hurricane? Star News Online: Wilmington, NC, USA, 2020. [Google Scholar]
- Lawrence, D.; Coe, M.; Walker, W.; Verchot, L.; Vandecar, K. The Unseen Effects of Deforestation: Biophysical Effects on Climate. Front. For. Glob. Chang. 2022, 5, 756115. [Google Scholar] [CrossRef]
- Li, Y.; Brando, P.M.; Morton, D.C.; Lawrence, D.M.; Yang, H.; Randerson, J.T. Deforestation-Induced Climate Change Reduces Carbon Storage in Remaining Tropical Forests. Nat. Commun. 2022, 13, 1964. [Google Scholar] [CrossRef]
- Butt, E.W.; Conibear, L.; Knote, C.; Spracklen, D.V. Large Air Quality and Public Health Impacts Due to Amazonian Deforestation Fires in 2019. GeoHealth 2021, 5, e2021GH000429. [Google Scholar] [CrossRef] [PubMed]
- Bianco, F.; García-Ayllón, S. Coastal Resilience Potential as an Indicator of Social and Morphological Vulnerability to Beach Management. Estuar. Coast. Shelf Sci. 2021, 253, 107290. [Google Scholar] [CrossRef]
- Malvarez, G.; Ferreira, O.; Navas, F.; Cooper, J.A.G.; Gracia-Prieto, F.J.; Talavera, L. Storm Impacts on a Coupled Human-Natural Coastal System: Resilience of Developed Coasts. Sci. Total Environ. 2021, 768, 144987. [Google Scholar] [CrossRef] [PubMed]


Disclaimer/Publisher’s Note: The statements, opinions and data contained in all publications are solely those of the individual author(s) and contributor(s) and not of MDPI and/or the editor(s). MDPI and/or the editor(s) disclaim responsibility for any injury to people or property resulting from any ideas, methods, instructions or products referred to in the content. |
© 2024 by the authors. Licensee MDPI, Basel, Switzerland. This article is an open access article distributed under the terms and conditions of the Creative Commons Attribution (CC BY) license (https://creativecommons.org/licenses/by/4.0/).