Abstract
Ensuring the spatial equity of health service facilities (HSFs) is crucial for the well-being of residents. However, previous research has predominantly focused on the accessibility and equity of single-type facilities, neglecting the residents’ demand for diversified types of health services. This study proposes a multi-type, Gaussian-based, two-step floating catchment area method (MT-G2SFCA) to assess the comprehensive accessibility and equity of multi-type HSFs in different age groups in the Hedong District of Tianjin, with the Gini coefficient and the bivariate local Moran’s I. Furthermore, the key factors affecting the accessibility were explored through a geo-detector. The results indicate the following: (1) Neglecting the health benefits of facility type diversity can result in an underestimation of the accessibility and equity; (2) neglecting the differences in walking ability of the elderly can result in an overestimation of the accessibility and equity; and (3) the Pedestrian Route Directness is the key factor affecting the accessibility and equity in high-density urban areas, and especially that the facility density is the key factor for the elderly. This research emphasizes the impact of facility type diversity on the accessibility and equity of HSFs, which can offer more precise and holistic technical assistance and policy recommendations for optimizing the allocation of HSFs.
1. Introduction
As urbanization continues globally, the urban population has surpassed 50% of the world’s total inhabitants, thereby making the health of urban residents crucial for global well-being [1,2]. Since the World Health Organization (WHO) first introduced the concept of “healthy cities” in 1984, the construction of healthy cities has gradually emerged as a vital strategy worldwide for addressing urban health challenges [3,4]. The disparities in facility resources and social spaces within urban environments are becoming increasingly pivotal determinants of human health and well-being [5]. As health service facilities (HSFs) serve as crucial resources for providing various health services to residents, they have been recognized as one of the key factors influencing the urban residents’ health in the “Integrating Health in Urban and Territorial Planning” released by WHO in 2020 [6]. In the “Healthy China 2030 Plan” released in 2016, the Chinese government explicitly advocated for ensuring the land needs of health-related public facilities and improving the relevant public infrastructure system. The HSFs, including urban parks, medical facilities, cultural activity centers, among others, have been proven to provide residents with access to nature [7,8], healthcare [9], promotion of social interaction [10], and physical activity [11], contributing to the health of urban residents. However, in the context of rapid urbanization, extensive development can lead to issues of inadequate supply and uneven distribution of urban health service resources, resulting in spatial justice concerns [12]. Therefore, the supply–demand levels and spatial equity of HSFs have garnered significant attention in urban research [13].
As China’s urban planning gradually shifts towards a “people-oriented” approach [14], community life circle planning centered on residents’ walkable accessibility has become a crucial approach to promoting the equalization of public services [15]. However, the limitations of previous studies lie in their emphasis on the accessibility assessment of single-type facilities, overlooking the fact that the residents’ health is often influenced by a combination of various types of health services [16]. For example, medical facilities and community health centers can provide residents with direct health services such as medication and treatment, while parks, green spaces, community cultural centers, and sports facilities can indirectly improve residents’ health by promoting physical activity and social interaction. Furthermore, previous research often simply assumes that the larger the scale of facilities accessible to residents, the higher the service benefits they can obtain. Therefore, previous research predominantly focuses on the equity of facility scale supply, while the inequalities arising from differences in facility type supply have not received sufficient attention. Ensuring both an ample scale and a diverse range of types for urban health service facilities is equally crucial for enhancing the level of urban health services and achieving social equity. Another significant limitation is that planning standards fail to account for the heterogeneity in walkable accessibility among different age groups [17,18,19]. Compared to typical adults, the elderly often have lower physical fitness and lower walking efficiency, resulting in comparatively slower walking speeds [20]. Thus, overlooking the heterogeneity in walking speed among the elderly may lead to inaccurate estimations of the supply–demand level for HSFs in areas with a higher aging population, resulting in supply inequity among different population groups within communities [21].
The initial definition of accessibility was the degree of difficulty in accessing potential opportunities [22]. Some scholars interpret the concept of accessibility from a spatial perspective, defining it as the convenience of traveling from one place to another using a particular mode of transportation [23]. This concept has gradually gained widespread acceptance in urban planning and is applied in various research areas such as transportation, facility layout, and become a significant metric for assessing the distribution equity [24,25,26]. Various methodologies have been proposed and adopted to effectively assess the accessibility and equity of public service facilities, including network analysis [27], walkability evaluation [28], cumulative opportunity measurement [29,30], gravity model [31], 2SFCA method [32,33,34] and so on. Among them, the 2SFCA is increasingly utilized in accessibility evaluation research [35,36], as it effectively addresses factors influencing accessibility from both the supply and demand perspectives [37]. In response to the limitations of the traditional 2SFCA method in representing distance effects, variations in search radius, travel modes, and facility competitiveness, researchers have continuously worked on optimizing and improving the 2SFCA method. For example, introducing distance decay functions to refine the impact of travel distance on accessibility [38,39]. Among these functions, the Gaussian distance decay function is particularly popular [40]. In addition, some scholars have optimized the search radius in the 2SFCA method based on differences in the capacities of different suppliers or demanders [41,42,43]. In response to different travel modes, models like CB2SFCA have been proposed [44,45]. Based on the Huff model, the competition between facilities is incorporated into 2SFCA [46]. Additionally, there are integrated approaches that combine various improved models, such as the MH3SFCA, which comprehensively calculates distance differences and facility competitiveness [47]. However, previous research predominantly focuses on the supply–demand levels of single-type facilities such as urban parks and medical facilities. Additionally, these studies often use a facility scale as a simple representation of facility supply capacity. In recent years, some scholars have integrated both the quality and scale of city parks into the G2SFCA method to evaluate the impact of the multidimensional attributes of parks on accessibility [48]. Elldér Erik proposed through survey research that configuring diverse types of facilities can enhance residents’ willingness to walk, thereby strengthening the actual service supply capacity of facilities [49]. Meanwhile, different population groups have varying degrees of demand for facility types, necessitating a more targeted approach to align the needs of diverse populations with the provision of facility resources [48]. Therefore, ignoring the supply–demand disparity caused by the uneven configuration of facility types may lead to decision biases [50,51]. It is recommended to integrate both facility scale and facility type in a comprehensive assessment [52] in order to enhance the comprehensiveness of the evaluation.
Gradually, scholars have noticed that most of the 2SFCA methods and their extensions are designed to assess accessibility for the general population. Therefore, there are limitations in evaluating the accessibility of facilities enjoyed by different age groups, which fail to effectively respond to residents’ differentiated needs [53], particularly those of vulnerable groups such as the elderly. Compared to residents of other age groups, the elderly often have a greater need for urban HSFs to fulfill their health service demands, making them a subject of increased attention among numerous scholars [54]. Neglecting the influence of age factors could significantly overestimate the accessibility for the elderly, leading to inaccurate assessments of facility resource accessibility and equity. On the one hand, the key factor contributing to accessibility disparities is the weak mobility of the elderly, whose walking speed is slower than that of general adults [55]. For instance, Ma utilized video recording to analyze the walking data of 1882 individuals in Beijing and found that the average walking speed of the elderly was 1.04 m/s [56]. Cai obtained, through meta-analysis, that the walking speed of elderly individuals was 1.068 m/s [57]. According to statistical data from Nanjing, the approximate walking speed of elderly individuals was 3.5 km per hour [58]. Willberg found the walking speed of elderly individuals was 4.26 km/h through on-site measurements and data statistics [59]. These studies provide more accurate accessibility thresholds to better describe the limited mobility of the elderly. On the other hand, differential levels of demand for facility types can impact comprehensive accessibility [60]. Therefore, in assessing accessibility, it is crucial not to overlook the preferences of the elderly for various types of facilities [58]. Li et al. found through surveys that markets, urban parks, and clinics are commonly frequented facilities by the elderly [61]. Li discovered through investigation that the elderly primarily utilize facilities such as markets, urban parks, community cultural centers, and elderly care facilities [62].
In summary, on the one hand, against the backdrop of a healthy city, the continuous growth of urban populations and the diversification of residents’ health needs have raised higher demands for ensuring an adequate scale and diverse types of urban health service facilities. On the other hand, the issue of unequal supply of health service facilities due to variations in the walking ability of different population groups deserves attention. Among them, the elderly, compared to other age groups, exhibits a stronger demand for urban health service facilities and a weaker access ability (due to slower walking speeds), and this contradiction is poised to intensify with the increasing severity of population aging. Therefore, the elderly constitute a demographic warranting special attention. In response to the prevailing focus of previous research on the accessibility and equity assessment of single-type facilities, which overlooks the inadequate consideration of the comprehensive impact of facility type diversity on residents’ health, this study proposes a multi-type Gaussian-based two-step floating catchment area method (MT-G2SFCA) integrating the scale accessibility and type diversity, and carries out a detailed measurement and analysis of the comprehensive accessibility and equity of HSFs for different age groups, taking the Hedong District of Tianjin as a typical research area. Furthermore, based on the geo-detector, the key factors affecting the accessibility and equity of HSFs are revealed. This research endeavors to accomplish a more precise and comprehensive assessment of the supply–demand levels of HSFs and provide corresponding technical assistance and policy suggestion for rational allocation of HSFs.
2. Materials and Methods
2.1. Study Area
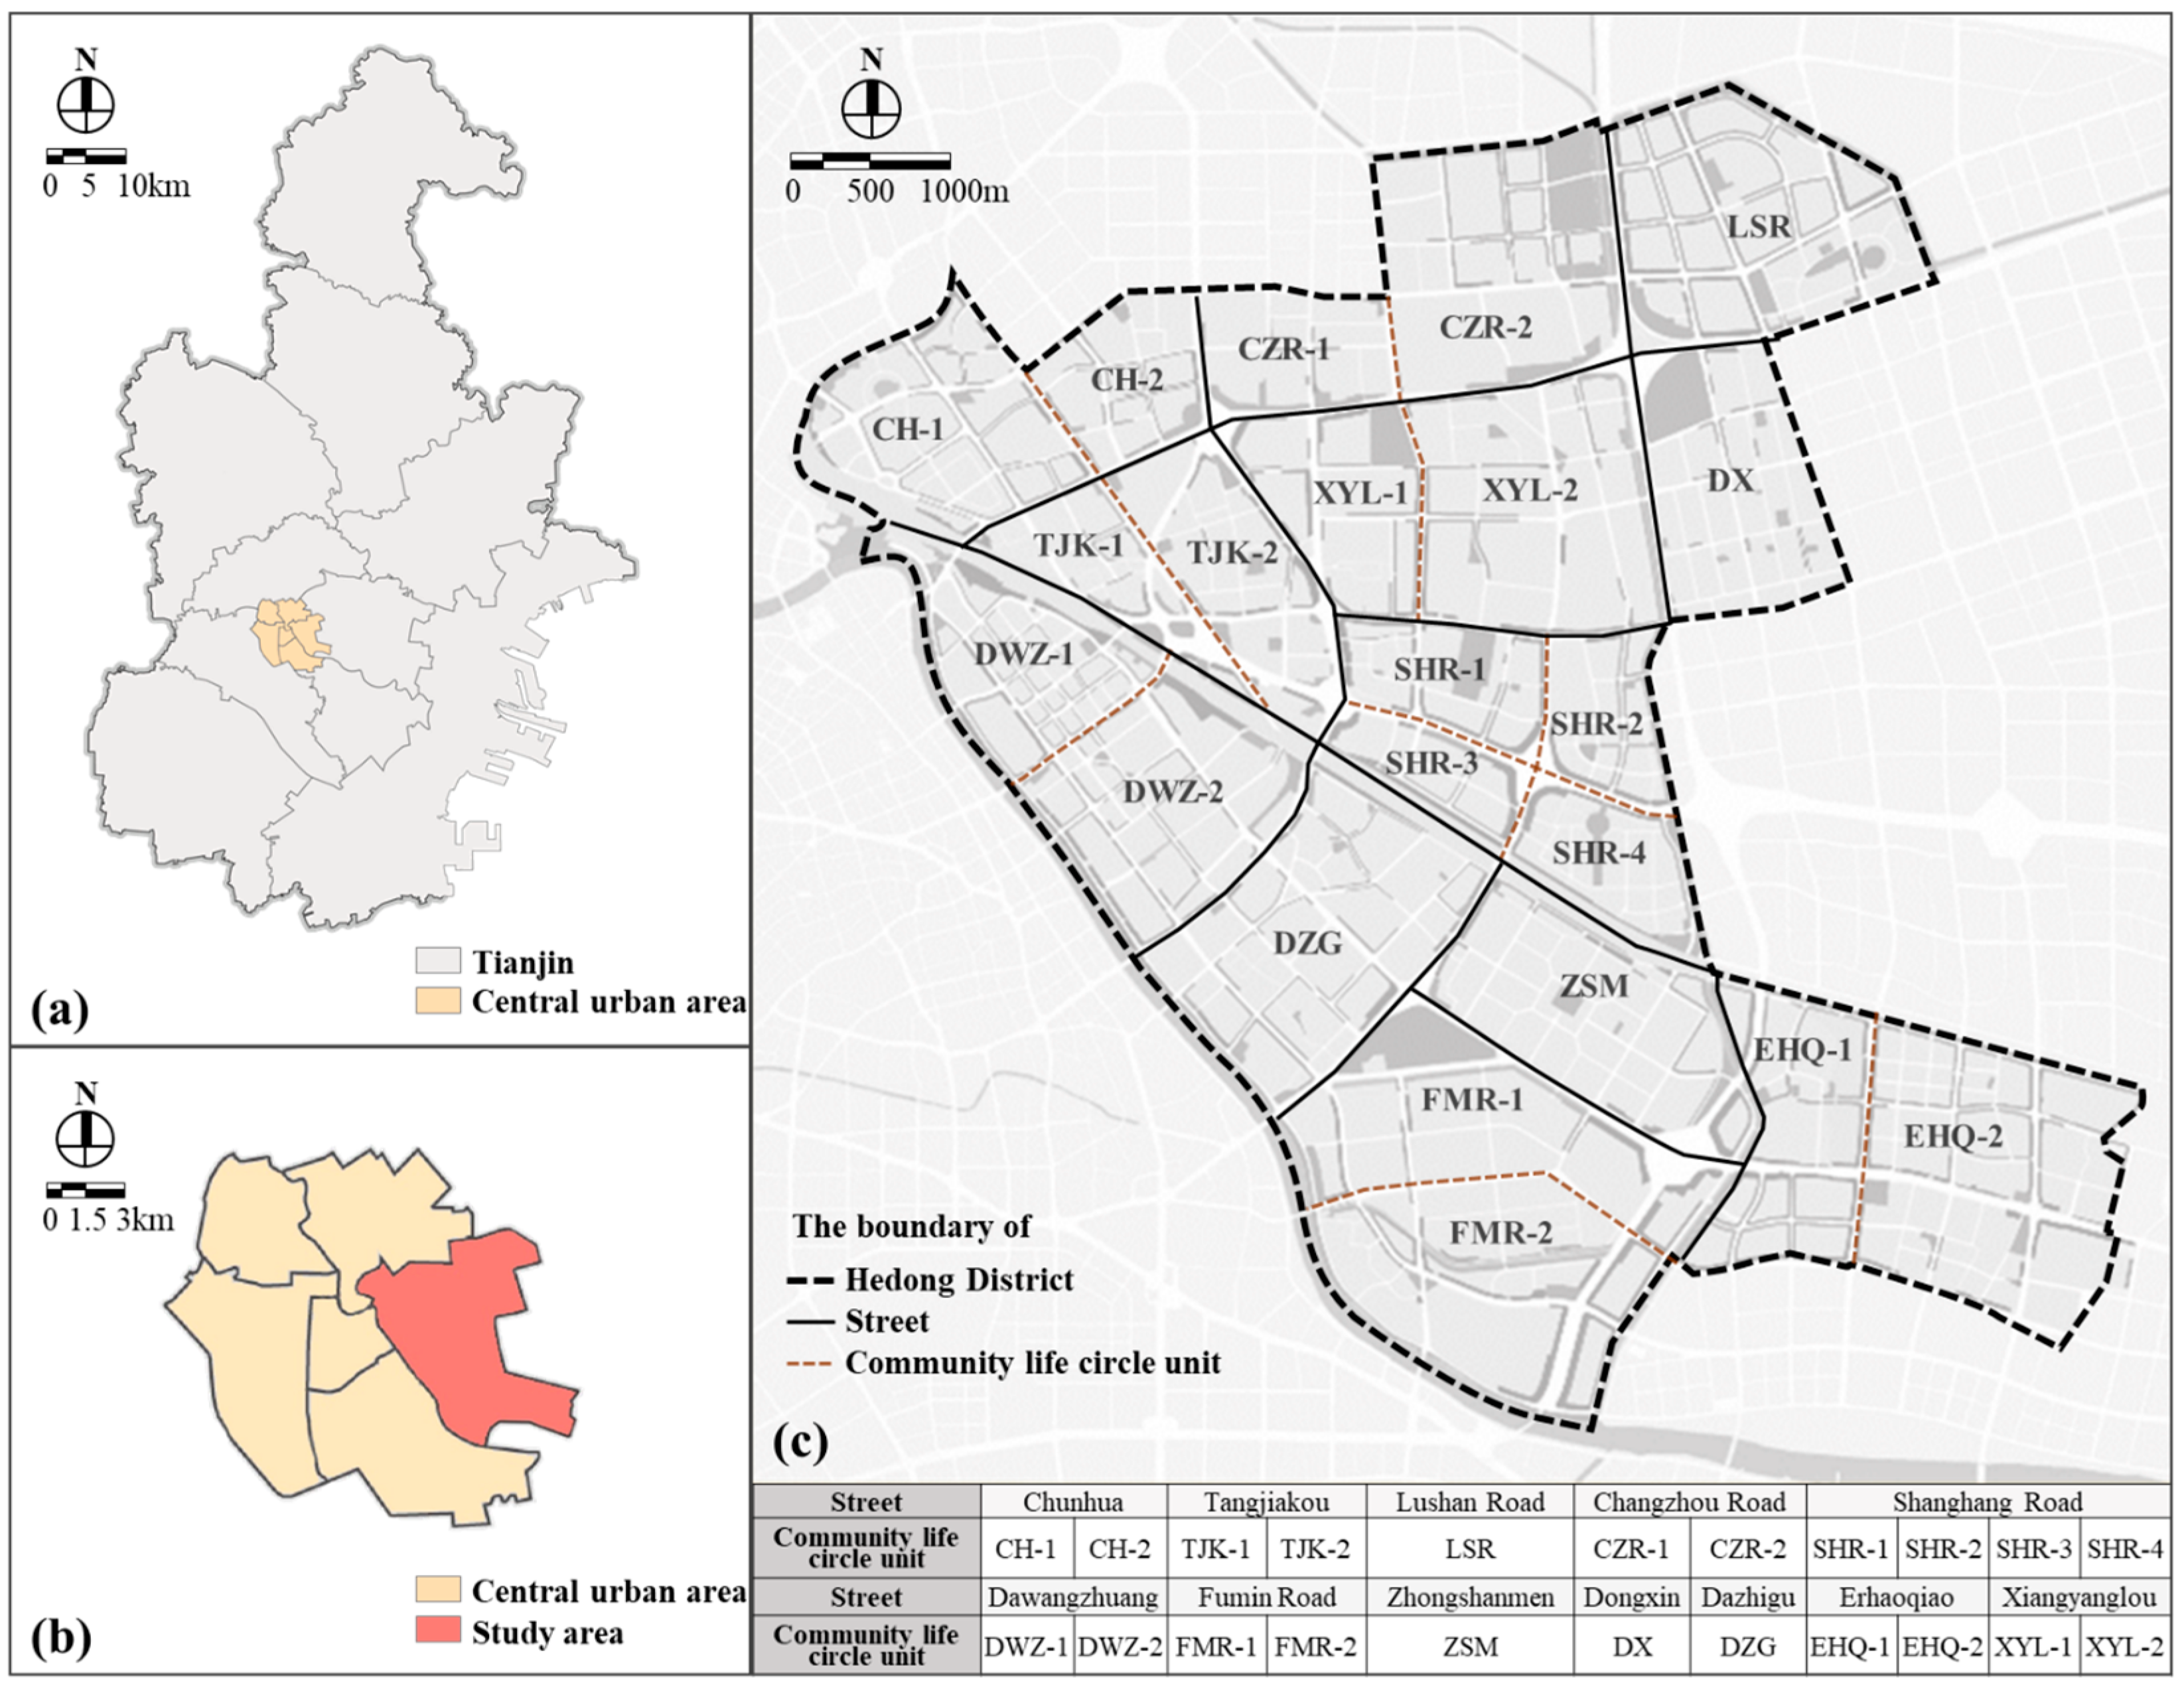
Hedong District is situated on the eastern bank of the Hai River in Tianjin, belonging to the central urban area. It covers a land area of 41.77 km2 and has a permanent population of 834,546 people. It has jurisdiction over 12 streets and can be further divided into 22 community life circle units (Figure 1). Conducting an assessment of the accessibility and equity of HSFs in Hedong District holds significant practical relevance. On one hand, the Hedong District is among the central urban areas in Tianjin that have experienced early and high levels of aging. According to the 2021 Statistical Yearbook of Tianjin, the proportion of elderly population in Hedong District was 19.46% in 2020, indicating that it has already entered a stage of deep aging (https://stats.tj.gov.cn/nianjian/2021nj/zk/indexch.htm, accessed on 27 March 2023). On the other hand, the allocation level of HSFs in Hedong District is relatively low. Additionally, the complex network of rapid transportation within the area results in highly fragmented living spaces and travel environments for residents. This highlights the urgent need for a precise assessment of the accessibility and equity of HSFs in the Hedong District to identify shortcomings and gaps in the construction.
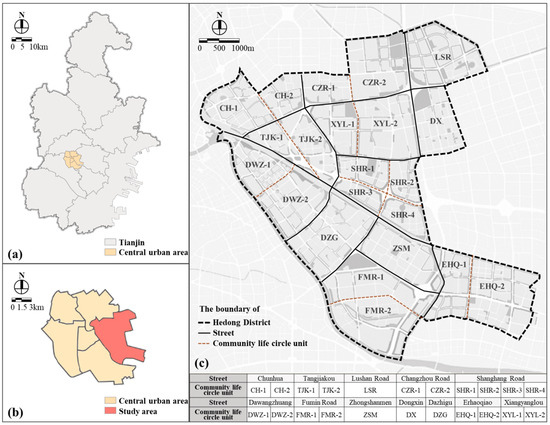
Figure 1.
The geographic location and basic information of Hedong District. (a) Scope of Tianjin, (b) Scope of the central urban area of Tianjin, (c) Scope of the Hedong District of Tianjin.
2.2. Data Source and Processing
The research data include the following four categories: residential quarters, population information, pedestrian road network, and health service facilities (Figure 2).

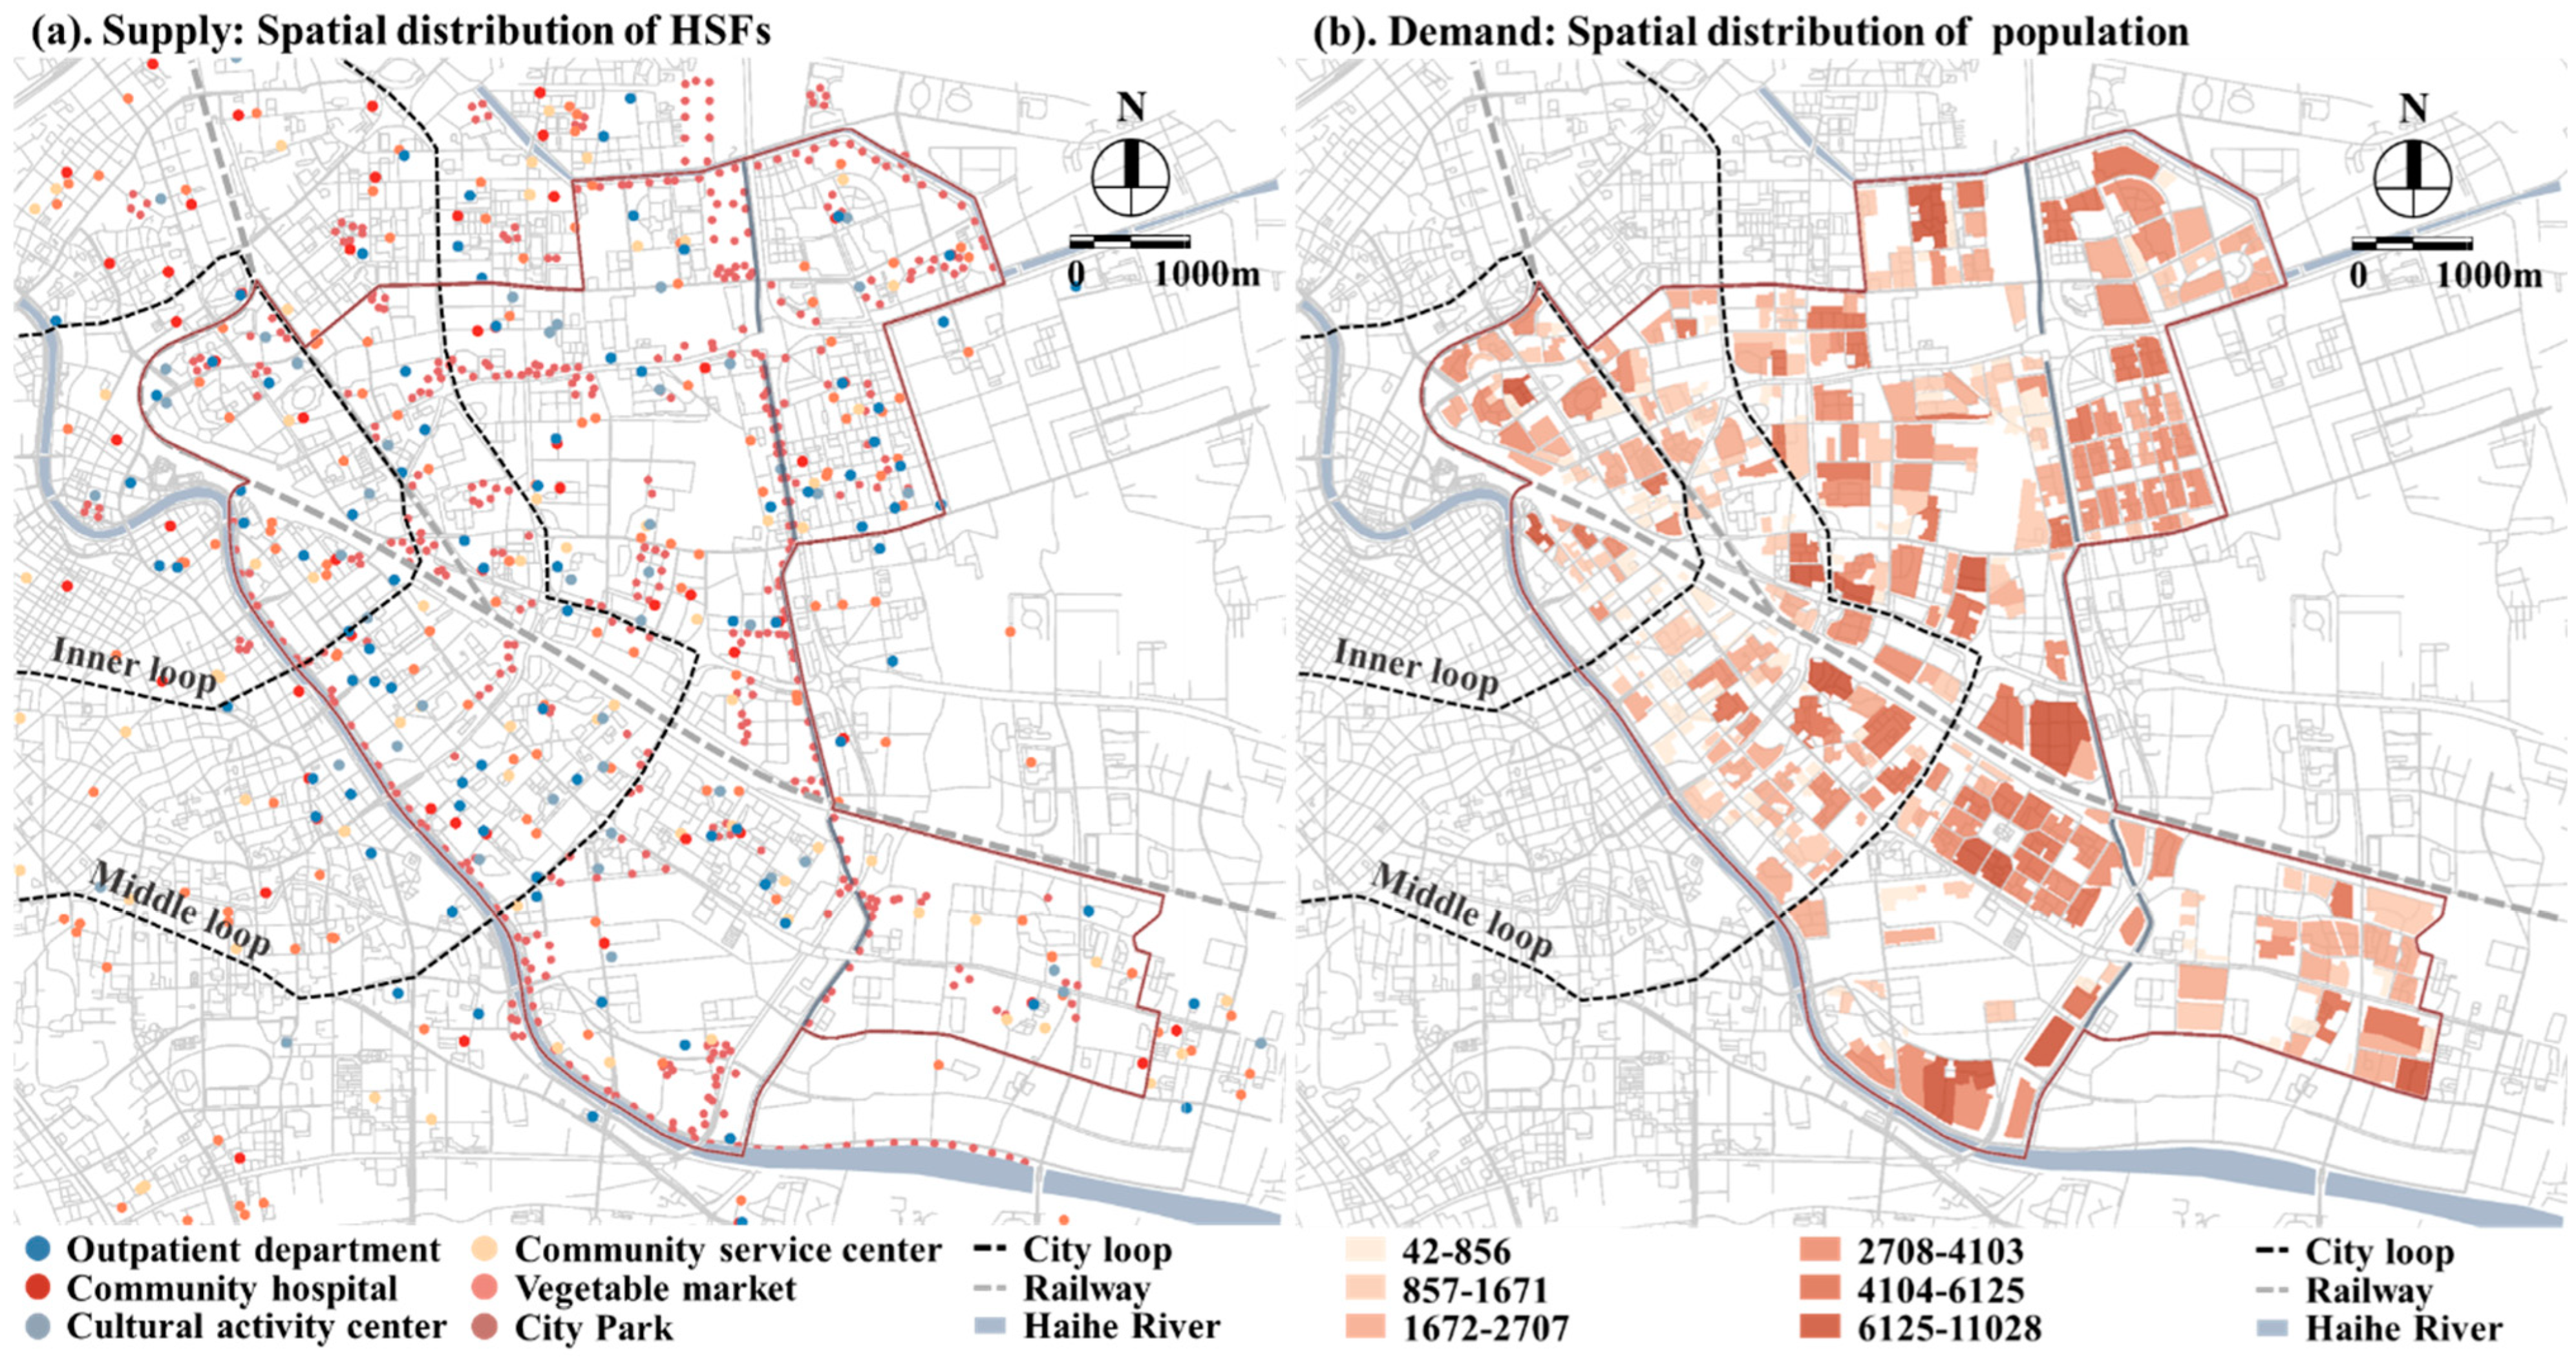
Figure 2.
Spatial distribution of the HSFs and the population.
- (1)
- Residential quarter
The data consist of vector polygon data collected through Baidu Maps, encompassing a total of 405 residential quarters. In this study, GIS is employed to compute the geometric centroids of each residential quarter, serving as the starting points for the residents’ demand.
- (2)
- Population information
These data come from the seventh census data of the Hedong District provided by the Tianjin Hedong District Natural Resources and Planning Bureau. Due to the granularity of the data being limited to the street level, the population data for each residential quarter are allocated based on the ratio of its household count to the total number of households on the respective street. And we assume that the elderly population within each street is uniformly distributed.
- (3)
- Pedestrian road network
The data consist of pedestrian road network data collected through Baidu Maps. Based on field surveys and visual interpretation of satellite images, we removed roads unsuitable for walking, supplemented residential area-level roads, and conducted topological checks to construct a pedestrian road network dataset.
- (4)
- Health service facilities
The data come from the POI data obtained from the Baidu Map Place API interface and the attribute information comes from the land management department of Hedong District, including the spatial point and building scale of each HSFs. We conducted a comparison and deduplication process on the data from the two sources. In the end, a total of 903 POI data were selected. Among them, entrances to city parks were chosen as service supply points for this facility.
Furthermore, considering that residents may access relevant HSFs outside the research area, we have retained road networks and various types of POI data within 1.5 km outside the research area boundary.
2.3. Methods
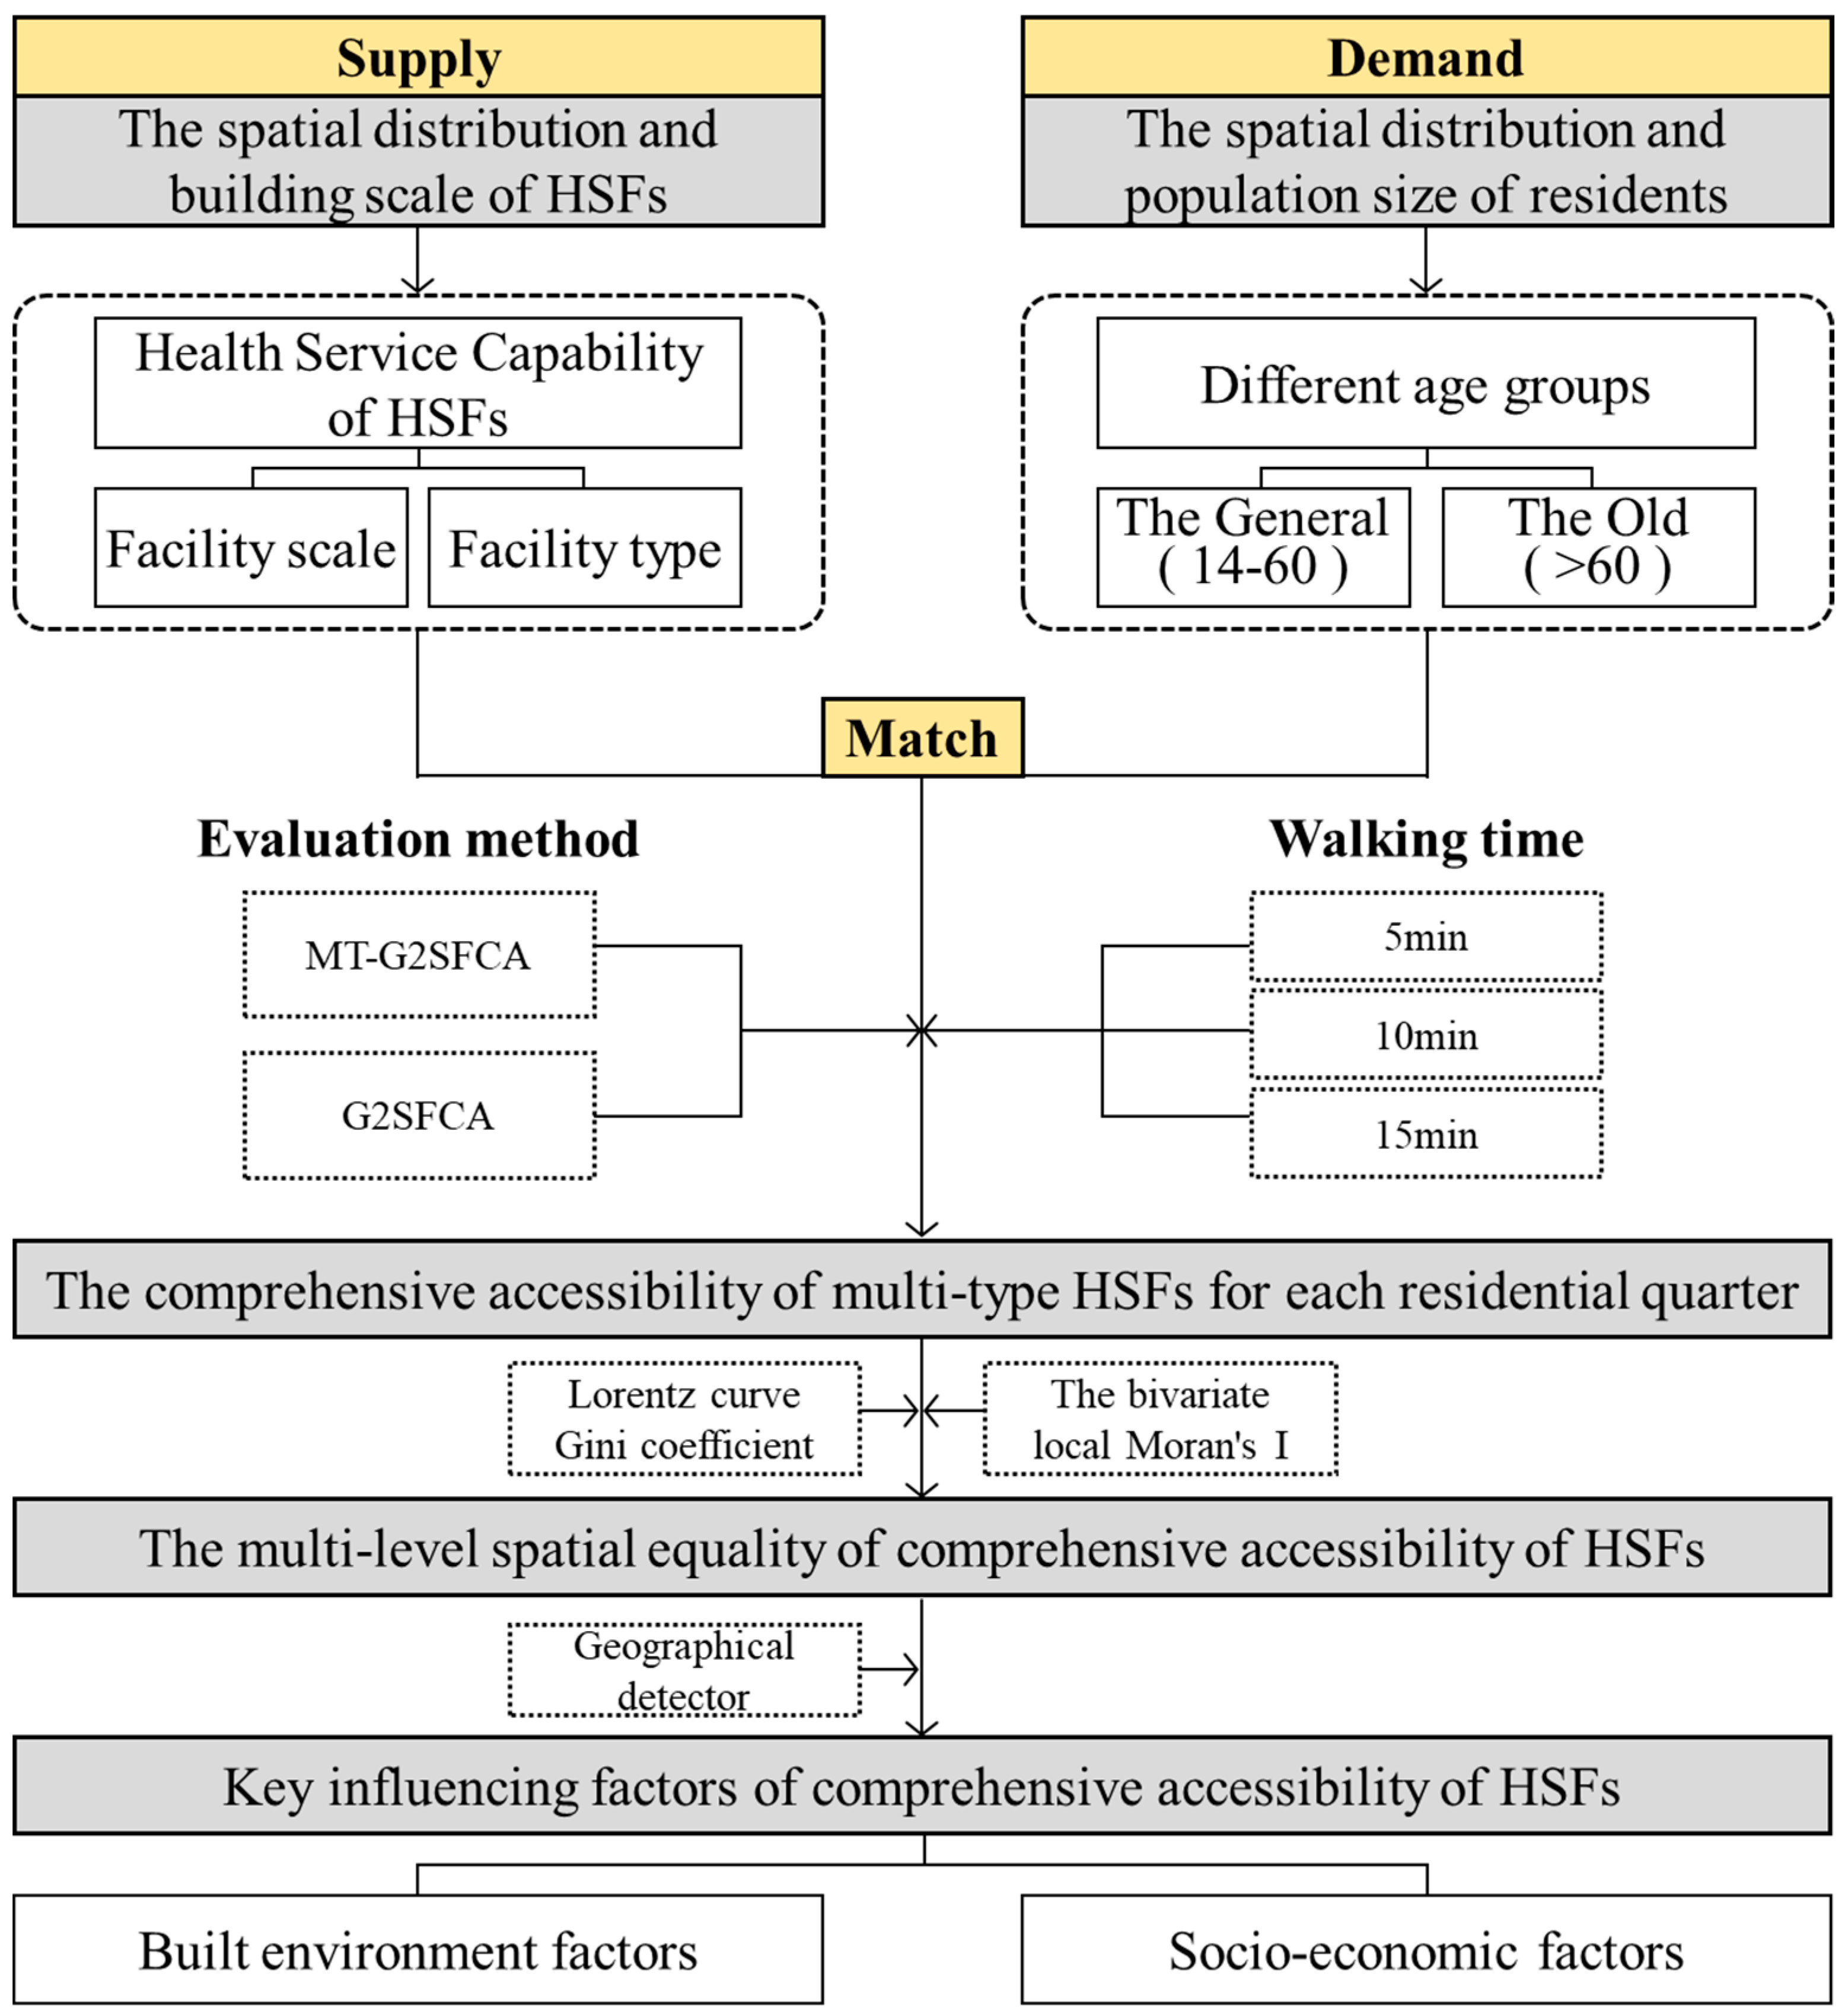
Building upon the dynamics of supply and demand, this research enhances the accuracy and comprehensiveness of the evaluation method by expanding the capacity attributes on the supply side and refining the demographic types on the demand side. Specifically, concerning the supply side, this study proposes comprehensively characterizing the health service capacity attributes of HSFs from two dimensions, namely “facility scale” and “facility type”. For the demand side, considering the trend of population aging and the relatively limited walking mobility of the elderly, the study subdivides the demand population into two groups with different behavioral characteristics, the general age group (14–60) and the elderly group (>60). It is noteworthy to mention that in urban centers in China, due to the prevalence of vehicular traffic, children under 14 years old are typically accompanied by their parents when going out and are rarely allowed to travel alone for safety reasons. Hence, their actual travel speed can be regarded as the same as those of the general group. Therefore, this study did not categorize children as a separate demand population group for discussion. Figure 3 shows the overall framework of this study. Firstly, considering the disparate walking speeds between the general and the elderly, the study utilized both the traditional G2SFCA and the improved MT-G2SFCA to assess the comprehensive accessibility of HSFs for each residential quarter under three scenarios, which were walking for 5 min, 10 min, and 15 min. Secondly, the Gini coefficient and the bivariate local Moran’s I are used to evaluate the spatial equity of comprehensive accessibility of HSFs at both the vertical and horizontal levels. Finally, the geo-detector is employed to analyze the key factors influencing the comprehensive accessibility of HSFs from the aspects of built environment and social economy.
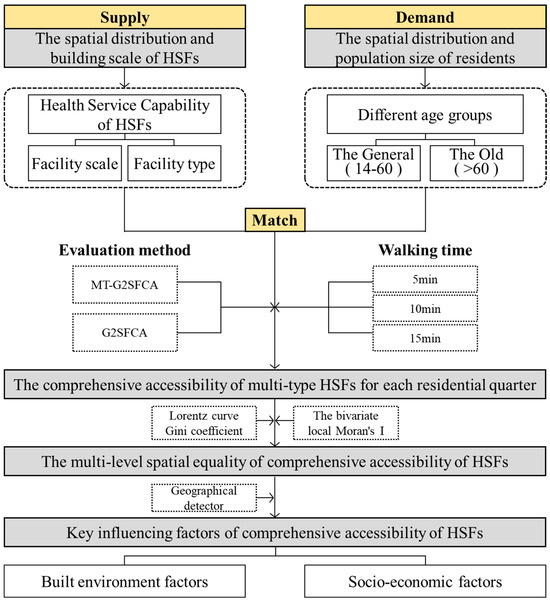
Figure 3.
Research framework.
2.3.1. Assessing Comprehensive Accessibility Based on MT-G2SFCA
- Assessing facility scale accessibility for multi-type facilities
Based on the survey results of the previous research, this study selects six types of HSFs that are frequently used by residents as the objects of investigation. We then utilize the G2SFCA method to compute the scale supply–demand ratio for various types of HSFs, and normalize the calculation based on the facility scale standards for each type of HSFs (Table 1). Finally, we sum up the supply–demand ratios of various HSF types to obtain the overall scale accessibility of HSFs. This method involves the following three steps:

Table 1.
The per capita facility scale index of various facilities.
Step 1: Calculate the facility scale supply–demand ratio for each HSF. Firstly, systematically locate all demand points k located within the walking distance threshold d0 range of facility point j. Then, utilize the Gaussian function G to weight and sum the population counts of demand point k, and calculate the total population count Pk of all points k within the search area of point j. Finally, calculate R as shown in Formulas (1) and (2).
Among them, represents the actual distance between the k and the j along the pedestrian network rather than the traditional Euclidean distance. is the building scale of facilities j of type i. d0 represents the walking distance threshold for the different age groups. To avoid calculation errors caused by using a single threshold, this study sets three time thresholds, 5 min, 10 min, and 15 min. Referring to the survey results regarding the walking speed of the elderly [56,57,58,59], the walking distance thresholds are set at 300 m, 600 m, and 900 m for the elderly population, while for the general population, they are set at 500 m, 1000 m, and 1500 m.
Step 2: Compute the scale supply–demand ratio for every type of HSF accessed by each residential quarter. Sum up the facility scale supply–demand ratios for all facilities j within the walking range d0 of the k to obtain the cumulative facility scale supply–demand ratios for demand point k, as shown in Formula (3).
Step 3: Calculate the comprehensive facility scale accessibility Wk of each demand point k. Firstly, set the standard values A for the scale supply–demand ratio as shown in Table 1, refer to the Standards for Urban Residential quarters Planning and Design. Secondly, calculate the normalized value of the facility scale accessibility of each demand point k as shown in Formula (4). Finally, sum up the facility scale accessibility of each type of HSFs to obtain the comprehensive facility scale accessibility Wk as shown in Formula (5).
This study adopts normalization to calculate the facility scale accessibility of each type of facility, ensuring comparability among different types of facilities. In addition, considering the potential impact of extreme values on the calculation results, this study adopts a normalization approach by establishing an upper limit for indicator values. Specifically, any scores exceeding this upper limit for a given facility category are capped at that limit. This approach aims to minimize the potential influence of extreme values on standardization scoring.
- 2.
- Assessing facility type diversity based on Shannon–Wiener index
The diversity of HSFs serves as a measure of the richness and comprehensive health benefits within a region. The Shannon–Wiener index, commonly employed in physics to measure system complexity and quality, is selected as the assessment metric for facility type diversity [63]. The level of this index can reflect the balance and diversity of HSF types within a region, with higher values indicating greater diversity.
Among them, nki represents the total count of i-type facilities covering the residential quarter k, Uki denotes the ratio of nki to the total count of all types of facilities covered by the residential quarter, I stands for the total number of facility types covering the residential quarter, and Hk is the Shannon–Wiener index of the residential quarter.
- 3.
- Assessing comprehensive accessibility for multi-type facilities
In order to ensure the comparability between the two indicators, as shown in Formula (8), this study uses normalization to process the calculated values of facility type diversity and facility scale accessibility. Subsequently, the values are summed based on different weights α. To avoid difficulty in comparison due to excessively small numerical results, the final score is computed as ten times the sum of their values.
In the formula, the values of Wk and Hk are respectively derived from Formulas (5) and (7). The weight coefficient α is determined by the relative importance between facility scale and facility type. In this study, the impacts of both on supply and demand levels are considered equal, thus the value of α is 0.5. For the evaluation objects of streets, life circle units and other evaluation objects containing multiple residential quarters, the population of each one within their scope is used as a weight. Comprehensive accessibility is calculated based on the per capita score.
2.3.2. Spatial Equality Evaluation Based on the Gini Coefficient and the Bivariate Local Moran’s I
The Gini coefficient is frequently utilized in studies assessing overall spatial equity [64]. The higher the value of the Gini coefficient, the greater the inequality in the comprehensive accessibility of HSFs. In general, in the range of [0, 0.2), the G value indicates the absolute average, while [0.2, 0.4) signifies relatively reasonable, and ranges [0.4, 0.5) and [0.5, 1] represent a large gap and a wide gap, respectively. The Lorenz curve, introduced by Lorenz [65], is a graphical method used to visualize the equality of income distribution. In this study, it is used to represent the distribution of HSFs in different evaluation units.
where n represents the count of analysis units, P represents the cumulative population ratio within the analysis unit compared to the total, and Z represents the cumulative value of the ratio, specifically indicating the proportion of the accessibility score of the analysis unit to the total score.
The bivariate local Moran’s I is often employed to assess the correlation and matching relationship between two factors in spatial distribution. In this study, it is used to analyze the relationship between comprehensive accessibility of HSFs and the distribution of residential population, thereby better reflecting the equity among local spatial areas. The formula is as follows:
represents the value of HSFs accessibility in residential quarter i, represents the value of population density in residential quarter j, and wij represents the spatial weight relationship between residential quarter i and j. The spatial matching relationships can be categorized as High–High, High–Low, Low–High, Low–Low, and non-significant types. By discerning the types and distribution of clusters, regions with mismatches can be identified, allowing for the assessment of the spatial equity of HSF supply–demand levels.
2.3.3. Impact Factor Analysis Based on Geo-Detector
Geo-detectors are commonly employed to reveal the spatial heterogeneity and driving factors contributing to this differentiation, as well as their explanatory power [66,67]. This method has no restriction on data type and has high statistical accuracy in small-sample-size analysis. This study uses geo-detectors to detect the key factors influencing the supply–demand level of HSFs.
where L stands for the classification of variables. Nh and σh represent the sample number and variance of layer h, respectively. N and σ represent the same of the study area. The q represents the explanatory power of the influencing factor, with a range from 0 to 1.
The study takes 22 community life circle units in the Hedong District as research units. The dependent variable is the per capita comprehensive accessibility, and the explanatory variables are picked from the built environment and socio-economic aspects as shown in Table 2, based on the relevant literature [68,69,70,71,72,73].
Table 2.
Type and definitions of explanatory variables.
3. Results
3.1. The Spatial Differences in Accessibility between G2SFCA and MT-G2SFCA
The accessibility of HSFs is calculated using both the G2SFCA and MT-G2SFCA methods under the walking time thresholds of 5 min, 10 min, and 15 min, as shown in Figure 4 and Figure 5. To compare the results of both methods, this study uniformly normalizes their computed values and divides their results into five categories according to the same criteria.

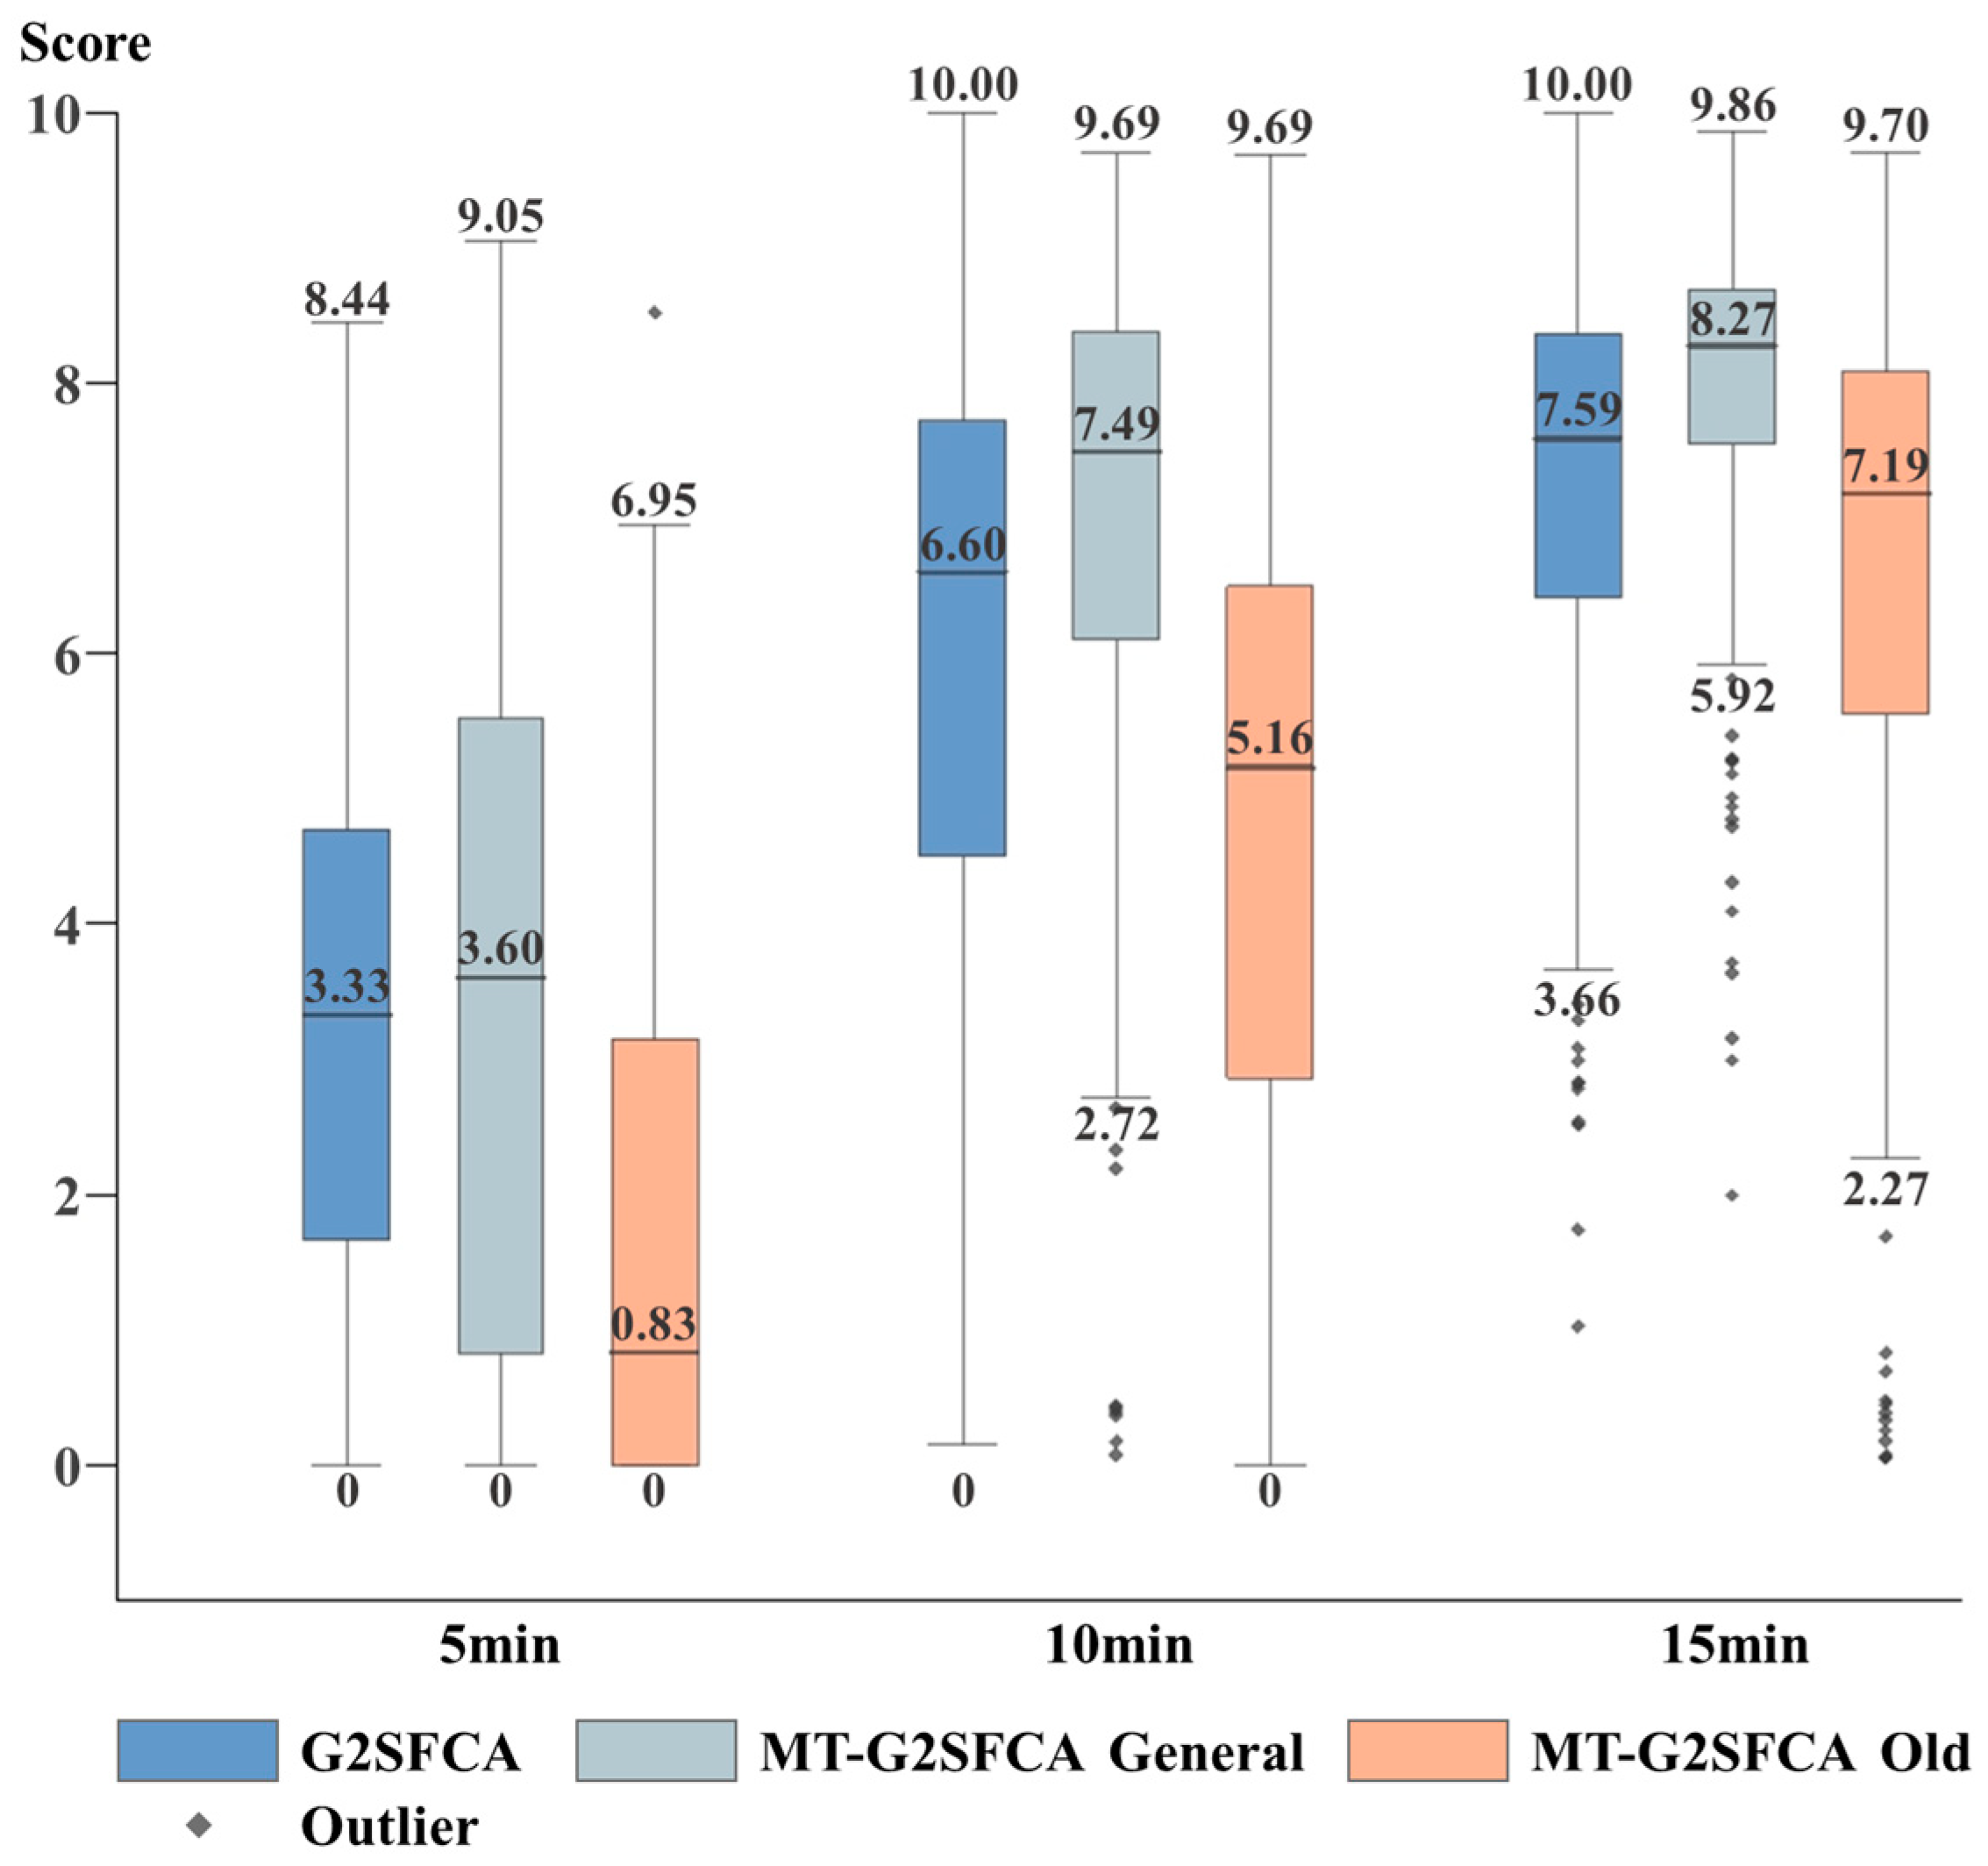
Figure 4.
Box diagram of comprehensive accessibility scores of HSFs.
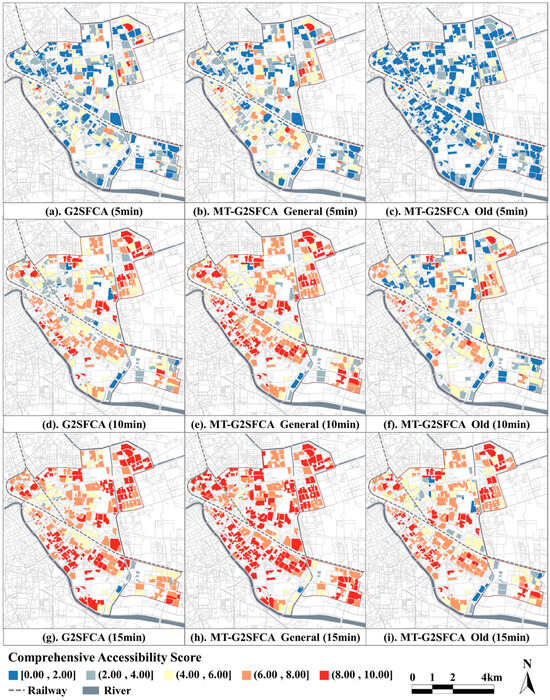
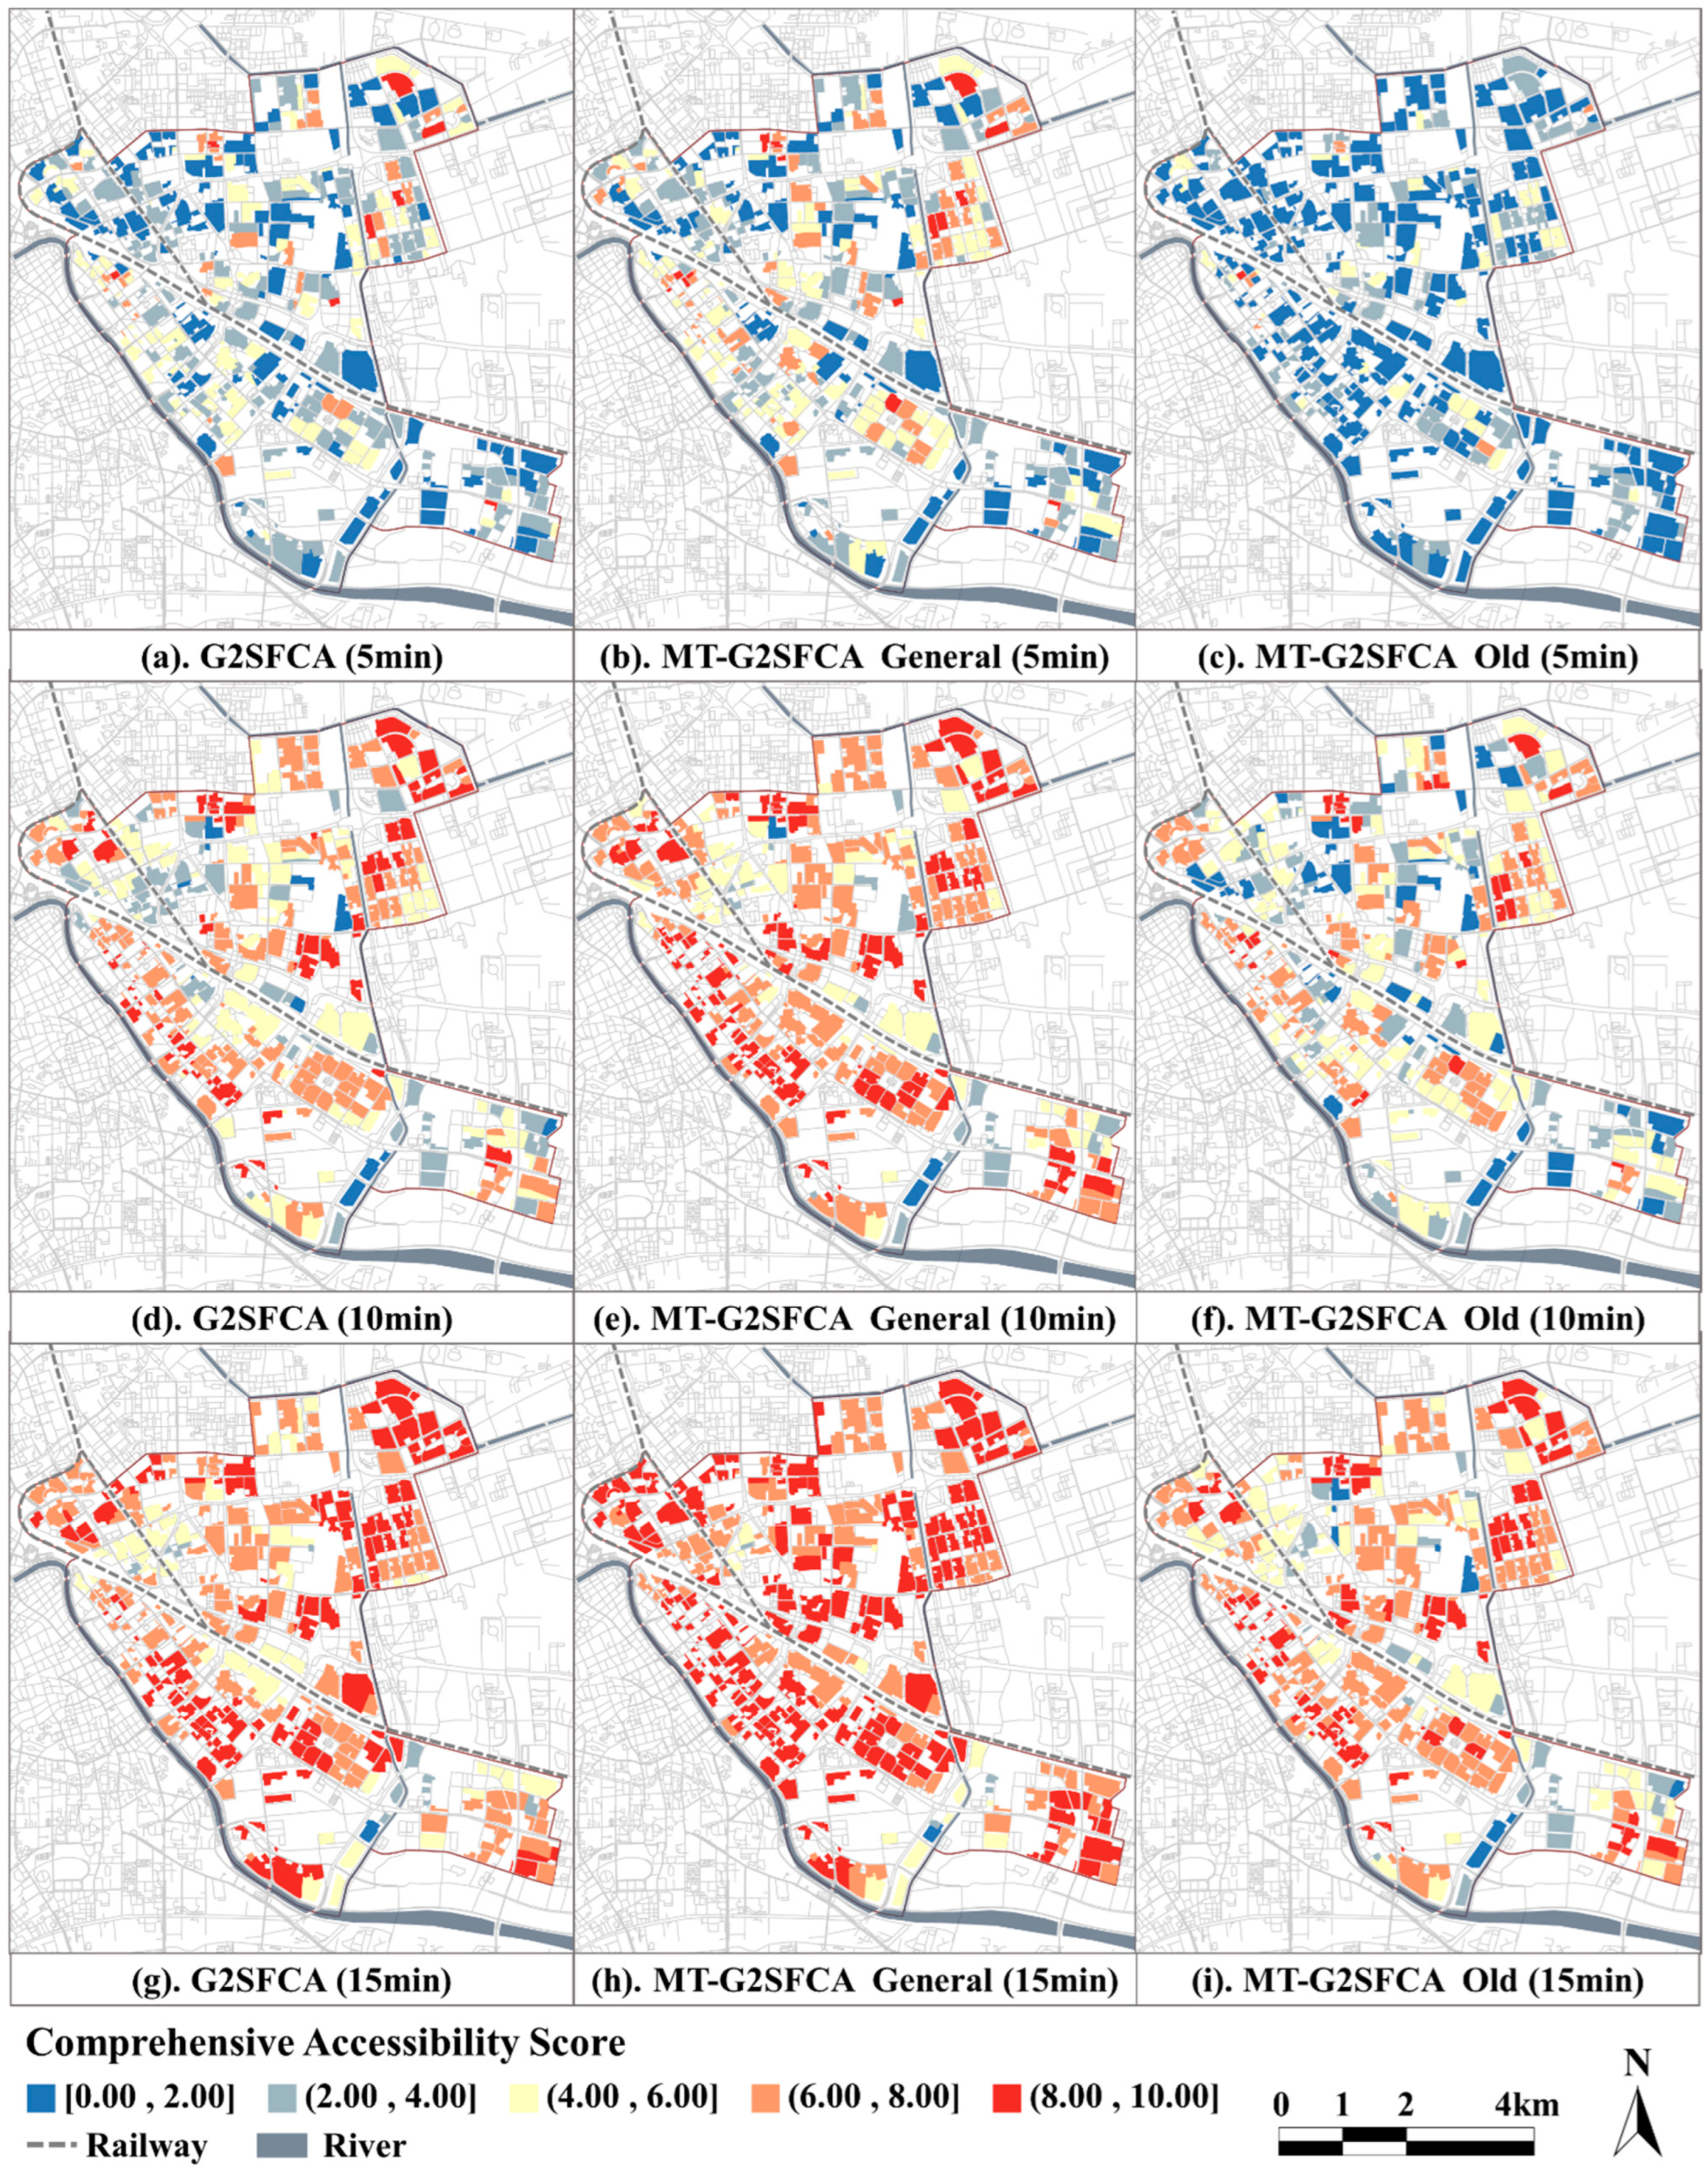
Figure 5.
Spatial distribution of comprehensive accessibility scores of HSFs.
As shown in Figure 4, the accessibility of HSFs in the Hedong District gradually increases with the increase in walking time; when the walking time is 5 min, the median scores of the accessibility of HSFs calculated by both methods are below four points. Specifically, the median score for the elderly group is only 0.83. This indicates that the overall supply level of HSFs in residential quarters in the Hedong District, particularly in proximity to surrounding areas, needs improvement. When the walking time increases to 10 min, the median scores for the general age group calculated by both methods increase from 3.33 and 3.60 to 6.60 and 7.49, respectively. This indicates that under the threshold of 10 min, there has been a significant improvement in the health facility services available to most residents in the Hedong District. However, the median score for the elderly group is only 5.16, which remains at a relatively low level. When the walking time increases to 15 min, the median scores for all three categories of calculated results are above seven. This indicates that under the 15 min threshold, most residents in the Hedong District can enjoy satisfactory health facility services.
Comparing the results of the two methods reveals that, under the same walking time threshold, their overall characteristics in terms of quantity statistics and spatial distribution are generally similar. Under the three walking time thresholds, the accessibility scores calculated by G2SFCA are consistently slightly lower than those calculated by MT-G2SFCA. Areas with slightly lower scores compared to others include Dawangzhuang Street and Dazhigu Street along the Haihe River, as well as large residential areas such as Zhongshanmen and Dongxin Street. These areas, situated in the urban core or densely populated urban areas, are surrounded by a richer variety of facilities. As walking time increases, the advantage of residents’ access to the comprehensive supply levels of HSFs becomes more pronounced in terms of facility type dimensions.
Comparing the results of the two age groups’ calculations reveals that, under the same walking time, the scores of the elderly group are consistently lower than the general. Furthermore, looking at the increase in scores across the three time scenarios, it is notable that the general group does not exhibit a significant increase in comprehensive accessibility scores from 10 min to 15 min of walking. Moreover, the health facility services obtained by 10 min are already at a high level. While the elderly group needs to walk 15 min to obtain the same level of comprehensive accessibility of HSFs as the general group walking for 10 min. This indicates that there is an inequality in the comprehensive accessibility of HSFs due to age differences. Compared with the general group, the elderly are in a weaker position. Facing the increasingly severe issue of population aging, this inequality in supply and demand deserves attention. In spatial distribution, regions exhibiting comparatively diminished scores for the elderly demographic are chiefly clustered around urban overpasses and railway locales. Due to obstruction and fragmentation caused by rapid transportation facilities, the pedestrian network spatial connectivity in these areas is often low, and environmental quality is poor, further exacerbating mobility challenges for the elderly.
3.2. The Spatial Equality of Comprehensive Accessibility Scores of HSFs
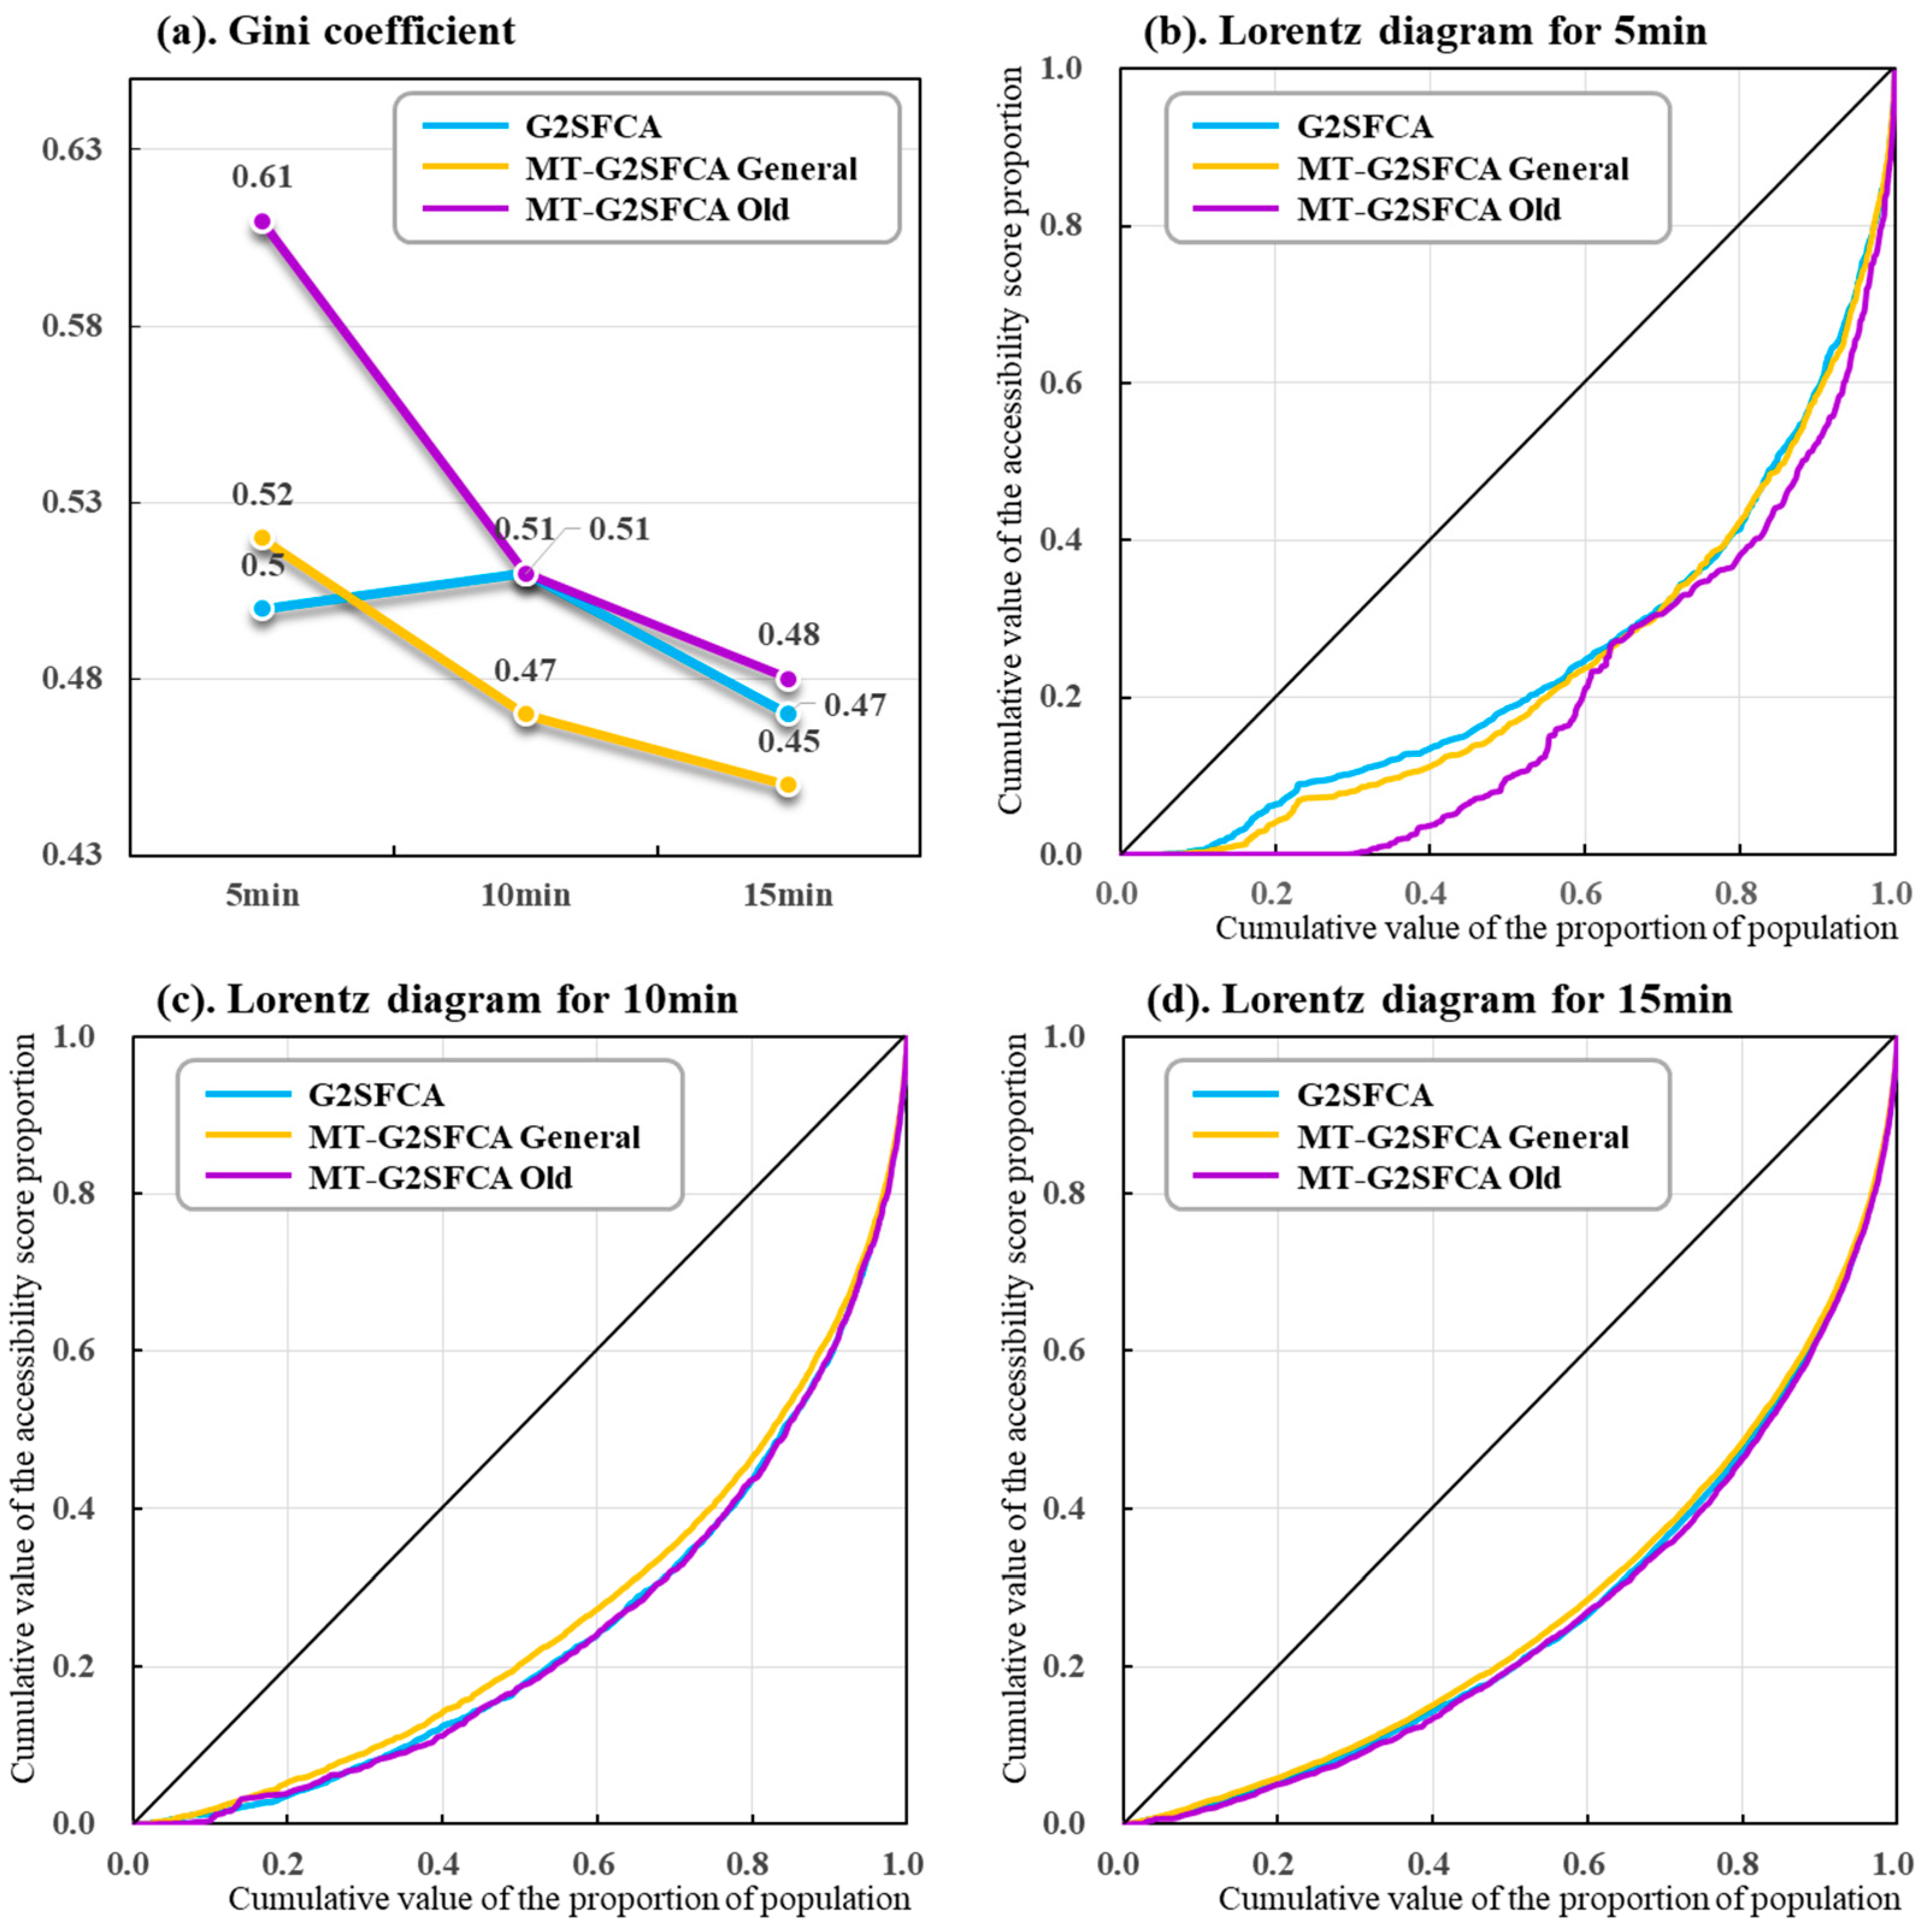
We calculated the Gini coefficients of comprehensive accessibility scores of HSFs under different walking time thresholds using G2SFCA and MT-G2SFCA, respectively. Subsequently, we depicted Lorenz curves based on these calculations. As observed in Figure 6, the spatial equity of the comprehensive accessibility scores of HSFs in the Hedong District generally gradually improves as walking time increases. As the walking time increases from 5 min to 15 min, the equity level of the Gini coefficient in the three scenarios improves from “wide gap” to “large gap” but remains at a low level.
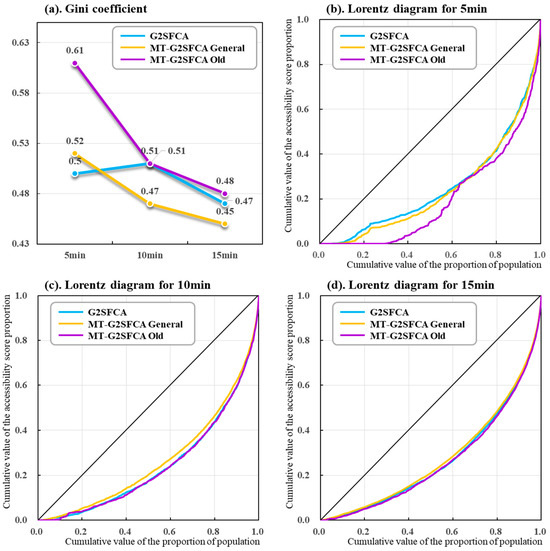
Figure 6.
The Gini coefficients and Lorentz curves of the comprehensive accessibility scores of HSFs.
Comparing the results of the two methods reveals that both G2SFCA and MT-G2SFCA demonstrate good consistency. The Gini coefficient obtained from MT-G2SFCA calculations is slightly lower than that of the traditional G2SFCA method. This suggests that the traditional G2SFCA may underestimate the spatial equity of HSFs, whereas the improved MT-G2SFCA, by considering the positive impact of facility type diversity on comprehensive accessibility scores of HSFs, can more comprehensively and effectively reflect the comprehensive service level provided by urban HSF to residents.
Comparing the calculation results of the two age groups reveals that the Gini coefficient for the elderly group is consistently higher than that of the general group, and the difference between them gradually decreases as the walking time increases. However, when the walking time is 10 min, the Gini coefficient for the elderly group still falls within the category of “wide gap”. This shows that compared with the general group, the elderly face more significant challenges regarding spatial equity.
Due to the constraints inherent in the Gini coefficient and Lorenz curve, which solely assess the overarching spatial equity of comprehensive accessibility to HSFs, without delineating local-level spatial disparities, this research employs the bivariate local Moran’s I to depict the spatial correlation between the comprehensive accessibility of HSFs and population density in the Hedong District.
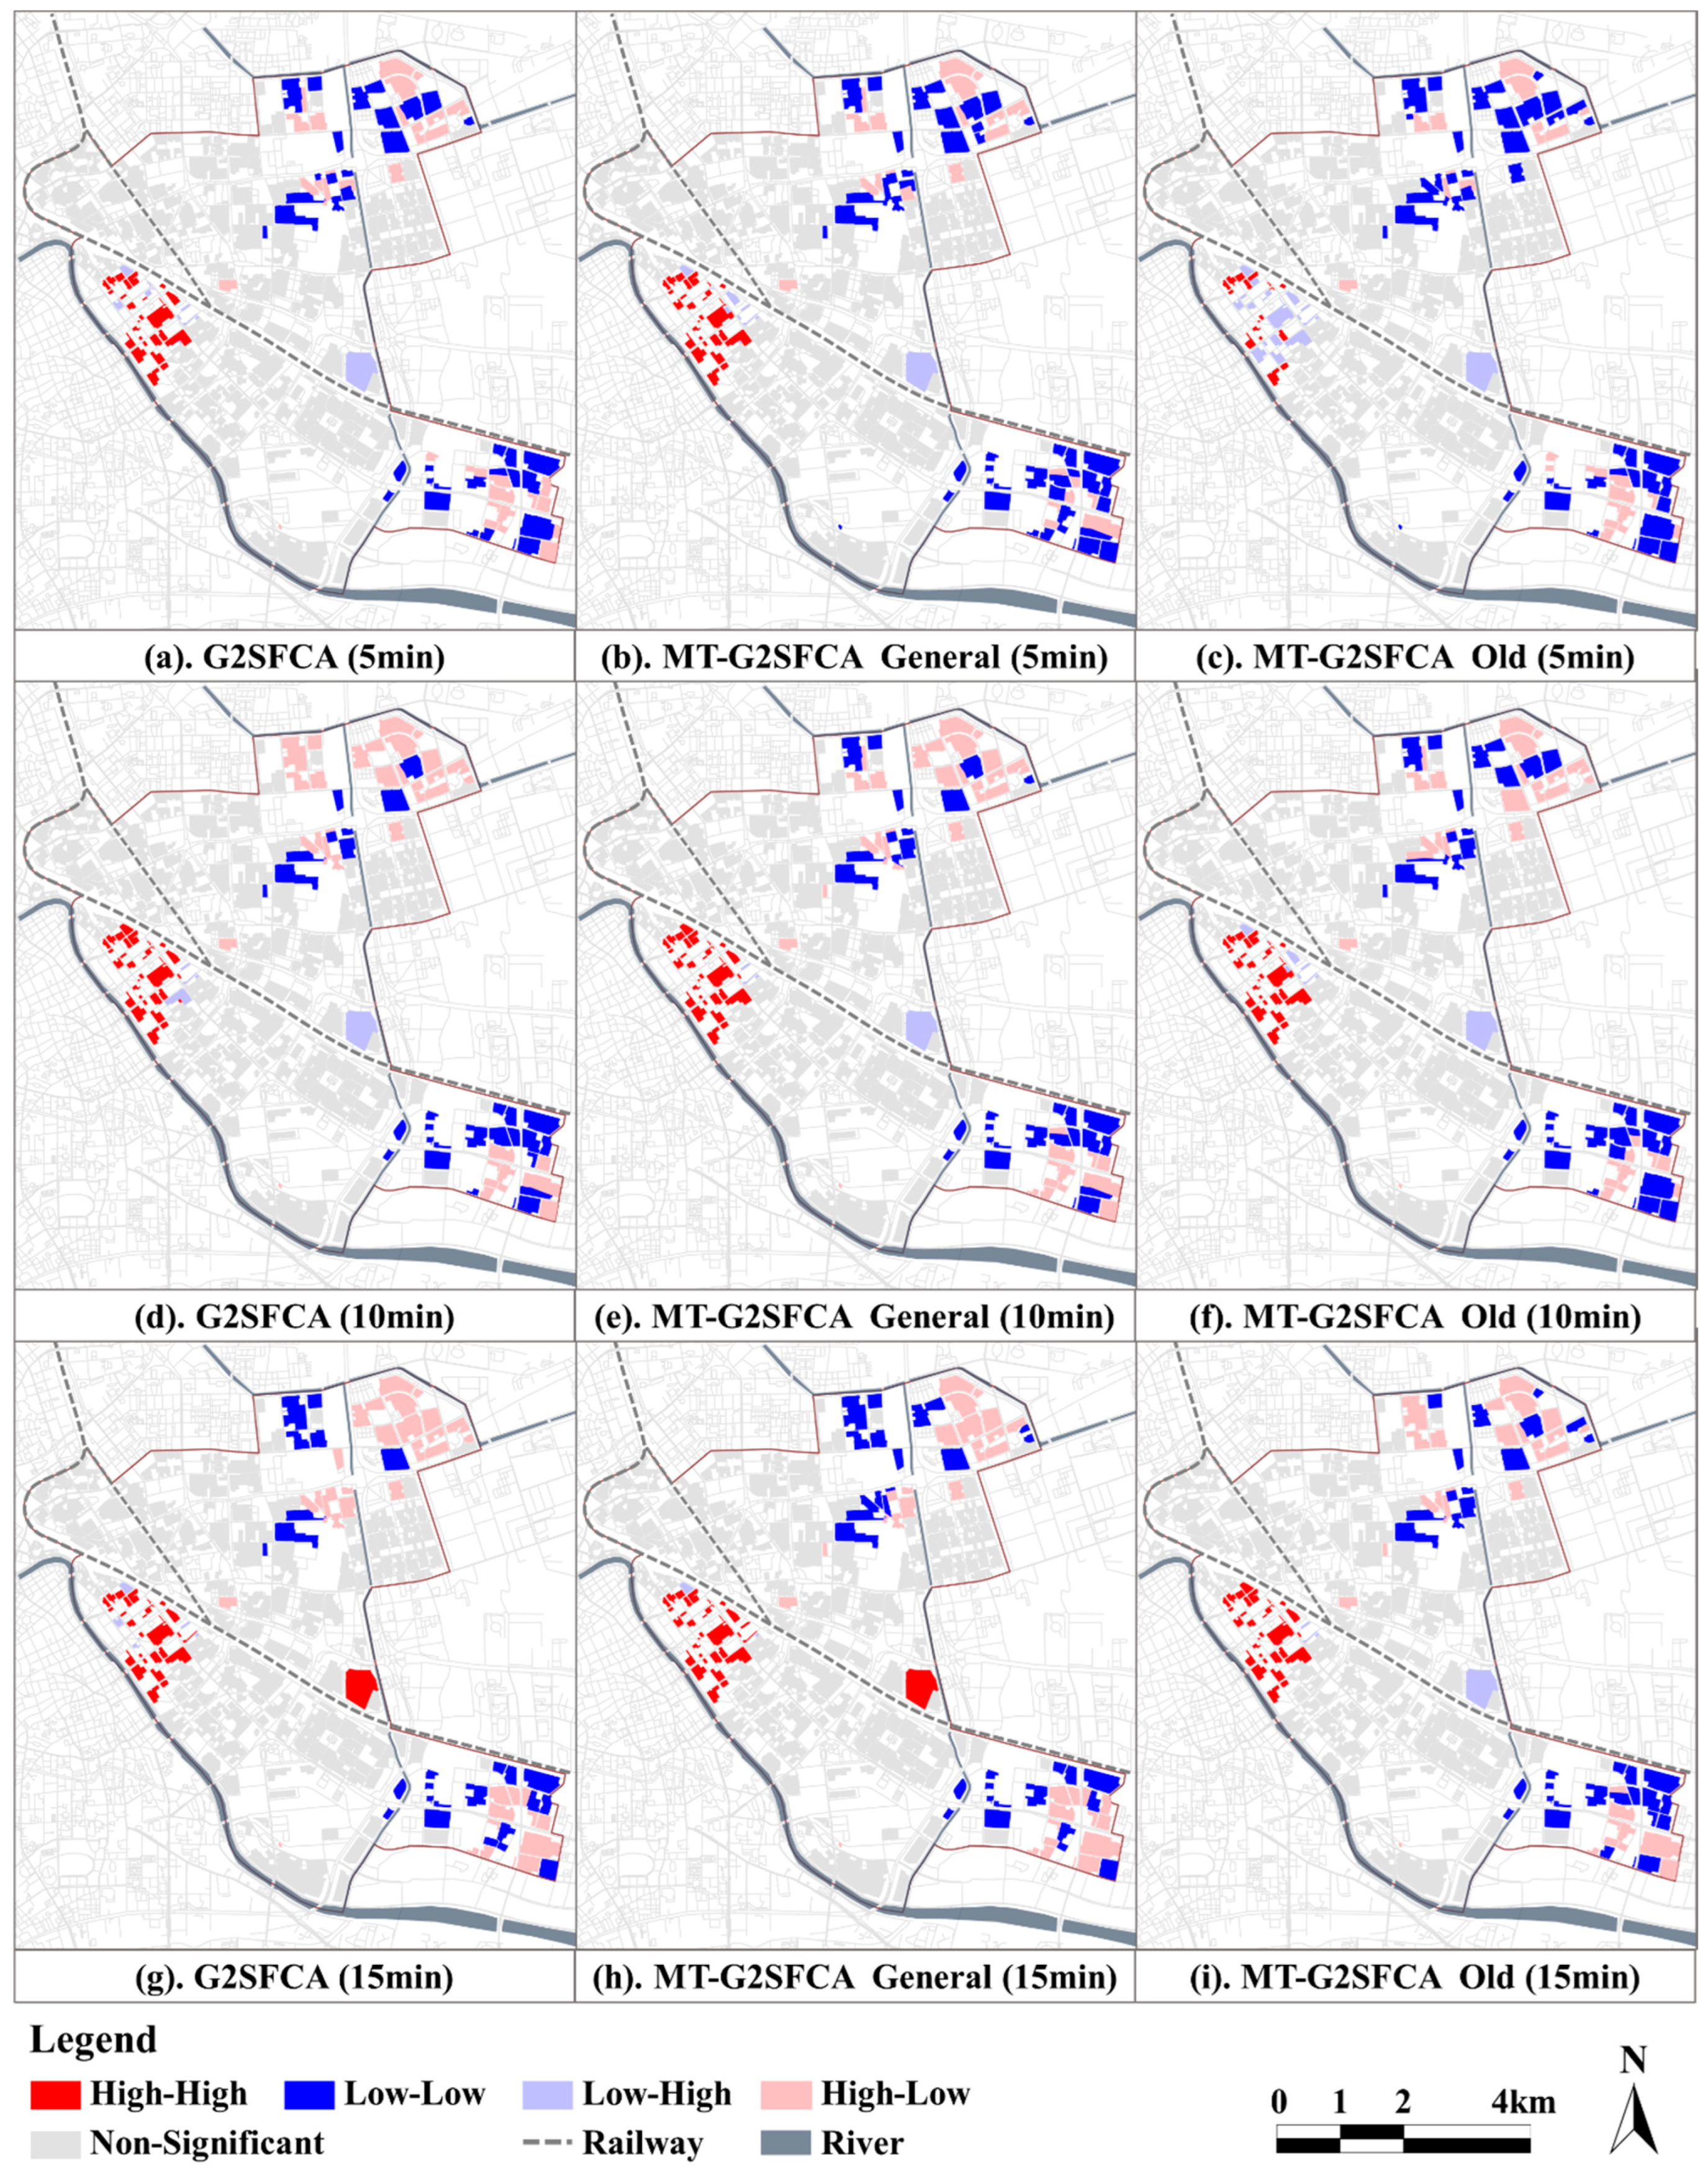
As shown in Figure 7, the spatial clustering results are generally consistent across the three scenarios. Overall, the spatial equity of HSFs in the Hedong District exhibits a “strong in the west, weak in the east” spatial characteristic. Among them, HH clusters (The explanation of abbreviations is in Table 3 at the end of the article) are mainly concentrated on the east bank of Haihe River, which is the closest area to the urban center in the Hedong District. The LL clusters primarily concentrate in the southeast and northeast of the Hedong District, belonging to the peripheral areas far from the city center. Most of the HL clusters (oversupply) are located in the northeastern part of Hedong District, particularly in the Sun City residential area. This may be attributed to the fact that it is a well-established, quality residential community with a relatively low population density and abundant health service facility resources. Overall, the supply–demand level of HSFs in Hedong District is mainly affected by the level of urban development, showing the spatial characteristics of gradual decrease from the city center outward along the region. Furthermore, regardless of the walking time threshold, there are more than half of the mismatch clustering in the Hedong District, which indicates that there is a serious supply–demand inequity between HSF allocation and population distribution in the region.
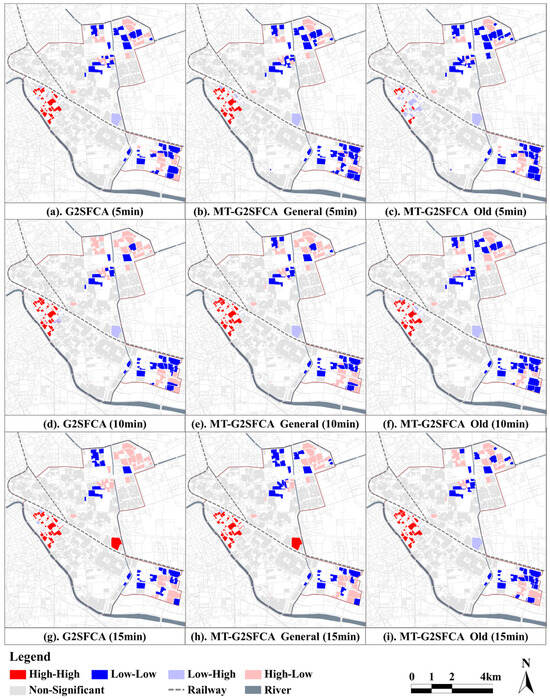
Figure 7.
Spatial correlation diagram between the accessibility of HSFs and the population density.
Table 3.
The explanation of abbreviations.
In addition, the calculation results of the two methods show good consistency under different walking time thresholds, which verifies the effectiveness of MT-G2SFCA. Comparing the computational outcomes of two age groups reveals that when the pedestrian time is 5 min, the number of HH class clusters among the elderly demographic is significantly lower than that of the general group. With an increase in pedestrian time, this situation exhibits some improvement, but it still underscores the spatial inequity challenges faced by the elderly compared to younger adults.
3.3. Impact Factor Exploration of the Comprehensive Accessibility of HSFs
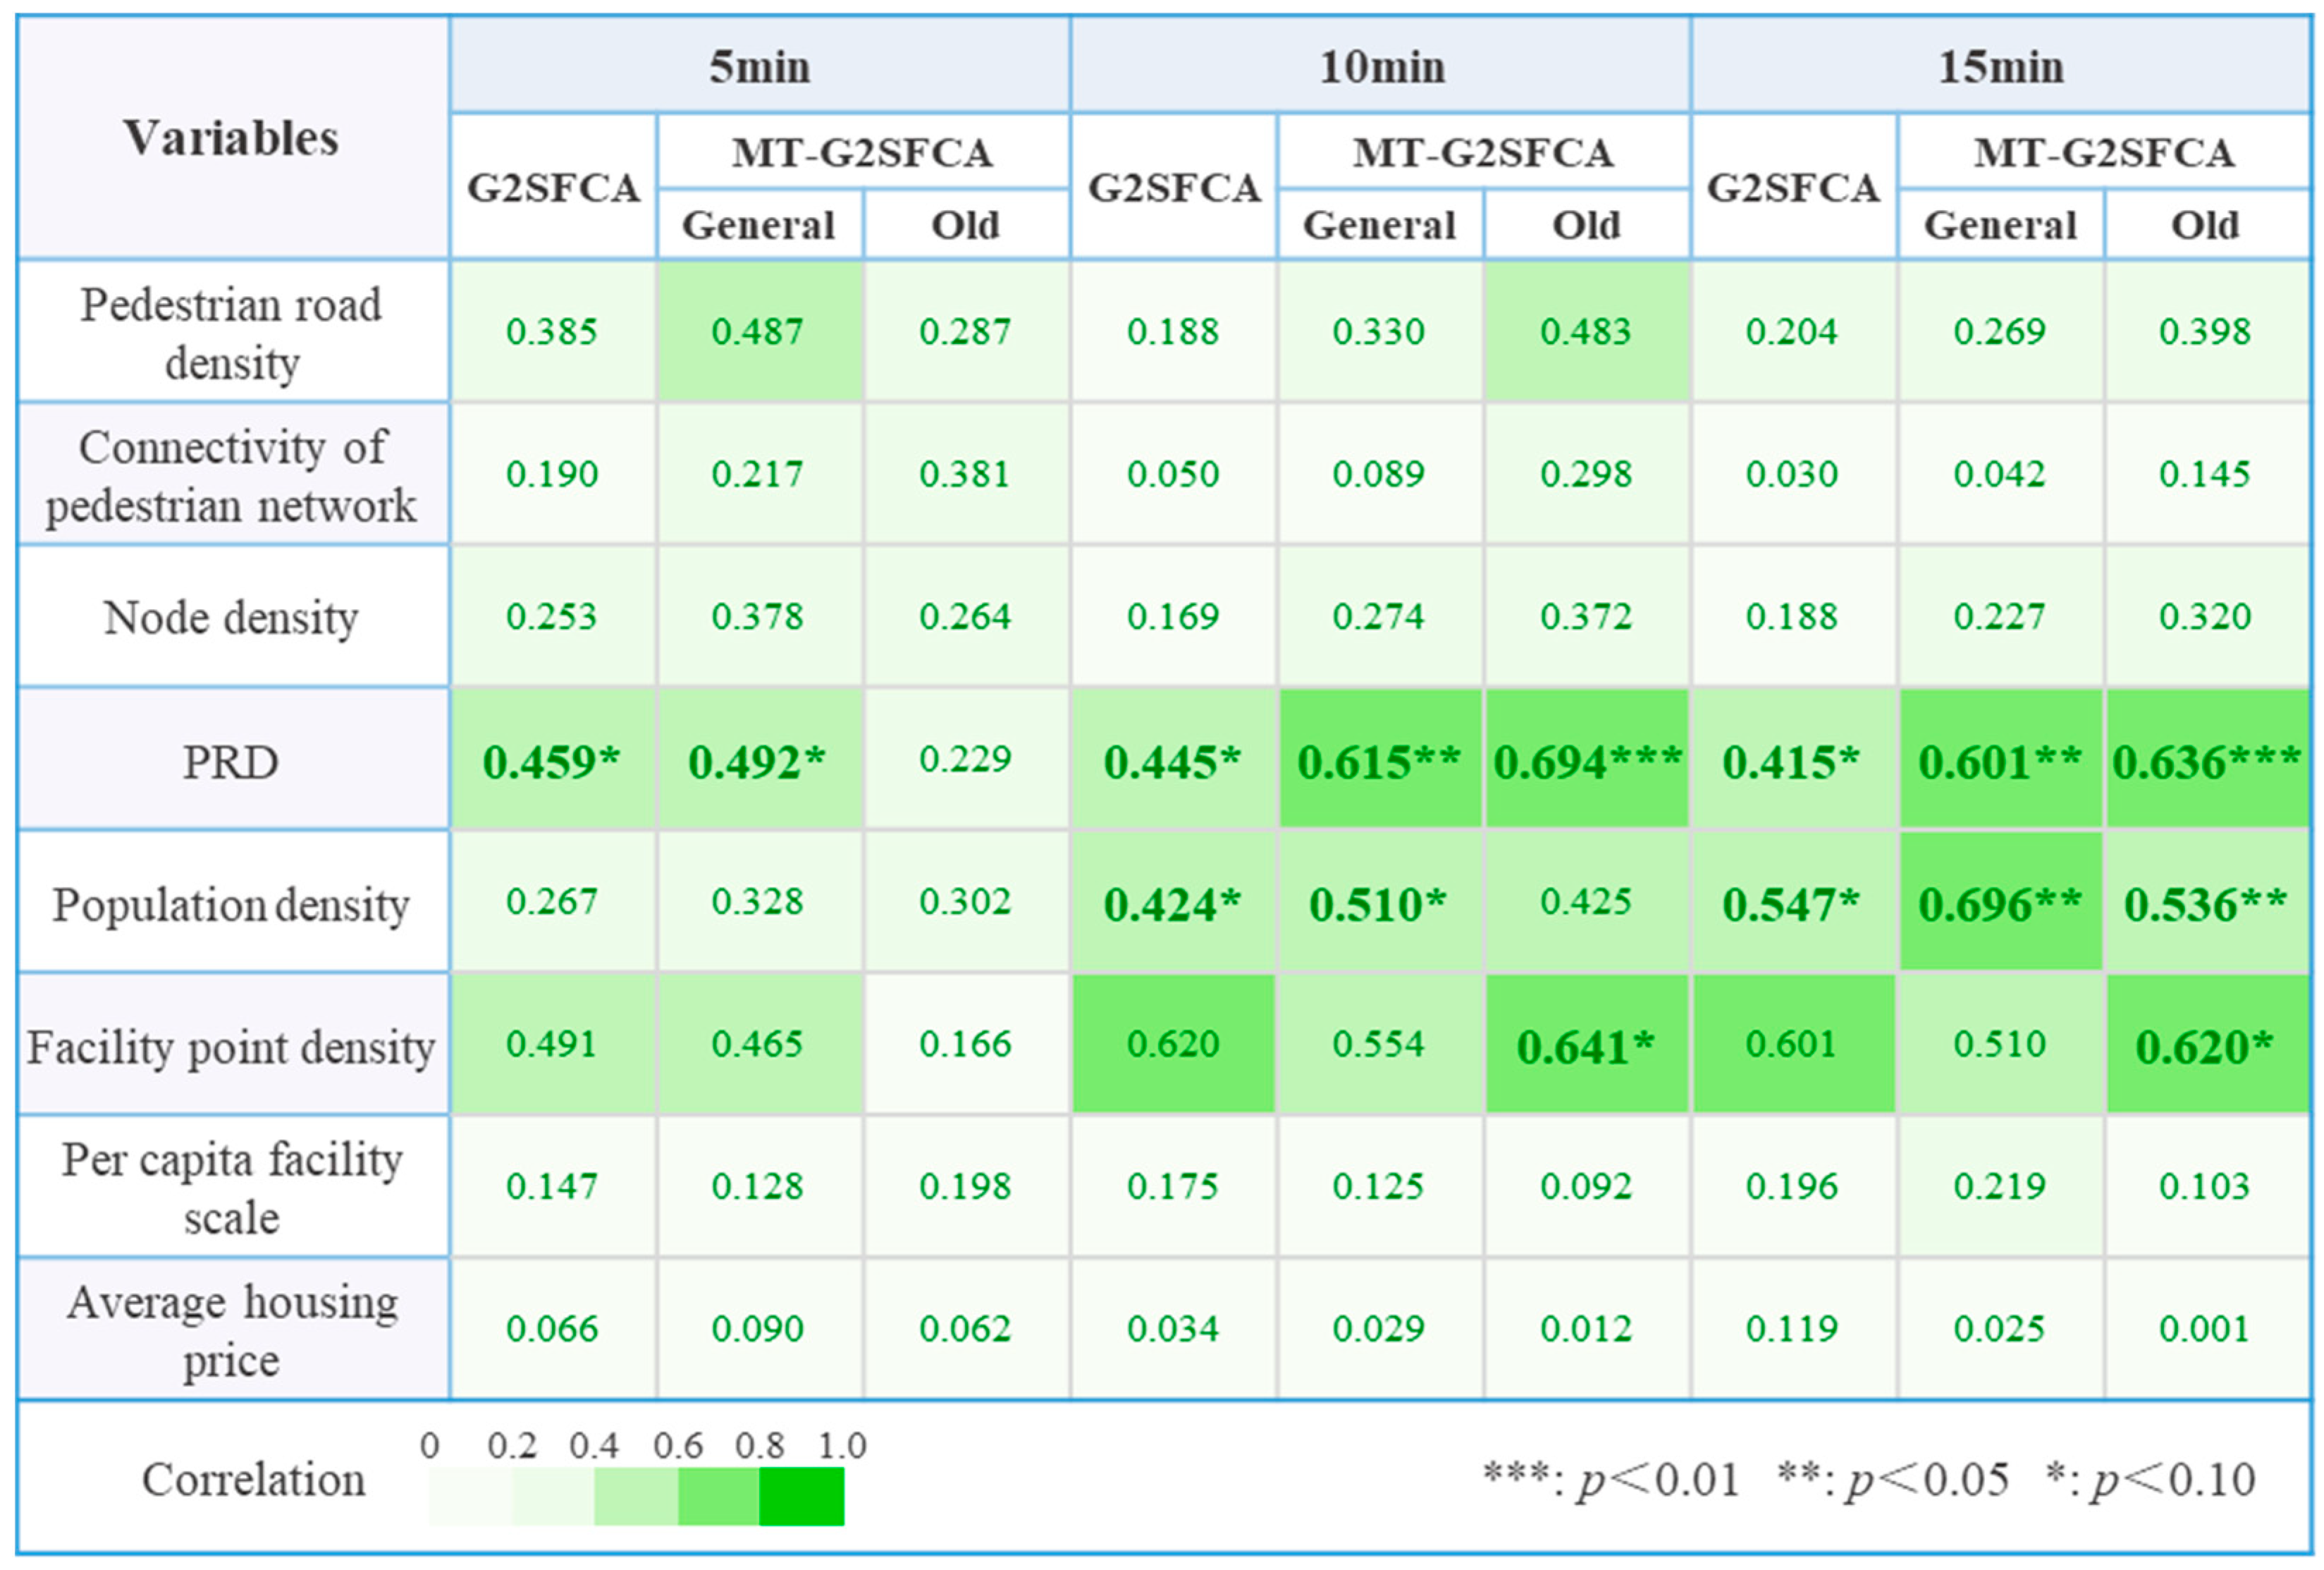
This study explores the explanatory power of factors for the comprehensive accessibility of HSFs, calculated under G2SFCA and MT-G2SFCA, across various pedestrian time thresholds. As shown in Figure 8, the analysis results obtained from both methods exhibit the following similarities: (1) PRD emerges as a pivotal factor in explaining the comprehensive accessibility of HSFs. Both methods measured that PRD passed the significance test at 5 min, 10 min, and 15 min, and had high explanatory power. In high-density urban areas, the urban pedestrian traffic network is often more complex and tortuous due to the influence of the vehicle traffic system. Therefore, the convenience of the pedestrian network has become a critical factor influencing residents’ access to facilities resources. (2) The population density passed the significance test at 10 min and 15 min. The population density corresponds to the primary service markets and their scale, making it a crucial factor influencing the allocation of facility resources from the demand side. This aligns with the earlier analysis results regarding the comprehensive accessibility and spatial equity of HSFs.

Figure 8.
Calculation results of the geo-detector.
Comparing the analysis results of different age groups reveals slight differences in the influencing factors and explanatory power coefficients obtained under the same pedestrian time conditions. When the pedestrian time is set at 5 min, none of the factors for the elderly group pass the significance test. This could be due to the limitation of the short walking distance for the elderly, indicating that the primary determinant affecting the comprehensive accessibility of HSFs is the walking distance rather than other urban environmental factors. When the walking time is 10 min and 15 min, the predominant factors influencing the comprehensive accessibility shift to urban environmental characteristics. The computed results exhibit better consistency in this regard.
In addition, facility point density emerges as a critical factor influencing the comprehensive accessibility for the elderly. As shown in Figure 8, facility point density demonstrates consistently high explanatory power across other scenarios, indicating its significant influence on comprehensive accessibility. For the elderly, their slower walking speed results in a smaller walking range within the given time limit. Unlike younger adults, they cannot compensate for the disparities in the comprehensive accessibility caused by insufficient facility point density through a larger walking range. Therefore, in areas with a dense elderly population, increasing facility point density is a key approach to enhancing the comprehensive accessibility of HSFs.
4. Discussion
4.1. Neglecting the Service Benefits of Facility Type Diversity Leads to an Underestimation of the Comprehensive Accessibility
Previous studies on facility accessibility and equity have primarily targeted single types of HSFs such as hospitals, parks, and nursing homes, with limited comprehensive assessments of multi-type facilities [74]. Previous studies often selected facility scale as a representation of its supply capacity, while neglecting the importance of the diversity of facility types for residents’ health. The diversifying health service demands of the residents have rendered the accessibility evaluation research of a single type of HSFs inadequate in objectively and comprehensively reflecting the overall service capacity of the facility resources. Therefore, this study proposes an MT-G2SFCA method integrating the scale accessibility and type diversity, aiming to improve the precision of comprehensive accessibility evaluation for multi-type HSFs. To examine the differences between the traditional G2SFCA and the improved MT-G2SFCA, this study plotted scatter diagrams of the calculation results of the two methods (Figure 9). As shown in the figure, the scores of G2SFCA are generally lower than those of MT-G2SFCA. As the score increases, the underestimation trend generally exhibits a characteristic of first rising and then falling back. This shows that the underestimation of facility accessibility by G2SFCA is more pronounced in regions with medium levels. The reason for the underestimation is that it only takes the facility scale as the standard one-sidedly, while ignoring the enhanced health service benefits brought about by the diverse and abundant facility types.
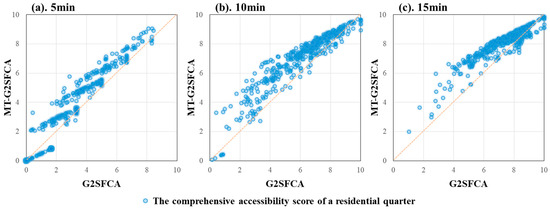
Figure 9.
The scatter plot of calculated scores of G2SFCA and MT-G2SFCA.
In terms of spatial pattern (Figure 5), the areas underestimated by the G2SFCA are mainly concentrated along the Haihe River and in large-scale urban residential areas. When the scale of facilities obtained is the same, the residents can obtain more diverse and more complete types of facilities, and the health service benefits they enjoy should also be better. These regions often boast more comprehensive facility provisions and a richer array of facility types, better catering to the increasingly diversified healthcare service demand of residents. However, the G2SFCA model fails to account for the value of this part.
In general, the G2SFCA that solely relies on facility scale as an evaluation metric overlooks the residents’ demand for facility type diversity, thereby underestimating the actual benefits of HSFs. In contrast, the MT-G2SFCA integrating the scale and type of facilities can more comprehensively and accurately reflect the comprehensive service capacity of HSFs, enhancing the precision of the computational outcomes.
4.2. Ignoring the Heterogeneity of the Elderly Leads to an Overestimation of the Comprehensive Accessibility
The aging population is swiftly emerging as one of the paramount healthcare and social demographic issues worldwide [75,76,77,78]. According to UN research data, the proportion of the global population aged 60 and above will reach 22% by 2050 [79]. With the ongoing expansion of the elderly population, it becomes imperative to amplify the emphasis on the elderly within research concerning the supply–demand alignment of urban HSFs. There has been extensive research investigating the accessibility of various public service facilities for residents, but few studies have explicitly considered the heterogeneity across different age groups [19]. To compare the differences in evaluation results between the elderly population and the general population, this study plotted a scatter diagram contrasting the scores of the two groups (Figure 10). As shown in the figure, in the context of three different walking time scenarios, the scores of the elderly population group were consistently lower than those of the general group. This suggests that ignoring the heterogeneous characteristics of elderly pedestrian behavior will result in an overestimation of comprehensive accessibility and spatial equity. As the aging population continues to deepen, this overestimation will become increasingly apparent, especially when considering the high search threshold [54], which may further lead to biases in relevant policies.
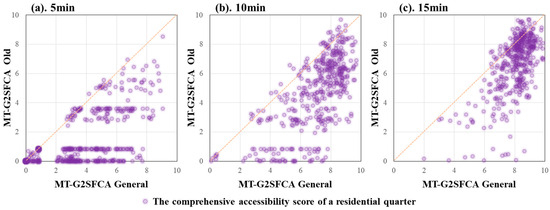
Figure 10.
The scatter plots of calculated scores of the general and old groups.
Given that age structure significantly influences variations in residents’ demand characteristics [61], this study contends that it is essential to comprehensively account for the diverse needs of residents across different age groups when allocating public service resources in the future. This includes facility type preference, facility use frequency, walking speed difference, walking tolerance time, and so on. Such considerations aim to enhance the efficiency and accuracy of urban public service resource allocation.
4.3. PRD and Facility Point Density Are the Key Factors Affecting the Comprehensive Accessibility of HSFs
Different from the previous research that considered factors such as walking road density, walking road network connectivity, and walking road network node density [80,81,82] as important factors affecting the comprehensive accessibility of HSFs, this study found that these factors are not significantly correlated with the comprehensive accessibility. Instead, PRD has a more significant correlation and higher explanatory power. This may be due to the fact that this study chose the distance traveled by residents along the actual pedestrian network as a substitute for the traditional Euclidean distance as the search radius for the search area. Indeed, these indicators can well reflect the convenience of the pedestrian network, but they cannot accurately reflect the differences in travel convenience within the unit due to the uneven distribution of the road network, especially for high-density urban areas with complex traffic network and high fragmentation of the pedestrian network represented by the Hedong District. This was confirmed in the spatial difference analysis of the comprehensive accessibility of HSFs in the Hedong District. Therefore, compared with traditional methods, using the actual travel distance of residents to calculate the convenience of travel is often more accurate when targeting high-density environmental objects at the medium–micro scale, such as the PRD, as it is closer to the actual situation of residents.
In addition, this study found that facility point density is also a key factor affecting the comprehensive accessibility of facilities, which is consistent with existing research views. Facility point density represents the service level of the supply side. The higher the density, the larger the scale of the facility, and the more diverse the types of facilities, which is usually beneficial for residents to obtain the necessary facility services in a one-stop manner. At the same time, a more diverse range of facility types is beneficial for creating a more attractive service atmosphere, which in turn increases the residents’ willingness to visit and the actual service capacity of the facilities [83,84]. Therefore, a comprehensive health service effectiveness evaluation that combines facility scale and facility type is accurate and necessary. Also, this study measured that the density of facility sites was strongly correlated with the comprehensive accessibility of the elderly population, but not with the general group. This may be due to the vulnerability of the elderly in terms of their own walking ability. Older people are less able to overcome the difficulties in accessing health service resources due to the dispersed distribution of facilities by virtue of larger walking range than the general population. A higher density of facilities represents a more concentrated distribution of HSFs, and more health services can be accessed in the same amount of walking time for older people who are less able to walk. This suggests that increasing the facility point density of HSFs is particularly important for the older population.
4.4. Policy and Planning Implications
Based on the aforementioned discussion, we have formulated several viable policy and planning implications aimed at ameliorating the current deficiencies in accessibility and equity of multi-type health service facilities. The specific recommendations are as follows:
- Refinement of planning standards tailored to different demographic groups.
It is imperative to consider the variations in walking accessibility among different age groups and formulate planning standards that are more flexible accordingly. For instance, in regions with a higher level of population aging, it may be appropriate to adjust the supply scale standards of HSFs upwards and augment requirements regarding the spatial aggregation multiple types of facilities, so as to weaken the spatial inequity caused by the difference in walking capacity. Furthermore, establishing more convenient public transportation networks in residential areas with a concentrated elderly population would enable the elderly to access health services within a broader range of travel.
- 2.
- Dynamic monitoring of the population situation.
The distribution of urban population is constantly changing, and population aging is also a continuous process of change. Therefore, it is imperative for planning and management authorities to regularly and dynamically monitor the distribution of populations and the level of aging within their jurisdictions and conduct predictive studies on population aging. Moreover, conducting assessments of accessibility and equity in health service facilities based on population projections for the next 5 or 10 years would identify areas requiring targeted improvements in the future. This proactive approach will assist government authorities in preparing for future planning and construction of health service facilities, holding significant policy implications.
- 3.
- Optimizing the urban slow-moving network.
Low connectivity and uneven distribution of slow-moving networks can lead to low levels of accessibility and spatial inequality of HSFs. Particularly given the weaker walking ability of older people, increasing the density and connectivity of urban slow-moving networks can broaden the pedestrian travel radius for residents and increase the number of facilities they can access within a given time. In addition, efforts should also be made to the accessibility and comfort design of walking paths in order to increase the willingness of older people to travel, so that they can access more facility resources more comfortably, conveniently, and safely.
- 4.
- Encouragement of mixed land use.
In urban centers, where available land resources are limited, it is difficult to increase the number and type of facilities. Mixed land use and sharing of facilities may indeed stand as one of the vital pathways to address the problem of “little space and big gaps” in urban centers. The government can encourage and guide the intensive construction and composite use of multiple types of facilities, so as to achieve “one-stop” fulfilment of the multiple health service needs of the elderly. Particularly for areas where the walking network is highly fragmented and difficult to repair, this approach can offer residents a greater variety of health services within the same travel radius and improve the supply–demand level of HSFs from the supply side.
5. Conclusions
In response to the trend of continuous growth in the number of urban populations and the increasing diversity of residents’ health needs, this study proposes the MT-G2SFCA method integrating the scale accessibility and type diversity and addresses the differences among different age groups to assess the comprehensive accessibility of HSFs for the elderly and the general, respectively, and further analyze the spatial equity and key influencing factors. The study found the following: (1) In contrast to MT-G2SFCA, the traditional G2SFCA approach ignores the health benefits of facility type diversity and can lead to an underestimation of facility accessibility and spatial equity; (2) neglecting the differences in walking ability of the elderly can result in an overestimation of the accessibility and equity; and (3) the Pedestrian Route Directness is the key factor affecting the accessibility and equity in high-density urban areas, and especially that the facility density is the key factor for the elderly. In general, our study provides a more accurate and comprehensive method for evaluating the comprehensive accessibility and spatial equity of multi-type HSFs and explores the spatial disparities in the accessibility of HSFs across different age subgroups, along with their underlying reasons. This study has the potential for further expansion to encompass additional special demographics, including children and individuals with disabilities, in order to achieve a more refined and humanized configuration of health service facilities.
In addition, there are still some shortcomings in this study as follows: (1) Insufficient consideration is given to the differences in the modes of slow travel for residents. This study assumes the uniform utilization of walking as a slow travel mode among residents, overlooking the diversity of their slow travel modalities. With the popularity of shared bicycles among the elderly, the slow travel mode of the residents is not limited to walking [42]. The corresponding slow travel distance will also change. The scenarios for accessibility assessment of facilities for different modes of slow-moving journeys can be carried out in the future. (2) Evaluation dimensions of facility accessibility can include matching the quality of the facility in addition to the scale and type. Some scholars have proposed perceived accessibility as distinct from traditional geographic accessibility, taking into account factors such as residents’ sense of security and satisfaction with the environmental quality of the facility [85]. This study does not integrate factors such as facility quality and environmental quality and other factors affecting residents’ willingness to choose HSFs into the model calculation. In the future, the 2SFCA can be further optimized by combining with the gravity model to achieve a comprehensive evaluation of the accessibility in terms of the size, type and quality of the facilities in a more multi-dimensional way. (3) The contribution ratio of facility scale and facility type to the comprehensive accessibility of facilities is worth further discussion. Future research can further determine the contribution weights of the two and improve the evaluation methodology through expert interviews and questionnaires.
Author Contributions
Conceptualization, J.Z. and Y.Z.; Methodology, J.Z., Y.Z. and J.L.; Software, Y.Z.; Validation, J.Z. and Y.Z.; Formal Analysis, Y.Z.; Investigation, J.Z., Y.Z. and C.L.; Resources, J.Z.; Data Curation, Y.Z. and C.L.; Writing—Original Draft Preparation, J.Z. and Y.Z.; Writing—Review and Editing, J.Z., Y.Z. and C.L.; Visualization, Y.Z.; Supervision, J.Z.; Project Administration, J.Z.; Funding Acquisition, J.Z. All authors have read and agreed to the published version of the manuscript.
Funding
This research was funded by the Tianjin Philosophy and Social Science Planning Project (grant number TJGL22-010).
Data Availability Statement
The data presented in this study are available on request from the corresponding author. The data are not publicly available due to confidentiality.
Acknowledgments
The authors gratefully acknowledge the support of the funders.
Conflicts of Interest
The authors declare that they have no financial and personal relationships with other people or organizations that can inappropriately influence their work, and there is no professional or other personal interest of any nature or kind in any product, service, and/or company that could be construed as influencing the position presented in, or the review of, the manuscript entitled.
References
- Florian, L.; Peter, K.; Leila, H.; Fabian, S.; Heike, T. City living and urban upbringing affect neural social stress processing in humans. Nature 2011, 474, 498–501. [Google Scholar] [CrossRef] [PubMed]
- Richard, H. Urban health and well-being. Nature 2016, 531, S49. [Google Scholar] [CrossRef] [PubMed]
- Rydin, Y.; Bleahu, A.; Davies, M.; Dávila, J.D.; Friel, S. Shaping cities for health: Complexity and the planning of urban environments in the 21st century. Lancet 2012, 379, 2079–2108. [Google Scholar] [CrossRef] [PubMed]
- Yang, J.; Siri, G.J.; Remais, V.J.; Cheng, Q.; Zhang, H. The Tsinghua-Lancet Commission on Healthy Cities in China: Unlocking the power of cities for a healthy China. Lancet 2018, 391, 2140–2184. [Google Scholar] [CrossRef] [PubMed]
- Anu, R.; Armistead, G.R.; Patricia, J.C.; Karnamadakala, R.S.; Emani, K. Meta-principles for developing smart, sustainable, and healthy cities. Science 2016, 352, 940–943. [Google Scholar] [CrossRef] [PubMed]
- Grant, M. Integrating Health in Urban and Territorial Planning: A Sourcebook; UN-HABITAT and World Health Organization: Geneva, Switzerland, 2020. [Google Scholar]
- Wiktor, H.; Tomasz, S.; Wioletta, F.; Anna, S.; Sylwia, K. Assessment and planning of green spaces in urban parks: A review. Sustain. Cities Soc. 2023, 88, 104280. [Google Scholar] [CrossRef]
- Ejr, A.; Rmcbc, D.; Sbha, E.; Mb, A. Exposure to natural space, sense of community belonging, and adverse mental health outcomes across an urban region. Environ. Res. 2019, 171, 365–377. [Google Scholar] [CrossRef] [PubMed]
- Guida, C.; Carpentieri, G.; Masoumi, H. Measuring spatial accessibility to urban services for older adults: An application to healthcare facilities in Milan. Eur. Transp. Res. Rev. 2022, 14, 23. [Google Scholar] [CrossRef] [PubMed]
- Mahsa, B.; Reto, S.; Ulrike, W.H.; Felix, K.; Adrienne, G.R. Greater place attachment to urban parks enhances relaxation: Examining affective and cognitive responses of locals and bi-cultural migrants to virtual park visits. Landsc. Urban Plan. 2023, 232, 104650. [Google Scholar] [CrossRef]
- Sukanya, B.; Harini, N. Perceptions of park visitors on access to urban parks and benefits of green spaces. Urban For. Urban Green. 2021, 57, 126959. [Google Scholar] [CrossRef]
- Castells-Quintana, D.; Royuela, V. Are Increasing Urbanization and Inequalities Symptoms of Growth? Appl. Spat. Anal. Policy 2015, 8, 291–308. [Google Scholar] [CrossRef]
- Wan, J.; Zhao, Y.; Zhang, K.; Ma, C.; Sun, H.; Wang, Z. Healthy Community-Life Circle Planning Combining Objective Measurement and Subjective Evaluation: Theoretical and Empirical Research. Int. J. Environ. Res. Public Health 2022, 19, 5028. [Google Scholar] [CrossRef] [PubMed]
- Li, C.; Xia, W.; Chai, Y. Delineation of an Urban Community Life Circle Based on a Machine-Learning Estimation of Spatiotemporal Behavioral Demand. Chin. Geogr. Sci. 2021, 31, 27–40. [Google Scholar] [CrossRef]
- Liu, T.; Chai, Y. Daily life circle reconstruction: A scheme for sustainable development in urban China. Habitat Int. 2015, 50, 250–260. [Google Scholar] [CrossRef]
- Gan, X.Y.; Chen, J.B. Experience and Enlightenment of “Aging in Place” Service Facilities Planning in Italy: A Case Study of Milan. Urban Plan. Int. 2023, 38, 136–144. [Google Scholar]
- Wu, X.A.; Xu, L.Q.; Zhong, L. Key Indicators of 15-min Life Circle in the Standard for Urban Residential Area Planning and Design. Planners 2020, 36, 33–40. [Google Scholar]
- Wu, X.A.; Xu, L.Q. Research on the Form of Community Life Circle Planning: Discussion on the Scope of Age-Friendly Life Circle and Walking Friendly Life Circle. J. Hum. Settl. W. China 2021, 36, 74–82. [Google Scholar] [CrossRef]
- Louis, A.M.; Ulrike, J. Global interest in walking accessibility: A scoping review. Transplant. Rev. 2023, 43, 1021–1054. [Google Scholar] [CrossRef]
- Long, C.; Min, Y.; Jonas, D.V.; Frank, W. Examining geographical accessibility to multi-tier hospital care services for the elderly: A focus on spatial equity. J. Transp. Health 2020, 19, 100926. [Google Scholar] [CrossRef]
- Song, L.; Kong, X.S.; Cheng, P. Supply-demand matching assessment of the public service facilities in 15-minute community life circle based on residents’ behaviors. Cities 2024, 144, 104637. [Google Scholar] [CrossRef]
- Walter, G.H. How accessibility shapes land-use. J. Am. Inst. Plan. 1959, 25, 73–76. [Google Scholar] [CrossRef]
- Olle, J.; Henrikki, T.; Maria, S.; Rein, A. Dynamic cities: Location-based accessibility modelling as a function of time. Appl. Geogr. 2018, 95, 101–110. [Google Scholar] [CrossRef]
- Guo, S.H.; Song, C.; Pei, T. Accessibility to urban parks for elderly residents: Perspectives from mobile phone data. Landsc. Urban Plan. 2019, 191, 103642. [Google Scholar] [CrossRef]
- Wu, J.Y.; Chen, H.T.; Wang, H.Y. Will the opening community policy improve the equity of green accessibility and in what ways? Response based on a 2-step floating catchment area method and genetic algorithm. J. Clean. Prod. 2020, 263, 121454. [Google Scholar] [CrossRef]
- Xiao, Y.; Wang, D.; Fang, J. Exploring the disparities in park access through mobile phone data: Evidence from Shanghai, China. Landsc. Urban Plan. 2019, 181, 80–91. [Google Scholar] [CrossRef]
- Kesarovski, T.; Hernández-Palacio, F. Time, the other dimension of urban form: Measuring the relationship between urban density and accessibility to grocery shops in the 10-minute city. Environ. Plan. B Urban Anal. City Sci. 2022, 50, 44–59. [Google Scholar] [CrossRef]
- Weng, M.; Ding, N.; Li, J.; Jin, X.; Xiao, H.; He, Z. The 15-minute walkable neighborhoods: Measurement, social inequalities and implications for building healthy communities in urban China. J. Transp. Health 2019, 13, 259–273. [Google Scholar] [CrossRef]
- Alessia, C.; Richard, D.; Alex, N.; Alex, S. The 20-minute city: An equity analysis of Liverpool City Region. Transp. Res. Part D Transp. Environ. 2022, 102, 103111. [Google Scholar] [CrossRef]
- Liu, Z.B.; Zhang, C.; Dai, T.Q. Measuring Accessibility of Multi-Type Urban Public Service Facilities with Entropy in Beijing. Econ. Geogr. 2018, 38, 77–84. [Google Scholar] [CrossRef]
- Xia, N.; Cheng, L.; Chen, S.; Wei, X.; Zong, W.; Li, M. Accessibility based on Gravity-Radiation model and Google Maps API: A case study in Australia. J. Transp. Geogr. 2018, 72, 178–190. [Google Scholar] [CrossRef]
- Hu, L.; Zhao, C.; Wang, M.; Su, S.; Weng, M.; Wang, W. Dynamic healthy food accessibility in a rapidly urbanizing metropolitan area: Socioeconomic inequality and relative contribution of local factors. Cities 2020, 105, 102819. [Google Scholar] [CrossRef]
- Hu, S.; Song, W.; Li, C.; Lu, J. A multi-mode Gaussian-based two-step floating catchment area method for measuring accessibility of urban parks. Cities 2020, 105, 102815. [Google Scholar] [CrossRef]
- Zhai, S.Y.; He, X.X.; Kong, Y.F.; Luo, J.J.; Song, G.X. Measuring the spatial accessibility of public services by optimal supply-demand allocation. Acta Geogr. Sin. 2022, 77, 1028–1038. [Google Scholar]
- Chen, X. Enhancing the Two-Step Floating Catchment Area Model for Community Food Access Mapping: Case of the Supplemental Nutrition Assistance Program. Prof. Geogr. 2019, 71, 668–680. [Google Scholar] [CrossRef]
- Xia, Z.L.; Li, H.; Chen, Y.H.; Yu, W.H. Integrating Spatial and Non-Spatial Dimensions to Measure Urban Fire Service Access. ISPRS Int. J. Geo-Inf. 2019, 8, 138. [Google Scholar] [CrossRef]
- Dai, W.; Yuan, S.; Liu, Y.; Peng, D.; Niu, S. Measuring equality in access to urban parks: A big data analysis from Chengdu. Front. Public Health 2022, 10, 1022666. [Google Scholar] [CrossRef]
- Dai, D. Black residential segregation, disparities in spatial access to health care facilities, and late-stage breast cancer diagnosis in metropolitan Detroit. Health Place 2010, 16, 1038–1052. [Google Scholar] [CrossRef] [PubMed]
- Dai, D.J. Racial/ethnic and socioeconomic disparities in urban green space accessibility: Where to intervene? Landsc. Urban Plan. 2011, 102, 234–244. [Google Scholar] [CrossRef]
- Zhang, S.; Yu, P.; Chen, Y.; Jing, Y.; Zeng, F. Accessibility of Park Green Space in Wuhan, China: Implications for Spatial Equity in the Post-COVID-19. Era. Int. J. Environ. Res. Public Health 2022, 19, 5440. [Google Scholar] [CrossRef]
- Jamtsho, S.; Corner, R.; Dewan, A. Spatio-temporal analysis of spatial accessibility to primary health care in Bhutan. ISPRS Int. J. Geo. Inf. 2015, 4, 1584–1604. [Google Scholar] [CrossRef]
- Coline, C.D.; Eric, M.D.; Elizabeth, C.D. Re-conceptualizing accessibility to parks in multi-modal cities: A variable-width floating catchment area (VFCA) method. Landsc. Urban Plan. 2015, 143, 90–99. [Google Scholar] [CrossRef]
- Matthew, R.M.; John, S.H. Measuring spatial accessibility to primary health care services: Utilising dynamic catchment sizes. Appl. Geogr. 2014, 54, 182–188. [Google Scholar] [CrossRef]
- Mitchel, L.; Gary, H.; Richard, F. Multi-modal two-step floating catchment area analysis of primary health care accessibility. Health Place 2016, 38, 70–81. [Google Scholar] [CrossRef] [PubMed]
- Fransen, K.; Neutens, T.; Maeyer, P.D.; Deruyter, G. A commuter-based two-step floating catchment area method for measuring spatial accessibility of daycare centers. Health Place 2015, 32, 65–73. [Google Scholar] [CrossRef] [PubMed]
- Luo, J. Integrating the Huff Model and floating catchment area methods to analyze spatial access to healthcare services. Trans. GIS 2014, 18, 436–448. [Google Scholar] [CrossRef]
- Subal, J.; Paal, P.; Krisp, J.M. Quantifying spatial accessibility of general practitioners by applying a modified huff three-step floating catchment area (MH3SFCA) method. Int. J. Health Geogr. 2021, 20, 9. [Google Scholar] [CrossRef] [PubMed]
- Zhang, R.; Peng, S.; Sun, F.; Deng, L.; Che, Y. Assessing the social equity of urban parks: An improved index integrating multiple quality dimensions and service accessibility. Cities 2022, 129, 103839. [Google Scholar] [CrossRef]
- Elldér, E.; Haugen, K.; Vilhelmson, B. When local access matters: A detailed analysis of place, neighbourhood amenities and travel choice. Urban Stud. 2022, 59, 120–139. [Google Scholar] [CrossRef]
- Romain, G.; Zahra, K.; Vladimir, C.; Ulla, M.; Brian, D.; Georgia, D. Distinction, quantification and mapping of potential and realized supply-demand of flow-dependent ecosystem services. Sci. Total Environ. 2017, 593–594, 599–609. [Google Scholar] [CrossRef]
- Uta, S.; Sebastian, C.; Lukas, E.V.; Hieronymus, J.; Alice, L.; Thomas, M. Integrating supply, flow and demand to enhance the understanding of interactions among multiple ecosystem services. Sci. Total Environ. 2019, 651, 928–941. [Google Scholar] [CrossRef]
- Cai, W.B.; Jiang, W.; Du, H.Y.; Chen, R.S.; Cai, Y.L. Assessing Ecosystem Services Supply-Demand (Mis) Matches for Differential City Management in the Yangtze River Delta Urban Agglomeration. Int. J. Environ. Res. Public Health 2021, 18, 8130. [Google Scholar] [CrossRef] [PubMed]
- Khavarian-Garmsir, A.R.; Sharifi, A.; Sadeghi, A. The 15-minute city: Urban planning and design efforts toward creating sustainable neighborhoods. Cities 2023, 132, 104101. [Google Scholar] [CrossRef]
- Li, C.Y.; Wang, J.R. Using an age-grouped Gaussian-based two-step floating catchment area method (AG2SFCA) to measure walking accessibility to urban parks: With an explicit focus on elderly. J. Transp. Geogr. 2024, 114, 103772. [Google Scholar] [CrossRef]
- Whitehead, J.; Pearson, A.L.; Lawrenson, R.; Atatoa-Carr, P. How can the spatial equity of health services be defined and measured? A systematic review of spatial equity definitions and methods. J. Health Serv. Res. Policy 2019, 24, 270–278. [Google Scholar] [CrossRef]
- Ma, Y.L.; Xiong, H.; Jiang, X.B. Analysis of Influence of Pedestrian Character on Walking Behavior. Traffic Transp. 2009, 1, 98–101. [Google Scholar]
- Cai, T.P.; Shao, X.H.; Long, J.W. Meta-analysis of gait speed test in healthy elderly. J. Nanchang Univ. (Med. Sci.) 2020, 60, 44–52. [Google Scholar] [CrossRef]
- Zhang, F.; Li, D.Z.; Sherry, A.; Zhang, J.K. Assessing spatial disparities of accessibility to community-based service resources for Chinese older adults based on travel behavior: A city-wide study of Nanjing, China. Habitat Int. 2019, 88, 101984. [Google Scholar] [CrossRef]
- Willberg, E.; Fink, C.; Toivonen, T. The 15-minute city for all?—Measuring individual and temporal variations in walking accessibility. J. Transp. Geogr. 2023, 106, 103521. [Google Scholar] [CrossRef]
- Li, Y.; Ran, Q.C.; Yao, S.; Ding, L. Evaluation and Optimization of the Layout of Community Public Service Facilities for the Elderly: A Case Study of Hangzhou. Land 2023, 12, 629. [Google Scholar] [CrossRef]
- Li, M. The planning strategies of a 15-minute community life circle based on behaviors of residents. Urban Plan. Forum 2017, 1, 111–118. [Google Scholar] [CrossRef]
- Li, M.; Hu, G.Y.; Huang, J.Z. Research on the demand characteristics of community service facilities for the elderly in Shanghai: Based on the perspective of walking abilities difference. Shanghai Urban Plan. Rev. 2017, 1, 25–31. [Google Scholar]
- Wang, J.; Jiao, Y.; Ren, Y.P.; Xue, Y.; Ji, Y.P.; Xu, B.D. Comparative study on two computing methods for estimating Shannon-Wiener diversity index. J. Fish. China 2015, 39, 1257–1263. [Google Scholar]
- Chen, Y.L.; Yu, P.H.; Li, Z.G.; Wang, J.; Chen, Y.Y. Environmental Equity Measurement of Urban Green Space from the Perspective of SDG11: A Case Study of the Central Urban Area of Wuhan. Geogr. Geo-Inf. Sci. 2021, 37, 8189. [Google Scholar] [CrossRef]
- Lorenz, M. Methods of measuring the concentration of wealth. Am. Stat. Assoc. 1905, 9, 209–219. [Google Scholar] [CrossRef]
- Wang, J.F.; Xu, C.D. Geodetector: Principle and prospective. Acta Geogr. Sin. 2017, 72, 116–134. [Google Scholar]
- Wang, J.F.; Li, X.H.; Christakos, G.; Liao, Y.L.; Zhang, T.; Gu, X. Geographical detectors-based health risk assessment and its application in the neural tube defects study of the Heshun region, China. Int. J. Geogr. Inf. Sci. 2010, 24, 107–127. [Google Scholar] [CrossRef]
- Zhao, J.; Su, W.; Luo, J.C.; Zuo, J. Evaluation and Optimization of Walkability of Children’s School Travel Road for Accessibility and Safety Improvement. Int. J. Environ. Res. Public Health 2021, 19, 71. [Google Scholar] [CrossRef] [PubMed]
- Li, D.Y.; Zang, H.Y.; Yu, D.M.; He, Q.L.; Huang, X.R. Study on the Influence Mechanism and Space Distribution Characteristics of Rail Transit Station Area Accessibility Based on MGWR. Int. J. Environ. Res. Public Health 2023, 20, 1535. [Google Scholar] [CrossRef] [PubMed]
- Fang, B.; Shi, F. Research Progress and Prospects of Street Connectivity Measurements: A Study on How to Popularize Block System in China from the Prospective of Regulations. Urban Plan. Int. 2019, 34, 72–78. [Google Scholar] [CrossRef]
- Jiang, J.C.; Chen, J.P.; Yu, J. Research on Live Connectivity of Road Network. Geomat. Spat. Inf. Technol. 2010, 33, 81–83+86. [Google Scholar] [CrossRef]
- Khaled, A.; Asim, K.; Azhar, D.; Rahma, A. Revisiting transit-oriented development: Alleys as critical walking infrastructure. Transp. Policy 2021, 100, 187–202. [Google Scholar] [CrossRef]
- Shen, J.; Chun, T.; Niu, Q.; Wei, W.; Peng, Y. Evaluation and Difference Analysis of Built Environment Walking Demands in Urban Residential Areas: A Case Study of Five Types of Residential Areas in Wuhan. Planners 2020, 36, 38–44. [Google Scholar]
- Xing, L.J.; Chen, Q.; Liu, Y.L.; He, H.G. Evaluating the accessibility and equity of urban health resources based on multi-source big data in high-density city. Sustain. Cities Soc. 2024, 100, 105049. [Google Scholar] [CrossRef]
- Calimport, S.R.G.; Bentley, B.L.; Stewart, C.E.; Pawelec, G.; Scuteri, A.; Vinciguerra, M. To help aging populations, classify organismal senescence. Science 2019, 366, 576–578. [Google Scholar] [CrossRef] [PubMed]
- John, R.B.; Alana, O.; Islene, A.D.C.; Ritu, S.; Anne, M.P.; Jean-Pierre, M. The World report on ageing and health: A policy framework for healthy ageing. Lancet 2016, 387, 2145–2154. [Google Scholar] [CrossRef]
- Dixon, A. The United Nations Decade of Healthy Ageing requires concerted global action. Nat. Aging 2021, 1, 2. [Google Scholar] [CrossRef] [PubMed]
- Freedman, V.A.; Kasper, J.D. Cohort Profile: The National Health and Aging Trends Study (NHATS). Int. J. Epidemiol. 2019, 48, 1044–1045. [Google Scholar] [CrossRef]
- Aging in unity. Nat. Aging 2021, 1, 1. [CrossRef] [PubMed]
- Zhang, Y.; Wang, R.; WU, Y.; Chu, G.L.; Wu, X.M. The Influence of Built-Environment Factors on Connectivity of Road Networks in Residential Areas: A Study Based on 204 Samples in Nanjing, China. Buildings 2023, 13, 301. [Google Scholar] [CrossRef]
- Yin, H.Y.; Li, J.Y.; Shi, T.; Zhao, D.; Yang, J.H.; Li, J.X. Objective influencing factors of urban park accessibility. Chin. J. Appl. Ecol. 2016, 27, 3387–3393. [Google Scholar] [CrossRef]
- Xing, L.J.; Du, S.N.; Tong, Z.M.; Zhang, L. Spatial and temporal accessibility of urban green space and its influencing factors in Wuhan from the perspective of environmental justice. Acta Ecol. Sin. 2023, 43, 5370–5382. [Google Scholar] [CrossRef]
- Petter, N.; Arvid, S.; Fitwi, W.; Harpa, S. Residential location, commuting and non-work travel in two urban areas of different size and with different center structures. Prog. Plan. 2017, 128, 1–36. [Google Scholar] [CrossRef]
- Erik, E. What Kind of Compact Development Makes People Drive Less? The “Ds of the Built Environment” versus Neighborhood Amenities. J. Plan. Educ. Res. 2018, 40, 432–446. [Google Scholar] [CrossRef]
- Wang, D.; Brown, G.; Liu, Y. The physical and non-physical factors that influence perceived access to urban parks. Landsc. Urban Plan. 2015, 133, 53–66. [Google Scholar] [CrossRef]


Disclaimer/Publisher’s Note: The statements, opinions and data contained in all publications are solely those of the individual author(s) and contributor(s) and not of MDPI and/or the editor(s). MDPI and/or the editor(s) disclaim responsibility for any injury to people or property resulting from any ideas, methods, instructions or products referred to in the content. |
© 2024 by the authors. Licensee MDPI, Basel, Switzerland. This article is an open access article distributed under the terms and conditions of the Creative Commons Attribution (CC BY) license (https://creativecommons.org/licenses/by/4.0/).