Abstract
Clarifying the intrinsic nature and formation mechanisms of the territorial spatial development non-equilibrium, optimizing the allocation of territorial resources, promoting regional balanced development, and alleviating regional development disparities have become common endeavors of all countries seeking to enhance development quality. This study, based on the land use and socio-economic data of 31 provinces and cities in China from 2006 to 2020, utilized the kernel density estimation method and ArcGIS spatial analysis to explore the spatiotemporal evolution characteristics of China’s territorial spatial development non-equilibrium. The research findings are as follows: (1) From 2006 to 2020, both the land development intensity and land supply capacity showed an increasing trend, with increases of 21.4% and 8.03%, respectively. However, their spatiotemporal evolutions significantly differed. (2) The state of the territorial spatial development non-equilibrium in China significantly improved, with a rising trend in the territorial spatial equilibrium degree. Regional disparities in the territorial spatial equilibrium degree decreased. The number of provinces and cities in a state of underdevelopment decreased from 23 to 8, while the number in an equilibrium state increased from 7 to 21. The central and western regions showed more significant improvements in the territorial spatial equilibrium degree and a greater reduction in regional disparity when compared to the eastern and northeastern regions. (3) China exhibited distinct regional disparities in the territorial spatial equilibrium degree. The overdeveloped areas were Beijing and Shanghai. The underdeveloped regions were primarily concentrated in western areas, including Sichuan, Yunnan, and Xinjiang. The high-level equilibrium regions were predominantly located in the southeastern coastal provinces and the central plains region, while the low-level equilibrium regions included Inner Mongolia, Ningxia, Qinghai, and the three northeastern provinces. (4) From the perspective of the number of agglomeration types, the order is HH (high–high) > LH (low–high) > LL (low–low) > HL (high–low), and China’s TSED exhibits a spatial proximity peer effect. The innovation of this study consists of the following aspects: (1) The clarification of the fact that the essence of equilibrium does not require an exact 1:1 match, as with “two horses”; rather, it entails the maintenance of a slight surplus of land supply capacity over land development intensity. This approach allows the possibility of future sustainable development by leaving room for expansion. (2) The differentiation between high-intensity conjugation (in terms of both quantity and quality) and low-intensity conjugation (quantity only) from a conjugate perspective. This categorization aids in a more comprehensive and in-depth understanding of the territorial spatial development non-equilibrium and its spatiotemporal patterns. It provides crucial information for the formulation of sustainable national territorial development plans and the promotion of a regional development equilibrium.
1. Introduction
Since the Industrial Revolution in the 18th century, the rapid advancement of industrialization and urbanization has not only contributed to the elevation of the global development level, but has also brought about negative effects, such as the widening of regional development disparities and the loss of spatial order [1]. This has led to the increasingly prominent issue of the global economic development non-equilibrium [2]. The non-equilibrium in development serves as a major factor, causing uncertainty and hindering regional economic growth [3], and thereby posing a significant challenge. The introduction of the United Nations’ 2030 Sustainable Development Goals has triggered a reconsideration and transformation of the strategies for land use and development [4]. Consequently, improving the quality of development through promoting regional balanced growth and alleviating regional development disparities have become the common endeavors of all countries.
The World Bank has pointed out that a combination of macroeconomic policy adjustments and an optimized infrastructure can help to narrow these disparities. The Organization for Economic Cooperation and Development (OECD), in several reports on “How Regions Grow,” focuses on the issue of balanced regional development [5]. The European Union’s “EU 2020 Strategy”, the United States’ “2050 Regional Development Strategy” [6], South Korea’s Balanced Economic Development policy, Turkey’s Integrated Urban Development Strategy (2010–2020), and Japan’s 2050 Spatial Development Strategy [7] are all aimed at addressing regional development imbalances through regional policies.
China, with its vast territory, exhibits significant differences in regional natural resource endowments. Under the national gradient development strategy, the policies aimed at prioritizing development in the eastern regions and the “first to prosper leading to later prosperity” approach, along with their agglomeration effects, have highlighted regional differentiation in the country. The Chinese government has expressed its high level of concern and has given instructions on national strategies such as “narrowing the gap”, “regional coordinated development”, and “optimizing the development pattern”. Therefore, in light of this, what is the current degree of imbalance in China’s territorial spatial development? Are there regional disparities? What are the mechanisms behind them? These questions are worth exploring. This study utilizes land as the spatial carrier to explore the mechanisms underlying the formation of the territorial spatial development non-equilibrium and development patterns, further clarifying the mechanisms behind these imbalances. This is of significant importance for exploring location-specific pathways to achieve balanced territorial spatial development.
The current research that is closely related to the research of this study covers three areas, which can be summarized as follows: ① The connotation and measurement of the development non-equilibrium. The equilibrium is divided into the quantitative equilibrium and the qualitative equilibrium. For the quantitative equilibrium, methods such as the coefficient of variation [8], decomposition of the Gini coefficient [9,10], and Theil index [11] are commonly used for measurement. The qualitative equilibrium is judged based on the correspondence between the spatial development intensity and the development supply capacity [12], the coordination between the regional development intensity and the resource and environmental carrying capacity [13], and the matching relationship between the spatial demand intensity and the spatial supply capacity [14]. ② The spatiotemporal differentiation of the development non-equilibrium. The research is gradually refined from the macroscale and mesoscale, i.e., the nation [11,15], regions [13], and provinces [12,16], to the microscale, i.e., cities [17] and counties [18], and is then expanded from the cross-section data of a single year [12,13] to the panel data of multiple years [11,19]. ③ The influencing factors of the development non-equilibrium. Most scholars have conducted research from the perspective of a natural background and economic and social development.
In summary, the existing studies lack systematic research on the mechanisms of the territorial spatial development non-equilibrium. The territorial spatial development non-equilibrium results from the combined effects of various factors, including natural, economic, social, and policy factors. Examining only one aspect, such as the economic and social conditions or regulatory policies, is not comprehensive. Additionally, in terms of measuring equilibrium states, the existing literature has focused solely on the quantitative match between the development intensity and the supply capacity, neglecting the quality aspect. Therefore, this study comprehensively considers natural, economic, social, and policy factors. Drawing upon a conjugate perspective and giving due consideration to both the “quantity” and “quality” of the equilibrium states, the study elucidates the intrinsic nature and mechanisms of the territorial spatial development non-equilibrium at the theoretical level. At the empirical level, it constructs measurement models and employs kernel density estimation and ArcGIS spatial analysis methods to investigate the spatiotemporal evolution characteristics of the territorial spatial development non-equilibrium. The study divides the types of equilibrium degree and puts forward the differentiated development path, which provides theoretical support and a practical demonstration of the coordination of the man–land relationship and the optimization of the spatial development pattern of the land.
2. Materials and Methods
2.1. The Delineation of the Territorial Spatial Development Non-Equilibrium from Conjugate Perspective
The “conjugate” perspective emphasizes the fact that two elements in a system interact with each other and jointly affect the stable and coordinated development of the system, and it emphasizes the importance of consistent and steady progress. Scholars have analyzed the interactive evolution process and collaborative development status of society and ecosystems from a conjugate perspective [20,21]. As a crucial spatial carrier for human activities, land resources are the fundamental guarantee of regional economic and social development, with the land development intensity being constrained by the supply capacity of the land resources [22]. There exists a natural intrinsic connection between the land development intensity and the land supply capacity, which mutually influence each other. Both can be considered as the “two horses” driving the territorial spatial development equilibrium. If these “two horses” move forward in harmony, a state of development equilibrium is achieved. However, if one of them progresses too quickly or too slowly, the result may be a non-equilibrium state with poor system stability and efficiency.
Therefore, according to the conjugate perspective, the “land development intensity” and “land supply capacity” ratio can be employed to construct equilibrium indicators [12,14]. Based on its degree, equilibrium can be divided into non-equilibrium states (overdevelopment and underdevelopment) and equilibrium states.
Overdevelopment means that the land supply capacity cannot meet the land development intensity, and underdevelopment means that the land supply capacity far exceeds the land development intensity, resulting in redundancy. Based on the idea of sustainable development, the equilibrium state of territorial space development is not a full 1:1 match between the land development intensity and land supply capacity, but the land supply capacity should be slightly higher than the land development intensity in order to retain a certain space for future development.
Additionally, there are high-intensity conjugate states (in terms of both quantity and quality) and low-intensity conjugate states (quantity only). The former refers to the dynamic balance between the land demand intensity and land supply capacity in terms of quantity, while maximizing the utility of various factors in regional development. Both the land demand intensity and land supply capacity reach a high level, achieving a coupling synergy between the land demand intensity and land supply capacity in terms of quantity and quality. The latter refers to the dynamic balance between the land demand intensity and land supply capacity in terms of quantity, but both the land development intensity and land supply capacity are at a relatively low level, and the two have not achieved full development. Therefore, high-intensity and low-intensity conjugate states are classified as high-level equilibrium and low-level equilibrium, respectively.
2.2. The Mechanisms of the Territorial Spatial Development Non-Equilibrium from Conjugate Perspective
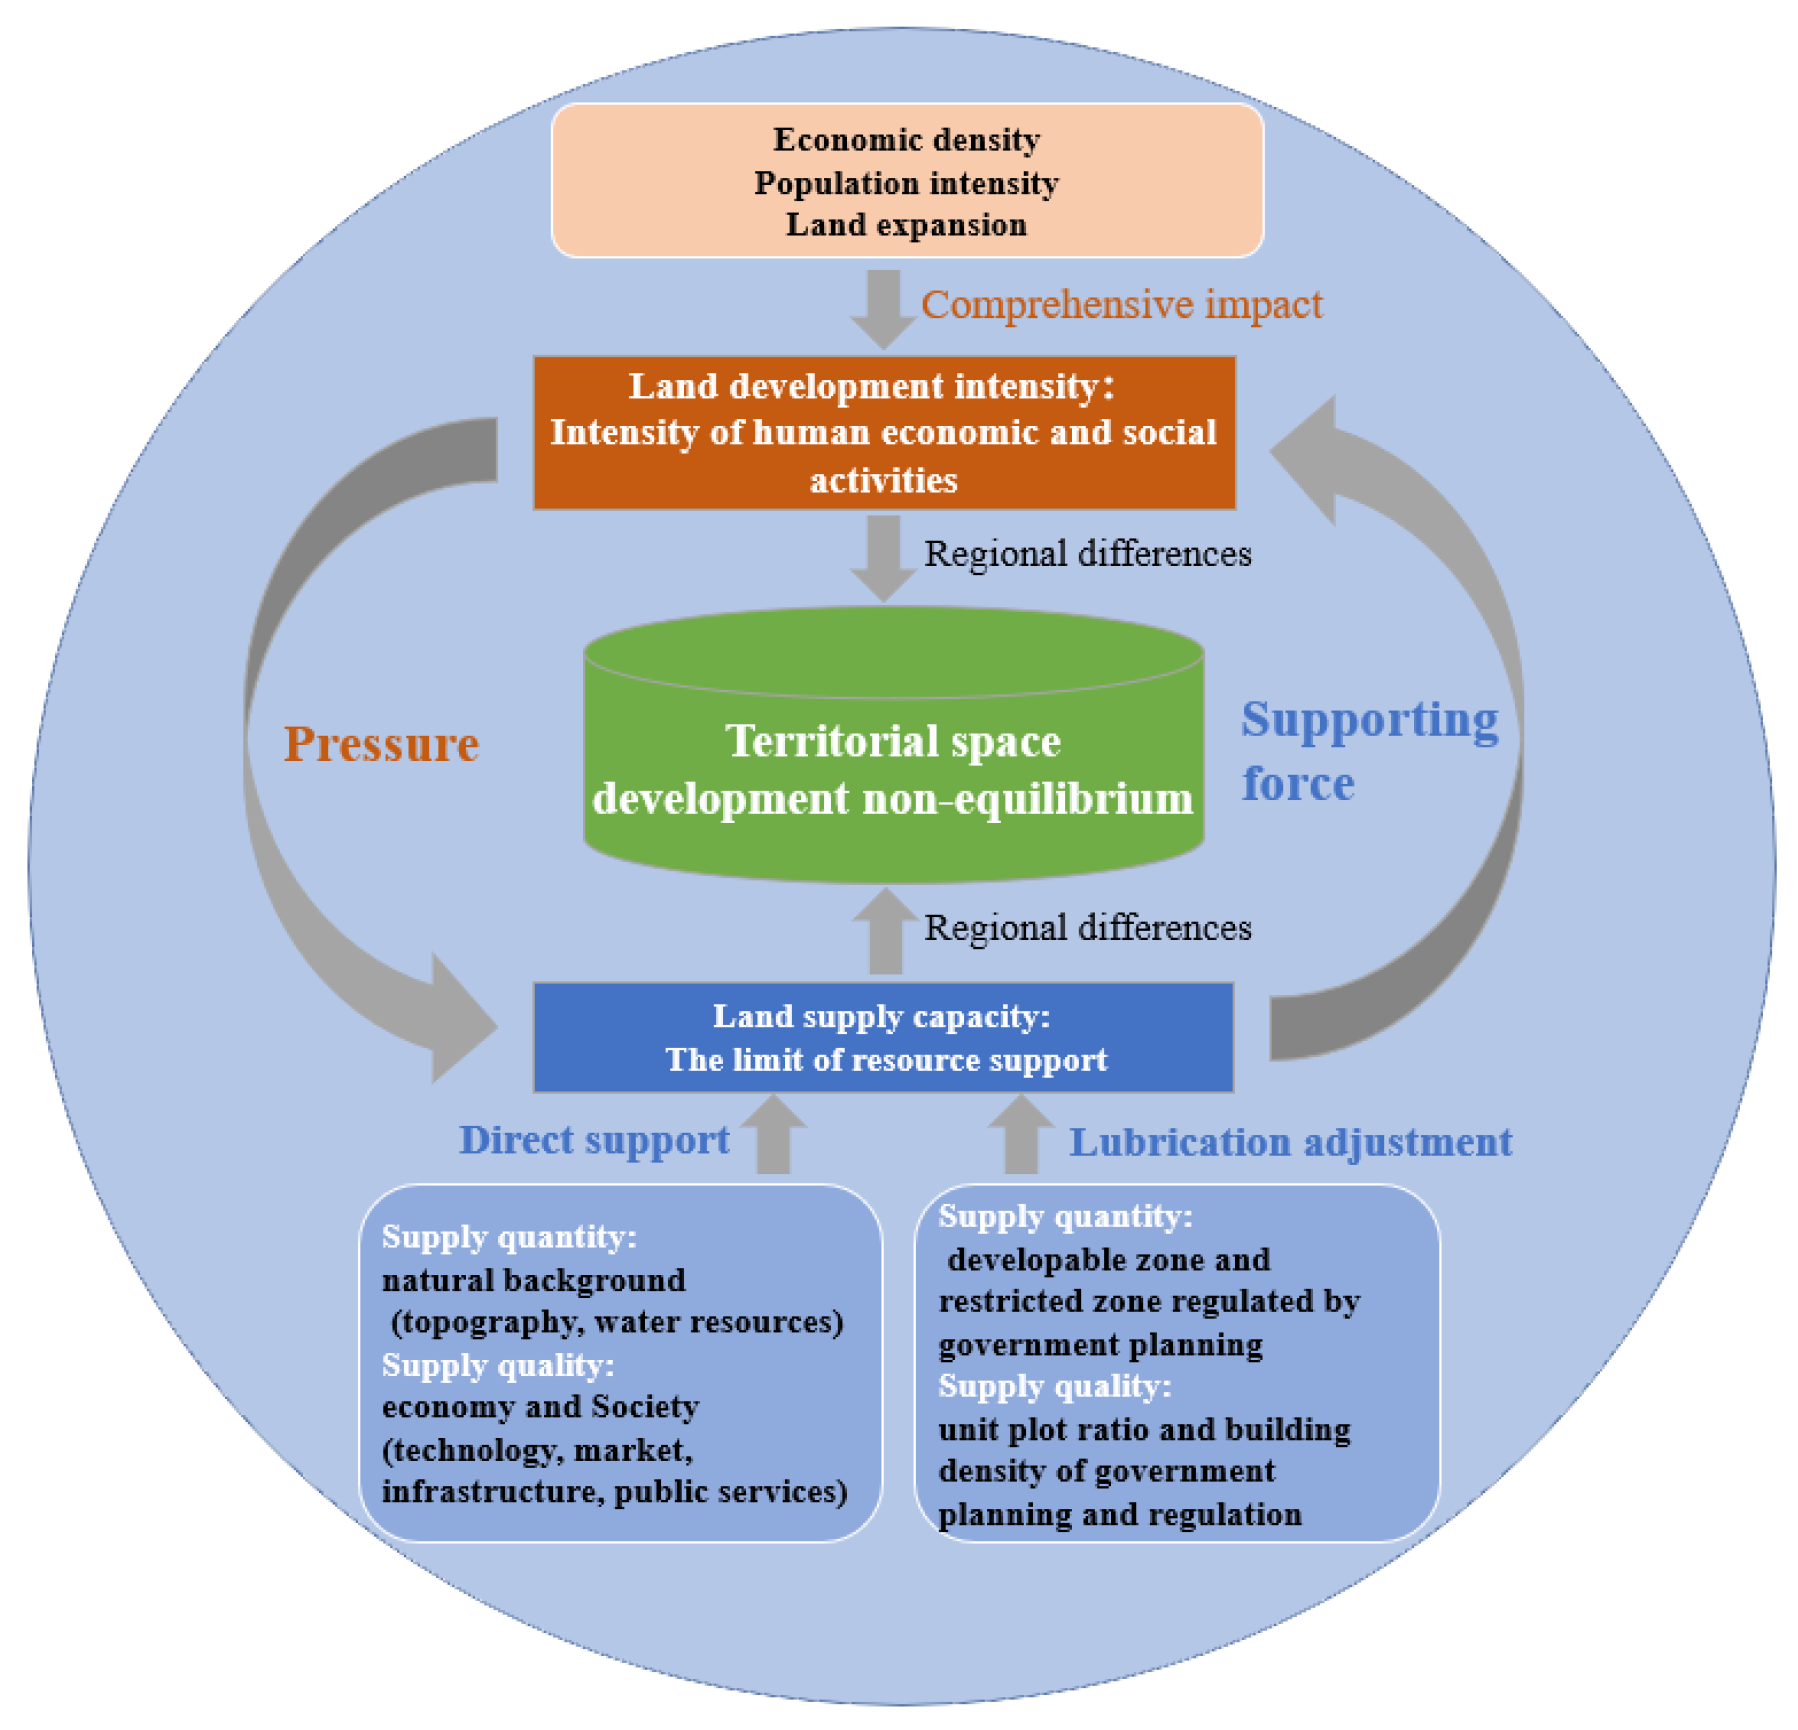
The territorial spatial development non-equilibrium is the outcome of the combined impact of the pressure generated by the land development intensity and the support provided by the land supply capacity, as shown in Figure 1. Land development emphasizes the development and utilization of land quality and quantity and the surface landscape by human society [23]. The level of regional economic development is a crucial influencing factor of the land development intensity [24]. Generally, the higher the level of economic development, the stronger its ability to attract capital, technology, and labor; other factors, such as agglomeration, promote the transformation of the industrial structure, and land, as the spatial carrier of industrial development, directly promotes the improvement of the regional land development intensity.

Figure 1.
Mechanism diagram of the territorial space development non-equilibrium.
Moreover, the level of social development is also a significant influencing factor of the land development intensity. Infrastructure and public services are essential indicators of social development [22]. High-quality infrastructure and public services lead to a higher population and industrial concentration, which lead to an increased demand for construction land and, consequently, the enhancement of the regional land development intensity.
The land supply capacity is primarily influenced by spatial centripetal and centrifugal factors [12]. Land supply can be divided into quantity and quality. Quantity supply is mainly influenced by natural resource endowment and government regulations, while quality supply is primarily affected by local economic and social development levels, as well as government regulations.
In addition, since the 18th National Congress, China has prioritized ensuring food security and has incorporated ecological civilization construction into the overall framework of the “Five-sphere Integrated Plan.” The territorial spatial control, with a significant focus on protecting arable land and the environment, has entered a crucial development phase. Territorial spatial control serves as a necessary means of sustaining governance over territorial space and exerting a lubricating and regulatory effect on the regional land supply capacity through the establishment of land development rights. Regarding the quantity of the land supply, it reduces the amount of land that can be converted into construction land in development-restricted areas [25]. Regarding the quality of the land supply, if the planning of the plot ratio of land with the same location, area, and use is different, the benefits generated per unit area will also differ.
Some scholars argue, from the perspective of land development rights, that the spatial heterogeneity and endowment differences of land resources will inevitably lead to uneven land development. However, government planning control and property rights restrictions will further reinforce the territorial spatial development non-equilibrium.
3. Research Methods, Study Area, and Data Source
3.1. Research Methods
3.1.1. Territorial Space Equilibrium Degree Indicator System
Zhou Min et al. indicate that the major factors influencing the urban land development intensity are the endowment of land resources, population size, and fixed asset investment [26]. Scholars such as Zhang Jingke et al. [27], Yang Qingke et al. [22], and Wu Dafang et al. [28] have discovered correlations between the land development intensity and the population capacity, economic development, and land expansion. Meanwhile, Cheng Yu et al. [13] proposed, from a theoretical perspective, that regional background conditions, regional development stages, industrial agglomeration status, spatial intensity, regulatory system design, and interregional relationship structures are crucial factors influencing the spatial equilibrium. In this study, drawing upon the researchers’ findings and mechanistic analyses, the economic density index (ED) and population intensity index (PI) are utilized to reflect the land development intensity. Additionally, changes in the area of construction land are considered to be the most direct manifestation of the land development intensity; thus, the land expansion index is introduced (LU).
Drawing upon the mechanistic analysis, it is observed that natural resource endowment primarily influences the quantity of the land supply, while the level of economic and social development mainly affects the quality of the land supply. Simultaneously, government regulation can impact both the quantity and the quality of the land supply. Therefore, indices such as the natural support index (NS), economic support index (ES), social support index (SS), and government regulation index (GR) were chosen to reflect the regional land supply capacity. Additionally, since the 18th National Congress, ecological civilization construction has been prioritized in the overall agenda, imposing higher demands on land use and subjecting the land supply to increased environmental pressure [29]. Hence, an ecological environment index was introduced. The following indices were chosen: ① The natural support index: This index is characterized by the proportion of plain area and the per capita water resources. ② The economic support index: Technological progress [30] and market development [31] are crucial means of enhancing regional economic development. The level of technological development is represented by per capita scientific and technological expenditures, while the degree of land marketization is reflected by the proportion of the number of land transactions through bidding and auction to the total number of land transactions. ③ The social support index: Transportation construction, education, and healthcare are commonly employed to gauge the level of regional infrastructure [32,33] and public services [34,35]. Given that the financial inputs of local governments significantly influence their development levels, per capita transportation expenditure and per capita education and healthcare expenditure are utilized as indicators in this regard. ④ The government regulation index: Land protection and ecological conservation are significant objectives of territorial space regulation in China. Therefore, this index represents the proportion of arable land to the total land area and the proportion of nature reserves to the total land area. ⑤ The ecological environment index: The degree of ecological security in a region is represented by the density of geological disasters. Due to the challenges involved in obtaining carbon dioxide data, per capita sulfur dioxide emissions are used to indicate the environmental carrying capacity. Ultimately, this constructs the assessment indicator system for the territorial space balance (Table 1).

Table 1.
Evaluation index system for the territorial spatial equilibrium degree.
3.1.2. The Model of Territorial Space Equilibrium Degree
- (1)
- Territorial Space Equilibrium Degree (TSED)
The ratio between the land development intensity and the land supply capacity is used to represent the territorial spatial equilibrium degree (TSED). The formula is as follows:
In the formula, the TSED is the territorial space equilibrium index, which can measure whether land resource utilization is in equilibrium or non-equilibrium. LD is the land development intensity index, and LS is the land supply capacity index. With reference to the existing research results [12], the TSED is divided into five levels. Among them, the non-equilibrium state includes serious underdevelopment, underdevelopment, and overdevelopment, and the equilibrium state includes low-level equilibrium and high-level equilibrium1 (Table 2).
Table 2.
Classification of the territorial spatial equilibrium degree.
- (2)
- Land Development Intensity Index and Land Supply Capacity Index
Based on the standardization of the data using the extreme value method, the land development intensity index and the land supply capacity index were calculated using a combination of the arithmetic average method and the geometric average method [14,16,24]. The formulas are as follows:
In Formulas (2) and (3), ED is the economic density index; PI is the population intensity index; LU is the land expansion index; NS is the natural support index; ES is the economic support index; SS is the social support index; GR is the government regulation index; and EV is the ecological environment index.
3.1.3. Kernel Density Estimation
Kernel density estimation is a non-parametric estimation method used to describe the dynamic distribution of data; it can effectively avoid the subjectivity of the function setting in the parameter estimation and can improve the authenticity of the estimation results. Suppose that the density function of the random variable W is f(w); then, the probability density formula for point w is as follows [36]:
In the formula, K (·) is the kernel function; n is the observed value; h is the bandwidth; Wi is an independent and equally distributed random variable; and is the mean. In this study, the Gaussian kernel density, which is commonly used in academia, is used to draw the kernel density curve of the territorial spatial equilibrium, and the temporal variation characteristics of the territorial spatial equilibrium are depicted by observing the distribution position and shape and the polarization of the density function in the graph.
3.1.4. Spatial Autocorrelation Analysis
- (1)
- Global Moran Index
Global spatial autocorrelation is an index used to measure the spatial correlation of research objects from a global perspective. This study uses the global Moran index to measure the global spatial pattern of the regional spatial equilibrium. The formula is as follows [37]:
In the formula, n is the number of study samples, and are the geographic attribute observations of region i and region j; is the average of the observations; is the sample variance; is the space weight matrix; and I is the global spatial autocorrelation coefficient. If I > 0, it means that the spatial distribution is positively correlated; if I < 0, it means it is negatively correlated; and if I = 0, it is randomly distributed in space.
- (2)
- Local Moran Index
After measuring the overall spatial correlation, the local Moran index is used to further explore the spatial agglomeration characteristics of the local spatial units. The formula is as follows [22]:
The variable has the same meaning that it had in Formula (5). If I > 0, it indicates that neighboring cells with similar local areas are gathered in the space; if I < 0, it indicates that neighboring cells with non-similar local areas are gathered in the space; and if I = 0, it indicates that the cells are randomly distributed in the space. Local agglomeration can be divided into four types as follows: high–high (H-H), low–high (L-H), low–low (L-L), and high–low (H-L).
3.2. Study Area and Data Source
The research encompassed thirty-one provinces (including direct-administered municipalities and autonomous regions) in China, with three provinces in the northeast, ten in the east, six in the central region, and twelve in the west, as shown in Table 3. Due to considerations such as statistical criteria and data availability, Hong Kong, Macau, and Taiwan were not included in the scope of the study. The indicator data primarily originated from the “China Statistical Yearbook (2007–2021)”, the “China Land and Resources Statistical Yearbook (2007–2021)”, and the “China Environmental Statistical Yearbook (2007–2021)”. The geographic coordinates were extracted using ArcGIS 10.7 software.
Table 3.
Classification of four major economic regions.
4. Results
4.1. Land Development Intensity and Land Supply Capacity
From the perspective of land development intensity, the average land development intensity showed an upward trend from 2006 to 2020, increasing from 0.688 to 0.835, with a growth rate of 21.4%. The provinces with a high land development intensity were predominantly concentrated in the eastern coastal provinces and directly administered municipalities, while the central and western provinces exhibited a lower land development intensity. In particular, regions such as Tibet, Qinghai, Xinjiang, and Jiangxi, which are characterized as being less developed and economically disadvantaged, were positioned at the lower levels. However, in terms of the growth rate, the increase in the land development intensity was more pronounced in the low-value provinces of the central and western regions. This indicates that strategies such as the Western Development, the rise of the central region, and the poverty alleviation initiatives have effectively promoted development and construction in these areas, leading to an improvement in the land development intensity.
From the perspective of the land supply capacity, the average land supply capacity also exhibited an upward trend from 2006 to 2020, increasing from 0.918 to 0.993, with a growth rate of 8.03%. The provinces with a high land supply capacity were spatially dispersed and were primarily located in the southeastern coastal provinces, some central and western provinces, and the municipalities of Beijing, Tianjin, and Shanghai. Although the land supply capacity values in the aforementioned provinces and municipalities were relatively high, the underlying reasons for their formation differed significantly. The southeastern coastal provinces and the three major municipalities mainly benefit from superior natural resource endowments and economic and social support. In contrast, the provinces in the central and western regions, such as Anhui, Henan, Guizhou, and Guangxi, benefit mainly from a favorable ecological environment. Additionally, the provinces heavily influenced by government planning and control include major grain-producing regions, such as Shandong, Henan, Jiangsu, Anhui, and Heilongjiang, as well as Hainan Province (with over 80% of its land designated as natural reserves).
In summary, the land development intensity and land supply capacity exhibit distinct regional disparities in spatial distribution, as shown in Table 4.. Under the combined influence of these factors, the development of China’s territorial space manifests a state of either equilibrium or imbalance. Furthermore, through comparing the initial and final averages of the land development intensity and land supply capacity, it is noted that the numerical level of the land development intensity is lower than that of the land supply capacity. However, the magnitude of the increase in the land development intensity exceeds that of the land supply capacity. This indicates that the improvement in the territorial space balance is primarily influenced by the intensity of the land development.
Table 4.
Land development intensity and land supply capacity of various provinces in China in 2006 and 2020.
4.2. Temporal Dynamic Evolution Characteristics of TSED
4.2.1. Temporal Dynamic Evolution Characteristics from a Global Perspective
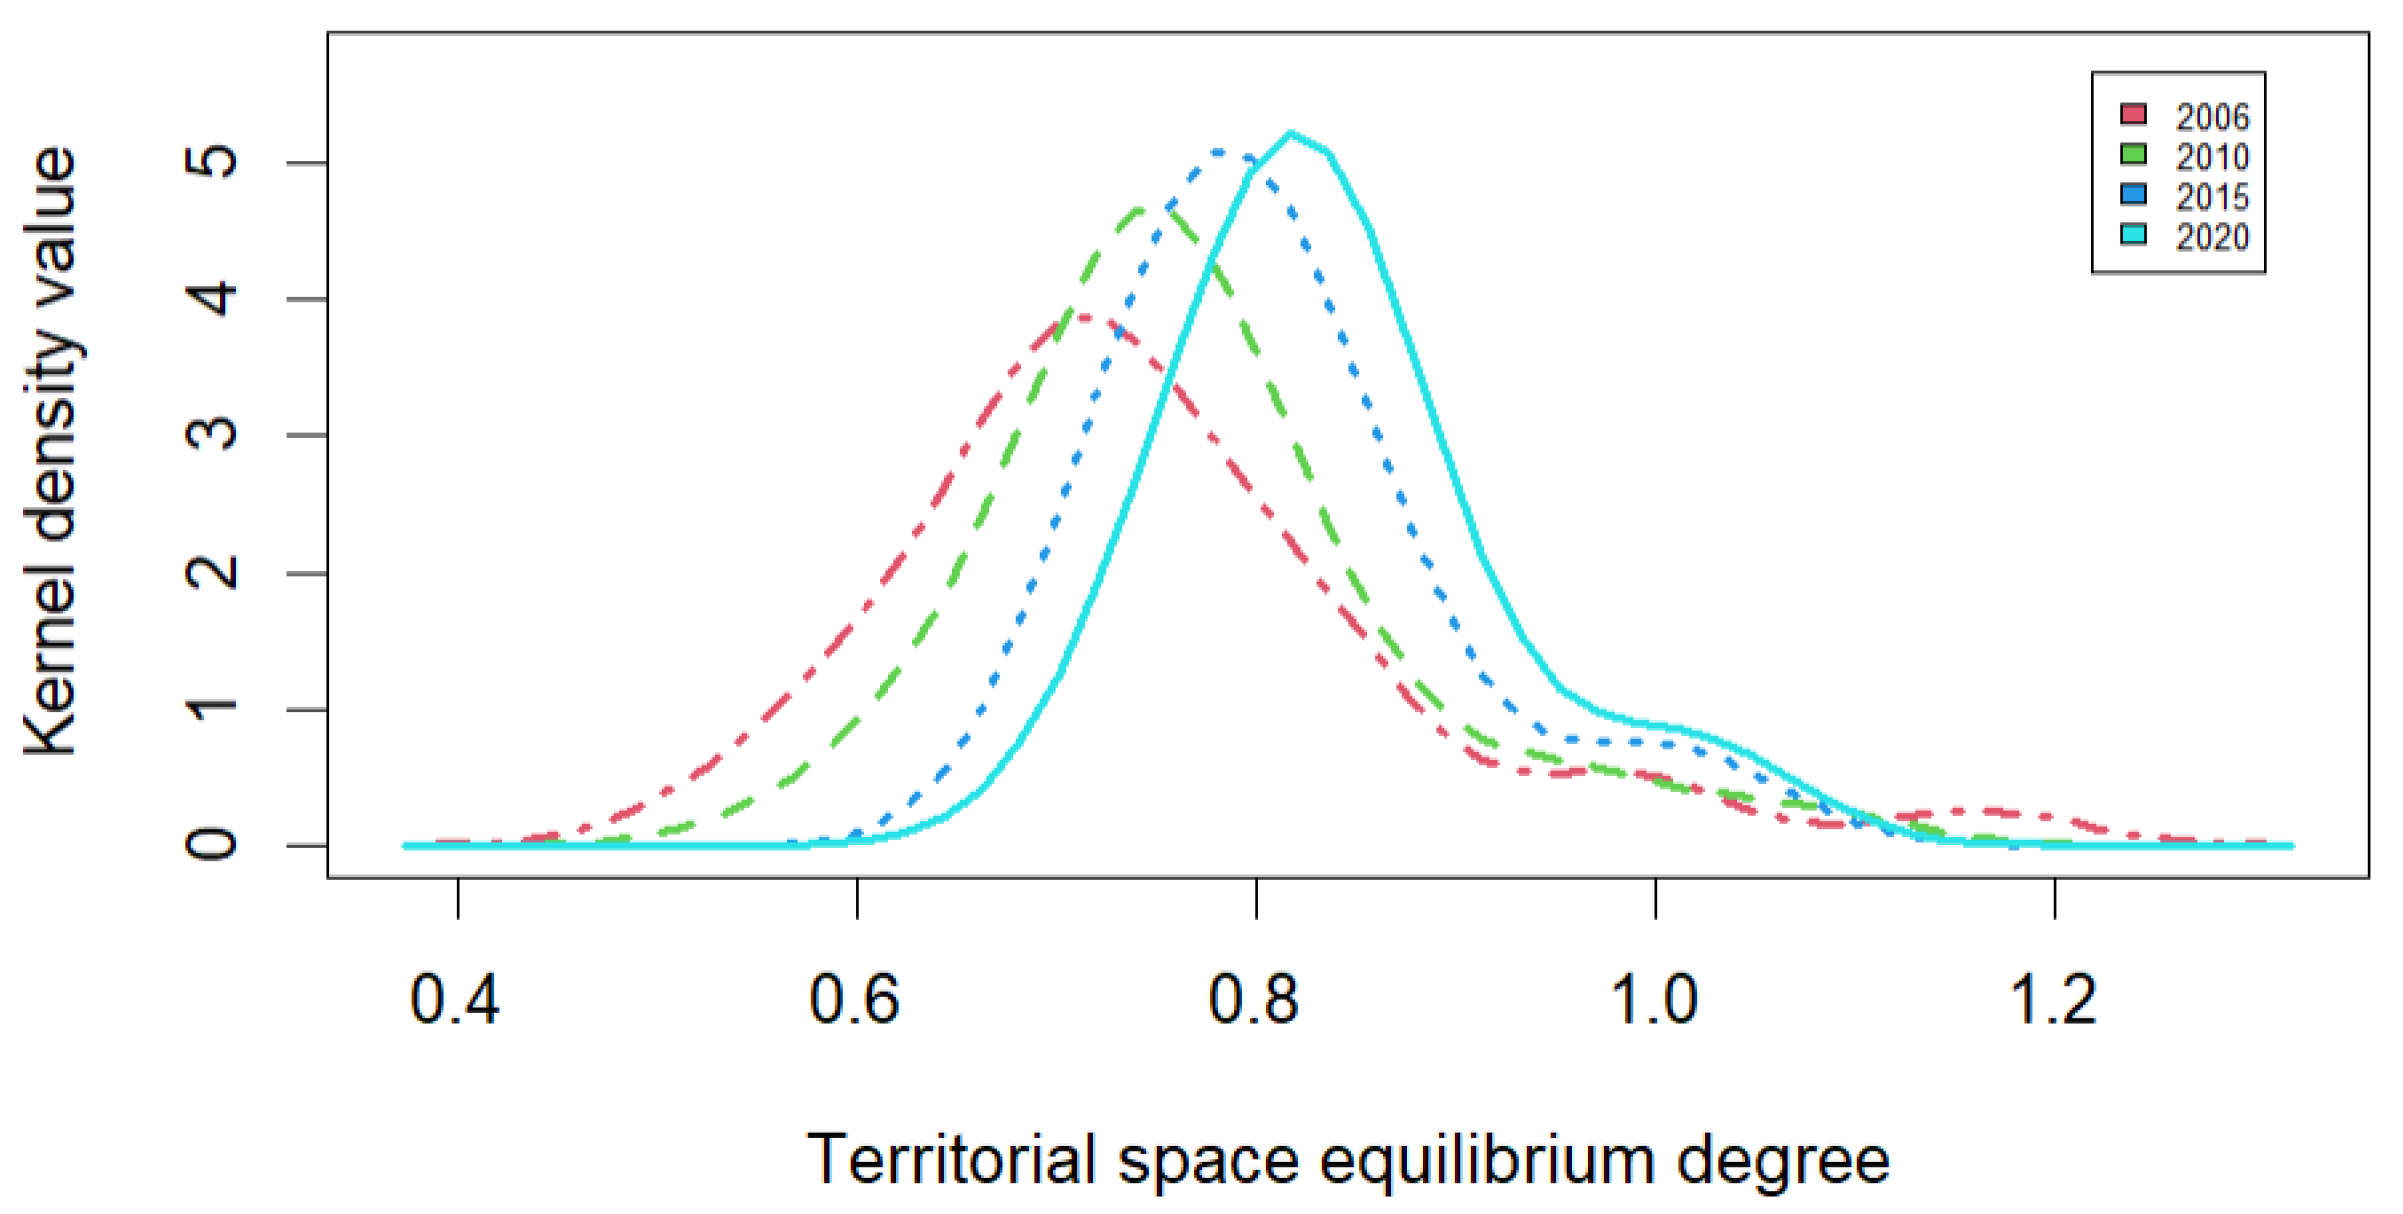
From the perspective of the centroid position of the kernel density curve, the centroid gradually shifted to the right from 2006 to 2020. This indicates an increase in the proportion of provinces with high values and suggests an overall upward trend in the TSED. From the height of the kernel density curve’s peak and its width, there was a significant increase in the peak height of the kernel density curve from 2006 to 2020, indicating a more concentrated distribution of the TSED across the provinces. The narrowing trend of the kernel density curve suggests a reduction in the numerical range of the TSED distribution. Taken together, these observations indicate a decrease in regional disparities in the TSED. From the number of curve peaks, it is clear that the curve did not have multiple peaks in each year, indicating that the TSED did not show obvious multipolar differentiation during the study period.
In general, from 2006 to 2020, China’s territorial space development non-equilibrium exhibited certain regularities. The state of the territorial space development non-equilibrium has improved, with a significant enhancement in the TSED. There is also a noticeable reduction in regional disparities in the TSED over this period, as shown in Figure 2.
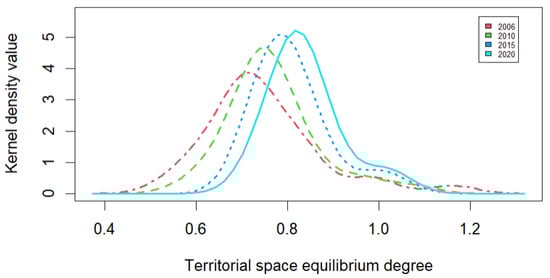
Figure 2.
Kernel density map of the territorial spatial equilibrium degree of the entire territory.
4.2.2. Temporal Dynamic Evolution Characteristics from a Local Perspective
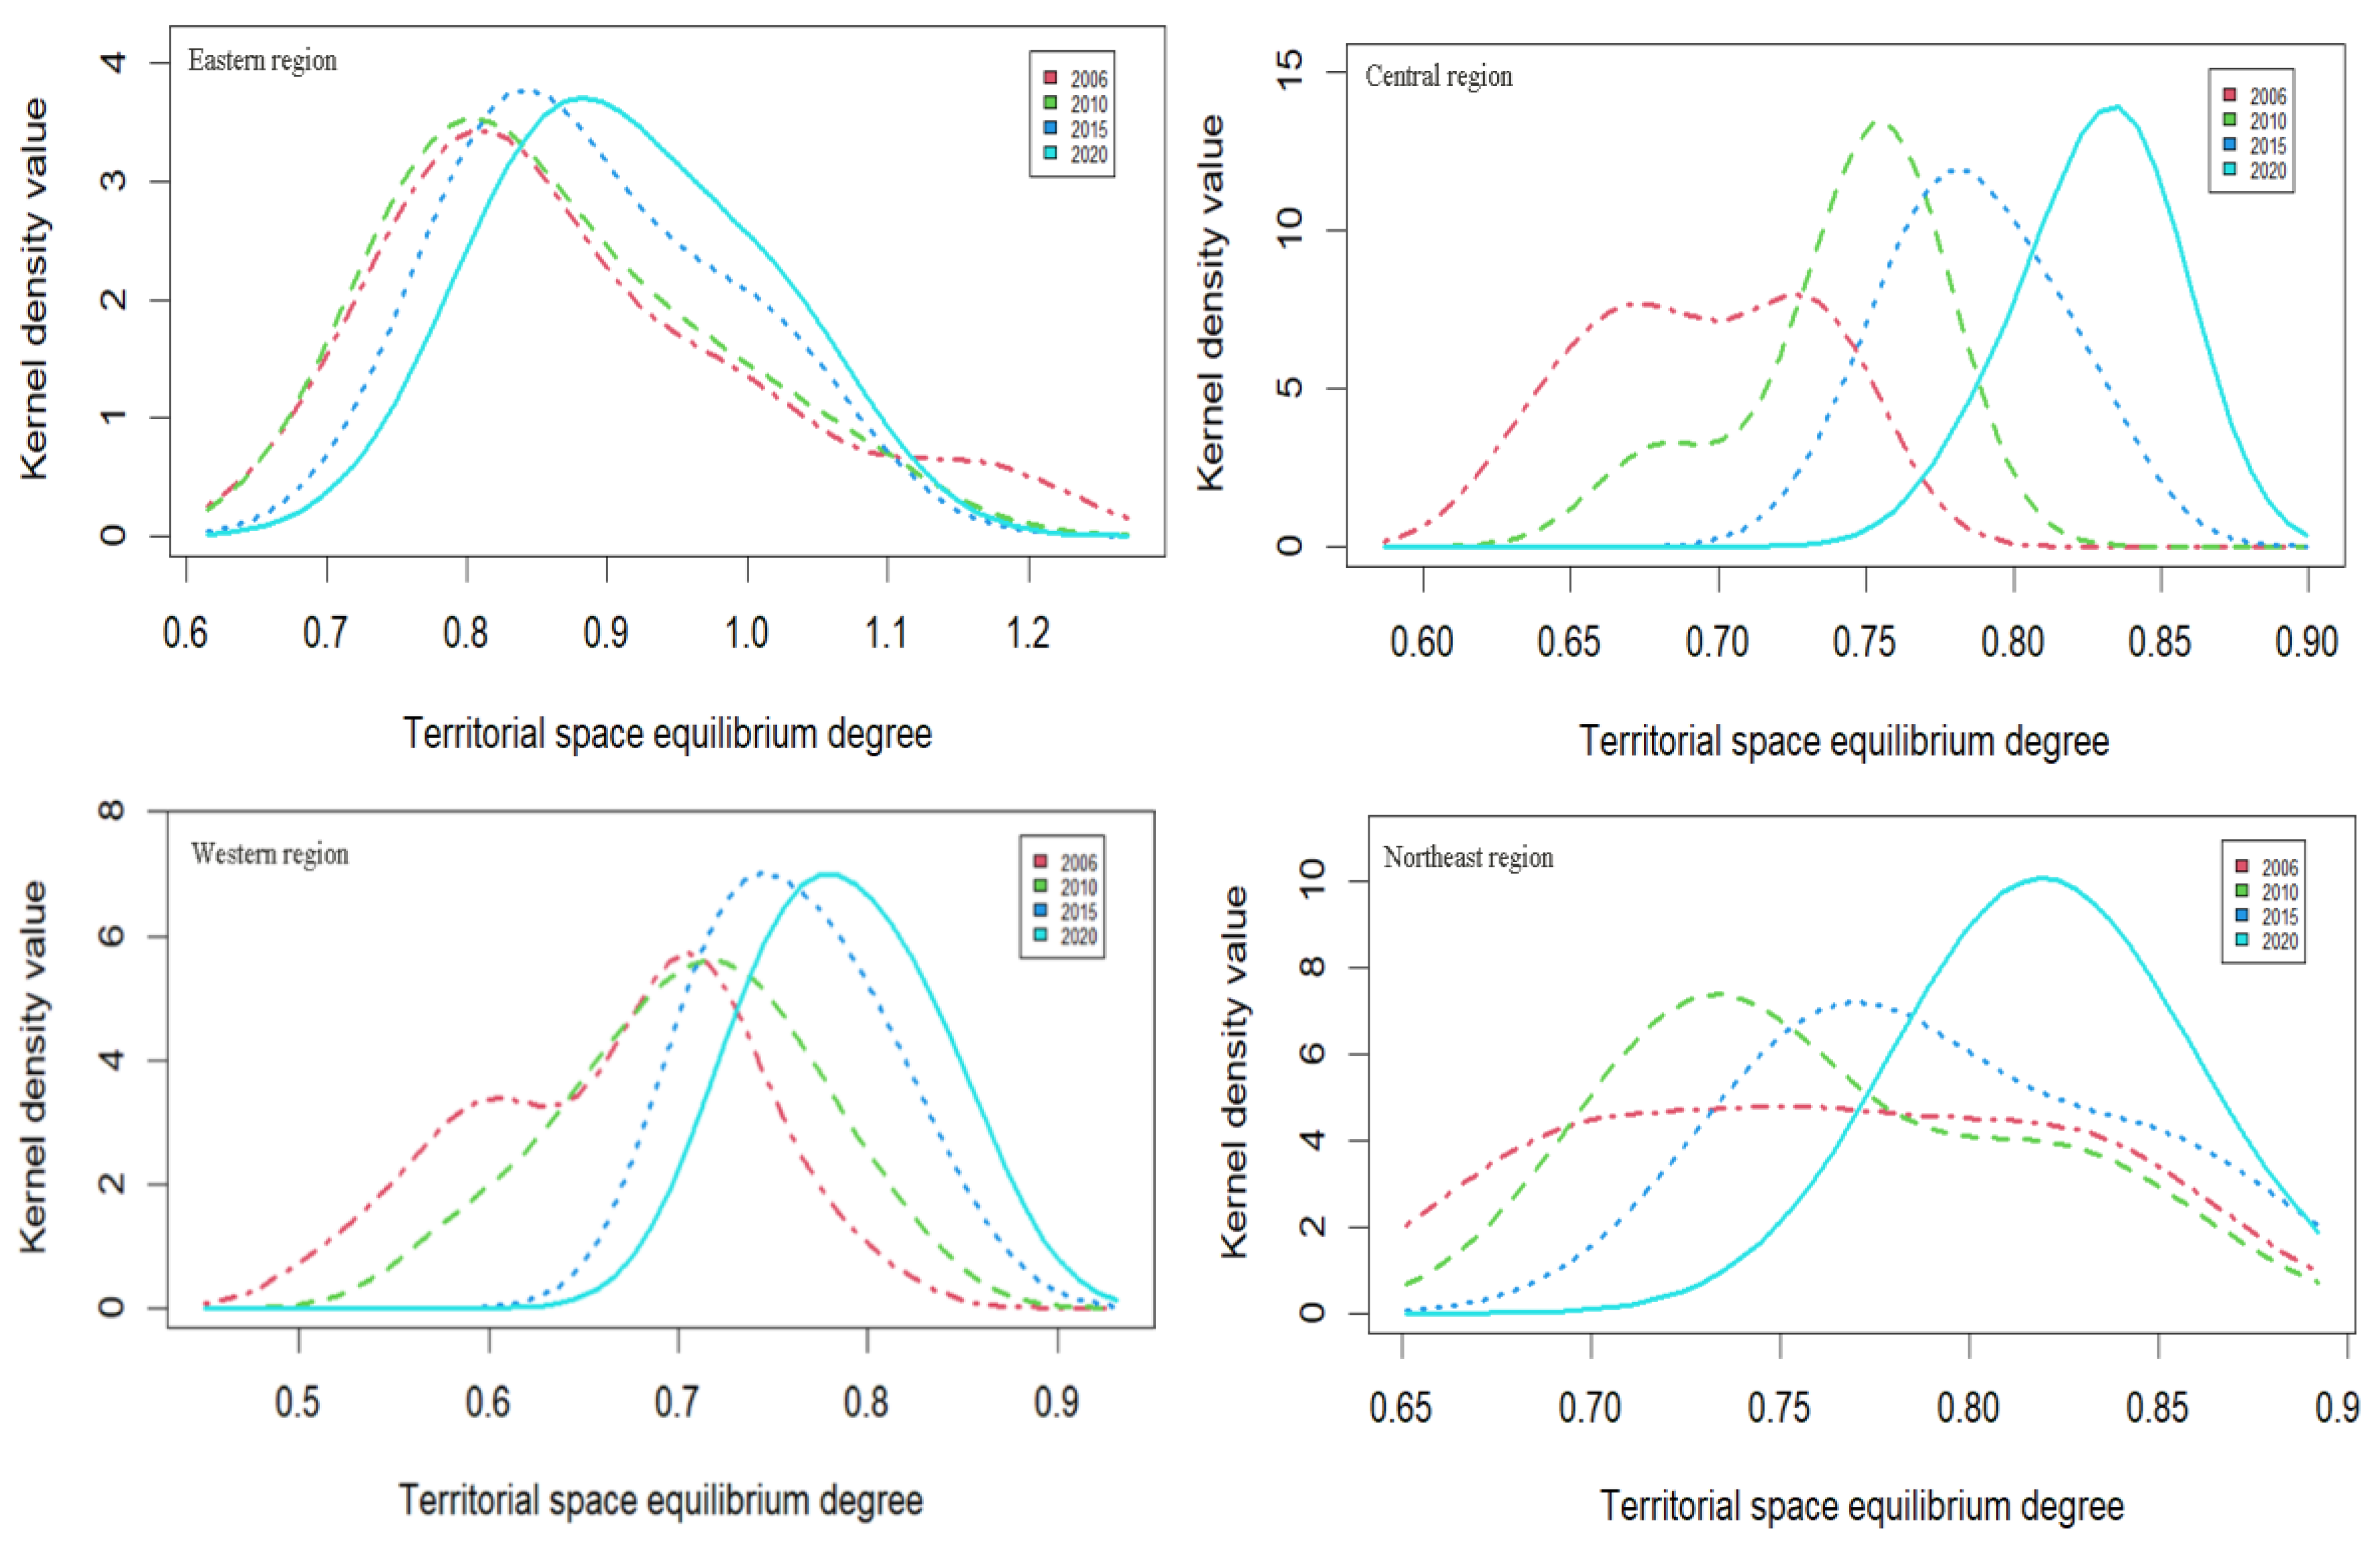
In terms of the numerical values of the TSED, the centroids of the kernel density curves for the eastern, central, western, and northeastern regions all shifted to the right from 2006 to 2020. This indicates an upward trend in the TSED for these four major regions, which is consistent with the overall developmental patterns observed from a nationwide perspective. However, there were noticeable differences in the magnitudes of these shifts among the regions. The central and western regions experienced a greater rightward shift, while the eastern and northeastern regions had a smaller rightward shift. This suggests that the increase in the TSED was more significant in the central and western regions when compared to the eastern and northeastern regions. In terms of the regional disparities in the TSED, the height of the kernel density curve peaks for the northeastern, eastern, central, and western regions increased, and the width of the curves narrowed from 2006 to 2020. This indicates a reduction in the regional disparities in the territorial space balance for these four major regions, which aligns with the developmental patterns observed from a nationwide perspective. Specifically, the eastern region showed a continuous upward trend, but the magnitude of the increase in the peak height and the narrowing of the curve were relatively small. The northeastern region exhibited an evolving trend in the peak height with an initial increase, followed by a decrease, and then another increase. The curve’s width continued to narrow. Both the central and western regions experienced significant increases in the peak height and a narrowing of the curve, indicating a more pronounced reduction in regional disparities in the TSED when compared to the eastern and northeastern regions, as shown in Figure 3.
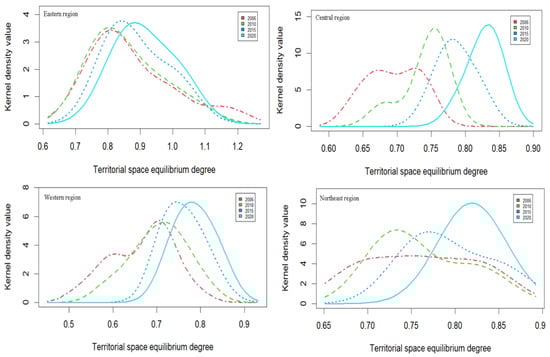
Figure 3.
Kernel density map of the territorial spatial equilibrium in four major regions.
The temporal and spatial evolution of the TSED in China reflects a dynamic interplay of regional characteristics and period-specific features. The eastern region, which benefits from superior natural conditions, economic location, and institutional policies, is at the forefront of national development, with a relatively high initial TSED level. However, the potential for further improvement is limited. The northeastern region, which is an established industrial base, has a solid development foundation. Consequently, the eastern and northeastern regions exhibit relatively modest increases in the TSED, and the reduction in regional disparities is limited. Due to constraints, such as industrial foundation, resource conditions, and historical and cultural factors, the initial level of the TSED in the central and western regions is relatively low. However, with the implementation of national strategies such as the “Western Development” and “Central Rise” in recent years, the development level of these regions has significantly improved [38,39]. This is particularly notable in the western region, where the increase in the TSED and the reduction in regional disparities are more pronounced.
4.3. Evolution Characteristics of Spatial Pattern of TSED
4.3.1. Spatial Differentiation Characteristics of TSED
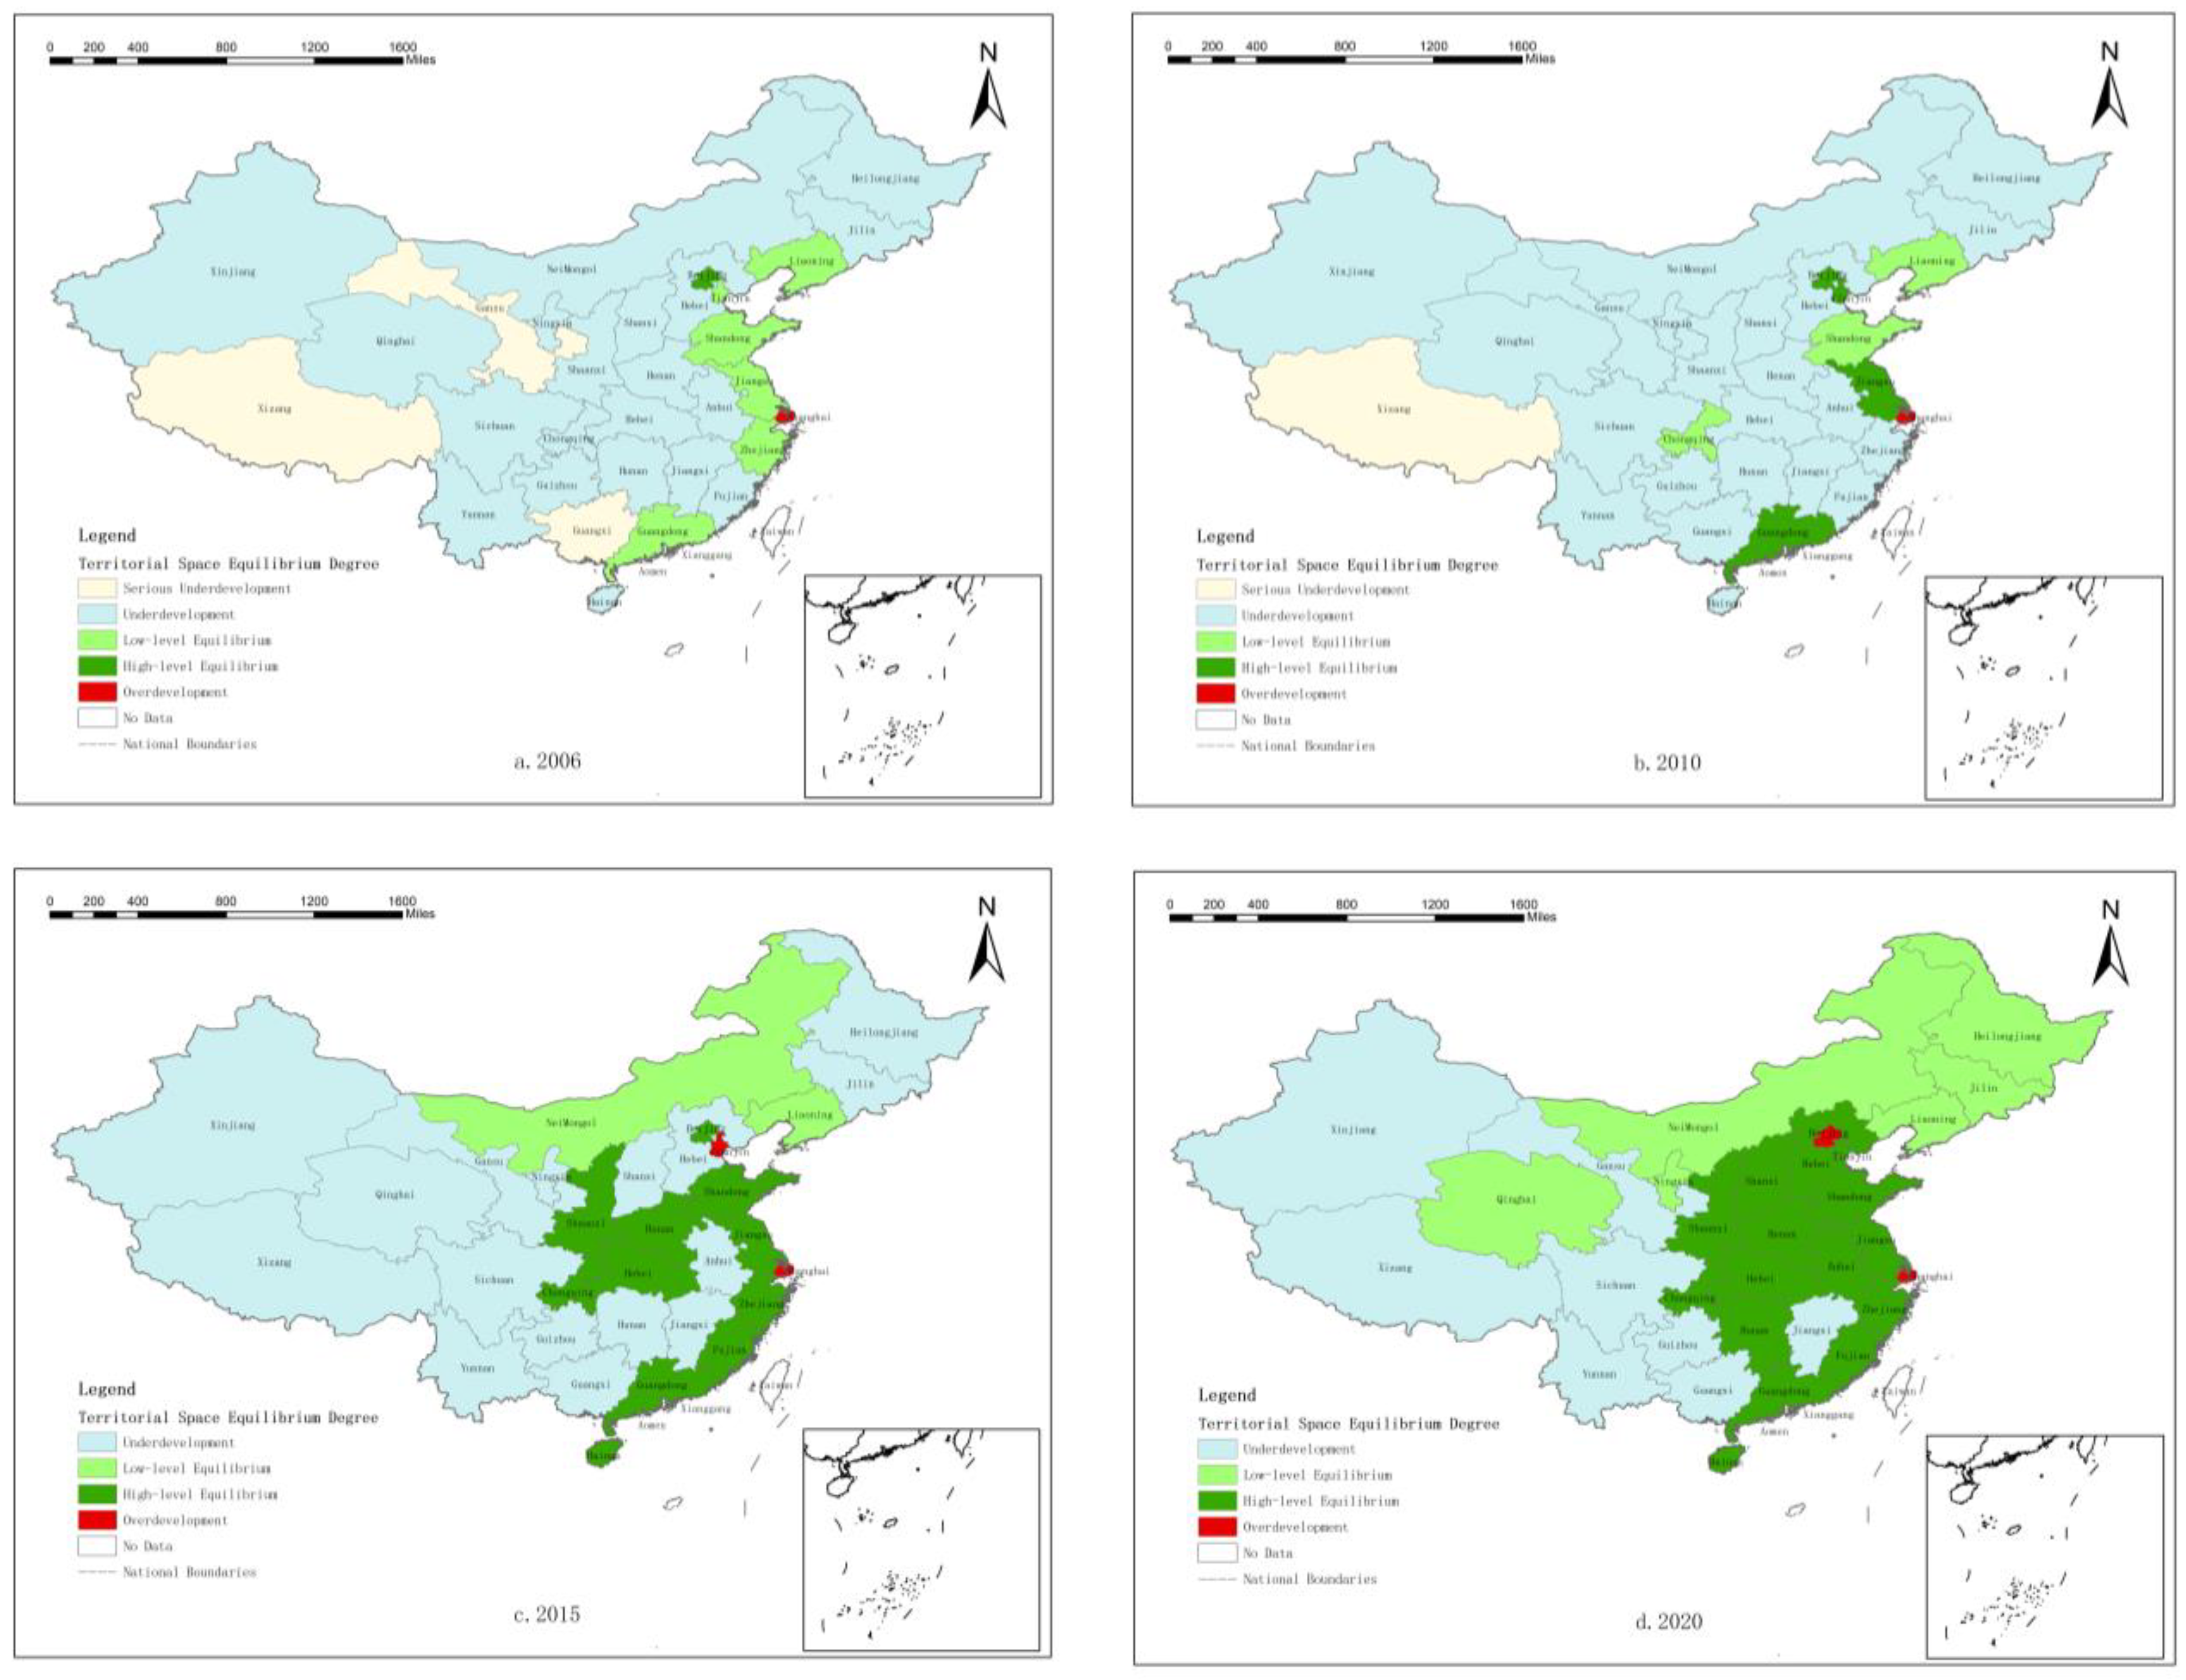
To visually illustrate the evolution of the spatial pattern, the data for the years 2006, 2010, 2015, and 2020 were selected and visualized using ArcGIS 10.7, as shown in Figure 4.
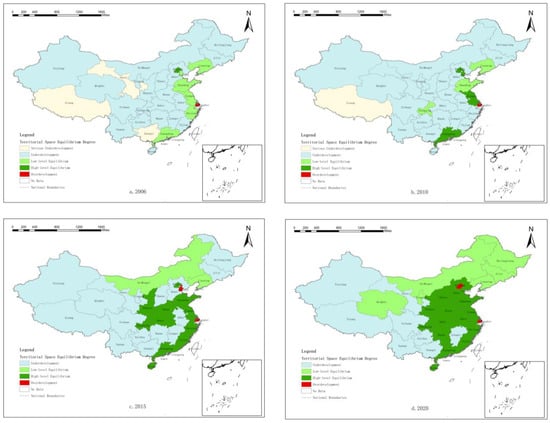
Figure 4.
Spatial differentiation of the territorial spatial equilibrium among provinces from 2006 to 2020. Note: This map is based on the standard map approved by the Ministry of Natural Resources with drawing number GS (2019) 1822, and the base map has not been modified.
At the end of the study period, the overdeveloped areas were represented by the two municipalities of Beijing and Shanghai. The underdeveloped areas were mainly distributed in the western areas, such as Sichuan, Yunnan, and Xinjiang. The high-level equilibrium areas were mainly found in the southeastern coastal provinces and the central plains. The low-level equilibrium areas included Inner Mongolia, Ningxia, Qinghai, and the three northeastern provinces.
Beijing and Shanghai, which are characterized by a narrow geographical area and intensive economic and social activities with a high population concentration, face a situation in which the land supply capacity is restricted due to farmland protection. This limitation leads to a situation in which the land development intensity exceeds the land supply capacity, resulting in a non-equilibrium state of overdevelopment. The underdeveloped areas are situated inland and exhibit a relatively lagging level of economic and social development. The lack of momentum in the land development demand, coupled with a low land development intensity that does not match the moderate level of the land supply capacity, creates a non-equilibrium state of underdevelopment. High-level equilibrium areas enjoy superior natural resource endowments, economic prosperity, and a large population. Both the land development intensity and the land supply capacity are high and contribute to a state of high-level equilibrium. Although the land development intensity and land supply capacity in regions with low-level equilibrium are numerically compatible, they are constrained by natural resource endowments, economic and social conditions, and government planning restrictions. Both factors operate at a lower level of development, which ultimately results in a state of low-level equilibrium.
The number of provinces and cities in a state of underdevelopment decreased from 23 to 8, while the number in an equilibrium state increased from 7 to 21. In 2006, except for some coastal provinces and cities in the northeast and east, most were in a state of underdevelopment. After 2014, there were no provinces and cities in a state of serious underdevelopment. The successive implementation of the Western Development, Central Rise, and Revitalization of the Northeast strategies has promoted the economic and social development of the underdeveloped areas [38,39,40], significantly increasing the land development intensity. Simultaneously, with the continuous improvement of the infrastructure and public services and the gradual deepening of ecological civilization construction, the effective enhancement of the land supply capacity has been achieved. The improvement of both aspects has led to a more equal alignment of the regional land development intensity with the supply capacity, resulting in a noticeable improvement in the non-equilibrium state of national land spatial development. In terms of spatial distribution, the provinces and cities in an equilibrium state have expanded beyond the Bohai Rim, Yangtze River Delta, and Pearl River Delta regions to include most provinces in the central part, as well as the northeastern and western regions, namely Inner Mongolia, Shaanxi, Chongqing, Ningxia, and Qinghai.
4.3.2. Spatial Correlation of TSED
- (1)
- Territorial Spatial Dependency Patterns of TSED
As can be seen in Table 5, the global Moran index values of China’s territorial spatial equilibrium degree from 2006 to 2020 were all positive, with values ranging from 0.133 to 0.212, a Z value > 2.58, and p value of less than 0.01, and each year passed the significance test at the 1% level. This indicates that China’s TSED exhibits positive spatial autocorrelation in spatial distribution. In other words, high-value provinces and low-value provinces show adjacent distribution characteristics in geographical space.
Table 5.
Global Moran index values of China’s territorial spatial equilibrium.
Further analysis showed that the spatial correlation degree of China’s TSED was not stable. From 2006 to 2011, the global Moran index showed a downward trend, reaching the lowest value of 0.133 in 2011, indicating that the spatial agglomeration of provinces and cities with a similar TSED had declined. From 2011 to 2020, the global Moran index showed an upward trend, reaching 0.203 in 2020, indicating that the spatial agglomeration of provinces and cities with a similar TSED was gradually enhanced and that the difference in the TSED was gradually reduced.
- (2)
- Local Spatial Clustering Pattern of TSED
The global Moran index cannot reflect the specific spatial relationships between adjacent provinces. Therefore, we further employ the local Moran index and utilize ArcGIS 10.7 software to create local indicators of spatial association (LISA) cluster maps for the years 2006, 2010, 2015, and 2020, as shown in Figure 5. The clustering types are spatially divided into four categories as follows: “high–high”, “low–low”, “low–high”, and “high–low”.
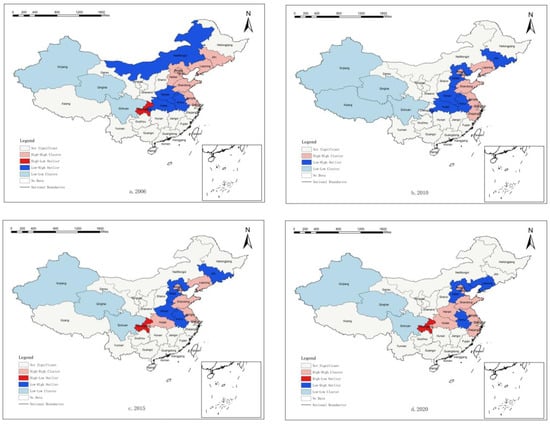
Figure 5.
LISA map of territorial spatial equilibrium among provinces from 2006 to 2020. Note: This map is based on the standard map approved by the Ministry of Natural Resources with drawing number GS (2019) 1822, and the base map has not been modified.
① High–High Area Type (H-H): This type of area represents a high-value clustering of the TSED, indicating that both the region itself and its neighboring areas have relatively high TSED levels. It is mainly distributed in the eastern coastal provinces and cities such as Shandong, Jiangsu, and Zhejiang, as well as Beijing, Tianjin, and Shanghai. It shows a trend of extending towards the central region, with Henan and Hubei gradually joining the high–high area. These regions have consistently maintained a high TSED level. As industries undergo transformation and upgrade, some industries shift to nearby central provinces. The provinces that take on these industrial resources experience rapid development, leading to an improvement in the TSED.
② Low–Low Area Type (L-L): This type of area represents a low-value clustering of the TSED, indicating that both the region itself and its neighboring areas have relatively low TSED levels. It is mainly distributed in the western regions such as Xinjiang, Tibet, Qinghai, and Sichuan. These areas are located in the inland regions, with lagging economic and social development. The land use is relatively extensive, and the excessively low land development intensity contributes to a low TSED level.
③ Low–High Area Type (L-H): This type of area indicates that its own TSED is relatively low, while the neighboring TSED is relatively high. It is mainly distributed in the northeastern regions, such as Jilin and Liaoning, and the central regions, such as Henan and Anhui, which are major grain-producing areas. Although these areas are adjacent to provinces and cities with a higher TSED, they are constrained by factors such as their own development foundation and the task of protecting arable land. Consequently, they have not formed a high–high linkage advantage with the surrounding high-value areas, and this has resulted in a relatively low TSED level.
④ High–Low Area Type (H-L): This type of area has a relatively high TSED, while the neighboring TSED is relatively low. Over the four years, only Chongqing exhibited this characteristic. Chongqing is the only directly administered municipality among the four major municipalities that is located inland. Policy advantages drive regional development and construction, resulting in a high TSED level.
From the perspective of the number of agglomeration types, the order is HH (high–high) > LH (low–high) > LL (low–low) > HL (high–low). In terms of the evolution of spatial patterns, China’s TSED exhibits a spatial proximity peer effect. This implies that, when the TSED in local neighboring regions is at a high (low) level, the local area is more likely to become a high (low) level region.
5. Conclusions and Discussion
5.1. Conclusions
(1) Both the land development intensity and the land supply capacity show an increasing trend, but there are significant spatiotemporal differences between the two. From 2006 to 2020, the increase in the land development intensity and land supply capacity was 21.4% and 8.03%, respectively. The increase in the land development intensity is much greater than that in the land supply capacity, indirectly indicating that the TSED is mainly influenced by the land development intensity. The areas with a high land development intensity are mainly concentrated in the eastern coastal provinces and the four major municipalities, while the areas with a high land supply capacity are more dispersed and are mainly distributed in the southeastern coastal provinces, in some provinces in the central and western regions, and in Beijing, Tianjin, and Shanghai.
(2) On the national scale, the state of China’s territorial spatial development non-equilibrium has improved, and the TSED has shown an upward trend, with a narrowing regional difference. The increase in the TSED in the central and western regions is greater than that in the eastern and northeastern regions, and the regional difference in the TSED in the central and western regions has significantly narrowed comparatively to the eastern and northeastern regions.
(3) Significant regional differentiation in the TSED was observed. At the end of the study period, the areas with overdevelopment were Beijing and Shanghai, while the areas with underdevelopment were mainly distributed in the western regions, such as Sichuan, Yunnan, and Xinjiang. The regions with high-level equilibrium were mainly found in the southeastern coastal provinces and the central plains region, whereas the regions with low-level equilibrium included Inner Mongolia, Ningxia, Qinghai, and the three northeastern provinces.
(4) In China, the TSED aggregation types follow the sequence HH > LH > LL > HL, demonstrating a neighboring effect.
5.2. Discussion
- (1)
- Implementing differential management strategies forms the foundation for optimizing the land use pattern
While polarization effects and spillover effects tend to reach equilibrium through a mutual growth and decline process, there are evident cyclical accumulation effects among the different regions, leading to the continuous strengthening of regional development imbalances. The spatiotemporal differences and the conclusion regarding the higher intensity in the east and the lower intensity in the west confirm the research findings of Zhao Yali et al. [24], Shu Cheng et al. [41], Zhang Jingke et al. [27], and Dilisha Ti Yakufu et al. [42]. China’s TSED includes five types as follows: serious underdevelopment, underdevelopment, low-level equilibrium, high-level equilibrium, and overdevelopment. Therefore, differential and targeted region-specific policies should be implemented.
For areas with overdevelopment, it is essential to break the cycle of spatial accumulation and the scale of the agglomeration of resources in order to create a more balanced spatial distribution of resource elements. For example, in cities such as Beijing and Shanghai, constructing urban clusters, relocating non-core functions from large cities, and moderately reducing the land development intensity can force an improvement in economic growth efficiency, facilitating the transition of the economic growth model [43].
In areas with underdevelopment, the main issue stems from inadequate economic and social development momentum, which results in a low demand for land development. Therefore, it is necessary to enhance the development capacity in these regions. Areas such as Sichuan, Yunnan, and Xinjiang could actively undertake the transfer of industries from the eastern regions, strengthen their own economic development, and, while controlling land expansion, force efficiency improvements in order to promote an increase in the land development intensity. Some underdeveloped areas are subject to restrictions and prohibitions; as they are key functional zones, they face a high degree of development constraints. Another regional equilibrium issue concerns the equal distribution of development opportunities. Government regulations significantly impact the non-equilibrium development of national land space. Restricted areas, burdened with tasks such as farmland protection and ecological conservation, lose some development opportunities. In contrast, unrestricted areas can transform land use structures and methods and can increase land revenue, leading to a situation in which regions fall into a “windfall profits-windfall losses” dilemma. Spatial transfer mechanisms such as “land quotas”, “coupling increases and decreases” [44], “ecological compensation” [45], and “enclave development” can be utilized to tap into regional resource endowments, establish regional financial transfer payments, establish connections between areas with overdevelopment and underdevelopment in terms of “land” and “economy”, enhance the economic vitality of underdeveloped regions, bridge the gap between “green mountains and clear waters” and the transformation of “golden mountains and silver mountains”, and transform ecologically advantageous regions into economically advantageous regions, promoting integrated development between regions.
For areas with low-level equilibrium, it is essential to maintain the coordination of the land development intensity and the quantity of the land supply while promoting their comprehensive development through means such as industrial development and ecological construction. For areas with high-level equilibrium, the goal is the long-term sustainability of the equilibrium state.
- (2)
- “Sustainability” and “high quality” are essential elements for territorial spatial development equilibrium
The state of China’s territorial spatial development non-equilibrium has improved, and the TSED has shown an upward trend, with a narrowing regional difference. This conclusion is consistent with the research results of Tan Shukui [13], and differs from the research results of Shi Minqi and Chen Yi [46]; in the latter, this is due to the failure to consider the impact of planning control. Some scholars have measured this development pattern in Fujian Province [21] and the Shenyang Economic Zone [47], providing confirmation at the provincial and municipal levels. This is attributed to the continuous advancement of the strategies such as “Western Development”, “Central Rise”, and “Northeast Revitalization”, especially since the 18th National Congress. With the continuous promotion of strategies such as regional coordinated development, poverty alleviation, and “common prosperity”, the TSED has significantly improved, effectively reducing the regional differences in the TSED. However, the problems of imbalanced and insufficient regional development still exist [3], indirectly indicating the significant gap in the territorial spatial development between the eastern and western regions. It can be seen that China still has a long way to go to achieve territorial spatial development equilibrium. This requires clarification on “What is the territorial spatial development equilibrium?” Most studies [15,21,48] set the equilibrium coefficient from 0 to 1, where 1 represents the optimal equilibrium state. However, they did not consider the limits of development and left room for sustainable development strategies. Singapore proposed the “white land” policy in 1995, and Beijing and Shanghai established a spatial “white space” system in their planning [49]. The concept of leaving space blank is not only about addressing uncertainties; it is also about considering risks and safety [50]. It is evident that spatial “white space” aligns with the goals of high-quality development and sustainable development. Moreover, a highlight of this study is the further subdivision of the equilibrium into high-quality equilibrium and low-level equilibrium. Both belong to the quantitative equilibrium, but only a high-quality equilibrium is considered to be the genuine equilibrium. This aligns with the idea that the transition from quantitative development to qualitative development is the essence of the new development concept in the new era, as emphasized by Deng Xiangzheng et al. [6].
- (3)
- Spatial proximity peer effects serve as an effective catalyst for the promotion of the territorial spatial development equilibrium
In the future, it will be crucial to leverage the spatial proximity peer effects among neighboring provinces, fostering consensus on regional development. In particular, the dominant feature of high–high (HH) indicates that the agglomeration scale effect of spatial factors reduces the cost of factor flow and aggregation between regions, enabling a more efficient combination of regional resources and the promotion of regional coordinated development. Maximizing the clustering advantages of strong alliances is essential to transition the TSED into a high-level equilibrium state. For low–low areas, policy guidance should focus on enhancing industrial service functions, attracting industries and innovative elements from advanced regions. Additionally, it is necessary to avoid the weakening of the development momentum in this area due to the suction effect of adjacent advanced provinces. For the high–low and low–high areas, it is crucial to promote the flow of regional elements through activities such as regional visits, transportation development, and economic trade. The aim is to leverage the radiating driving force of high-value provinces in order to improve low-value provinces, fully exploiting the roles of urban clusters and centrally polarized cities in leading regional balanced development. Furthermore, it is essential to understand that non-equilibrium is widespread, and efforts should be made to promote a relative equilibrium in the course of development. Significantly, regions with LH aggregation types are mainly distributed in the grain-producing areas of the northeastern provinces, such as Jilin and Liaoning, as well as in the central provinces, including Henan and Anhui. These regions, burdened with heavy responsibilities for farmland protection and strong regulatory constraints, face challenges in forming effective interactions with surrounding provinces. It is suggested that such regions should receive policy guidance and resource allocation support from the national level in order to unlock their development potential.
Author Contributions
Conceptualization, A.M.; methodology, A.M. and Y.G.; formal analysis, Y.G. and W.Z.; investigation, W.Z.; resources, A.M.; data curation, Y.G.; writing—original draft preparation, A.M., Y.G., and W.Z.; writing—review and editing, A.M., Y.G., and W.Z.; visualization, Y.G.; supervision, A.M.; project administration, A.M.; funding acquisition, A.M. All authors have read and agreed to the published version of the manuscript.
Funding
Ministry of Education Humanities and Social Sciences Project (Approval No. 20YJA790051).
Data Availability Statement
The original contributions presented in the study are included in the article; further inquiries can be directed to the corresponding author.
Acknowledgments
The authors are grateful to the anonymous reviewers for their comments and suggestions which contributed to the further improvement of this paper.
Conflicts of Interest
The authors declare no conflicts of interest.
Note
| 1 | For the categorization of low and high levels of balance, the reference is made to the average levels of LD (Land Development) and LS (Land Supply) over the 15 years from 2006 to 2020. A region is considered to have a high level of balance only if both LD and LS are above the respective means. |
References
- Zhang, Y.Z.; Zhang, J.L.; Cheng, Y.; Run, J.L. Study on the meaning of space balance and condition assessment from the perspective of supply and demand driven—A case of shandong province. Soft Sci. 2016, 30, 54–58. [Google Scholar]
- Song, J.K. The theory of “dual wheel spillover drive” for achieving balanced development of resource space and its carrying capacity coefficient value. Urban Obs. 2012, 3, 172–181. [Google Scholar]
- Kalim, S. The us economy, global imbalances and recent development: A critical review. İstanbul İktisat Derg. 2019, 69, 175–205. [Google Scholar]
- Hu, Q.Y.; Wang, X.B.; Shen, W.C.; Zhang, Z.F. Study on the balanced development of territorial space functions in urban agglomerations: Taking beijing-tianjin-hebei region as an example. China Land Sci. 2023, 37, 53–65. [Google Scholar]
- Lin, J.Y.; Deng, M.J.; Li, W. The spatial policy choices for coordinated regional development in China. Explor. Econ. Issues 2020, 8, 11–21. [Google Scholar]
- Deng, X.Z.; Liang, L.; Wu, F.; Wang, Z.B.; He, S.J. Chinese balanced regional development strategy from the perspective of development geography. Acta Geogr. Sin. 2021, 76, 261–276. [Google Scholar]
- Sun, Z.Y.; Hou, Y.Z. Multi-perspective observation and policy response to regional unbalanced development in China. J. Manag. World 2019, 35, 1–8. [Google Scholar]
- Yang, K.Z. Research on changes in regional economic differences in China. Econ. Res. J. 1994, 12, 28–35. [Google Scholar]
- Dagum, C. A new approach to the decomposition of the Gini income inequality ratio. Empir. Econ. 1997, 22, 515–531. [Google Scholar] [CrossRef]
- Zhou, R.X.; Jin, J.L.; Cui, Y.; Ning, S.W.; Zhou, L.G.; Zhang, L.B.; Wu, C.G.; Zhou, Y.L. Spatial equilibrium evaluation of regional water resources carrying capacity based on dynamic weight method and Dagum Gini Coefficient. Front. Earth Sci. 2022, 9, 790349. [Google Scholar] [CrossRef]
- Wang, G.; Li, S.J.; Ma, Q.F. Spatial equilibrium and pattern evolution characteristics of ecological civilization construction efficiency in China. J. Geogr. 2018, 73, 2198–2209. [Google Scholar]
- Chen, W.; Sun, W.; Zhao, H.X. Spatial imbalance models and status evaluation of regional development: A case study of jiangsu province. J. Geogr. 2010, 65, 1209–1217. [Google Scholar]
- Cheng, Y.; Ren, J.L.; Hou, C.G.; Ren, M. Definition and status evaluation of spatial equilibrium in coastal ecological regions: A case study of the efficient ecological economic zone in the yellow river delta. Geogr. Sci. 2017, 37, 83–91. [Google Scholar]
- Jing, B.; Li, T.S.; Qi, H.; Zhu, Y.P. Research on the equilibrium state and spatial control of human land relationship in Qinba Mountain area based on supply-demand matching model. Resour. Environ. Yangtze River Basin 2020, 29, 654–667. [Google Scholar]
- Tan, S.K.; Liu, Q.; Li, Y.N. Analysis of spatiotemporal characteristics of land use spatial equilibrium in China. Chin. Land Sci. 2017, 31, 40–46. [Google Scholar]
- Yang, Q.K.; Wang, L.; Li, Y.L.; Qin, X.H. Land use spatial equilibrium from the perspective of supply and demand matching: A case study of Jiangsu Province. Resour. Sci. 2021, 43, 932–943. [Google Scholar] [CrossRef]
- Hong, H.K.; Liao, H.P.; Li, T.; Yang, J.; Xie, D.T. Analysis of spatiotemporal evolution of rural spatial functions based on entropy method and Dagum Gini coefficient decomposition. J. Agric. Eng. 2016, 32, 240–248. [Google Scholar]
- LV, X.; Huang, X.J. Spatial equilibrium analysis of county construction land expansion: A case study of tongzhou, jiangsu. Geogr. Geogr. Inf. Sci. 2015, 31, 53–59. [Google Scholar]
- Zhu, R.M.; Chen, S.L. Study on spatiotemporal differentiation and driving forces of land use spatial equilibrium in Fujian Province. J. Shanxi Norm. Univ. (Nat. Sci. Ed.) 2021, 35, 96–105. [Google Scholar]
- Yu, G.M.; Li, M.X.; Tu, Z.F.; Yu, Q.W.; Jie, Y.; Xu, L.L.; Dang, Y.F.; Chen, X.X. Conjugated evolution of regional social-ecological system driven by land use and land cover change. Ecol. Indic. 2018, 89, 213–226. [Google Scholar] [CrossRef]
- Gao, Q.; Fang, C.L.; Liu, H.M.; Zhang, L.F. Conjugate evaluation of sustainable carrying capacity of urban agglomeration and multi- scenario policy regulation. Sci. Total Environ. 2021, 785, 147373. [Google Scholar] [CrossRef]
- Yang, Q.K.; Duan, X.J.; Jin, Z.F.; Wang, L.; Wang, Y.F. The spatiotemporal differentiation and impact mechanism of urban land development intensity in the Yangtze River Delta region. Resour. Sci. 2020, 42, 723–734. [Google Scholar]
- Zhou, B.Z.; Bao, H.S.; Peng, B.Z. Evaluation of land resource development intensity in the yangtze river delta region. Geogr. Sci. 2000, 3, 218–223. [Google Scholar]
- Zhao, Y.L.; Liu, Y.Z. Research on differences and influencing factors of urban land development intensity: Based on panel data of 222 cities at or above the prefecture level. Resour. Sci. 2013, 35, 380–387. [Google Scholar]
- Ma, A.H.; Tang, P. Spatial spillover of cultivated land protection and regional financial transfer under planning regulation: An empirical study based on sichuan province. Yangtze River Basin Resour. Environ. 2020, 29, 776–784. [Google Scholar]
- Zhou, M.; Kuang, B.; Tao, X.F. Evolution characteristics of urban land development intensity in China from the perspective of spatial convergence. Econ. Geogr. 2018, 38, 98–103+122. [Google Scholar]
- Zhang, J.K.; Chen, Y.; Huang, X.J. Research on the Equilibrium and Limit Evaluation of Land Development in the Yangtze River Economic Belt. Resour. Environ. Yangtze River Basin 2017, 26, 1945–1953. [Google Scholar]
- Wu, D.F.; Hu, Y.; Liu, Y.Y.; Liu, Y.H. Coordination analysis of urban development intensity and resource environment carrying capacity: A case study of the pearl river delta. J. Nat. Resour. 2020, 35, 82–94. [Google Scholar]
- Jin, G.; Chen, K.; Wang, P.; Guo, B.S.; Dong, Y.; Yang, J. Trade-offs in land-use competition and sustainable land development in the North China Plain. Technol. Forecast. Soc. Chang. 2019, 141, 36–46. [Google Scholar] [CrossRef]
- Lu, Z. Hierarchy of higher education, technological progress, and high quality economic development. Stat. Decis. Mak. 2023, 39, 115–119. [Google Scholar]
- Huang, L.X.; Han, J.; Ai, P.; Chen, Z. Land Market, Fiscal Pressure, and Economic Growth: An Empirical Analysis Based on Provincial Panel VAR. China Land Sci. 2020, 34, 85–94. [Google Scholar]
- Lin, J.P.; Cao, X.Q.; Zhang, Y.H. Factors influencing the level of urban municipal infrastructure in China and its non-equilibrium: A framework based on urban stratification analysis. Geogr. Sci. 2021, 41, 562–570. [Google Scholar]
- Xiao, L.; Liang, J.X.; Lu, Y.N.; Zhang, Z.W. Regional Differences and Distribution Evolution of Infrastructure Level in Chinese Urban Agglomerations. Stat. Decis. Mak. 2023, 39, 47–52. [Google Scholar]
- Li, X.; Wang, W.N. Urban Public Service Level, Land Supply Elasticity, and Housing Prices: Empirical Evidence from Nanjing City. Econ. Manag. Res. 2012, 9, 48–57. [Google Scholar]
- Wan, J.X.; Hao, B.J.; Li, M.Y.; Liu, J.Z. Research on the Relationship between Basic Public Service Level and Economic Development Level in China. Sci. Decis. Mak. 2023, 2, 43–60. [Google Scholar]
- Ke, N.; Lu, X.H.; Kuang, B.; Han, J. Regional differences and influencing factors of green and low-carbon utilization of arable land in China under carbon neutrality goals. China Land Sci. 2021, 35, 67–76. [Google Scholar]
- Liu, S.C.; Ye, Y.M.; Xiao, W. Research on spatiotemporal differentiation of urban land use efficiency in China based on stochastic frontier analysis. China Land Sci. 2020, 34, 61–69. [Google Scholar]
- Ru, S.F.; Zhou, Z.K. The net effect of policies in the 20 years of western development and high-quality economic development in the western region: A test based on propensity score matching and double difference method. J. Shaanxi Norm. Univ. (Philos. Soc. Sci. Ed.) 2019, 48, 63–75. [Google Scholar]
- Hu, H.Y.; Yao, C.; Hu, S.T. Evaluation of the Effect of Regional Coordinated Development Strategy in the New Era: An Empirical Study Based on the Central China Rise Strategy. Ind. Technol. Econ. 2019, 38, 154–160. [Google Scholar]
- Yang, T.Y.; Rong, Y.F. Can Regional Development Strategy Promote Economic Growth-Taking the Strategy of Revitalizing the Old Industrial Base in Northeast China as an Example. Econ. Theory Manag. 2017, 10, 88–99. [Google Scholar]
- Shu, C.; Xu, B. Measurement and causal analysis of land development heterogeneity in urban areas of China. Econ. Geogr. 2018, 38, 190–196. [Google Scholar]
- Dilishati, Y.; Xia, F.Z. Spatial characteristics and influencing factors and mechanisms of land development intensity based on ESDA-GWR: A case study of Hebei Province. Resour. Ind. 2018, 20, 28–38. [Google Scholar]
- Li, X.; Ma, X.D.; Xiao, C.J. Research on the Path and Governance Strategy of Uneven Expansion of Urban Land in China. Hum. Geogr. 2016, 31, 83–88+144. [Google Scholar]
- Peng, M.X.; Huang, H.M. A study on the extended application of “increase and decrease link between urban and rural construction land” in territorial planning: From the perspective of transfer of land development rights. City Plan. Rev. 2021, 45, 24–32. [Google Scholar]
- Nie, X.; Li, X.J.; Lyu, C.Y.; Su, Y.L.; Wang, H. Can ecological compensation based on the transfer of development rights (TDR) improve ecosystem service value? A multi-scenario simulation. Land Use Policy 2024, 138, 107024. [Google Scholar] [CrossRef]
- Huang, X.J.; Chen, Y.; Zhao, Y.T.; Shi, M.Q.; Li, T.S. Research on Optimizing the Spatial Development Pattern of the Yellow River Basin: Based on the Perspective of Land Development Intensity. Geogr. Res. 2021, 40, 1554–1564. [Google Scholar]
- Wei, S.Y.; Ju, X.; Xun, W.H. Study on the spatiotemporal coupling relationship between regional land development intensity and resource and environmental carrying capacity: A case study of Shenyang Economic Zone. China Land Sci. 2018, 32, 58–65. [Google Scholar]
- Chen, Y.; Huang, X.J.; Chen, Z.G.; Ma, Q.F.; Zhang, L. Evaluation of Spatial Equilibrium of Construction Land Development in Various Provinces of China. Geogr. Sci. 2012, 32, 1424–1429. [Google Scholar]
- Yang, H.; He, D.H. Discussion on the strategy of leaving blank spaces in the overall planning of national land space: A case study of Zengcheng District. Guangzhou Plan. 2020, 36, 78–82. [Google Scholar]
- Cai, W.M.; Zhang, Y.C. A Study on the Selection of Village “Blank” Land Based on the Theory of “Reverse Planning”-Taking Hongshuizhuang Village in Tianjin City as an Example. China Land Sci. 2020, 34, 34–43. [Google Scholar]

Disclaimer/Publisher’s Note: The statements, opinions and data contained in all publications are solely those of the individual author(s) and contributor(s) and not of MDPI and/or the editor(s). MDPI and/or the editor(s) disclaim responsibility for any injury to people or property resulting from any ideas, methods, instructions or products referred to in the content. |
© 2024 by the authors. Licensee MDPI, Basel, Switzerland. This article is an open access article distributed under the terms and conditions of the Creative Commons Attribution (CC BY) license (https://creativecommons.org/licenses/by/4.0/).