Abstract
Mountain cities with complex topographies have always been highly vulnerable areas to global environmental change, prone to geological hazards, climate change, and human activities. Exploring and analyzing the vulnerability of coupling systems in mountain cities is highly important for improving regional resilience and promoting sustainable regional development. Therefore, a comprehensive framework for assessing the spatial vulnerability of mountain cities is proposed. A vulnerability assessment index system is constructed using three functional systems, ecological protection, agricultural production, and urban construction. Subsequently, the BP neural network and the genetic algorithm (GA) are combined to establish a vulnerability assessment model, and geographically weighted regression (GWR) is introduced to analyze the spatial influence of one-dimensional systems on the coupling system. Linzhou, a typical mountain city at the boundary between China’s second- and third-step terrains, was selected as a case study to demonstrate the feasibility of the framework. The results showed that the vulnerability of the ecological protection system was highly aggregated in the east–central region, that of the agricultural production system was high in the west, and that of the urban construction system was low in the central region and high in the northwestern region. The coupling system vulnerability was characterized by multispatial distribution. The complex topography and geomorphology and the resulting natural hazards are the underlying causes of the vulnerability results. The impact of ecological and urban systems on the coupling system vulnerability is more prominent. The proposed framework can serve as a reference for vulnerability assessments of other similar mountain cities with stepped topographies to support the formulation of sustainable development strategies.
1. Introduction
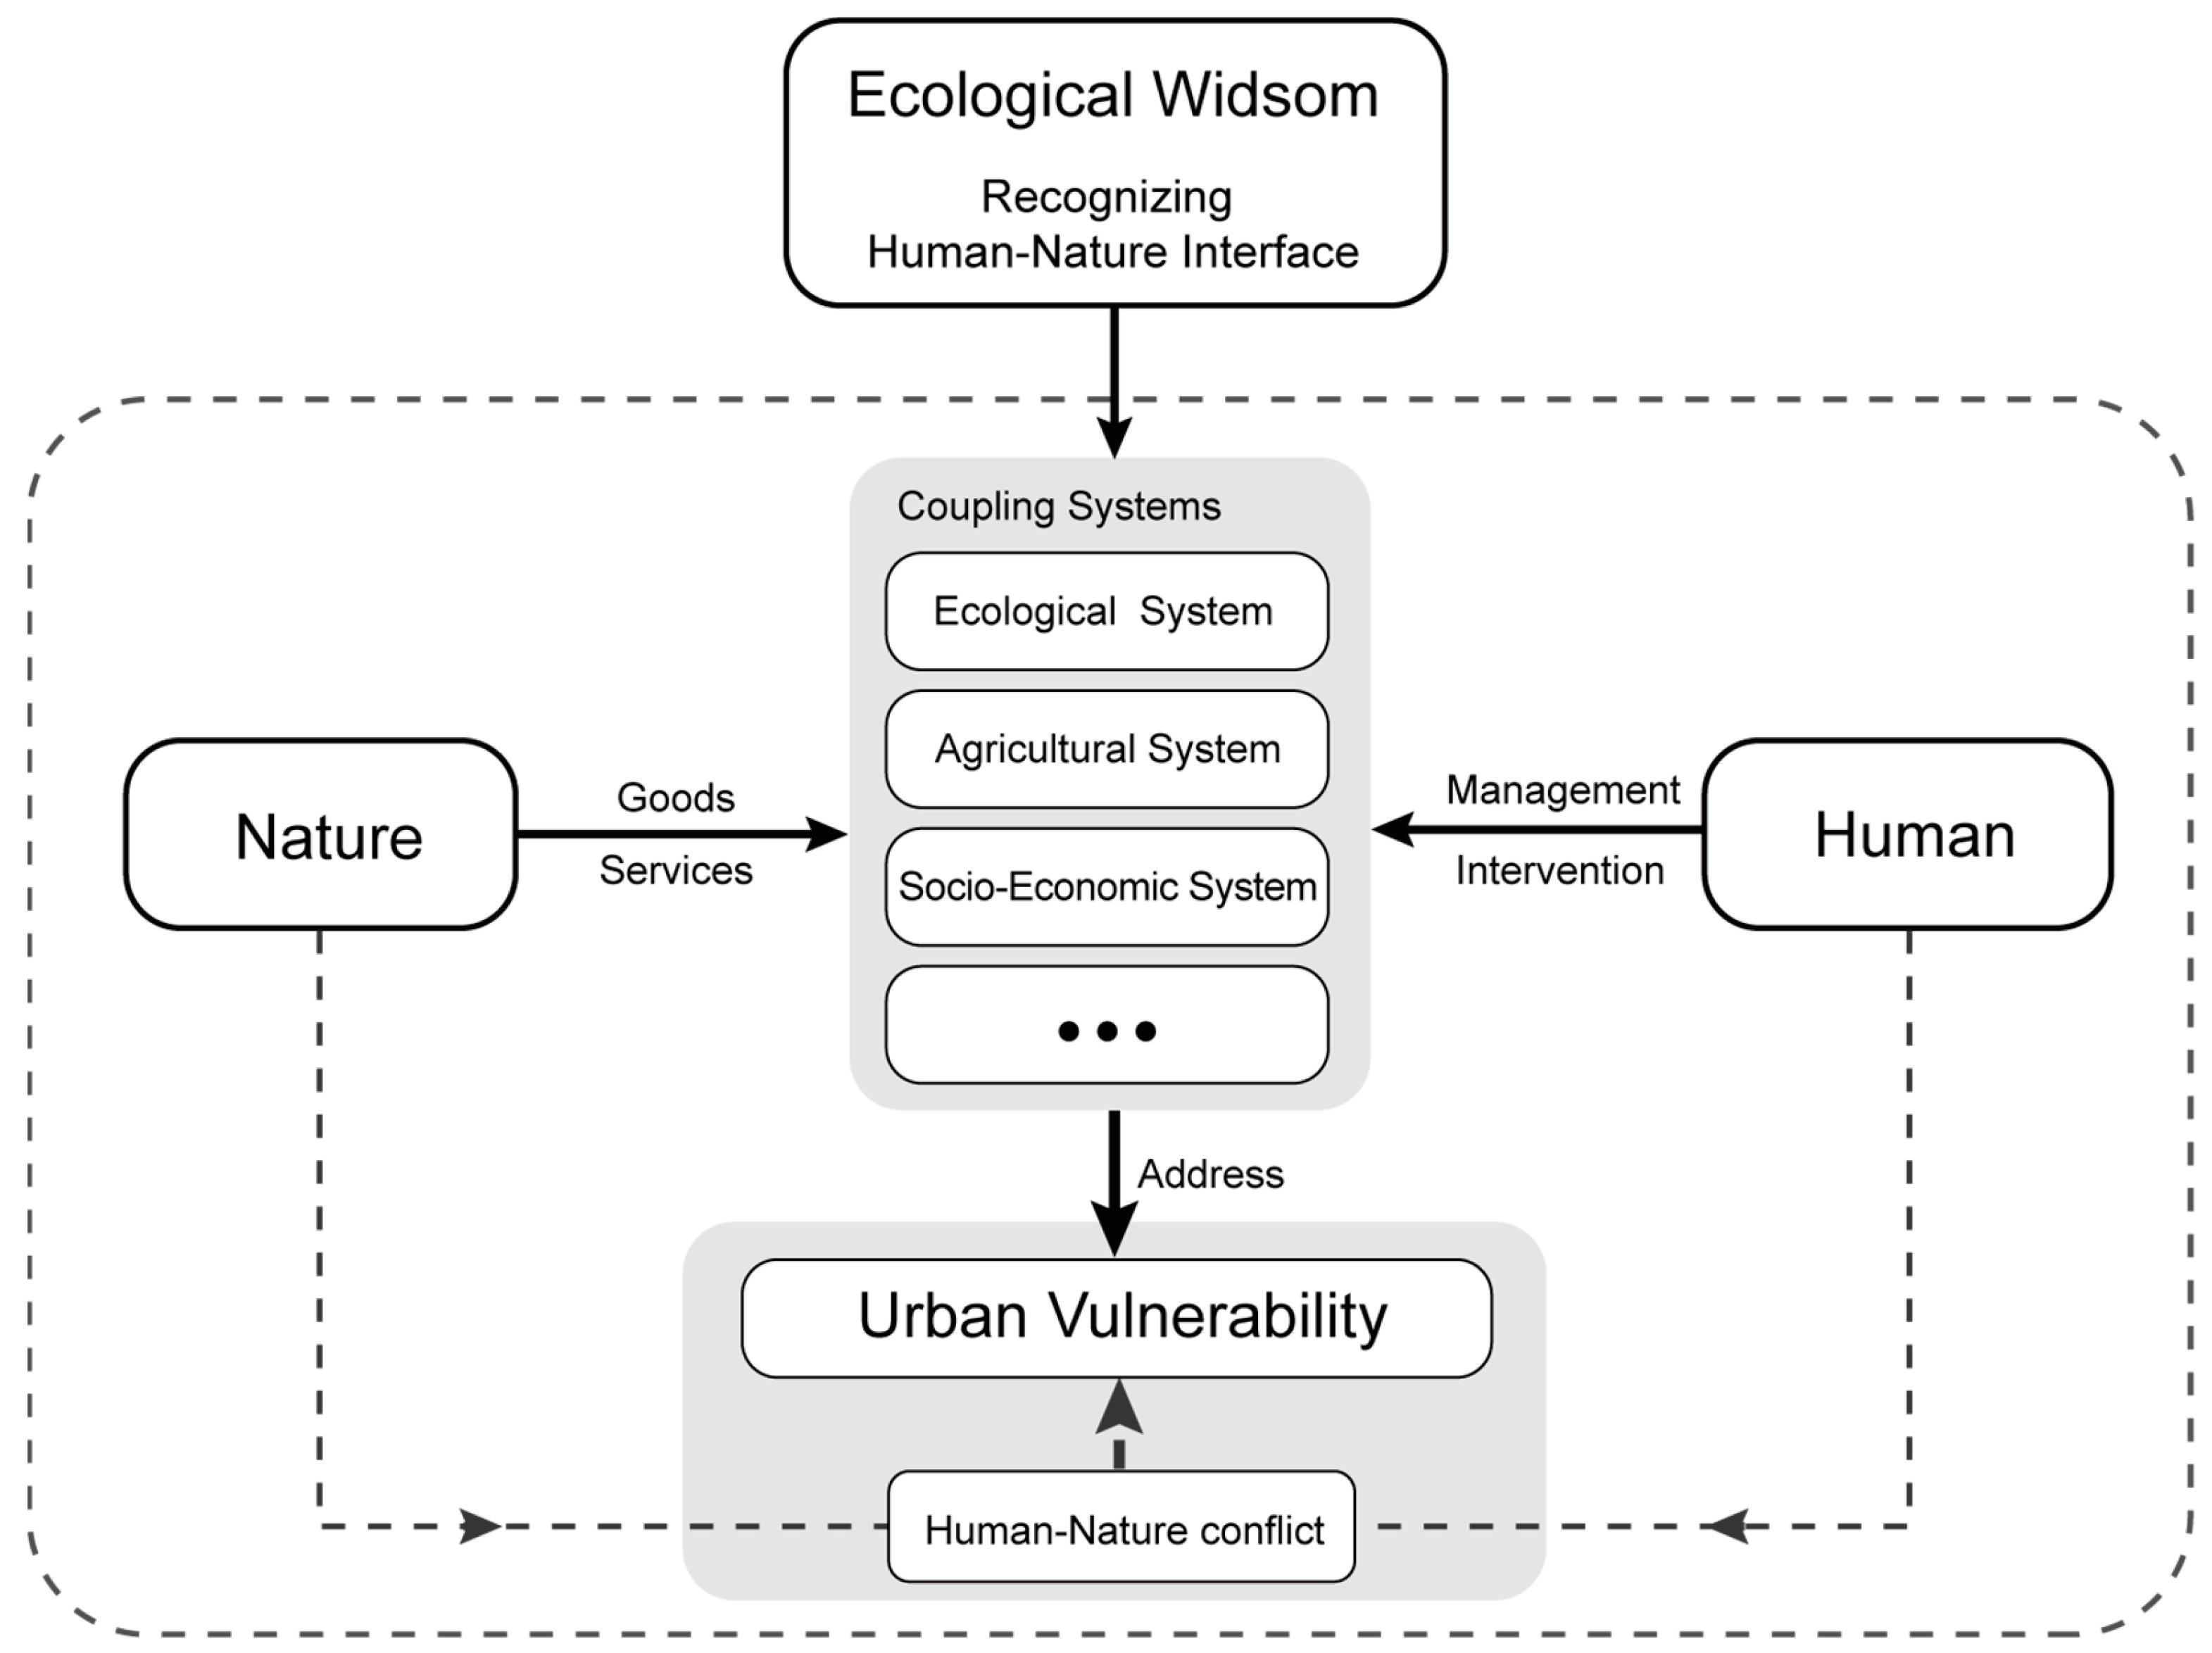
In recent years, population growth and urbanization have caused rapid changes in the global environment, triggering a series of extreme events such as ecological degradation, sea-level rise, and frequent geological disasters [1,2]. The intensification of human–nature conflict has made vulnerability one of the key issues in global environmental change and sustainable development [3,4,5]. As an important part of the ecosystem, humans are not in a dualistic perspective with nature [6]. Human society relies on the goods and services from natural ecosystems to maintain development, and nature, once tapped for goods and services, depends on human management and intervention to sustain functionality [7,8]. Cities are coupled systems of humans and nature, where the internalized ecosystems, agricultural systems, and socioeconomic systems are described as ontologically coupled. This ontology gives rise to ecological wisdom [9,10]. The ecological wisdom emphasizes a comprehensive consideration of factors such as resources, environment, economy, and society, balancing the integrity of the natural environment with human needs [6,11]. Hence, exploring the coupling system vulnerability from the perspective of ecological wisdom is an effective approach to promoting urban sustainable development (Figure 1).

Figure 1.
Conceptual framework for vulnerability research.
Vulnerability is usually defined as the degree to which a system or subsystem is likely to experience harm due to exposure to stress [12,13]. Existing vulnerability research has shifted focus from single-dimensional systems to coupling systems [14,15,16,17,18]. This is in line with Ecological Wisdom’s emphasis on integrating interdisciplinary knowledge from ecology, disaster science, and sociology, combined with regional characteristics [6,19]. For example, Darabi et al. (2019) evaluated the ecological vulnerability of the Chelgard mountainous landscape from ecological, socioeconomic, and human activity dimensions, developing a framework for balanced ecological and social development [20]. Villegas-González et al. (2017) assessed Colombia’s vulnerability based on environmental–urban–economic–political–societal perspective and developed an information decision-making platform for natural and social risks [21]. Nan et al. (2022) incorporated factors such as nature, economy, society, and resources into the VSD model to assess the vulnerability of Yan’an City [22]. Researchers combined regional characteristics with multi-dimensional indicators to evaluate vulnerability, demonstrating the core impact of ecological wisdom in developing vulnerability frameworks and adaptive management strategies. However, research on the coupling system vulnerability has mostly focused on coastal regions and mega cities in plains, with insufficient attention given to mountain cities. Restricted by a stepped geomorphic pattern, mountain cities exhibit more prominent human–nature conflicts, such as fragile ecological environments, frequent occurrences of high-risk disasters, and social poverty [23,24]. As typical human–nature coupled systems, mountain cities have composite spatial functions covering ecological protection, agricultural production, and urban construction, with nonlinear characteristics. Addressing the different spatial system contradictions of ecological degradation, farmland encroachment, and poor urban infrastructure in mountainous cities is a focal point of the vulnerability study.
In terms of assessment methods, vulnerability assessment models mainly use multicriteria decision analysis [21], analytic hierarchy processes [25,26], entropy methods [27], the TOPSIS method [28], and other traditional mathematical methods. Traditional mathematical methods can only provide a general derivation of nonlinear factors influencing vulnerability. The calculation is complicated and slow. The BP neural network has been gradually applied to assess vulnerability because of its nonlinear mapping ability and parallel processing mechanism [29]. For example, Zhao et al. (2019) trained a standard BP neural network to predict the critical points of Cambodia’s national vulnerability index, demonstrating the BP neural network’s effectiveness [30]. Xu et al. (2023) applied a BP neural network with multiple inputs and one output to assess the vulnerability of immovable cultural relics in Henan Province [31]. Xia and Zhai (2023) employed particle swarm to optimize three BP neural networks to assess Shenzhen’s vulnerability, concluding that the optimized neural network outperformed the standard BP neural network [18]. Researchers have improved the applicability of BP neural networks in vulnerability assessment by adjusting parameters and introducing optimization algorithms. However, for large-scale, nonlinear mountainous spatial data, the fast convergence often leads to local optimization. Existing optimization algorithms require multiple neural networks dealing with multiple inputs and outputs in parallel, which is less efficient. To enhance the accuracy and efficiency of BP neural networks, the genetic algorithm has been applied to optimize BP neural networks. This algorithm has been widely applied in various fields [32], such as option pricing [33], coal mine safety assessment [34], and water resource safety assessment [35]. In this study, we innovatively apply the GA-BP neural network to vulnerability assessment, increasing data input and using the genetic algorithm to optimize the BP neural network with double hidden layers, thereby improving model generalization.
This study aims to achieve the following objectives: (1) Discuss the spatial vulnerability of mountain cities from the perspectives of the three systems of ecological protection, agricultural production, and urban construction to establish a vulnerability index system of exposure–sensitivity–adaptive capacity. (2) Apply the GA-BP neural network model to assess vulnerability. (3) Apply GWR to interpret the spatial influence of one-dimensional systems on coupling system vulnerability. Then, we propose strategies to reduce vulnerability for the sustainable development of Linzhou.
2. Materials and Methods
2.1. Spatial Vulnerability Assessment Framework
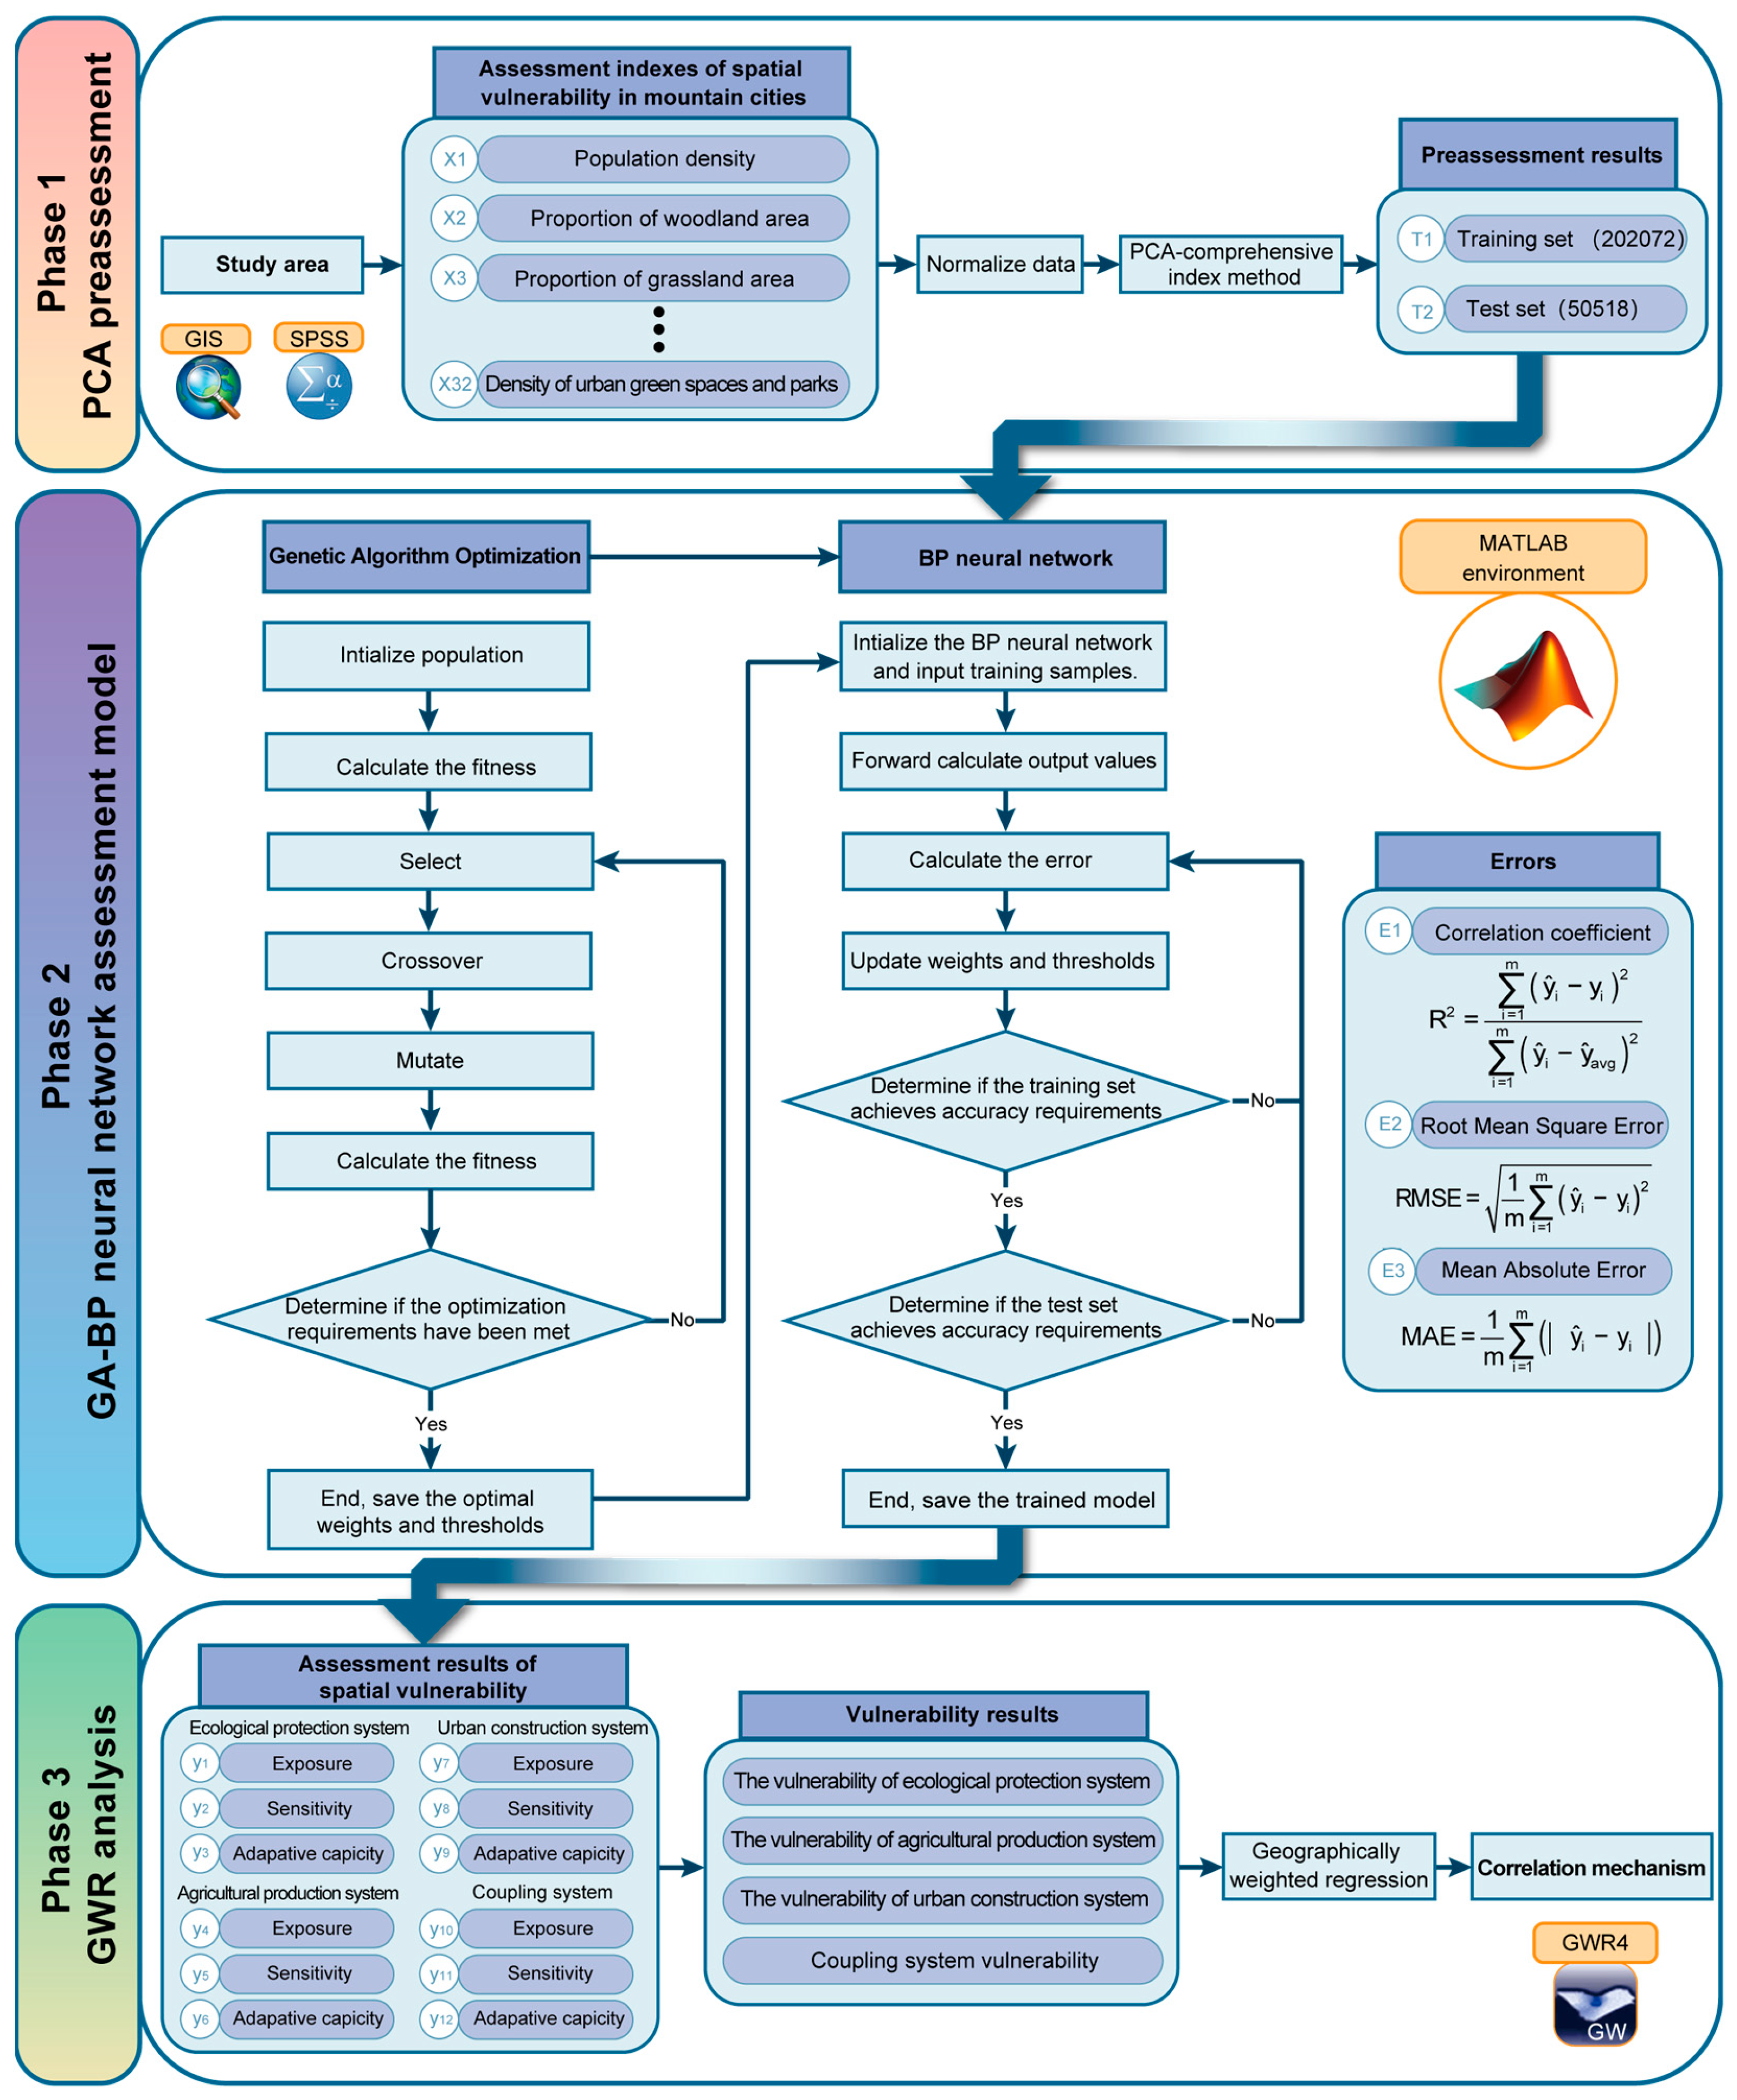
The research framework included the following steps (Figure 2): (1) PCA preassessment phase. Linzhou was selected as the study area, and a spatial vulnerability index system was constructed. The principal component analysis (PCA)–comprehensive index method was applied for preassessment. (2) GA-BP neural network assessment phase. The preassessment results were utilized to train both the BP neural network and GA-BP neural network to conduct assessment testing. By comparing the performance and error of the two models, the neural network with superior performance and accuracy was selected to build the vulnerability assessment model. (3) GWR analysis phase. GWR was used to analyze the spatial influence of one-dimensional systems on coupling system vulnerability.
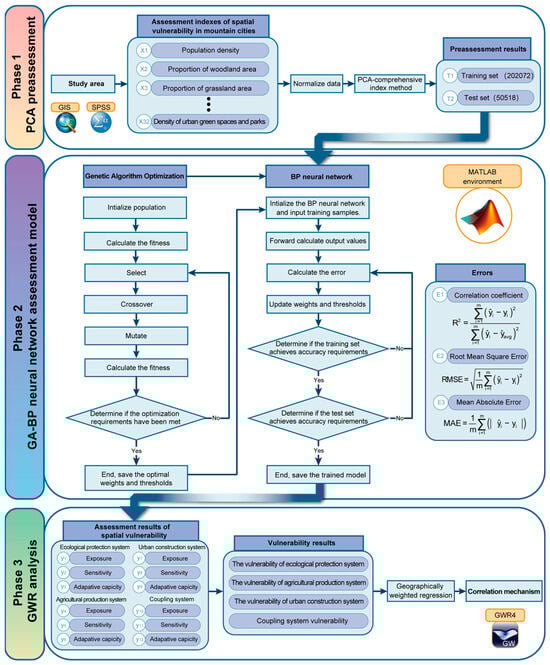
Figure 2.
Spatial vulnerability assessment framework.
2.2. Study Area
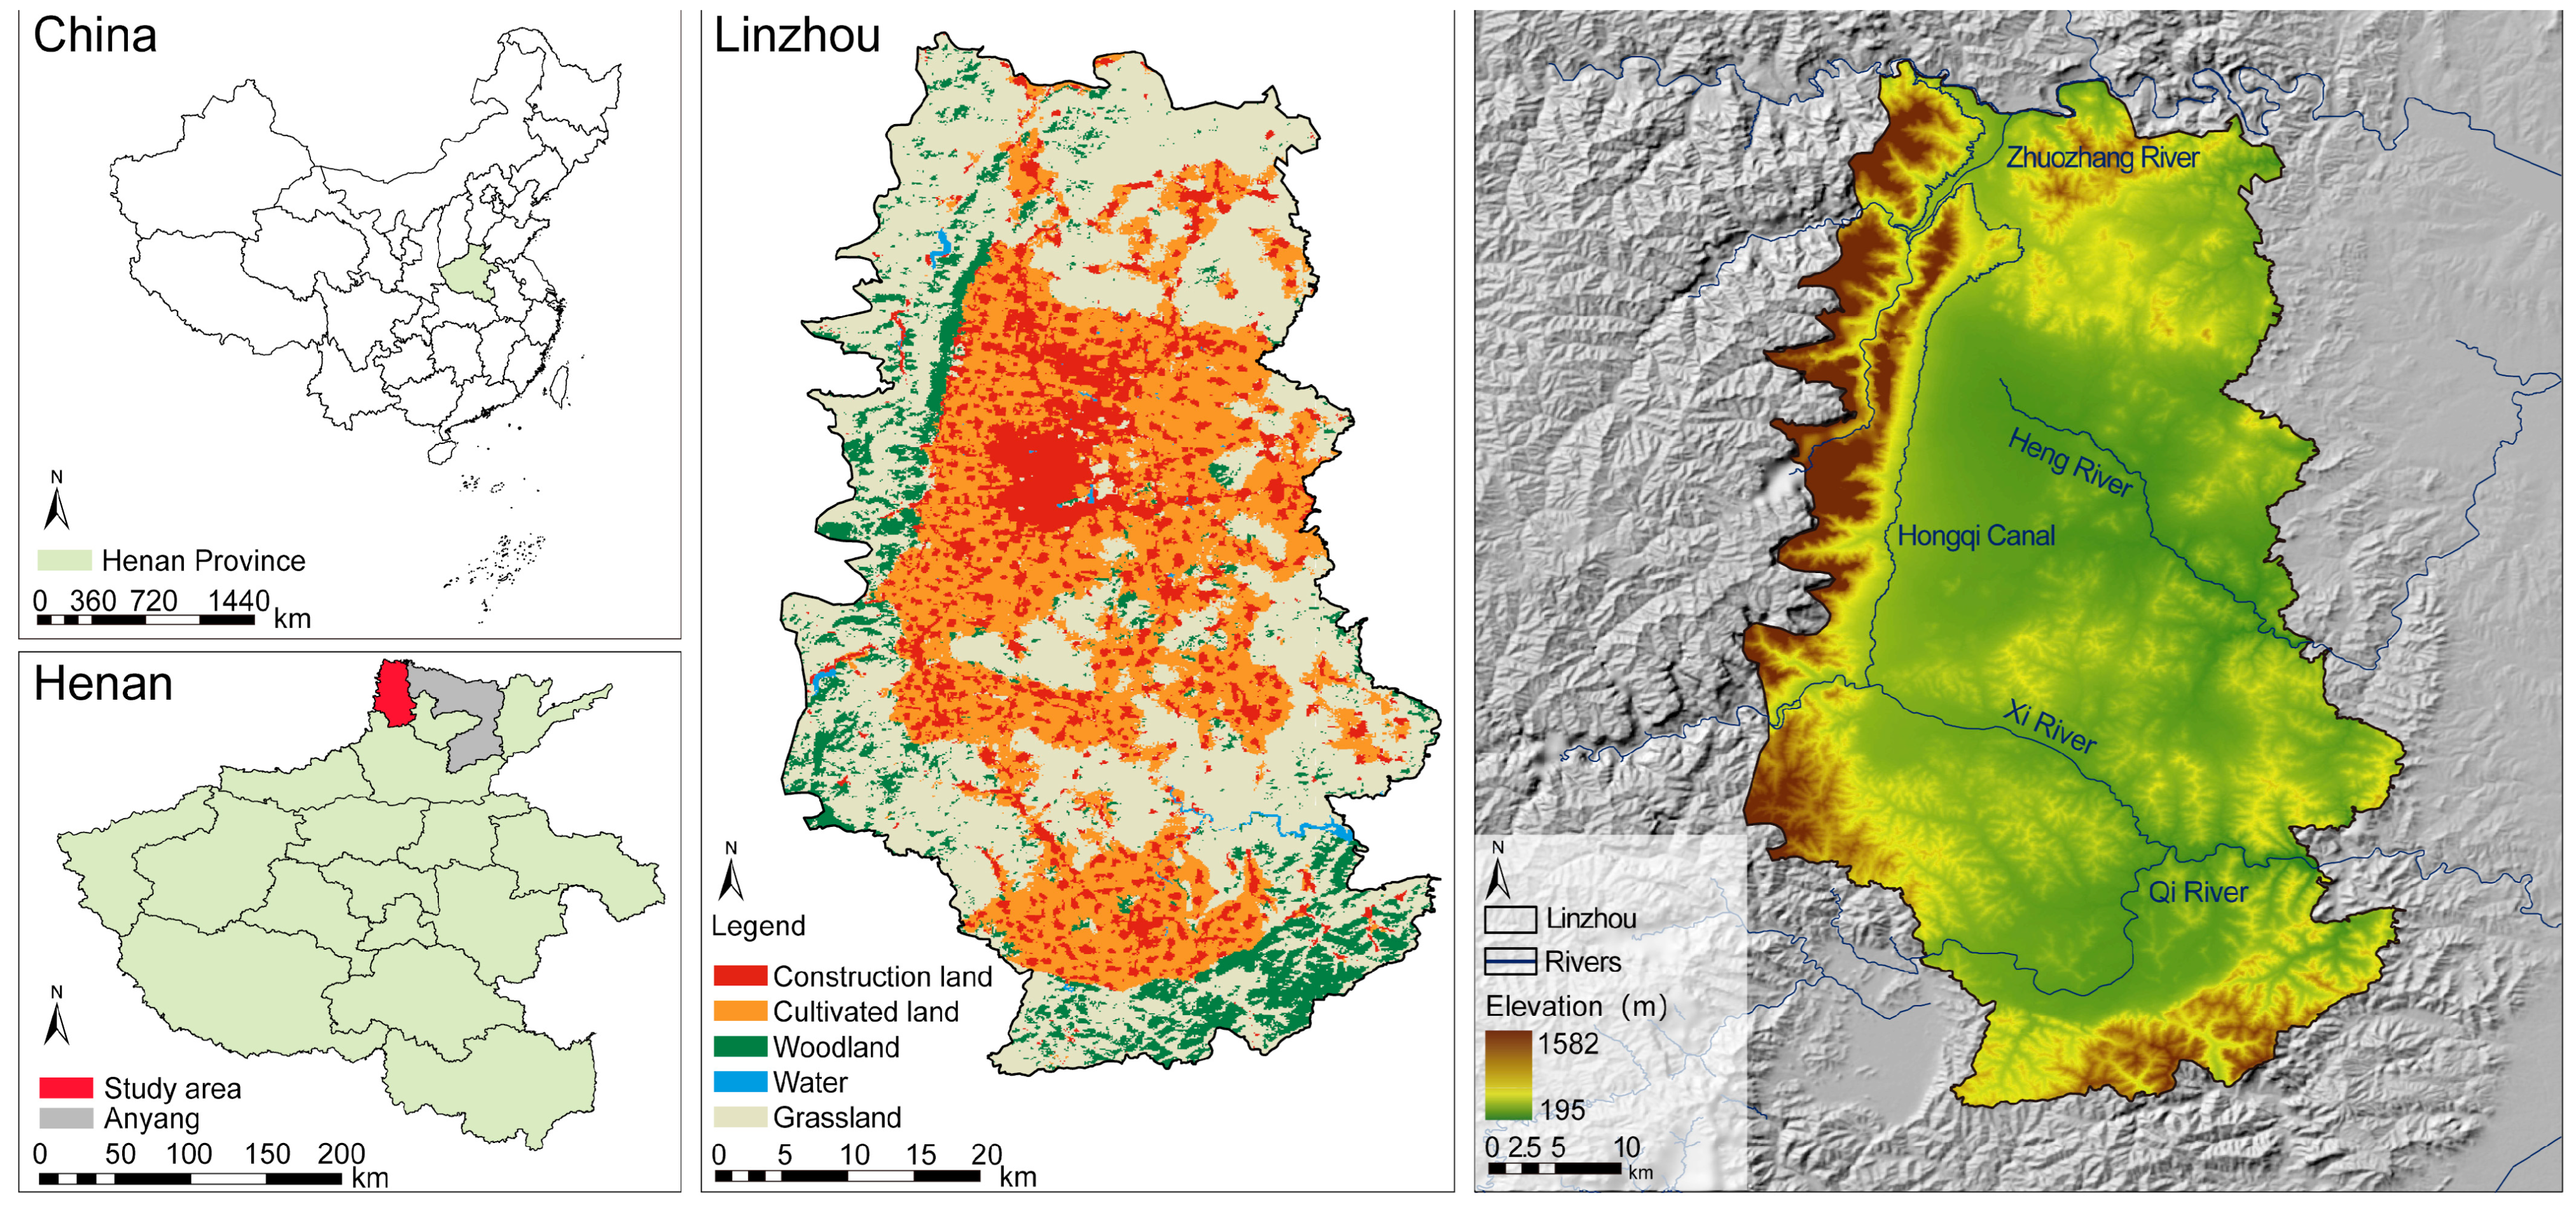
Linzhou (35°40′ N~36°21′ N, 113°37′ E~114°51′ E) is in the eastern foothills of the Taihang Mountains in the northwestern part of Henan Province, China (Figure 3). This city has a total area of 2046 km2 and is a mountain city with a high population density in China. Located on the North China Seismic Belt at the boundary between China’s second- and third-step terrains, Linzhou has a wide distribution of mountains, hills, and basins, with an overall topography that is high in the west and low in the east. The highest elevation in the west reaches 1582 m, and the topography, including slopes greater than 20°, accounts for 17.85% of the total area, making it susceptible to geologic hazards, such as landslides, ground collapse, and mudslides. In recent years, the continuous expansion of urban space has led to ecosystem degradation and increases in steep slope cultivation, deforestation, and grass destruction, thus severely damaging natural resources. The quantity and quality of cultivated land are declining, while the proportion of cultivated land on slopes and of medium and low quality is relatively high, which restricts agricultural development in Linzhou. This situation presents a conflict between the ecological space, agricultural space, and urban space [36]. To address these issues, we assessed and analyzed Linzhou’s vulnerability.
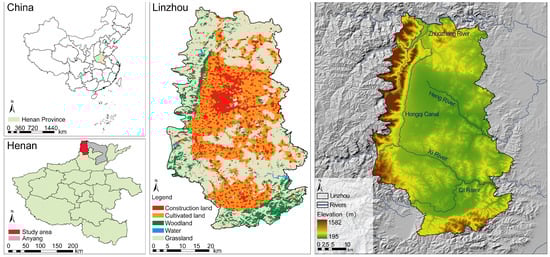
Figure 3.
Study area.
2.3. Index System and the Data Sources
2.3.1. Index System
The vulnerability quantification consists of three components, namely, exposure, sensitivity, and adaptive capacity [37,38]. Linzhou includes three spatial functions according to the way it is developed, protected, and used: ecological protection, agricultural production, and urban construction [36]. We defined the ecological protection system, agricultural production system, and urban construction system as one-dimensional systems for vulnerability research, and all three together constitute the coupling system. A total of 32 indicators (Table 1) for exposure, sensitivity, and adaptive capacity were used to assess the vulnerability of the one-dimensional systems and coupling system in mountain cities.

Table 1.
Index system.
- Exposure index
Exposure has been defined as the frequency, intensity, and scale of the systems subjected to stressors such as the natural environment and human society (Table A1); the greater the exposure is, the greater the vulnerability of the system [39,40]. The selection of the exposure index mostly considers natural environmental pressure, such as mountain disasters, and social environmental pressure, such as human activities. In the ecosystem, population density [14,41], the proportion of woodland and grassland areas [42], and the land-use degree [43] were selected to characterize the pressures on natural resources and ecological quality caused by human activities. In the agricultural system, considering that agricultural production is more susceptible to disturbances caused by climate change, the intensity of extreme rainfall [15] was selected to characterize waterlogging stress on agricultural production, and the proportion of cultivated land [44] was selected to characterize the pressure of farmland encroachment. In the urban system, the hidden danger of geological collapse, the hidden danger of landslides, and the hidden danger of mudflows [45] were selected to characterize the pressures on urban construction caused by mountain disasters, and nighttime light intensity [46] and the proportion of construction land [16] were selected to characterize the intensity and scale of socioeconomic activities, increasing the urban vulnerability.
- 2.
- Sensitivity index
Sensitivity, defined as the degree of sensitivity and resistance to external pressures according to internal characteristics, mainly depends on the stability of the system structure (Table A1); an increase in sensitivity increases system vulnerability [47]. With respect to the ecosystem, the aridity index [14], soil erosion intensity [48], and normalized difference vegetation index [42] were selected to characterize the ecosystem in terms of climate, soil, and vegetation, reflecting the likelihood of ecosystems being disrupted by external pressures. In the agricultural system, annual average precipitation, annual average temperature [49], slope, and distance from a water source [50] were selected to characterize the stability of mountainous agricultural production in terms of climate, topography, and water source, and farmland production potential [15] was selected to reflect the production stability of existing farmland. In the urban system, elevation, topographic undulation [16], and the rate of natural population increase [21,51] were selected to describe the stability of urban geography and population change.
- 3.
- Adaptive capacity index
Adaptive capacity is defined as the ability of systems to adapt and deal with stresses and recover from emergencies (Table A1), and an increase in adaptive capacity reduces system vulnerability [39,52]. In the ecosystem, we selected soil conservation [53], biodiversity [54], water conservation, and the climate regulation value [43], reflecting the ecosystem’s ability to control soil erosion, maintain biodiversity, and regulate climate anomalies, which can improve ecosystem adaptation to existing and potential stresses. In the agricultural system, the agricultural workforce [15] and total power of agricultural machinery [49] were selected to characterize human and physical capital inputs, improving adaptive capacity to climate change. In the urban system, we chose socioeconomic indicators such as road density [41], density of educational facilities, density of medical institutions, and density of urban green spaces and parks [55]. These indicators demonstrate the distribution of social resources and basic services, reflecting measures taken by people to improve urban adaptive capacity.
2.3.2. Data Sources
Linzhou’s digital elevation model (DEM) was obtained from the Geospatial Data Cloud (https://www.gscloud.cn/, accessed on 2 January 2024). The slope and topographic undulation were extracted from the DEM data. The land use data were obtained from Sentinel-2 imagery (https://livingatlas.arcgis.com/landcoverexplorer/, accessed on 2 January 2024). The population density, soil erosion intensity, normalized difference vegetation index, climate regulation value, annual average precipitation, annual average temperature, water source, farmland productivity potential, geologic disaster site, and infrastructure data were all provided by the Resource and Environment Science and Data Center of the Chinese Academy of Sciences (https://www.resdc.cn/, accessed on 2 January 2024). Biodiversity, soil conservation, water conservation, and extreme rainfall data were obtained from the Institute of Mountain Hazards and Environment, Chinese Academy of Sciences (http://imde.cas.cn/, accessed on 2 January 2024). Nighttime light data were obtained from LJ1-01 (http://59.175.109.173:8888/app/login.html, accessed on 2 January 2024). Socioeconomic data such as agricultural workforce, agricultural machinery power, and population data were obtained from the Anyang Statistical Yearbook. To ensure consistency in data calculation, the whole area of Linzhou was quantified at a resolution of 90 m × 90 m, resulting in a total of 252,590 rasters. Combining the index system of 32 indicators, all the data were uniformly resampled to this resolution on the ArcGIS 10.8 platform (Figure A1), creating a data matrix of 32 × 252,590 for training the GA-BP neural network model and visualization of results.
2.4. Research Method
2.4.1. PCA Preassessment
Before training the GA-BP neural network, principal component analysis (PCA) was used to determine the indicator weights. Combining indicator weights to assess the exposure, sensitivity, and adaptive capacity, the vulnerability values of the one-dimensional and coupling systems were determined. The training and test samples’ construction was completed at a ratio of 8:2. In the PCA algorithm, the applicability of the data was ensured by the Kaiser–Meyer–Olkin (KMO) test (Table A2). The exposure, sensitivity, and adaptive capacity are calculated based on Formula (1). The vulnerability value is calculated based on Formula (2) [15,44].
where , , and represent the vulnerability, exposure, sensitivity, and adaptability indices, respectively; is the dimensionless value of each indicator after min–max normalization; is the weight value of the indicator; and is the index of the indicator.
2.4.2. GA-BP Neural Network Assessment Model
- 1.
- Principle of the BP neural network (BP)
The BP neural network is a multilayer feedforward neural network with a structure consisting of an input layer, hidden layers, and an output layer. The number of hidden layer neurons is calculated by Formula (3). The operating principles of the BP neural network include the forward propagation of the data and error back propagation. In forward propagation, the input data are provided through the input layer and are calculated layer by layer to obtain the output. The output value of the output layer is determined by Formula (4). In back propagation, the BP neural network compares the output with the expected output , measures the error, and iteratively adjusts the parameters to minimize this error [59,60].
where , , and represent the input layer neurons, output layer neurons, and hidden layer neurons, respectively, and is a constant in [0, 10]. and are the first and second hidden layer output values, respectively; is the output layer output value; and are the hidden layer weight and threshold, respectively; and are the output layer weight and threshold, respectively; is the hidden layer activation function; and is the output layer activation function.
- 2.
- Principle of the genetic algorithm (GA)
The BP neural network is prone to falling into local optima due to its random initial weights and thresholds. To address this issue, the genetic algorithm was applied to optimize the initial weights and thresholds. The GA is an efficient global optimization search algorithm, including various processes, such as initialization, selection, crossover, and mutation [33].
- 3.
- Network construction
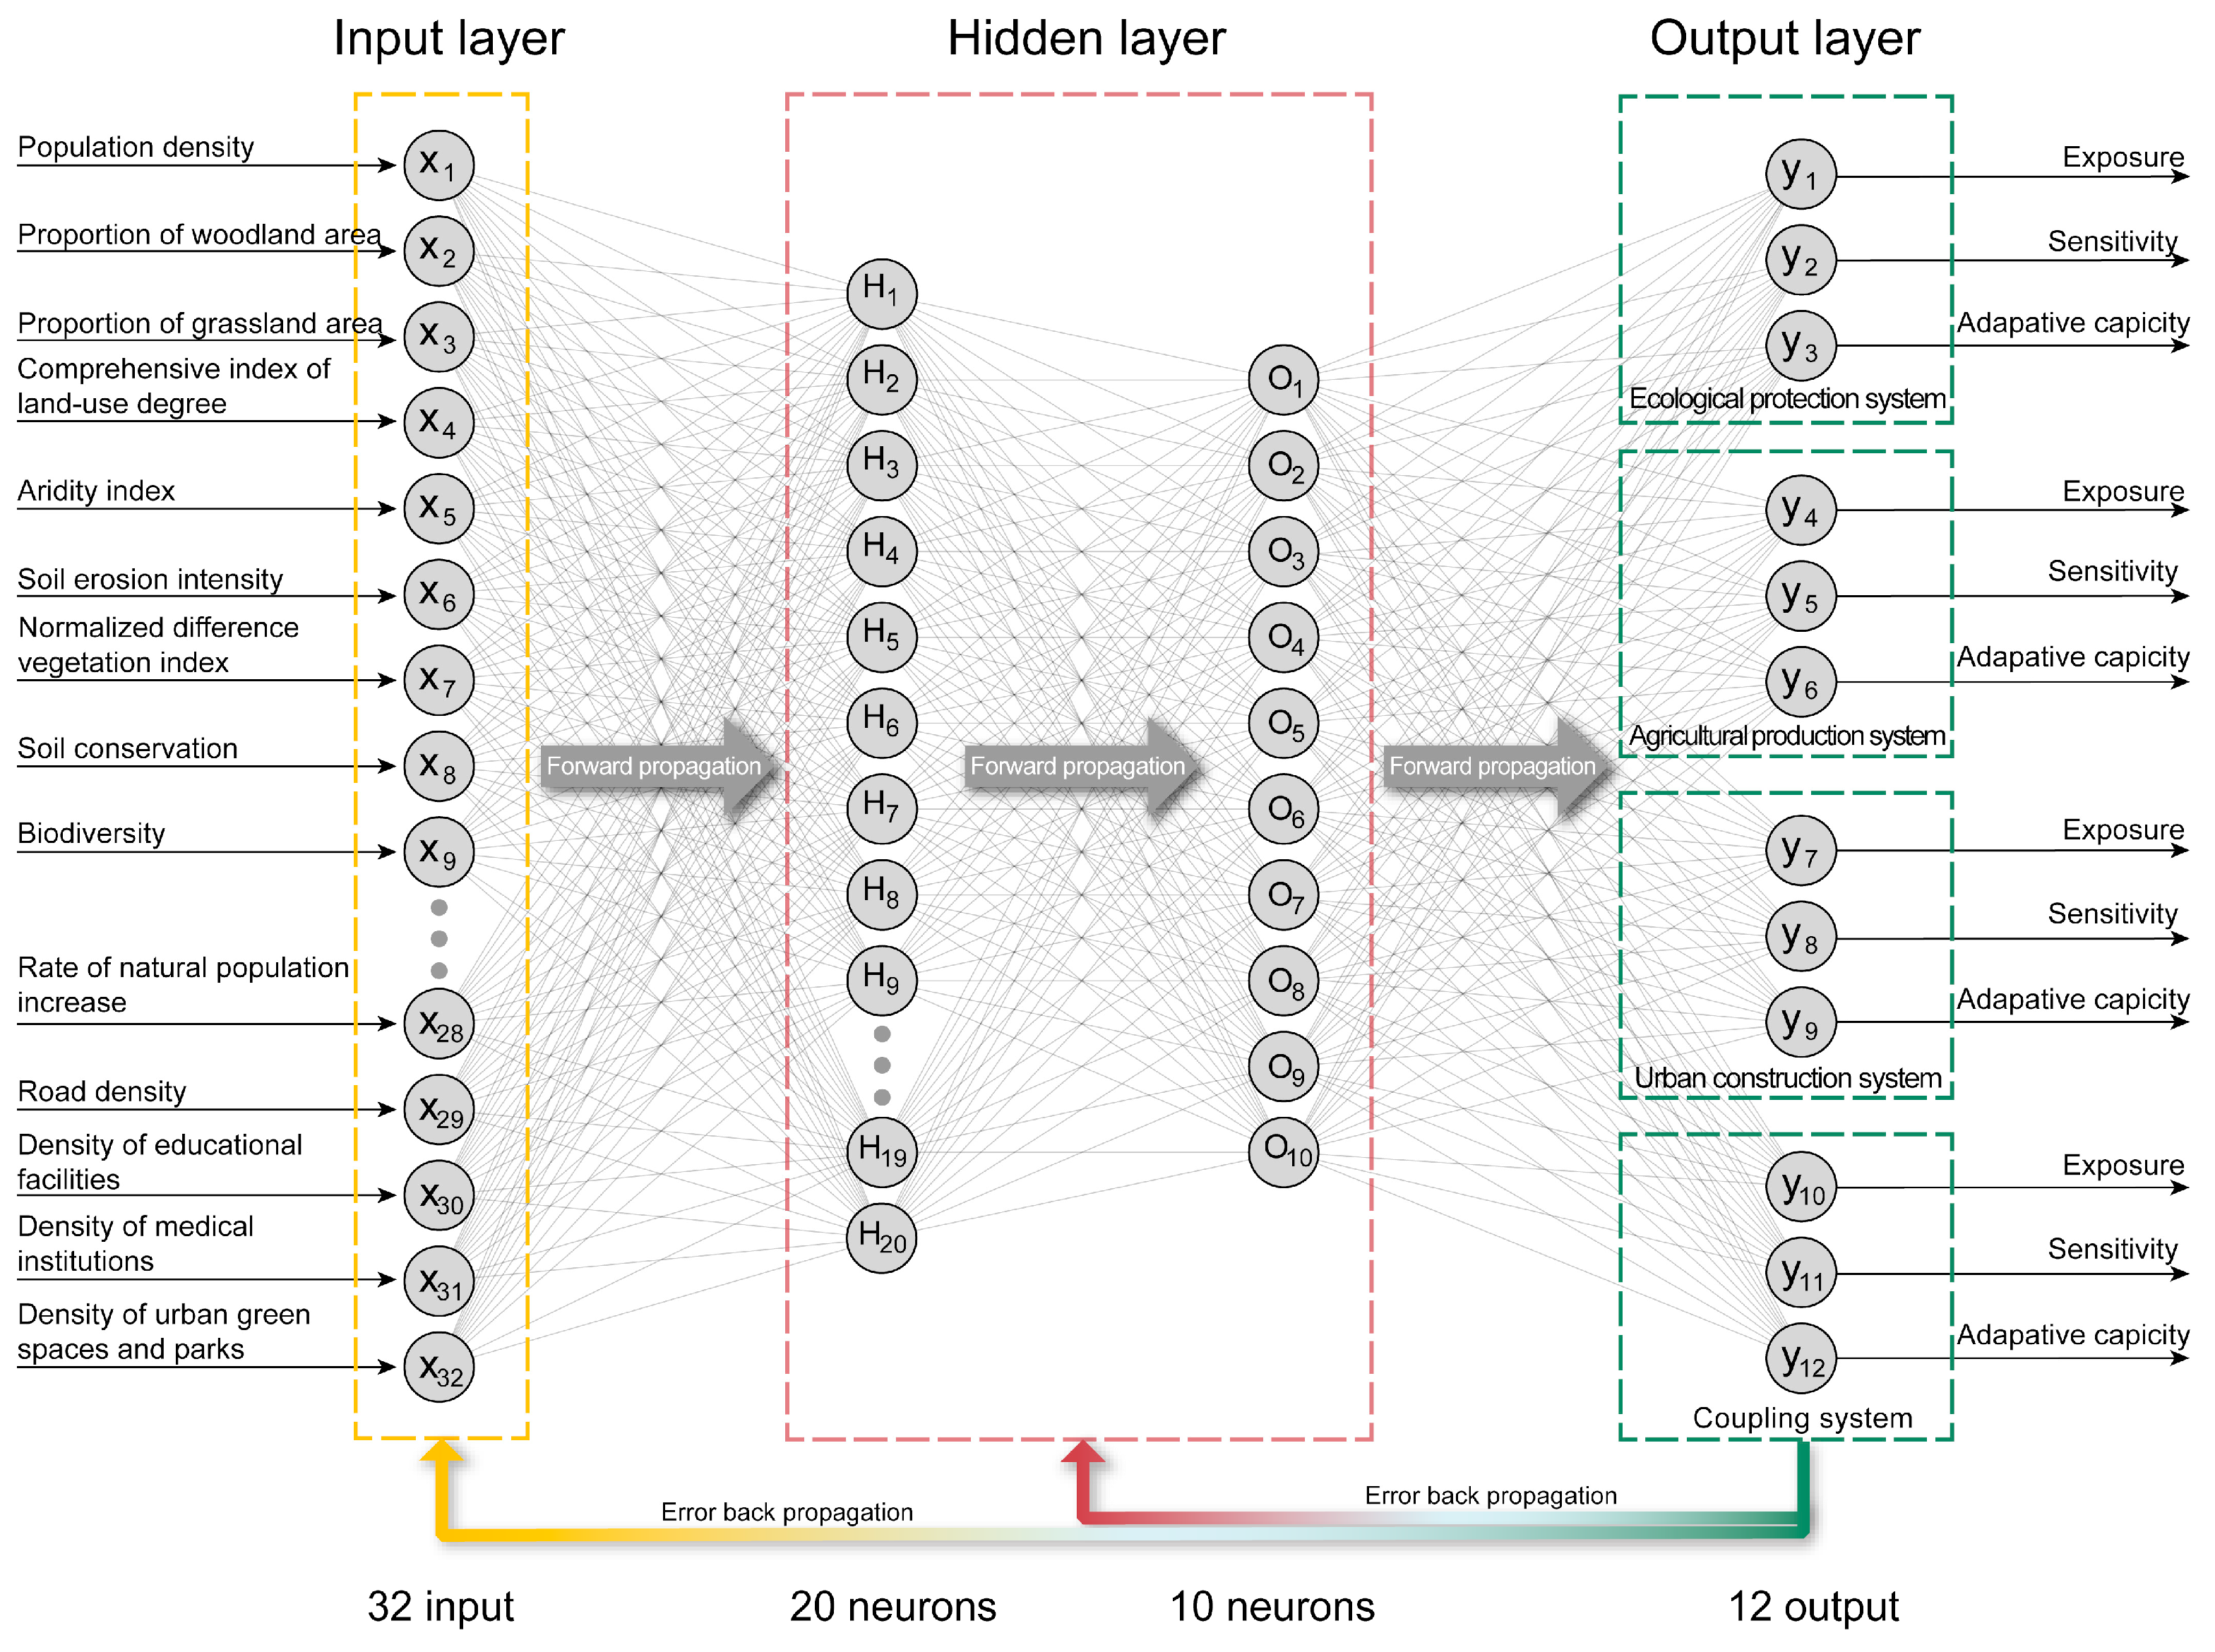
We constructed a four-layer BP neural network (Figure 4) on the MATLAB R2022b platform. There are 32 indicators in the spatial vulnerability assessment system, so the input layer has 32 input nodes. The vulnerability results are measured by the exposure, sensitivity, and adaptive capacity of the one-dimensional systems and coupling system, so the output layer has 12 nodes. Through trial and error, we determined that the first hidden layer has 20 nodes and the second hidden layer has 10 nodes [61]. Parameters such as weights, thresholds, learning rate, target error, maximum number of iterations, and activation functions were initialized and set randomly, then adjusted during the optimization and training process.

Figure 4.
BP neural network structure.
- 4.
- Optimization process
Following the finalization of the BP neural network structure, the GA was used to optimize the initial weights and thresholds. Firstly, the population was initialized. We set the number of genetic generations to 100 and the population size to 50. Secondly, we established the individual fitness formula (5). The GA then generated new generations of population by selection, crossover, and mutation and selected individuals with higher fitness, until the optimal weights and thresholds were found. When the crossover probability was set to 0.2 and the mutation probability was set to 0.1, the genetic algorithm searched for the individual with the highest fitness, determining the optimal weights and thresholds.
where is the individual fitness value, is the number of training samples, is the training result of sample , and is the preassessment value of sample .
- 5.
- Training process
We substituted the GA-optimized weights and thresholds into the BP neural network and trained the GA-BP neural network with 202,072 training samples. At the beginning of forward propagation, the loss of the model was high, and the error between the output values and the preassessment results was large. Through the back propagation of the error, the parameters were constantly adjusted. When the learning rate was set to 0.05, the target error was set to 1 × 10⁻⁴, the maximum number of iterations was set to 20,000, the activation functions of the hidden layer and output layer were selected as the “trainlm” and “purelin” functions, respectively, and the model met the target error. Then, to prevent overfitting, 50,518 testing samples were input into the trained GA-BP neural network. When there was no significant difference between the error of the test set and the error of the training set, the model not only had high accuracy but also good generalizability. Finally, all 252,590 sets of data were input into the trained model, and the spatial vulnerability results in Linzhou were obtained.
2.4.3. GWR Analysis
We applied GWR to identify the spatial influence of one-dimensional systems on the coupling system. As the geographic location changes, the regression coefficients can reflect the degree of influence between the variables [62]. GWR is tested by the goodness of fit R2 and p-value. To ensure the effectiveness of the GWR analysis, the vulnerability results of the one-dimensional systems and coupling system were expanded to 1000 m × 1000 m on the ArcGIS 10.8 platform. The GWR formula is as follows:
where is the coupling system vulnerability value of each sample point , is the one-dimensional system vulnerability value of each sample point , denotes the number of variables, are the coordinates, is the intercept, and is the regression coefficient.
3. Results
3.1. Accuracy Verification
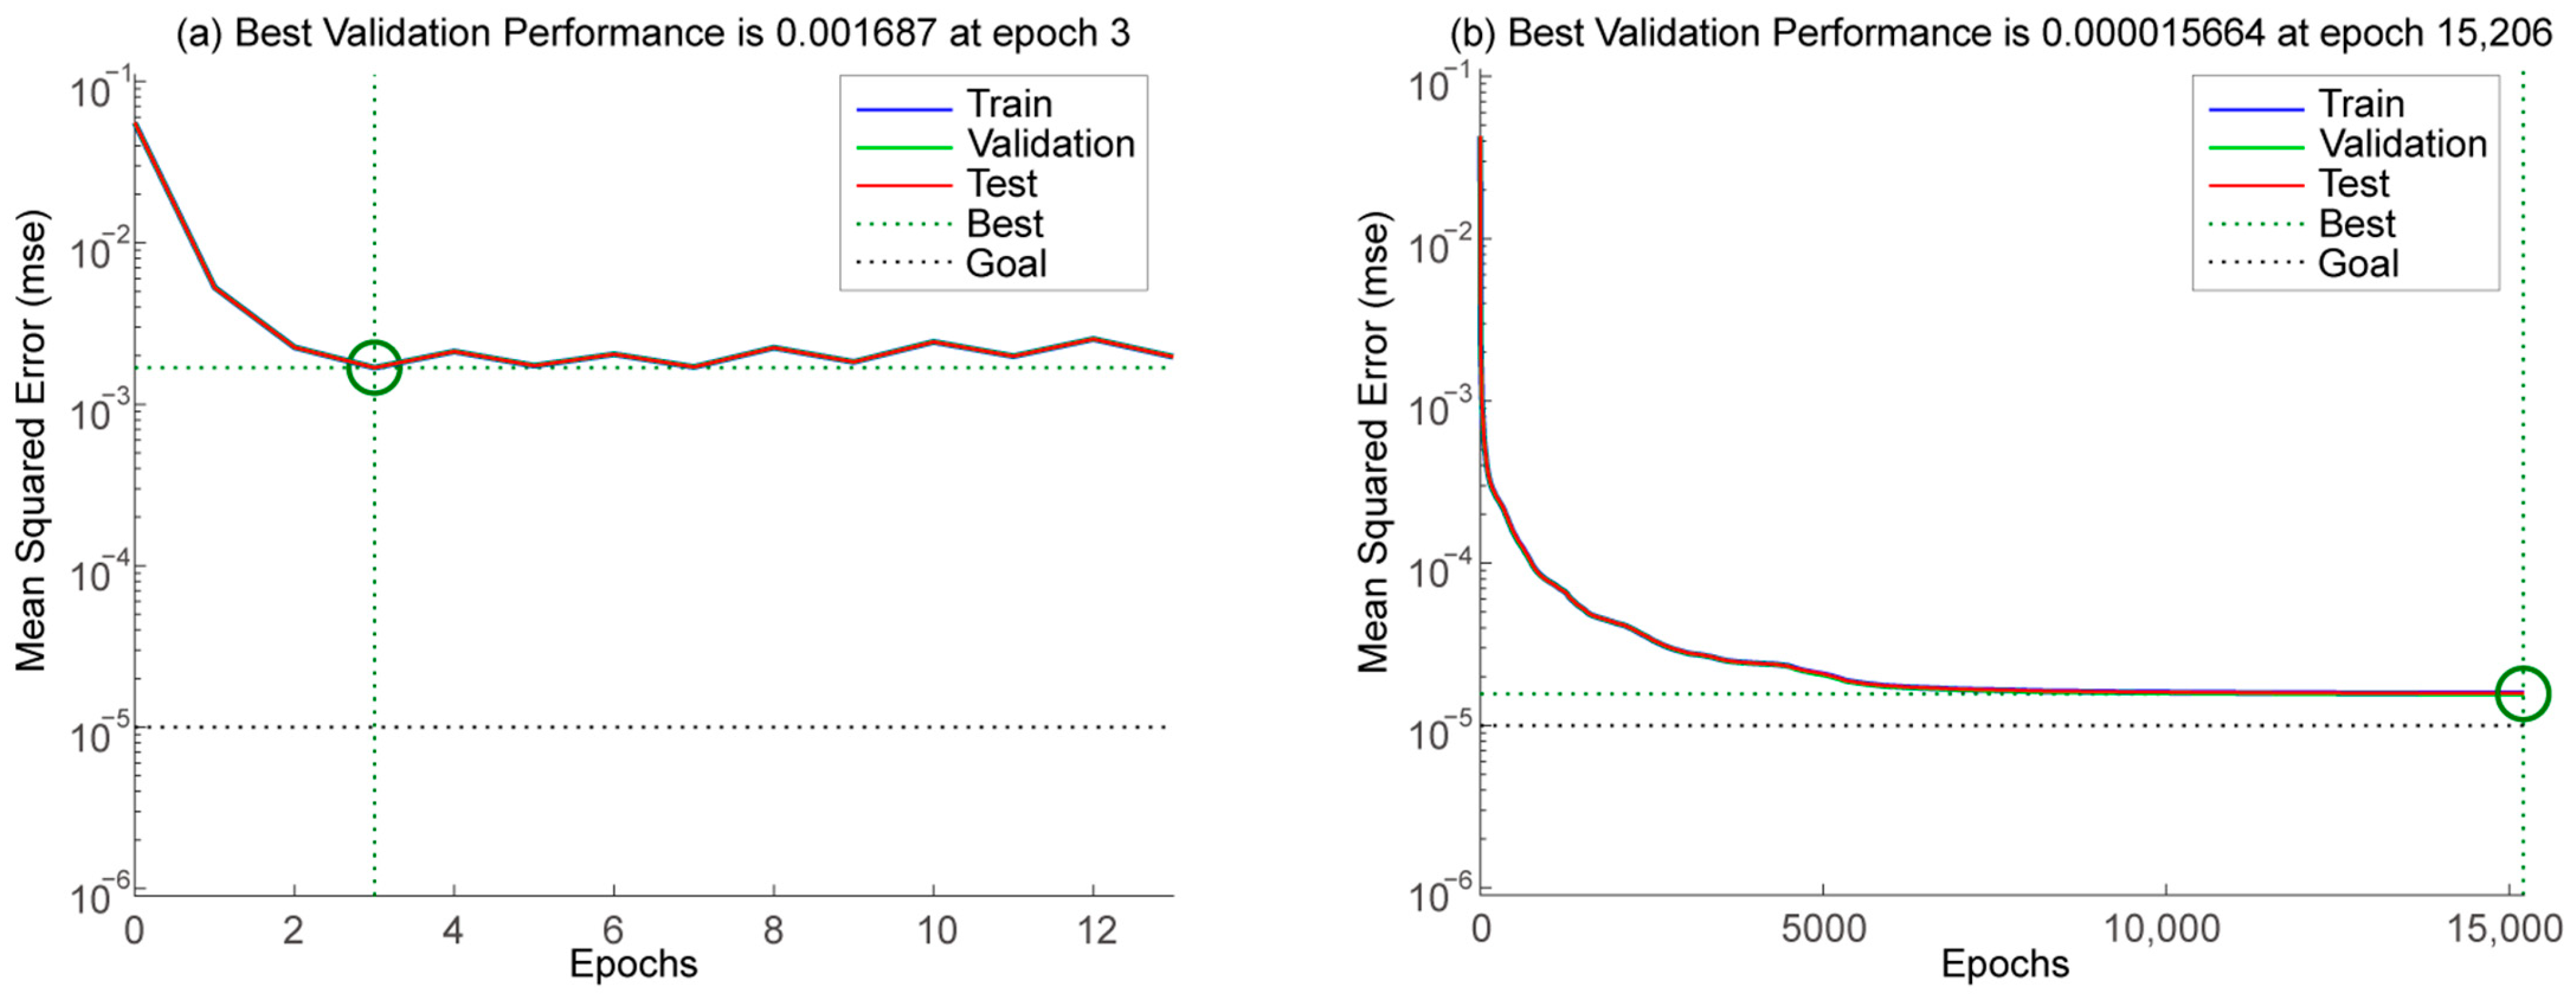
To better reflect the model’s accuracy, we input the training data into both the GA-BP neural network model and the BP neural network model to conduct assessment testing. The performance plot was used to compare the error convergence ability of the GA-BP neural network and BP neural network in the process of finding the optimal solution, where the vertical coordinate represents the mean square error and the horizontal coordinate represents the number of iterations. Figure 5a shows that the BP neural network frequently fell into the local optimum during the gradient descent process, resulting in a significant gap between the optimal solution and the goal. Figure 5b illustrates that the GA-BP neural network had a more stable gradient descent performance, lower mean square error, and searched for the global optimal solution after 15,206 iterations. The model had achieved the training goal. We used the error indices R2, RMSE, and MAE to compare the errors between the assessment results of the BP and GA-BP neural network models and the preassessment results [60,63]. As shown in Table 2, the GA-BP neural network reduced the error to less than 1%, significantly outperforming the BP neural network in accuracy and alignment with reality. The GA-BP neural network assessment model constructed in this study is well-performed and accurate.
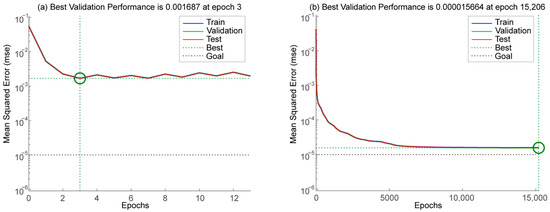
Figure 5.
(a) Performance of BP neural network and (b) GA-BP neural network.
Table 2.
Comparison of assessment precision.
3.2. Vulnerability Assessment Results
3.2.1. Vulnerability of the Ecological Protection System
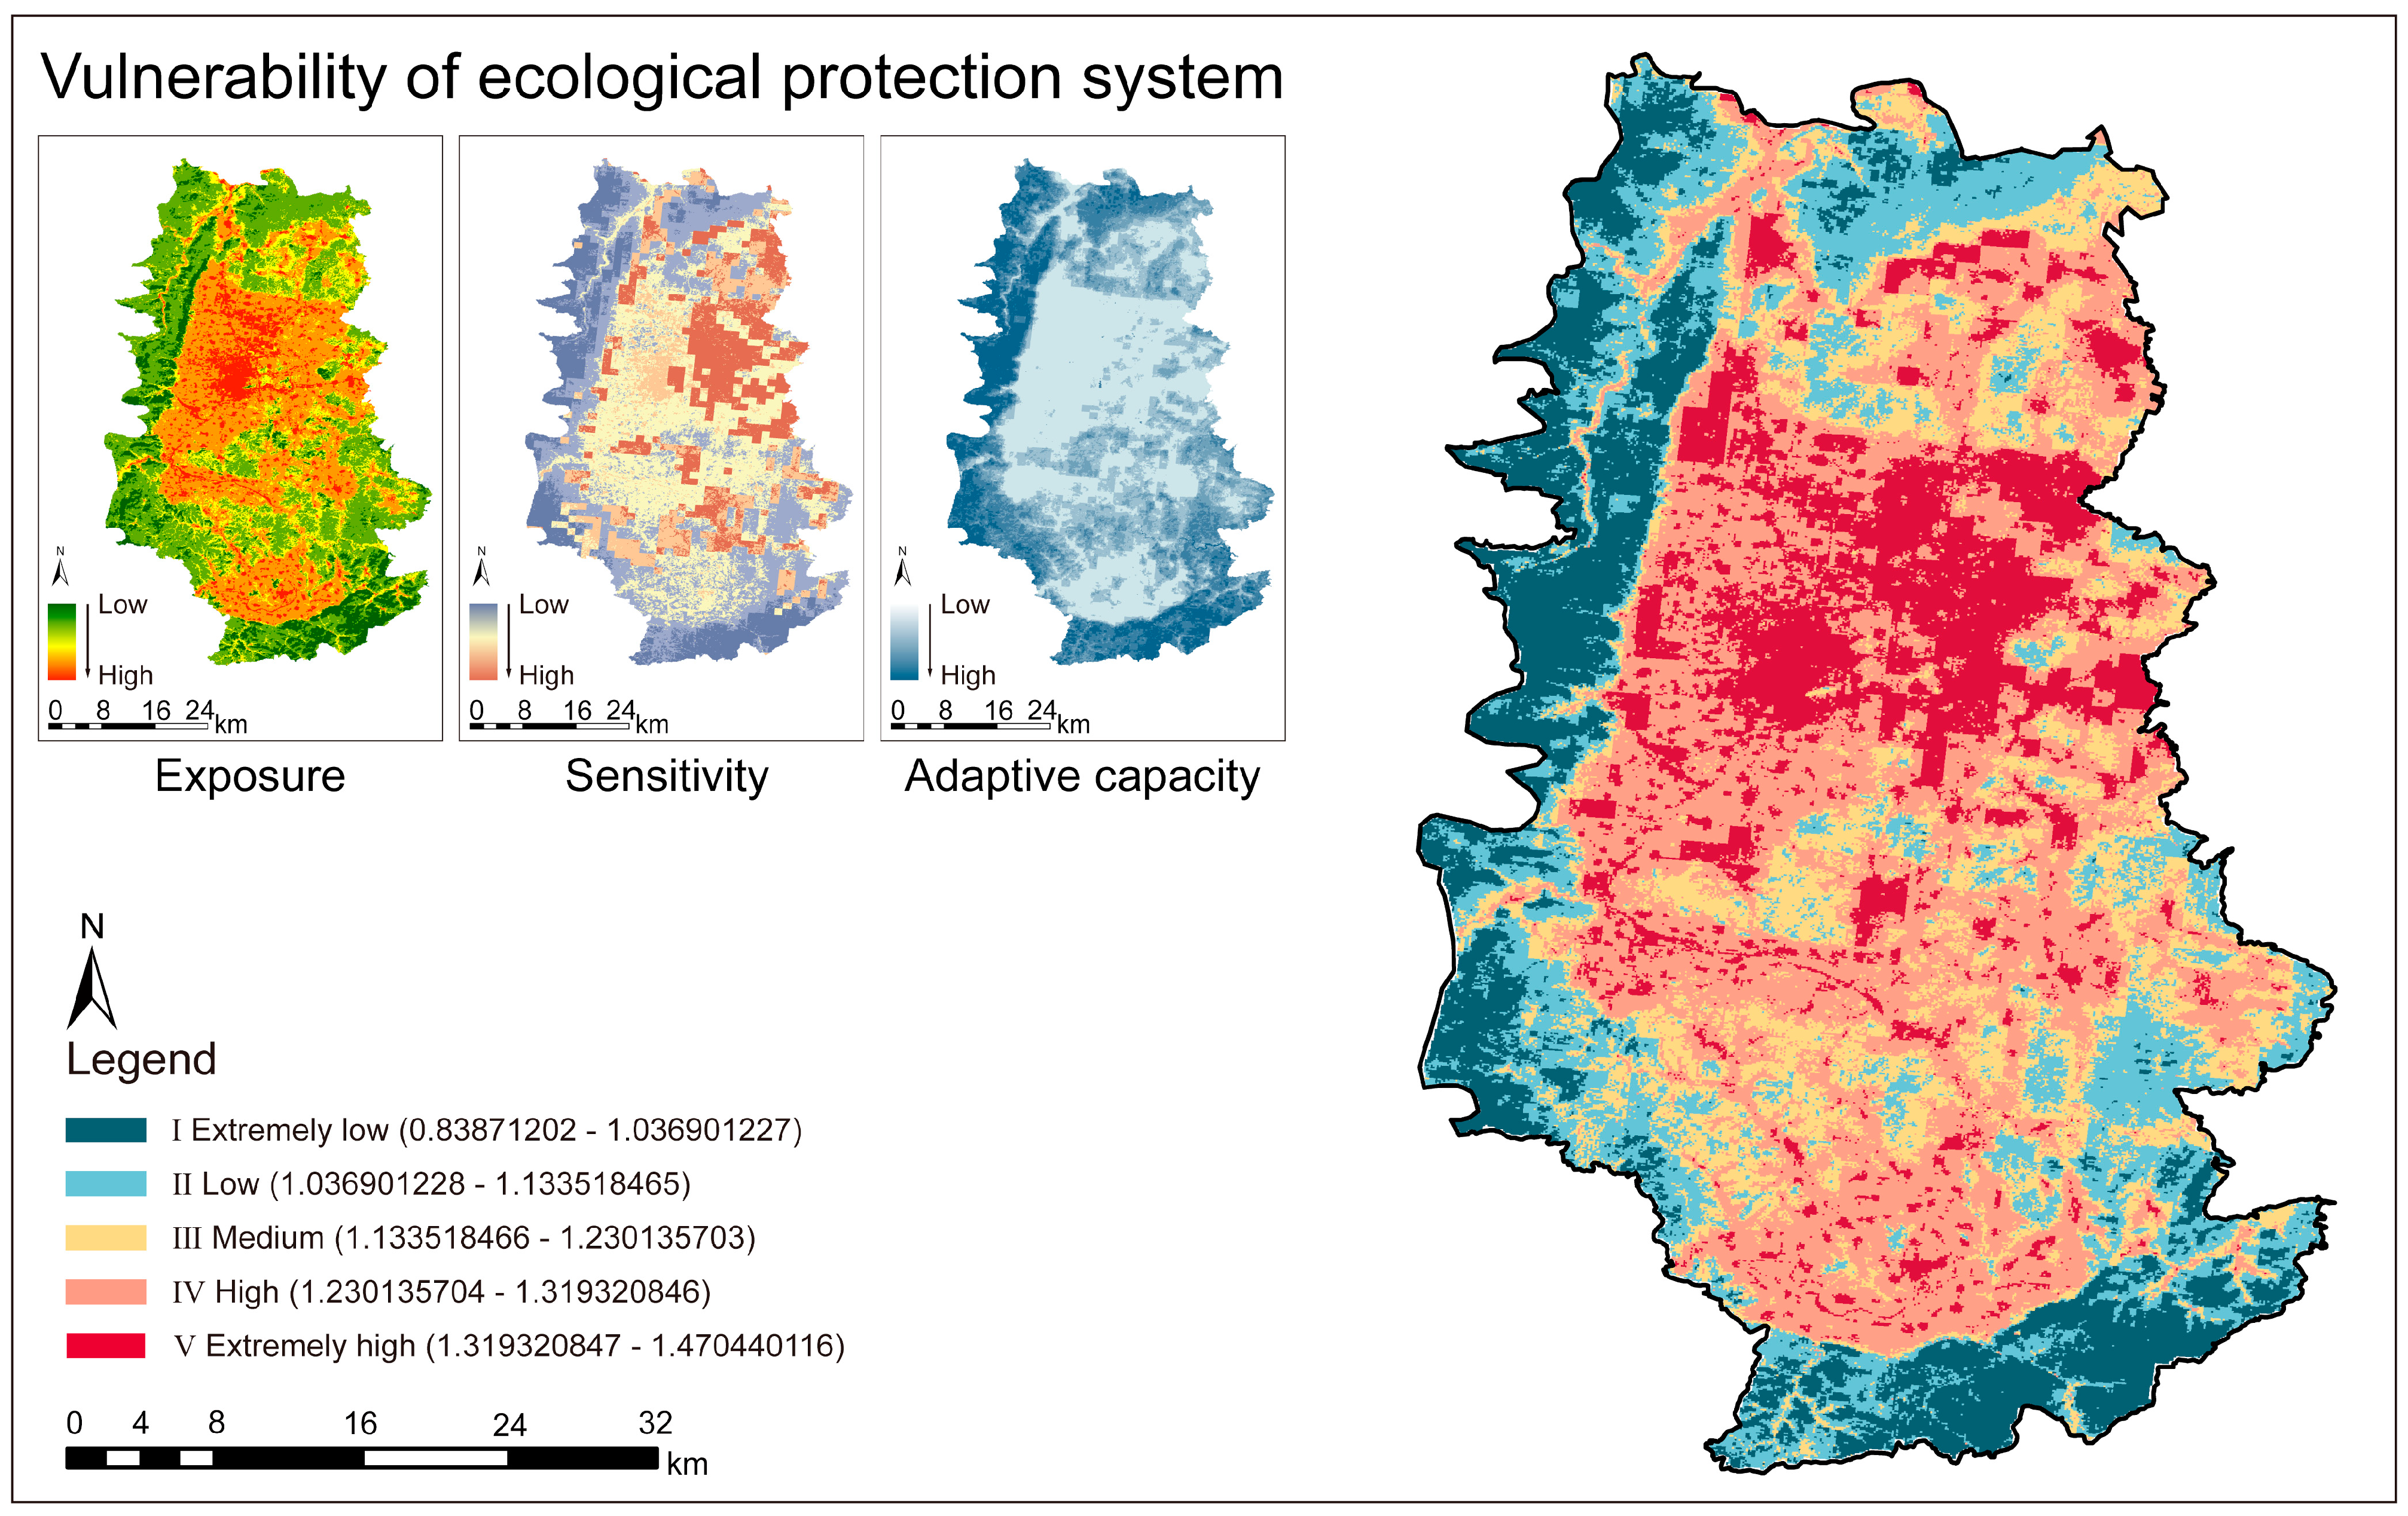
Figure 6 shows that the proportions of areas classified as extremely low (I), low (II), medium (III), high (IV), and extremely high (V) vulnerability regions in the ecological protection system accounted for 14.71%, 17.77%, 18.37%, 33.43%, and 15.72%, respectively. The extremely high vulnerability space was mainly clustered in the east–central region. High-exposure areas were mainly concentrated in the central urban area, where high population density and overexploitation of land, such as deforestation and destruction of grassland, have led to a decrease in the amount of natural resources and the quality of the ecological environment. High-sensitivity areas were distributed in the east–west hilly areas. Affected by urban construction, these areas exhibited low vegetation cover, the area of hydraulic erosion and the degree of erosion were expanding and intensifying, and the structure of the ecosystem was unstable. The central region was a zone of low adaptive capacity. The ecological space represented by the Heng River was disrupted, leading to decreased ecological adaptive capacity due to decreases in soil and water conservation and biodiversity abilities. Integrating exposure, sensitivity, and adaptive capacity, the high vulnerability area in the east–central region was influenced mostly by land-use degree (X4), soil erosion intensity (X6), the normalized difference vegetation index (X7), biodiversity (X9), and water conservation (X10). The vulnerability of the ecological protection system in Linzhou was extremely high.
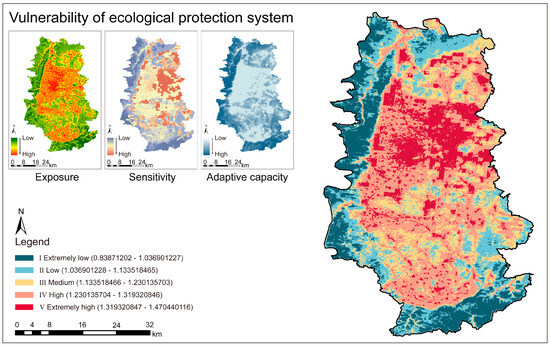
Figure 6.
Vulnerability of the ecological protection system.
3.2.2. Vulnerability of the Agricultural Production System
Figure 7 indicates that the proportions of areas classified as extremely low (I), low (II), medium (III), high (IV), and extremely high (V) vulnerability regions in the agricultural production system accounted for 11.80%, 23.41%, 22.02%, 32.72%, and 10.05%, respectively. The extremely high vulnerability space was clustered in the western mountainous areas. High-exposure areas were concentrated in the mountainous areas of Linzhou. These areas were largely covered with barren grassland, with a relatively low proportion of cultivated land and a high intensity of rainfall. High-sensitivity areas were distributed in the mountainous areas in the east and west. These mountainous farmlands served as Linzhou’s reserve cultivated land. A higher slope in the west and longer distance of water transport in the east led to lower farmland production potential and increased sensitivity to climate change. The agricultural adaptive capacity was greater in villages and towns around the central urban area, where agricultural modernization parks were constructed earlier. Integrating exposure, sensitivity, and adaptive capacity, the high vulnerability area in the west was influenced mostly by extreme rainfall (X12), the proportion of cultivated land (X13), slope (X16), farmland production potential (X18), and the total power of agricultural machinery (X20). The vulnerability of the agricultural production system in Linzhou was at a medium level.
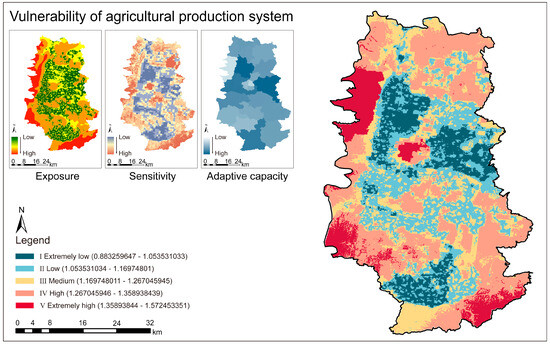
Figure 7.
Vulnerability of the agricultural production system.
3.2.3. Vulnerability of the Urban Construction System
Figure 8 shows that the proportions of areas classified as extremely low (I), low (II), medium (III), high (IV), and extremely high (V) vulnerability regions in the urban construction system accounted for 9.8%, 29.43%, 31.11%, 19.33%, and 10.33%, respectively. The extremely high vulnerability space was mainly concentrated in the northwestern mountainous and hilly areas. High-exposure areas were concentrated in the mountainous and hilly areas in the northwest and northeast. These areas feature gravity-based landforms, which are prone to geologic hazards such as collapses, landslides, and mudflows. In the central urban area, which had an urbanization rate of 56.78%, the construction intensity was relatively high, and the exposure was also high. High-sensitivity areas were primarily clustered in the western mountainous area characterized by high altitude, large topographic undulation, and negative population growth; therefore, these areas were more sensitive to emergencies. The adaptive capacity of the central urban area was greater than that of the other areas. This area had a good economic foundation and relatively perfect urban construction, and had a certain ability to withstand emergencies. Integrating exposure, sensitivity, and adaptive capacity, the high vulnerability area in the northwest was influenced mostly by geological hazards (X21, X22, and X23), the proportion of construction land (X25), topographic undulation (X27), and urban infrastructure (X29, X30, X31, and X32). The vulnerability of the urban construction system in Linzhou was relatively high.
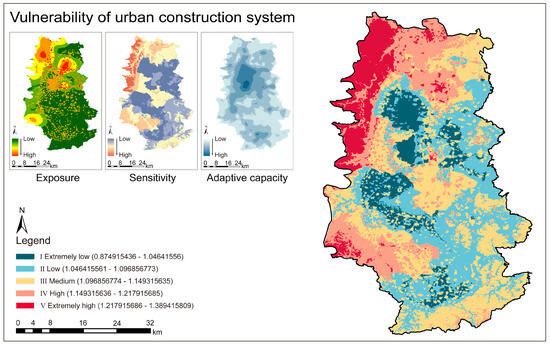
Figure 8.
Vulnerability of the urban construction system.
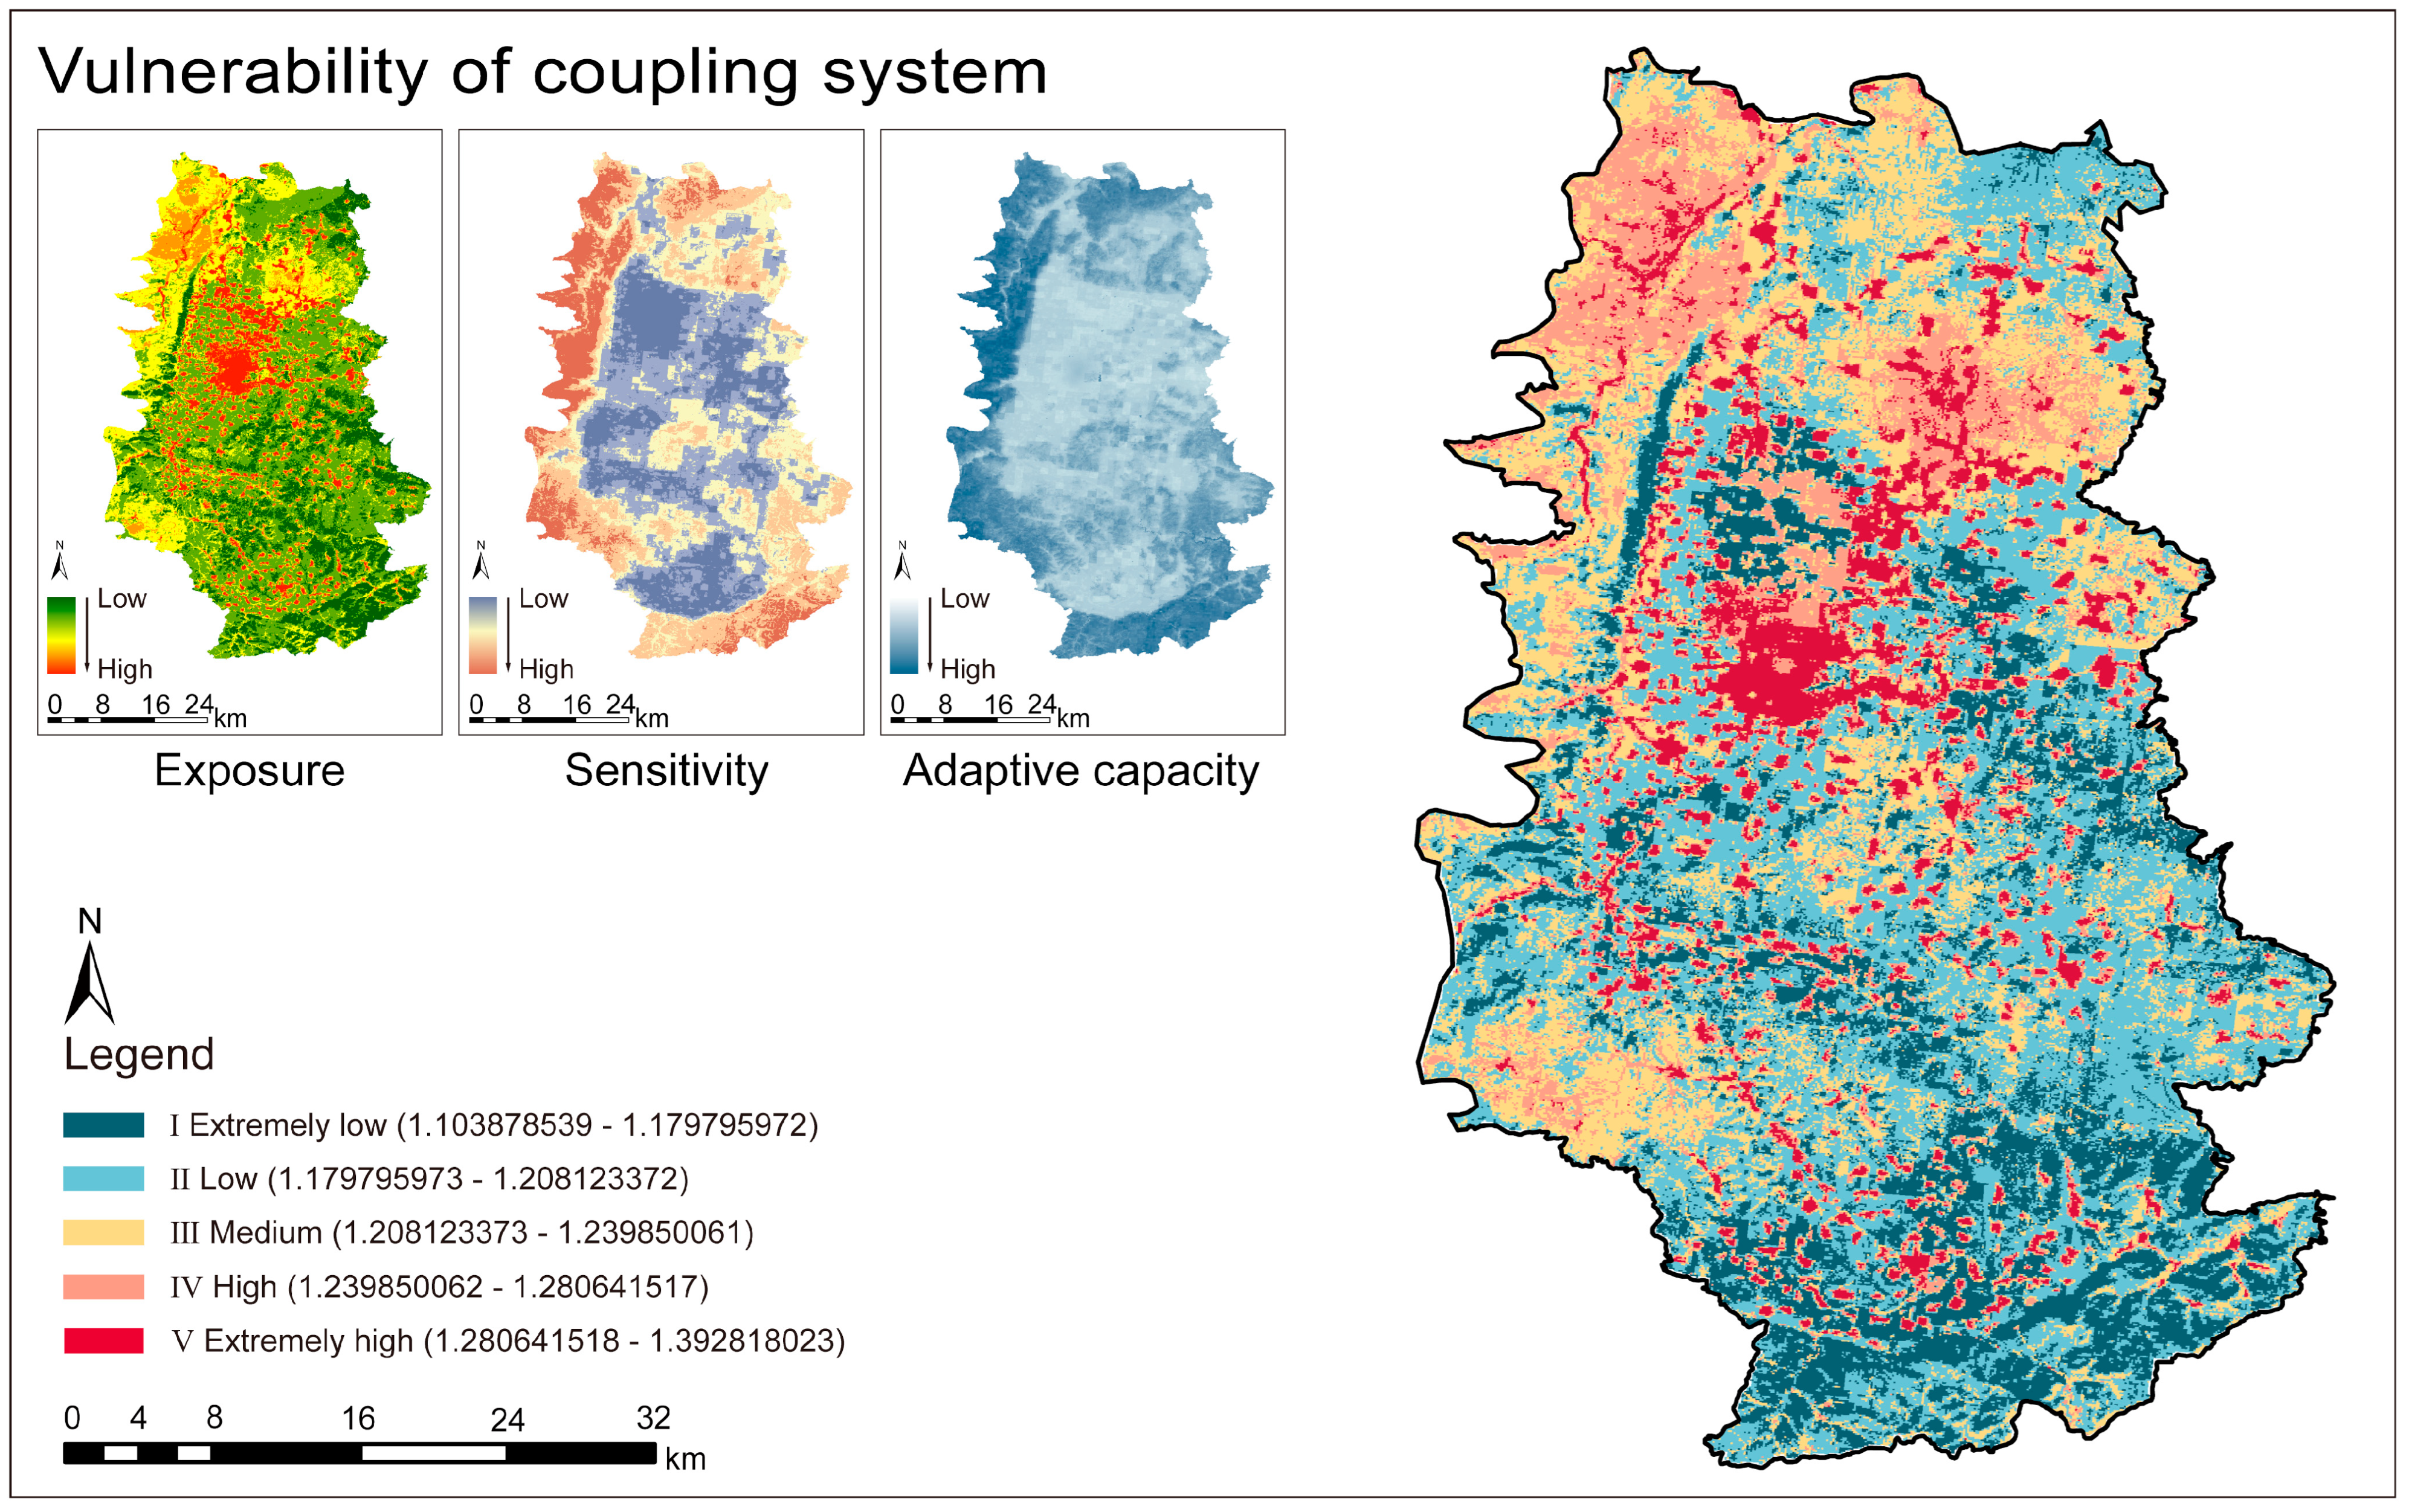
3.2.4. Vulnerability of the Coupling System
Figure 9 shows that the proportions of areas classified as extremely low (I), low (II), medium (III), high (IV), and extremely high (V) vulnerability regions accounted for 18.08%, 34.58%, 24.35%, 13.69%, and 9.3%, respectively. The extremely high vulnerability space was mostly concentrated in the mountainous areas in the northwest and northeast and in the central urban area, characterized by multispatial distribution. High-exposure areas were clustered in the central urban area. These areas were mainly distributed within high-intensity built-up land, exerting pressure on the ecological system and urban system. High-sensitivity areas were primarily concentrated in the western mountainous regions. These regions were characterized by a complex topography and low soil quality and were more sensitive to changes in the external environment during the processes of ecological protection, agricultural production, and urban construction. The mountainous and hilly areas in the west had a greater capacity for soil and water conservation, less disturbance from human activities, and had a greater adaptive capacity. The transitional areas between the central urban area and the mountainous area had a significantly reduced ecological adaptive capacity due to the impact of urban expansion, and the infrastructure construction was relatively backward compared to that of the central urban area; thus, the adaptive capacity of this area was relatively low.
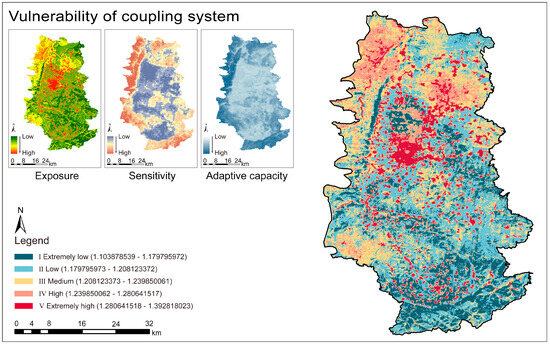
Figure 9.
Vulnerability of the coupling system.
3.3. GWR Analysis Results
The goodness of fit R2 of the GWR model reached 0.90, and the regression coefficients passed the p-value test (p < 0.05). Figure 10 shows that ecological system vulnerability was significantly positively correlated () with coupling system vulnerability in approximately 63% of the regions represented by the central urban area. The central urban area was mainly affected by the ecosystem, and the extremely high ecological vulnerability of the region exacerbated the coupling system vulnerability. Therefore, ecological restoration needs to be prioritized in future spatial planning. In the north–central region, the agricultural system had a positive correlation () with the coupling system vulnerability. However, the coefficient was close to 0 () in approximately 49% of the regions, suggesting that agriculture had less of an impact. The coupling vulnerability of most regions in Linzhou was less influenced by the agricultural system. The low vulnerability of the agricultural system in the north–central region reduced the coupling vulnerability, and the agricultural development in this region helps to reduce overall vulnerability. In approximately 78% of the mountainous and hilly areas in Linzhou, there was a significant positive correlation () between the urban system and coupling system. The coupling vulnerability of eastern and northwestern hilly areas was mainly affected by the urban system. The low urban vulnerability in the east reduced the coupling system vulnerability. Conversely, the extremely high vulnerability of the urban system in the northwest exacerbated the coupling system vulnerability, highlighting the importance of disaster prevention and control planning in the region. GWR demonstrated that the ecosystem and urban system had a greater impact on the coupling system, while the agricultural system had less influence.
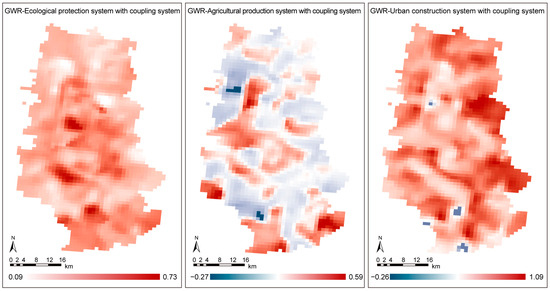
Figure 10.
Spatial pattern of geographically weighted regression.
4. Discussion
4.1. Applicability of the Assessment Framework
We constructed a spatial vulnerability assessment framework for mountain cities, including a vulnerability index system, a GA-BP neural network assessment model, and GWR analysis. In previous papers on the vulnerability of mountainous regions, researchers have assessed the vulnerability from the perspectives of geology and hazards [45,64], socioeconomics [65], ecological sensitivity, and ecosystem services [53] by constructing vulnerability indicator systems. These indicators are mostly selected from a single perspective, and holistic studies of humans and the nature are lacking. In this study, we constructed an exposure–sensitivity–adaptive capacity index system from ecology–agriculture–urban spatial systems. The index system not only considered the coupling systems of mountain cities but also selected indicators with mountain geographic characteristics, such as frequent disasters and topography, to compensate for the shortcomings of the existing research.
We innovatively introduced the GA-BP neural network to assess the spatial vulnerability. By constructing a four-layer BP neural network, we obtained the optimal relationship between each indicator and the vulnerability results. Accuracy verification revealed that, compared to the standard BP neural network commonly used in the vulnerability field [66,67], the GA-BP neural network with double hidden layers had superior generalization capability, avoided local optima, and greatly improved the assessment accuracy. This is because the genetic algorithm determined the optimal weights and thresholds by searching for individuals with higher fitness, significantly reducing the error of the results [68,69]. The double hidden layers enhanced the neural network’s generalization capability, making it suitable for large-scale nonlinear datasets. This expands the application of machine learning in vulnerability research [14]. In the future, the well-performing GA-BP neural network can be used for coupling system vulnerability assessment, and combined with long-term series data, the trained model can continuously update and assess vulnerability.
Moreover, the GWR analysis identified the spatial influence of the one-dimensional system on the coupling system, providing a reference for formulating vulnerability reduction and sustainable development strategies in different regions of Linzhou [70]. The framework can lay the foundation for assessing the vulnerability of more mountainous urbanized regions.
4.2. Reliability of Results
The mountainous and hilly areas of Linzhou account for 86% of the total area. Mountainous regions have special attributes, with a gradient distribution of natural resources, hidden danger of geologic hazards, and extreme climate. Combined with the key impact indicators of the vulnerability results in the previous section, the topography and geomorphology characterized by steep slopes and erosion, and the resulting geohazard events and extreme climate events, are the underlying causes of vulnerability in Linzhou. Many scholars have explored the causes of vulnerability in other mountainous urbanized regions. For example, Wilson et al. (2018) [24] reported that the determinants of mountain community vulnerability in the Austrian Alps are climate change factors, such as snowfall, and Jha et al. (2021) [71] argued that the socioecological vulnerability of communities in the Indian Himalayas is influenced by multiple factors, such as climatic risks and resource constraints, aligning substantially with the above findings.
The GWR results show that the vulnerability of the coupling system is strongly influenced by the ecosystem. The positive impact of the urban system on the coupling system is more evident in the mountainous and hilly regions of Linzhou, which aligns with the results of previous studies [72]. The agricultural system has a certain inhibitory effect on coupling system vulnerability. In recent years, measures such as strictly controlling the red line of cultivated land and standardizing the balance of cultivated land occupation and compensation in Linzhou have helped to alleviate spatial vulnerability, but the overall impact is relatively small and in line with reality [73].
4.3. Sustainable Development Suggestions
Based on the results, the following strategies are proposed to reduce spatial vulnerability and achieve sustainable development in Linzhou:
Prioritize the reduction of ecological vulnerability in the central area. The central area is highly vulnerable driven by the ecological system, which is consistent with what is stated in Linzhou’s 14th Five-Year Plan Ecological Restoration Report. Firstly, for the ecological space disruption of the Heng River, the relevant departments should enforce the ecological protection red line and restore the vegetation and natural succession process in the area. Secondly, since the central urban area is the core for industrial development, with high construction intensity and low ecological adaptability, it is recommended to install small-scale, high-density green infrastructure. This includes small parks, roadside green spaces, etc., to restore ecological connectivity between the central urban area and the surrounding towns [72].
Develop agriculture in the western mountainous area. The western mountainous area is highly vulnerable due to the agricultural system. As a mountainous city, Linzhou has less high-quality cultivated land in the central and southern plains, hindering its ability to meet long-term development needs. Territorial Spatial Master Planning of Linzhou (2020–2035) incorporates the western mountainous area into the reserve cultivated land. Given the poor quality of farmland and infrastructure in this region, the construction of western branch canals should be improved based on the Hongqi trunk canal to increase the irrigated area. Constructing irrigation canals helps to improve the quality of farmland by reducing the loss of soil nutrients. Additionally, introducing small-scale, intelligent agricultural machinery suitable for mountain operations will enhance the efficiency of agricultural production in the region [74].
Enhance disaster prevention and control in the northwestern mountainous and hilly areas. In the urban system, these areas are highly vulnerable due to the dense presence of geohazard sites. It is recommended that engineering measures should be taken to restore the geologic environment by clearing dangerous rocks, cutting slopes, and ecological slope protection, so as to prevent landslides, mudflows, and other sudden geologic hazards [75]. When planning new rural construction sites in the area, the planning department should avoid potential geohazard sites and choose flat areas [45]. The mountain–urban transitional region in the west, which was built late and has a low adaptive capacity to cope with emergencies, should enhance the intensive use of land and gradually improve the infrastructure of public transportation, medical care, and education.
4.4. Limitations
This study represents a novel attempt to assess the vulnerability of mountain cities using the GA-BP neural network; however, it also has several limitations. First, due to data availability and the difficulty in quantifying socioeconomic factors, representative indicators can be selected only for ecological, agricultural, and urban systems. The geographical features of mountainous agriculture and transitional areas between mountainous and urban areas cannot be comprehensively characterized. In the future, we will combine historical high-resolution data to improve the index system and explore the spatial and temporal trends of vulnerability on an annual basis. Second, the genetic algorithm is used to search for the optimal weights and thresholds of the BP neural network. Although it achieves higher model accuracy, it reduces the convergence speed and takes a long time. In the future, we will improve the genetic algorithm by using it to quickly optimize the overall structure of the BP neural network.
5. Conclusions
Based on the vulnerability index system, the GA-BP neural network model, and GWR analysis, we focused on constructing a comprehensive assessment framework for spatial vulnerability in mountain cities. Linzhou was selected as a typical case to complete the assessment–analysis–management closed-loop study. The major conclusions are as follows: (1) The vulnerability assessment model based on the GA-BP neural network has the advantages of high accuracy and good generalizability. (2) The vulnerability of the ecological protection system was high in the east–central region, that of the agricultural production system was high in the western mountainous areas, and that of the urban construction system was low in the middle and high in the northwestern mountainous and hilly areas. The vulnerability of the coupling system was characterized by multispatial distribution. (3) The complex topography and geomorphology and the resulting natural hazards are the underlying causes of spatial vulnerability in Linzhou. Linzhou’s spatial vulnerability is significantly influenced by the ecosystem and urban system.
The framework helps to assess the spatial vulnerability of Linzhou over the long term and serves as a reference for vulnerability assessments of other similar mountain cities with stepped topographies. Future research can optimize the GA-BP neural network model. For instance, the adaptive genetic algorithm can be applied to optimize the overall structure of the BP neural network [76]. This includes searching for multiple optimal solutions simultaneously, improving the speed of model training, and adaptively adjusting the parameters, such as variance and crossover probability, to avoid the error from manual adjustments.
Author Contributions
Conceptualization, Y.D., S.Z. and M.Y.; methodology, Y.D. and M.Y.; software, Y.D.; validation, Y.D.; formal analysis, Y.D.; investigation, Y.D.; resources, Y.D.; data curation, Y.D. and M.Y.; writing—original draft preparation, Y.D.; writing—review and editing, Y.D.; visualization, Y.D. and W.S.; supervision, S.Z. and Y.L.; project administration, S.Z. and Y.L.; funding acquisition, Y.L. All authors have read and agreed to the published version of the manuscript.
Funding
This research received no external funding.
Data Availability Statement
The data presented in this study are available from the corresponding author upon reasonable request. The data are not publicly available due to privacy.
Acknowledgments
The authors sincerely acknowledge the Resource and Environment Science and Data Center, Chinese Academy of Sciences, and the Institute of Mountain Hazards and Environment, Chinese Academy of Sciences, for the provision of remote sensing data.
Conflicts of Interest
The authors declare no conflicts of interest.
Appendix A
Table A1.
The rationale of selecting indicators.
Table A1.
The rationale of selecting indicators.
| Index | Indicator | Rationale |
|---|---|---|
| X1 | Population density | With the increase in population, human activities such as overexploitation of natural resources, environmental pollution, and vegetation destruction will lead to the intensification of ecological vulnerability. |
| X2 | Proportion of woodland area | The main land types in Linzhou are woodland, grassland, and cultivated land, and phenomena such as deforestation and grass destruction can lead to increased ecological vulnerability. |
| X3 | Proportion of grassland area | |
| X4 | Comprehensive index of land-use degree | Land-use degree is a measure which can reflect the extent of human impact on nature, containing information on patterns and their proportions of land use. Overexploitation of land leads to a decline in the total amount of natural resources and the quality of the ecological environment, and increases ecological vulnerability. |
| X5 | Aridity index | Arid environments can limit vegetation growth, and reduce grassland productivity, negatively impacting ecosystems and increasing ecological vulnerability |
| X6 | Soil erosion intensity | The type of soil erosion in Linzhou is mainly hydraulic erosion, which mainly responds to the state of soil susceptibility to erosion, and soil erodibility increases ecological vulnerability. |
| X7 | Normalized difference vegetation index | The normalized difference vegetation index is used to assess the degree of vegetation coverage. Areas with high vegetation cover play an important role in maintaining slope stability and are less susceptible to environmental changes, reducing ecological vulnerability. |
| X8 | Soil conservation | Soil conservation reduces ecological vulnerability through capacity to conserve soil and control erosion. |
| X9 | Biodiversity | Biodiversity reduces ecological vulnerability by increasing ecosystem resilience to disturbance. |
| X10 | Water conservation | Water conservation is mainly manifested in ecosystems that intercept precipitation, regulate runoff, purify water, etc., which helps to reduce ecological vulnerability. |
| X11 | Climate regulation value | Climate regulation capacity reduces ecological vulnerability by mitigating the effects of climate change. |
| X12 | Intensity of extreme rainfall | High intensity of rainfall may lead to waterlogging situation, and it may sometimes adversely affect crop productivity, resulting in increased agricultural vulnerability. |
| X13 | Proportion of cultivated land | The main land types in Linzhou are woodland, grassland, and cultivated land. Encroachment on cultivated land results in reduced soil fertility, which increases the agricultural vulnerability. |
| X14 | Annual average precipitation | Insufficient or uneven precipitation inhibits crop growth and increases agricultural vulnerability. |
| X15 | Annual average temperature | Lower temperature inhibits crop growth and increases agricultural vulnerability. |
| X16 | Slope | The proportion of sloping cultivated land of 6–25° in Linzhou is as high as 43.79%, and sloping cultivated land can easily lead to soil fertility loss and increase agricultural vulnerability. |
| X17 | Distance from a water source | Distance from a water source affects agricultural water management, and increased distance to water increases agricultural vulnerability. |
| X18 | Farmland productivity potential | Farmland productivity potential is an index to measure soil crop production capacity by integrating agricultural technology, topography, climate, and other factors in Linzhou. High farmland production potential helps to reduce agricultural vulnerability. |
| X19 | Number of agricultural workforce | The increase in agricultural workforce will contribute to the exchange of agricultural resources and technical skills and reduce agricultural vulnerability. |
| X20 | Total power of agricultural machinery | The input of agricultural mechanization helps to improve the efficiency ofagricultural activities such as sowing and threshing, and reduce agricultural vulnerability. |
| X21 | Hidden danger of geological collapse | Linzhou is a high risk area for geologic hazards. Disasters such as collapses, landslides, and mudflows threaten social and urban infrastructure and increase urban vulnerability. |
| X22 | Hidden danger of landslides | |
| X23 | Hidden danger of mudflows | |
| X24 | Nighttime Light intensity | The distribution of nighttime lights reflects the scale of the regional economy and human activities. The higher the intensity of nighttime light, the greater the intensity of human activity, which leads to the increase in urban vulnerability. |
| X25 | Proportion of construction land | The construction land in Linzhou is expanding continuously. High-intensity land construction leads to the increase in urban vulnerability. |
| X26 | Elevation | Elevation is an important factor influencing climate change and geological stability. Areas of higher elevation are less susceptible to building of urban infrastructure and increase in urban vulnerability. |
| X27 | Topographic undulation | In areas with large undulating topography, the stability of infrastructure construction is poor, and it is more vulnerable to external environment, which leads to the increase in urban vulnerability. |
| X28 | Rate of natural population increase | Rate of natural population increase characterizes the stability of population change. Positive population growth indicates that the urban has a good and stable living environment and that the urban vulnerability is low. |
| X29 | Road density | Developed transportation systems improve the response ability in the early stage of disaster and reduce urban vulnerability. |
| X30 | Density of educational facilities | Popularizing disaster-related education and improving capacity to respond to emergencies contribute to reducing urban vulnerability. |
| X31 | Density of medical institutions | Rational arrangement of medical facilities can improve urban rescue capacity and reduce urban vulnerability. |
| X32 | Density of urban green spaces and parks | In the face of emergencies, urban parks and green spaces help reduce urban vulnerability by providing emergency shelter. |


Figure A1.
Map of indicators.
Figure A1.
Map of indicators.
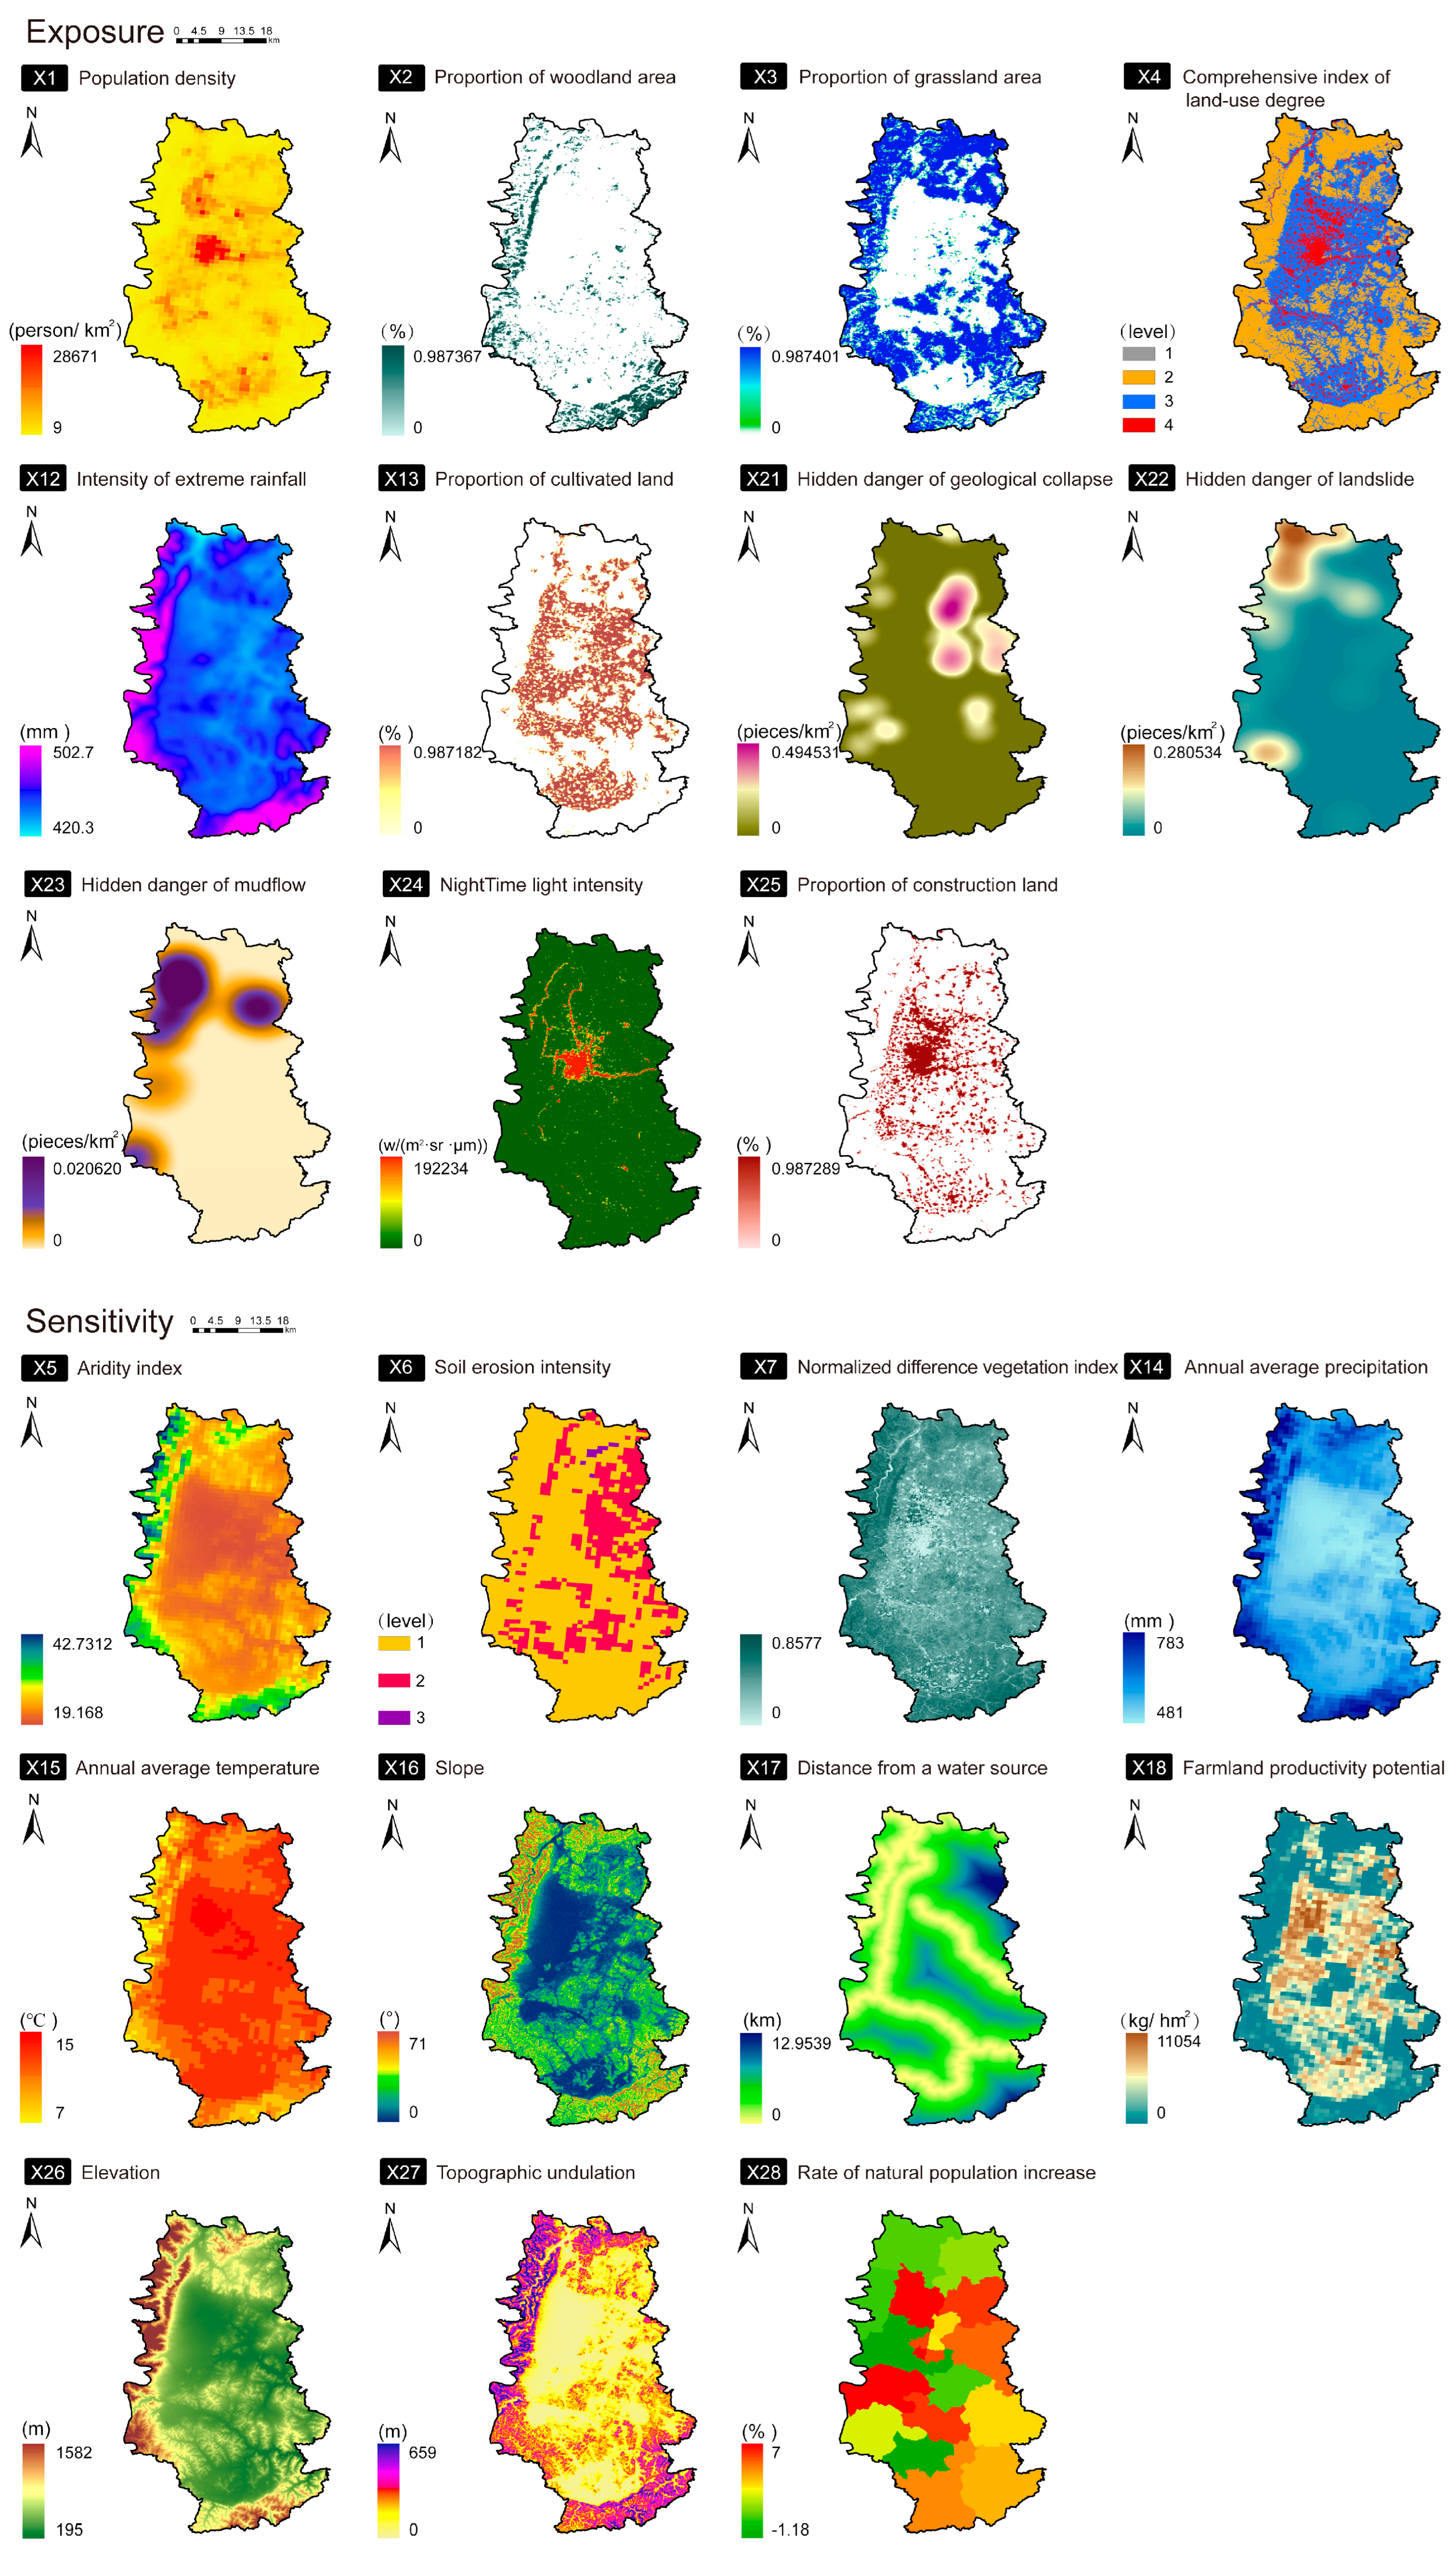
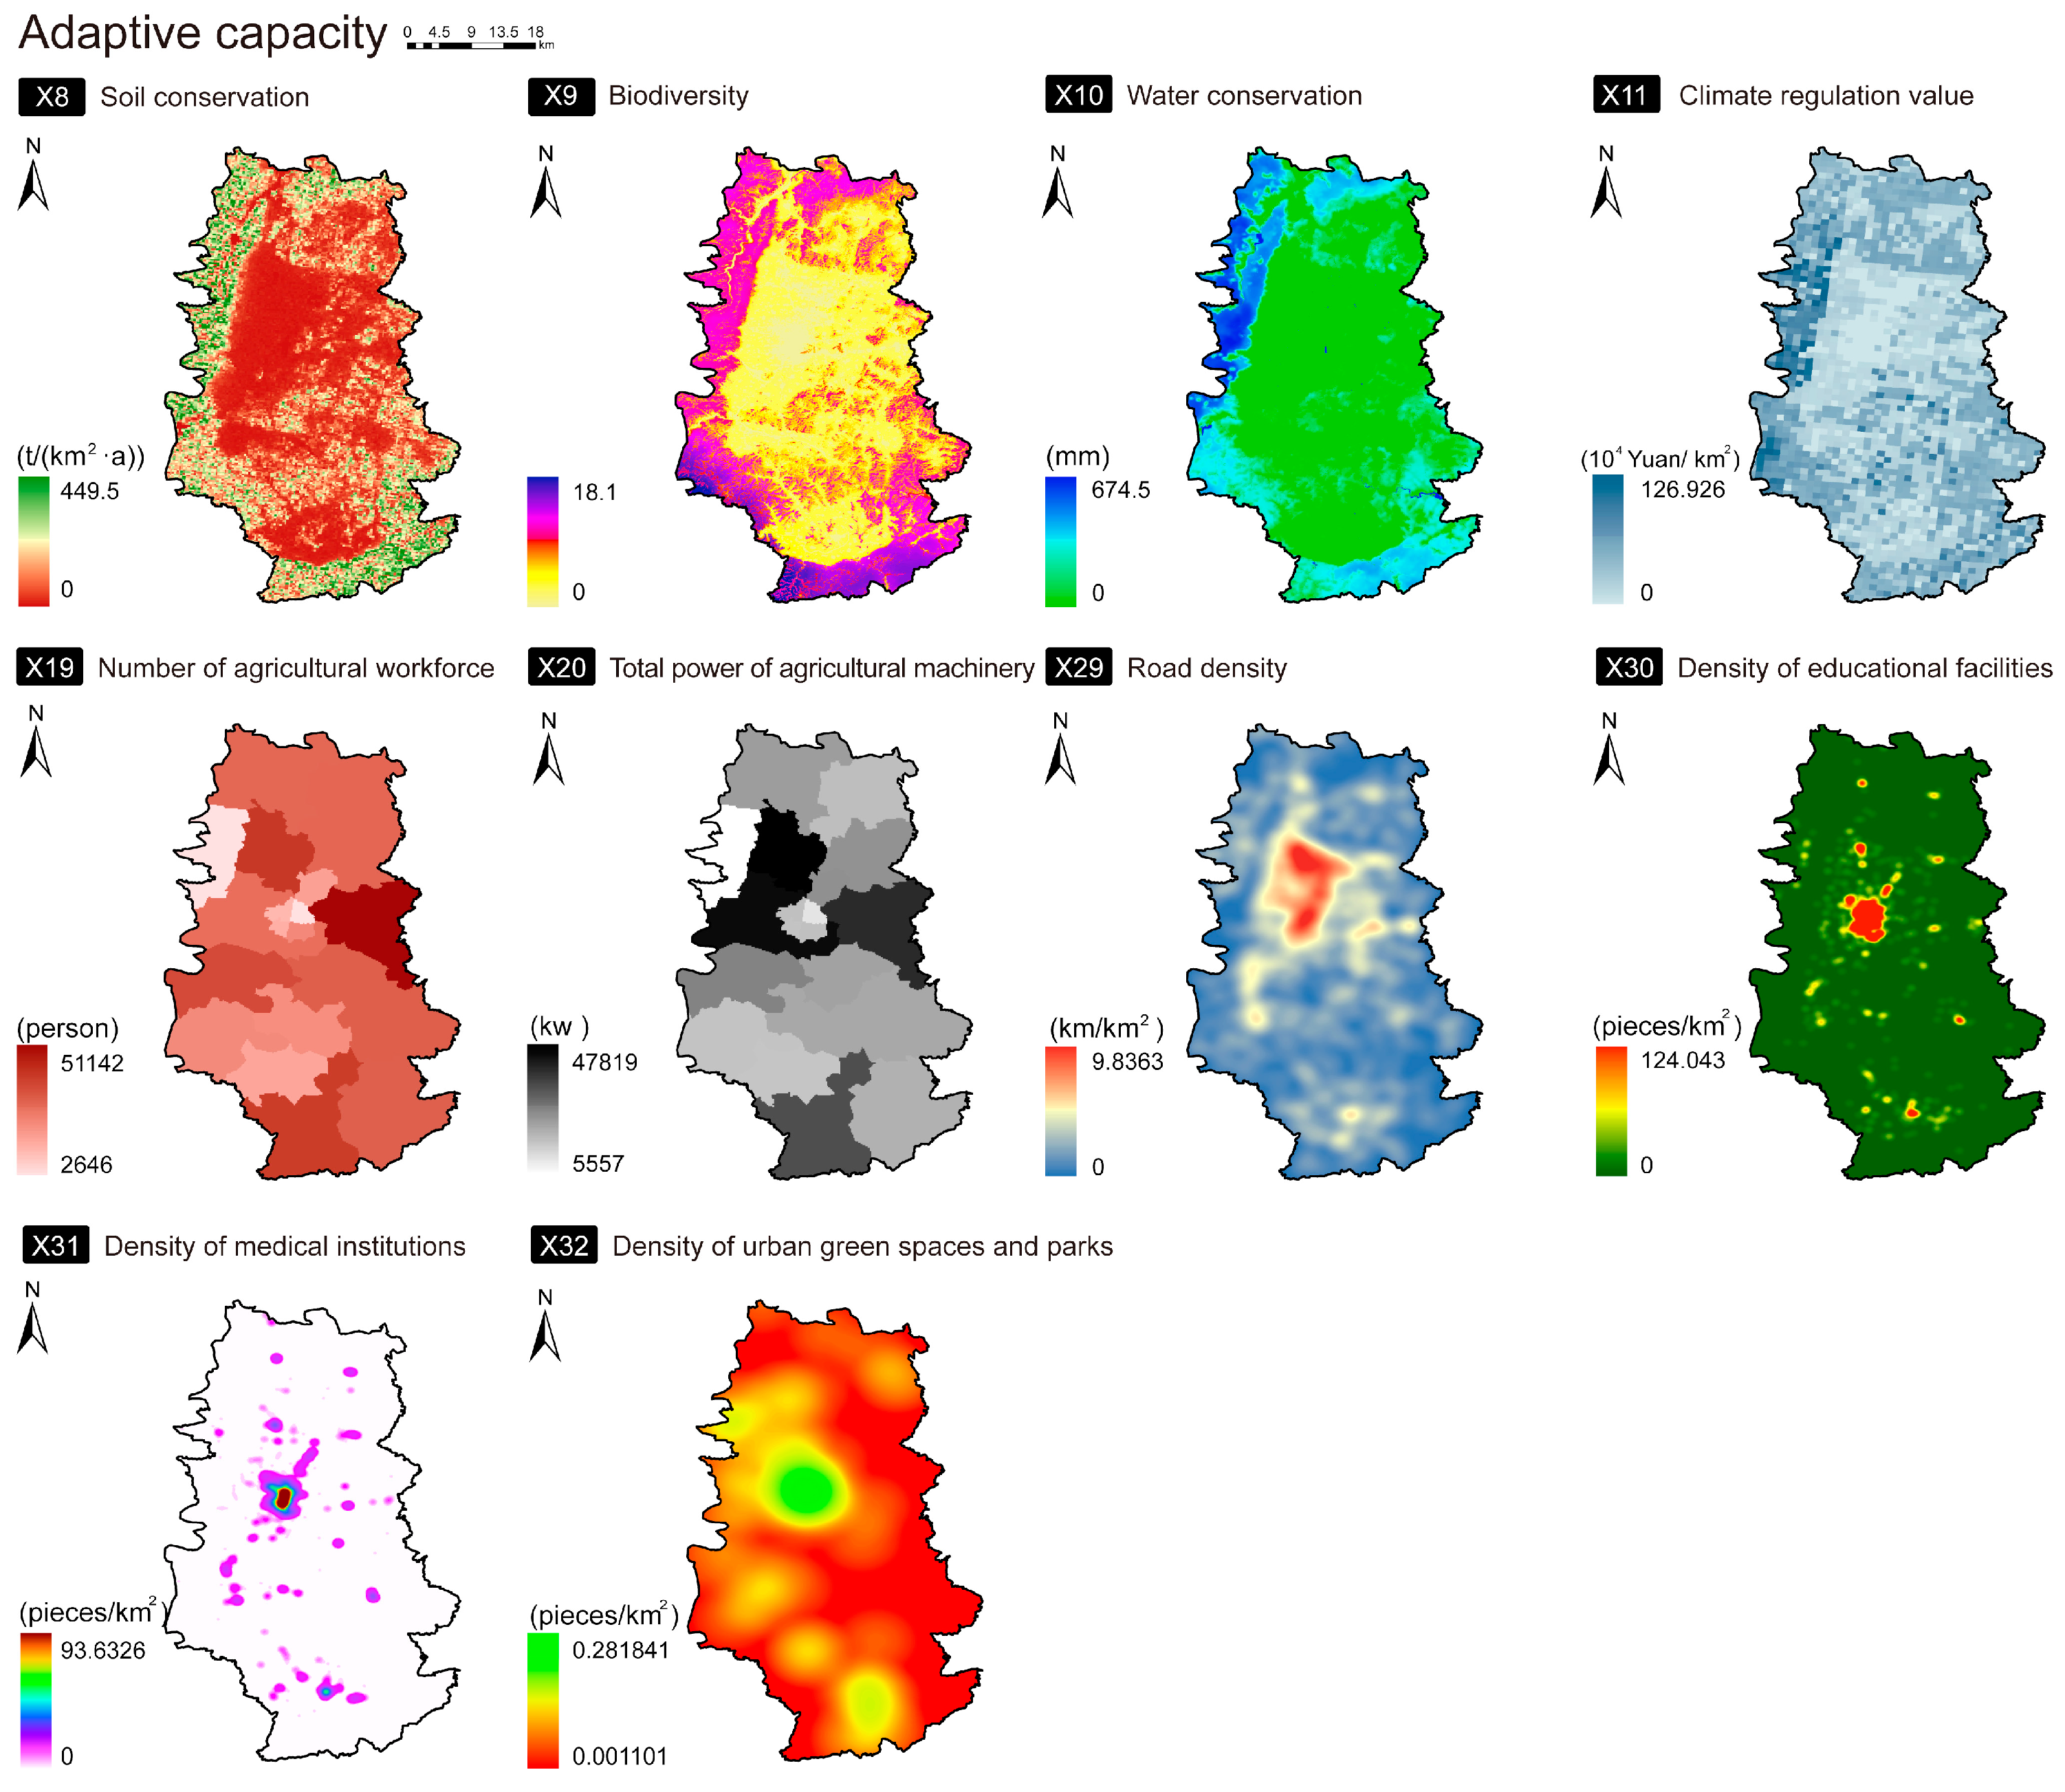
Table A2.
Principal component analysis results.
Table A2.
Principal component analysis results.
| System | Principal Component | Eigenvalue | Contribution Rate (%) | Cumulative Contribution Rate (%) | KMO |
|---|---|---|---|---|---|
| Ecological protection system | 1 | 5.261 | 47.831 | 47.831 | 0.876 |
| 2 | 1.329 | 12.084 | 59.915 | ||
| 3 | 0.97 | 8.816 | 68.731 | ||
| 4 | 0.854 | 7.767 | 76.498 | ||
| Agricultural production system | 1 | 4.425 | 49.166 | 49.166 | 0.808 |
| 2 | 1.353 | 15.036 | 64.203 | ||
| 3 | 1.037 | 11.518 | 75.72 | ||
| 4 | 0.832 | 9.25 | 84.97 | ||
| Urban construction system | 1 | 3.903 | 32.527 | 32.527 | 0.739 |
| 2 | 2.245 | 18.707 | 51.234 | ||
| 3 | 1.403 | 11.688 | 62.922 | ||
| 4 | 1.03 | 8.585 | 71.507 | ||
| Coupling system | 1 | 11.728 | 36.649 | 36.649 | 0.844 |
| 2 | 3.789 | 11.841 | 48.49 | ||
| 3 | 1.912 | 5.975 | 54.465 | ||
| 4 | 1.753 | 5.479 | 59.944 | ||
| 5 | 1.447 | 4.523 | 64.467 | ||
| 6 | 1.303 | 4.072 | 68.539 | ||
| 7 | 1.207 | 3.771 | 72.309 | ||
| 8 | 1.02 | 3.188 | 75.497 | ||
| 9 | 0.879 | 2.746 | 78.243 |
References
- Terzi, S.; Torresan, S.; Schneiderbauer, S.; Critto, A.; Zebisch, M.; Marcomini, A. Multi-Risk Assessment in Mountain Regions: A Review of Modelling Approaches for Climate Change Adaptation. J. Environ. Manag. 2019, 232, 759–771. [Google Scholar] [CrossRef] [PubMed]
- Chakraborty, A. Mountains as Vulnerable Places: A Global Synthesis of Changing Mountain Systems in the Anthropocene. GeoJournal 2021, 86, 585–604. [Google Scholar] [CrossRef]
- Schipper, L.; Pelling, M. Disaster Risk, Climate Change and International Development: Scope for, and Challenges to, Integration. Disasters 2006, 30, 19–38. [Google Scholar] [CrossRef] [PubMed]
- Hinkel, J. “Indicators of Vulnerability and Adaptive Capacity”: Towards a Clarification of the Science–Policy Interface. Glob. Environ. Chang. 2011, 21, 198–208. [Google Scholar] [CrossRef]
- Raikes, J.; Smith, T.F.; Baldwin, C.; Henstra, D. The Influence of International Agreements on Disaster Risk Reduction. Int. J. Disaster Risk Reduct. 2022, 76, 102999. [Google Scholar] [CrossRef]
- Wang, X.; Palazzo, D.; Carper, M. Ecological Wisdom as an Emerging Field of Scholarly Inquiry in Urban Planning and Design. Landsc. Urban Plan. 2016, 155, 100–107. [Google Scholar] [CrossRef]
- Patten, D.T. The Role of Ecological Wisdom in Managing for Sustainable Interdependent Urban and Natural Ecosystems. Landsc. Urban Plan. 2016, 155, 3–10. [Google Scholar] [CrossRef]
- Steiner, F. The Ecological Wisdom of Plan-Making. J. Urban Manag. 2018, 7, 124–130. [Google Scholar] [CrossRef]
- Wang, X.; Xiang, W.-N. Ecological Wisdom for Urban Sustainability: Doing Real and Permanent Good in Ecological Practice. Landsc. Urban Plan. 2016, 155, 1–2. [Google Scholar] [CrossRef]
- Douglas, E.M.; Reardon, K.M.; Täger, M.C. Participatory Action Research as a Means of Achieving Ecological Wisdom within Climate Change Resiliency Planning. J. Urban Manag. 2018, 7, 152–160. [Google Scholar] [CrossRef]
- Simandan, D. The Wise Stance in Human Geography. Trans. Inst. Br. Geogr. 2011, 36, 188–192. [Google Scholar] [CrossRef]
- Birkmann, J.; Jamshed, A.; McMillan, J.M.; Feldmeyer, D.; Totin, E.; Solecki, W.; Ibrahim, Z.Z.; Roberts, D.; Kerr, R.B.; Poertner, H.-O.; et al. Exposure, Sensitivity and Adaptive Capacity. Sci. Total Environ. 2022, 803, 150065. [Google Scholar] [CrossRef] [PubMed]
- Turner, B.L.; Zhou, B.-B. Reflections on a Vulnerability Framework for Sustainability Science. Jamba J. Disaster Risk Stud. 2023, 15, 1335. [Google Scholar] [CrossRef]
- Zou, T.; Chang, Y.; Chen, P.; Liu, J. Spatial-Temporal Variations of Ecological Vulnerability in Jilin Province (China), 2000 to 2018. Ecol. Indic. 2021, 133, 108429. [Google Scholar] [CrossRef]
- Swami, D.; Parthasarathy, D. Dynamics of Exposure, Sensitivity, Adaptive Capacity and Agricultural Vulnerability at District Scale for Maharashtra, India. Ecol. Indic. 2021, 121, 107206. [Google Scholar] [CrossRef]
- Han, X.; Wang, P.; Wang, J.; Qiao, M.; Zhao, X. Evaluation of Human-Environment System Vulnerability for Sustainable Development in the Liupan Mountainous Region of Ningxia, China. Environ. Dev. 2020, 34, 100525. [Google Scholar] [CrossRef]
- Iglesias-Pascual, R.; Benassi, F.; Hurtado-Rodríguez, C. Social Infrastructures and Socio-Economic Vulnerability: A Socio-Territorial Integration Study in Spanish Urban Contexts. Cities 2023, 132, 104109. [Google Scholar] [CrossRef]
- Xia, C.; Zhai, G. Territorial Spatial Vulnerability Assessment Based on PSO-BP Neural Network: A Case Study in Shenzhen, China. Ecol. Inform. 2023, 75, 102088. [Google Scholar] [CrossRef]
- Wang, X. Ecological Wisdom as a Guide for Implementing the Precautionary Principle. Socio Ecol. Pract. Res. 2019, 1, 25–32. [Google Scholar] [CrossRef]
- Darabi, H.; Farsani, I.; Behbahani, I. Evaluation of Ecological Vulnerability in Chelgard Mountainous. Landscape 2019, 4, 597–610. [Google Scholar]
- Villegas-González, P.A.; Ramos-Cañón, A.M.; González-Méndez, M.; González-Salazar, R.E.; De Plaza-Solórzano, J.S. Territorial Vulnerability Assessment Frame in Colombia: Disaster Risk Management. Int. J. Disaster Risk Reduct. 2017, 21, 384–395. [Google Scholar] [CrossRef]
- Nan, G.; Han, L.; Wang, Y. Assessing Vulnerability of Coupled Human–Environment Systems and Its Influence Factors in Yan’an City, China. Hum. Ecol. Risk Assess. Int. J. 2022, 28, 783–801. [Google Scholar] [CrossRef]
- Molden, D.; Hurni, H.; von Dach, S.W.; Zimmermann, A.B. Focus Issue: Vulnerability and Resilience to Natural Hazards and Disasters in Mountains. Mt. Res. Dev. 2015, 35, 103. [Google Scholar] [CrossRef]
- Wilson, G.A.; Schermer, M.; Stotten, R. The Resilience and Vulnerability of Remote Mountain Communities: The Case of Vent, Austrian Alps. Land Use Policy 2018, 71, 372–383. [Google Scholar] [CrossRef]
- Yang, X.; Yu, Y.; Zheng, Y. Assessment and Optimization of Territorial Space Vulnerability: A Case Study of Xingyang, Henan, China. Phys. Chem. Earth Parts A/B/C 2020, 120, 102950. [Google Scholar] [CrossRef]
- Hu, X.; Ma, C.; Huang, P.; Guo, X. Ecological Vulnerability Assessment Based on AHP-PSR Method and Analysis of Its Single Parameter Sensitivity and Spatial Autocorrelation for Ecological Protection—A Case of Weifang City, China. Ecol. Indic. 2021, 125, 107464. [Google Scholar] [CrossRef]
- Liu, B.; Han, R.; Tang, L.; Cheng, X. An Object–Pressure–Endurance–Resilience System for Assessing the Vulnerability of Coastal Zone Ecosystems. Ecol. Indic. 2022, 141, 109105. [Google Scholar] [CrossRef]
- Xiao, Y.; Tang, X.; Li, Y.; Huang, H.; An, B.-W. Social Vulnerability Assessment of Landslide Disaster Based on Improved TOPSIS Method: Case Study of Eleven Small Towns in China. Ecol. Indic. 2022, 143, 109316. [Google Scholar] [CrossRef]
- Xiong, J.; Sun, M.; Zhang, H.; Cheng, W.; Yang, Y.; Sun, M.; Cao, Y.; Wang, J. Application of the Levenburg–Marquardt Back Propagation Neural Network Approach for Landslide Risk Assessments. Nat. Hazards Earth Syst. Sci. 2019, 19, 629–653. [Google Scholar] [CrossRef]
- Zhao, G.; Zhang, Y.; Shi, Y.; Lan, H.; Yang, Q. The Application of BP Neural Networks to Analysis the National Vulnerability. Comput. Mater. Contin. 2019, 58, 421–436. [Google Scholar] [CrossRef]
- Xu, C.; Gong, A.; Liang, L.; Song, X.; Wang, Y. Vulnerability Assessment Method for Immovable Cultural Relics Based on Artificial Neural Networks—An Example of a Heavy Rainfall Event in Henan Province. Int. J. Disaster Risk Sci. 2023, 14, 41–51. [Google Scholar] [CrossRef]
- Wang, S.; Zhang, N.; Wu, L.; Wang, Y. Wind Speed Forecasting Based on the Hybrid Ensemble Empirical Mode Decomposition and GA-BP Neural Network Method. Renew. Energy 2016, 94, 629–636. [Google Scholar] [CrossRef]
- Qian, L.; Zhao, J.; Ma, Y. Option Pricing Based on GA-BP Neural Network. Procedia Comput. Sci. 2022, 199, 1340–1354. [Google Scholar] [CrossRef]
- Bai, G.; Xu, T. Coal Mine Safety Evaluation Based on Machine Learning: A BP Neural Network Model. Comput. Intell. Neurosci. 2022, 2022, e5233845. [Google Scholar] [CrossRef] [PubMed]
- Liu, L. Assessment of Water Resource Security in Karst Area of Guizhou Province, China. Sci. Rep. 2021, 11, 7641. [Google Scholar] [CrossRef] [PubMed]
- The “14th Five-Year Plan” for Territorial Spatial Ecological Restoration in Linzhou. Available online: http://www.linzhou.gov.cn/sitesources/lzsrmzf/page_pc/zwgk/zc/xzgfxwj/lz/articleaae81efd7efd%204b1e982ca23f44139490.html (accessed on 25 April 2024).
- Adger, W.N. Vulnerability. Glob. Environ. Chang. 2006, 16, 268–281. [Google Scholar] [CrossRef]
- Liu, X.; Wang, Y.; Peng, J.; Braimoh, A.K.; Yin, H. Assessing Vulnerability to Drought Based on Exposure, Sensitivity and Adaptive Capacity: A Case Study in Middle Inner Mongolia of China. Chin. Geogr. Sci. 2013, 23, 13–25. [Google Scholar] [CrossRef]
- Füssel, H.-M. Vulnerability: A Generally Applicable Conceptual Framework for Climate Change Research. Glob. Environ. Chang. 2007, 17, 155–167. [Google Scholar] [CrossRef]
- Afsari, R.; Nadizadeh Shorabeh, S.; Bakhshi Lomer, A.R.; Homaee, M.; Arsanjani, J.J. Using Artificial Neural Networks to Assess Earthquake Vulnerability in Urban Blocks of Tehran. Remote Sens. 2023, 15, 1248. [Google Scholar] [CrossRef]
- Uddin, M.N.; Saiful Islam, A.K.M.; Bala, S.K.; Islam, G.M.T.; Adhikary, S.; Saha, D.; Haque, S.; Fahad, M.G.R.; Akter, R. Mapping of Climate Vulnerability of the Coastal Region of Bangladesh Using Principal Component Analysis. Appl. Geogr. 2019, 102, 47–57. [Google Scholar] [CrossRef]
- Xiao, H.; Shao, H.; Long, J.; Zhang, S.; He, S.; Wang, D. Spatial-Temporal Pattern Evolution and Geological Influence Factors Analysis of Ecological Vulnerability in Western Sichuan Mountain Region. Ecol. Indic. 2023, 155, 110980. [Google Scholar] [CrossRef]
- Li, X.; Wang, Y.; Song, Y. Unraveling Land System Vulnerability to Rapid Urbanization: An Indicator-Based Vulnerability Assessment for Wuhan, China. Environ. Res. 2022, 211, 112981. [Google Scholar] [CrossRef] [PubMed]
- Gong, J.; Jin, T.; Cao, E.; Wang, S.; Yan, L. Is Ecological Vulnerability Assessment Based on the VSD Model and AHP-Entropy Method Useful for Loessial Forest Landscape Protection and Adaptative Management? A Case Study of Ziwuling Mountain Region, China. Ecol. Indic. 2022, 143, 109379. [Google Scholar] [CrossRef]
- Liu, Y.; Shu, B.; Chen, Y.; Zhang, H. Spatial Vulnerability Assessment of Rural Settlements in Hilly Areas Using BP Neural Network Algorithm. Ecol. Indic. 2023, 157, 111278. [Google Scholar] [CrossRef]
- Peng, J.; Zhang, J. Urban Flooding Risk Assessment Based on GIS-Game Theory Combination Weight: A Case Study of Zhengzhou City. Int. J. Disaster Risk Reduct. 2022, 77, 103080. [Google Scholar] [CrossRef]
- Pearce, T.; Smit, B.; Duerden, F.; Ford, J.D.; Goose, A.; Kataoyak, F. Inuit vulnerability and adaptive capacity to climate change in Ulukhaktok, Northwest Territories, Canada. Polar Rec. 2010, 46, 157–177. [Google Scholar] [CrossRef]
- Shao, H.; Liu, M.; Shao, Q.; Sun, X.; Wu, J.; Xiang, Z.; Yang, W. Research on Eco-Environmental Vulnerability Evaluation of the Anning River Basin in the Upper Reaches of the Yangtze River. Environ. Earth Sci. 2014, 72, 1555–1568. [Google Scholar] [CrossRef]
- Ma, Y.; Guga, S.; Xu, J.; Su, Y.; Liu, X.; Tong, Z.; Zhang, J. Agricultural Vulnerability Assessment of High-Temperature Disaster in Shaanxi Province of China. Agriculture 2022, 12, 980. [Google Scholar] [CrossRef]
- Hoque, M.Z.; Cui, S.; Xu, L.; Islam, I.; Tang, J.; Ding, S. Assessing Agricultural Livelihood Vulnerability to Climate Change in Coastal Bangladesh. Int. J. Environ. Res. Public Health 2019, 16, 4552. [Google Scholar] [CrossRef]
- Jiao, L.; Wang, L.; Lu, H.; Fan, Y.; Zhang, Y.; Wu, Y. An Assessment Model for Urban Resilience Based on the Pressure-State-Response Framework and BP-GA Neural Network. Urban Clim. 2023, 49, 101543. [Google Scholar] [CrossRef]
- Lindner, M.; Maroschek, M.; Netherer, S.; Kremer, A.; Barbati, A.; Garcia-Gonzalo, J.; Seidl, R.; Delzon, S.; Corona, P.; Kolström, M.; et al. Climate Change Impacts, Adaptive Capacity, and Vulnerability of European Forest Ecosystems. For. Ecol. Manag. 2010, 259, 698–709. [Google Scholar] [CrossRef]
- Luo, Q.; Bao, Y.; Wang, Z.; Chen, X.; Wei, W.; Fang, Z. Vulnerability Assessment of Urban Remnant Mountain Ecosystems Based on Ecological Sensitivity and Ecosystem Services. Ecol. Indic. 2023, 151, 110314. [Google Scholar] [CrossRef]
- Liu, Y.; Lü, Y.; Zhao, M.; Fu, B. Integrative Analysis of Biodiversity, Ecosystem Services, and Ecological Vulnerability Can Facilitate Improved Spatial Representation of Nature Reserves. Sci. Total Environ. 2023, 879, 163096. [Google Scholar] [CrossRef]
- Fistola, R.; Gargiulo, C.; La Rocca, R.A. Rethinking Vulnerability in City-Systems: A Methodological Proposal to Assess “Urban Entropy”. Environ. Impact Assess. Rev. 2020, 85, 106464. [Google Scholar] [CrossRef]
- Zhuang, D.; Liu, J. Modeling of Regional Differentiation of Land-Use Degree in China. Chin. Geogr. Sci. 1997, 7, 302–309. [Google Scholar] [CrossRef]
- Nygren, B.L.; O’Reilly, C.E.; Rajasingham, A.; Omore, R.; Ombok, M.; Awuor, A.O.; Jaron, P.; Moke, F.; Vulule, J.; Laserson, K.; et al. The Relationship between Distance to Water Source and Moderate-to-Severe Diarrhea in the Global Enterics Multi-Center Study in Kenya, 2008–2011. Am. J. Trop. Med. Hyg. 2016, 94, 1143–1149. [Google Scholar] [CrossRef]
- Xin, Z.; Xiaoyu, Z.; Hao, L.; Chenyi, Z.; Zhile, S.; Lijun, J.; Zelin, W.; Zheng, F.; Jiayang, Y.; Xin, Y.; et al. The Relationship between Geological Disasters with Land Use Change, Meteorological and Hydrological Factors: A Case Study of Neijiang City in Sichuan Province. Ecol. Indic. 2023, 154, 110840. [Google Scholar] [CrossRef]
- Li, J.; Cheng, J.; Shi, J.; Huang, F. Brief Introduction of Back Propagation (BP) Neural Network Algorithm and Its Improvement. In Advances in Computer Science and Information Engineering; Jin, D., Lin, S., Eds.; Advances in Intelligent and Soft Computing; Springer: Berlin/Heidelberg, Germany, 2012; Volume 169, pp. 553–558. ISBN 978-3-642-30222-0. [Google Scholar]
- Wu, Z.-J.; Tian, S.; Ma, L. A 4D Trajectory Prediction Model Based on the BP Neural Network. J. Intell. Syst. 2020, 29, 1545–1557. [Google Scholar] [CrossRef]
- Tian, Y.; Bai, L.; Wei, L.; Zheng, K.; Zhou, X. Modeling for Project Portfolio Benefit Prediction via a GA-BP Neural Network. Technol. Forecast. Soc. Chang. 2022, 183, 121939. [Google Scholar] [CrossRef]
- Wang, S.; Fang, C.; Ma, H.; Wang, Y.; Qin, J. Spatial Differences and Multi-Mechanism of Carbon Footprint Based on GWR Model in Provincial China. J. Geogr. Sci. 2014, 24, 612–630. [Google Scholar] [CrossRef]
- Zheng, D.; Qian, Z.; Liu, Y.; Liu, C. Prediction and Sensitivity Analysis of Long-Term Skid Resistance of Epoxy Asphalt Mixture Based on GA-BP Neural Network. Constr. Build. Mater. 2018, 158, 614–623. [Google Scholar] [CrossRef]
- Zou, Q.; Cui, P.; Zhou, G.G.; Li, S.; Tang, J.; Li, S. A New Approach to Assessing Vulnerability of Mountain Highways Subject to Debris Flows in China. Prog. Phys. Geogr. Earth Environ. 2018, 42, 305–329. [Google Scholar] [CrossRef]
- Letsie, M.M.; Grab, S.W. Assessment of Social Vulnerability to Natural Hazards in the Mountain Kingdom of Lesotho. Mt. Res. Dev. 2015, 35, 115–125. [Google Scholar] [CrossRef]
- Pham, Q.B.; Ali, S.A.; Bielecka, E.; Calka, B.; Orych, A.; Parvin, F.; Łupikasza, E. Flood Vulnerability and Buildings’ Flood Exposure Assessment in a Densely Urbanised City: Comparative Analysis of Three Scenarios Using a Neural Network Approach. Nat. Hazards 2022, 113, 1043–1081. [Google Scholar] [CrossRef]
- Zhou, H.; Che, A.; Shuai, X.; Zhang, Y. A Spatial Evaluation Method for Earthquake Disaster Using Optimized BP Neural Network Model. Geomat. Nat. Hazards Risk 2023, 14, 1–26. [Google Scholar] [CrossRef]
- Ding, S.; Su, C.; Yu, J. An Optimizing BP Neural Network Algorithm Based on Genetic Algorithm. Artif. Intell. Rev. 2011, 36, 153–162. [Google Scholar] [CrossRef]
- Liu, Y.; Li, M.; Li, Q.; Lu, X.; Zhu, X. Parameter Optimization of L-Joint of Composite Sandwich Structure Based on BP-GA Algorithm. Compos. Struct. 2022, 289, 115508. [Google Scholar] [CrossRef]
- Wang, S.; Fu, B.; Zhao, W.; Liu, Y.; Wei, F. Structure, Function, and Dynamic Mechanisms of Coupled Human–Natural Systems. Curr. Opin. Environ. Sustain. 2018, 33, 87–91. [Google Scholar] [CrossRef]
- Jha, S.K.; Negi, A.K.; Alatalo, J.M.; Negi, R.S. Socio-Ecological Vulnerability and Resilience of Mountain Communities Residing in Capital-Constrained Environments. Mitig. Adapt. Strat. Glob. Chang. 2021, 26, 38. [Google Scholar] [CrossRef]
- Liao, Y.; Ran, D.; Zhang, L.; Li, J.; Yang, C. Analysis of territorial spatial pattern and habitat evolution in mountainous and hilly areas of Linzhou. Ecol. Sci. 2020, 39, 26–33. [Google Scholar]
- Linzhou Third National Land Survey Main Data Bulletin. Available online: http://www.linzhou.gov.cn/sitesources/lzsrmzf/page_pc/jczwgkzl/sdly/cxghly/ghgs/articled215ee522d0346a78150adf58017d637.html (accessed on 25 April 2024).
- Gauchan, D.; Shrestha, S. Agricultural and Rural Mechanisation in Nepal: Status, Issues and Options for Future; Institute for Inclusive Finance and Development (InM): Dhaka, Bangladesh, 2017; ISBN 978-984-34-2253-8. [Google Scholar]
- Cao, Z.; Li, Y.; Liu, Y.; Lu, Y. Scenario Analysis of High and Steep Cutting Slopes Protection in the Loess Hilly Region: A Case Study of the Yangjuangou Catchment in Yan’an, China. CATENA 2023, 220, 106638. [Google Scholar] [CrossRef]
- Zhang, J.; Qu, S. Optimization of Backpropagation Neural Network under the Adaptive Genetic Algorithm. Complexity 2021, 2021, e1718234. [Google Scholar] [CrossRef]


Disclaimer/Publisher’s Note: The statements, opinions and data contained in all publications are solely those of the individual author(s) and contributor(s) and not of MDPI and/or the editor(s). MDPI and/or the editor(s) disclaim responsibility for any injury to people or property resulting from any ideas, methods, instructions or products referred to in the content. |
© 2024 by the authors. Licensee MDPI, Basel, Switzerland. This article is an open access article distributed under the terms and conditions of the Creative Commons Attribution (CC BY) license (https://creativecommons.org/licenses/by/4.0/).