Article

A Study on Spatiotemporal Evolution and Influencing Factors of Chinese National Park Network Attention

by
Mingxin Chen
1,
Dong Dong
1,2,*,
Fengquan Ji
1,*,
Yu Tai
1,
Nan Li
1,
Runyu Huang
1 and
Tieqiao Xiao
1,2,3
1
School of Architecture and Planning, Anhui Jianzhu University, Hefei 230022, China
2
Anhui Institute of Territory Spatial Planning and Ecology, Hefei 230022, China
3
Anhui Provincial Key Laboratory of Smart Countryside and Collaborative Governance, Hefei 230031, China
*
Authors to whom correspondence should be addressed.
Land 2024, 13(6), 826; https://doi.org/10.3390/land13060826
Submission received: 19 April 2024 / Revised: 31 May 2024 / Accepted: 6 June 2024 / Published: 8 June 2024

Abstract

:
Due to advancements in information technology and growing eco-tourism demand, National Park Network Attention (NPNA) has emerged as a novel indicator of tourism appeal and ecological value recognition. Utilizing Baidu search index (accessed in 2023) data from 2013 to 2022, this study employs time series analysis, index analysis, and spatial statistics to measure and differentiate the spatial and temporal aspects of NPNA across 31 provinces, regions, and municipalities in mainland China, while systematically assessing the impact of various factors from both source and destination perspectives. Over the period of 2013 to 2022, NPNA has increased annually, peaking around holidays and during spring and autumn, demonstrating pronounced seasonality and precursor effects, while exhibiting volatility due to external events. Influenced by factors from both source and destination perspectives, the spatial distribution of NPNA displays a trend of being “high in the east and low in the west” and “high in the south and low in the north”, though regional disparities are diminishing. The population size in the source areas remains the dominant factor influencing NPNA, while the concept of national parks is not yet widely recognized. The destination’s tourism resource endowment, media publicity, accessibility, and level of informatization are significant influences. An effective integration of resources and marketing is essential for boosting NPNA. The findings provide valuable insights for optimizing the spatial layout of national parks, enhancing the tourism service system, innovating communication and promotional strategies, and improving national park governance effectiveness.

1. Introduction

A national park refers to a designated land or sea area primarily established to protect nationally representative natural ecosystems, promote scientific conservation, and ensure the rational utilization of natural resources [1]. National parks constitute the most vital components of China’s natural ecosystem, showcasing exceptional natural landscapes, preserving the essence of natural heritage, and harboring abundant biodiversity. They are subject to comprehensive protection measures and encompass complete ecological processes [2]. In recent years, as mainland China has initiated the pilot, development, and establishment of a national park system, national parks have received widespread attention from all sectors of society for their rich ecotourism resources and national symbolic status. Reports indicate that the country already boasts 563 nature reserves that facilitate ecotourism activities, with each reserve attracting an average of over 220,000 visitors annually and generating an annual gross income surpassing CNY 22.8 billion (USD 3.2 billion) [3].
In the era of big data, the digital traces resulting from tourists’ information search and decision-making processes can be measured as individuals’ attention to travel and tourism networks. China’s advancement in informatization construction has led to a substantial increase in the number of Chinese internet users, reaching 1.067 billion as of December 2022, accompanied by a corresponding internet penetration rate of 75.6% [4]. Digital technology serves as a formidable catalyst for the transformation, advancement, and high-quality growth of the tourism market. Network attention plays a pivotal role in resource allocation and marketing endeavors of tourism destinations [5,6], thus garnering significant attention from both domestic and international scholars. Presently, network attention research predominantly centers on the following areas. Firstly, research focuses on prediction utilizing the data on network attention. For instance, Clark et al. [7] and Bangwayo-Skeete et al. [8] used Google Trends to construct prediction models for tourist and destination search volumes, respectively. Secondly, research on the effects of network attention, for example, that by Huang et al. [9] and Li Shan et al. [10], demonstrated that the Baidu Index enhances predictions of actual tourist flows and exhibits a precursor effect. Thirdly, Zhang et al. [11] and Liu et al. [12] utilized the Baidu Index to investigate the impacts of film and television works and online public opinion events on network attention. Studies also focus on network attention related to specific types of tourism and the factors influencing this attention, such as regional scenic spots [13], red tourism [14,15], ice and snow tourism [16], and tourism safety [17]. However, systematic research is lacking on the temporal evolution and spatial distribution of the public’s network attention to national parks, a significant form of tourism.
The establishment of national parks plays a crucial role in protecting ecological resources and offers the public and visitors opportunities for natural science education, environmental protection, and scientific research. Given that national parks serve both ecological protection and public recreation, studying their network attention offers valuable insights for management decisions. Studies show that analyzing search engine data can effectively predict tourist flow [7,9] and monitor the tourism industry’s scale [18,19,20]. On the other hand, the factors influencing the spatial and temporal variations of network attention are complex, involving micro factors like tourist personal characteristics and macro factors like destination attractiveness [21,22], necessitating a clarification of their mechanisms. Recent domestic research on national parks has centered on community participation [23,24,25], functional zoning [26,27,28], and environmental education [29,30], with studies proposing path research at specific sites [31,32,33,34]. However, there is a dearth of empirical research on national parks in ecotourism.
Considering this, we opt for “national parks” as the search term and employ the Baidu Index data platform to acquire search indices for 31 provinces (autonomous regions and municipalities) in mainland China from 2013 to 2022. We address the following questions: (1) What are the temporal trends and cyclical characteristics of National Park Network Attention (NPNA)? (2) What are the spatial distribution patterns and regional differences of NPNA? (3) What key factors drive these temporal and spatial variations? The study’s findings could enhance national parks’ role in enriching China’s tourism landscape and supporting sustainable natural resource management, aligning with goals for cultural promotion and tourism growth. Additionally, it could offer decision-making insights for the scientific planning, precise marketing, and sustainable management of national parks, thereby promoting the construction of ecological civilization and high-quality tourism development.

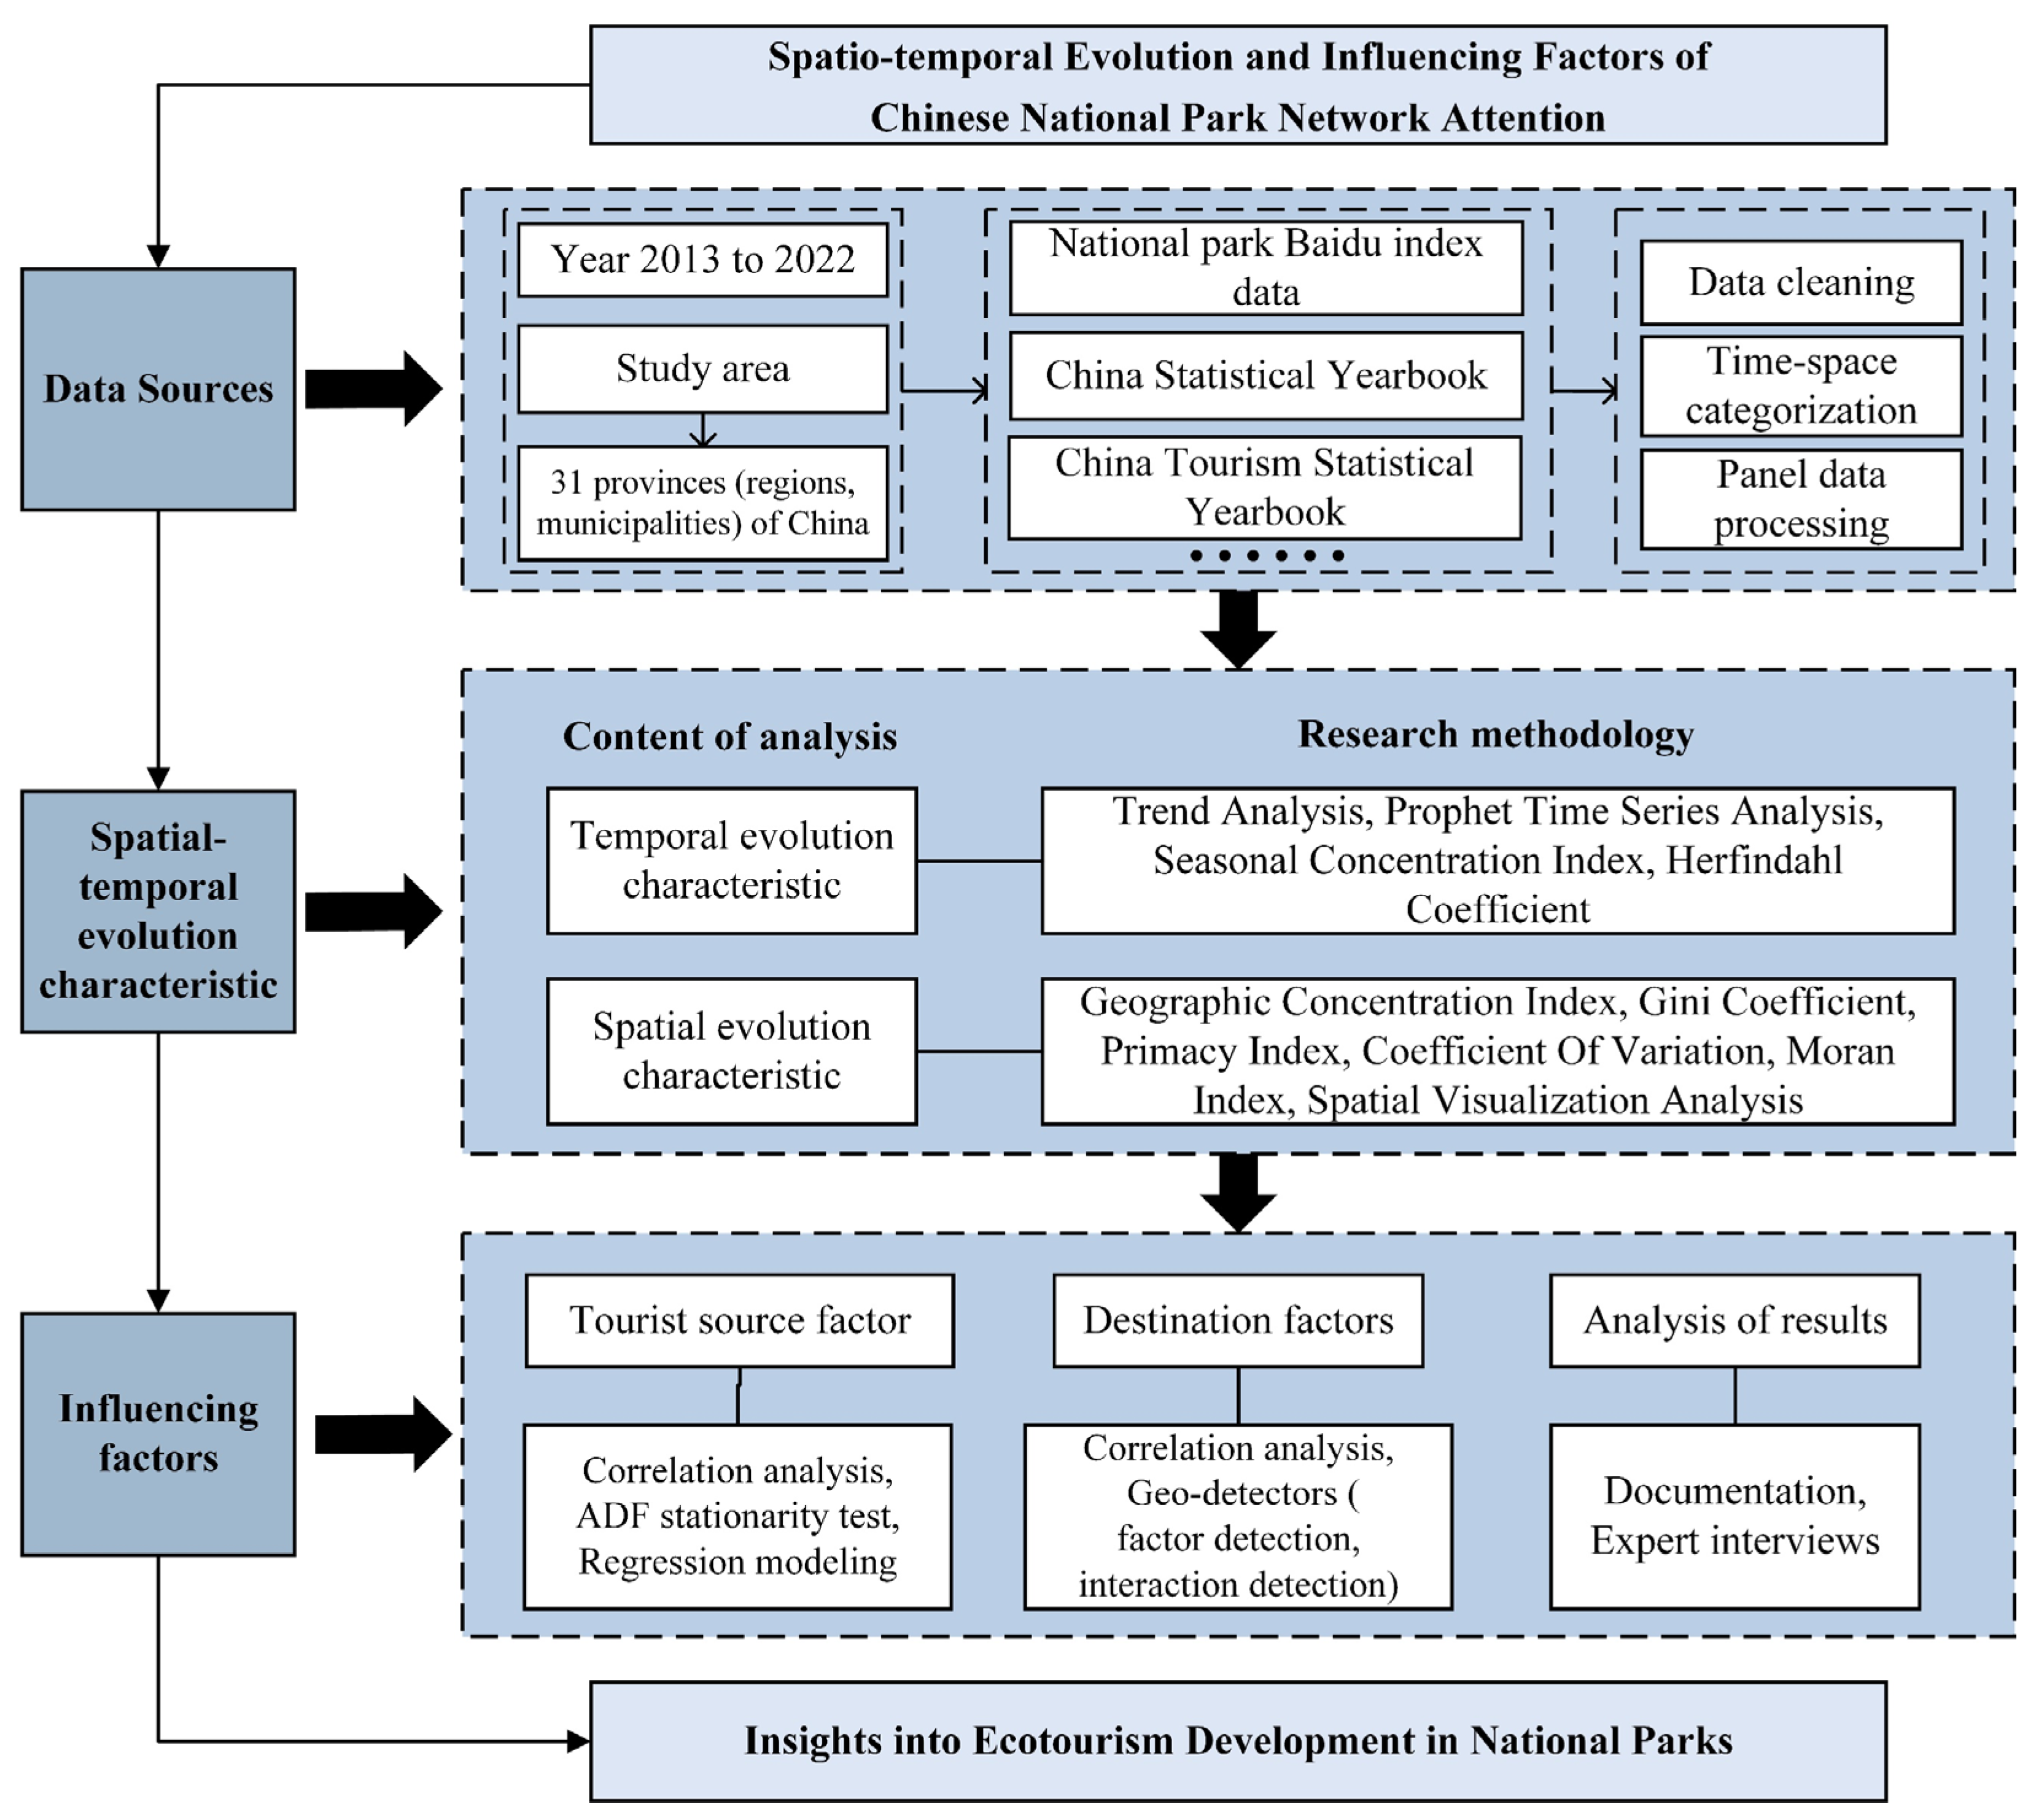
2. Data Sources and Research Methods

2.1. Study Area and Data Sources

The Baidu Index data platform [35] enables the scientific calculation of search volumes for specific keywords by netizens, thus reflecting their level of attention towards particular topics. In 2013, a significant initiative for the establishment of a national park system was introduced by the Third Plenary Session of the 18th Central Committee of the Communist Party of China. For the examination of temporal and spatial distribution characteristics of the NPNA, this study utilized “国家公园 (national park)” as the search keyword and obtained Baidu Index data on a daily, monthly, and annual basis from 1 January 2013, to 31 December 2022, via web crawlers. The study area is 31 provincial-level administrative units in mainland China (excluding the Hong Kong SAR, the Macao SAR, and Taiwan), which were categorized into seven regions based on administrative geographic divisions [36]: Northeast China (NE), East China (ED), North China (NB), Central China (CD), South China (SD), Southwest China (SW), and Northwest China (NW) (Figure 1). These data act as a proxy for public network attention measurement, targeting the investigation of the spatiotemporal distribution characteristics of NPNA. Figure 1 shows the distribution of geographical regions in China. The base map is sourced from the National Standard Map Service Website of the Ministry of Natural Resources [37], whose registration number is GS (2019)1822. Additionally, this research investigates the search volumes for keywords related to ten pilot national parks outlined in the 2017 “General Plan for Establishing a National Park System”. Ultimately, data on network attention was obtained for five specific national parks: Giant Panda, Northeast Tiger and Leopard, Three-River-Source, Wuyi Mountains, and Pudacuo. Furthermore, the analysis of relevant factors influencing NPNA was conducted using variable settings derived from existing research results. The primary data sources encompassed the China Statistical Yearbook, China Tourism Statistical Yearbook, statistical yearbooks of provinces (autonomous regions and municipalities), Statistical Bulletins of National Economic and Social Development, China Environmental Status Bulletin, and the China Internet Network Development Statistics Report from 2013 to 2022, alongside resources from Qunar and the Baidu Index platform.

2.2. Research Methods

Following the cleaning, spatial classification, and processing of panel data on factors influencing the “national parks” Baidu Index, as well as the Baidu Index of five specific national parks and data from the China Statistical Yearbook for the period 2013–2022, this paper establishes a foundational database. Leveraging theories from economics and spatial analysis, this study employs time series analysis, index analysis, and geospatial visualization to elucidate the spatiotemporal characteristics of NPNA. This paper details the changes and diversifications in periodic NPNA, attributing these to the varying motivations behind online behavior. It begins by examining the changes among different audience groups: those engaged solely in online activities, those whose network attention stems from offline activities, and those involved in both online and offline activities. Utilizing regression analysis and geographic detectors, this study comprehensively investigates the factors influencing the spatiotemporal differences in NPNA and examines the intrinsic relationships between these factors from the perspectives of both source and destination, as depicted in the technical roadmap (Figure 2).

2.2.1. Methods of Spatial Evolution Analysis

(1)
Prophet time series analysis, a decomposable, open-source model developed by Facebook, breaks down time series into components such as trends, seasonality, and holidays, featuring interpretable parameters. Subsequently, each component is individually fitted to the time series, and their collective contribution is calculated through an additive model. The basic model can be represented as follows:
y ( t ) = g t + s t + h ( t ) + ε t
where g ( t ) denotes the trend component—encompassing both linear and nonlinear trends; s ( t ) for the seasonality or cyclical component—spanning periods from yearly to daily; h ( t ) for holiday effects—capturing the influence of non-fixed holidays or events; and ε t as the noise term, denoting random fluctuations. For modeling, this study utilizes R version 4.3.2 and the Prophet framework, with parameter optimization achieved via grid search and cross-validation [38,39].
(2)
The Seasonal Concentration Index (SCI) is utilized to depict the temporal concentration of network attention across seasons. A higher SCI value signifies a greater concentration of network attention within a particular season, whereas a lower SCI value signifies a more evenly distributed network attention across seasons. The specific formula is as follows:
S C I = i = 1 12 x i 8.33 2 12
where xi represents the ratio of monthly network attention to annual network attention [40].
(3)
The Herfindahl Index (HI) is utilized to measure the degree of temporal and spatial concentration within the regional economic scale. The HI value ranges from 0 to 1, where a value closer to 1 indicates a more concentrated temporal and spatial distribution, while a value closer to 0 indicates a more dispersed distribution. The equation is as follows:
H I = i = 1 n P i 2
where Pi represents the ratio of network attention in a specific time period or spatial unit to the total attention [13].

2.2.2. Methods of Spatial and Temporal Evolution Analysis

(1)
The Geographic Concentration Index (GCI) is employed to analyze the spatial concentration of network attention. A higher GCI value closer to 100 indicates a more concentrated distribution of network attention among different regions, whereas a lower value indicates a more dispersed distribution. The GCI is calculated as follows:
G C I = 100 × i = 1 n x i S 2
where xi represents the network attention value of the i-th region, and S represents the total network attention value of all regions [13].
(2)
The Gini coefficient (GC) measures the degree of imbalance in network attention across regions, with a higher GC indicating a larger disparity in network attention between provinces or regions. According to the United Nations, a GC value exceeding 0.4 denotes a significant imbalance. The formula is as follows:
G C = 1 2 n 2 μ y i = 1 n j = 1 n y i y j
where n represents the total number of regions; μ y is the average network attention across all regions; and y i and y j correspond to the network attention in regions i and j, respectively [41].
(3)
The coefficient of variation (CV) is utilized to reflect the disparity and balance of the regional distribution of network attention. A higher CV value indicates a more substantial spatial difference, whereas a lower CV value indicates a more balanced spatial distribution. The specific formula is as follows:
C V = 1 x ¯ Σ i = 1 n x i x ¯ 2 n
where n represents the 31 provinces (regions and municipalities), and xi represents the network attention value of the i-th province (autonomous region and municipality) [13].
(4)
The Primacy Index (PI) is employed to indicate the regional concentration of network attention. A PI value less than 2 suggests a relatively balanced distribution of network attention, whereas a higher value signifies a more concentrated distribution. The equation of PI is as follows:
P I = P 1 P 2
where P1 and P2 represent the regions with the highest and the second highest network attention, respectively [13].
(5)
Moran’s I is utilized to examine the evolutionary characteristics and correlation of network attention across different spatial units, often divided into global and local spatial autocorrelation Moran’s I indices. The former indicates the overall concentration of network attention across the entire study area, whereas the latter reflects the heterogeneity of network attention distribution in local study areas. The specific calculation formula is as follows:
I = n i j W i j × i j W i j x i x ¯ × x j x ¯ i x i x ¯ 2
I i = n 2 i j W i j × x i x ¯ j W i j x j x ¯ j x j x ¯ 2
where I and Ii represent the global and local spatial autocorrelation Moran’s I indices, respectively; i and j represent each province (autonomous region and municipality); and Wij represents the spatial weight matrix. In this paper, the spatial weight matrix based on geographic distance is constructed using the Euclidean distance calculation method, obtained from the latitude and longitude data of relevant units [42,43].
(6)
Spatial Visualization: ArcGIS 10.5 software facilitated the creation of a map highlighting the spatial evolution characteristics of NPNA. Based on the findings, interest breakpoints within each province were categorized, enabling the analysis of the dynamic spatial changes in national park network interest.

2.2.3. Methods of Influencing Factors Analysis

(1)
Regression analysis: Network attention serves as a direct behavioral reflection of tourist demand, encompassing both factors and volumes. Economically, besides the influence of tourists themselves, the motivation from the source region’s living environment is significantly associated with tourist demand [21]. Considering the spatiotemporal distribution and evolution of NPNA, relevant indicators from the source regions are identified as influencing factors. A quantitative analysis is performed to assess the impact of each factor on NPNA. Utilizing panel data, this study constructs a multivariate regression model to measure the influence of these factors [44].
(2)
Geo-Detector is a statistical method used to explore the spatial differentiation of factors [45]. It is capable of detecting the consistency between the spatial distribution of network attention and influencing factors. It not only reveals the spatial relationships between variables but also identifies key influences and interactions. Tourists’ network attention with national parks is influenced not only by the push factors of their own environment but also by the pull factors of the destination’s attributes. This pull factor reflects the extent to which a destination satisfies tourists’ needs and expectations [22]. Employing the GD package in R 3.4.2 [46], the study optimally discretizes continuous variables for spatial data, utilizing combined network attention data for five specific national parks in 2021. Factor and interaction detection techniques reveal the determinants influencing the spatial distribution of NPNA, with the calculation formula shown as follows:
q x = 1 h = 1 L N h σ h 2 N σ 2
where qx represents the detection value of the independent variable x on network attention, ranging from 0 to 1. A higher qx value indicates a stronger influence of the independent variable x on network attention. L represents the partition of factor x, σh2 and σ2 represent the variance of network attention in region h and the whole area, respectively, and Nh and N represent the number of units in region h and the whole area, respectively.
Interaction detection is utilized to explore how different combinations of two factors affect the dependent variable. Five types of factor interactions are identified: nonlinear weaken, univariate weaken, bivariate enhanced, independent, and nonlinear enhanced [47].

3. Results and Analysis

With advances in information technology and increased public ecological awareness, the NPNA has become increasingly prominent. Overall, the NPNA has exhibited a yearly increase in online attention from 2013 to 2022. In terms of spatial distribution, the patterns of “east-west divergence” and “north-south difference” coexist. Consequently, what is the evolutionary trajectory of NPNA through time and space? And what are the underlying drivers? To address these questions, this section will focus on the temporal characteristics, spatial patterns, and influencing factors of NPNA, conducting a systematic and in-depth empirical analysis.

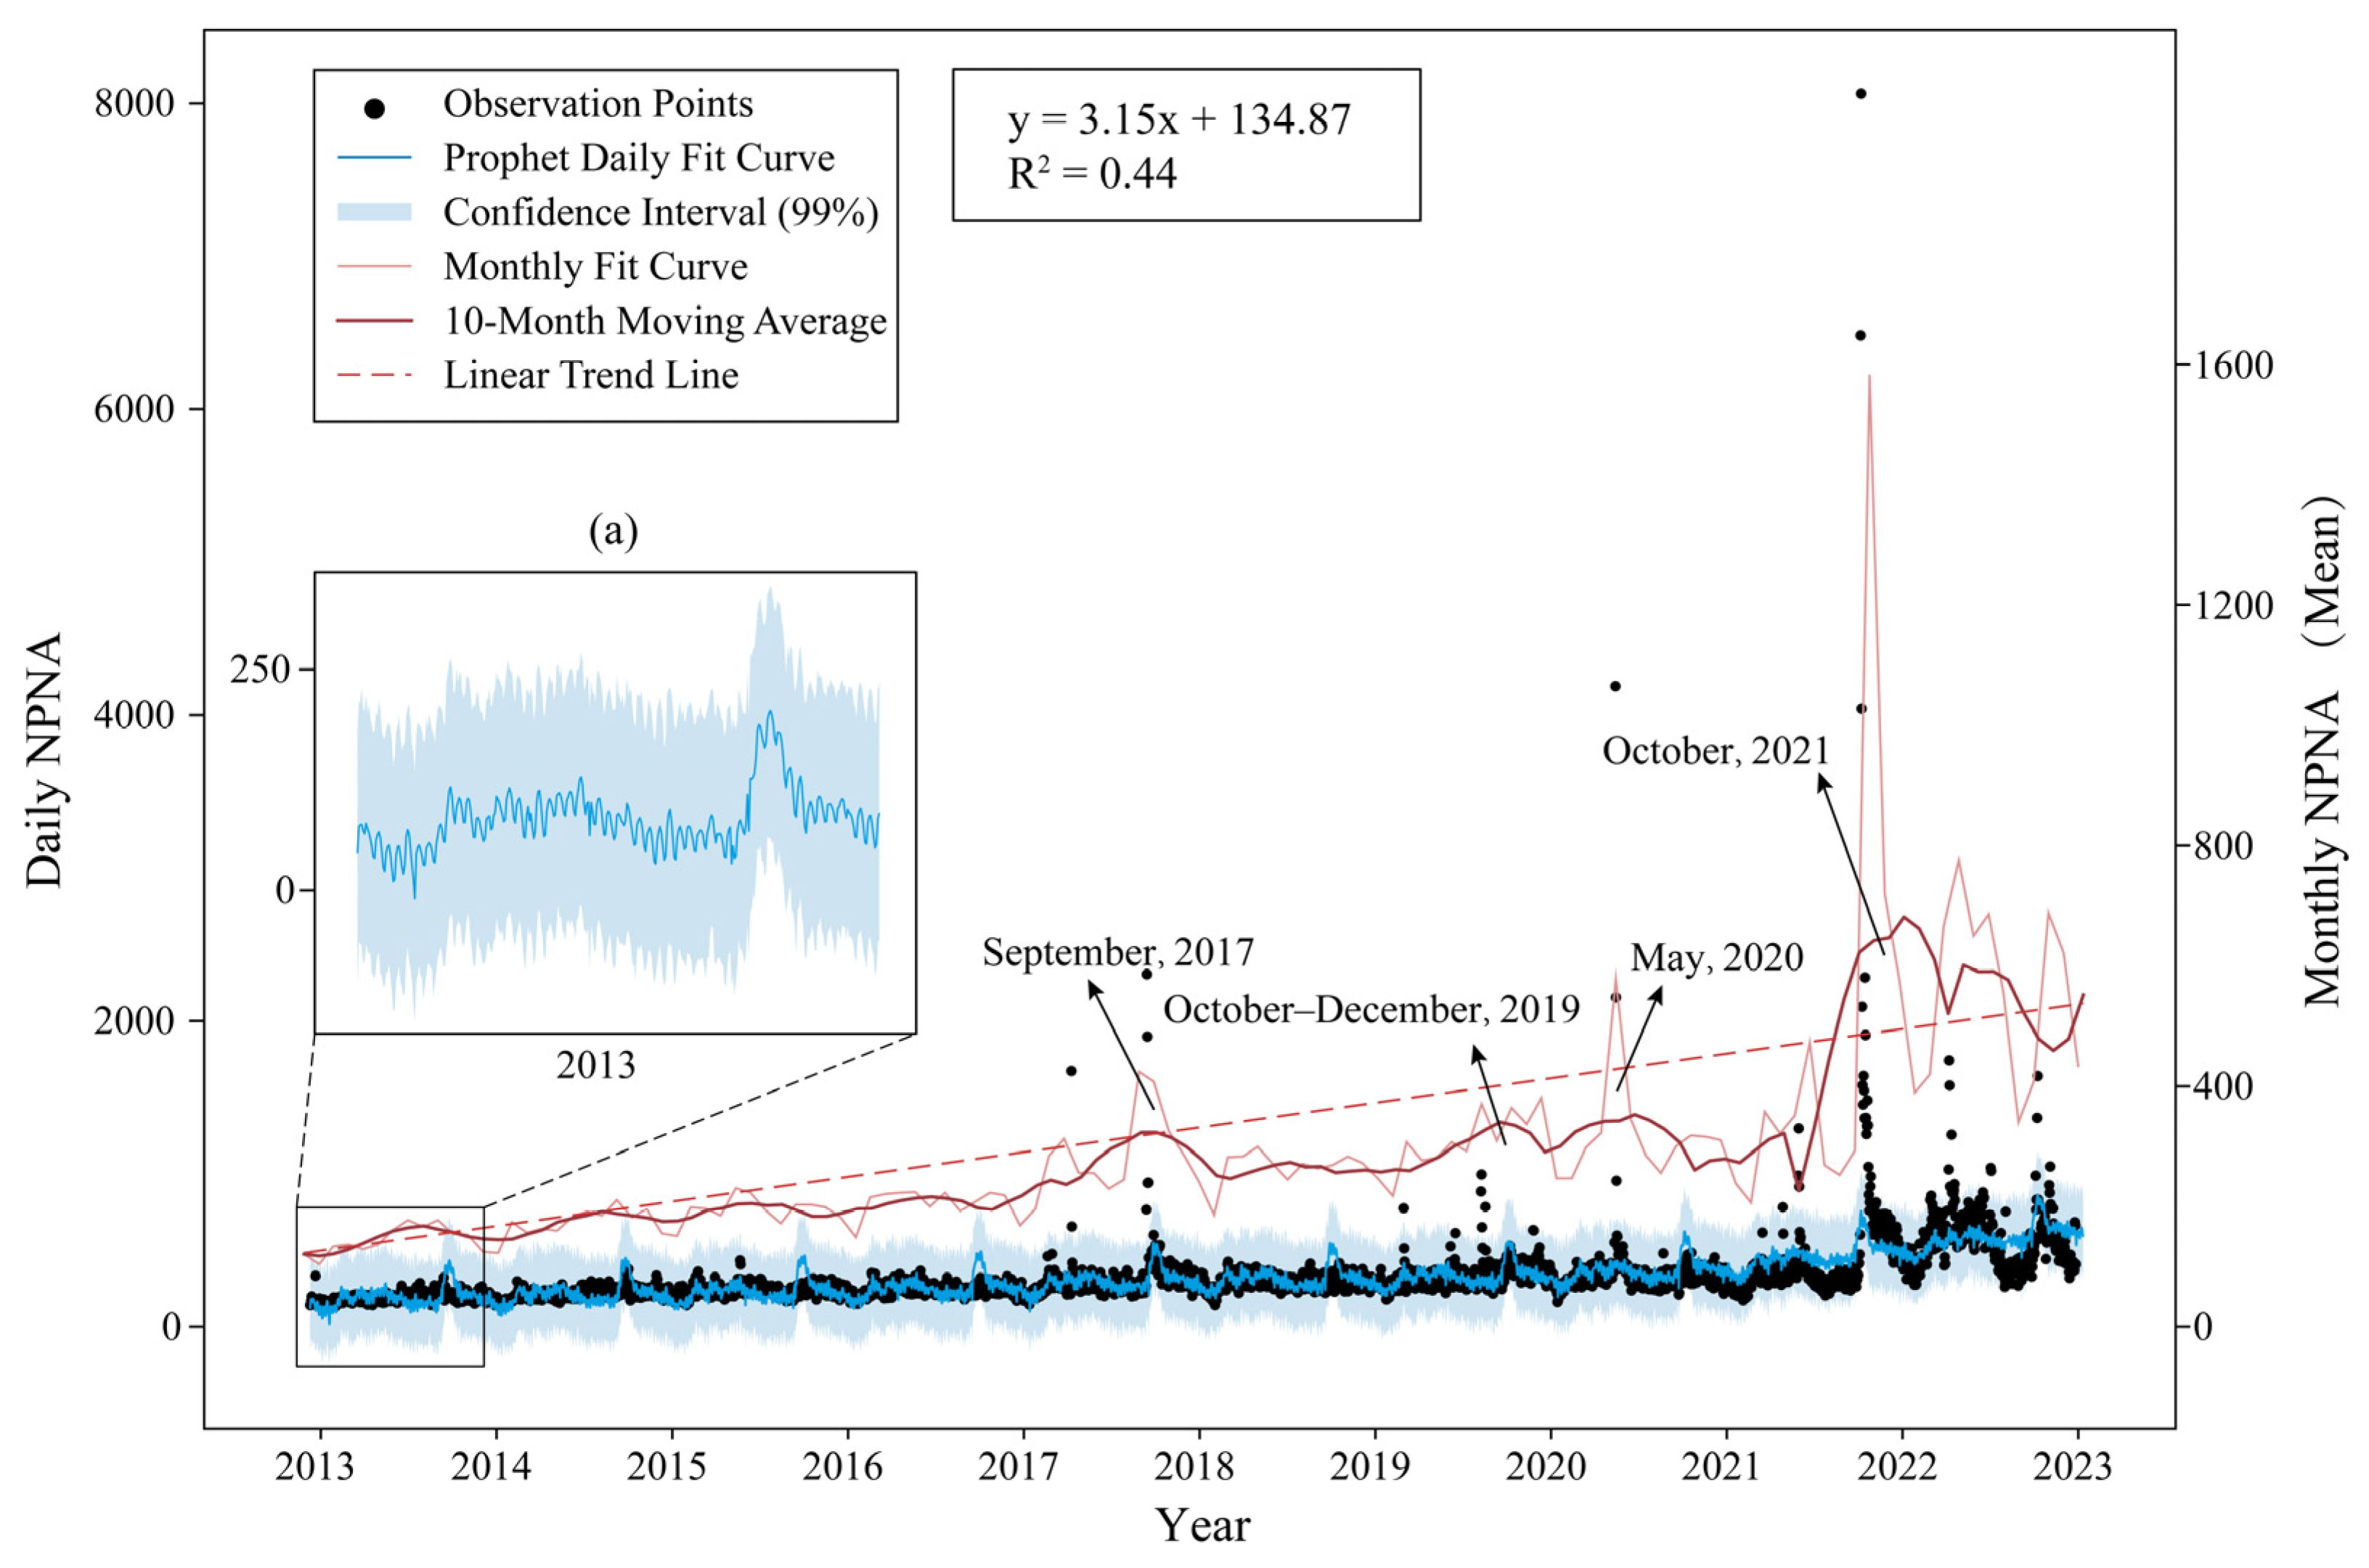
3.1. Temporal Evolution Characteristics of NPNA

3.1.1. Time Pattern Characteristics

Trend analysis (Figure 3) reveals a slight upward trend in NPNA throughout the study period. The monthly trend peaks in twelve months at a rate of 3.15, with an R2 value explaining 44% of the variance. A 10-month moving average was applied to mitigate cyclical changes, revealing multi-peak fluctuations in the total NPNA rate, especially in 2017, 2019, 2020, and 2021. The overall growth trend and observed peaks correlate significantly with key developments in national park management and policy guidance. Among them, in 2017, the Central Government and the State Council published the “General Plan for Establishing a National Park System”. In 2019, the Central Government officially released the “Guiding Opinions on Establishing a Nature Reserve System with National Parks as the Main Body”. In 2020, the National Forestry Grassland Bureau began the comprehensive initiation, acceptance, and evaluation of national park system pilot tasks, concurrent with the release of regulations and standards by the National Standardization Management Committee. In 2021, the State Council announced the first batch of five national parks [48]. This trend is evidently influenced by policy guidance and significant historical events against the backdrop of internet development. Additionally, the continuous progress of ecological civilization construction in recent years, along with the deep-rooted “Two Mountain” theory, has amplified public awareness and attention to national parks through policy support and publicity education. Since 2013, the increased popularity of the internet and smartphones [49] has enabled a growing number of netizens to search for relevant information about national parks on mobile internet platforms, leading to a significant increase in the NPNA. However, there were minor fluctuations in network attention in 2018. This can be attributed to the launch of the “All-for-one Tourism Year” activity by the National Ministry of Culture and Tourism in 2018. Various regions focused on developing a comprehensive tourism image, which led to the emergence of new tourism demands like rural homestays, ice and snow sports, cultural heritage, and urban leisure vacations. These diversions shifted tourists’ attention away from the NPNA, resulting in a decline in 2018. In 2020, the Ministry of Culture and Tourism (MCT) issued an Emergency Circular on the Suspension of Tourism Enterprises due to the impact of the COVID-19 pandemic and other sudden public health events. This directive led to intermittent closures or visitor restrictions at National Parks, disrupted public travel, and significantly impacted NPNA.

3.1.2. Time-Periodicity Characteristics

The periodic prediction component of the Prophet time series analysis (Figure 4) demonstrates that NPNA fluctuates across various time scales, indicating a precursor effect. The holiday component (Figure 4a) shows a significant negative effect, with NPNA declining during holidays like New Year’s, Spring Festival, Qingming, and May Day, likely due to preferences for family reunions or non-internet activities. The weekly component (Figure 4b) indicates that NPNA is relatively stable during weekdays and decreases over weekends, reflecting higher weekday internet activity, with weekend preferences shifting towards outdoor or leisure activities, thus diminishing online searches for national park information. The monthly component (Figure 4c) shows that NPNA peaks in the early to mid-part of the month, potentially tied to travel planning and holiday-related searches, with a trend towards making travel decisions at these times. The yearly component (Figure 3a and Figure 4d) highlights distinct peaks, notably from March to June and October to November, when the agreeable climate and seasonal scenery changes spark increased interest. National parks, endowed with abundant natural resources, serve as quintessential spaces for individuals to connect with nature and seek solace. Conversely, network attention with national parks typically decreases from July to September and December to February of the following year. February often sees the lowest annual engagement, primarily due to unfavorable climate conditions. Furthermore, winter signifies the tourism off-season, with the Spring Festival prompting many to prefer home gatherings over travel. Moreover, climate change profoundly affects the landscapes’ quality and biodiversity within national parks. During spring and summer, frequent rainfall fosters vegetation growth and water replenishment, crucial for maintaining national parks’ ecosystem stability. This period witnesses vibrant growth in flora and fauna, rendering it an ideal time for outdoor experiences, natural scenery appreciation, and educational activities. This correlates with the increased engagement in national park tourism from March to June.
To investigate the seasonal characteristics of NPNA in more detail, the Seasonal Concentration Index (SCI) and Herfindahl Index (HI) were employed to analyze the data from 2013 to 2022 (Table 1). The findings reveal distinct seasonal variations in NPNA. Specifically, the SCI values for the years 2013–2016 and 2018 consistently remained below 1, exhibiting minimal fluctuations in the line chart. This suggests a relatively balanced NPNA during these years, with less influence from seasonal factors. In contrast, for the years 2017 and 2019–2022, the SCI values surpassed 1, accompanied by significant fluctuations in relevant months. Notably, the year 2021 recorded the highest SCI value of 5.7001. Furthermore, when considering the HI, the value exceeded 0.1 in 2021, while it remained below 0.1 in the other years, indicating an overall tendency toward 0. The introduction of the initial batch of national parks in 2021 led to a considerable enhancement in the digitization level of national parks, resulting in the establishment of dedicated websites for the public. Consequently, there was a noteworthy increase in NPNA due to the influx of visitors seeking information and engagement.

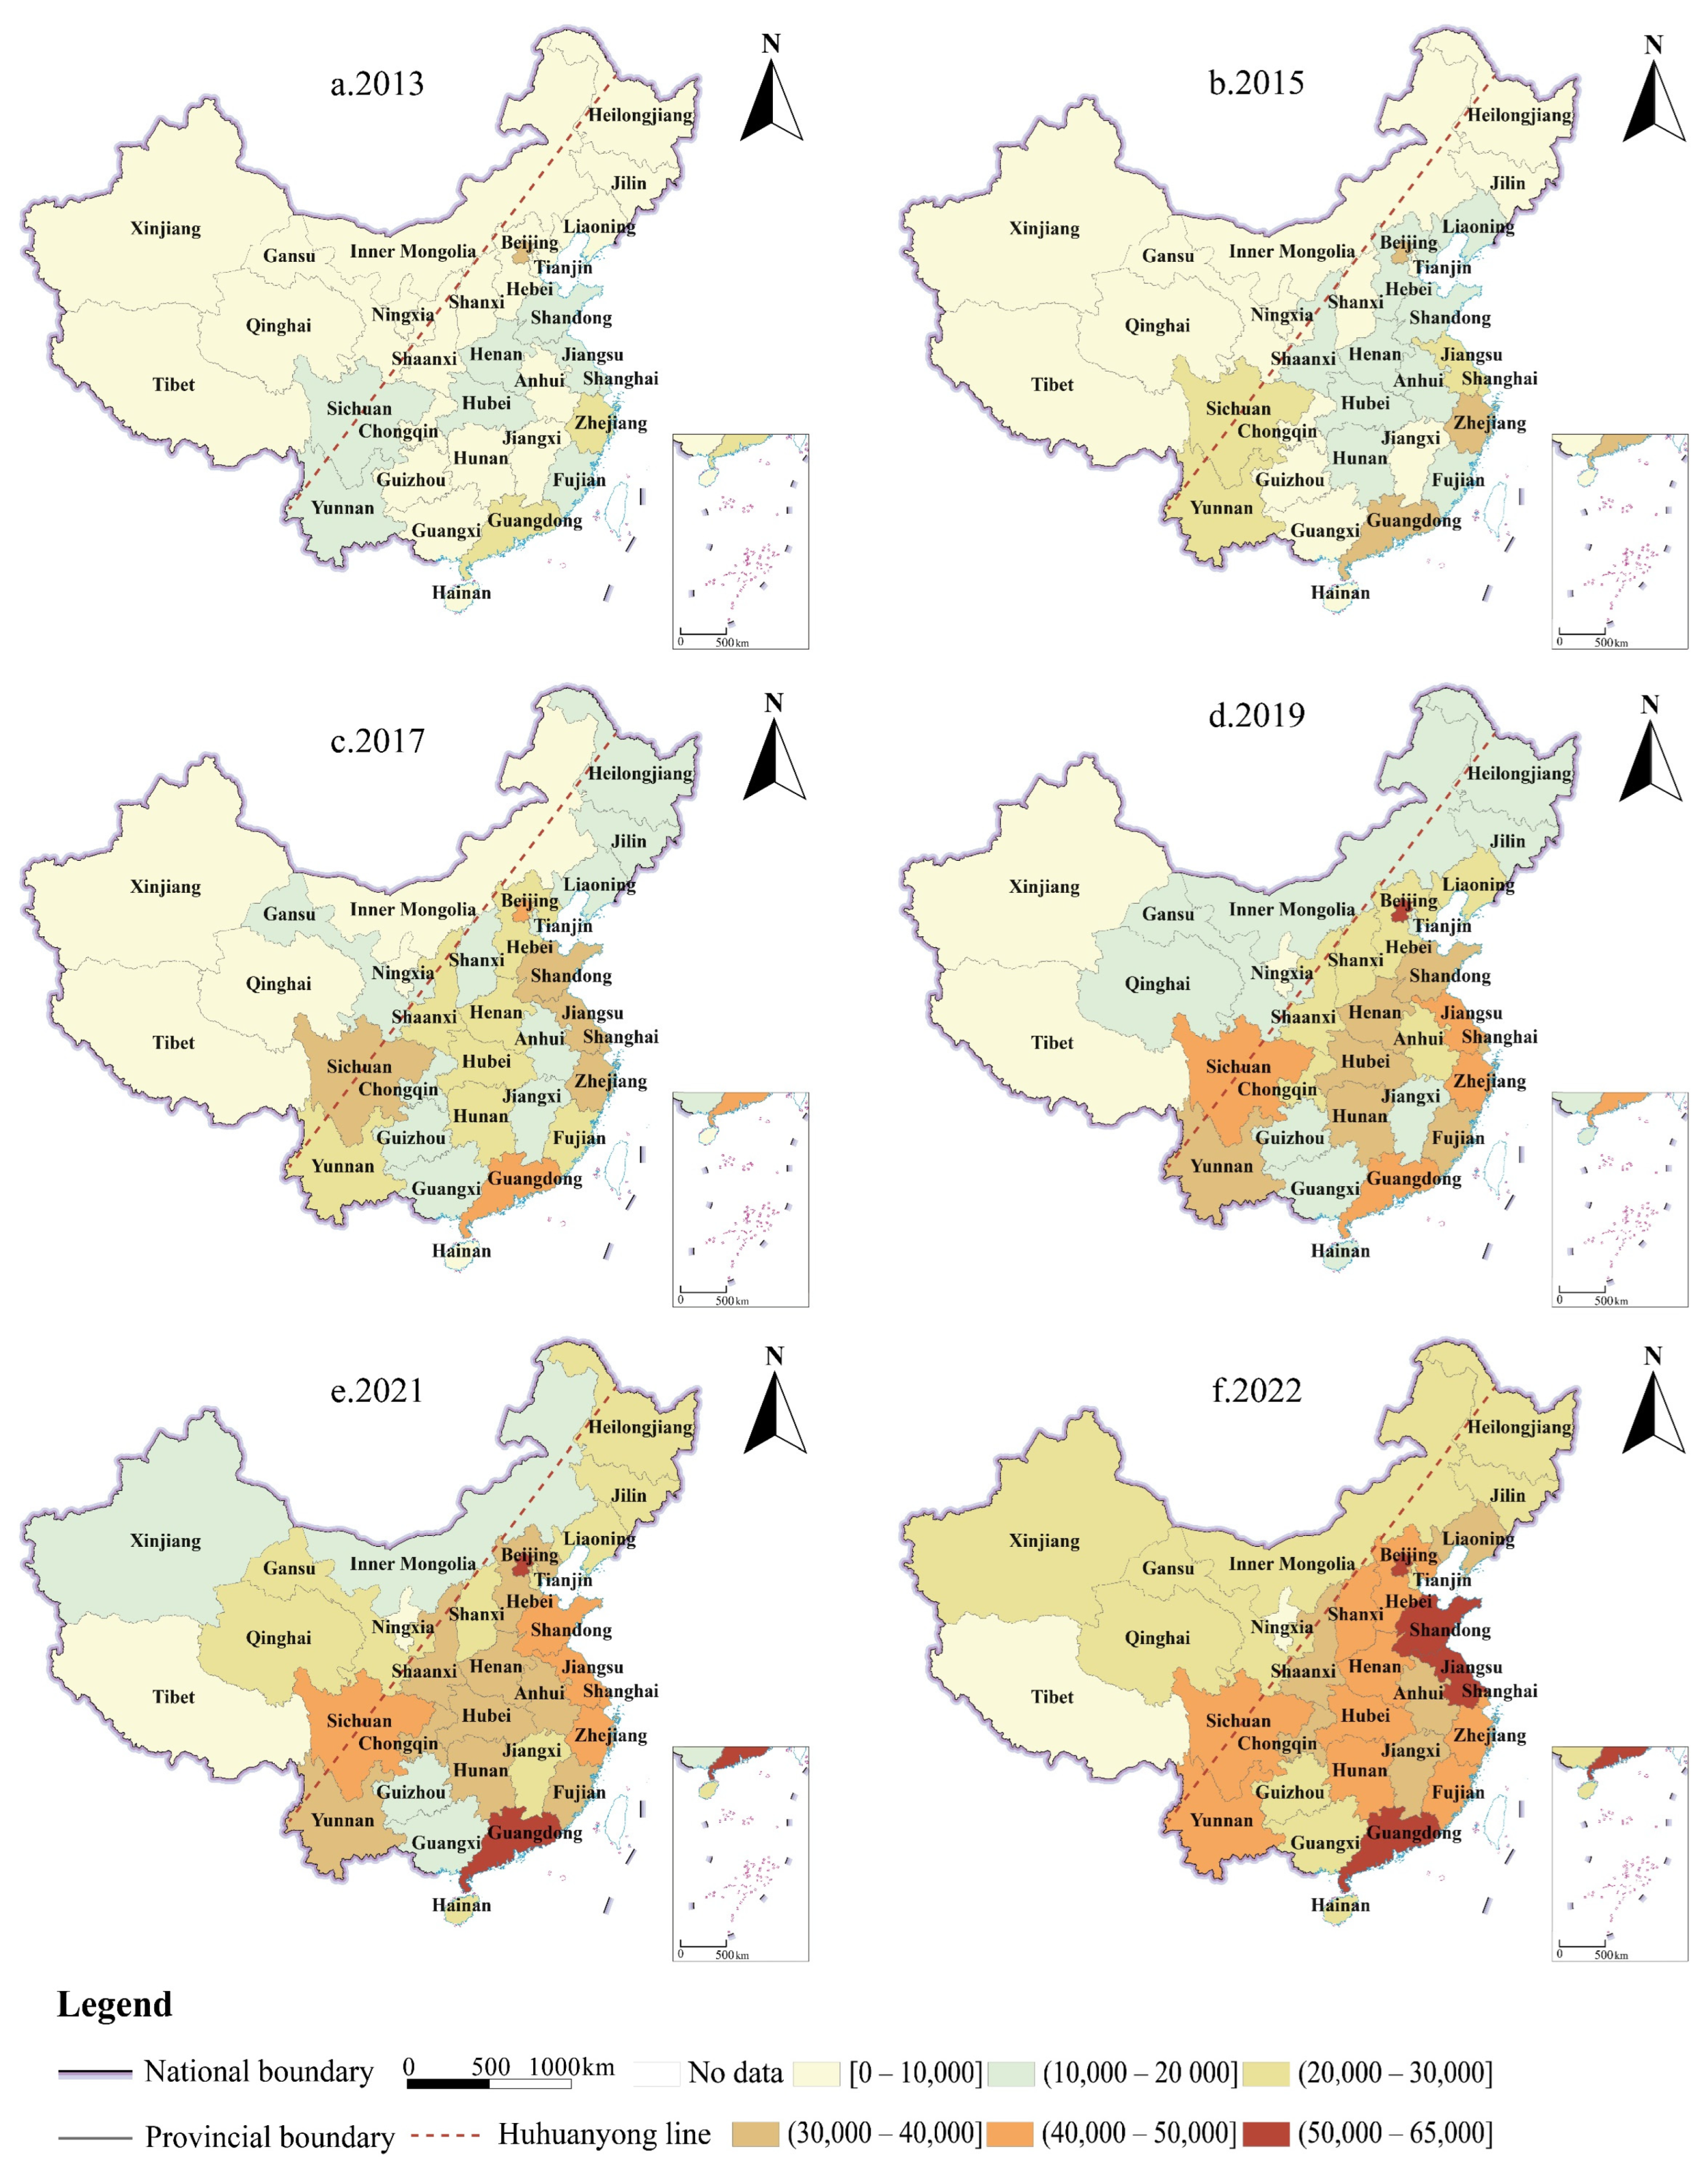
3.2. Spatial Evolution Characteristics of NPNA

3.2.1. Spatial Pattern Characteristics

ArcGIS was utilized to visualize the NPNA data spanning from 2013 to 2022 (Figure 5). The findings reveal a spatial pattern of NPNA across the country extending both horizontally and vertically from south to north and east to west. The eastern region exhibits concentrated areas of high NPNA, with a Baidu Index generally exceeding 40,000. Notably, provinces and municipalities such as Beijing, Guangdong, Zhejiang, Jiangsu, Sichuan, Shanghai, and Shandong demonstrate substantial attention. The central region, encompassing Hubei, Henan, Hebei, Hunan, Shaanxi, and Anhui, showcases a moderate level of attention, ranging from 20,000 to 40,000 in terms of the Baidu Index. Conversely, the western region, which comprises Qinghai, Xinjiang, Gansu, Guizhou, Ningxia, and Tibet, has consistently displayed low levels of attention over the past decade, characterized by a Baidu Index below 20,000. Moreover, areas with heightened attention primarily cluster around the eastern coastal regions and major cities, whereas regions with relatively lower attention are predominantly distributed in the western and remote inland areas.
The spatial analysis of national park network concern was conducted by calculating the indices using Equations (4)–(7) (Table 2). The results indicated that the spatial distribution of NPNA became more dispersed over the decade, displaying a moderate level of regional clustering and decreasing regional differences. The top two regions exhibited minimal disparity and were relatively balanced. More specifically, the GCI value rose from 16.9245 in 2013 to 18.9870 in 2015 and subsequently declined to 16.0481 in 2022. This indicates that the spatial distribution of NPNA became more dispersed, likely due to the rapid growth of emerging industries like tourism and the rising public interest in other tourist destinations. After reaching a maximum value of 0.4431 in 2015, the GC value falls to a minimum of 0.1860 in 2022, with an overall decreasing trend, indicating that the inequality in the attention of the national parks network among provinces is gradually decreasing. The CV value decreased from 0.7894 in 2013 to 0.3370 in 2022, signifying a substantial decrease in regional disparities in NPNA. Furthermore, the PI value ranged from 1.0 to 1.3, which indicates a balanced distribution. This suggests that the differences between the top two regions in terms of NPNA are not significant, likely due to the progressive promotion of national park construction and the increasing public awareness of nature preservation.

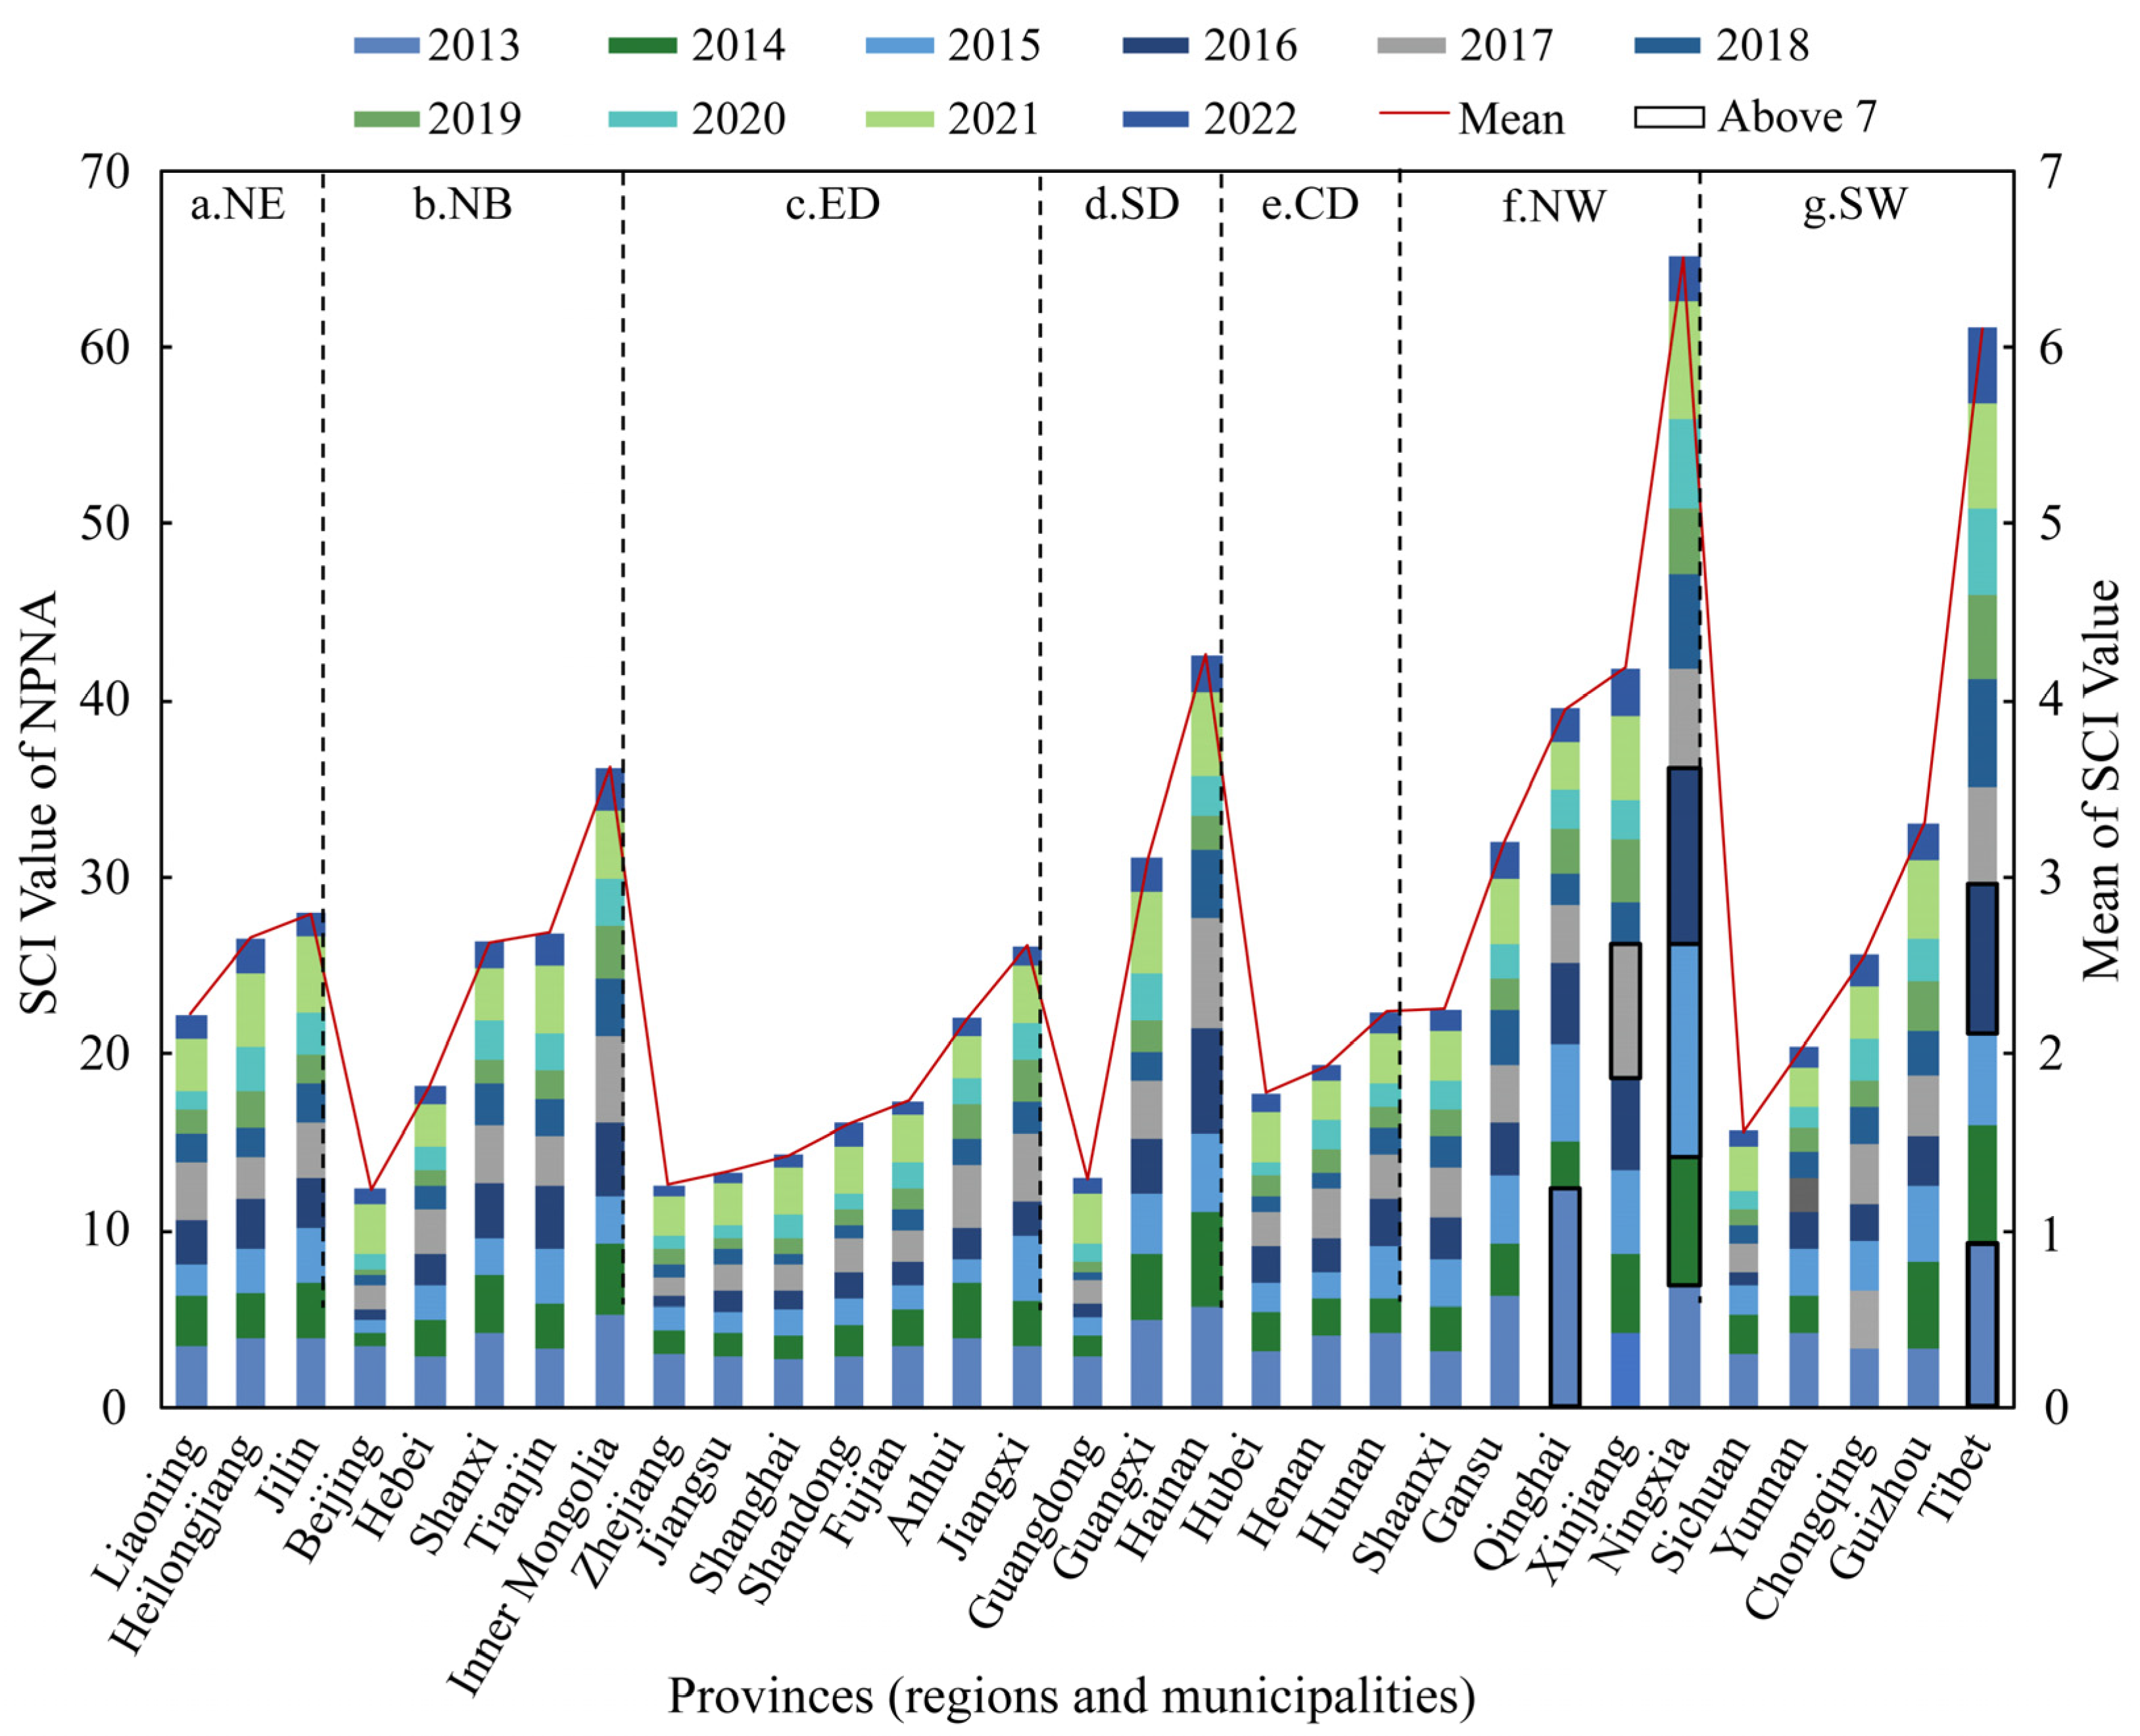
3.2.2. Spatial Differences Characteristics

To capture regional differences in NPNA across China, the 31 provinces (regions and municipalities) were categorized into seven regions. According to the total NPNA values, the east region exhibited the highest NPNA, significantly surpassing the North China region, which secured the second position, by 41.8%. In contrast, the northeast and northwest regions had the lowest NPNA values.
Figure 6 illustrates notable seasonal variations in NPNA across China between 2013 and 2022, indicated by an SCI value exceeding 1. Nevertheless, these differences gradually diminished over time, while certain regions continued to experience significant seasonal fluctuations in specific years. From a regional standpoint, all seven regions exhibited an upward trend in SCI values. Within Northwest and Southwest China, four provinces—Xinjiang, Qinghai, Ningxia, and Tibet—reported SCI values exceeding 7. This indicates that these provinces experienced more concentrated seasonal changes in NPNA during specific years, leading to significant intra-regional disparities. These patterns can be attributed to the distinctive monsoon climate and geographical features of Northwest and Southwest China. For instance, Ningxia and Qinghai experience extremely low temperatures during winter, rendering them unfavorable for travel during those months and resulting in decreased attention.
According to the index calculations (Figure 7), the GCI and PI values for NPNA in the East China remained relatively stable from 2013 to 2022. However, the GC and CV value exhibited notable fluctuations, with the GC value decreasing from 0.2578 to 0.0735 and the CV value decreasing from 0.2876 to 0.0898. This suggests a more balanced distribution of network attention within East China, with decreased disparities between provinces. In South China, the four index values consistently ranked the highest over the ten-year period, peaking in 2015 and gradually decreasing thereafter in a unimodal pattern. Despite the GCI, GC, PI, and CV values for 2022 decreasing to 60.9813, 0.1612, 1.9393, and 0.3400, respectively, they remain relatively high compared to other regions, signifying a relatively concentrated distribution of network attention in South China. From an index perspective, the GCI values of the seven regions exhibit distinct differences. With the exception of East China, where the GCI value was less than 50, the GCI values for the other regions ranged from 50 to 70, indicating a relatively dispersed distribution of NPNA in East China without clustering, while the remaining regions are characterized by aggregated and uneven distribution. Notably, South China exhibited the highest GCI value of 69.1651, denoting a concentrated distribution of NPNA within the region and significant variations among provinces, particularly with Guangdong province displaying a clustering phenomenon. Regarding the PI value, the average values for North China, South China, and Northwest China all exceed 2 and exhibit unstable variations. This signifies notable disparities in the attention levels between the top two ranked regions, indicating an uneven distribution of NPNA within these regions, primarily concentrated in specific areas. Notably, Beijing, Guangdong, and Shaanxi emerge as the core cluster areas within their respective regions. Additionally, NPNA in Central and Northeast China exhibited relative stability over the ten-year period, with a more evenly distributed attention among its provinces. This is shown by the relatively stable GCI values, as well as the low GC, PI, and CV values.

3.2.3. Spatial Correlation Characteristics

(1)
Global Spatial Autocorrelation Analysis
The global spatial autocorrelation of network attention was examined by calculating the global Moran’s I index for NPNA in China, using Stata17.0 software. From 2013 to 2022, the Moran’s I index of NPNA in China displayed a negative value, ranging from −0.065 to −0.111, indicating a significant negative spatial correlation that passed the 5% significance test (Table 3). This finding suggests a scattered and uneven distribution of NPNA across the country, with areas of high or low attention tending to be dispersed in space. Over the decade, the global Moran’s I value exhibited a continuous decrease, reflecting a strengthening spatial dispersion effect and a gradual reduction in spatial distribution differences. These results are consistent with the previous conclusion.
(2)
Local Spatial Autocorrelation Analysis
To examine the spatial heterogeneity of attention towards the NPNA in China, we conducted a local spatial autocorrelation analysis, revealing local spatial correlation patterns not captured by the global Moran index. The horizontal coordinate of the scatter plot represented the standardized value of network concern for each province (region and municipality), while the vertical axis represented the weighted average of all neighboring provinces (referred to as spatial lag). The resulting scatter plot visually displayed the provinces corresponding to each quadrant, which were subsequently mapped (Figure 8). The first and third quadrants exhibited positive spatial correlation, while the second and fourth quadrants exhibited negative spatial correlation.
The results reveal significant spatial heterogeneity and non-uniformity in the distribution of attention among the 31 provinces, including autonomous regions and municipalities. Based on the analysis of a four-quadrant scatter plot, the distribution pattern of attention among these regions has remained relatively stable in recent years, except for changes observed in Chongqing, Liaoning, Jiangxi, Hunan, Anhui, and Shaanxi. However, attention in other regions exhibits a certain level of spatial correlation stability. The majority of provinces, autonomous regions, and municipalities exhibit a distribution of the local Moran’s I index in the second and fourth quadrants, indicating a “high-low (H-L)” and “low-high (L-H)” agglomeration phenomenon in the NPNA, which highlights significant imbalances in these areas. Consequently, a higher level of attention from nearby urban areas may inhibit local attention. This phenomenon is particularly notable in the fourth quadrant, demonstrating a significant “low-high (L-H)” agglomeration, which includes Hebei, Henan, Hubei, Fujian, Shandong, Shanghai, Zhejiang, Jiangsu, Beijing, and Guangdong. These areas exhibit high levels of NPNA, whereas surrounding areas display lower levels of attention attributed to disparities in economic and internet development. Despite variations in the level of development and distribution of tourism resources among provinces, each province possesses significant geographic advantages, leading to variations in the degree of NPNA. Several additional provinces reside in the first and third quadrants, indicating a balanced development phenomenon characterized by “high-high (H-H)” and “low-low (L-L)” situations. For instance, the first quadrant primarily consists of Sichuan and Yunnan, two provinces with abundant tourist resources and close geographic proximity, facilitating mutual development and exhibiting high development potential. From a regional perspective, the provinces primarily situated in the first quadrant are concentrated in Southwest China. The second quadrant encompasses certain provinces in the Northwest and Northeast regions, while the third quadrant is predominantly found in North and East China. Meanwhile, the fourth quadrant encompasses the majority of provinces nationwide, highlighting substantial spatial distribution heterogeneity among provinces in each region.

3.3. Influencing Factors Analysis

The influencing factors of NPNA are complex, encompassing multiple dimensions including source and destination. Building on previous research and adhering to the principles of scientific rigor, comprehensiveness, and accessibility, we employed the literature analysis method during the indicator selection process. We reviewed the representative literature on tourism network attention and the spatial–temporal distribution of tourism flows, initially selecting 14 indicators for source push [50,51,52] and 31 for destination attractiveness [13,14,53,54,55]. Subsequently, 15 renowned experts in tourism management, human geography, ecological conservation, and urban and rural planning evaluated these indicators over three rounds using the Delphi method. Experts assessed each indicator’s relevance, representativeness, and data availability for NPNA, suggesting modifications that led to a scientific, comprehensive, and operable evaluation set. Based on expert feedback, this paper revised the indicator system, including five core indicators reflecting regional development and tourism consumption capacity from the source perspective (Table 4). For destinations, this paper selected seven dimensions to reflect the tourism attractiveness of national parks: Tourism Resources, Tourism Service Level, Transportation Convenience, Tourism Development Level, Environmental Suitability, Socio-Economic Development Level, and Tourism Informatization Level, incorporating 15 representative indicators (Table 4). The data for each indicator are mainly derived from official statistics, including authoritative publications such as the China Statistical Yearbook and China Tourism Statistical Yearbook, as well as statistical bulletins and data yearbooks published regularly by the National Bureau of Statistics, the Ministry of Culture and Tourism, and other government departments.

3.3.1. Influencing Factors of Tourist Source

Initially, a Pearson correlation test was performed using SPSS 24.0 software to analyze the relationship between the NPNA of each province (region and municipality) and the explanatory variables (Table 5). The results indicated a strong correlation between the various influencing factors and NPNA, as evidenced by the correlation coefficients of 0.613, 0.673, 0.478, 0.398, and 0.540, all exceeding 0.35. Furthermore, these coefficients passed the significance test at a 5% level. Subsequently, a panel data set was constructed. To prevent the occurrence of “pseudo-regression”, the explanatory variables were logarithmically transformed, and the stationarity of each variable was assessed to ensure the stationarity required for regression analysis. The Augmented Dickey–Fuller (ADF) method was employed to assess the stationarity of the data (Table 6). The results demonstrated that all variables rejected the null hypothesis at a 1% significance level, indicating the stationarity of the panel data and establishing the foundation for conducting regression analysis based on sequence stationarity. Additionally, a test was conducted to assess the presence of multicollinearity in the model (Table 7). The results indicated that all variables in the model had Variance Inflation Factor (VIF) values below 5, suggesting the absence of collinearity issues among the variables and satisfying the requirements for multiple regression analysis.
The NPNA Equation Model yielded a coefficient of determination (R2) of 0.777 and an adjusted R2 of 0.733, as shown in Table 7. This implies that the independent variables account for 77.7% of the variation in the dependent variable. The model successfully passed the F-test (F = 17.441, p = 0.000) and exhibited a Durbin–Watson statistic (D–W) of 2.014, signifying the absence of autocorrelation and indicating no correlation between the sample data. These findings indicate a strong fit and interpretability of the model. Among all variables, only population size exhibited a significant positive impact on NPNA at a 5% confidence level, with an effect coefficient of 0.468. Among other influencing factors examined, the coefficients were as follows: economic development level (0.150), internet development level (0.596), education level (0.363), and tourism consumption expenditure (0.312). However, none of these coefficients met the 5% significance threshold. Generally, the concept of national parks serving as spaces for natural resource conservation and public recreation is relatively novel in China, resulting in limited public understanding and awareness. Furthermore, the national park system’s establishment has been progressively promoted and implemented in recent years, with corresponding educational and promotional activities still not widespread. This scenario positions the current population size as a primary driver behind the increasing attention towards national parks. Additionally, the nonsignificant variables, despite their lack of significant direct effects on NPNA, should not be deemed unimportant. Instead, they may indirectly affect NPNA by influencing public awareness, travel preferences, and information access capabilities. As public comprehension of the national park concept deepens, the impact of these factors is likely to become increasingly evident.

3.3.2. Influencing Factors of Destination

The relationship between NPNA and each influencing factor was analyzed using the Pearson correlation test since the geographic detector was not applicable. The results indicated that all correlation coefficients were above 0.4 and passed the 5% confidence test, confirming the validity of the selected influencing factors. Then, the factor detection and interaction detection were performed.
The results of the factor probes (Table 8) show that the influencing factors of NPNA primarily revolved around six dimensions: Tourism Resources, Service Level, Development Level, Informatization Level, Transportation Convenience, and Environmental Suitability. Among the five factors, media promotion level (0.926), travel agencies number (0.789), regional informatization construction level (0.771), cross-city transport carrying capacity (0.686), and urban public transportation convenience (0.649) exhibited significant explanatory power. Media publicity level was manifested through online media’s capacity to enhance the visibility and recognition of the national park through direct reports, in-depth interpretations, and photo displays, thereby enabling a greater understanding of the value and significance of the national park. The regional informatization construction level determines whether internet users can access information, engage in interactions, and express their views promptly and effectively, leading to a substantial increase in public attention towards national parks. The tourism service capability is a fundamental requirement for the sustainable development of the destination tourism industry and significantly influences the tourist experience within national parks, particularly concerning factors such as local star-rated hotels, homestays, and the number of travel agencies. Prior to engaging in outdoor eco-tourism activities, consumers typically focus on the quality of local accommodations and travel agencies through social media platforms or tourism websites, thereby establishing a significantly positive relationship between tourism service level and network attention. Regarding transportation convenience, transportation is a fundamental requirement and a key concern for outdoor eco-tourism enthusiasts. The cross-city transport carrying capacity, such as high-speed rail, plays a pivotal role in connecting the origin and destination. Additionally, the environmental sanitation level (0.624), the tourism resources abundance (0.569), and the tourism reception scale (0.530) contribute to the explanatory power of NPNA to a certain extent. The levels of social and economic development, tourism’s economic contribution, and green construction exhibit limited explanatory power concerning NPNA and are not considered key influencing factors.
As depicted in Figure 9, interaction detection of factors influencing NPNA in China identifies three interaction types: bivariate enhanced, nonlinear weaken, and univariate weaken. Most influencing factors demonstrate a bivariate enhanced relationship, signifying an overarching enhancement effect. Specifically, any two factors’ interaction increases their q value. The strongest interaction effect emerges from combining tourism resource abundance (X1) with media promotion level (X14), boasting an explanatory power of 0.9735, markedly higher than other combinations. This underscores the pivotal role of these two indicators’ combined impact in elevating NPNA. Combining the tourism informatization level (X15) with factors like overall regional economic level (X11) and urban development level (X13) yields an interaction explanatory power over 0.9, highlighting informatization’s significant role in the socio-economic context. For enhancing NPNA, factors such as the richness of tourism resources, effective promotion, high service quality, convenient transportation, and a comprehensive tourism development environment are mutually reinforcing and essential. Notably, the single-factor analysis results highlight the strong explanatory power of factors like media promotion level (X14) and informatization construction level (X15). However, combining these factors with others, such as the green construction level (X9), resident economic conditions (X12), and urban development level (X13), sometimes leads to nonlinear weaken interactions. Overall, nuanced strategies are essential for promoting NPNA. While media promotion and informatization significantly enhance NPNA, their combination with certain factors may not lead to expected enhancements. This necessitates a comprehensive understanding of both individual factors and their complex interrelations when devising strategies to enhance NPNA.

4. Discussion

4.1. Temporal Characteristics and Spatial Pattern of NPNA

Focusing on national parks, this paper analyzes the spatiotemporal dynamics of NPNA from 2013 to 2022 using the Baidu Index, revealing distinctive spatiotemporal differentiation characteristics. In the temporal dimension, NPNA exhibits cyclical fluctuations and seasonal differences, showing multiple peaks around holidays and distinct off-peak periods, echoing Li Shan et al.’s [10] findings on tourist attraction attention using the Baidu Index. Furthermore, this study illustrates how seasonal variations in attention to national parks correlate with the Chinese holiday system and cultural traditions [56,57], underscoring unique mechanisms that drive tourism demand in China. Spatially, NPNA displays marked regional disparities and imbalances, characterized by higher attention in the east and south and lower in the west and north. However, these disparities are gradually narrowing, with hotspots shifting towards the central and western regions. This finding aligns with Yan Jiyao et al.’s [58] study, which used the Baidu Index to map China’s attention to Russian tourism. This paper extends these insights by detailing the dynamic evolution of national parks’ attention at the provincial scale and the nuances of regional disparities, crucial for understanding spatial variations in park attractiveness and developing targeted strategies for national park development.
This paper conducts a systematic study on the concern for national parks from spatial and temporal perspectives, constructing a comprehensive analysis framework of “temporal characteristics, spatial pattern, and influence mechanism”. This framework aids in understanding the formation mechanisms and evolutionary laws governing the concern for national parks. Additionally, utilizing the Baidu Index, tourism statistics, geographic information, and other data sources—aided by spatial and temporal statistics, mathematical models, and other methods—we depict the dynamic landscape of NPNA. This approach exemplifies the research paradigm of multidisciplinary integration. Although previous studies have used search engine data to explore the spatial and temporal characteristics of tourism attention [7,8], most were confined to regional or urban scales, with a notable lack of targeted research on Chinese national parks [59]. By introducing and applying new methodologies like Prophet time series analysis, index analysis, regression models, and geo-detectors to the study of China’s national parks, this paper achieves innovation and expansion in the research scale, subject, and techniques. Building on the revealed spatial and temporal evolution of national park concern, this paper delves into the natural, humanistic, social, and economic factors influencing this concern. It proposes strategies for optimizing national parks’ spatial layout, enhancing service systems, and innovating marketing and promotion. This reflects the problem-oriented and practical value of national park research. Unlike Western research, which typically focuses on environmental and infrastructural factors [60], this paper integrates key factors such as resource endowment, policy atmosphere, and cultural psychology—aligned with Chinese characteristics—providing a targeted theoretical foundation and practical guidance for the high-quality development of national parks in China.

4.2. Implications for Ecotourism and Management of National Parks

Building upon the established background of national parks and the characteristics of spatiotemporal evolution, this study proposes three strategies to offer valuable insights for the precise marketing of national parks as tourist destinations and to facilitate their sustainable development.
First, enhance the tourism attractiveness of national parks. National parks should prioritize ecological considerations in the development and utilization of tourism resources, adopting a multi-pronged approach to enhance their attractiveness. For the developed resources, enhanced protection and value augmentation are essential, particularly through aspects of cultural cognition, interpersonal communication, and emotional experience. Firstly, there should be a reinforced comprehensive assessment of national parks, with a focus on protecting and developing ecological resources, continually enhancing the significance and value of these resources, and creating vibrant ecotourism landscapes. Secondly, leveraging seasonal characteristics to develop tourism products tailored for various seasons—like nature sightseeing tours in spring and autumn, ecological tours in summer, and ice and snow experience tours in winter—is advisable. Thirdly, in areas with lower visitor attention, strengthening infrastructure construction, enhancing service quality, boosting publicity, and enhancing the attractiveness and popularity of the national parks is crucial. Finally, developing and implementing scientific visitor management strategies to balance tourist numbers with ecological protection needs is essential, particularly during peak seasons. This includes optimizing visitor reception processes and implementing reservation systems to mitigate the ecological and environmental pressures of excessive tourism. For instance, Sanjiangyuan National Park, a pioneer among China’s national parks, is situated in the Qinghai-Tibetan Plateau’s hinterland, boasting abundant wildlife, significant ecological value, and extensive tourism resources. However, due to its alpine, anoxic climate and limited transport facilities, Sanjiangyuan National Park suffers from low visibility and reduced attention. In response, Sanjiangyuan National Park should develop eco-tourism products that capitalize on its plateau characteristics—like plateau hiking, visits to herdsman’s homes, and wildlife viewing—to enrich tourists’ experiences and sense of discovery, while continuing to prioritize ecosystem protection. Additionally, enhancing the park’s infrastructure, such as road traffic and communication networks, is vital to providing a more accessible and convenient environment for tourists. Moreover, utilizing new media channels to augment publicity and boost Sanjiangyuan National Park’s influence and reputation is recommended.
Second, enhancing NPNA is essential for tourism development. Strengthening public education about the concept, value, and importance of national parks is crucial for increasing public attention. Enhancing public understanding of national parks through diverse channels including media campaigns, educational programs, and social media activities can boost interest and awareness, thereby increasing NPNA. Relevant management departments and organizations should develop a long-term publicity and educational strategy to enhance public understanding and concern for national parks by disseminating knowledge, increasing media visibility, and promoting school and community engagement. Secondly, based on the temporal and spatial characteristics of national parks, targeted online publicity and marketing should be intensified to understand potential tourists’ needs and preferences, thereby crafting precise marketing strategies. Leveraging the abundant natural and cultural resources of national parks, distinctive tourism products should be developed to enhance the tourism experience and attract more attention and visits. Finally, national parks should enhance their online promotion and marketing, create tourism portals, establish information hubs, build new media platforms, and utilize social media to cultivate fan groups. Further analysis of potential tourists should be conducted, with targeted online content provided, utilizing new media technologies like short videos, metaverses, digital twins, mixed reality, and holographic projection to diversify tourism promotion forms and amplify their impact.
Third, optimizing the spatial layout of national parks is essential. National parks should incorporate ecological protection, scientific research, monitoring, and recreation experiences into their overall planning. This involves logically segregating core protection zones, ecological restoration areas, traditional use areas, establishing necessary buffer zones, and directing recreational activities to appropriate areas, all while ensuring ecological safety. Additionally, strengthening coordination and integration with neighboring regions to enhance regional transportation, information, and services, thereby improving both the accessibility of national parks and tourists’ perceptions of accessibility, is crucial. For instance, consider Shennongjia National Park in western Hubei, one of China’s richest biodiversity hotspots. However, this study reveals that NPNA in Hubei Province is relatively low, indicating a need for improved spatial agglomeration. This may be attributed to the poor accessibility of the mountainous Shennongjia area and also highlights shortcomings in the park’s spatial layout and functional zoning. Therefore, Shennongjia National Park should refine its spatial layout, enhance coordination with surrounding areas, and improve both accessibility and the visitor experience.

4.3. Research Constraints and Prospective Studies

This study has certain limitations that necessitate further improvement in future research. Firstly, although the Baidu Index provides a comprehensive measure of online attention, it may still exhibit biases. In future studies, considering a combination of data from search engines, OTA platforms, social media, and other sources could yield a more objective and multidimensional perspective. Secondly, due to data limitations, this study primarily explores the spatial and temporal patterns of NPNA, necessitating a strengthened analysis of the underlying mechanisms. Future research could analyze the impacts of various factors and their transmission paths by constructing spatial econometric models. Additionally, expanding the research scope to include county and scenic area levels, and deepening the interpretation through case studies of typical national parks, would enhance understanding. With advancements in digitalization and intelligence, research on NPNA is poised to enable multidimensional and dynamic monitoring and simulation predictions. Future research should fully leverage big data and AI, including coupling search engine data with GIS to develop spatial and temporal prediction models for NPNA; integrating multi-platform data and employing AI methods like NLP and sentiment analysis to dynamically depict online reputations and emotional trends of national parks; and utilizing immersive technologies such as augmented reality and virtual simulations to revolutionize the educational and promotional approaches in national parks. Combining NPNA research with traditional methods such as questionnaires and interviews could provide a more comprehensive and reliable foundation for decision-making in national parks. Moreover, theoretical exploration should be enhanced by integrating theories of tourism demand, consumer behavior, and destination choice, to develop a comprehensive theoretical framework influencing the formation and evolution of NPNA. Furthermore, the practical application should be intensified by proposing optimization strategies for the planning, construction, marketing, and management of national parks, thereby facilitating innovation in their institutional and operational mechanisms. The study of NPNA holds promise and requires deeper engagement in both theoretical innovation and practical application.

5. Conclusions

This study examines the spatial and temporal characteristics of NPNA and its influencing factors from 2013 to 2022, using Baidu Index data. The main conclusions are as follows:
(1)
NPNA displays a generally increasing annual trend, with notable cyclical fluctuations peaking around holidays and during spring and autumn, reflecting clear seasonality and precursor effects. It also exhibits volatility due to external events.
(2)
The spatial distribution of NPNA is characterized by an unbalanced “high in the east and low in the west” and “high in the south and low in the north” pattern. However, these regional disparities are diminishing, with attention hotspots increasingly spreading to the central and western regions.
(3)
The size of the population in the source area is a predominant factor, while the concept of national parks remains underrecognized. Key influencing factors include the destination’s tourism resource endowment, media promotion level, traffic conditions, and information technology level. A synergistic integration of abundant tourism resources and effective media promotion is crucial for enhancing NPNA.
(4)
In the mobile internet era, NPNA has emerged as a new indicator of tourism appeal. Accurately understanding the dynamics of attention, optimizing the spatial layout of national parks, enhancing the tourism service system, and intensifying brand promotion and marketing are essential for improving national park governance and advancing ecological civilization.
Based on the network attention perspective, this paper elucidates the spatial and temporal variations in the attractiveness of Chinese National Parks, enriching tourism geography research and the demand-side analysis of national parks, while providing insights into their planning, construction, marketing, and governance.

Author Contributions

Conceptualization, M.C.; methodology, M.C.; validation, Y.T.; formal analysis, M.C.; investigation, N.L. and R.H.; resources, D.D. and F.J.; data curation, D.D. and F.J.; writing—original draft preparation, M.C.; writing—review and editing, M.C. and D.D.; visualization, F.J. and T.X.; supervision, D.D. and F.J.; funding acquisition, D.D. and T.X. All authors have read and agreed to the published version of the manuscript.

Funding

This research was funded by the Key Project of Natural Science Research Project of Anhui Educational Committee, grant number 2022AH050244; Philosophy and Social Science Planning Project of Anhui Province, grant number AHSKQ2020D16; Research Project on the Innovative Development of Social Sciences in Anhui Province, grant number 2022CX159; Anhui Provincial Department of Education Major Project, grant number SK2020ZD25; Anhui Provincial Natural Science Foundation, grant number 2008085QC132; and the Doctoral Research Foundation of Anhui Jianzhu University, grant number 2020QDZ26.

Data Availability Statement

The data presented in this study are available on request from the corresponding author.

Conflicts of Interest

The authors declare no conflicts of interest.

References

  1. Guiding Opinions on Establishing a Nature Reserve System with National Parks as the Main Body. Available online: https://www.gov.cn/gongbao/content/2019/content_5407657.htm (accessed on 5 March 2023).
  2. General Plan for Establishing a National Park System. Available online: https://www.gov.cn/gongbao/content/2017/content_5232358.htm (accessed on 5 March 2023).
  3. Lei, S.; Gan, H.; Zheng, J.; Wen, Y. An Analysis of Households’ Cognition, Participation in and Support for Ecotourism in National Parks—A Case Study in Qinling Mountains. Chin. J. Agric. Resour. Reg. Plan. 2020, 41, 16–25. [Google Scholar]
  4. The 51st Statistical Report on China’s Internet Development. Available online: https://www3.cnnic.cn/n4/2023/0303/c88-10757.html (accessed on 5 March 2023).
  5. Fang, Z.Q. The Evolvement of Tourist Flow Over the Past Ten Years in Guangdong Province. Econ. Geogr. 2010, 30, 1200–1204. [Google Scholar]
  6. Fang, Y.; Cheng, X.; Huang, Z.; Guo, B. The Dislocation Characteristics and Mechanism of Network Attention and Tourists About Chinese National Scenic Spots. Econ. Geogr. 2020, 40, 204–213. [Google Scholar]
  7. Clark, M.; Wilkins, E.J.; Dagan, D.T.; Powell, R.; Sharp, R.L.; Hillis, V. Bringing Forecasting into the Future: Using Google to Predict Visitation in Us National Parks. J. Environ. Manag. 2019, 243, 88–94. [Google Scholar] [CrossRef]
  8. Bangwayo-Skeete, P.F.; Skeete, R.W. Can Google Data Improve the Forecasting Performance of Tourist Arrivals? Mixed-data Sampling Approach. Tour. Manag. 2015, 46, 454–464. [Google Scholar] [CrossRef]
  9. Huang, X.K.; Zhang, L.F.; Ding, Y.S. The Baidu Index: Uses in Predicting Tourism Flows—A Case Study of the Forbidden City. Tour. Manag. 2017, 58, 301–306. [Google Scholar] [CrossRef]
  10. Qiu, R.X.; Chen, L. Cyberspace Attention of Tourist Attractions Based on Baidu Index: Temporal Distribution and Precursor Effect. Geogr. Geo-Inf. Sci. 2008, 24, 102–107. [Google Scholar]
  11. Zhang, H.; Hu, J.; Liu, H.; Zhang, Y.; Li, S.; Li, X. Influence of Revolutionary Historical Dramas on the Network Attention of Related Red Tourist Attractions: A Case Study of the Age of Awakening. J. Cent. China Norm. Univ. (Nat. Sci.) 2022, 56, 1052–1063. [Google Scholar]
  12. Liu, J.; Chen, L.; Chen, Y. Spatial-temporal Evolutionary Characteristics and Influencing Factors of Network Attention to Tourism Public Opinion. Areal Res. Dev. 2019, 38, 88–94. [Google Scholar]
  13. Liang, L.; Fu, H.; Li, J.; Li, B. Spatio-temporal Dynamic Evolution and Influencing Factors of Net Celebrity City Network Attention: A Case of Xi’an. Sci. Geogr. Sin. 2022, 42, 1566–1576. [Google Scholar]
  14. Zhang, X.; Liang, X.; Gao, N.; Wang, L. An Analysis of the Spatial Network Structure and Formation Mechanism of the Attention Degree of Long-march-themed Red Tourism Resources. Tour. Sci. 2021, 35, 1–23. [Google Scholar]
  15. Gao, N.; Zhang, X.; Wang, L. Spatio-temporal Characteristics and Influencing Factors of Chinese Red Tourism Network Attention. J. Nat. Resour. 2020, 35, 1068–1089. [Google Scholar]
  16. Wang, C.; Lu, C.; Ba, D.; Ma, B.; Qin, Z. Spatio-temporal Evolution and Influencing Factors of Network Attention of Representative Ski Resorts in China. J. Nat. Resour. 2022, 37, 2367–2386. [Google Scholar] [CrossRef]
  17. Zou, Y.; Lin, W.; Zheng, X. Spatial-temporal Characteristics and Influential Factors of Network Attention to Tourism Security. Tour. Trib. 2015, 30, 101–109. [Google Scholar]
  18. Park, S.B.; Oh, C.M.; Choi, B.K. Using Twitter Data for Cruise Tourism Marketing and Research. J. Travel Tour. Mark. 2016, 33, 885–898. [Google Scholar] [CrossRef]
  19. Patel, S.S.; Patel, R.K. Quantifying Potential Tourist Behavior in Choice of Destination Using Google Trends. Tour. Manag. Perspect. 2017, 24, 34–47. [Google Scholar]
  20. Önder, I.; Gunter, U. Forecasting Tourism Demand with Google Trends for a Major European City Destination. Tour. Anal. 2016, 21, 203–220. [Google Scholar] [CrossRef]
  21. Lin, H.; Liu, W.; Wu, Y. A Study on the Influencing Factors of Tourism Demand from Mainland China to Hong Kong. J. Hosp. Tour. Res. 2021, 45, 171–191. [Google Scholar]
  22. Li, H.; Song, H.; Li, L. A Dynamic Panel Data Analysis of Climate and Tourism Demand: Additional Evidence. J. Travel Res. 2017, 56, 158–171. [Google Scholar] [CrossRef]
  23. Zhu, H.; Zhao, M.; Zhu, Z. Practice and Enlightenment of National Park Concession at Home and Abroad: A Case Study of Northeast China Tiger and Leopard National Park. World For. Res. 2022, 35, 50–55. [Google Scholar]
  24. Beaumont, N.J.; Mongruel, R.; Hooper, T. Practical Application of the Ecosystem Service Approach (ESA): Lessons Learned and Recommendations for the Future. Int. J. Biodivers. Sci. Ecosyst. Serv. Manag. 2017, 13, 68–78. [Google Scholar] [CrossRef]
  25. Brennan, L.; Rogan, L. Disseminating Environmental Ethics and Values: A Study of Ecotourism Business Owners. Tour. Rev. 2018, 73, 252–261. [Google Scholar]
  26. Belnap, J. Environmental Auditing: Choosing Indicators of Natural Resource Condition: A Case Study in Arches National Park, Utah, USA. Environ. Manag. 1998, 22, 635–642. [Google Scholar] [CrossRef]
  27. Liu, Q.; Yu, H. Functional Zoning Mode and Management Measures of Qianjiangyuan National Park Based on Ecological Sensitivity Evaluation. J. Resour. Ecol. 2020, 11, 617–623. [Google Scholar]
  28. Wang, Z.; Li, Y.; Hua, S.; Zhou, J.; Liu, W.; Liao, S. Functional Zoning of Potatso National Park by Ecological Protection Weighting. J. Nanjing For. Univ. (Nat. Sci. Ed.) 2021, 45, 225–231. [Google Scholar]
  29. Ma, J.; Kohori, T. Environmental Education of Yambaru National Park in Japan Based on Ecotourism and Biological Protection. Landsc. Archit. 2019, 26, 60–65. [Google Scholar]
  30. Zhang, L.; Li, L.; Zhan, C. National Park Environmental Education in the USA and Its Enlightenment to China. World For. Res. 2021, 34, 103–109. [Google Scholar]
  31. Yang, Z.; Xie, B.; He, X. On China National Park from the Perspective of Society-ecology System. J. Sichuan Norm. Univ. (Soc. Sci. Ed.) 2020, 47, 65–71. [Google Scholar]
  32. Gao, Q.; Jin, G.; Cui, Z.; Zhang, H.; Lu, B. Research on the Development of Ecotourism in the Entrance Community of the Northeast Tiger and Leopard National Park. Agric. Sci. J. Yanbian Univ. 2020, 42, 104–109. [Google Scholar]
  33. Huang, D.; Li, M.; Li, Q.; Liu, F. SWOT Analysis of Ecotourism in Shennongjia National Park and Its Development Strategy. Saf. Environ. Eng. 2019, 26, 50–55. [Google Scholar]
  34. Xiang, B.; Zeng, Y. Ecotourism Construction and Operating Mechanism in the Sanjiangyuan National Park System Pilot Area, China. Resour. Sci. 2017, 39, 50–60. [Google Scholar]
  35. Baidu Index. Available online: https://index.baidu.com/ (accessed on 15 March 2023).
  36. Liu, M.G. Atlas of Physical Geography of China, 3rd ed.; Chinese Map Press: Beijing, China, 2010. [Google Scholar]
  37. China Standard Map Service. Available online: http://bzdt.ch.mnr.gov.cn/index.html (accessed on 5 March 2023).
  38. Agus, S. A Hybrid Forecasting Model Using LSTM and Prophet for Energy Consumption with Decomposition of Time Series Data. PeerJ Comput. Sci. 2022, 8, e1001. [Google Scholar]
  39. Boussalem, S.; Salah, C.; Bouziane, I.; Salim, M.; Ghalem, F. A Novel Hybrid Approach for Daily Tourism Arrival Forecasting: The Prophet-Bayesian Gaussian Process-Forward Neural Network Model. Ing. Syst. Inf. 2023, 28, 833. [Google Scholar]
  40. Liu, Y.W.; Liao, W. Spatial Characteristics of the Tourism Flows in China: A Study Based on the Baidu Index. ISPRS Int. J. Geo-Inf. 2021, 10, 378. [Google Scholar] [CrossRef]
  41. Wang, M.; Li, S.; Wei, C. Spatial Distribution and Influencing Factors of High-quality Tourist Attractions in Shandong Province, China. PLoS ONE 2023, 18, e0288472. [Google Scholar] [CrossRef]
  42. Li, Y.Y.; Jin, G.Y.; Sun, B.Y.; Cui, Z.H.; Lu, B.S. Spatial and Temporal Differences of Chinese Tourists’ Travel Demands to North Korea. PLoS ONE 2022, 17, e0272731. [Google Scholar] [CrossRef]
  43. Wang, L.; Cao, X.S.; Li, T.; Gao, X.C. Accessibility Comparison and Spatial Differentiation of Xi’an Scenic Spots with Different Modes Based on Baidu Real-time Travel. Chin. Geogr. Sci. 2019, 29, 848–860. [Google Scholar] [CrossRef]
  44. Lin, Y.; Liu, Y.; Liu, L. A Panel Data-based Analysis of Factors Influencing Market Demand for Chinese Outbound Tourism. Asia Pac. J. Tour. Res. 2018, 23, 667–676. [Google Scholar]
  45. Wang, J.; Xu, C. Geodetector: Principle and Prospective. Acta Geogr. Sin. 2017, 72, 116–134. [Google Scholar]
  46. Song, Y.Z.; Wang, J.F.; Ge, Y.; Xu, C.D. An Optimal Parameters-based Geographical Detector Model Enhances Geographic Characteristics of Explanatory Variables for Spatial Heterogeneity Analysis: Cases with Different Types of Spatial Data. GIScience Remote Sens. 2020, 57, 593–610. [Google Scholar] [CrossRef]
  47. Wang, X.Y.; Wang, M.M.; Lu, X.J.; Guo, L.Z.; Zhao, R.X.; Ji, R.R. Spatio-temporal Evolution and Driving Factors of the High-quality Development of Provincial Tourism in China. Chin. Geogr. Sci. 2022, 32, 896–914. [Google Scholar] [CrossRef]
  48. Li, X.; Lu, H.; Xing, W.; Wu, S. Ecotourism in the Context of National Parks: Concept, Positioning, and Implementation. Ecol. Econ. 2021, 37, 117–123. [Google Scholar]
  49. Wu, J.Y.; Li, W.J.; Huang, J.P.; Zhang, J.L.; Chen, D.R. Key Techniques for Mobile Internet: A Survey. Sci. China Inf. Sci. 2015, 45, 45–69. [Google Scholar]
  50. Li, H.; Li, D.; Dong, X.; Xu, N. Spatial Patterns of 5A-level Tourist Attractions and Their Network Attention Degrees in China. J. Arid Land Resour. Environ. 2019, 33, 178–184. [Google Scholar]
  51. Li, B.; Zeng, C.; Liu, P.; Dou, Y. System Characteristics and Dynamic Mechanism of Transformation Development of Human Settlement Environment in Traditional Villages: A Case Study of Lanxi Village Jiangyong County. Econ. Geogr. 2019, 39, 153–159. [Google Scholar]
  52. Su, H.; Kang, W. Spatial-Temporal Characteristics of the Network Attention to Classical Red Tourist Attractions. J. Arid Land Resour. Environ. 2022, 36, 200–208. [Google Scholar]
  53. Tang, H.; Xu, C. Spatio-temporal Evolution and Influencing Factors of Chinese Red Tourism Classic Scenic Spots Network Attention. J. Nat. Resour. 2021, 36, 1792–1810. [Google Scholar] [CrossRef]
  54. Guo, X.; Mu, X.; Ming, Q.; Ding, Z. Spatial and Temporal Differentiation Characteristics of Transportation Service Function and Tourism Intensity Coordination: A Case Study of Yunnan Province. J. Nat. Resour. 2020, 35, 1425–1444. [Google Scholar]
  55. Ma, X.; Cui, P. Response Process and Influence Mechanism of Performing Enterprises to the Growth of Tourism Industry: A Case Study of Zhangjiajie’s “Charming Xiangxi”. Geogr. Geo-Inf. Sci. 2019, 35, 118–124. [Google Scholar]
  56. Zopiatis, A.; Loi, L.; Dionysiou, I. Tourism Seasonality: The Causes and Effects. Worldw. Hosp. Tour. Themes 2022, 14, 421–430. [Google Scholar]
  57. Zhou, S.; Jin, H. The Regional Differences and Influencing Factors of Tourism Development on Hainan Island, China. PLoS ONE 2021, 16, e0258407. [Google Scholar]
  58. Yan, J.; Zhao, Y.; Cui, P.; Guo, X. Spatio-temporal Difference and Influencing Factors of Network Attention to Russia in China. World Reg. Stud. 2021, 30, 1175–1186. [Google Scholar]
  59. Baranowski, C.; Maciejewski, B.; Głowacki, J.C. Identifying Temporal Patterns of Visitors to National Parks Through Geotagged Photographs. Sustainability 2019, 11, 6983. [Google Scholar] [CrossRef]
  60. Santos, S.; Silva, L.F.; Vieira, A. Protected Areas and Nature-based Tourism: A 30-year Bibliometric Review. Sustainability 2023, 15, 11698. [Google Scholar] [CrossRef]
Figure 1. Distribution of geographical regions in China. Source: China Standard Map Service, 2023.
Land 13 00826 g001
Figure 2. Technology roadmap.
Land 13 00826 g002
Figure 3. Trend Analysis of National Park Network Attention in 31 provinces (regions and municipalities) of China from 2013 to 2022. (a) Detailed view of the daily fluctuations of National Park Network Attention in 2013.
Land 13 00826 g003
Figure 4. Cyclical change in National Park Network Attention in 31 provinces (regions and municipalities) of China. (a) Holiday change; (b) Weekly change; (c) Monthly change; (d) Yearly change.
Land 13 00826 g004
Figure 5. Spatial distribution of National Park Network Attention in 31 provinces (regions and municipalities) of China in 2013, 2015, 2017, 2019, 2021, and 2022. Source: China Standard Map Service, 2023.
Land 13 00826 g005
Figure 6. The Seasonal Concentration Index (SCI) of National Park Network Attention in 31 provinces (regions and municipalities) of China from 2013 to 2022. (a) NE represents Northeast China, (b) NB represents North China, (c) ED represents East China, (d) SD represents South China, (e) CD represents Central China, (f) NW represents Northwest China, (g) SW represents Southwest China.
Land 13 00826 g006
Figure 7. Index results of National Park Network Attention in seven Geographical Administrative Regions of China from 2013 to 2022. (a) GCI represents Geographic Concentration Index, (b) GC represents Gini Coefficient, (c) PI represents Primacy Index, (d) CV represents Coefficient of Variation, NE represents Northeast China, ED represents East China, NB represents North China, CD represents Central China, SD represents South China, SW represents Southwest China, NW represents Northwest China.
Land 13 00826 g007
Figure 8. Distribution map of the local Moran’s I statistic for 31 provinces (regions and municipalities) of China in the scatter plot in 2013, 2015, 2017, 2019, 2021, and 2022. Source: China Standard Map Service, 2023.
Land 13 00826 g008
Figure 9. Interaction detection results of destination factors affecting National Park Network Attention across 31 provinces (regions and municipalities) of China.
Land 13 00826 g009
Table 1. The Seasonal Concentration Index (SCI) and Herfindahl Index (HI) for monthly National Park Network Attention of China from 2013 to 2022.
Year2013201420152016201720182019202020212022
SCI0.86560.91090.74680.67761.76150.71231.06121.82505.70011.9043
HI0.08420.084330.08400.08390.08710.08390.08470.08730.12230.0877
Table 2. Index results of National Park Network Attention in 31 provinces (regions and municipalities) of China from 2013 to 2022.
YearIndices
GCIGCPICV
201318.25460.4207 1.31720.7894
201418.56680.3995 1.14590.7319
201518.98700.4331 1.10800.7948
201618.88160.4259 1.14370.7738
201717.57630.3227 1.13190.5710
201817.82920.3220 1.15170.5668
201917.26110.2757 1.09430.4840
202017.10440.2612 1.03430.4589
202116.43640.2387 1.14800.4229
202216.04810.1860 1.09570.3370
Table 3. Global Moran’s I index of National Park Network Attention in China from 2013 to 2022.
Year2013201420152016201720182019202020212022
Global Moran’s I index−0.065−0.069−0.070−0.067−0.088−0.096−0.097−0.096−0.097−0.111
z-score−1.928−2.151−2.198−2.003−3.257−3.704−3.754−3.747−3.787−4.648
p-value0.0270 0.0160 0.0140 0.0230 0.0010 0.0000 0.0000 0.0000 0.0000 0.0000
Table 4. National Park Network Attention Source and Destination Influence Factor Indicators.
Sources of Influencing FactorsDimensionSpecific IndicatorIDIndicator ExplanationUnit
Source region Economic ConditionsECPer Capita GDPCNY
Population SizePSResident Population10,000 people
Internet Development LevelINInternet Coverage%
Education DegreeEDProportion of People with Tertiary Education%
Tourism ExpenditureTEResident Consumption Expenditure on Communication, Culture, Education, Entertainment, and Medical CareCNY
DestinationTourism
Resources
Tourism Resources AbundanceX1Calculated by assigning value to Region 3A-level Scenic Area
Tourism
Service
Level
Star-rated Hotels
Number
X2Total number of hotels above three-star levelunits
Homestays NumberX3Data obtained from where the homestay isunits
Travel Agencies
Number
X4Total number of travel agenciesunits
Transportation
Convenience
Cross-city Transportation Carrying CapacityX5Passenger transport volume10,000 people
Urban Public Transportation ConvenienceX6Number of public buses per 10,000 peoplebus unit
Tourism Development LevelTourism Economy
Contribution
X7Total tourism revenue/Regional GDP%
Tourist Reception ScaleX8Number of domestic tourist receptions10,000 person-times
Environmental
Suitability
Green Construction LevelX9Green coverage rate of built-up areas%
Environmental
Sanitation Level
X10Road cleaning and maintenance area10,000 square meters
Socio-Economic
Development Level
Overall Regional
Economic Level
X11Per capita GDPCNY
Resident Economic ConditionsX12Per capita disposable income of urban residentsCNY
Urban Development LevelX13Urbanization rate%
Tourism
Informatization
Level
Media Promotion LevelX14Baidu News Index
Regional
Informatization
Construction Level
X15Broadband access users and mobile internet users10,000 households
Table 5. Results of correlation analysis of source region influencing factors on National Park Network Attention in 31 provinces (regions and municipalities) of China.
FactorsECPSINEDTE
NPNA0.613 **0.673 **0.478 **0.398 *0.540 **
Note: * and ** denote significant correlations at the 5% and 1% levels, respectively.
Table 6. Results of ADF stationarity tests of source region influencing factors on National Park Network Attention in 31 provinces (regions and municipalities) of China.
VariableTest Statisticp-ValueConclusions
lnNPNA−4.2060.001Stationary
lnEC−5.6930.000Stationary
lnPS−4.7930.000Stationary
lnIN−5.3160.000Stationary
lnED−3.5890.006Stationary
lnTE−3.8350.003Stationary
Table 7. Results of panel data regression model of source region influencing factors on National Park Network Attention in 31 provinces (regions and municipalities) of China.
IndicatorUnstandardized CoefficientsStandardized
Coefficients
t-Valuep-ValueCollinearity
Statistics
BStandard ErrorBetaVIF
Constant0.0014.3710.0001.000
lnEC0.1500.2710.0990.5530.5853.625
lnPS0.4680.0780.7076.0280.000 **1.543
lnIN0.5960.5730.1121.0410.3081.310
lnED0.3630.3890.1900.9330.3604.639
lnTS0.3120.4320.1430.7210.4784.424
R20.777
Adj.R20.733
F-valueF = 17.441, p = 0.000
D-W value2.014
Note: ** denote significant correlations at the 1% levels.
Table 8. Factor detection results of destination factors affecting National Park Network Attention across 31 provinces (regions and municipalities) in China.
DimensionIDq-ValueDimensionIDq-Value
Tourism ResourcesX10.569 *Environmental SuitabilityX90.538
Tourism Service LevelX20.647 ***X100.624 ***
X30.565 *Socio-Economic Development LevelX110.567
X40.789 ***X120.527
Transportation ConvenienceX50.686 **X130.494
X60.649 ***Tourism Informatization LevelX140.926 ***
Tourism Development LevelX70.435X150.771 ***
X80.530 **
Note: *, **, and *** denote significant correlations at the 10%, 5%, and 1% levels, respectively.
Disclaimer/Publisher’s Note: The statements, opinions and data contained in all publications are solely those of the individual author(s) and contributor(s) and not of MDPI and/or the editor(s). MDPI and/or the editor(s) disclaim responsibility for any injury to people or property resulting from any ideas, methods, instructions or products referred to in the content.

