Article

Soil Organic Carbon Content and Its Relationship with the Stand Age in Tea Plantations (Camellia sinensis L.) in Fujian Province, China

1
Institute of Digital Agriculture, Fujian Academy of Agricultural Sciences, Fuzhou 350003, China
2
Key Laboratory of Ecosystem Network Observation and Modeling, Institute of Geographic Sciences and Natural Resources Research, Chinese Academy of Sciences, Beijing 100045, China
*
Author to whom correspondence should be addressed.
Land 2024, 13(6), 834; https://doi.org/10.3390/land13060834
Submission received: 15 May 2024 / Revised: 8 June 2024 / Accepted: 11 June 2024 / Published: 12 June 2024

Abstract

:
Optimizing soil carbon content is essential for mitigating climate change. Understanding the soil organic carbon (SOC) contents and their relationship with plantation age is important for enhancing SOC in tea plantations. However, there is still a lack of studies in quantifying the SOC–age curve of the whole life cycle in tea plantations. Thus, in this study, we collected 140 soil samples aged 3 to 60 years in the four representative regions (Anxi, Datian, Qingliu, and Fuzhou) in Fujian Province to quantify the SOC contents and their relationship with plantation age. We found that the average SOC was 14.6 ± 6.1 g/kg in the four sampling regions. Nitrogen (N) emerged as having a highly significant positive correlation with SOC (R2 = 0.9). We also found a significant negative correlation between SOC and mean annual temperature (MAT) (R2 = 0.6), and a significant positive correlation with mean annual precipitation (MAP) (R2 = 0.6). The SOC increased with plantation age at 3–20 years old and peaked at 16–20 years old. After 35 years, the SOC decreased gradually with the aging of the plantation. The results indicated that tea plantations could be renewed after the age of 35. These results showed that optimizing age structure is important in enhancing SOC in tea plantations and is meaningful in achieving carbon neutrality.

1. Introduction

Since the beginning of the industrial revolution, the concentration of carbon dioxide (CO2) in the atmosphere has increased by 30.13% over 59 years owing to human activities [1]. Rising CO2 concentration leads to global warming and seriously threatens human society. To tackle this, the world must reduce anthropogenic CO2 emissions by at least 50% by 2030 to maintain a 50% chance of avoiding the worst impacts of climate change [2]. On 22 September 2020, Chinese President Xi Jinping announced at the 75th United Nations General Assembly that China will strive to achieve peak carbon dioxide emissions before 2030 and achieve carbon neutrality by 2060. Usually, it takes developed countries 60 years from the peak of carbon emissions to achieve the goal of carbon neutrality, but China’s commitment only took 30 years [3]. Thus, it is a daunting task and needs the joint efforts of the whole of society.
One of the most cost-effective ways to mitigate global warming is to absorb atmospheric CO2 into the terrestrial ecosystem, which is critical in achieving regional and national carbon neutrality [4,5,6]. Soil is an irreplaceable carbon pool that can dynamically act as a carbon source or sink and plays a critical role in the global carbon cycle [7]. Globally, the amount of organic carbon in the soil is triple the amount of atmosphere carbon and about three times more than in vegetation biomass [8]. Vegetation, climate, and soil properties fundamentally shape soil organic carbon (SOC) content, influencing soil organic matter’s mineralization and sequestration processes [6,9]. Agriculture has a large potential for carbon sequestration. Increasing SOC in agriculture is important in mitigating global climate change and achieving carbon neutrality [6,10].
Tea (Camellia sinensis L.) is an evergreen shrub widely planted in mountainous subtropical regions [11]. Tea bushes capture CO2 from the atmosphere throughout the year, and the vegetation coverage of a tea plantation can reach 80–90%. Due to its high biomass, tea may act as a carbon sink in terrestrial ecosystems. Key management practices in these tea estates include high nitrogen (N) fertilization and an annual pruning routine [12,13]. Tea bushes must be pruned periodically each year to maintain a constant height and vegetative growth stage. After pruning, the pruning litter is generally left in the field as a potential source of organic matter in the soil, which leads to a high carbon input to tea plantation soils [14]. Most tea plantations have rotational or renewed life cycles from 40 years to 90 years, which may represent the potential to store a large amount of carbon in the soil [15]. In addition, the harvest carbon output of tea plantations is small, and the economic coefficient is only 0.2 [16]. Thus, we hypothesize that SOC accumulation in tea plantations varies with age.
There are many valuable studies on tea plantations’ carbon storage and plantation age [10,17,18]. The SOC of mature tea plantations is higher than that of other croplands and exceeds that of forests and other plantations such as bamboo [16]. The difference in young (3 years old) and mature (50 years old) plantation carbon storage is about 50.3% [19]. SOC levels and reserves are notably higher across tea plantations aged 31 and 43 years old than those in 19-year-old plantations [20]. Yulnafatmawita et al. [21] proposed that agricultural practices contribute to SOC storage and that SOC reserves generally rise with the age of the tea plantation despite regular tea leaf collection. However, these studies also studied certain ages of tea plantation and did not investigate the relationship between SOC and the whole plantation life cycle.
China holds the title of the world’s leading tea producer, boasting an expansive cultivation area of 3.23 million hectares [7]. This vast land area accounts for over 70% of the global tea cultivation space [22]. Furthermore, the nation’s tea yield reached an impressive 0.32 million tons, representing more than 40% of the total global tea output in 2020 [11]. In China, tea plantations are mainly distributed in southern and southwestern regions. Fujian is one of the most typical tea plantation provinces in China. Among the six tea categories, Fujian Province is the birthplace of black, white, and oolong tea [23]. In Fujian, tea is the most widely distributed economic crop and has a long history of tea planting, production, and processing [24]. Optimizing age structure can be a way to maintain and enhance the carbon sink in Fujian Province [25]. Thus, investigating SOC content and its correlation with plantation age is essential for achieving carbon neutrality in Fujian Province.
In this study, we focused on investigating the SOC content and its relationship with tea plantation age in Fujian Province, China. The specific objectives are (i) to quantify the SOC content in tea plantations in Fujian Province and (ii) to explore the relationship between SOC and plantation age in the whole tea life cycle using the SOC–age curve. The outcome of this study may provide a comprehensive understanding of SOC content and its correlation with stand age in the tea plantations in Fujian Province and be helpful for optimizing age structure in tea plantations to achieve carbon neutrality in Fujian Province.

2. Materials and Methods

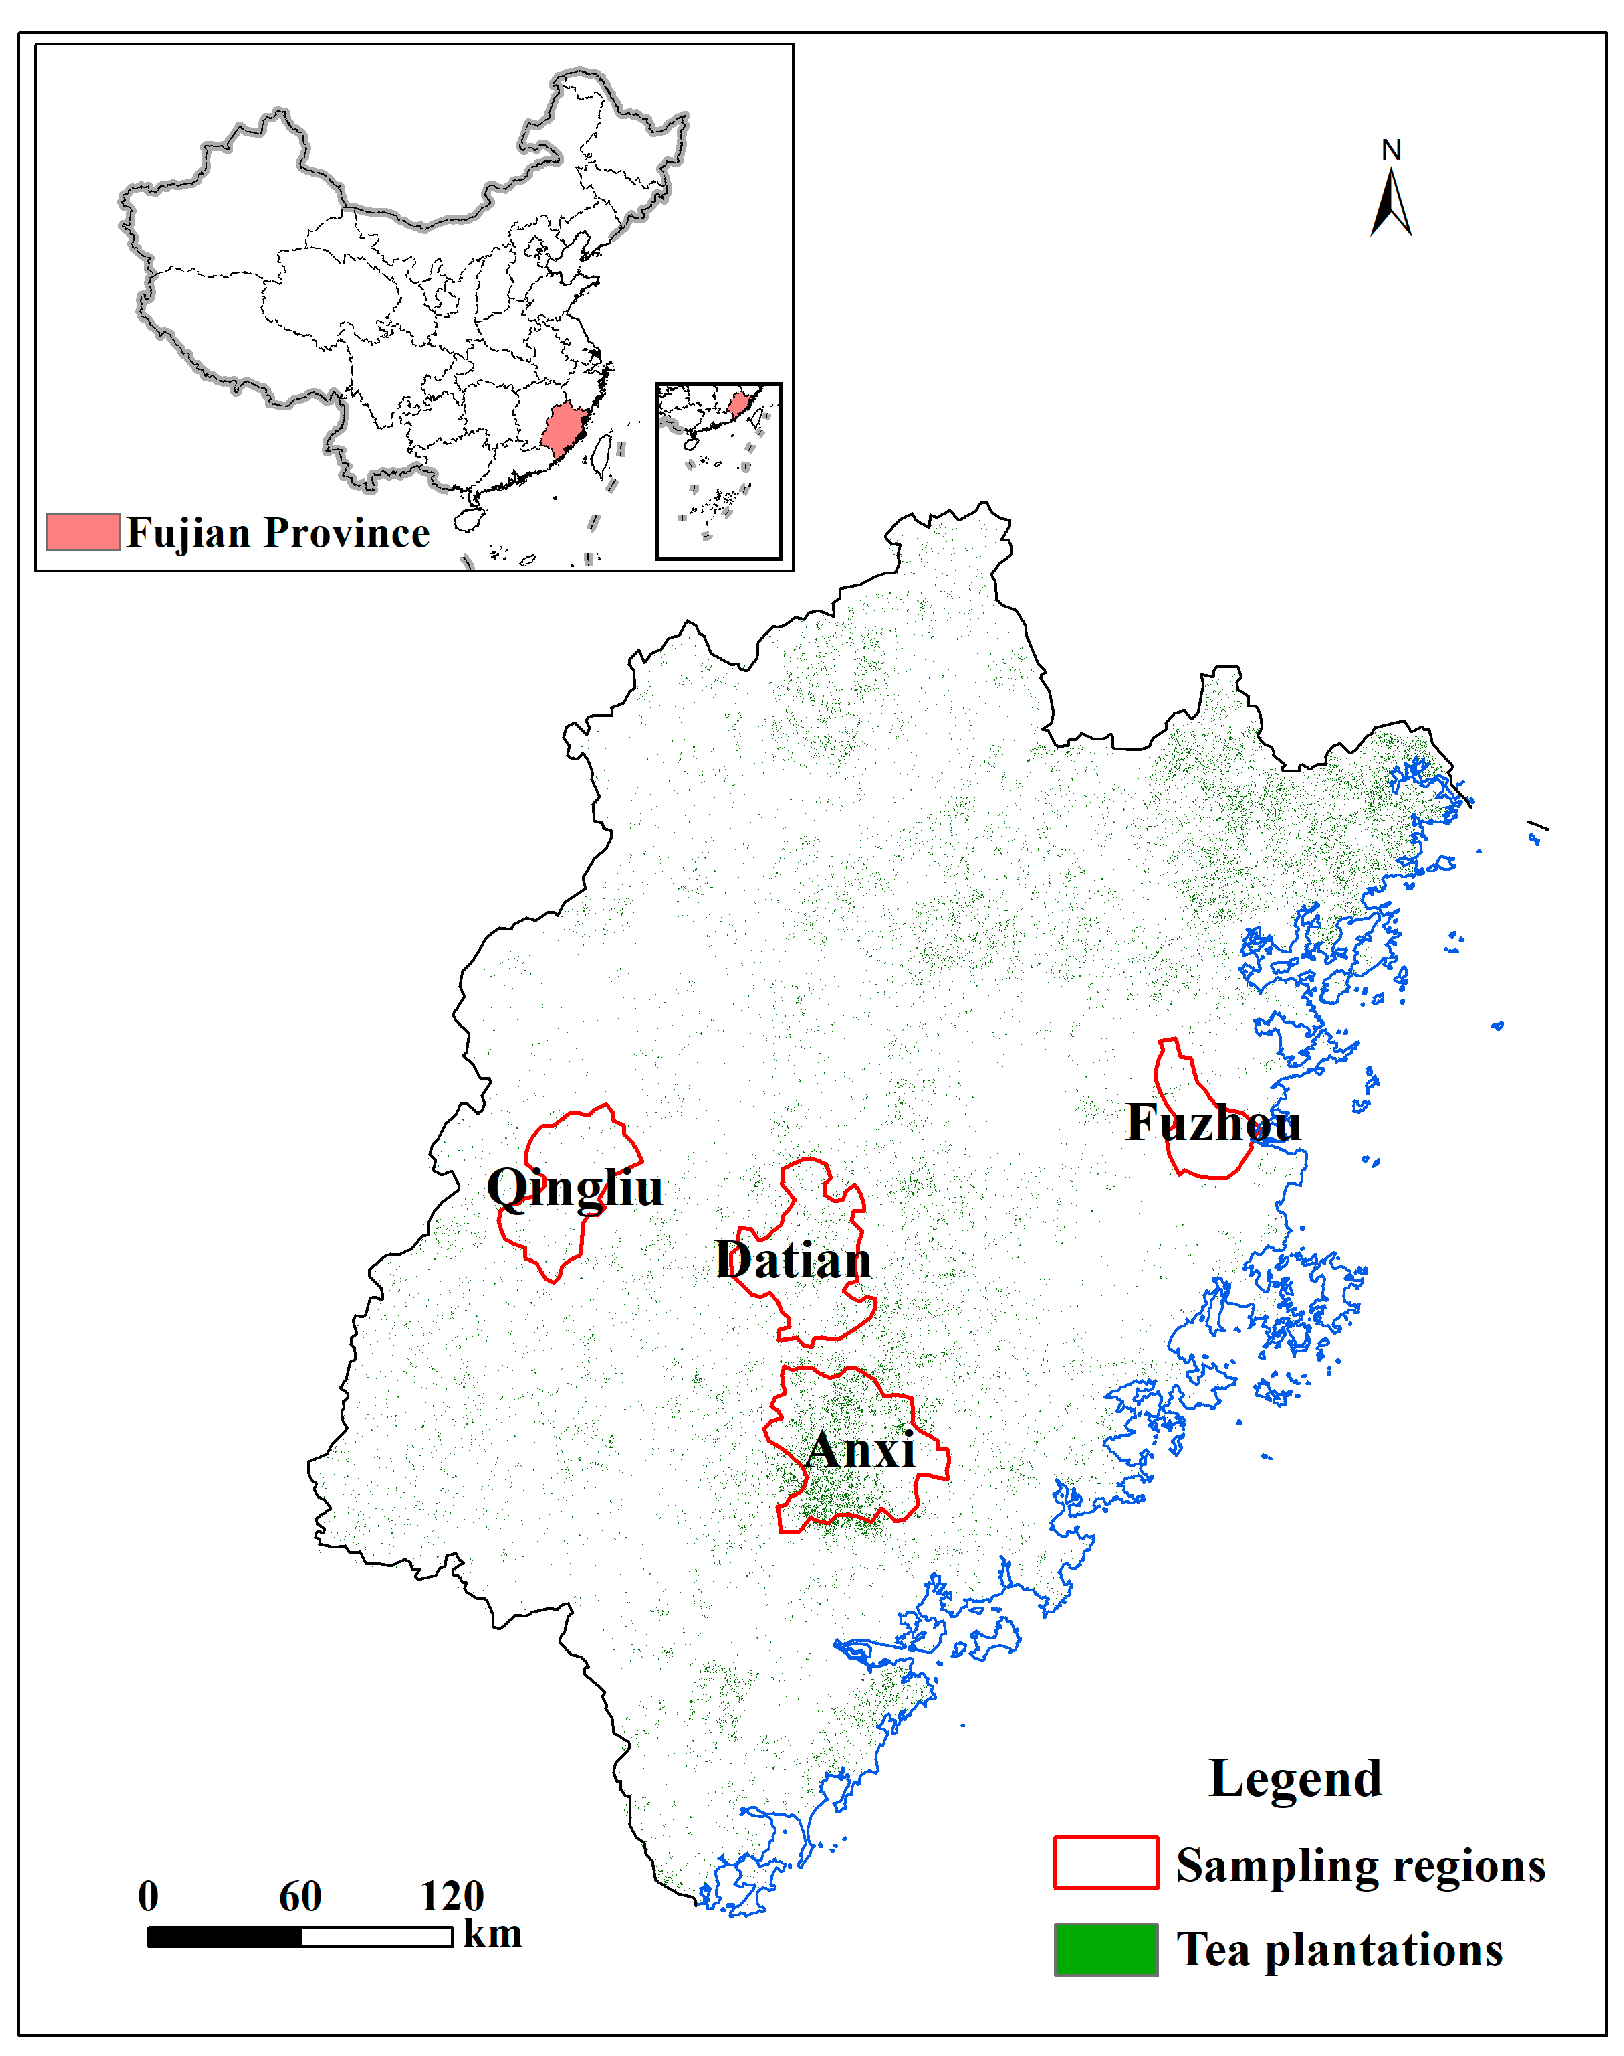
2.1. Sampling Regions

In this study, we collected soil data samples from the representative tea plantation counties of Anxi, Datian, Qingliu, and Fuzhou City in Fujian (Figure 1). Anxi County is located in Quanzhou, Fujian. It is the birthplace of the world-famous tea Tieguanyin. The county’s tea plantations cover an area of 2428 km2, ranked first in the country’s critical tea-producing counties in 2016, and was rated as a superior area for agricultural products with Chinese characteristics [26]. Datian County is located in the central part of Fujian Province. The existing tea plantation area is 403 km2, of which the ecological tea plantation area is more than 324 km2. Qingliu County is located in Sanming City, Fujian Province. The tea plantation area in Qingliu County is 114 km2. Fuzhou City strives to create green, ecological tea plantations. At the end of 2022, the city’s environmental tea plantations covered an area of 95 km2, accounting for 81.76% of the city’s total tea plantation. The mean annual temperature and precipitation in these regions range from 16.0 to 21.5 °C and 1513.0 to 2012.0 mm, respectively.

2.2. Sample Collection

Field work was conducted in July 2022, with selected tea plantation ages from 3 to 60. Before conducting soil sampling, any litterfall and weeds on the soil surface were removed. The bulk density (BD) was determined by collecting three mineral soil samples using volumetric cores at various depths within the soil profile. Soil samples were collected using a stainless steel soil sampler from 0 to 20 cm depth. For each sampling plot, we collected soil samples from five randomly selected, non-adjacent rows of tea trees and combined them to obtain a composite sample and ensure at least five sampling points in every age group. Ultimately, we obtained 140 composite soil samples from 3 to 60 years and divided the 140 soil samples into 12 groups by 5-year intervals. There are 67, 27, 24, and 22 soil samples of different plantation ages in Anxi, Datian, Qingliu, and Fuzhou, respectively. Then, we allowed them to air-dry at room temperature in the shade and removed all root residues and visible stones from these air-dried soil samples, and they were sieved through a 2 mm mesh to analyze soil physicochemical properties. After sieving through a 0.15 mm mesh, the soil samples were used to analyze the content of SOC, nitrogen (N), phosphorus (P), and potassium (K).

2.3. Measurement of Soil Physicochemical Parameters

In this study, we measured the soil physicochemical parameters of SOC, N, P, and K. The SOC and N were measured by an Elementar Vario EL III analyzer (https://speciation.net/Database/Instruments/elementar-Analysensysteme-GmbH/vario-EL-III-Element-Analyzer-;i1898, accessed on 16 July 2022). The Elementar Vario EL III analyzer is utilized in laboratories to measure soil SOC and N through a series of steps involving combustion, oxidation, reduction, drying, absorption, and detection. The measurement process is as follows: (1) Sample preparation: a known quantity (typically between 10 and 500 mg) of the soil sample is placed in a rectangular tin boat, tightly packed, and then loaded onto an automatic sampler plate for automated sampling. (2) Combination: The sample enters the combustion furnace, combusted under oxygen flow at temperatures ranging from 958 to 962 °C. This process converts organic matter into gases such as CO2 and N2. (3) Secondary Oxidation: Combustion products pass through a secondary combustion furnace, further oxidized at temperatures between 898 and 902 °C. (4) Reduction: The combustion products enter a reduction tube where, under the action of tungsten trioxide, cupric oxide, and copper, nitrogen is further converted to N2 and carbon to CO2. (5) Drying: The gas mixture passes through a P2O5 drying agent to remove moisture. (6) Absorption and Detection: The gas enters an adsorption column where CO2 is absorbed. Nitrogen enters a thermal conductivity detector for measurement of nitrogen content. CO2 in the adsorption column is subsequently released and measured using the thermal conductivity detector for carbon content determination. This method ensures high precision, accuracy, and repeatability, with recovery rates typically above 98%. It allows for the analysis of various types of soils, providing valuable insights into soil nitrogen levels, which are crucial for agricultural practices and environmental studies.
P and K were analyzed following inductively coupled plasma atomic emission spectroscopy (ICP-AES; Thermo Jarrell Ash Ltd., Toronto, ON, Canada) (https://www.spectralabsci.com/equipment/thermo-jarrell-ash-iris-advantage-inductively-coupled-plasma-optical-emission-spectrometer/, accessed on 16 July 2022). First, soil samples are ground to a fine powder to increase surface area for better digestion, and then the soil is dissolved in acid to break down organic matter and convert minerals into soluble forms. The resulting solution is filtered to remove any undissolved particles. Then, the prepared sample solution is introduced into the ICP-AES instrument. This process excites the atoms in the sample, causing them to emit light at specific wavelengths characteristic of the elements present. The emitted light is detected by a spectrometer, which measures light intensity at various wavelengths. The concentration of these elements in the soil sample can be determined by comparing the intensity of light emitted by the sample to a standard curve (created using solutions of known concentrations of P and K). Finally, the raw data collected by the ICP-AES are processed to calculate the final concentrations of P and K in the soil sample.

2.4. Measurement of Plant Area Index

Vegetation is one of the fundamental factors in shaping the SOC content. The plant area index (PAI), defined as one-half of the total surface plant area per unit ground surface area and consisting of the leaf area index (LAI) and woody area index (WAI), is closely related to the amount of pruning litter [27]. The LAI-2000 plant canopy analyzer (LI-COR, Lincoln, NE, USA) was used to measure the PAI in the tea trees above each soil sample. We measured PAI while collecting soil samples. The LAI-2000 instrument calculates gap fractions at five different zenith angles by analyzing the diffuse radiation that passes through the canopy. By assuming that leaf distribution is random across space, these gap fractions can then be translated into PAI values [28,29]. We measured PAI from five randomly selected, non-adjacent rows of tea trees (the same location as the soil samples) and averaged them as the PAI in the tea plantation.

2.5. Meteorological Data

The climate data included daily air temperature and precipitation at the meteorological station from the National Meteorological Information Center (NMIC; http://cdc.nmic.cn/home.do, accessed on 16 July 2022) of the Chinese Meteorological Administration (CMA). We used the AUSPLIN software (version 3.02) [30] to interpolate the data to 500 m × 500 m resolution in Fujian. AUSPLIN software creates an elevation effect and is widely used to interpolate climate data [31]. In this study, we used the average temperature and precipitation in 2001–2020 as the mean annual temperature (MAT) and mean annual precipitation (MAP) in the four sampling regions.

3. Results

3.1. The Content of SOC, N, P, and K in the Tea Plantations

There were different SOC contents in different sampling regions (Figure 2a). There was 65% SOC ranging from 10 to 20 g/kg. There were significant statistical differences between Anxi and Datian. The SOC contents in Datian were the highest; the average SOC was 17.3 ± 4.0 g/kg, followed by Qingliu and Anxi; Qingliu’s average SOC was 16.2 ± 5.6 g/kg, and Anxi’s average SOC was 15.6 ± 5.9 g/kg. Fuzhou tea plantation had the lowest SOC, 13.5 ± 3.9 g/kg. The average SOC value of the four sampling regions was 14.6 ± 6.1 g/kg.
This study also explored soil N, P, and K contents to examine the correlation between SOC and N, P, and K contents. In the four regions, there were no significance statistical differences in N content. The results indicated that the Qingliu tea plantation had the highest soil N content—the average N content was 1.5 ± 0. 6 g/kg—followed by Datian and Fuzhou, with an average N content of 1.4 ± 0. 4 g/kg and 1.3 ± 0. 3 g/kg, respectively; Anxi’s average N content was relatively lower, with 1.1 ± 0. 6 g/kg. The average soil N value of tea plantations in the four sampling regions was 1.3 ± 0. 6 g/kg (Figure 2b).
The soil P content is shown in Figure 2c. There were no significance statistical differences in P content in the four regions. The results showed that the Anxi tea plantation had the highest soil P content, 0.7 ± 0.6 g/kg, followed by Datian and Qingliu; the soil average P content was 0.6 ± 0.2 g/kg and 0.6 ± 0.3 g/kg, respectively. Fuzhou tea plantation’s soil P content was the lowest, with 0.5 ± 0.2 g/kg. The average soil P content in the four sampling areas was 0.6 ± 0.5 g/kg.
The soil K content is shown in Figure 2d. There were no significance statistical differences in K content in the four regions. The results indicated that among the four sampling regions, the soil average K content of Anxi and Qingliu tea plantations was close—the average K content was 10.0 ± 6.8 g/kg and 9.9 ± 3.7 g/kg, respectively—followed by Fuzhou; the soil average K content was 8.6 ± 3.5 g/kg. The soil K content in the Datian tea plantation was lower, with 8.2 ± 2.1 g/kg. The average soil K content in the four sampling areas was 9.4 ± 5.4 g/kg.

3.2. Correlation between SOC and Physicochemical and Meteorological Properties

This study used all sampling data from the four regions to analyze the correlation between SOC and N, P, and K. The results indicated significant positive correlations between SOC and N (Figure 3a) and P (Figure 3b) in the tea plantation, with the R2 at 0.92 and 0.40, respectively. However, the tea plantation soil SOC and soil K content showed a negative correlation, with an R2 of 0.14 (Figure 3c). The results show that the increase in soil N and P content benefits soil carbon fixation in tea plantations. In contrast, the rise in tea plantation soil K content will be detrimental to tea plantation soil carbon fixation.
In this study, we used the mean annual temperature (MAT) and mean annual precipitation (MAP) in the past 20 years (from 2001 to 2020) to investigate the effect of meteorology on SOC. We explore the correlation between SOC and MAT (Figure 4a) and MAP (Figure 4b) in the four sampling regions. We found a significant negative correlation between SOC and MAT and a significant positive correlation between SOC and MAP. In Fuzhou, the MAT was the highest (21.5 °C), the MAP (1513 mm) was the lowest, and the SOC (13.5 g/kg) was the smallest compared to the other three sampling regions. The MAT and MAP in Anxi and Datian Counties were relatively close, and SOC in Datian County was larger than in Anxi. In Qingliu County, the MAT was the lowest (16.0 °C), the MAP was the highest (2012 mm), and the SOC was larger than in Fuzhou City and Anxi County. These results indicated that sufficient precipitation is beneficial and warming is harmful to SOC accumulation.

3.3. Relationship between SOC and Tea Plantation Age

In the sampling, we selected tea plantations of different ages, ranging from 3 to 60 years. We divided them into 12 groups by 5-year intervals. There were 5 to 12 samples in each age group (Figure 5).
The tea plantations had different PAIs at different ages (Figure 6). The PAI was small in the age range of 3–5; the average value was 4.9 ± 0.9 m2/m2. In the young and mature tea plantations, the PAI increased with stand age and peaked at the age of 26–30, with an average PAI of 7.2 ± 1.1 m2/m2. After age 30, the PAI decreased with age and reduced to 4.9 ± 1.9 m2/m2 at the age of 56–60.
In this study, the SOC–age curve in tea plantations was fitted using a unimodal function model (Figure 7). At the age of 3–20 years, the SOC increased with plantation age. It increased from 10.32 ± 3.26 to 20.96 ± 6.77 g/kg, and reached its peak at 16–20 years. At the age of 21–35, the SOC range is relatively narrow, and the value of SOC ranges from 16.38 ± 5.38 g/kg to 17.24 ± 4.94 g/kg. After 35 years, the SOC decreases gradually with the gradual aging of the plantation. At 55–60, there was the lowest SOC; the average SOC was 9.71 ± 2.66 g/kg. The results indicated that the tea plantation could be renewed after the age of 35, which could benefit SOC accumulation in the tea plantations.

4. Discussion

4.1. SOC Content of the Tea Plantations in Fujian Province

In this study, we found different SOC contents in the different sampling regions. The average SOC in Anxi, Datian, Qingliu, and Fuzhou was 15.6 ± 5.9 g/kg, 17.3 ± 4.0 g/kg, 16.2 ± 5.6 g/kg, and 13.5 ± 3.9 g/kg, respectively. The average SOC value of the four sampling regions was 14.6 ± 6.1 g/kg in Fujian Province. Previous studies indicated that most tea-producing regions in China had SOC contents ranging from 10 to 20 g/kg; our sample data showed 65% SOC ranging from 10 to 20 g/kg in Fujian, which is consistent with previous studies [32].
The SOC differed in the sampling regions mainly due to vegetation, soil chemical properties, and meteorological conditions. Vegetation, being the primary source of SOC, significantly influences its dynamics by controlling the carbon influx from plant debris and promoting its interaction with the atmosphere [33]. In theory, applying high nitrogen levels and conducting regular pruning can lead to significant increases in SOC levels. Meteorological factors such as temperature and precipitation play a crucial role in balancing the carbon influx from plant litter against carbon losses due to decomposition, thereby affecting the quantity and composition of SOC [34].

4.2. The Drivers of SOC Content in Tea Plantations

The Pearson correlation analysis identified a notable connection between the content of SOC and soil N, P, and K. Among these variables, the content of soil N, a measure of soil chemical properties, emerged as having a highly significant positive correlation with SOC (R2 = 0.92), aligning with findings from other ecological systems [35,36]. Applying fertilizers, particularly N fertilizers, can positively impact the accumulation of SOC [37]. On the one hand, adding N can stimulate the activation of crystalline iron (Fe) in the soil, thereby enhancing the stability of SOC by decreasing its oxidation rate [6]. On the other hand, high levels of nitrogen can stimulate plant growth, leading to increased photosynthesis and thus higher carbon uptake by plants. This carbon is then stored in the soil as organic matter when plants die and decompose. Additionally, high nitrogen levels can affect microbial activity in the soil, influencing the decomposition rates of organic matter and thereby the balance between carbon input and output. Therefore, managing soil nitrogen levels is crucial for optimizing soil carbon storage capacity [38].
In this study, we found a significant negative correlation between SOC and MAT, and a significant positive correlation between SOC and MAP. These results are highly consistent with the previous studies [33,39]. Research has consistently demonstrated that temperature and precipitation significantly influence soil carbon storage by affecting soil carbon input and decomposition across different regions [33,40]. Adequate rainfall helps maintain soil moisture, which is essential for plant growth and productivity. Healthy vegetation contributes to greater carbon uptake during photosynthesis, leading to increased carbon accumulation in the soil. Additionally, water infiltration into the soil enhances organic matter formation, further enhancing carbon storage capacity [39]. Conversely, elevated temperatures can hinder soil carbon accumulation by accelerating the decomposition of SOC through microbial activity [41]. Higher temperatures can accelerate the decomposition of organic matter in soils, reducing the amount of stored carbon [40]. This process is known as heterotrophic respiration, where microorganisms break down dead plant material faster due to warmer conditions, releasing carbon dioxide back into the atmosphere. Conversely, cooler temperatures slow down this decomposition process, allowing more carbon to remain sequestered in the soil [33]. Consequently, these dynamics result in greater soil carbon storage in cooler, more humid environments, whereas warmer, drier conditions are associated with reduced soil carbon levels [42,43].

4.3. The SOC Content and Tea Plantation Age

In this study, we found that SOC increased at the age of 3–20 years and reached its peak at 16–20 years; after 35 years, the SOC decreased gradually with the aging tea plantation. The results are consistent with those of Li et al. [44], who reported that the levels of SOC were notably lower in tea plantations over 50 years old compared to those that were 23 years old, specifically in the southwest region of China. They found that a 23-year-old tea plantation had a better soil structure and could protect SOC well [44]. A similar study in Northeast India found that the SOC peaked in plantations aged between 10 and 15 years, reaching a maximum of 94.3 Mg C per hectare. After this peak, the SOC levels stabilized, averaging around 84 Mg C per hectare, but showed a slight dip to a minimum of 74.0 Mg C per hectare in plantations aged 20 to 25 years [10].
Vegetation is one of the critical factors influencing SOC accumulation in tea plantations. The PAI is an important indicator in assessing vegetation growth status. In this study, we investigated how PAI changes with a tea plantation’s age. The results indicated that the PAI increased in the young and mature tea plantations, peaked at the age of 26–30, and decreased after 30 years. Increasing the PAI could lead to increased plant photosynthesis and more ecosystem carbon sources. The significant contribution of carbon inputs, stemming from elevated litter production in the topsoil, has led to increased levels and reserves of SOC in tea plantations [10]. In older tea plantations, the primary factors contributing to the reduction in carbon accumulation over time in plants are primarily due to a decrease in gross primary productivity (GPP) and respiration (Ra), with GPP decreasing at a faster rate than Ra [45,46]. This decline in carbon uptake in older tea plantations can be attributed to nutrient limitations and ecological succession [47]. Moreover, older tea plantations typically have reduced nutrient availability due to prolonged biomass production and nutrient depletion, resulting in nutrient-poor soils in some areas. This nutrient scarcity hampers plant growth and diminishes the rate at which soil carbon is accumulated.
In addition, aging influences the distribution of assimilates towards the roots. As tea plantations mature, they undergo soil acidification, and aluminum (Al) and antibacterial compounds increase. This accumulation negatively impacts the diversity and activity of microorganisms [48]. Additionally, the reduction in litter and decreasing coverage with age enhances rainfall runoff, contributing to soil structure degradation [49].

4.4. Uncertainties and Implications

This study used soil sampling and laboratory methods to analyze the SOC content and its relationship with stand age in the tea plantations. The study also has some uncertainties. Firstly, due to the limitation of sampling conditions, we only chose four representative tea regions to collect soil data, which may result in some uncertainties in analyzing the SOC content in Fujian Province. Secondly, in the collected soil sample, it is difficult to gain the exact tea planting time from farmers, so the tea plantation age in this study is approximate, and we divided it into 5-year intervals. Thirdly, we only investigated SOC at soil depths of 0–20 cm in this study. Finally, we did not consider the effect of the previous history and management strategy on SOC in tea plantations. Thus, this study’s results only represent the topsoil’s SOC content. We will continue to collect more soil samples and investigate the 20–30 cm and 30–40 cm depth SOC conditions in further study.
As the acreage dedicated to tea cultivation expands, it becomes crucial to investigate management techniques that enhance SOC levels. Previous studies indicated that tea plantations employing ecological management methods—such as reduced tillage [50], minimal inorganic fertilizer use [51], or intercropping [52,53]—exhibit higher SOC concentrations, alongside superior tea quality and yield. In this study, we found that optimizing age structure in tea plantations is also one of the good ways to enhance SOC in tea plantations.

5. Conclusions

This study first attempts to explore the SOC–age curves of tea plantations in Fujian Province. We collected 140 soil samples aged 3 to 60 in the four representative regions (Anxi, Datian, Qingliu, and Fuzhou) and analyzed the content of SOC, N, P, and K in the laboratory. We found that the average SOC was 14.6 ± 6.1 g/kg in the four sampling regions, and had highly significant correlations with N, a significant negative correlation with MAT, and a significant positive correlation with MAP. These suggest that an increase in soil N content benefits soil carbon fixation, and that sufficient precipitation is beneficial but warming harms SOC accumulation. The SOC increased at the age of 3–20 years and reached its peak at 16–20 years; after 35 years, the SOC decreased gradually with the aging tea plantation. These results showed that optimizing age structure is important in enhancing SOC in tea plantations and is meaningful in achieving carbon neutrality. This finding is important not only for the global carbon cycle and climate projections but also for developing tea plantation management strategies to enhance carbon sinks by alleviating the age effect.

Author Contributions

Conceptualization, M.W. and J.Z.; methodology, M.W. and J.C.; software, S.Z.; validation, X.Z and S.Z.; formal analysis, J.C.; investigation, X.Z.; resources, J.C.; data curation, X.Z. and S.Z.; writing—original draft preparation, M.W.; writing—review and editing, J.Z. and J.C.; visualization, M.W. and S.Z.; supervision, J.Z.; project administration, J.Z.; funding acquisition, M.W. and J.Z. All authors have read and agreed to the published version of the manuscript.

Funding

This research was funded by the Fujian Academy of Agricultural Sciences External Cooperation Projects, grant number DWHZ2024-17; the Natural Science Foundation of Fujian Province, China, grant number 2021J01502; the Collaborative Innovation Project of High-Quality Development of Agriculture in Fujian Province, grant numbers XTCXGC2021015 and XTCXGC2021021; and the Fujian Intelligent Agricultural Science and Technology Innovation Team, grant number CXTD2021013-1.

Data Availability Statement

All the data used in this study are available from the corresponding author on reasonable request.

Conflicts of Interest

The authors declare no conflicts of interest.

References

  1. IPCC. Global Warming of 1.5 °C; Cambrodge University Press: Cambridge, UK; New York, NY, USA, 2018. [Google Scholar]
  2. He, M.-B.; Zong, S.-X.; Li, Y.-C.; Ma, M.-M.; Ma, X.; Li, K.; Han, X.; Zhao, M.-Y.; Guo, L.-P.; Xu, Y.-L. Carbon footprint and carbon neutrality pathway of green tea in China. Adv. Clim. Chang. Res. 2022, 13, 443–453. [Google Scholar] [CrossRef]
  3. Zhao, X.; Ma, X.; Chen, B.; Shang, Y.; Song, M. Challenges toward carbon neutrality in China: Strategies and countermeasures. Resour. Conserv. Recycl. 2022, 176, 105959. [Google Scholar] [CrossRef]
  4. Gao, S.; Chen, J.; Tang, Y.; Xie, J.; Zhang, R.; Tang, J.; Zhang, X. Ecosystem carbon (CO2 and CH4) fluxes of a Populus dettoides plantation in subtropical China during and post clear-cutting. For. Ecol. Manag. 2015, 357, 206–219. [Google Scholar] [CrossRef]
  5. Matysek, M.; Evers, S.; Samuel, M.K.; Sjogersten, S. High heterotrophic CO2 emissions from a Malaysian oil palm plantations during dry-season. Wetl. Ecol. Manag. 2018, 26, 415–424. [Google Scholar] [CrossRef]
  6. Di, S.; Zong, M.; Li, S.; Li, H.; Duan, C.; Peng, C.; Zhao, Y.; Bai, J.; Lin, C.; Feng, Y.; et al. The effects of the soil environment on soil organic carbon in tea plantations in Xishuangbanna, southwestern China. Agric. Ecosyst. Environ. 2020, 297, 106951. [Google Scholar] [CrossRef]
  7. Wang, D.; Wu, B.S.; Li, F.; Li, X.; Wang, Z.; Hou, J.; Cao, R.; Yang, W. Soil organic carbon stock in China’s tea plantations and their great potential of carbon sequestration. J. Clean. Prod. 2023, 421, 138485. [Google Scholar] [CrossRef]
  8. Rodriguez Martin, J.A.; Alvaro-Fuentes, J.; Gonzalo, J.; Gil, C.; Ramos-Miras, J.J.; Corbi, J.M.G.; Boluda, R. Assessment of the soil organic carbon stock in Spain. Geoderma 2016, 264, 117–125. [Google Scholar] [CrossRef]
  9. Xin, Z.; Qin, Y.; Yu, X. Spatial variability in soil organic carbon and its influencing factors in a hilly watershed of the Loess Plateau, China. Catena 2016, 137, 660–669. [Google Scholar] [CrossRef]
  10. Mishra, G.; Sarkar, A.; Giri, K.; Nath, A.J.; Lal, R.; Francaviglia, R. Changes in soil carbon stocks under plantation systems and natural forests in Northeast India. Ecol. Model. 2021, 446, 109500. [Google Scholar] [CrossRef]
  11. FAO; CAAS. Carbon Neutral Tea Production in China—Three Pilot Case Studies; Food and Agriculture Organization of the United Nations, FAO: Rome, Italy, 2021. [Google Scholar]
  12. Ni, K.; Liao, W.; Yi, X.; Niu, S.; Ma, L.; Shi, Y.; Zhang, Q.; Liu, M.; Ruan, J. Fertilization status and reduction potential in tea gardens of China. J. Plant Nutr. Fertil. 2019, 25, 421–432. [Google Scholar]
  13. Du, L.; Zheng, Z.; Li, T.; Wang, Y.; Huang, H.; Yu, H.; Ye, D.; Liu, T.; Zhang, X. The variation in organic carbon mineralization and its temperature sensitivity in soils after long-term planting of different tea varieties. Sci. Hortic. Amst. 2023, 309, 111612. [Google Scholar] [CrossRef]
  14. Yang, X.; Ma, L.; Ji, L.; Shi, Y.; Yi, X.; Yang, Q.; Ni, K.; Ruan, J. Long-term nitrogen fertilization indirectly affects soil fungi community structure by changing soil and pruned litter in a subtropical tea (Camellia sinensis L.) plantation in China. Plant Soil 2019, 444, 409–426. [Google Scholar] [CrossRef]
  15. Han, W.; Kemmitt, S.J.; Brookes, P.C. Soil microbial biomass and activity in Chinese tea gardens of varying stand age and productivity. Soil Biol. Biochem. 2007, 39, 1468–1478. [Google Scholar] [CrossRef]
  16. Zhang, M.; Chen, Y.; Fan, D.; Zhu, Q.; Pan, Z.; Fan, K.; Wang, X. Temporal Evolution of Carbon Storage in Chinese Tea Plantations from 1950 to 2010. Pedosphere 2017, 27, 121–128. [Google Scholar] [CrossRef]
  17. Matsuura, E.; Komatsuzaki, M.; Hashimi, R. Assessment of Soil Organic Carbon Storage in Vegetable Farms Using Different Farming Practices in the Kanto Region of Japan. Sustainability 2018, 10, 152. [Google Scholar] [CrossRef]
  18. Wang, S.; Li, T.; Zheng, Z. Tea plantation age effects on soil aggregate-associated carbon and nitrogen in the hilly region of western Sichuan, China. Soil Tillage Res. 2018, 180, 91–98. [Google Scholar] [CrossRef]
  19. Li, S.; Wu, X.; Xue, H.; Gu, B.; Cheng, H.; Zeng, J.; Peng, C.; Ge, Y.; Chang, J. Quantifying carbon storage for tea plantations in China. Agric. Ecosyst. Environ. 2011, 141, 390–398. [Google Scholar] [CrossRef]
  20. Chiti, T.; Diaz-Pines, E.; Butterbach-Bahl, K.; Marzaioli, F.; Valentini, R. Soil organic carbon changes following degradation and conversion to cypress and tea plantations in a tropical mountain forest in Kenya. Plant Soil 2018, 422, 527–539. [Google Scholar] [CrossRef]
  21. Yulnafatmawita, Y.; Yasin, S.; Haris, Z.A. Organic carbon sequestration at different age of tea [Camelia sinensis] plantation under the wet tropical area. IOP Conf. Ser. Earth Environ. Sci. 2020, 497, 012037. [Google Scholar] [CrossRef]
  22. NBS. National Data. Available online: https://data.stats.gov.cn/easyquery.htm?cn=C01 (accessed on 5 September 2022).
  23. Jiang, L.; Xie, S.; Zhou, C.; Tian, C.; Zhu, C.; You, X.; Chen, C.; Lai, Z.; Guo, Y. Analysis of the Genetic Diversity in Tea Plant Germplasm in Fujian Province Based on Restriction Site-Associated DNA Sequencing. Plants 2024, 13, 100. [Google Scholar] [CrossRef] [PubMed]
  24. Cheng, Q.; Luo, Z.; Xiang, L. Spatiotemporal Differentiation of Coupling and Coordination Relationship of the Tea Industry-Tourism-Ecological Environment System in Fujian Province, China. Sustainability 2021, 13, 10628. [Google Scholar] [CrossRef]
  25. Shang, R.; Chen, J.M.; Xu, M.; Lin, X.; Li, P.; Yu, G.; He, N.; Xu, L.; Gong, P.; Liu, L.; et al. China’s current forest age structure will lead to weakened carbon sinks in the near future. Innovation 2023, 4, 100515. [Google Scholar] [CrossRef]
  26. Li, W.; Geng, J.; Bao, J.; Lin, W.; Wu, Z.; Fan, S. Spatial and Temporal Evolution Patterns of Habitat Quality under Tea Plantation Expansion and Multi-Scenario Simulation Study: Anxi County as an Example. Land 2023, 12, 1308. [Google Scholar] [CrossRef]
  27. Chen, J.M.; Black, T.A. Foliage Area and Architecture of Plant Canopies from Sunfleck Size Distributions. Agric. For. Meteorol. 1992, 60, 249–266. [Google Scholar] [CrossRef]
  28. Wang, R.; Chen, J.M.; Liu, Z.; Arain, A. Evaluation of seasonal variations of remotely sensed leaf area index over five evergreen coniferous forests. Isprs J. Photogramm. 2017, 130, 187–201. [Google Scholar] [CrossRef]
  29. Miller, J.J., 3rd; Cole, L.J. The Immunologic Reactivity of Long-Lived Lymphocytes in situ in Rat Popliteal Lymph Nodes. USNRDL-TR-67-93. In Research and Development Technical Report. United States; Naval Radiological Defense Laboratory: San Francisco, CA, USA, 1967; pp. 1–20. [Google Scholar]
  30. Hutchinson, M.F. Interpolating mean rainfall using thin plate smoothing splines. Int. J. Geogr. Inf. Sci. 1995, 6, 385–403. [Google Scholar] [CrossRef]
  31. Wang, M.M.; Wang, S.Q.; Wang, J.B.; Yan, H.; Mickler, R.A.; Shi, H.; He, H.L.; Huang, M.; Zhou, L. Detection of Positive Gross Primary Production Extremes in Terrestrial Ecosystems of China During 1982-2015 and Analysis of Climate Contribution. J. Geophys Res. Biogeosci. 2018, 123, 2807–2823. [Google Scholar] [CrossRef]
  32. Yang, X.; Yi, X.; Ni, K.; Zhang, Q.; Shi, Y.; Chen, L.; Zhao, Y.; Zhang, Y.; Ma, Q.; Cai, Y.; et al. Patterns and abiotic drivers of soil organic carbon in perennial tea (Camellia sinensis L.) plantation system of China. Environ. Res. 2023, 237, 116925. [Google Scholar] [CrossRef] [PubMed]
  33. Wiesmeier, M.; Urbanski, L.; Hobley, E.; Lang, B.; von Luetzow, M.; Marin-Spiotta, E.; van Wesemael, B.; Rabot, E.; Liess, M.; Garcia-Franco, N.; et al. Soil organic carbon storage as a key function of soils—A review of drivers and indicators at various scales. Geoderma 2019, 333, 149–162. [Google Scholar] [CrossRef]
  34. Huang, Y.; Ren, W.; Grove, J.; Poffenbarger, H.; Jacobsen, K.; Tao, B.; Zhu, X.; McNear, D. Assessing synergistic effects of no-tillage and cover crops on soil carbon dynamics in a long-term maize cropping system under climate change. Agric. For. Meteorol. 2020, 291, 108090. [Google Scholar] [CrossRef]
  35. Pathak, P.; Reddy, A.S. Vertical distribution analysis of soil organic carbon and total nitrogen in different land use patterns of an agro-organic farm. Trop. Ecol. 2021, 62, 386–397. [Google Scholar] [CrossRef]
  36. Xia, S.; Song, Z.; Van Zwieten, L.; Guo, L.; Yu, C.; Wang, W.; Li, Q.; Hartley, I.P.; Yang, Y.; Liu, H.; et al. Storage, patterns and influencing factors for soil organic carbon in coastal wetlands of China. Glob. Chang. Biol. 2022, 28, 6065–6085. [Google Scholar] [CrossRef] [PubMed]
  37. Juang, K.-W.; Chen, C.-P. Changes in soil organic carbon and nitrogen stocks in organic farming practice and abandoned tea plantation. Bot. Stud. 2023, 64, 28. [Google Scholar] [CrossRef] [PubMed]
  38. Neff, J.C.; Townsend, A.R.; Gleixner, G.; Lehman, S.J.; Turnbull, J.; Bowman, W.D. Variable effects of nitrogen additions on the stability and turnover of soil carbon. Nature 2002, 419, 915–917. [Google Scholar] [CrossRef] [PubMed]
  39. Sun, J.; Zhou, T.; Du, W.; Wei, Y. Precipitation mediates the temporal dynamics of net primary productivity and precipitation use efficiency in China’s northern and southern forests. Ann. For. Sci. 2019, 76, 92. [Google Scholar] [CrossRef]
  40. Doetterl, S.; Stevens, A.; Six, J.; Merckx, R.; Van Oost, K.; Casanova Pinto, M.; Casanova-Katny, A.; Munoz, C.; Boudin, M.; Zagal Venegas, E.; et al. Soil carbon storage controlled by interactions between geochemistry and climate. Nat. Geosci. 2015, 8, 780–783. [Google Scholar] [CrossRef]
  41. Koven, C.D.; Hugelius, G.; Lawrence, D.M.; Wieder, W.R. Higher climatological temperature sensitivity of soil carbon in cold than warm climates. Nat. Clim. Chang. 2017, 7, 817–822. [Google Scholar] [CrossRef]
  42. Fissore, C.; Giardina, C.P.; Kolka, R.K.; Trettin, C.C.; King, G.M.; Jurgensen, M.F.; Barton, C.D.; McDowell, S.D. Temperature and vegetation effects on soil organic carbon quality along a forested mean annual temperature gradient in North America. Glob. Chang. Biol. 2008, 14, 193–205. [Google Scholar] [CrossRef]
  43. Abdalla, M.; Hastings, A.; Cheng, K.; Yue, Q.; Chadwick, D.; Espenberg, M.; Truu, J.; Rees, R.M.; Smith, P. A critical review of the impacts of cover crops on nitrogen leaching, net greenhouse gas balance and crop productivity. Glob. Chang. Biol. 2019, 25, 2530–2543. [Google Scholar] [CrossRef] [PubMed]
  44. Li, W.; Zheng, Z.; Li, T.; Zhang, X.; Wang, Y.; Yu, H.; He, S.; Liu, T. Effect of tea plantation age on the distribution of soil organic carbon fractions within water-stable aggregates in the hilly region of Western Sichuan, China. Catena 2015, 133, 198–205. [Google Scholar] [CrossRef]
  45. Tang, J.; Luyssaert, S.; Richardson, A.D.; Kutsch, W.; Janssens, I.A. Steeper declines in forest photosynthesis than respiration explain age-driven decreases in forest growth. Proc. Natl. Acad. Sci. USA 2014, 111, 8856–8860. [Google Scholar] [CrossRef] [PubMed]
  46. Drake, J.E.; Davis, S.C.; Raetz, L.M.; DeLucia, E.H. Mechanisms of age-related changes in forest production: The influence of physiological and successional changes. Glob. Change Biol. 2011, 17, 1522–1535. [Google Scholar] [CrossRef]
  47. Kamau, D.M.; Spiertz, J.H.; Oenema, O.; Owuor, P.O. Productivity and nitrogen use of tea plantations in relation to age and genotype. Field Crops Res. 2008, 108, 60–70. [Google Scholar] [CrossRef]
  48. Xue, D.; Yao, H.; Huang, C. Characteristics of mineralization and nitrification in soils of tea gardens different in age. Acta Pedol. Sin. 2007, 44, 373–378. [Google Scholar]
  49. Wang, S.; Zheng, Z.; Li, T.; Li, Y. Effects of age of tea plantations on distribution of exchangeable base cations in soil aggregates. Acta Pedol. Sin. 2013, 50, 1013–1020. [Google Scholar]
  50. Niu, S.; Song, Q.; Fan, W. Analysis on site soil nutrients of ancient tea trees in the Southwest State of Guizhou Province. Acta Agric. Zhejiangensis 2013, 25, 1348–1353. [Google Scholar]
  51. Zhou, J.; Sun, W.; Yu, Q.; Lin, H.; Wang, Q.; Ye, J.; Chen, Z.; Ma, J.; Yang, J. Effects of partial replacement of chemical fertilizer by three organic fertilizers on the yield and quality of spring tea. J. Hunan Agric. Univ. Nat. Sci. 2023, 49, 79–85. [Google Scholar]
  52. Xie, K.; Xue, Z.; Chen, Z. Effects of intercropping different plants in tea garden on yield and quality of tea and soil of tea garden. J. Tea Commun. 2021, 48, 422–429. [Google Scholar]
  53. Slothuus, C.F.; Schmidt-Vogt, D.; Mertz, O. Navigating between Tea and Rubber in Xishuangbanna, China: When New Crops Fail and Old Ones Work. Land 2020, 9, 22. [Google Scholar] [CrossRef]
Figure 1. The distribution and sampling regions in tea plantations in Fujian Province.
Land 13 00834 g001
Figure 2. The content of averaged (a) SOC, (b) N, (c) P, and (d) K of tea plantations in different counties. The black vertical bars represent the standard deviation of the sampling data. The letters on the top represent the statistical difference in the four regions; the significance level is 0.05.
Land 13 00834 g002
Figure 3. The relationship between SOC and (a) N, (b) P, and (c) K in tea plantations.
Land 13 00834 g003
Figure 4. The correlation between SOC and (a) MAT and (b) MAP.
Land 13 00834 g004
Figure 5. The distribution of the sampling tea plantation age.
Land 13 00834 g005
Figure 6. PAI at different stand ages in the tea plantations.
Land 13 00834 g006
Figure 7. SOC–age curve in the tea plantations.
Land 13 00834 g007
Disclaimer/Publisher’s Note: The statements, opinions and data contained in all publications are solely those of the individual author(s) and contributor(s) and not of MDPI and/or the editor(s). MDPI and/or the editor(s) disclaim responsibility for any injury to people or property resulting from any ideas, methods, instructions or products referred to in the content.

