Article

Long-Term Analysis of Spatial–Temporal Variation in Ecological Space Quality within Urban Agglomeration in the Middle Reaches of the Yangtze River

1
Faculty of Resources and Environmental Sciences, Hubei University, Wuhan 430062, China
2
Hubei Key Laboratory of Regional Development and Environmental Response, Hubei University, Wuhan 430062, China
3
Dalaoling Nature Reserve Administration of Yichang Three Gorges, Yichang 443000, China
*
Author to whom correspondence should be addressed.
Land 2024, 13(6), 842; https://doi.org/10.3390/land13060842
Submission received: 29 April 2024 / Revised: 1 June 2024 / Accepted: 3 June 2024 / Published: 13 June 2024

Abstract

:
The assessment of ecological space quality (ESQ) and its spatio-temporal change monitoring are crucial for regional ecological management and sustainable development. However, there are few studies on how to construct a comprehensive ESQ assessment system to reveal the spatial and temporal change patterns of ESQ over a long time series. Therefore, this study constructs an ESQ evaluation model with comprehensive ecological characteristics to quantitatively assess the spatio-temporal dynamics of ESQ from 2001 to 2020 based on policy objectives and public demands, using the urban agglomeration in the middle reaches of the Yangtze River as an example. The results show that, in the past 20 years, the mean value of ESQ in urban agglomeration has decreased (−0.179·year−1), and the overall ESQ is dominated by a good level. The ESQ has shifted from improvement (2001–2010) to deterioration (2010–2020) and shows the spatial distribution characteristics of “high in the periphery and center, low in the interior”. From the trend of change, the degraded area of ESQ is greater than the improved area, and the degraded area of ESQ will increase in the future compared with the trend of 2001–2020. The distribution of ESQ has a significant spatial agglomeration and scale effect. The hot spots of ESQ at the town scale are mainly concentrated in the central part of urban agglomeration and mountainous areas in the periphery. The cold spots are mainly concentrated in the surrounding areas of central cities (Wuhan, Changsha, and Nanchang). The proposed assessment framework can be used to quantify spatial and temporal changes in ESQ and identify potential ecological space management issues, providing basic information for implementing ecological space protection, restoration, and developing adaptive ESQ management measures. The research results are of significant importance for ecosystem restoration and long-term development in the Yangtze River Basin.

1. Introduction

Ecological space is the land use that provides all ecosystem services or protection, which includes natural ecological land as well as artificial and semi-artificial ecological land [1]. Ecological spaces are fundamental to achieving regional sustainable development as they enhance human well-being and ensure regional ecological security [2,3]. In particular, ecological space is an important component of urban ecosystem services, which determines the benefits of urban ecosystems and the quality of living environments for residents [4], such as mitigating the urban heat island effect, improving the quality of air and water resources, and maintaining human well-being [5,6]. Furthermore, ecological spaces provide a space in which residents can engage with and enjoy the local ecological environment, developing an aesthetic appreciation and a sense of belonging while also providing a space for recreational activities [7,8]. Urban agglomerations are currently the main spatial manifestation of urbanization [9]. Rapid urbanization has emerged as a significant cause of ecological space change, affecting ecosystem structure, processes, and functions through land use changes such as deforestation, lake damming, riverbank encroachment, and land expansion for development [10]. The formation of urban agglomeration development has expedited the growth of industrial and urban areas, thereby encroaching upon ecological spaces and causing a subsequent deterioration in their quality [11]. This has subsequently prompted a variety of ecological challenges, such as biodiversity loss, air pollution, soil erosion, floods, and urban heat [12]. There is an increased recognition of the significance of maintaining ecological spaces and their overall condition, as residents within urban agglomerations are becoming increasingly aware of the importance of ecological spaces for their overall well-being [13,14]. Consequently, the emphasis of modern urban planning and ecological conservation has shifted to the maintenance and improvement of ecological spaces. This is demonstrated through the incorporation of ecological space quality concepts into the national ecological restoration initiatives, with the primary goal of increasing ESQ.
The urban agglomeration in the middle reaches of the Yangtze River (UAMRYR) is a key ecological functional area, an ecologically sensitive area, and the focus of the strategic pattern of urbanization in China [15]. With the implementation of the Yangtze River Economic Belt Strategy, the Rise of Central China Strategy, and the Central Triangle Strategy, urban expansion has led to a huge shift in land use, resulting in enormous pressure on population, resources, and the environment [16]. The report of the 20th Party Congress proposes to speed up the implementation of major projects for the protection and restoration of important ecosystems, focusing on key national ecological function zones, ecological protection red lines, and nature reserves, and enhancing the diversity, stability, and sustainability of ecosystems. Thus, in the face of major obstacles in ecological restoration, protection, and urban planning, we should consider ESQ characteristics fully to precisely determine the extent and location of urbanization effects on these regions, and execute intended ecological management strategies [17].
Considering the complexity of the external attributes and interior mechanisms of ecological spaces and their extensive diversity, the necessity for a standardized evaluation system to assess ESQ has increased considerably [18]. Current assessments primarily concentrate on single ecological spaces, leading to a wide variation of evaluation indices that emphasize either ecosystem stability or environmental characteristics [19]. The increasing separation of urban populations from their natural environments has increased their awareness of environmental perceptions, specifically the emergence of extreme urban thermal environments that present substantial risks to health [20]. These hazards include heat-related fatalities and respiratory ailments, such as bronchitis and asthma, which are prevalent among urban residents [21]. Variations in urban temperature also impact vegetation growth, leading to the degradation of urban green spaces and diminishing the quality of urban outdoor recreation and leisure spaces [22,23]. Consequently, residents considered the temperature comfort, air quality, and the overall experience of daily recreation and leisure as key indicators of environmental quality [24]. The rapid development of urban agglomerations has resulted in changes in landscape patterns, such as landscape fragmentation and an increase in the quantity, diversity, and fragmentation of landscape patches [25]. The establishment of ecological corridors enhances landscape connectivity. Hence, landscape connectivity serves as an essential indicator for assessing the stability of ecological spaces [26]. Ecosystem stability and the overall ecological benefits of ecological spaces, in addition to the intrinsic properties and external mechanisms that influence ESQ, should be incorporated into a comprehensive evaluation of ESQ. ESQ assessment should also be consistent with the goals of regional policy and residents’ requirements by effectively identifying the ecological deficiencies that can be addressed by ecological conservation and restoration.
The UAMRYR is the main battleground for building an ecological civilization in the Yangtze River Economic Belt, which plays an important role in ensuring the high-quality development of the Yangtze River and is an integral part of China’s ecological security pattern. However, human interference and rapid urbanization have led to ecological degradation. Therefore, it is important to establish a scientific and comprehensive evaluation system to comprehensively evaluate the spatial and temporal changes of ESQ over long-term series, and to understand further the spatial distribution characteristics, temporal change characteristics, and trend characteristics of ESQ, to provide a scientific basis for future ecological protection and restoration, as well as for urban development decision making, which is also the ultimate purpose of implementing ecological spaces evaluation in this study. The main objectives of this study are (Figure 1): (1) to establish a framework for ESQ assessment that takes into account policy objectives and public preferences; (2) to identify the characteristics of year-to-year changes in ESQ in a long-term series (2001–2020), including trend changes and sustainability analyses; and (3) to explore the characteristics of spatial differentiation of ESQ.

2. Materials and Methods

2.1. Study Area

The UAMRYR is located in central China (110°23′–118°28′ E, 26°29′–31°51′ N) and encompasses 31 cities across the Hubei, Hunan, and Jiangxi provinces (Figure 2). The land area of UAMRYR is approximately 347,000 km2. In 2020, the total population of the study area was approximately 130 million, accounting for 9.4% of the national population, and the GDP was CNY 11.1 trillion, accounting for 9.3% of the national population [27]. As a key component of the Yangtze River Economic Belt, it is an ecological urban agglomeration with significant influence and one of the most urbanized and rapidly developing regions in China. Due to its unique mountainous topography, geographical conditions, and subtropical monsoon climate, the region is abundant in soil resources, water resources, and vegetation resources, and has high biodiversity. However, the rapid urbanization of the region has caused substantial ecological losses, such as the disappearance of patches of forests, grasslands, wetlands, and bodies of water [28]. ecological losses have resulted in various ecological challenges, including soil erosion, a warming climate, water pollution, diminished vegetation cover, and landscape fragmentation, all of which pose threats to ecosystem integrity and sustainability [26].

2.2. Data Sources

In this study, the years 2001–2020 were selected as the study years for the UAMRYR, and the sources and functions of the study data are detailed in Figure S1. The data mainly include land use data, DEM, MODIS data, air quality data, precipitation data, LST data, and soil texture data. Specific descriptions are provided below:
(1) Land use data were obtained from the 30 m resolution CLCD data of Wuhan University (https://zenodo.org/record/5210928, accessed on 16 June 2022), and the land use cover types were categorized into cropland, forest, shrub, grassland, water, snow/ice, barren, impervious, and wetland; (2) Topographic data were provided by the Earth Science Data Systems (ESDS) program (https://earthdata.nasa.gov/esds/, accessed on 16 June 2022); (3) MOD13Q1 data were provided by LAADS DAAC (https://ladsweb.modaps.eosdis.nasa.gov/, accessed on 23 June 2022), selected for May and September of each year, and preprocessed using the MODIS Reprojection Tool (MRT); (4) Air quality data were obtained from the Ministry of Ecology and Environment of China (https://www.mee.gov.cn/, accessed on 28 June 2022); (5) Precipitation data from the China Meteorological Data Center (http://data.cma.cn, accessed on 28 June 2022); (6) Surface temperature data from “China Regional l km Seamless Surface Temperature Dataset”, obtained from the National Tibetan Plateau Scientific Data Center (http://data.tpdc.ac.cn, accessed on 8 July 2022); (7) Soil texture data were obtained from the Resource and Environment Science and Data Center (http://www.resdc.cn, accessed on 1 August 2022).

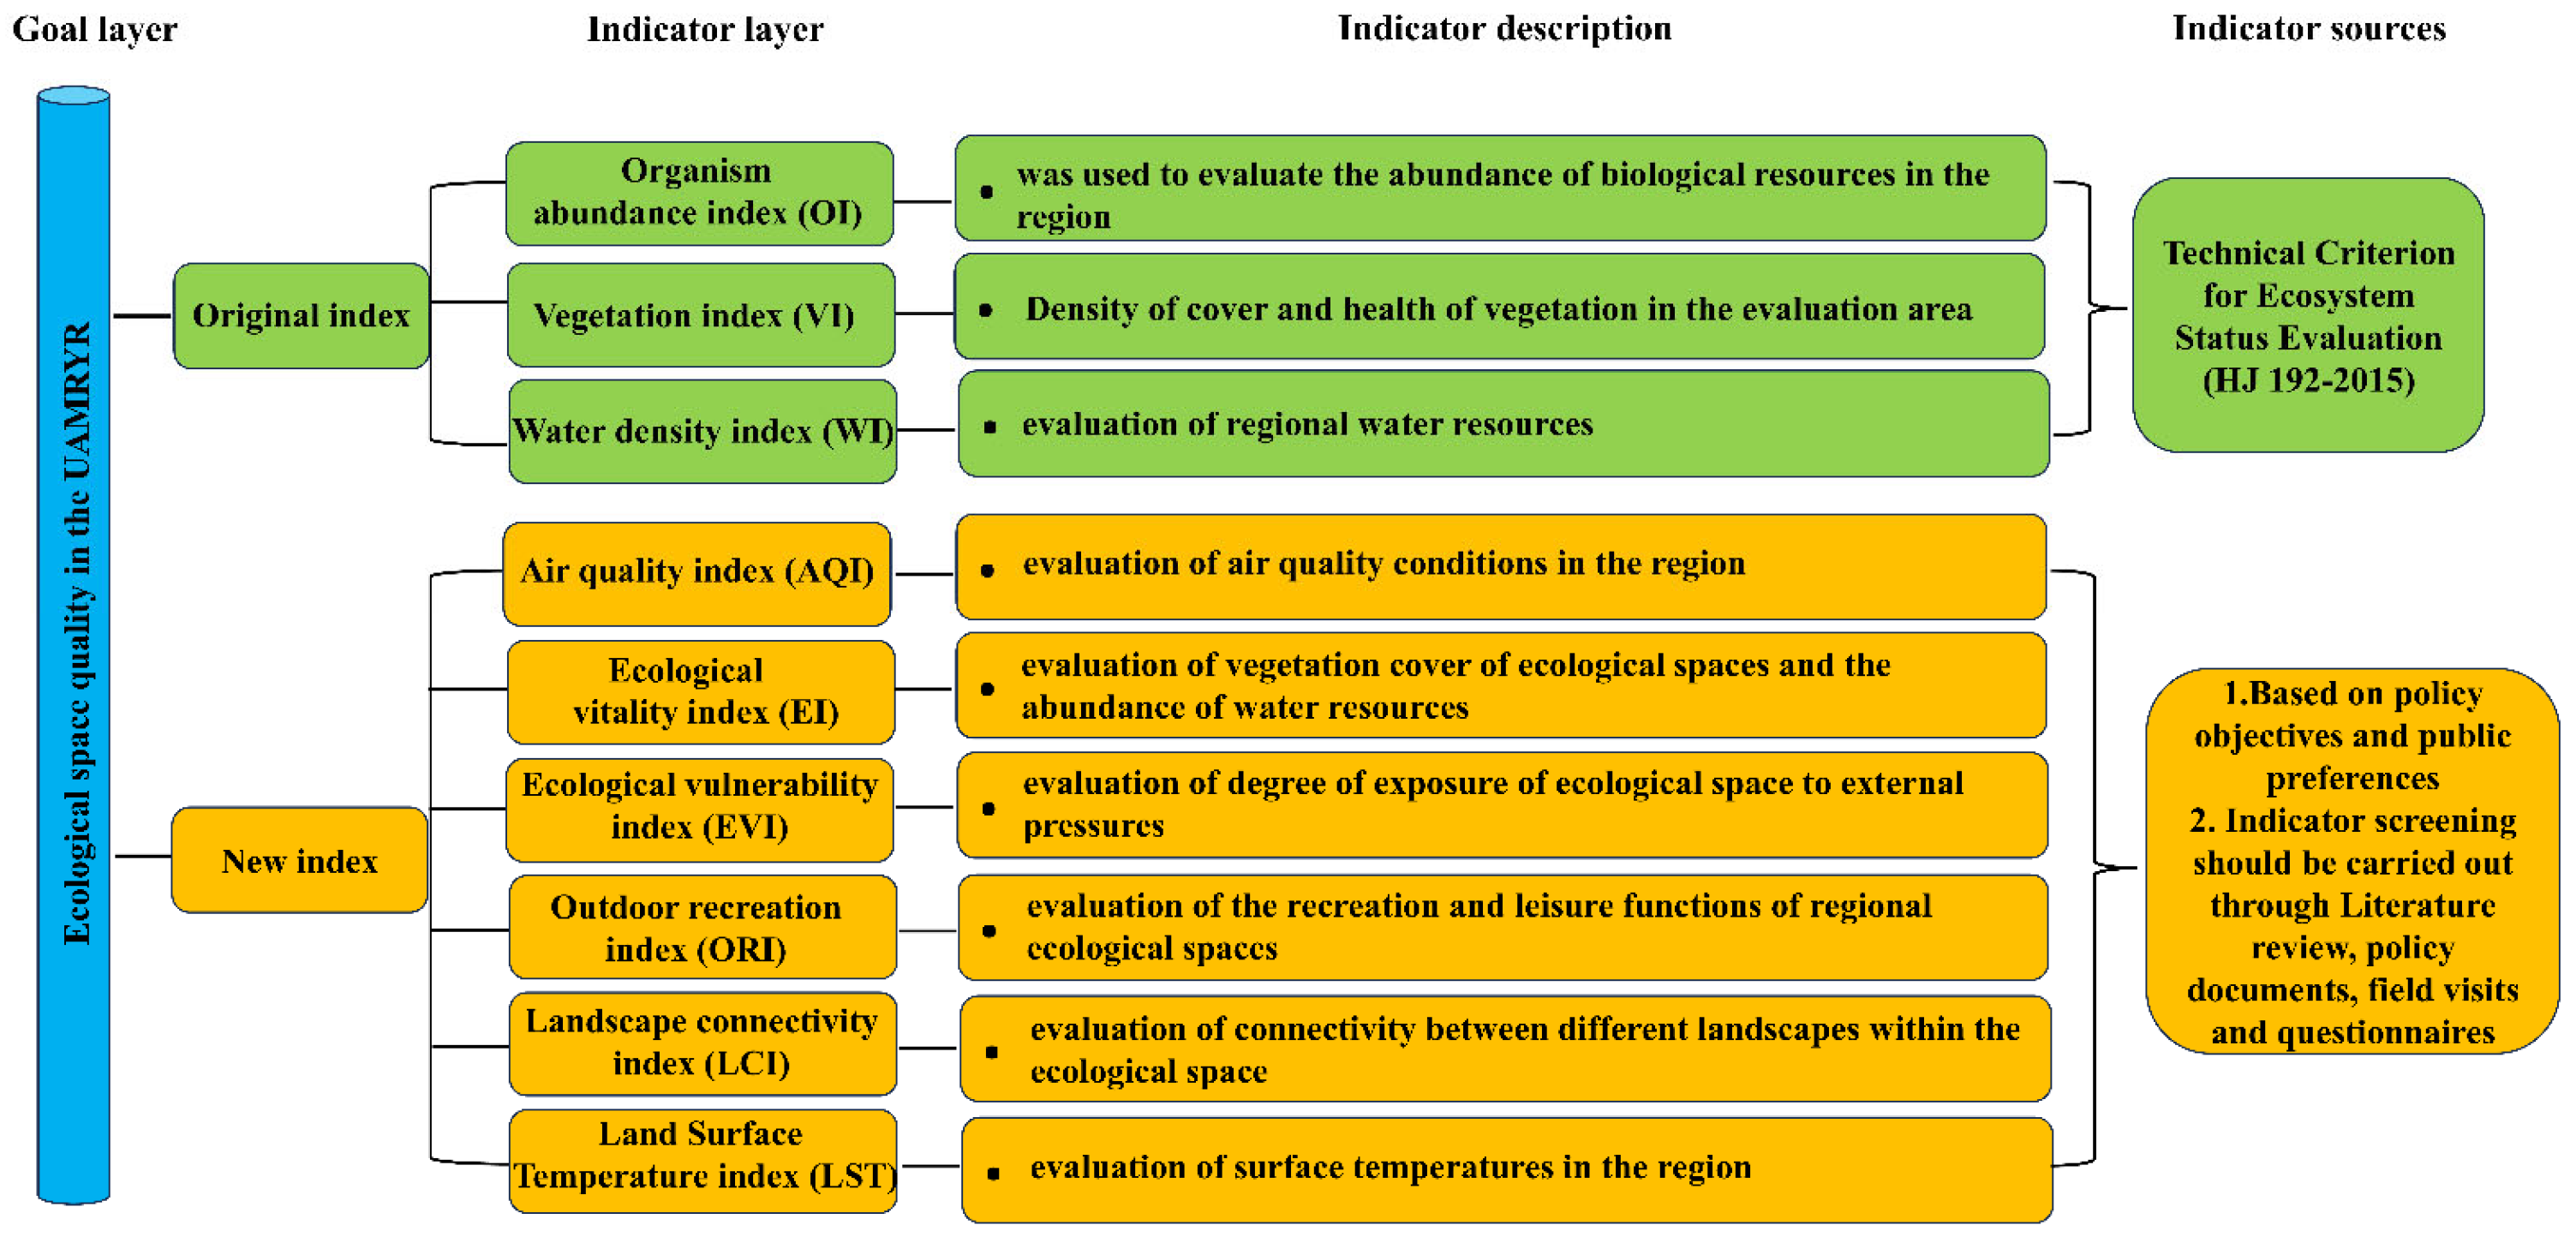
2.3. Construction of ESQ Assessment Indicators System

2.3.1. ESQ Assessment Indices

We construct a set of ESQ evaluation systems with high policy applicability and in line with regional ecological characteristics and public needs, based on the original ecological environmental condition evaluation system of the Ministry of Environmental Protection of China (HJ192-2015) (Figure 3).
The following principles should be followed for the selection of assessment indicators: (1) in a scientific context, the identification of indicators should primarily rely on policy objectives and public preferences; (2) Screening of indicators through literature review, interpretation of policy documents, field visits, and questionnaires (Appendix A); (3) Assessment indicators should be comprehensive, encompassing all ecological characteristics of the study area in a broader context; (4) Furthermore, the selection of indicators should be representative, closely linked to the ecological characteristics of the region, and feasible.
With higher demands on the spiritual life and quality of human habitat, maintaining and managing ecological space, enhancing its quality and socio-cultural (e.g., recreational) service value, and improving the usability and comfort of residents’ living environments are the main elements of policy objectives. Field visits and questionnaire surveys have shown that urban residents are mainly concerned with living conditions such as air quality, water safety, urban temperature, and vegetation cover, as well as parks, natural attractions, scenic areas, and nature reserves, which affect the quality of human recreation and leisure. Experts are more concerned with landscape pattern indices and the impact of ecological space on the generation of human well-being.
In summary, we selected the organism abundance index (OI), ecological vitality index (EI), ecological vulnerability index (EVI), outdoor recreation index (ORI), air quality index (AQI), and landscape connectivity index (LCI), and land surface temperature index (LST) to establish a new ESQ assessment system. The description of each index is shown in Figure 4.

2.3.2. Calculation of ESQ Assessment Indicators

The calculation of ESQ evaluation indicators can be divided into four categories: (1) direct access (NDVI, LST, and AQI); (2) landscape connectivity index calculated by Fragstats 4.2; (3) outdoor recreation index calculated by ESTIMAP recreation method; and (4) organism abundance index (OI), ecological vitality index (EI), and ecological vulnerability index (EVI) calculated by ArcGIS. The specific methods and formulas are shown in Table 1.

2.3.3. Comprehensive Multiple-Based Index Assessment

In this study, the hierarchical analysis method (AHP) was used to determine the weights of the indicators of the evaluation system, which helps decision makers deal with complex decision-making problems by decomposing them into a hierarchical structure and then determining the relative importance of each indicator by comparing them two by two [29]. In this case, the relative importance scores for each indicator were completed by 20 experts familiar with ecological assessment and management. According to the relative importance scoring of the indicators, the weight of each indicator is then calculated to establish the ESQ assessment model.
The indicators and indicator weights of the assessment system are shown in Table 1. All indices were normalized to a range between 0 and 100 to eliminate differences in magnitude and resampled to a spatial scale of 250 m to better characterize the region. The ecological space quality index (ESQ) can be expressed as:
ESQ = 0.17 Ea + 0.15 Eb + 0.15 Ec + 0.17 Ed + 0.14 Ee + 0.1 Ef + 0.12 Eg
where ESQ is the ecological space quality; Ea, Eb, Ec, Ed, Ee, Ef, and Eg are the core values of the organism abundance index (OI), ecological vitality index (EI), ecological vulnerability index (EVI), outdoor recreation index (ORI), air quality index (AQI), and landscape connectivity index (LCI), and land surface temperature index (LST).

2.3.4. Classification of ESQ

Referring to related research [30], the results were classified into five grades by the natural breakpoint method, and according to the Technical Criterion for Ecosystem Status Evaluation (HJ192- 2015) (Table 2).

2.4. Long-Term Trend Analysis

Theil–Sen median trend analysis is a reliable non-parametric statistical method utilized to estimate trends by reducing the impact of outliers in the data [31]. The median of the slope of a set of n(n − 1)/2 data is computed using Theil–Sen median trend analysis as follows:
S ESQ = Median ( ESQ j ESQ i j i ) , 2001 i j 2020
A SESQ > 0 and ≤ indicate the tendency for increasing and decreasing ESQ, respectively.
The Mann–Kendall test is a non-parametric statistical test used to determine the significance of a trend [32], and was calculated as:
set {ESQi}, I = 2001, 2002,…, 2020
Define   the   Z   statistic   as :   Z = { S - 1 s ( S ) , S > 0 0 , S = 0 S + 1 s ( S ) , S < 0   Among   them ,   S = j = 1 n 1 i = j + 1 n sgn ( ESQ j ESQ i )
sgn ( ESQ j ESQ i ) = { 1 , ESQ j ESQ i > 0 0 , ESQ j ESQ i = 0 1 , ESQ j ESQ i < 0 , s ( S ) = n ( n 1 ) ( 2 n + 5 ) 18
where ESQi and ESQj represent ESQ in years i and j of the image element, respectively, n is the time series length, sgn denotes the sign function, and the Z statistic is in the range (−∞, +∞).
Changes in the trend of ESQ were classified into five categories by integrating the results of the Theil–Sen and the Mann–Kendall trend tests: (1) significant improvement; (2) slight improvement; (3) stable (4) slight deterioration; and (5) significant deterioration.

2.5. Sustainability Analysis—Hurst Index

The Hurst exponent is a method for distinguishing the sustainability of time series data [33].
The time series {ESQ(t)}, t = 1, 2,…, n, define the mean series:
ESQ ¯ ( τ ) = 1 τ t = 1 τ ESQ ( τ ) τ = 1 , 2 , ,   n
( 1 )   cumulative   deviation   X ( t , τ ) = t = 1 t ( ESQ t ESQ ¯ ( τ ) ) 1 t τ
( 2 ) max   min   R ( τ ) = max 1 t τ X ( t , τ ) min 1 t τ X ( t , τ ) τ = 1 , 2 , ,   n
( 3 )   standard   deviation   S ( τ ) = [ 1 τ t = 1 τ ( ESQ ( t ) ESQ ( τ ) ) 2 ] 1 2 τ = 1 , 2 , , n
Within the ratio R(τ)/S(τ)     R/S, a Hurst phenomenon in the analyzed time series can be confirmed if R/SτH, while H represents the Hurst index. The value of H can be obtained using a least-squares fit based on log (R/S)n = a + H × log (n).
There are three types of H values: H = 0.5 signifies a random ESQ time series devoid of sustainability and with a future sustainability independent of the past; 0.5 < H < 1 represents a sustainable ESQ time series with a future sustainability consistent with the past; 0 < H < 0.5 represents unsustainable ESQ time series with a future trend as opposed to the past.
The trend in ESQ and its sustainability were revealed by overlaying the results of the ESQ trend analysis with the results of the Hurst index. These results were divided into six categories: (1) sustainability improvement; (2) sustainability degradation; (3) sustainability stability; (4) unsustainability improvement; (5) unsustainability degradation; and (6) unsustainability stability [34].

2.6. Spatial Autocorrelation Analysis

Getis–Ord Gi* is an indicator of local autocorrelation and provides an effective means of exploring the characteristics of local spatial clustering. In the present study, Getis–Ord Gi* was used to identify localized areas of high and low ESQ [35]:
G i = j = 1 n w i , j x j X ¯ j = 1 n w i , j s [ n j = 1 n w i , j 2 ( j = 1 n w i , j ) 2 ] n 1
X ¯ = j = 1 n x j n
s = j = 1 n x j 2 n ( X ¯ ) 2
where xj is the quality of the ecological space of site j, wi,j is the spatial weight between sites i and j, and n is the total number of sites. Localized areas of high and low ESQ were considered statistically significant if p < 0.05 with a confidence level of >95%.

3. Results

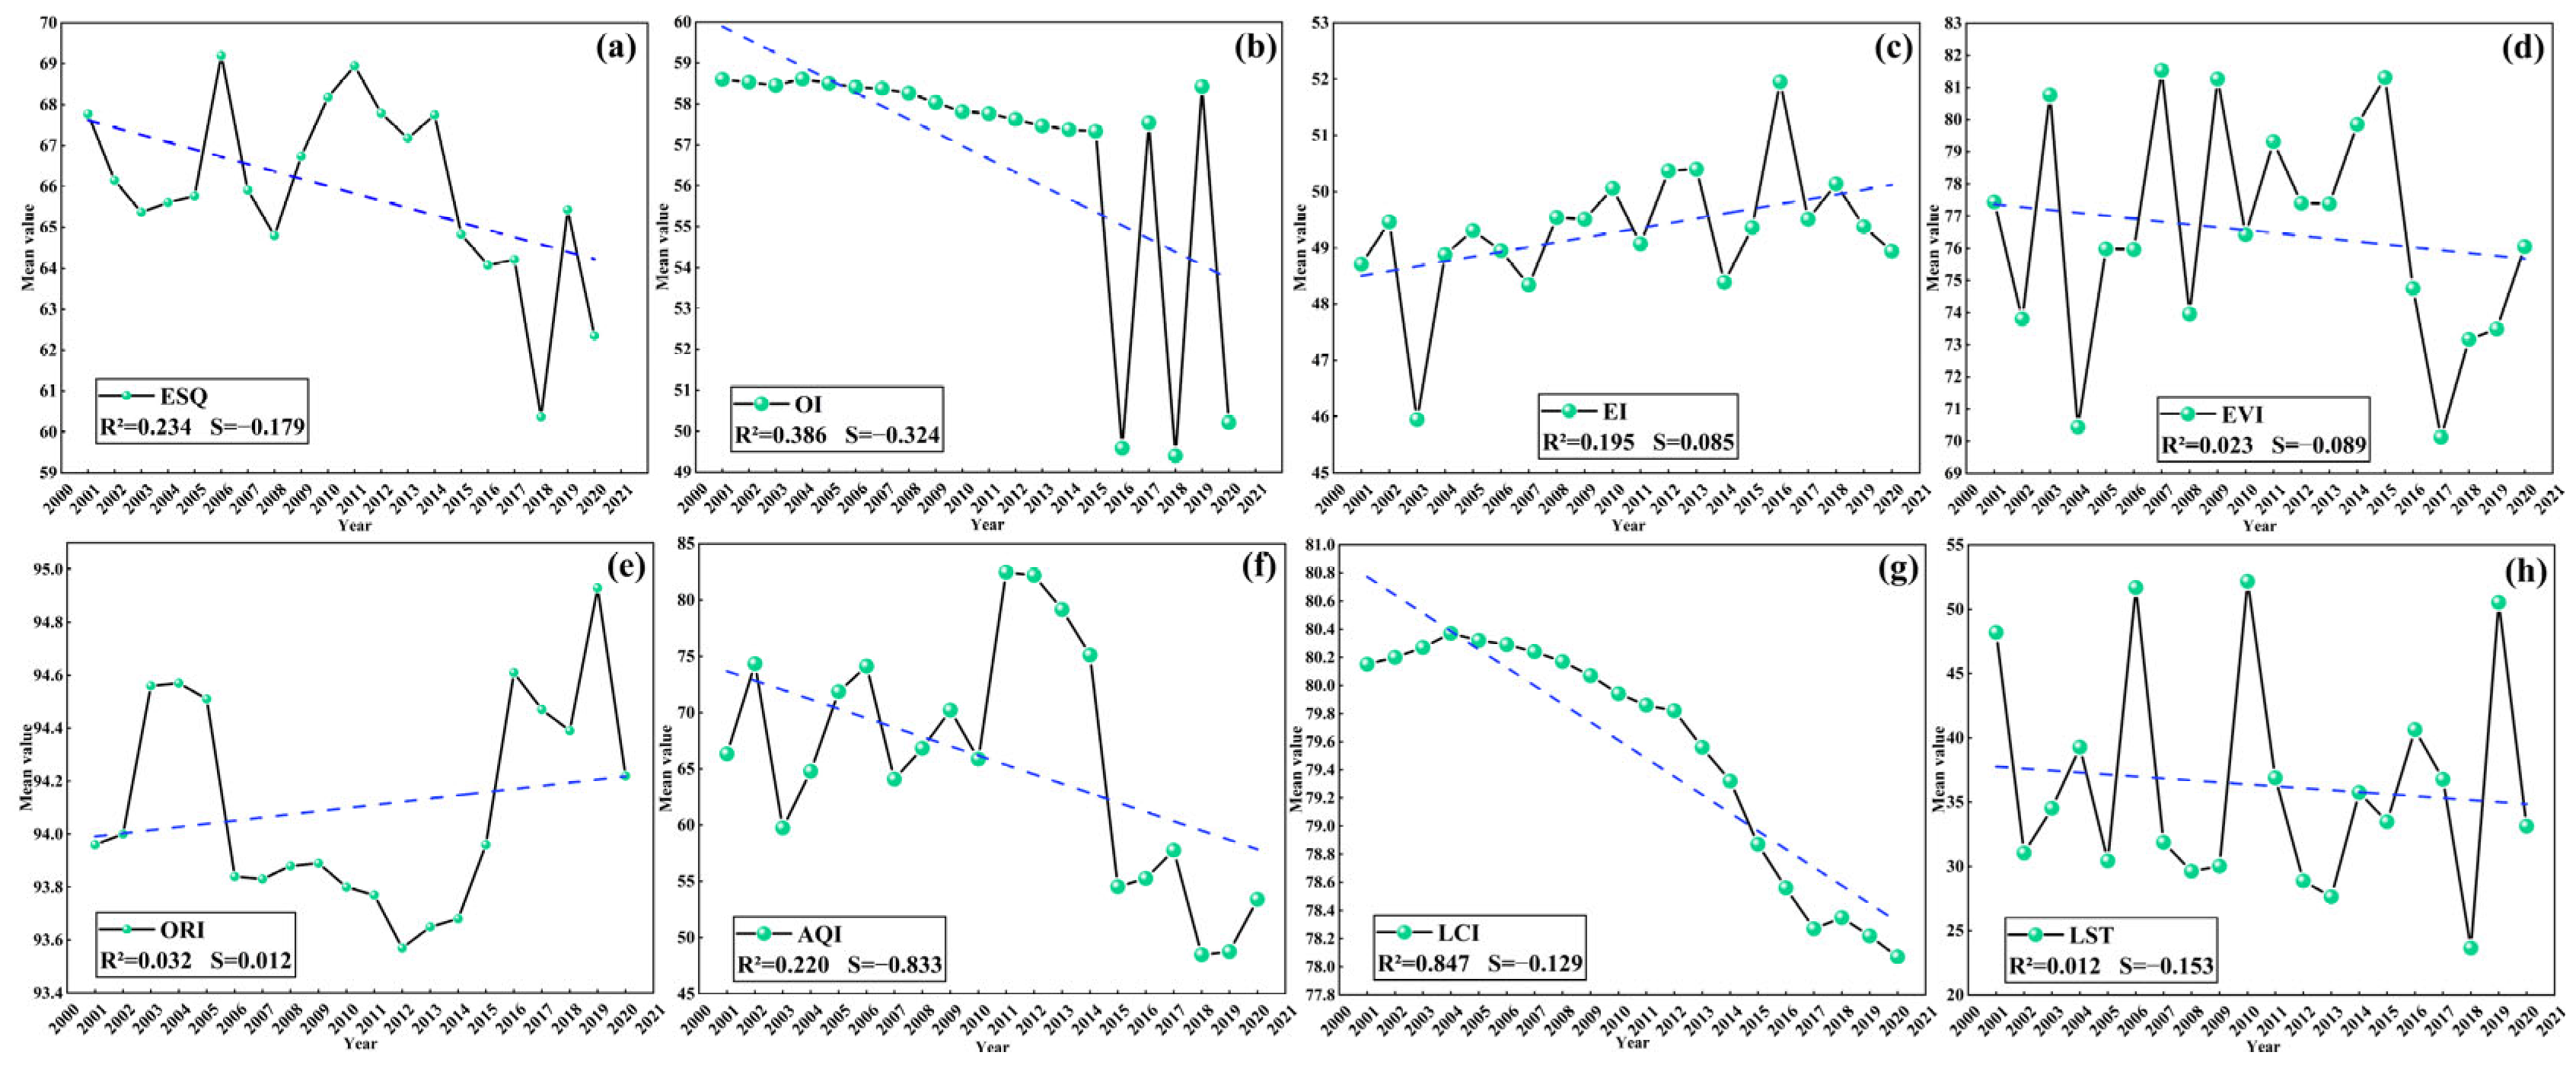
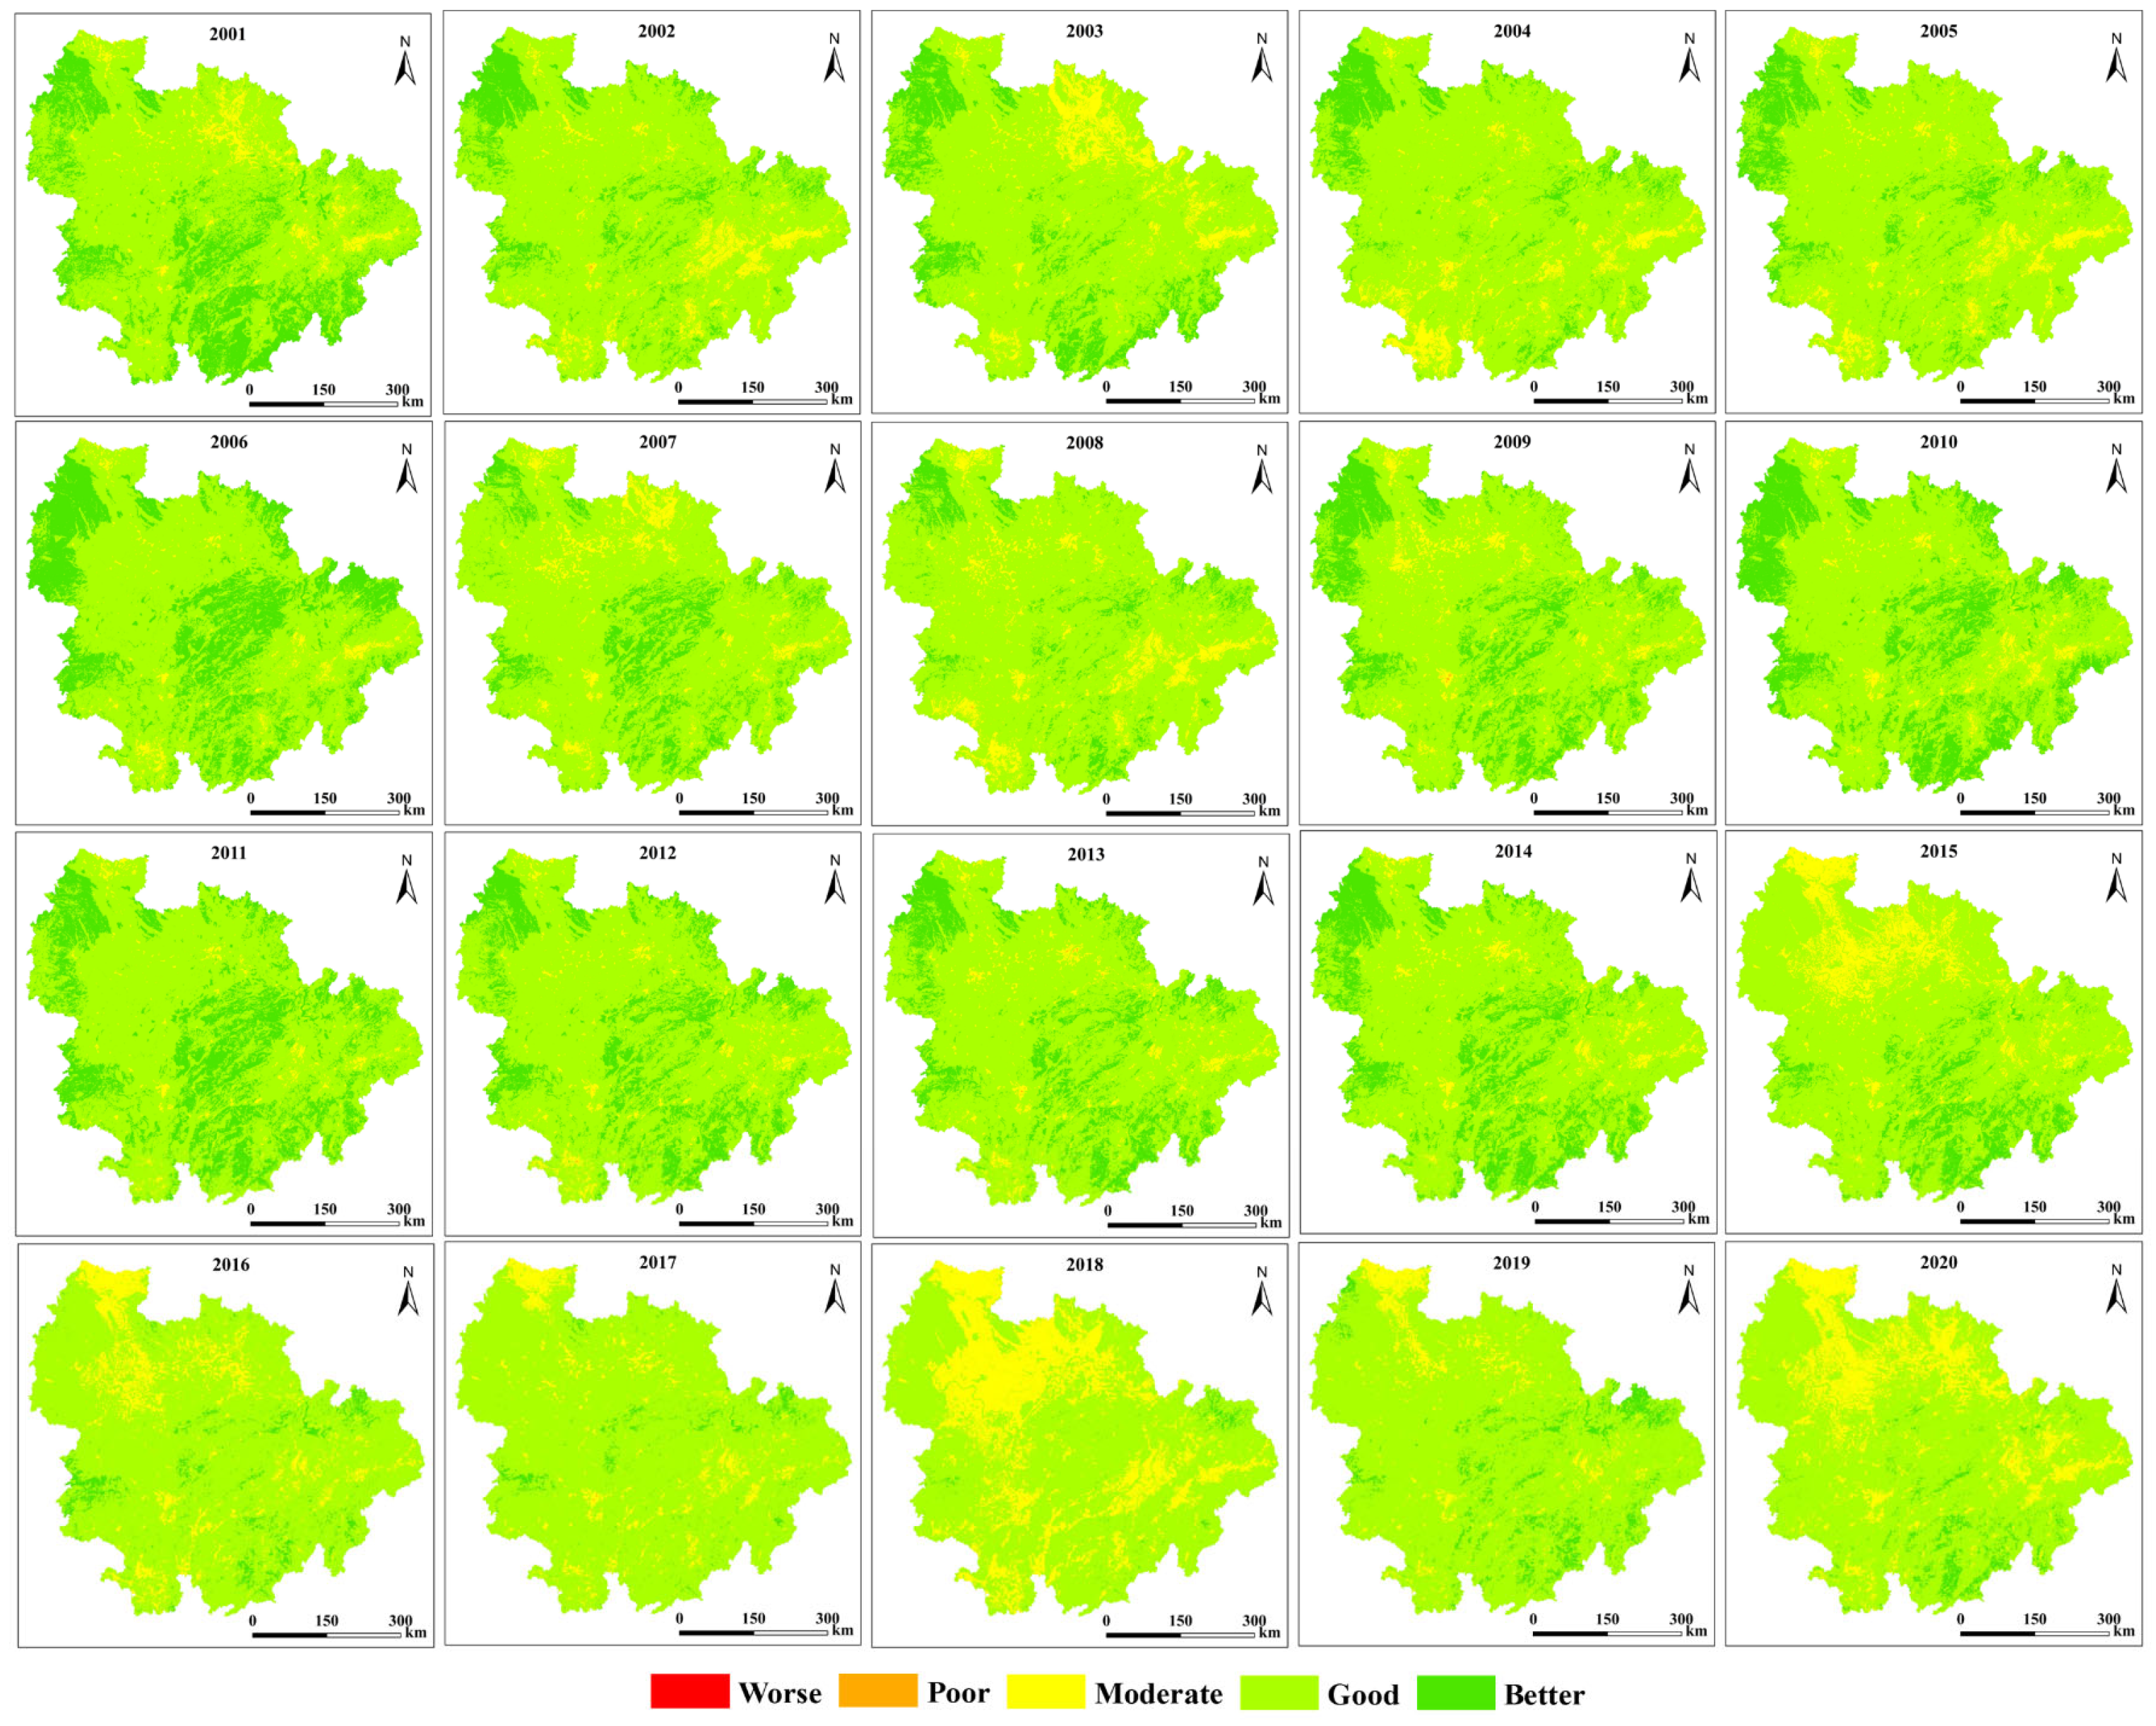
3.1. Spatial-Temporal Variation Characteristics of Ecological Space Quality Index

This study attempted to introduce China’s high-resolution eco-environmental quality (CHEQ) dataset to compare and validate ESQ evaluation results so that the ESQ evaluation framework has a high policy applicability. As shown in Figure S2, the RMSE of ESQ is 0.049, the MAE is 0.11, and the R2 is 0.703, indicating that the results of ESQ evaluation have a certain degree of accuracy, reliability, and rationality.
The results showed that the mean ESQ of the agglomeration varied between 60 and 70 over two decades, with the maximum and minimum values recorded in 2006 and 2018, respectively (Figure 5a). There was an overall decreasing trend in ESQ (−0.179 year−1). ESQ showed a fluctuating downward trend from 2001 to 2014, which could be attributed to EVI, AQI, and LST (Figure 5), as they also showed corresponding downward trends (p < 0.05). Urbanization within the agglomeration increased between 2001 and 2014, resulting in a subsequent decline in ESQ due to the continuous and increasing pressure on ecological space. A significant decrease in ESQ was observed between 2014 and 2020, which corresponded to significant decreases in OI, EVI, AQI, and LCT (Figure 5). Furthermore, the rapid urbanization of urban agglomerations had a significant impact on the decrease in ESQ.
This present study integrated the grading results of the Theil–Sen median trend analysis and the Mann–Kendall test to depict spatial-scale changes in ESQ accurately. The study area witnessed larger regions with a degraded ESQ compared to improved areas. Specifically, 78.31% of the regions exhibited degradation ESQ, and only 21.6% having experienced an improved ESQ (Figure 6a). Changes in ESQ exhibited a strong correlation with land use types in terms of spatial distribution (Figure 6c,d). The regions with slightly degraded ESQ were predominantly those with high urbanization in the plain area (Figure 6a). The slightly improved regions were predominantly found in the southwest, southeast, northeast, and central areas of low urbanization. Significant degradation in ESQ was observed primarily in the northern part of the study area and on the plains. Areas of significant improvement in ESQ were smaller and are primarily located in the southwest, southeast, and east of the study area.
The results of the current study showed that the sustained degradation of ESQ was the primary trend within the UAMRYR (Figure 6b). Nevertheless, there will be an increase in ESQ degradation in the future compared to past trends. Notably, 37.94% of the region exhibits a sustained degradation of the ESQ, with the largest proportions in the northern part of the agglomeration and the counties and cities of the plains (Figure 6b). However, negligence in supervision may result in a deteriorating trend in certain areas with initially good ESQ. Sustained improvement was observed in only 12.80% of the total area (Figure 6b). These areas are primarily located to the southwest, south, and southeast of the urban agglomeration and are dominated by forests, croplands, grasslands, and water (Figure 6c,e). The combinations of unsustainability and degradation as well as stability and improvement signified uncertain future trends in ESQ.

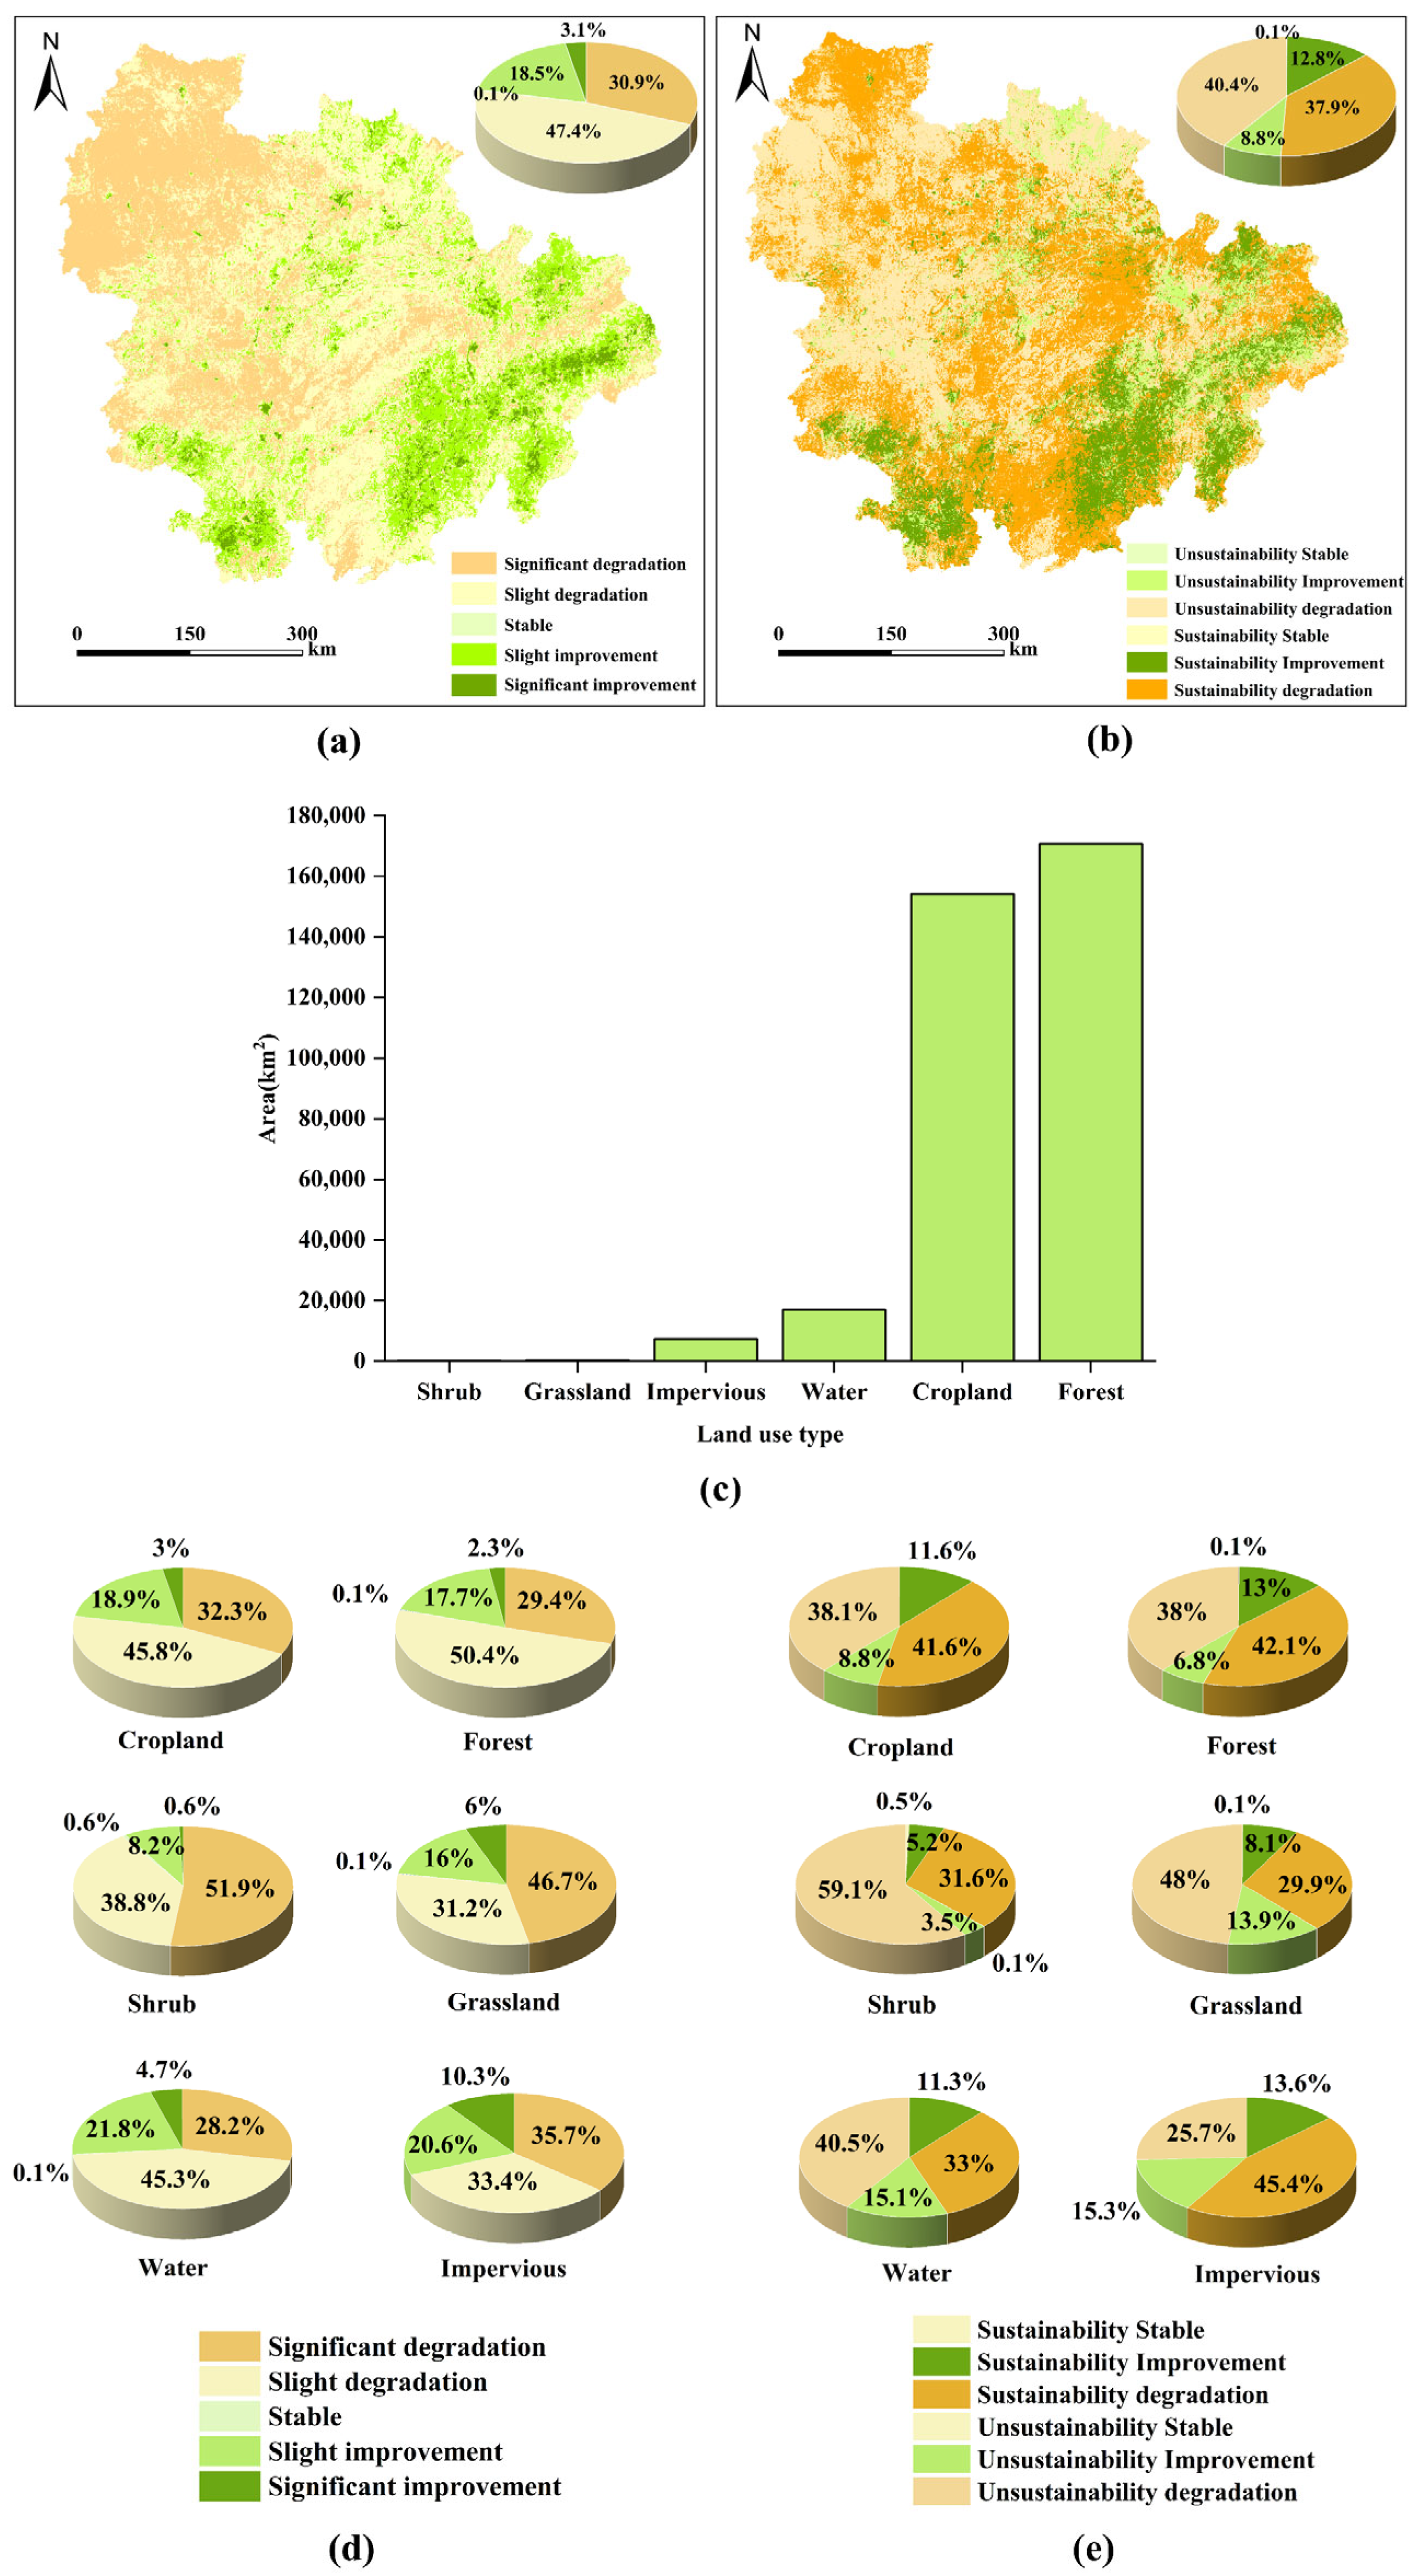
3.2. Spatiotemporal Variation in Grades of Quality of the Ecological Space

The yearly grading ESQ of the urban agglomerations shown in Figure 7 indicated overall good ESQ between 2001 and 2020. According to Figure 7 and the zonal statistics, the ESQ of areas surrounding urban agglomerations and central mountainous regions was significantly higher than that of the plains. During the study period, the better-grade ESQ was predominantly found in mountainous regions surrounding urban centers and in the central area, where the area decreased from 27.99% to 0.76%, with the largest increase in 2006, and where the area is dominated by forests (Figure 7 and Figure S3). Good grade ESQ is primarily located in the plains, with an area increase ranging from 69.18% to 90.39%, the greatest area increase occurring in 2017 and 2019 when the cropland predominates (Figure 7 and Figure S3). Moderate-grade ESQ was primarily located in the northern, southern, eastern, and southeastern parts of the urban agglomeration, increasing from 2.19% to 29.4%, with the largest increase observed in 2018, dominated by cropland and forest (Figure 7 and Figure S3). There was a decline in the areas of poor and worse ESQ, with these areas scattered throughout the agglomeration.
We examined ESQ changes over two specific periods (2001–2010 and 2010–2020) using a transfer matrix to acquire a more comprehensive understanding of the spatial and temporal attributes of ESQ grades between 2001 and 2020. Considerable changes occurred in the ESQ grades between better and good, good and better, good and moderate, and moderate and good grades (Figure S4a). Between 2001 and 2010, a total of 12.39% of moderate ESQ land underwent a transition to good grades, while good grades experienced the most significant change, accounting for a shift of 31,320.04 km2 from good to better grades (Figure S4a). These areas were predominantly located in mountainous central regions and low-urbanization areas adjacent to urban agglomerations. Water bodies, forests, cropland, shrubs, and grassland predominate in these regions. Various government ecological conservation and construction initiatives, including natural forest conservation, the conversion of farmland into forest and grassland, and the restoration of fields to lakes were associated with these improvements. The primary objective of each of these policies was to improve the condition of the ecological environment in the UAMRYR. There was deteriorating ESQ in 8.56% of the good and better grades, among which the change in the latter was the most significant and the transfer from a better to good grade occupied 23,521.83 km2, which was primarily concentrated in the eastern and southern regions of the urban agglomeration. The area of the degraded ESQ comprised 38.82% of the total area between 2010 and 2020. Notably, transitions occurred from good to moderate grades of ESQ and from better to good grades, encompassing respective areas of 58,658.72 km2 and 76,309.64 km2, respectively (Figure S4a). These regions were predominantly forested and arable land and were primarily located in the southern, eastern, northern, and southwestern portions of the urban agglomeration. On the other hand, the region that demonstrated an improvement in ESQ comprised only 1.1% of the overall area and had a sporadic distribution throughout the agglomeration.
A map of the spatial transformation distribution of ESQ grades shows that the spatial distribution of ESQ has undergone substantial alterations in the last two decades, characterized by an initial period of improvement, followed by subsequent deterioration (Figure S4b). Significantly, the most substantial improvement in ESQ occurred from 2001 to 2010, encompassing an area of 43,128.84 km2 (equivalent to 12.39% of the total). The improvements were primarily observed in the eastern, northwestern, and north-eastern regions of the agglomeration. The improved areas comprised forest, cropland, water, shrubs, and grassland. The improved areas for 2010–2020 are concentrated in the south, north, and a smaller area in the east, dominated by cropland, woodland, and water. The most severe ESQ degradation occurred between 2010 and 2020, with an extensive degradation of 135,113.5 km2, accounting for 38.82% of the total (Figure S4b). The degraded areas are dominated by cropland, forest, water, shrubs, and grassland, and are primarily concentrated in the northern, central, western, and eastern parts of the agglomeration, with a few areas in the south. The degraded regions between 2001 and 2010 primarily comprised forest and cropland and were concentrated to the south and east of the urban agglomerate, with a few exceptions in the north.

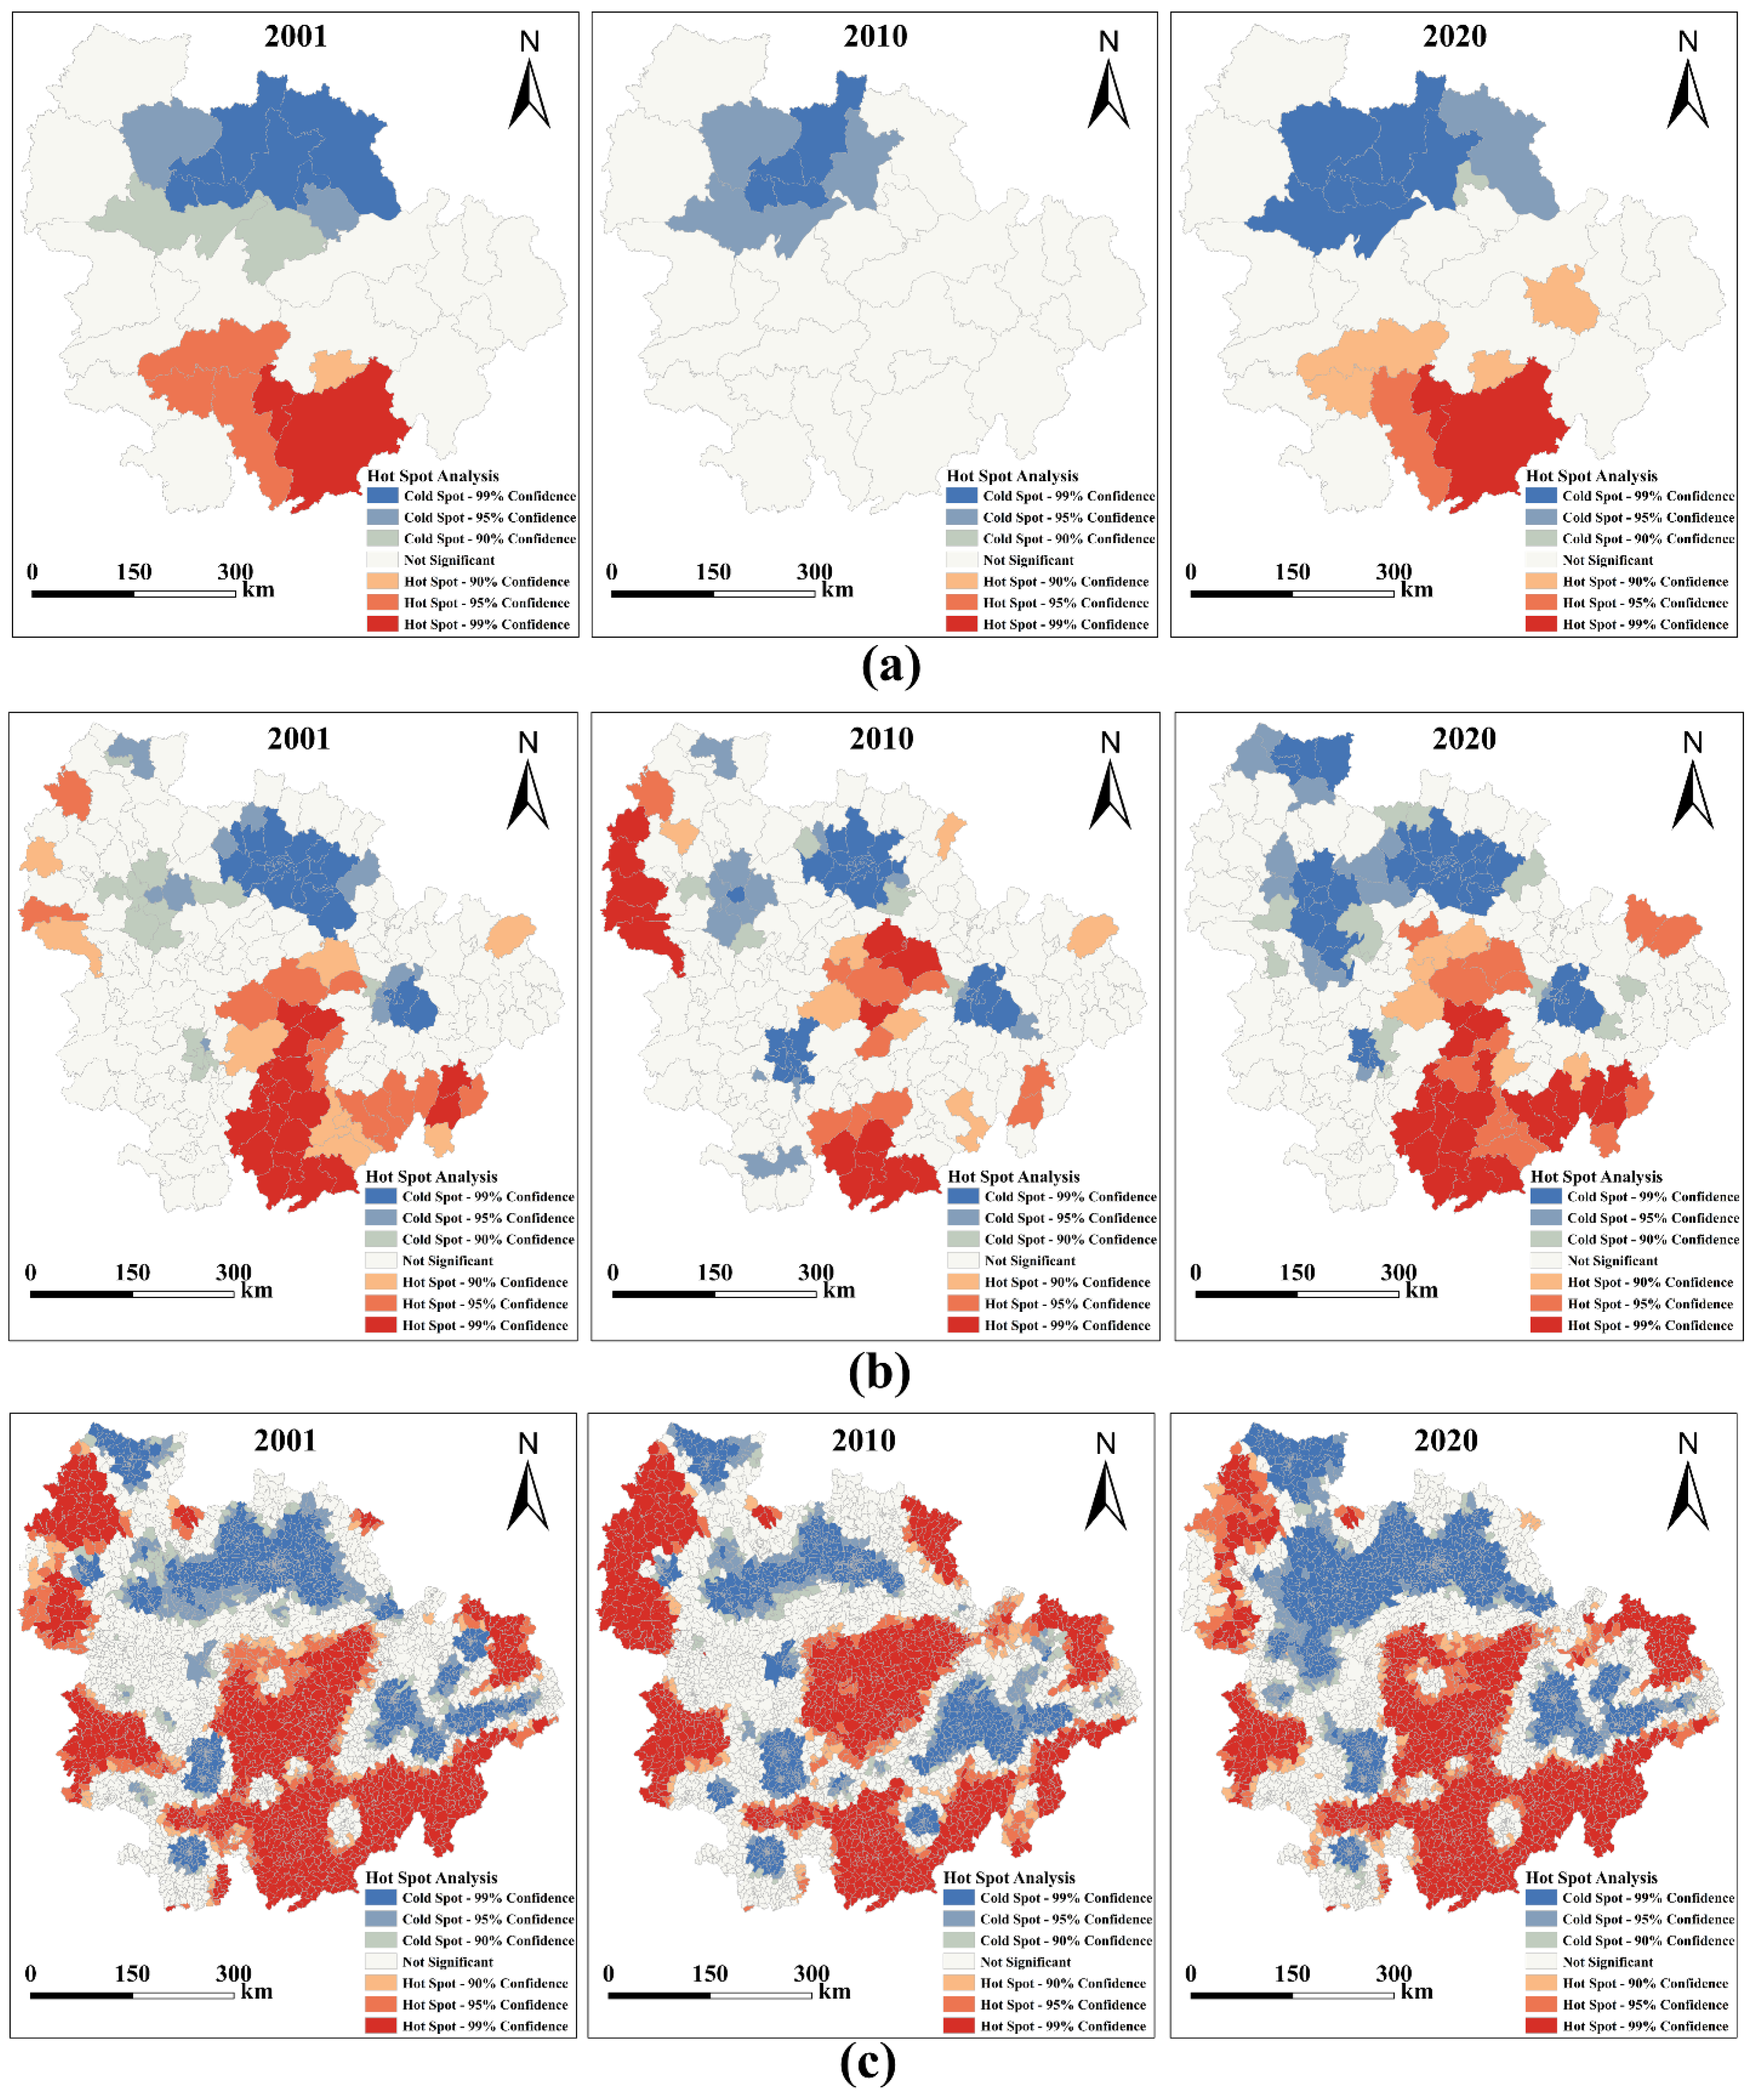
3.3. Spatial Autocorrelation Analysis of Ecological Space Quality

To gain further insight into the spatial aggregation of ESQ, a local spatial autocorrelation analysis was performed focusing on urban agglomerations at different scales (Figure 8). Positive spatial patterns were observed in the ESQ of the urban agglomeration across multiple scales, including city, county, and town scales. The findings suggest that as the scale changes, the distribution of hot spots at the town scale becomes a more regular and clustered pattern (Figure 8). Notably, the town scale is identified as the best scale for ESQ hot spot analysis. At the town scale, hot spots are mainly located surrounding urban agglomerations and in the central mountain area, while cold spots were predominantly distributed in plain areas and the peripheral regions of provincial capitals.
At the large scale (city scale), the hot spots of ESQ are primarily located in the southern part of the agglomeration, and the cold spots are primarily located in the north (Figure 8a). From 2001 to 2020, the hot spots were primarily located in the southern part of the study area and the cold spots were primarily located in the northern part of the study area; for 2010, there were no hot spots in the study area, and the colds pots are primarily located in the northern part of the study area. At the county scale, the distribution of hot and cold spots of ESQ is more dispersed and not significantly developed (Figure 8b). In 2001, hot spots of ESQ were primarily distributed in the south, cold spots were predominantly located in the north, with a few occurrences in the counties surrounding Changsha and Nanchang. In 2010, hot spots were scattered in the northwest, central, and south, and cold spots were scattered in the northern, Wuhan, Changsha, and the districts surrounding Nanchang. In 2020, hot spots were concentrated in the south, with a few areas in the east, whereas low ESQ areas were located in the north, with a few areas in Changsha and counties surrounding Nanchang. Town-scale areas of high ESQ were mainly around urban agglomerations and in the central mountainous regions, while low ESQ regions were concentrated in the plains and around large cities (Figure 8c). The hot spots in the central portion of the agglomeration exhibited a certain level of stability between 2001 and 2010. In contrast, the cold spots increased from the north to the southwest and east, whereas the hot spots in the south spread to the northwest, northeast, and east. In the 2010 to 2020 period, the hot spots were primarily concentrated in the central to southern regions, with a small number located in the northwest, west, and east, while the cold spots were mostly concentrated in the northern part of the agglomeration, with only a few in the southwest and east.
With statistical spatial change data at the town scale, a hot spot analysis was performed to further investigate the spatial distribution of ESQ degradation and improvement (Figure S5). The regions experiencing ESQ improvement hot spots were predominantly found in low-urbanization areas surrounding the study area and in the central mountainous areas between 2001 and 2010. The hot spots of ESQ degradation were primarily distributed in the southern, southwestern, and eastern parts of the study area (Figure S5a,b). The hot spots of ESQ improvement were predominantly located in the south, southwest, and east of the study area from 2010 to 2020, whereas the hot spots of ESQ degradation were predominantly located in the central, western, southwestern, and eastern parts of the study area (Figure S5c,d).

4. Discussion

4.1. Spatial-Temporal Variation Characteristics of ESQ of Urban Agglomerations in Time Series

The ESQ serves as a tangible representation of the external characteristics exhibited by regional ecosystems. The level of excellence directly impacts residents’ perspectives and urban development and serves as a significant measure of evaluating the developmental potential of cities [4]. The comprehensive analysis of ESQ over 20 years conducted in the present study (Figure 7) revealed a distinct pattern in ESQ in which ESQ around urban agglomerations and central mountainous regions significantly exceeded that of plain areas. The primary cause of this consequence can be ascribed to the high population density and economic activity in the plains. In such regions, ecological spaces are subjected to more significant pressure from human activities and land utilization in comparison to mountainous areas [36]. The mean ESQ value of the urban agglomeration from 2001 to 2020 showed an overall fluctuating downward trend. The observed result could be attributed to the rapid development of socio-economic development and urbanization, which exacerbated the impacts of tradeoffs between the natural ecology of urban agglomerations and urban development and land use efficiency. The implementation of ecological construction and urban development has always been in a contradictory development situation, but in the end, the intensified pressure on ecological space has resulted in a decline in ESQ [37]. Significantly, the greatest ESQ was recorded in 2006 and 2012, which provided favorable precipitation and temperature for plant growth, as indicated by increased ORI and elevated EI and OI. The enhanced ESQ within the urban agglomeration can be attributed to the combination of these factors. 2018 and 2020, on the contrary, experienced significant decreases in ESQ. The observed outcome may be ascribed to water resource scarcities, inadequate vegetation coverage, compromised air quality, and increased human population. These pressures diminished outdoor recreational and leisure opportunities for residents. Urbanization-induced land use intensification between 2001 and 2020 significantly altered the ecological characteristics of urban agglomerations and deteriorated natural ecological spaces.
The trend and Hurst index analysis of this study shows that the degraded area of ESQ is more than the improved area from 2001 to 2020, and 38% of the area shows a continuous degradation trend, and this result indicates that there will be a degradation trend of ESQ in the future in the study area. This implies that additional ecological protection measures and the execution of environmental construction initiatives by the government are necessary to address ESQ. Furthermore, it also highlights the need for continued and enhanced initiatives to protect the ecological environment, which will need to be expanded and strengthened in the future as new issues and needs arise, including climate change, biodiversity conservation, and the control of environmental health risks. The regions with slightly degraded ESQ were predominantly those with high urbanization in the plain area (Figure 6a). These regions comprised 50.39%, 45.76%, 33.36%, 45.28%, 38.78%, and 31.20% of the forest, cropland, construction land, water, scrubland, and grassland, respectively (Figure 6d). Significant degradation in ESQ was observed primarily in the northern part of the study area and on the plains, accounting for 29.40%, 32.31%, 35.71%, 28.23%, 51.89%, and 46.66%, respectively, of forest, cropland, construction land, water, scrubland, and grassland (Figure 6d). Notably, 38% of the region exhibits a sustained degradation of the ESQ, with the largest proportions in the northern part of the agglomeration and the counties and cities of the plains (Figure 6b). This region comprised 42.07%, 41.56%, 33%, 45.41%, 29.89%, and 31.6% of the forest, cropland, water, construction land, grassland, and scrubland, respectively (Figure 6e). Due to the development of urbanization, the ecological space has been invaded, and the increase in the intensity of human activities in the plains has had complex, diverse, and long-lasting impacts on the surrounding ecological environment, resulting in a decline in ecosystem service functions and a degradation trend in ESQ [38].
Notably, the greatest improvement in ESQ was observed between 2001 and 2010. The reason for this result is that during the early phase of urbanization (2001–2010), the urban population grew slowly, which resulted in less pressure on ecological space and less impact on the ecosystem. Another reason is that the environmental policies and restoration measures implemented by the Chinese government in the study area have brought positive ecological benefits to the regional ecosystem (Figure S6), such as the Yangtze River Protective Forest Project, farmland reclamation, natural forest protection and farmland return to forest, which are important for regional sustainable development [39,40]. While promoting the construction of ecological civilization, the national government is also actively carrying out ecological environmental education to raise people’s awareness of the concept of harmonious coexistence between humans and nature, to reduce the extent of ecological damage to some extent.
The largest degradation in ESQ occurred between 2010 and 2020, with the highest degradation in areas dominated by forest, cropland, water, grassland, and Construction land. The implementation of national strategies, such as the “Central Rising Strategy”, the “Yangtze River Economic Belt Strategy”, and the “Several Opinions on Promoting the Rising Strategy in Central China” (Figure S6) demonstrated significant influence on urbanization and industrialization processes in the UAMRYR [41]. Insufficient ecological restoration policies or a concentration of regulation measures in specific areas have resulted in the neglect of cropland, forest, water, grassland, and shrubland within these regions. This lack of oversight has in turn resulted in the degradation of ESQ [42]. This result was primarily responsible for the overall lower ESQ in 2020 compared to that in 2001. Restoration and ecological conservation of these ecological spaces will be necessary for future ecological management. This includes the implementation of ecological management projects and the imposition of strict limits on the encroachment and destruction of ecological spaces within and around urban areas, including forests, cropland, shrubs, grasslands, and water. The alternative is to enhance ecological control. Currently, urban agglomerations lack oversight of established ecological protection and restoration zones, which should guarantee that areas of good ecological quality are not destroyed and implement the construction of ecological networking patterns.

4.2. Spatial Agglomeration Effect of ESQ

The spatial heterogeneity of ESQ is closely related to spatial scale, and spatial aggregation characteristics differ significantly at different scales [43]. Previous studies have focused on a single scale. however, hot spot areas of ESQ are likely to fluctuate across multiple scales [44]. Throughout the study period, the distribution pattern of ESQ hot spots at the municipal scale was more dispersed, with the development of some hot spots less pronounced and cold spots concentrated in the north. This is because the spatial continuity in areas with high ESQ ratings is not as good as in areas with low ratings, which may be related to anthropogenic disturbances. From the city scale to the county scale, the ESQ hot spots and cold spots are gradually dispersed and show a certain regularity, and this change is due to the dispersion of the distribution of high and low ESQ areas. In contrast, the distribution of high and low ESQ levels at the town scale shows greater aggregation and regularity, with the most concentrated ESQ hot spots and cold spots at the town scale (Figure 8). The hot spots are concentrated in the mountainous areas around and in the center of the urban agglomerations, which have better ESQ, and the cold spots are concentrated in the plains, where human activities are frequent and which have poorer ESQ. Therefore, the town scale is the best scale for ESQ hot spot analysis and ecological restoration, and the corresponding ecological restoration project has a low cost and good restoration effect.

4.3. ESQ Assessment Methodology

ESQ assessment is a process of the qualitative and quantitative characterization of ecological space conditions [17]. In recent years, scholars have explored comprehensive quantitative methods for regional ESQ evaluation, which are mainly categorized into the following types of methods: (1) Most studies have focused on fixed indicators, such as greenness, dryness, wetness, and heat [45,46,47,48], or public demand for single and multiple services [49,50]. (2) Single-type indicators have been used by some previous studies, namely a single correlation factor such as Normalized Vegetation Index (NDVI) [51], Land Surface Temperature (LST) [7,24], Landscape Pattern Index [52,53], and Net Primary Productivity (NPP) of vegetation to visualize and evaluate ecological status [54]. However, due to the complexity of ecosystems, it is difficult for a single indicator to comprehensively reflect the status of ecosystem quality [55]. (3) In addition, to quantitatively evaluate the regional ecological environment, China’s Ministry of Environmental Protection (2015) established an ecological environment quality index (EI) evaluation index system, and the ecological environment status index (EI) has been widely used to evaluate the ecological environment quality of many provinces, cities, autonomous regions, counties, and watersheds [56], and the evaluation system mainly focuses on a biological abundance index, vegetation cover index, water network density index, land degradation index, and environmental quality index. However, in practical application, the specification still has many problems [57]. For example, there are differences in policy documents and policy objectives in different regions, whether to pay attention to public demand, and different ecological characteristics in different regions, so the original indices cannot comprehensively and scientifically evaluate the quality of the regional ecological environment.
In summary, we propose a new multi-indicator evaluation system that considers regional ecological characteristics based on public demand and policy purposes. Therefore, compared with the previous ecological environmental assessment system, the multiple indicators in the ESQ system reflect the public demand and policy makers’ purpose, and the assessment results can accurately and comprehensively reflect the regional ecological spatial characteristics and better explain the causes of regional ecological problems. In particular, the ESQ assessment system can be adapted to the specific policy objectives and ecological characteristics of different regions, thus improving the practicality of the assessment results. In this study, seven indicators, namely the organism abundance index (OI), ecological vitality index (EI), ecological vulnerability index (EVI), outdoor recreation index (ORI), air quality index (AQI), landscape connectivity index (LCI), and land surface temperature index (LST) were included in the ESQ evaluation system, and the ecological space condition of the UAMRYR was comprehensively evaluated from 2001 to 2020. The results of the study can provide a comprehensive evaluation of the ecological space condition of the urban agglomeration from 2001 to 2020, and provide a reference for further research on the ecological space of the urban agglomeration.

4.4. Implications of ESQ for Sustainable Land Management

From 2001 to 2020, the ESQ of the UAMRYR shows an overall fluctuating downward trend. The trend analysis shows that the degraded area of ESQ in the urban agglomeration is larger than the improved area, and it is expected that the degraded area of ESQ in the urban agglomeration will increase in the future and maintain a continuous degradation trend. The rapid development of urbanization and industrialization has caused changes in land use patterns in urban agglomerations, which further exacerbates the pressure on ecological space in urban agglomerations and leads to the degradation of ESQ [27,58]. Therefore, this paper puts forward the following suggestions to balance the relationship between ESQ and land use, mitigating the impact of urbanization on the ecological environment, and realizing the sustainable management of land resources. The “Grain for Green Program” initiated by the State in 1999 is a good example of land management that aims to protect the ecological environment, improve the ecosystem, and promote sustainable development [59,60]. As a next step, government departments will continue to promote the return of cultivated land to forest on steep slopes around urban agglomerations and in central mountainous areas, as well as the afforestation of forestable barren land, to prevent soil erosion and increase forest cover, and promote the restoration of the ecological space structure and function of urban agglomerations and the improvement of ESQ.
Farmland protection is the core of land management, and the farmland protection policies formulated by government departments mainly prevent urban expansion from further occupying a large amount of high-quality farmland in the plain areas of the urban agglomerations, improve the level of land protection and intensive use, ensure the sustainable use of land, and reduce the pressure on the ecological space of the urban agglomerations. These measures include strict adherence to the arable land red line, the implementation of arable land protection projects, and the curbing of land encroachments [61,62]. In addition to the above arable land protection measures, the government also needs to further protect the urban development boundaries of the central cities of the urban agglomerations (Wuhan, Changsha, and Nanchang) and delineate the boundaries of the areas where urban development and construction can be concentrated, and where urban functions are the main focus, to prevent the disorderly spread of cities and improve the ESQ of the urban agglomerations [63]. Nevertheless, to further strengthen the protection of ecological space in urban agglomerations, the government should establish nature reserves and forest parks in the forest-rich and ecologically healthy areas of urban agglomerations, promote the rational development and protection of ecological land in urban agglomerations, and effectively restrict the occupation of forests and water bodies by human activities [38,64]. Finally, the key factors influencing the ecological space change of urban agglomerations are identified to provide a scientific basis for policy formulation and management, effectively adjust the regional land use structure and urban development direction, and ultimately improve ESQ.

4.5. Research Limitations and Future Work

The novelty of this study lies in constructing a more standardized and comprehensive assessment framework based on policy objectives and public demand, which can be adapted according to the specific policy objectives and ecological characteristics of different regions, thus improving the practicability of the assessment results. We utilized the continuous time series data of ESQ to enhance the dependability and accuracy of ESQ trend analysis results and explored the temporal and spatial patterns of ESQ changes to provide a scientific basis for the formulation of regional sustainable development and environmental management policies.
However, the ESQ assessment system proposed in this paper can effectively assess the features of spatial and temporal change, however, it also has some limitations: (1) Assessment indicators are not comprehensive enough. In the context of the interaction of environmental, economic, political, and socio-cultural factors, ecological space is complex and diverse. We should carry out rational planning, management, and evaluation of the whole ecological process. (2) The ESQ assessment framework can be adapted to the policy objectives and ecological characteristics of different regions. However, the assessment of ecological space change focuses on human well-being. (3) The quantification of the indicators in the evaluation system mainly depends on land use data, and the current land use data are not categorized in sufficient detail and the land use is inaccurate, which to some extent, affects the biased results of ESQ evaluation. (4) Moreover, evaluating small ecological zones within built-up areas is not clear due to data limitations. Therefore, future research should consider socio-economic, cultural, and residents’ health and psychological needs indicators for a better evaluation of ESQ. More attention should be paid to the ecological space in the suburbs of built-up areas of cities to analyze their ecological security problems and conduct research in terms of ecological protection and restoration.

5. Conclusions

Ecological space is the basis for human survival and development. Scientific management is impossible without proper assessment. This study establishes a scientific and comprehensive ESQ assessment system based on policy objectives and public needs, and conducts long–term monitoring studies. A reliable and effective assessment tool can provide policy guidance for ecological protection and restoration, which is important for maintaining regional ecological security and realizing sustainable development. The results of the study show that:
(1)
The ESQ of the urban agglomeration exhibited a fluctuating downward trend from 2001 to 2020, while generally maintaining a good level. In spatial terms, ESQ shows a spatial distribution pattern which is “high in the periphery and center, low in the interior“, with an ESQ significantly higher in the surrounding urban agglomerations and central mountain areas than in the plains.
(2)
The most significant degradation was observed from 2010 to 2020 due to urban development and construction, resulting in a 38.82% degradation of the total area. Conversely, ecological restoration caused the most significant improvement from 2001 to 2010, improving the total area by 12.39%.
(3)
In terms of trends, the degraded areas of ESQ are larger than the improved areas, and it is expected that the degraded area of ESQ will increase compared to the study period, with a sustained trend of degradation.
(4)
The distribution of ESQ has significant spatial aggregation and scale effects. In particular, as the scale decreases, the distribution of ESQ hot spots and cold spots becomes more regular and aggregated, with town-scale hot spots mainly concentrated around urban agglomerations and in the central mountainous areas, and cold spots predominantly located in the areas around central cities (Wuhan, Changsha, and Nanchang).
Due to the increasing urbanization, the government needs to prioritize the restoration and protection of ecological space at the scale of towns and cities where human activities are most intensive, focus on the rational development and protection of ecological space at the community scale, and raise the ecological awareness of residents. However, the ESQ evaluation system also has some limitations, such as the difficulty of data collection, which leads to an insufficient number of selected evaluation indicators, which needs to be improved in future studies. Our evaluation results can provide a reference for regional ecological space protection and management.

Supplementary Materials

The following supporting information can be downloaded at: https://www.mdpi.com/article/10.3390/land13060842/s1, Figure S1 to S6. Figure S1. Research data sources. Figure S2. The regional adaptation assessment results for the ESQ using the standardized CHEQ index. Figure S3. Area distribution of ESQ grades. Figure S4. Spatial transfer and spatial change characteristics of the ESQ grade from 2001 to 2020. Figure S5. Hotspots analysis of spatial changes in ESQ at the town scale 2001–2020. Figure S6. Relevant ecological protection policies and restoration works in the study are.

Author Contributions

Conceptualization, R.Z. and Z.W.; methodology, R.Z. and L.W.; validation, R.Z. and Z.W.; investigation, Q.L. and B.C.; data curation, M.Z. and Q.L.; writing—original draft preparation, R.Z.; writing—review and editing, Z.W. and L.W.; project administration, Z.W. All authors have read and agreed to the published version of the manuscript.

Funding

This research was supported by the Hubei Key Research and Development Program in China (2020AAA004).

Data Availability Statement

Data are contained within the article.

Conflicts of Interest

The authors declare no conflicts of interest.

Appendix A. Questionnaire on Urban Residents’ Preferences for ESQ Evaluation System Indicators

The questionnaires for the selection of indicators in this study were mainly online surveys, and a small number of samples were used for field visits and expert consultations to ensure the scientificity and rationality of the selection of evaluation indicators. The 12 following indicators were selected for this survey, and the demographic information of the respondents is shown in Figure A1, and a total of 342 valid questionnaires were returned (Figure A2).
Figure A1. Demographic information of respondents in the questionnaire (n = 342).
Land 13 00842 g0a1
Figure A2. Importance of indicators in establishing the ESQ evaluation system according to respondents.
Land 13 00842 g0a2

References

  1. Wang, R.S.; Li, F.; Hu, D.; Li, B.L. Understanding eco-complexity: Social-Economic-Natural Complex Ecosystem approach. Ecol. Complex. 2011, 8, 15–29. [Google Scholar] [CrossRef]
  2. Hong, W.Y.; Liao, C.C.; Guo, R.Z.; An, Q.; Li, X.M.; Ma, T. Predicting the minimum scale of urban ecological space based on socio-ecological systems analysis. Sci. Total Environ. 2023, 863, 160912. [Google Scholar] [CrossRef] [PubMed]
  3. Ouyang, Z.; Zheng, H.; Xiao, Y.; Polasky, S.; Liu, J.; Xu, W.; Wang, Q.; Zhang, L.; Xiao, Y.; Rao, E.M.; et al. Improvements in ecosystem services from investments in natural capital. Science 2016, 352, 1455–1459. [Google Scholar] [CrossRef] [PubMed]
  4. Wang, P.; Wang, K.; Chen, T.; Li, P. Progress and prospect of research on urban ecological space. Prog. Geogr. 2017, 36, 207–218. [Google Scholar] [CrossRef]
  5. Huang, Q.F.; Lu, Y.Q. Urban heat island research from 1991 to 2015: A bibliometric analysis. Theor. Appl. Climatol. 2018, 131, 1055–1067. [Google Scholar] [CrossRef]
  6. Chen, H.Y.; Hao, Y.; Li, J.W.; Song, X.J. The impact of environmental regulation, shadow economy, and corruption on environmental quality: Theory and empirical evidence from China. J. Clean. Prod. 2018, 195, 200–214. [Google Scholar] [CrossRef]
  7. Grooms, B.P.; Urbanek, R.E. Exploring the effects of non-consumptive recreation, trail use, and environmental factors on state park avian biodiversity. J. Environ. Manag. 2018, 227, 55–61. [Google Scholar] [CrossRef] [PubMed]
  8. Martín-López, B.; Gómez-Baggethun, E.; Lomas, P.L.; Montes, C. Effects of spatial and temporal scales on cultural services valuation. J. Environ. Manag. 2009, 90, 1050–1059. [Google Scholar] [CrossRef] [PubMed]
  9. Fang, C.L.; Cui, X.G.; Li, G.D.; Bao, C.; Wang, Z.B.; Ma, H.T.; Sun, S.A.; Liu, H.M.; Luo, K.; Ren, Y.F. Modeling regional sustainable development scenarios using the Urbanization and Eco-environment Coupler: Case study of Beijing Tianjin-Hebei urban agglomeration, China. Sci. Total Environ. 2019, 689, 820–830. [Google Scholar] [CrossRef]
  10. Zhang, Y.; Liu, Y.F.; Zhang, Y.; Liu, Y.; Zhang, G.X.; Chen, Y.Y. On the spatial relationship between ecosystem services and urbanization: A case study in Wuhan, China. Sci. Total Environ. 2018, 637, 780–790. [Google Scholar] [CrossRef]
  11. Chen, D.S.; Jiang, P.H.; Li, M.C. Assessing potential ecosystem service dynamics driven by urbanization in the Yangtze River Economic Belt, China. J. Environ. Manag. 2021, 292, 112734. [Google Scholar] [CrossRef] [PubMed]
  12. Pártl, A.; Vackár, D.; Loucková, B.; Lorencová, E.K. A spatial analysis of integrated risk: Vulnerability of ecosystem services provisioning to different hazards in the Czech Republic. Nat. Hazards 2017, 89, 1185–1204. [Google Scholar] [CrossRef]
  13. Zhu, D.Y.; Chen, T.; Wang, Z.W.; Niu, R.Q. Detecting ecological spatial-temporal changes by Remote Sensing Ecological Index with local adaptability. J. Environ. Manag. 2021, 299, 113655. [Google Scholar] [CrossRef] [PubMed]
  14. Zhang, T.J.; Zhang, S.P.; Cao, Q.; Wang, H.Y.; Li, Y.L. The spatiotemporal dynamics of ecosystem services bundles and the social-economic-ecological drivers in the Yellow River Delta region. Ecol. Indic. 2022, 135, 108573. [Google Scholar] [CrossRef]
  15. Zhang, X.M.; Fan, H.B.; Liu, F.; Lv, T.G.; Sun, L.; Li, Z.L.; Shang, W.L.; Xu, G.L. Coupling coordination between the ecological environment and urbanization in the middle reaches of the Yangtze River urban agglomeration. Urban Clim. 2023, 52, 101698. [Google Scholar] [CrossRef]
  16. Chen, W.X.; Chi, G.Q.; Li, J.F. The spatial aspect of ecosystem services balance and its determinants. Land Use Policy 2020, 90, 104263. [Google Scholar] [CrossRef]
  17. Aizizi, Y.; Kasimu, A.; Liang, H.W.; Zhang, X.L.; Zhao, Y.Y.; Wei, B.H. Evaluation of ecological space and ecological quality changes in urban agglomeration on the northern slope of the Tianshan Mountains. Ecol. Indic. 2023, 146. [Google Scholar] [CrossRef]
  18. Vatn, A. An institutional analysis of methods for environmental appraisal. Ecol. Econ. 2009, 68, 2207–2215. [Google Scholar] [CrossRef]
  19. Roces-Díaz, J.V.; Vayreda, J.; Banqué-Casanovas, M.; Díaz-Varela, E.; Bonet, J.A.; Brotons, L.; de-Miguel, S.; Herrando, S.; Martínez-Vilalta, J. The spatial level of analysis affects the patterns of forest ecosystem services supply and their relationships. Sci. Total Environ. 2018, 626, 1270–1283. [Google Scholar] [CrossRef]
  20. Wang, S.X.; Hao, J.M. Air quality management in China: Issues, challenges, and options. J. Environ. Sci. 2012, 24, 2–13. [Google Scholar] [CrossRef]
  21. Palmeiro-Silva, Y.K.; Lescano, A.G.; Flores, E.C.; Astorga, Y.; Rojas, L.; Chavez, M.G.; Mora-Rivera, W.; Hartinger, S.M. Identifying gaps on health impacts, exposures, and vulnerabilities to climate change on human health and wellbeing in South America: A scoping review. Lancet Reg. Health Am. 2023, 26, 100580. [Google Scholar] [CrossRef] [PubMed]
  22. Zhang, D.J.; Tang, R.L.; Zhao, W.; Tang, B.H.; Wu, H.; Shao, K.; Li, Z.L. Surface Soil Water Content Estimation from Thermal Remote Sensing based on the Temporal Variation of Land Surface Temperature. Remote Sens. 2014, 6, 3170–3187. [Google Scholar] [CrossRef]
  23. Yusa, A.; Berry, P.; Cheng, J.J.; Ogden, N.; Bonsal, B.; Stewart, R.; Waldick, R. Climate Change, Drought and Human Health in Canada. Int. J. Environ. Res. Public Health 2015, 12, 8359–8412. [Google Scholar] [CrossRef] [PubMed]
  24. Guo, N.A.; Liang, X.B.; Meng, L.R. Evaluation of the Thermal Environmental Effects of Urban Ecological Networks—A Case Study of Xuzhou City, China. Sustainability 2022, 14, 7744. [Google Scholar] [CrossRef]
  25. Zheng, L.; Wang, Y.; Li, J.F. Quantifying the spatial impact of landscape fragmentation on habitat quality: A multi-temporal dimensional comparison between the Yangtze River Economic Belt and Yellow River Basin of China. Land Use Policy 2023, 125, 106463. [Google Scholar] [CrossRef]
  26. Yi, Y.; Zhang, C.; Zhang, G.L.; Xing, L.Q.; Zhong, Q.C.; Liu, J.L.; Lin, Y.C.; Zheng, X.W.; Yang, N.; Sun, H.; et al. Effects of Urbanization on Landscape Patterns in the Middle Reaches of the Yangtze River Region. Land 2021, 10, 1025. [Google Scholar] [CrossRef]
  27. Liu, M.B.; Xiong, Y.F.; Zhang, A.L. Multi-scale telecoupling effects of land use change on ecosystem services in urban agglomerations—A case study in the middle reaches of Yangtze River urban agglomerations. J. Clean. Prod. 2023, 415, 137878. [Google Scholar] [CrossRef]
  28. Hu, C.; Song, M.; Zhang, A.L. Dynamics of the eco-environmental quality in response to land use changes in rapidly urbanizing areas: A case study of Wuhan, China from 2000 to 2018. J. Geogr. Sci. 2023, 33, 245–265. [Google Scholar] [CrossRef]
  29. Kumar, M.; Kalra, N.; Singh, H.; Sharma, S.; Rawat, P.S.; Singh, R.K.; Gupta, A.K.; Kumar, P.; Ravindranath, N.H. Indicator-based vulnerability assessment of forest ecosystem in the Indian Western Himalayas: An analytical hierarchy process integrated approach. Ecol. Indic. 2021, 125, 107568. [Google Scholar] [CrossRef]
  30. Chen, X.C.; Li, F.; Li, X.Q.; Hu, Y.H.; Wang, Y. Mapping ecological space quality changes for ecological management: A case study in the Pearl River Delta urban agglomeration, China. J. Environ. Manag. 2020, 267, 110658. [Google Scholar] [CrossRef]
  31. Peng, C.C.; Zeng, J.Y.; Chen, K.S.; Li, Z.; Ma, H.L.; Zhang, X.; Shi, P.F.; Wang, T.T.; Yi, L.; Bi, H.Y. Global spatiotemporal trend of satellite-based soil moisture and its influencing factors in the early 21st century. Remote. Sens. Environ. 2023, 291, 113569. [Google Scholar] [CrossRef]
  32. Li, T.; Chen, Y.Z.; Han, L.J.; Cheng, L.H.; Lv, Y.H.; Fu, B.J.; Feng, X.M.; Wu, X. Shortened duration and reduced area of frozen soil in the Northern Hemisphere. Innovation 2021, 2, 100146. [Google Scholar] [CrossRef] [PubMed]
  33. Tao, S.; Peng, W.F.; Xiang, J.Y. Spatiotemporal variations and driving mechanisms of vegetation coverage in the Wumeng Mountainous Area, China. Ecol. Inform. 2022, 70, 101737. [Google Scholar] [CrossRef]
  34. Jiang, W.G.; Yuan, L.H.; Wang, W.J.; Cao, R.; Zhang, Y.F.; Shen, W.M. Spatio-temporal analysis of vegetation variation in the Yellow River Basin. Ecol. Indic. 2015, 51, 117–126. [Google Scholar] [CrossRef]
  35. Xu, Z.H.; Peng, J.; Dong, J.Q.; Liu, Y.X.; Liu, Q.Y.; Lyu, D.N.; Qiao, R.L.; Zhang, Z.M. Spatial correlation between the changes of ecosystem service supply and demand: An ecological zoning approach. Landsc. Urban Plan. 2022, 217, 104258. [Google Scholar] [CrossRef]
  36. Yu, Y.; Tong, Y.; Tang, W.W.; Yuan, Y.B.; Chen, Y. Identifying Spatiotemporal Interactions between Urbanization and Eco-Environment in the Urban Agglomeration in the Middle Reaches of the Yangtze River, China. Sustainability 2018, 10, 290. [Google Scholar] [CrossRef]
  37. Gu, Q.W.; Wang, H.Q.; Zheng, Y.N.; Zhu, J.W.; Li, X.K. Ecological footprint analysis for urban agglomeration sustainability in the middle stream of the Yangtze River. Ecol. Model. 2015, 318, 86–99. [Google Scholar] [CrossRef]
  38. Zhu, Z.; He, Q.Y. Spatio-temporal evaluation of the urban agglomeration expansion in the middle reaches of the Yangtze River and its impact on ecological lands. Sci. Total Environ. 2021, 790, 148150. [Google Scholar] [CrossRef] [PubMed]
  39. Chen, W.X.; Zhao, H.B.; Li, J.F.; Zhu, L.J.; Wang, Z.Y.; Zeng, J. Land use transitions and the associated impacts on ecosystem services in the Middle Reaches of the Yangtze River Economic Belt in China based on the geo-informatic Tupu method. Sci. Total Environ. 2020, 701, 134690. [Google Scholar] [CrossRef]
  40. Peng, L.; Wu, H.W.; Li, Z.H. Spatial-Temporal Evolutions of Ecological Environment Quality and Ecological Resilience Pattern in the Middle and Lower Reaches of the Yangtze River Economic Belt. Remote Sens. 2023, 15, 430. [Google Scholar] [CrossRef]
  41. Zhang, D.; Wang, Z.Q.; Li, S.C.; Zhang, H.W. Impact of Land Urbanization on Carbon Emissions in Urban Agglomerations of the Middle Reaches of the Yangtze River. Int. J. Environ. Res. Public Health 2021, 18, 1403. [Google Scholar] [CrossRef] [PubMed]
  42. Dai, X.; Wang, L.C.; Huang, C.B.; Fang, L.L.; Wang, S.Q.; Wang, L.Z. Spatio-temporal variations of ecosystem services in the urban agglomerations in the middle reaches of the Yangtze River, China. Ecol. Indic. 2020, 115, 106394. [Google Scholar] [CrossRef]
  43. Sun, W.; Li, D.H.; Wang, X.R.; Li, R.X.; Li, K.; Xie, Y.J. Exploring the scale effects, trade-offs and driving forces of the mismatch of ecosystem services. Ecol. Indic. 2019, 103, 617–629. [Google Scholar] [CrossRef]
  44. Wang, J.L.; Zhou, W.Q.; Pickett, S.T.A.; Yu, W.J.; Li, W.F. A multiscale analysis of urbanization effects on ecosystem services supply in an urban megaregion. Sci. Total Environ. 2019, 662, 824–833. [Google Scholar] [CrossRef] [PubMed]
  45. Jing, Y.Q.; Zhang, F.; He, Y.F.; Kung, H.T.; Johnson, V.C.; Arikena, M. Assessment of spatial and temporal variation of ecological environment quality in Ebinur Lake Wetland National Nature Reserve, Xinjiang, China. Ecol. Indic. 2020, 110, 105874. [Google Scholar] [CrossRef]
  46. Xu, H.Q.; Wang, Y.F.; Guan, H.D.; Shi, T.T.; Hu, X.S. Detecting Ecological Changes with a Remote Sensing Based Ecological Index (RSEI) Produced Time Series and Change Vector Analysis. Remote Sens. 2019, 11, 2345. [Google Scholar] [CrossRef]
  47. Yuan, B.D.; Fu, L.N.; Zou, Y.; Zhang, S.Q.; Chen, X.S.; Li, F.; Deng, Z.M.; Xie, Y.H. Spatiotemporal change detection of ecological quality and the associated affecting factors in Dongting Lake Basin, based on RSEI. J. Clean. Prod. 2021, 302, 126995. [Google Scholar] [CrossRef]
  48. Guo, Y.K.; Zhao, S.Q.; Zhao, X.; Wang, H.Y.; Shi, W.X.; Song, C.H.; Li, J.X.; Lin, T.; Ye, H.; Zhan, G.Q. Evaluation of the Spatiotemporal Change of Ecological Quality under the Context of Urban Expansion-A Case Study of Typical Urban Agglomerations in China. Remote Sens. 2024, 16, 45. [Google Scholar] [CrossRef]
  49. Baró, F.; Gómez-Baggethun, E.; Haase, D. Ecosystem service bundles along the urban-rural gradient: Insights for landscape planning and management. Ecosyst. Serv. 2017, 24, 147–159. [Google Scholar] [CrossRef]
  50. Fu, Q.; Li, B.; Hou, Y.; Bi, X.; Zhang, X.S. Effects of land use and climate change on ecosystem services in Central Asia’s arid regions: A case study in Altay Prefecture, China. Sci. Total Environ. 2017, 607, 633–646. [Google Scholar] [CrossRef]
  51. Cui, R.H.; Han, J.Z.; Hu, Z.Q. Assessment of Spatial Temporal Changes of Ecological Environment Quality: A Case Study in Huaibei City, China. Land 2022, 11, 944. [Google Scholar] [CrossRef]
  52. Li, M.; Luo, G.J.; Li, Y.B.; Qin, Y.; Huang, J.; Liao, J.J. Effects of landscape patterns and their changes on ecosystem health under different topographic gradients: A case study of the Miaoling Mountains in southern China. Ecol. Indic. 2023, 154, 110796. [Google Scholar] [CrossRef]
  53. Liu, Y.X.; Lü, Y.H.; Fu, B.J.; Zhang, X. Landscape pattern and ecosystem services are critical for protected areas’ contributions to sustainable development goals at regional scale. Sci. Total Environ. 2023, 881, 163535. [Google Scholar] [CrossRef] [PubMed]
  54. Xu, Y.; Lu, Y.G.; Zou, B.; Xu, M.; Feng, Y.X. Unraveling the enigma of NPP variation in Chinese vegetation ecosystems: The interplay of climate change and land use change. Sci. Total Environ. 2024, 912, 169023. [Google Scholar] [CrossRef] [PubMed]
  55. Zhang, Y.; She, J.Y.; Long, X.R.; Zhang, M. Spatio-temporal evolution and driving factors of eco-environmental quality based on RSEI in Chang-Zhu-Tan metropolitan circle, central China. Ecol. Indic. 2022, 144, 109436. [Google Scholar] [CrossRef]
  56. Wang, C.L.; Jiang, Q.O.; Shao, Y.Q.; Sun, S.Y.; Xiao, L.; Guo, J.B. Ecological environment assessment based on land use simulation: A case study in the Heihe River Basin. Sci. Total Environ. 2019, 697, 133928. [Google Scholar] [CrossRef] [PubMed]
  57. Sun, C.; Li, J.L.; Liu, Y.C.; Cao, L.D.; Zheng, J.H.; Yang, Z.J.; Ye, J.W.; Li, Y. Ecological quality assessment and monitoring using a time-series remote sensing-based ecological index (ts-RSEI). Giscience Remote Sens. 2022, 59, 1793–1816. [Google Scholar] [CrossRef]
  58. Zhang, S.Q.; Yang, P.; Xia, J.; Wang, W.Y.; Cai, W.; Chen, N.C.; Hu, S.; Luo, X.G.; Li, J.; Zhan, C.S. Land use/land cover prediction and analysis of the middle reaches of the Yangtze River under different scenarios. Sci. Total Environ. 2022, 833, 155238. [Google Scholar] [CrossRef] [PubMed]
  59. Uchida, E.; Xu, J.T.; Rozelle, S. Grain for green: Cost-effectiveness and sustainability of China’s conservation set-aside program. Land Econ. 2005, 81, 247–264. [Google Scholar] [CrossRef]
  60. Liu, Z.; Lan, J. The Sloping Land Conversion Program in China: Effect on the Livelihood Diversification of Rural Households. World Dev. 2015, 70, 147–161. [Google Scholar] [CrossRef]
  61. Zhang, Z.H.; Wang, X.T.; Zhang, Y.; Gao, Y.; Liu, Y.X.; Sun, X.M.; Zhi, J.J.; Yin, S.F. Simulating land use change for sustainable land management in rapid urbanization regions: A case study of the Yangtze River Delta region. Landsc. Ecol. 2023, 38, 1807–1830. [Google Scholar] [CrossRef]
  62. Haregeweyn, N.; Tsunekawa, A.; Tsubo, M.; Fenta, A.A.; Ebabu, K.; Vanmaercke, M.; Borrelli, P.; Panagos, P.; Berihun, M.L.; Langendoen, E.J.; et al. Progress and challenges in sustainable land management initiatives: A global review. Sci. Total Environ. 2023, 858, 160027. [Google Scholar] [CrossRef] [PubMed]
  63. Zhang, Y.N.; Long, H.L.; Tu, S.S.; Ge, D.Z.; Ma, L.; Wang, L.Z. Spatial identification of land use functions and their tradeoffs/synergies in China: Implications for sustainable land management. Ecol. Indic. 2019, 107, 105550. [Google Scholar] [CrossRef]
  64. Cheng, A.T.; Sims, K.R.E.; Yi, Y.Y. Economic development and conservation impacts of China’s nature reserves. J. Environ. Econ. Manag. 2023, 121, 102848. [Google Scholar] [CrossRef]
Figure 1. Framework of this study.
Land 13 00842 g001
Figure 2. (a) The UAMRYR in China; and (b) elevation distribution map of the UAMRYR.
Land 13 00842 g002
Figure 3. Assessment indicator system of ESQ in the UAMRYR.
Land 13 00842 g003
Figure 4. Assessment indicators of ESQ in the UAMRYR.
Land 13 00842 g004
Figure 5. The changing trend of the ESQ and the indicators. (a) ESQ (ecological space quality); (b) OI (organism abundance index); (c) EI (ecological vitality index); (d) EVI (ecological vulnerability index); (e) ORI (outdoor recreation index); (f) AQI (air quality index); (g) LCI (landscape connectivity index); (h) LST (land surface temperature index).
Land 13 00842 g005
Figure 6. Spatial distribution of ESQ. (a) Trend changes in ESQ; (b) Future trends of the ESQ; (c) Major land use types; (d) Trend changes in ESQ in land use; (e) Future trend changes in ESQ in land use.
Land 13 00842 g006
Figure 7. The spatial distribution of the ESQ.
Land 13 00842 g007
Figure 8. The hot spots and cold spots of ESQ in 2001, 2010 and 2020 ((a) at city scale, (b) at county scale, (c) at town scale).
Land 13 00842 g008
Table 1. Calculation methods and weighting of indicators.
IndicatorsWeightCalculation Methods
Organism abundance index (OI)0.17OI = (HQ + BI)/2
HQ is the habitat quality index, and BI is the biodiversity index. Calculated by weighting land use types.
Ecological vitality index (EI)0.15 EI = 0.6   ×   C + 0.4   ×   DW , C is the vegetation index, and DW is the water density index.
Ecological vulnerability index (EVI)0.15Calculated by weighting the soil erosion susceptibility indices.
Outdoor recreation index (ORI)0.17Calculated using the ESTIMAP recreation method
Air quality index (AQI)0.14Based on the air quality data from the monitoring stations, the characterization was performed using kriging method interpolation.
Landscape connectivity index (LCI)0.1Calculated using Fragstats 4.2 software.
Land surface temperature (LST)0.12Using the China regional 1 km seamless surface temperature dataset to characterize the LST index
Table 2. The classification standard of the ecological space quality.
LevelWorsePoorModerateGoodBetter
IndexESQ < 2020 ≤ ESQ < 3535 ≤ ESQ < 5555 ≤ ESQ < 75ESQ ≥ 75
DescriptionEcological conditions are poor and human life is restricted, requiring immediate ecological restoration.Vegetation cover is poor, species are low, and there are obvious constraints to human life that require ecological restoration.There is moderate vegetation cover and an average biodiversity level, and though this can sustain human life, factors limiting human life exist, requiring ecological management.Higher vegetation cover and rich biodiversity sustain human life.High vegetation cover, rich biodiversity, ecological stability, and suitability for ecological conservation.
Disclaimer/Publisher’s Note: The statements, opinions and data contained in all publications are solely those of the individual author(s) and contributor(s) and not of MDPI and/or the editor(s). MDPI and/or the editor(s) disclaim responsibility for any injury to people or property resulting from any ideas, methods, instructions or products referred to in the content.

