Abstract
The exploration of ecological security patterns (ESPs) can help people find those areas that are in urgent need of restoration, which is an effective way to realize ecological protection. It is of utmost significance for promoting regional sustainable development to construct ESP and put forward sub-regional optimization suggestions based on the supply and demand ratio of ecosystem services (ESs). In this paper, we assessed the level of supply and demand for five ESs based on multi-source data in 2020 with the help of InVEST, ArcGIS, and IUEMS. Based on the results of supply and demand, we calculated the supply and demand ratio of ESs and extracted the ecological source areas (ESAs) on this basis. Then, we used the Linkage Mapper tool to construct the ESP based on the principle of the minimum cumulative resistance (MCR) model and circuit theory in the Chengdu–Chongqing economic circle (CCEC). Our results indicated that there were apparent spatial differences in the supply and demand of five ESs. There were 35 ESAs in the ESP network, covering an area of about 7914 km2, and most of their land use types were woodland. The CCEC was interconnected by a network of 91 ecological corridors (ECs), spanning a total length of approximately 10,701 km. From the ECs, we extracted 29 ecological pinch points (EPPs) and 16 ecological barrier points (EBPs), which each accounted for about 0.3% of the planned area of the CCEC. Finally, we divided the ecological spaces into four types and put forward the corresponding optimization suggestions. Among them, the proportion of ecological restoration area was 7.7%, which was located in Chengdu City, northwest of the study area. The findings of this paper can give some theoretical guidance and serve as a reference for making decisions in the pursuit of ecological civilization in this region.
1. Introduction
Ecosystem services (ESs) refer to the various material products and benefits that human beings obtain directly or indirectly from ecosystems, mainly including supply, regulation, support, and cultural services [1,2]. The balance between the supply and demand of ESs is the key to reflecting the development potential and health level of the ecological environment. In the current economic surge and rapid urbanization, various types of living and production activities are also intensifying. Based on this status quo, the discrepancy between the supply and demand of ESs is followed in space, resulting in many ecological issues, including soil erosion, greenhouse effect, drought, flood, degradation of ESs functions, and loss of biodiversity, which directly or indirectly affect the ecological environment security of a certain region [3]. As a land management methodology that can effectively guarantee the health of ecosystems and protect biodiversity, the ecological security pattern (ESP) was established as one of the three strategic patterns for land resource protection, which affected ESs by affecting the natural ecological processes [4]. The construction of the ESP aims to identify an ecological network composed of key ecological elements. By restoring the damaged ecological elements in an ecological network and ensuring the full play of their ecological functions, the connectivity of the ESP network can be increased to maintain regional ecological security [5]. Therefore, in the context of global climate change, optimizing the allocation of natural resources by identifying the ESP network has become an important means for many countries or regions to maintain ecological security. In this process, how to coordinate the contradiction between the ecological environment and economic development is a key issue. The supply and demand of ESs are the most intuitive means to quantify the ecological environment and economic development. Using the balance between supply and demand of ESs as the scientific basis for establishing a regional ESP plays a crucial role in promoting integrated ecosystem management, rational allocation of natural resources, and comprehensive improvement of people’s well-being.
The concept of ESs was first formed in the 1960s [6]. With the proposal of the concept of ecological civilization construction, it has become the focus of common concern among academia and managers. At present, for ESs, scholars focus on supply and demand matching [7], ecological compensation [8], value accounting [9], trade-offs and synergies [10], ecosystem service flow [11], and so on. On the whole, international research focuses on the study of the interdependence between ESs and human well-being [12]. In China, more attention was paid to ecosystem service assessment, land use, and sustainability of ESs [13]. For the functional assessment of ESs, the most widely used models are InVEST [14], ARIES [15], SWAT [16], FLUS [17], and SolVES [18]. The study of ESP originated in the field of landscape ecology planning abroad [19]. At the beginning of the 20th century, scholars gradually carried out research from the aspects of ecological networks [20], green space [21], green infrastructure [22], and so on. The research scope involved habitat conservation [23], urban spatial planning [24], ecological restoration area identification [25], and other fields, and its technical system was relatively mature. The establishment of ESP has evolved into fundamental processes of “determining ecological source areas (ESAs)–constructing ecological resistance surface (ERS)–extracting ecological corridors (ECs) and nodes” [26]. A reasonable and orderly ESP can preserve the integrity of the ecosystem, strengthen the spatial arrangement of the ecosystem, and ultimately safeguard the harmony of the ecosystem [27]. Therefore, in the context of the increasingly prominent contradiction between the current ecological environment and social economy, the mutual coordination pattern of the natural ecosystem and social and economic coupling gradually became the current research trend of ESP [28].
One of the most important links in the construction of ESP is the identification of ESAs. As an important patch in the landscape, ESAs are the basis for generating ECs and ecological nodes and have an important contribution to maintaining the stability of ecological processes [29]. Therefore, knowing how to accurately identify ESAs is the key to building ESP. The identification methods of ESAs can be summarized as direct methods and indirect methods. One method is to directly select patches with high-quality habitat, such as historical sites, biological habitats, urban green spaces, and nature reserves, as ESAs [30,31]. Although this method is simple to operate, its applicability is limited. Another indirect method of extracting ESAs is to construct an evaluation system by selecting indicators to calculate ecological security, environmental carrying capacity, ecological sensitivity, ecosystem service function, and so on [26,32,33,34]. Although the indirect method requires complex data processing, the extraction results are relatively more accurate. However, most studies using indirect methods to identify ESAs only focus on the single dimension of the supply of ESs and rarely consider the interrelationship between natural system supply and human social needs. The balance between supply and demand of ESs is not only an effective measure to coordinate the contradiction between economic development and environmental protection but also an effective way to alleviate climate change. This balance is crucial for maintaining regional ecological security and promoting the healthy development of the natural environment [35]. The imbalance of supply and demand capacity of regional ESs will affect the identification of ESAs in the process of ESP construction and then affect the quantity and spatial distribution of other ecological elements. Based on the balance of supply and demand for ESs, Wu et al. constructed the ESP of Hubei Province and put forward the ecological protection and restoration pattern of “two axes, three belts, four districts, and five cores” [36]. Gao et al. coupled the supply and demand of ESs to construct the ESP of the Yangtze River Delta region and simulated the supply and demand changes of future ESs in multiple scenarios [37]. Tian et al. extracted the ESAs by calculating the matching state of supply and demand of ESs and obtained the ESP of the West Liao river basin [38]. These studies not only reflect the importance of the balance of supply and demand of ESs in the construction of ESP but also show the universal applicability of using the balance of supply and demand of ESs to extract ESAs. Therefore, this paper identified ESAs from the perspective of the supply and demand ratio of ESs, and constructed an ESP network, in order to enrich the application of ESs in ESP from theoretical aspects and provide scientific reference for the formulation of relevant policies in practical aspects.
Chengdu and Chongqing are important national central cities in southwest China, and Chongqing is the last pass to strictly guard the ecological barrier in the upper reaches of the Yangtze River. The Chengdu–Chongqing economic circle (CCEC) is a crucial strategic focal point for the advancement of the western region and contributes significantly to fostering high-quality development nationwide. The implementation of ecological security protection in this region is the basis for ensuring the ecological environment of the midstream and downstream regions. However, during the thriving advancement of the social economy, due to the absorption of a large population and industrial transfer, coupled with the early single-purpose urban development mode, some areas are overdeveloped, and the degradation of ESs function has led to an exacerbation of ecological risks. Under the background of the construction of the CCEC, the coordinated development of this region has become a hot topic. How to maintain the security of the regional ecological environment while vigorously developing economics is a topic worth exploring and pondering, and the construction and optimization of ESP can provide a practical idea to solve it.
This paper followed the logic system of “supply and demand assessment–pattern construction–optimization suggestion” to carry out research. Considering the unique geographical location and ecological background of the CCEC, combined with the availability of data, this paper selected five ESs, including carbon sequestration (CS), water yield (WY), water conservation (WC), habitat quality (HQ), and climate regulation (CR). The research objectives include (a) evaluating the supply and demand of ESs in the CCEC; (b) calculating the supply and demand ratio of ESs and extracting the ESAs based on this, then using the MCR model and CT to construct the ESP; and (c) dividing the ecological security zoning and proposing the corresponding policy recommendations. This paper hopes to provide some foundational scientific support for the future development of the natural ecological environment of the CCEC in terms of theory.
2. Method and Materials
2.1. Study Area
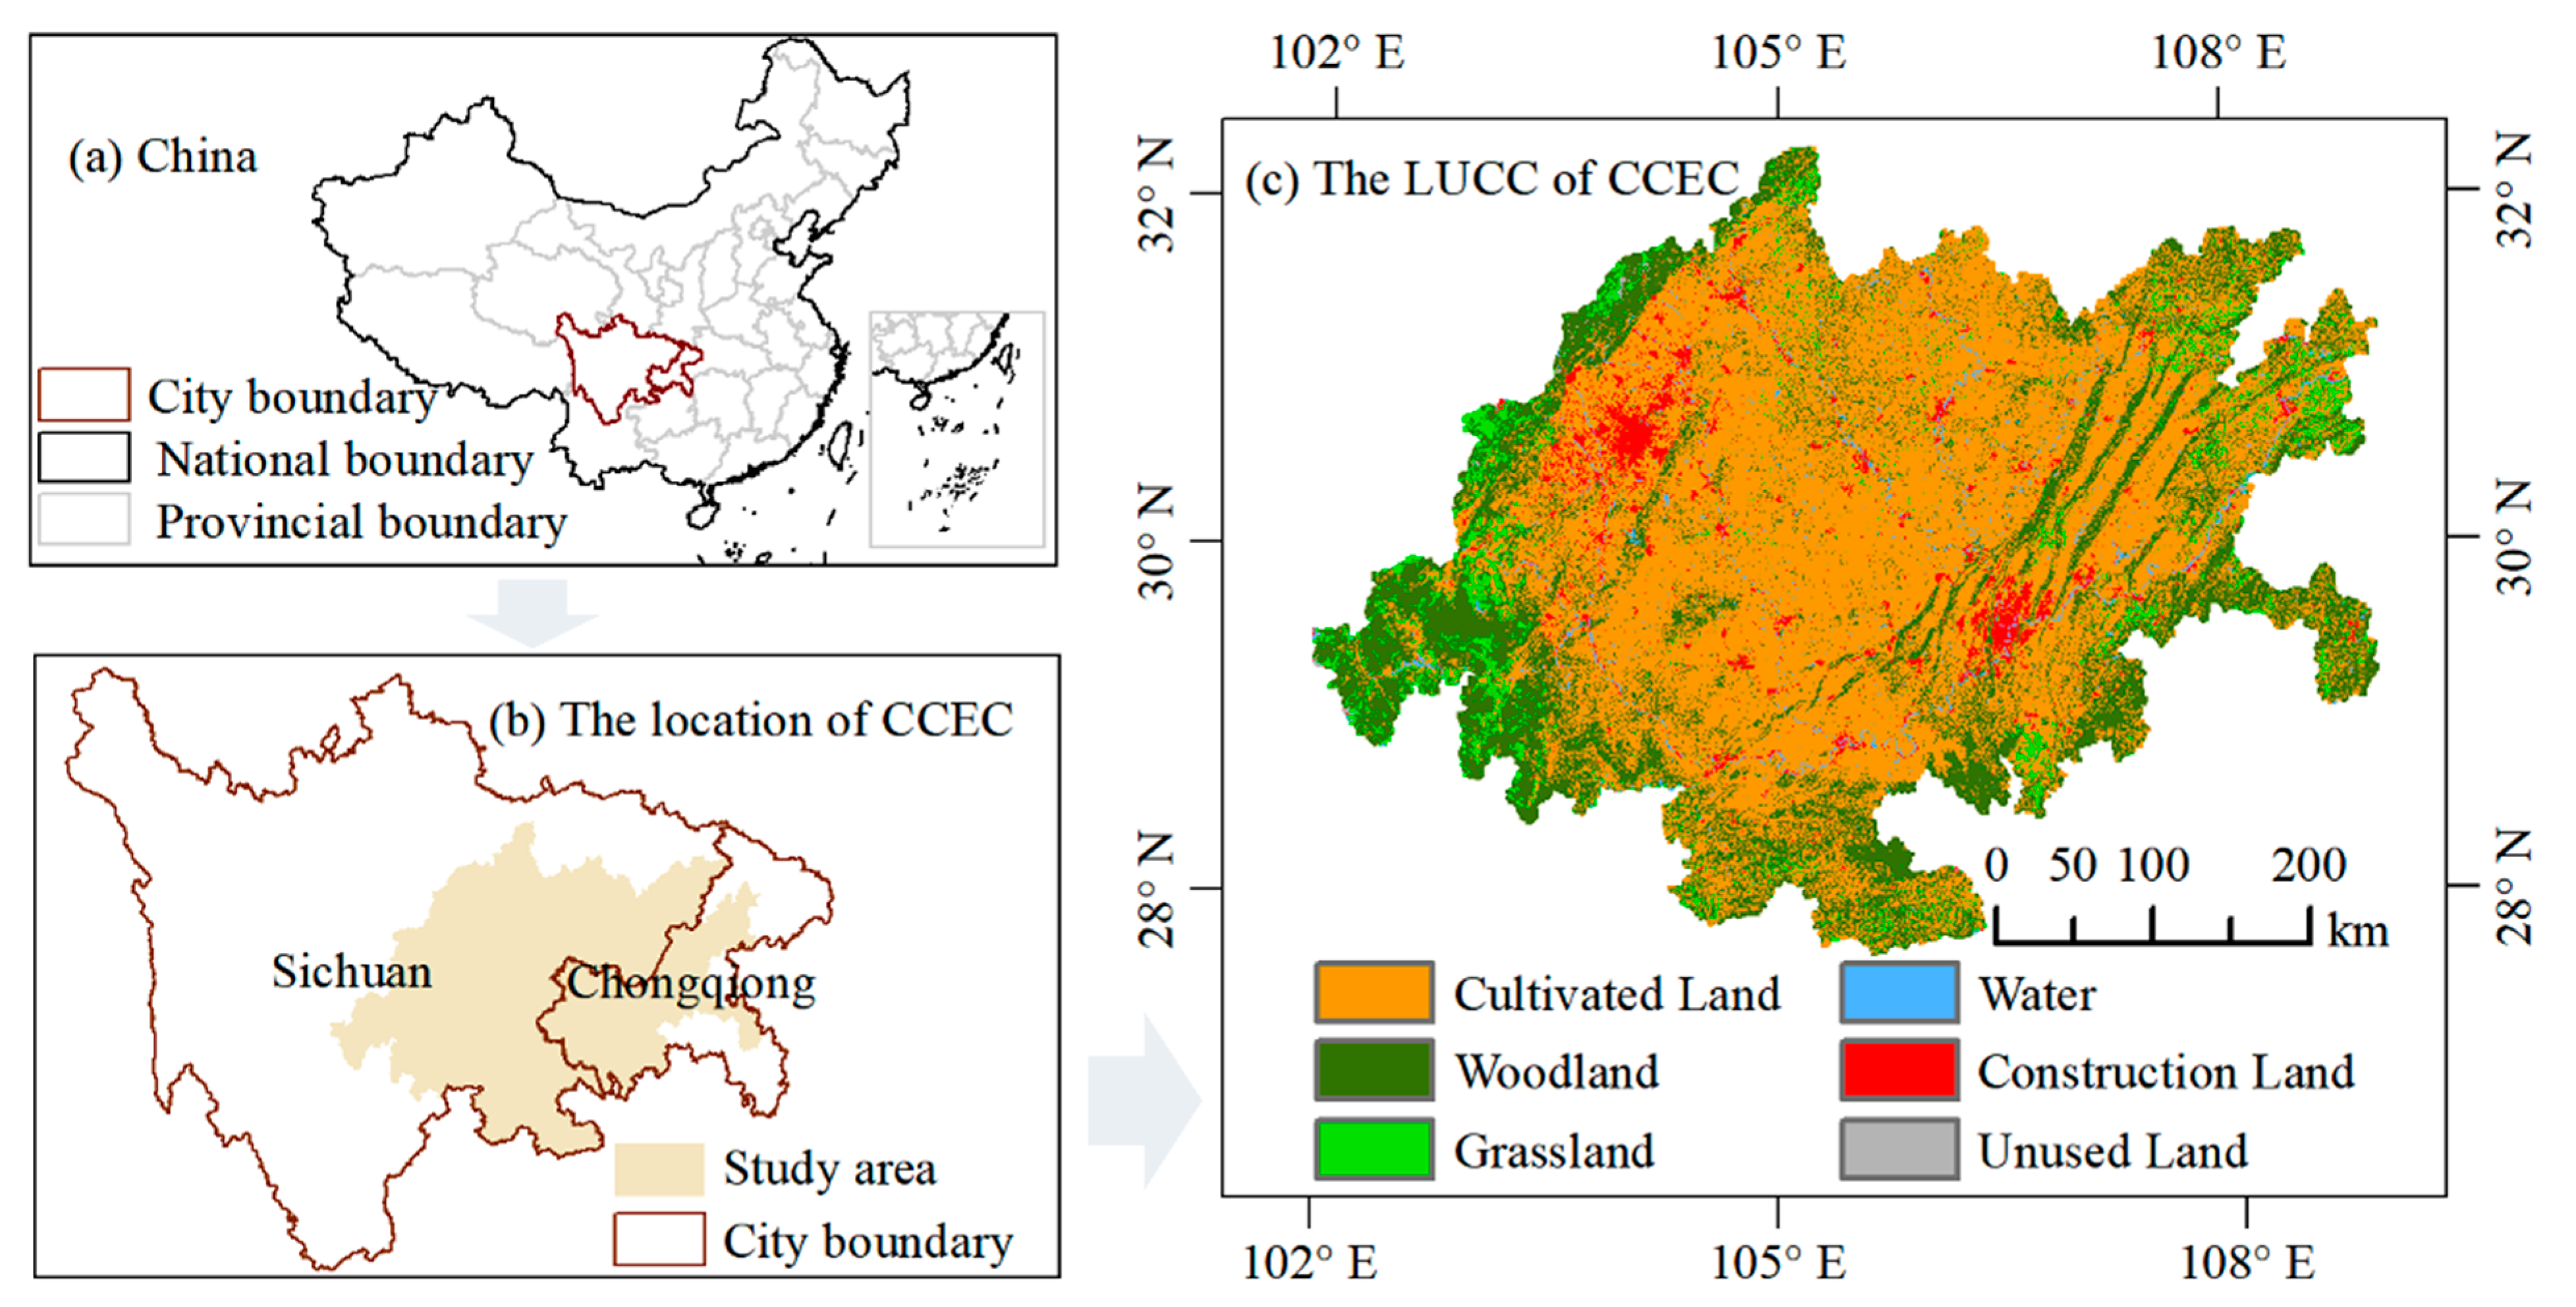
The CCEC is situated in the southwest of China and belongs to the upper reaches of the Yangtze River. It is characterized by natural resource endowment, rich energy and minerals, dense urban distribution, a strong industrial foundation, and a broad economic market. This region is not only the most densely populated area in western China but also the region with the strongest innovation ability and the highest degree of openness. The planning area is about 185,000 km2, and the geographical scope includes 29 districts (counties) such as Dazu District, Banan District, and Fuling District of Chongqing, and 15 cities such as Chengdu City, Dazhou City, and Mianyang City of Sichuan Province. In 2020, the permanent population in this area exceeded 96 million. In addition to the main stream of the Yangtze River, there are other rivers in the region, such as the Jialing River. Overall, the altitude of the periphery of the region is high, the terrain in the middle is low, and construction land, woodland, and cultivated land are the primary land use types (Figure 1). The unique geographical location, important political status, and current development needs were all important reasons for studying the ESP of the CCEC.

Figure 1.
Overview of the study area. (a) the location of Sichuan and Chongqing in China; (b) the location of CCEC in Sichuan and Chongqing; (c) the LUCC of CCEC. Note: Map of China—Approval No. GS(2019)1822.
2.2. Data Sources
The various data used in the research process and their sources are listed in Table 1. Among them, the land use data was provided by Data Center for Resources and Environmental Sciences, Chinese Academy of Sciences (RESDC) [39]. According to the classification system of this dataset, the land use data was preprocessed into six types of first-class land: water, cultivated land, construction land, woodland, unused land, and grassland. In addition, all the data used in this paper were unified to a raster resolution of 1 km × 1 km by the ArcGIS toolbox, and the projection coordinate was WGS_1984_UTM_Zone_48N.

Table 1.
Names and sources of data.
2.3. Assessing the Supply and Demand for ESs
2.3.1. Construction of the Model for ES Supply
The CS service belongs to the regulatory service of ES, specifically referring to the capacity of vegetation to capture carbon from the atmosphere and sequester it through photosynthesis. As one of the important means to reduce the amount of carbon dioxide gas produced by human activities and attain the objective of carbon neutrality, this service is also an important representation of ecosystem CS capacity. The InVEST model has the function of calculating the amount of sequestered carbon and expressing its spatial distribution characteristics based on four types of carbon pools: above-ground (), underground (), soil (), and dead organic (), according to the current land use status. It is the main model for evaluating the supply of CS services.
In this paper, the data of the central urban area of Chongqing were used as the basic reference [41]. The carbon density data of the CCEC was modified by calculating the temperature and precipitation factors (Table 2).
where is soil carbon density according to precipitation; and are the biological carbon density acquired from precipitation and temperature, respectively; and are, respectively, the correction coefficients of precipitation factor and temperature factor of biological carbon density; and are the correction coefficients of biomass and soil carbon density, respectively; MAT is the average annual temperature; MAP is the average annual precipitation; and are the research area and reference area, respectively.
Table 2.
Corrected carbon density values for the CCEC.
The WY service is an important ES that is more obviously affected by human activities than other services. Therefore, studying the function of this service is crucial to understanding how to regulate the water cycle, protecting potable water sources, and improving hydrological conditions. The InVEST model can use land use type data, meteorological data, and soil data to obtain the supply of WY service. Its basic principle is that the water supply of each unit is equal to the amount of precipitation minus the amount of actual evapotranspiration. In addition, the biophysical attribute table needed in the model calculation was set with reference [42] to the existing research.
where is the WY of grid unit x; is the actual evapotranspiration of grid unit x; is the precipitation of grid unit x.
WC service refers to the ecosystem’s function of regulating water under certain conditions, such as forest canopy interception of rainwater, water absorption by dead leaves, and so on. On the basis of WY, combined with the topographic index, the saturated water conductivity of soil, and the flow velocity coefficient, the value of WC was calculated.
where WR is the WC (mm); TI is the topographic index (dimensionless); Ks is the saturated water conductivity of soil (mm/d); V is the flow velocity coefficient; WY is the value of WY service (mm). DA is the number of grids in the watershed (dimensionless); θ is the percentage of slope.
The final purpose of the ecosystem to achieve its service function is to regulate the climate. CR service has played a positive role in supporting the health and sustainability of society, and it reflects the ecosystem’s ability to absorb heat and provide cooling. In this paper, the supply of the CR service was evaluated by the CR model in the Intelligent Urban Ecosystem Management System (IUEMS). The principle is that the natural ecosystem absorbs heat and reduces the temperature through the processes of vegetation transpiration and water surface evaporation, so as to make humans live in a more comfortable environment. The model needs to prepare raster data for land use and vector data for the study area boundary. In addition, the number of days with a daily average temperature greater than 26° and the sum of evaporation on these days need to be counted from the meteorological data. The air conditioning energy consumption coefficient and volatile latent heat value were the default values of the model.
HQ service is the basic survival condition for the permanent development of living organisms in a regional ecosystem. It reflects the potential of an ecosystem to offer a suitable living environment for species to live and reproduce, and its value can be used to represent the health degree and biodiversity level of a regional ecosystem. Using the InVEST model, combined with the information on land use and biodiversity threat factors, the status of HQ service in each region will be acquired. This paper considered unused land, cultivated land, and construction land as threat sources and set the weight and maximum stress distance of each threat source (Table 3). Different land use types have different sensitivity to threat sources and their own habitat suitability, which will further affect the quality of the habitat. Existing studies [43] and regional characteristics were comprehensively considered for setting (Table 3 and Table 4).
Table 3.
Attributes of the threat factor.
Table 4.
Information on habitat suitability and sensitivity.
2.3.2. Calculation of the Demand for ESs
This paper used per capita carbon emissions multiplied by population density to refer to the demand for CS services. The calculation of per capita carbon emissions is to multiply the total consumption of coal, crude oil, and natural gas in Sichuan and Chongqing by the corresponding carbon emission coefficient (0.7559 for coal, 0.5860 for crude oil, and 0.4483 for natural gas), and then divide it by the total population of the region.
where is the demand for CS service, is the per capita carbon emissions, and is the grid population density.
The consumption of water resources was used to assess the demand for the WY service.
where is the demand for WY service; is the grid population density; is per capita comprehensive water used; is the raster data of CNY ten thousand GDP; is water consumption of CNY ten thousand GDP; is paddy field raster data (extracted by reclassification based on land use data); is the amount of water used for farmland irrigation.
This paper mainly considered the consumption of ecological water in the CCEC to quantify the demand for WC service by multiplying the population density and the per capita ecological water consumption.
where is the demand for WC service; is the per capita ecological water consumption; is the grid population density.
The high consumption of energy in cities is accompanied by the urgent need for CR services. In addition, energy consumption is highly positively correlated with electricity consumption. Therefore, the demand for CR services is represented by the electricity consumption of the whole society.
where is the demand for CR service; is the grid population density; is per capita electricity consumption; 0.75 is the correction factor.
Human needs for HQ service depend on the habitat basics that land can provide. The normalized difference vegetation index (NDVI) is the quantification of crop growth and vegetation coverage. The net primary productivity (NPP) can reflect the impact of land cover change on vegetation. Therefore, this paper took the habitat factor composed of NDVI and NPP as the demand index of the HQ service.
where is the total demand for HQ; is the per capita HQ of unit x; is the grid population density; is the total HQ index; P is the total population; and are the corresponding raster data.
2.3.3. Calculation of the Supply–Demand Ratio of ESs
The standardization of data is to convert the original data into a dimensionless relative value according to a certain method through a certain mathematical transformation so that indicators of different units or orders of magnitude can be comprehensively analyzed and compared. The standardization method used in this paper is max min standardization.
where x is the raw data; is the normalized value.
The calculation of the ecological supply–demand ratio (ESDR) presupposes the standardization of the values of supply and demand, and it was utilized to represent a state of balance or imbalance between supply and demand of regional ESs.
where ES is the supply for ESs; ED is the demand for ESs; ESDR > 0 represents a surplus of ESs; ESDR = 0 represents an equilibrium between supply and demand; ESDR < 0 represents that ESs is in deficit.
2.4. Construction of the ESP Optimization Model
2.4.1. Identification of ESAs
Based on the above, it can be seen that in areas where the ESDR is greater than 0, ESs can generate surpluses, indicating that the ecological background of these areas is good. Therefore, this paper used the attribute extraction function of ArcGIS to extract the part of the ESDR greater than 0 and divided it into five levels according to the principle of the Natural Breaks method. In order to ensure that the selected ESAs have sufficient ES supply capacity, the largest level was picked as the basic ESAs. The patch obtained by this method has strong habitat sustainability. Furthermore, for the purpose of reducing the degree of fragmentation of the ESAs and playing the function of them, this paper deleted the independent patches with a far interval and an area of less than 2 km2 and integrated the adjacent patches to obtain the final ESAs.
2.4.2. Construction of ERS
The obstruction of material and energy in the process of flow and transfer together constitutes the ecological resistance surface. We know that ecological security is influenced by the combined effects of natural and man-made factors, so this paper picked six indicators, including slope, land use types, DEM, NDVI, distance from railway, and distance from water system, from these two aspects to build the ERS. Referring to the existing study, the resistance value of the factor was set, and the weight was obtained by principal component analysis (Table 5).
Table 5.
The classification, weight, and resistance values of each factor.
2.4.3. Extraction of ECs, EPPs, and EBPs
Extraction of ECs: As a key hub connecting the flow of materials and energies between different landscapes in the region, ECs are an important part of ESP. According to the ERS constructed above, the path with the lowest resistance between ESAs was extracted as an ecological corridor by using the Linkage Pathways Tool toolbox. ECs were classified according to the ratio of the cost-weighted distance to the minimum cost path. The level of the value indicates the quality of the corridor.
The essence of the MCR refers to the cost or work of overcoming resistance when the source traverses various landscapes with differing levels of resistance.
where MCR represents the MCR value of the source extending to a landscape; i and j refer to two different ecological sources; is the Euclidean distance from source i to source j; is the diffusion resistance coefficient of source i.
Extraction of EPPs: The Linkage Mapper tool can use the principle of CT to connect different landscapes, and the flow of species can be simulated as the movement of electric charges. The resistance value is converted into the size of electrical resistance in the software, and the random walk of charge can be used to identify the nodes of charge flow based on different resistances. EPPs can be extracted by the pinch point mapper module under the toolbox, where the nodes identified by the software are relatively densely distributed in areas with large resistances. The regions with a high-density current in the ECs are EPPs, and these areas lack or do not have an alternative path. This means that if the region is degraded or lost, it will have a direct negative impact on the connectivity between different sources, so they are the first areas to be considered for ecological protection.
Extraction of EBPs: The areas where organisms encounter obstacles in the migration of ESAs are the EBPs. Eliminating these points will improve the circulation between different ESAs. The Barrier Mapper module can be used to extract EBPs in ECs. The module identifies areas where landscape connectivity is greatly affected by calculating how much current is restored after removing the barrier point. The size of the obstacle to landscape connectivity in a certain area is reflected by the cumulative recovery current value. Therefore, EBPs are the key focus areas when implementing the ecological restoration project.
3. Results
3.1. Spatial Differentiation Analysis of the Supply and Demand for ESs
3.1.1. Spatial Distribution of ES Supply
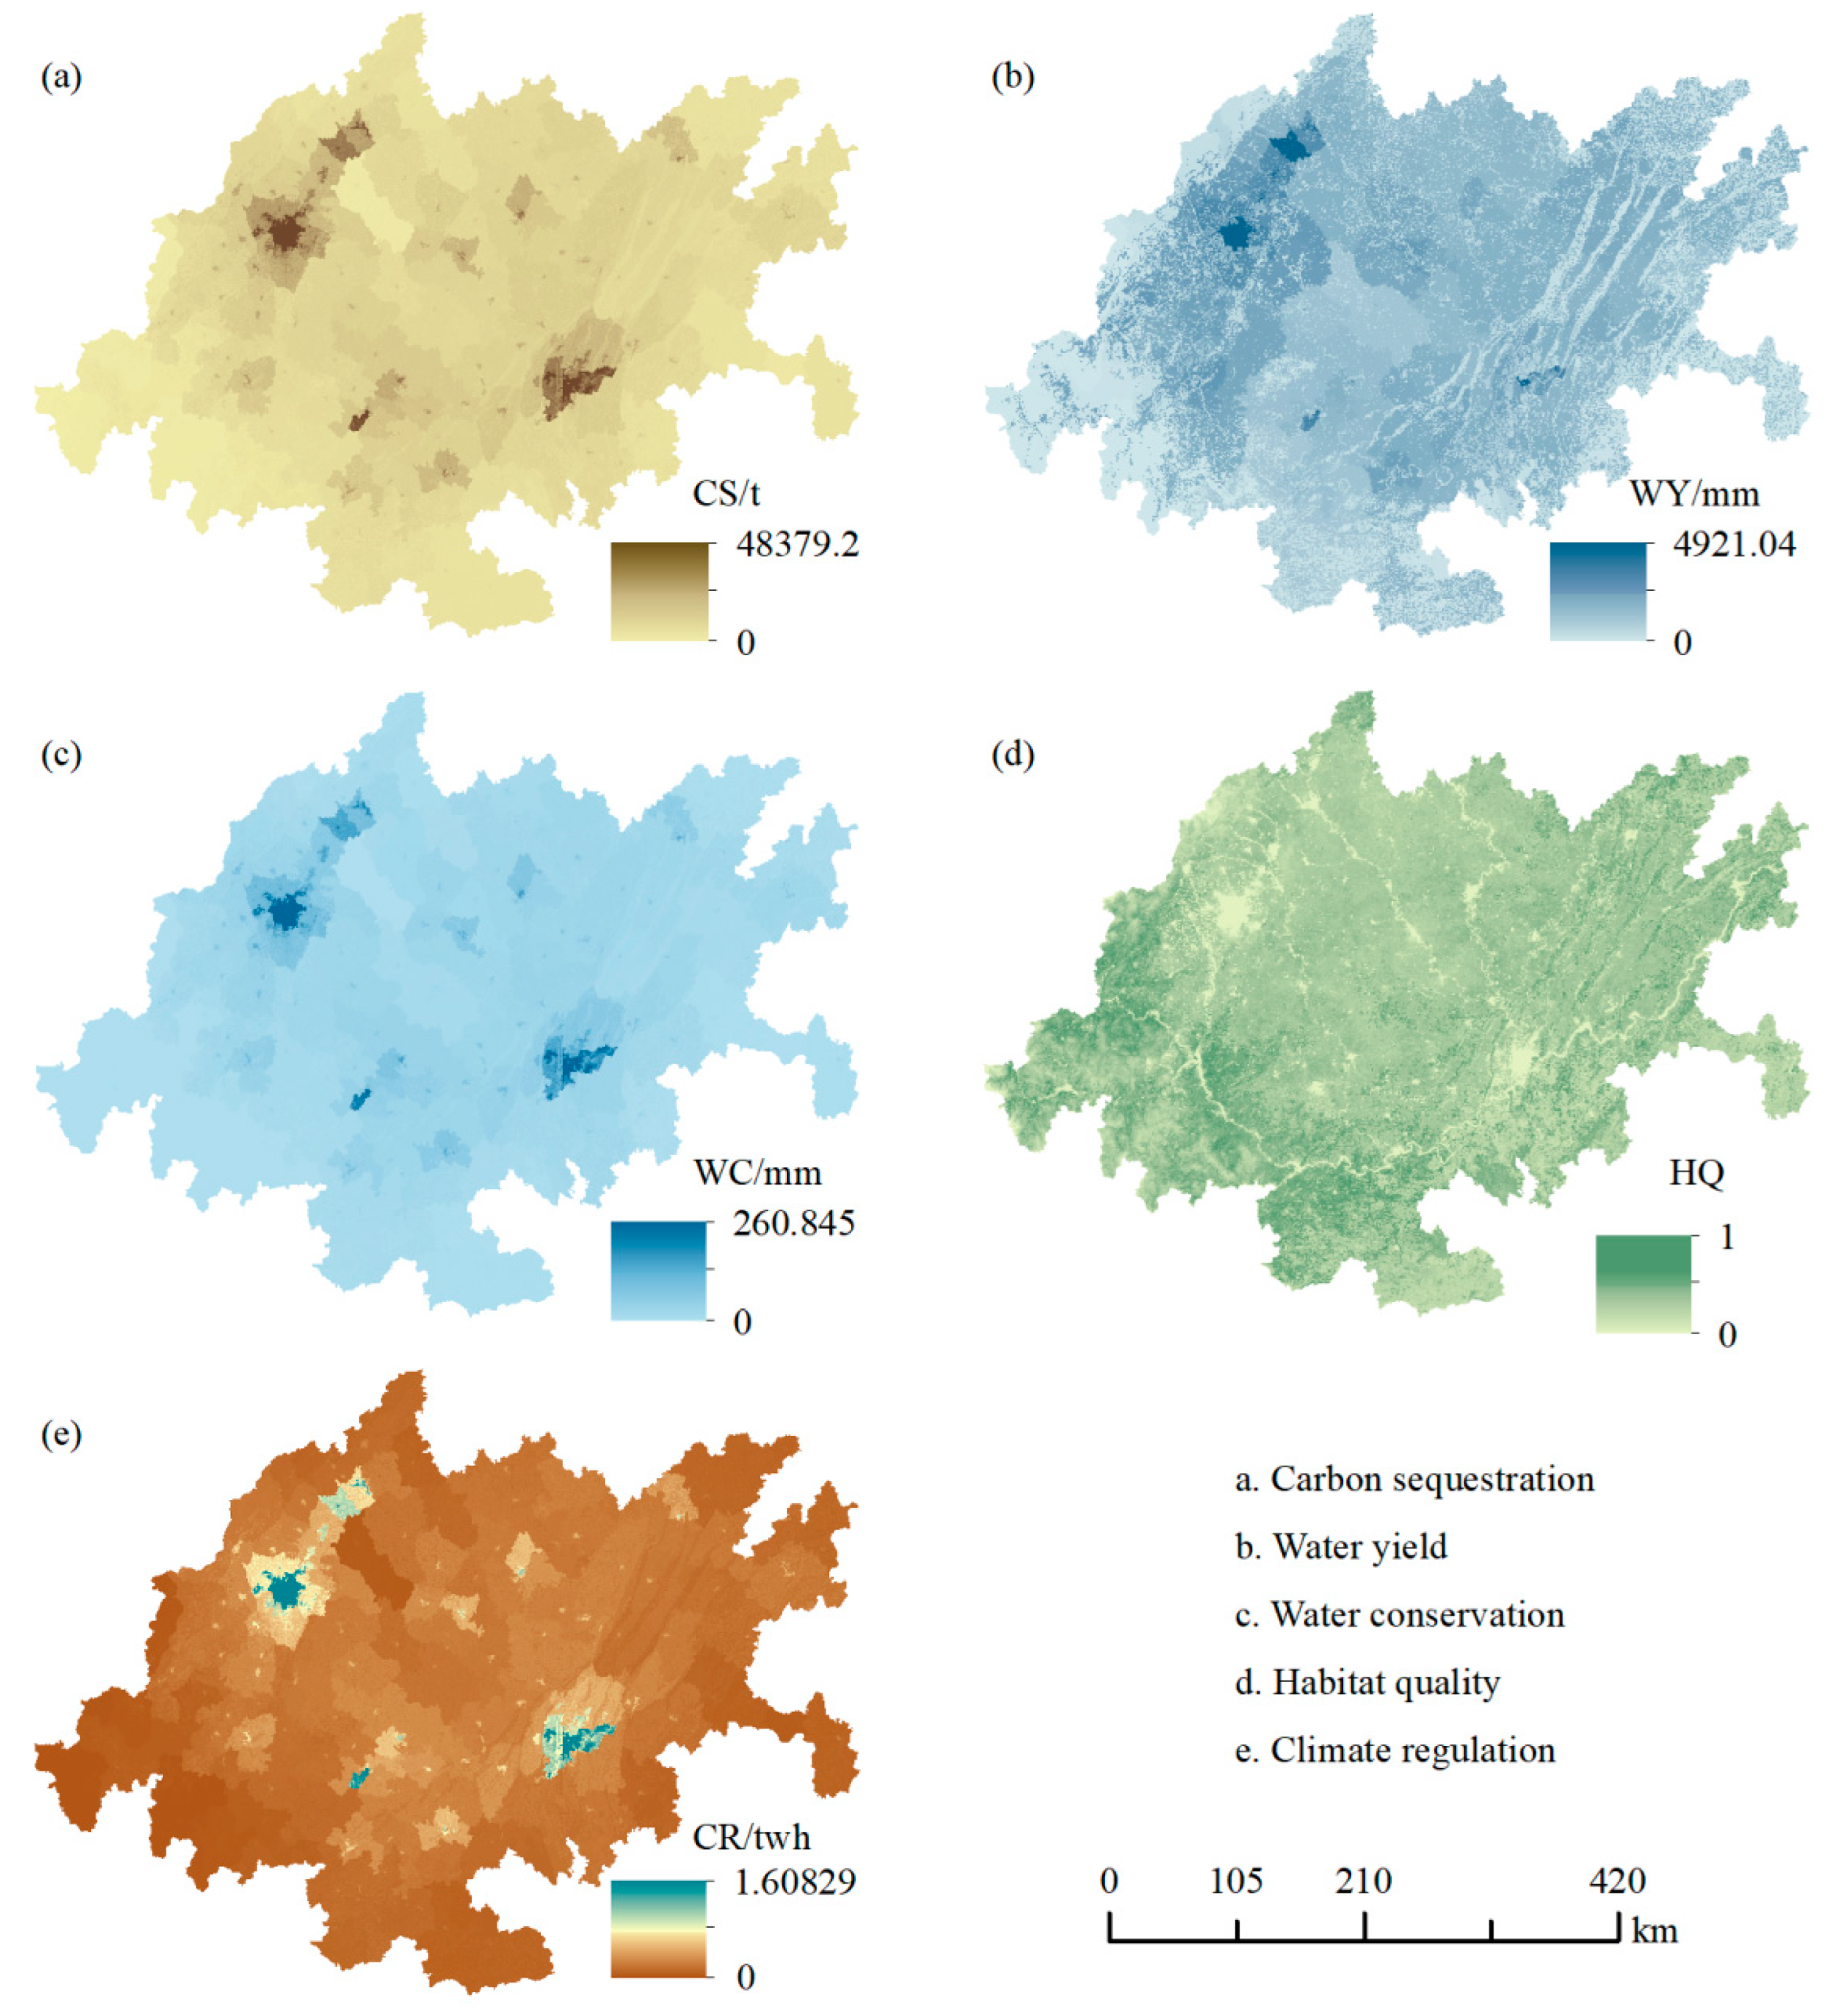
It can be seen from (Figure 2) that the five ESs of the CCEC in 2020 all have obvious spatial heterogeneity. Among them, the total supply of CS service was about 2.15 × 10⁹ t, and its overall distribution was characterized by “high value in the periphery and low value in the two cities”. The forest region on the periphery of the CCEC is the main region of high-value distribution, whereas the low-value region was predominantly clustered in the central part of Chengdu and Chongqing. The maximum supply depth of WY service in the region was 2001.36 mm, which was concentrated in the Minshan–Qionglai–Liangshan area in the northwest of the CCEC and the southeastern part, with Daloushan as the main part. The maximum amount of WC service was 266.613 mm, scattered in Chengdu, Meishan, Guang’an, Liangping District, Yongchuan District, and other southern areas. The distribution characteristics of CR service and HQ service were basically similar. From a spatial point of view, the high-value areas largely corresponded to the distribution of woodland, and the forest in these areas was relatively broad. The land use types were mostly cultivated land and construction land in the low-value areas, and the surface of these areas was greatly affected by human development. This also reflects the good and bad influences of forest land systems and human activities on the ecological environment from the side.
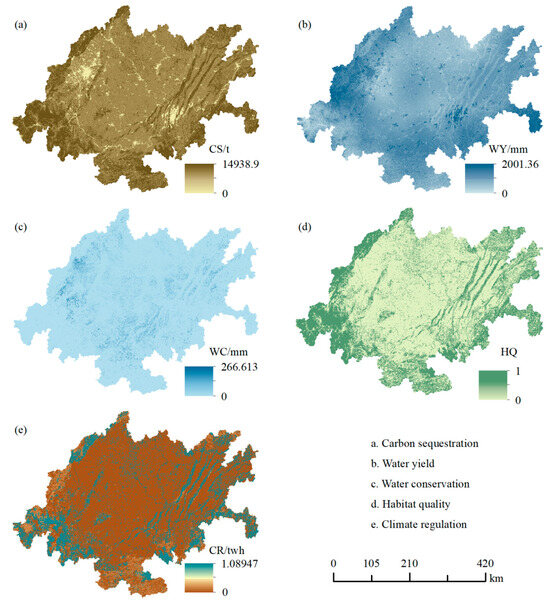
Figure 2.
Spatial distribution of ES supply in the CCEC. (a–e) represent the spatial distribution of CS, WY, WC, HQ, and CR on the supply side, respectively.
3.1.2. Spatial Distribution of ES Demand
As can be seen from (Figure 3), the demand for multiple ESs in the dual-core cities of Chengdu and Chongqing in 2020 was much higher than that of other prefecture-level cities or districts. The performance of CS, WC, and CR services was the most obvious, and their spatial distribution was generally “low in the periphery, medium in the middle, and high in the two cities”. This was because the calculation of the demand for these three kinds of ESs all involved population density data. Therefore, the demand was higher in the central urban area of Chongqing and the central part of Chengdu, where the population was denser, while in areas with sparse population distribution, such as Ya’an City in the west and Luzhou City in the south, the demand was relatively low. The regions with large demand for WY service were Luojiang County of Deyang City, Yuzhong District of Chongqing City, and some areas of Chengdu City, with a maximum demand depth of 4921.04 mm. The area with low demand was located in the southwest and east of the strip forest land, and the water requirement of crops was relatively low. For the demand for HQ service, the high-value was predominantly clustered in the Qionglai-Liangshan region in the southwest of the CCEC, which can be simply summarized into three major regions: the eastern section of Ya’an City, the northeastern section of Leshan City, and the northern section of Yibin City. Because the land use types in the central urban area of Chongqing City and the central part of Chengdu City are mainly construction land, they can provide less habitat on their own, so they become low-value distribution areas. In addition, the demand for HQ is also highly related to the degree of population agglomeration, and the water is an area with a low frequency of human activities, so the demand value near the river system was relatively low.
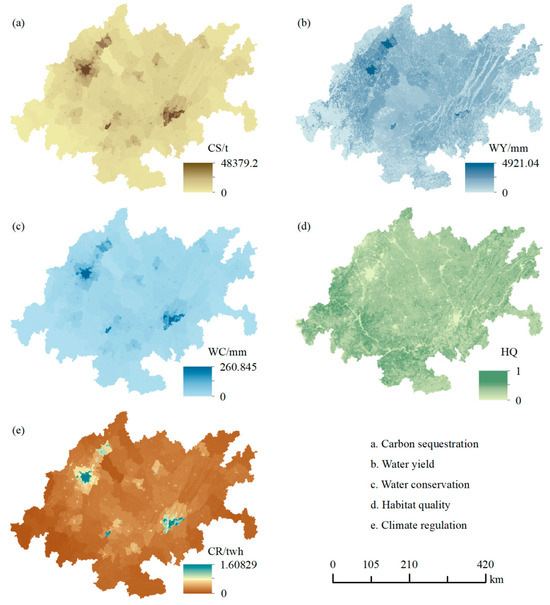
Figure 3.
Spatial distribution of ES demand in the CCEC. (a–e) represent the spatial distribution of CS, WY, WC, HQ, and CR on the demand side, respectively.
3.1.3. Spatial Distribution of the ESDR
The balance status between supply and demand for five ESs can be seen in Figure 4. When the value of the ESDR exceeds 0, there will be a surplus of ESs. In 2020, the average values of the ESDR of CS, WY, WC, HQ, and CR were 0.93, 0.63, −0.67, 0.06, and −0.37, respectively. To a certain extent, this can represent that, in addition to WC and CR, the supply of CS and WY can better maintain and meet human needs in the study area as a whole, while the HQ service was basically in a state of balance between supply and demand, with supply slightly larger than demand. In regard to spatial distribution, the ESs in the central urban areas of Chongqing and Chengdu exhibited a state of loss, of which the most obvious was the CS service. In the forest region on the periphery of the CCEC, the supply capacity of ESs was strong, and it can be surplus in addition to meeting human needs, among which HQ and CR services are the most significant.
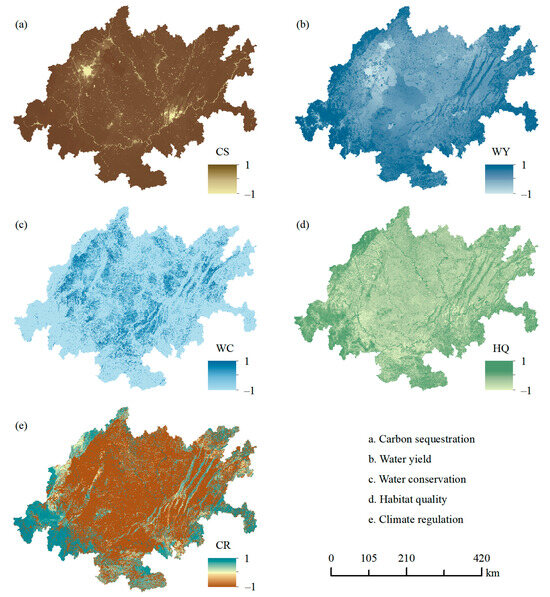
Figure 4.
Spatial distribution of the ESDR in the CCEC. (a–e) represent the spatial distribution of the ESDR of CS, WY, WC, HQ, and CR, respectively.
3.2. ESP Network
3.2.1. ESAs
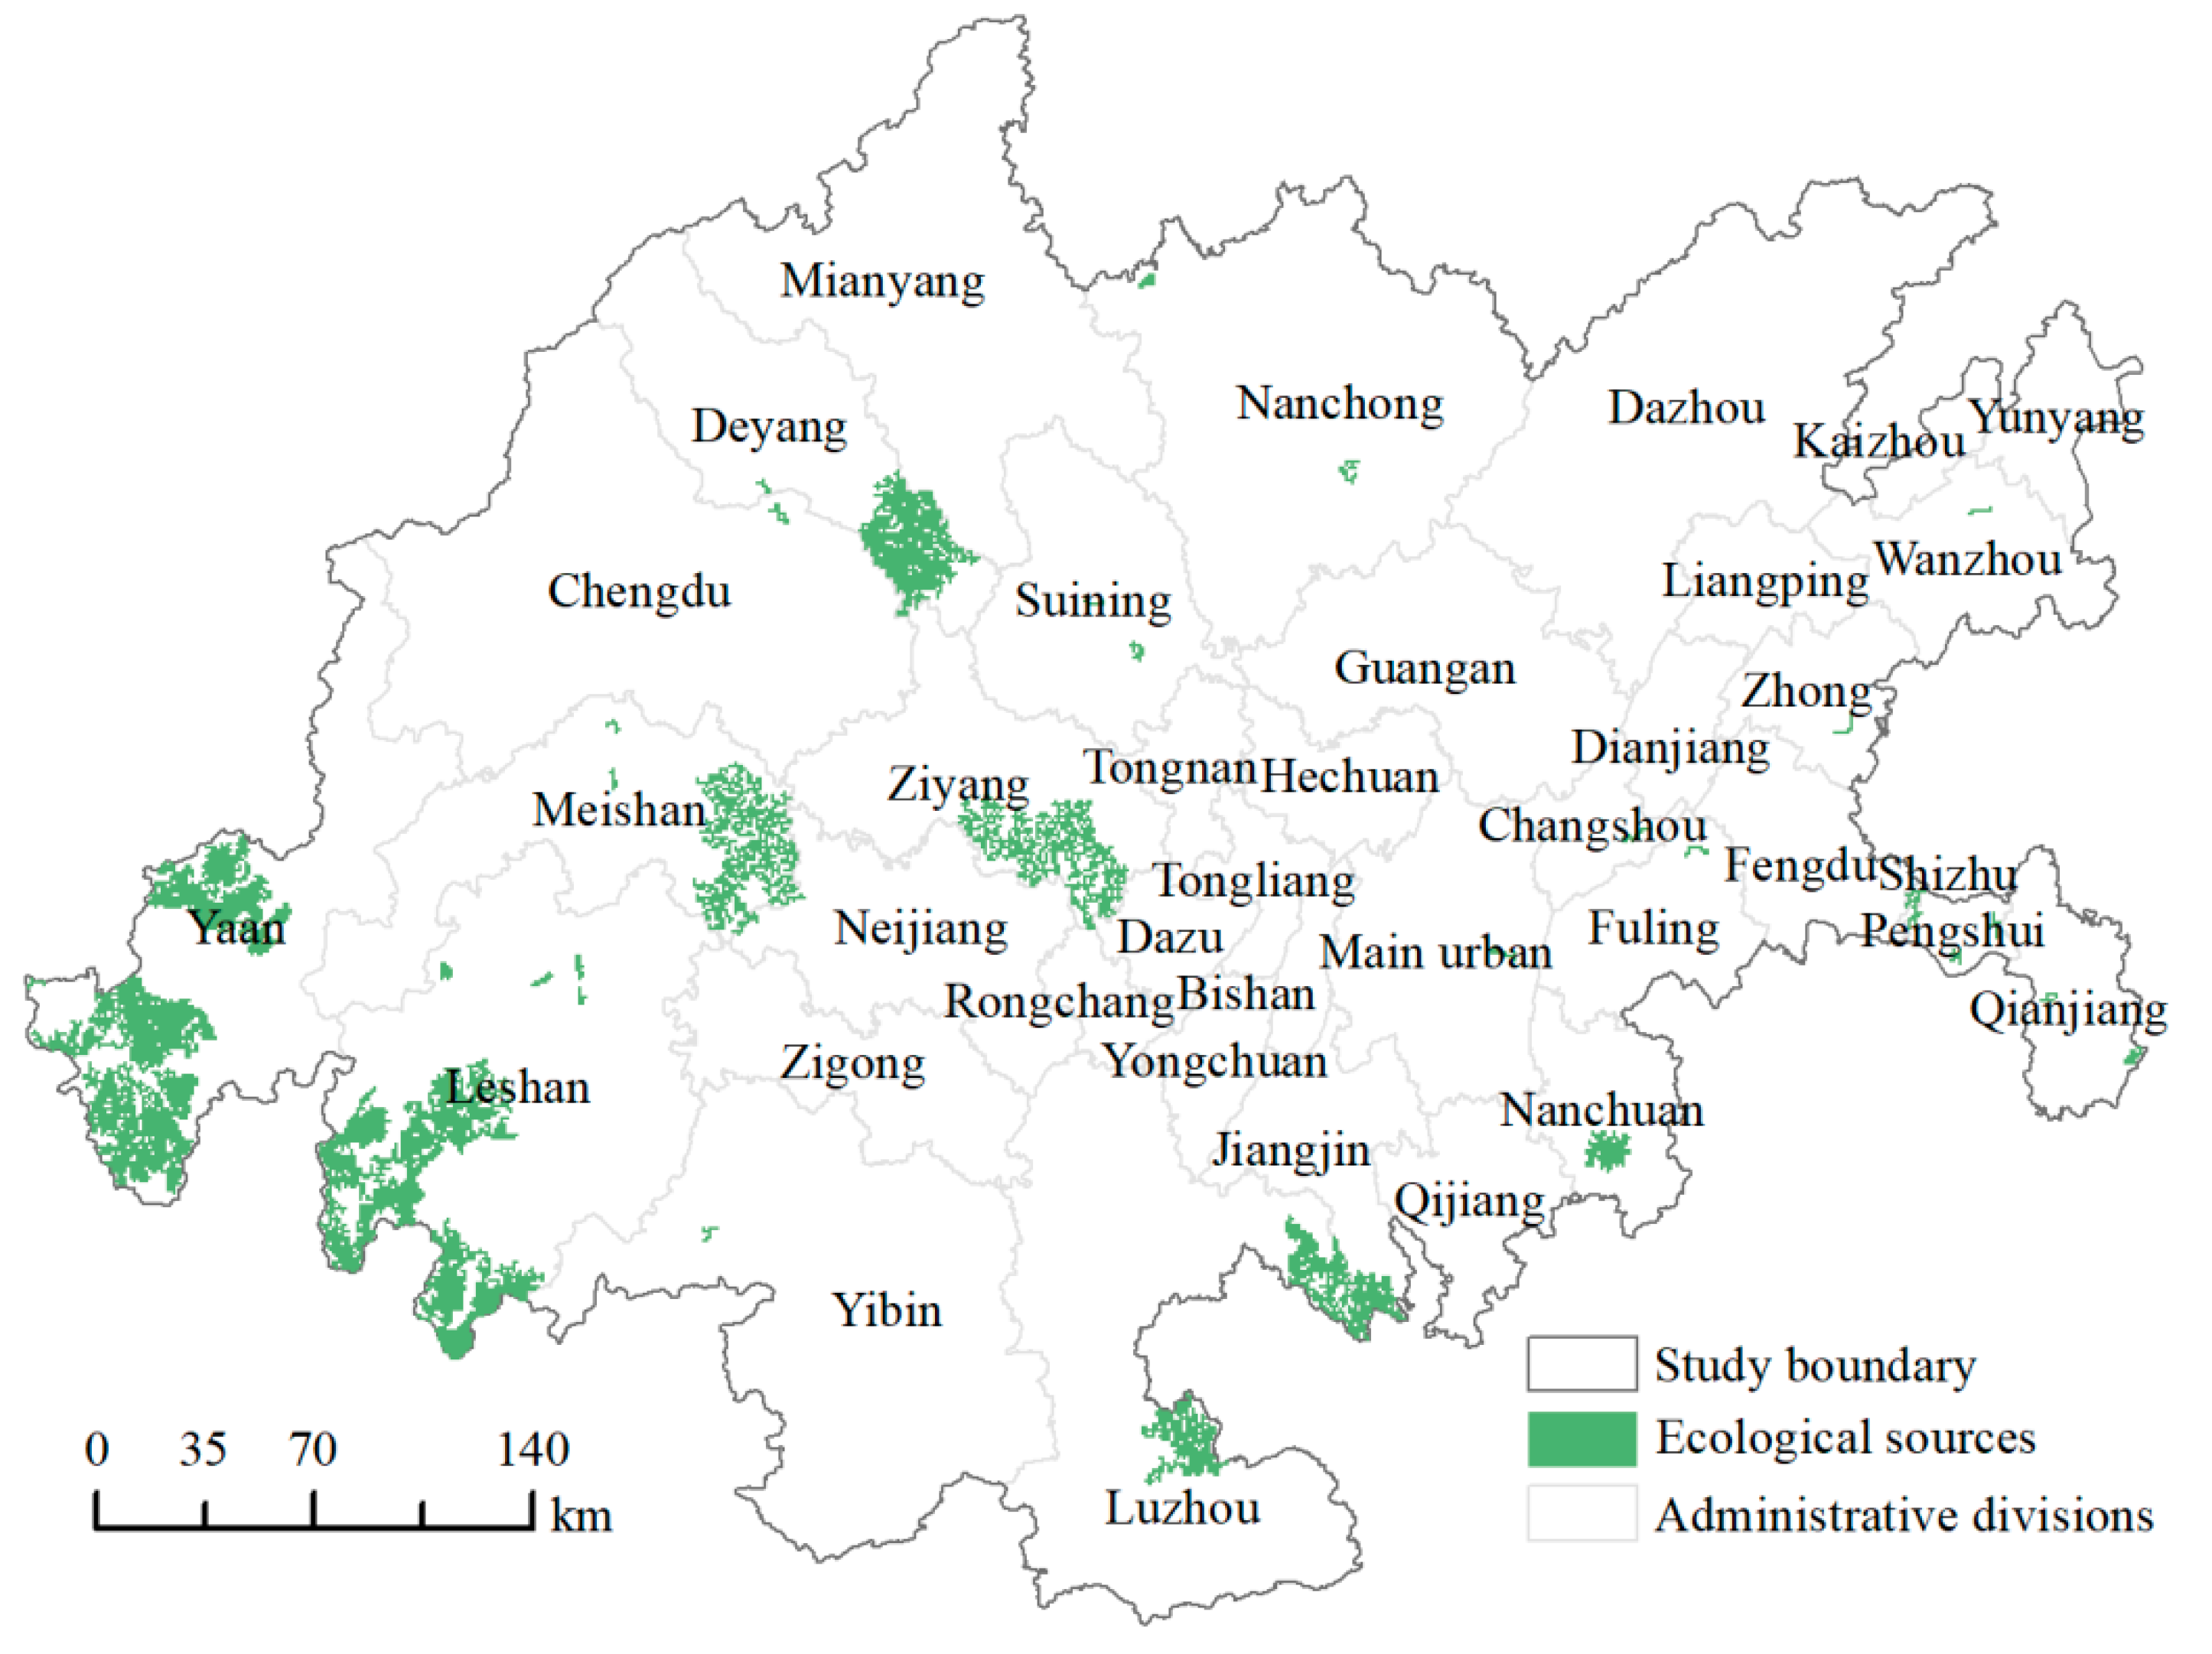
According to the assessment results of the ESDR, this paper extracted 72 basic ESAs and finally retained 35 after removing and integrating some broken patches, covering approximately 7914 km2, occupying 4.3% of the CCEC area. According to Figure 5, ESAs were mostly located in the southwest and southeast of the forest land, belonging to the Minshan–Qionglai–Liangshan ecological barrier region in the “four screens” of the territorial spatial planning in the CCEC. In addition, the central cities of Deyang, Meishan, and Ziyang also had some large ESAs. Sichuan Province issued the Work Plan for Controlling Greenhouse Gas Emissions in Sichuan Province in 2017. In the implementation effectiveness test by 2020, Deyang City has continuously deepened renewable energy and carried out large-scale use of new energy; the carbon emissions of Meishan City have declined for four consecutive years, and the carbon emission intensity of Ya’an City has remained low, making them the main ecological source of CS service.
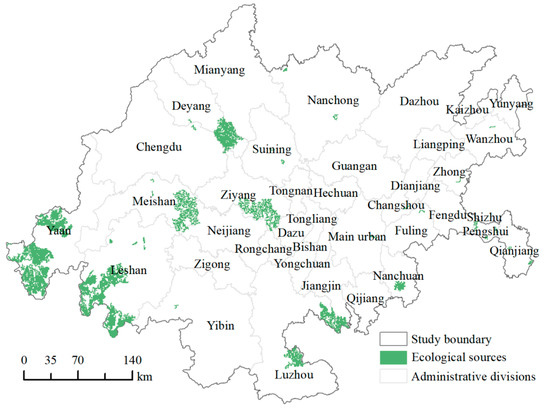
Figure 5.
Spatial distribution of ESAs.
3.2.2. ERS
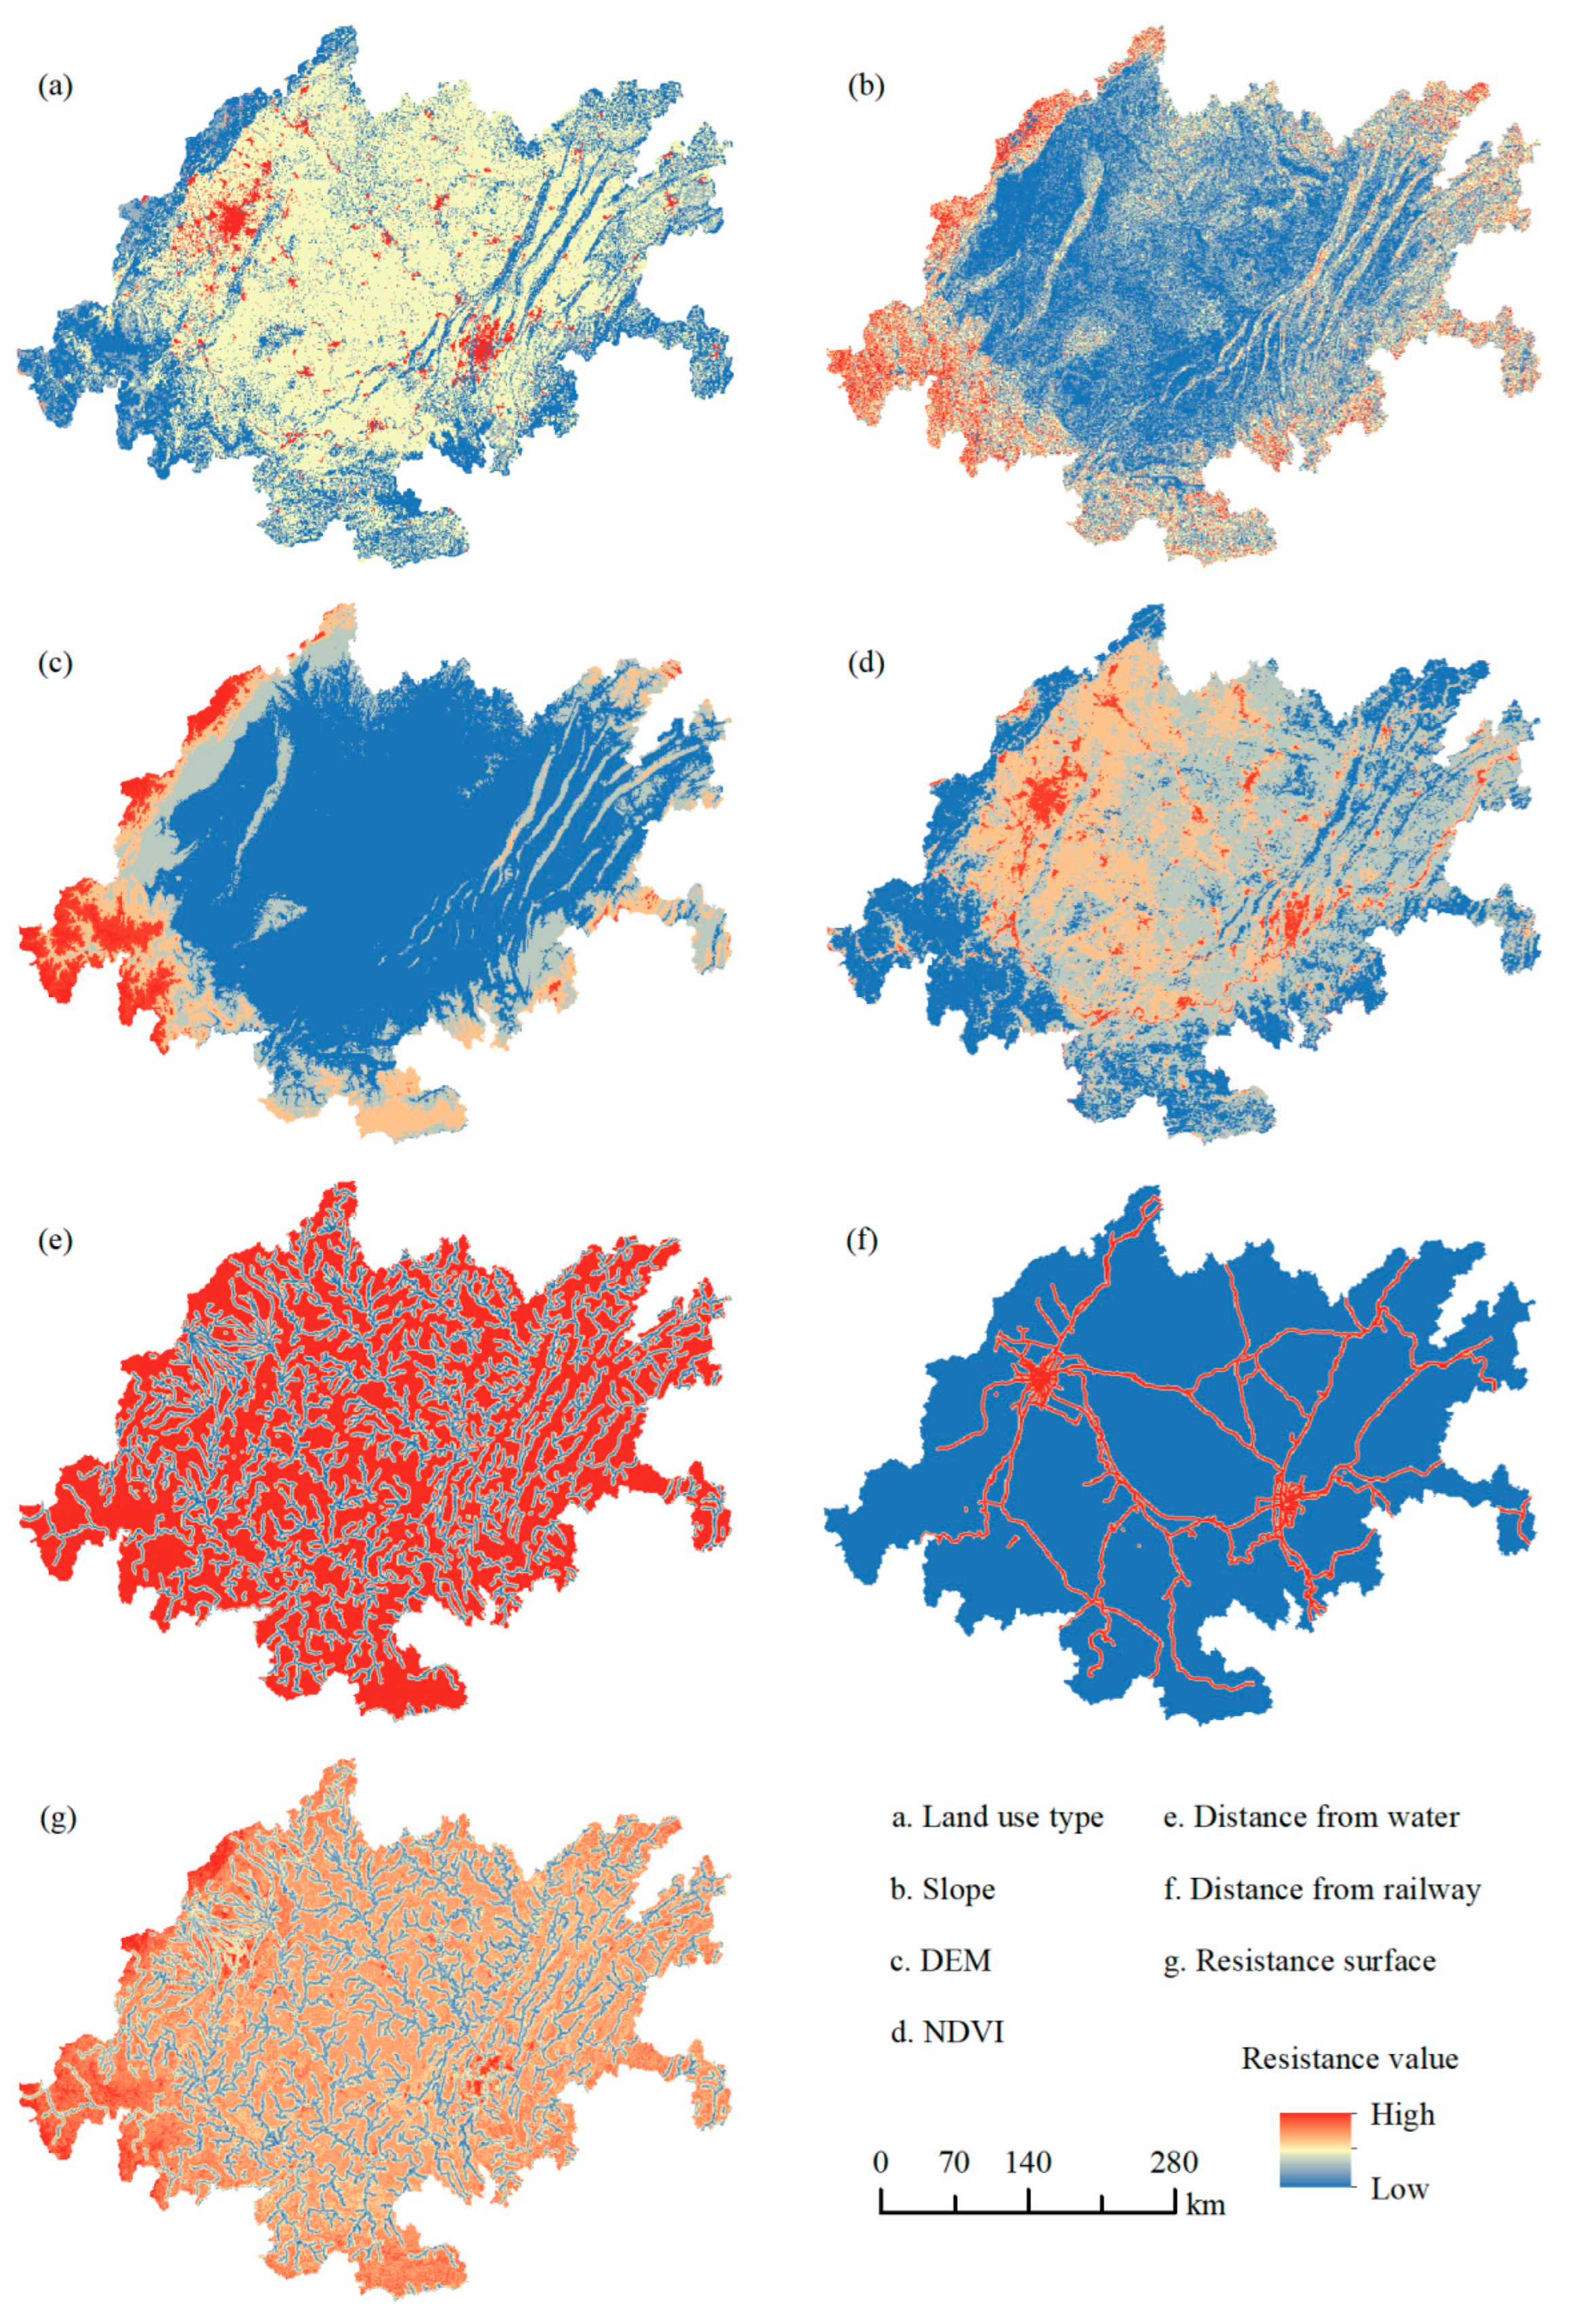
The combined ERS was obtained by superimposing the single resistance factors according to the corresponding weights (Figure 6). The high resistance value appeared in the mountainous area with a steep slope and high altitude in the western part of the CCEC. In addition, the central urban areas of Chengdu and Chongqing all had complex roads and developed economies; thus, the high-intensity production and living activities of human beings also had a certain obstructive effect on the flow of ESs. The low-value area of comprehensive resistance was mostly concentrated near the water area, which is beneficial to the continuous transmission of energy within the natural ecosystem.

Figure 6.
Single resistance factor and comprehensive ERS. (a–f) represent the spatial distribution of single resistance factor of Land use type, Slope, DEM, NDVI, Distance from water, and Distance from railway, respectively. (g) represent the spatial distribution of the comprehensive resistance surface.
3.2.3. ECs, EPPs, and EBPS
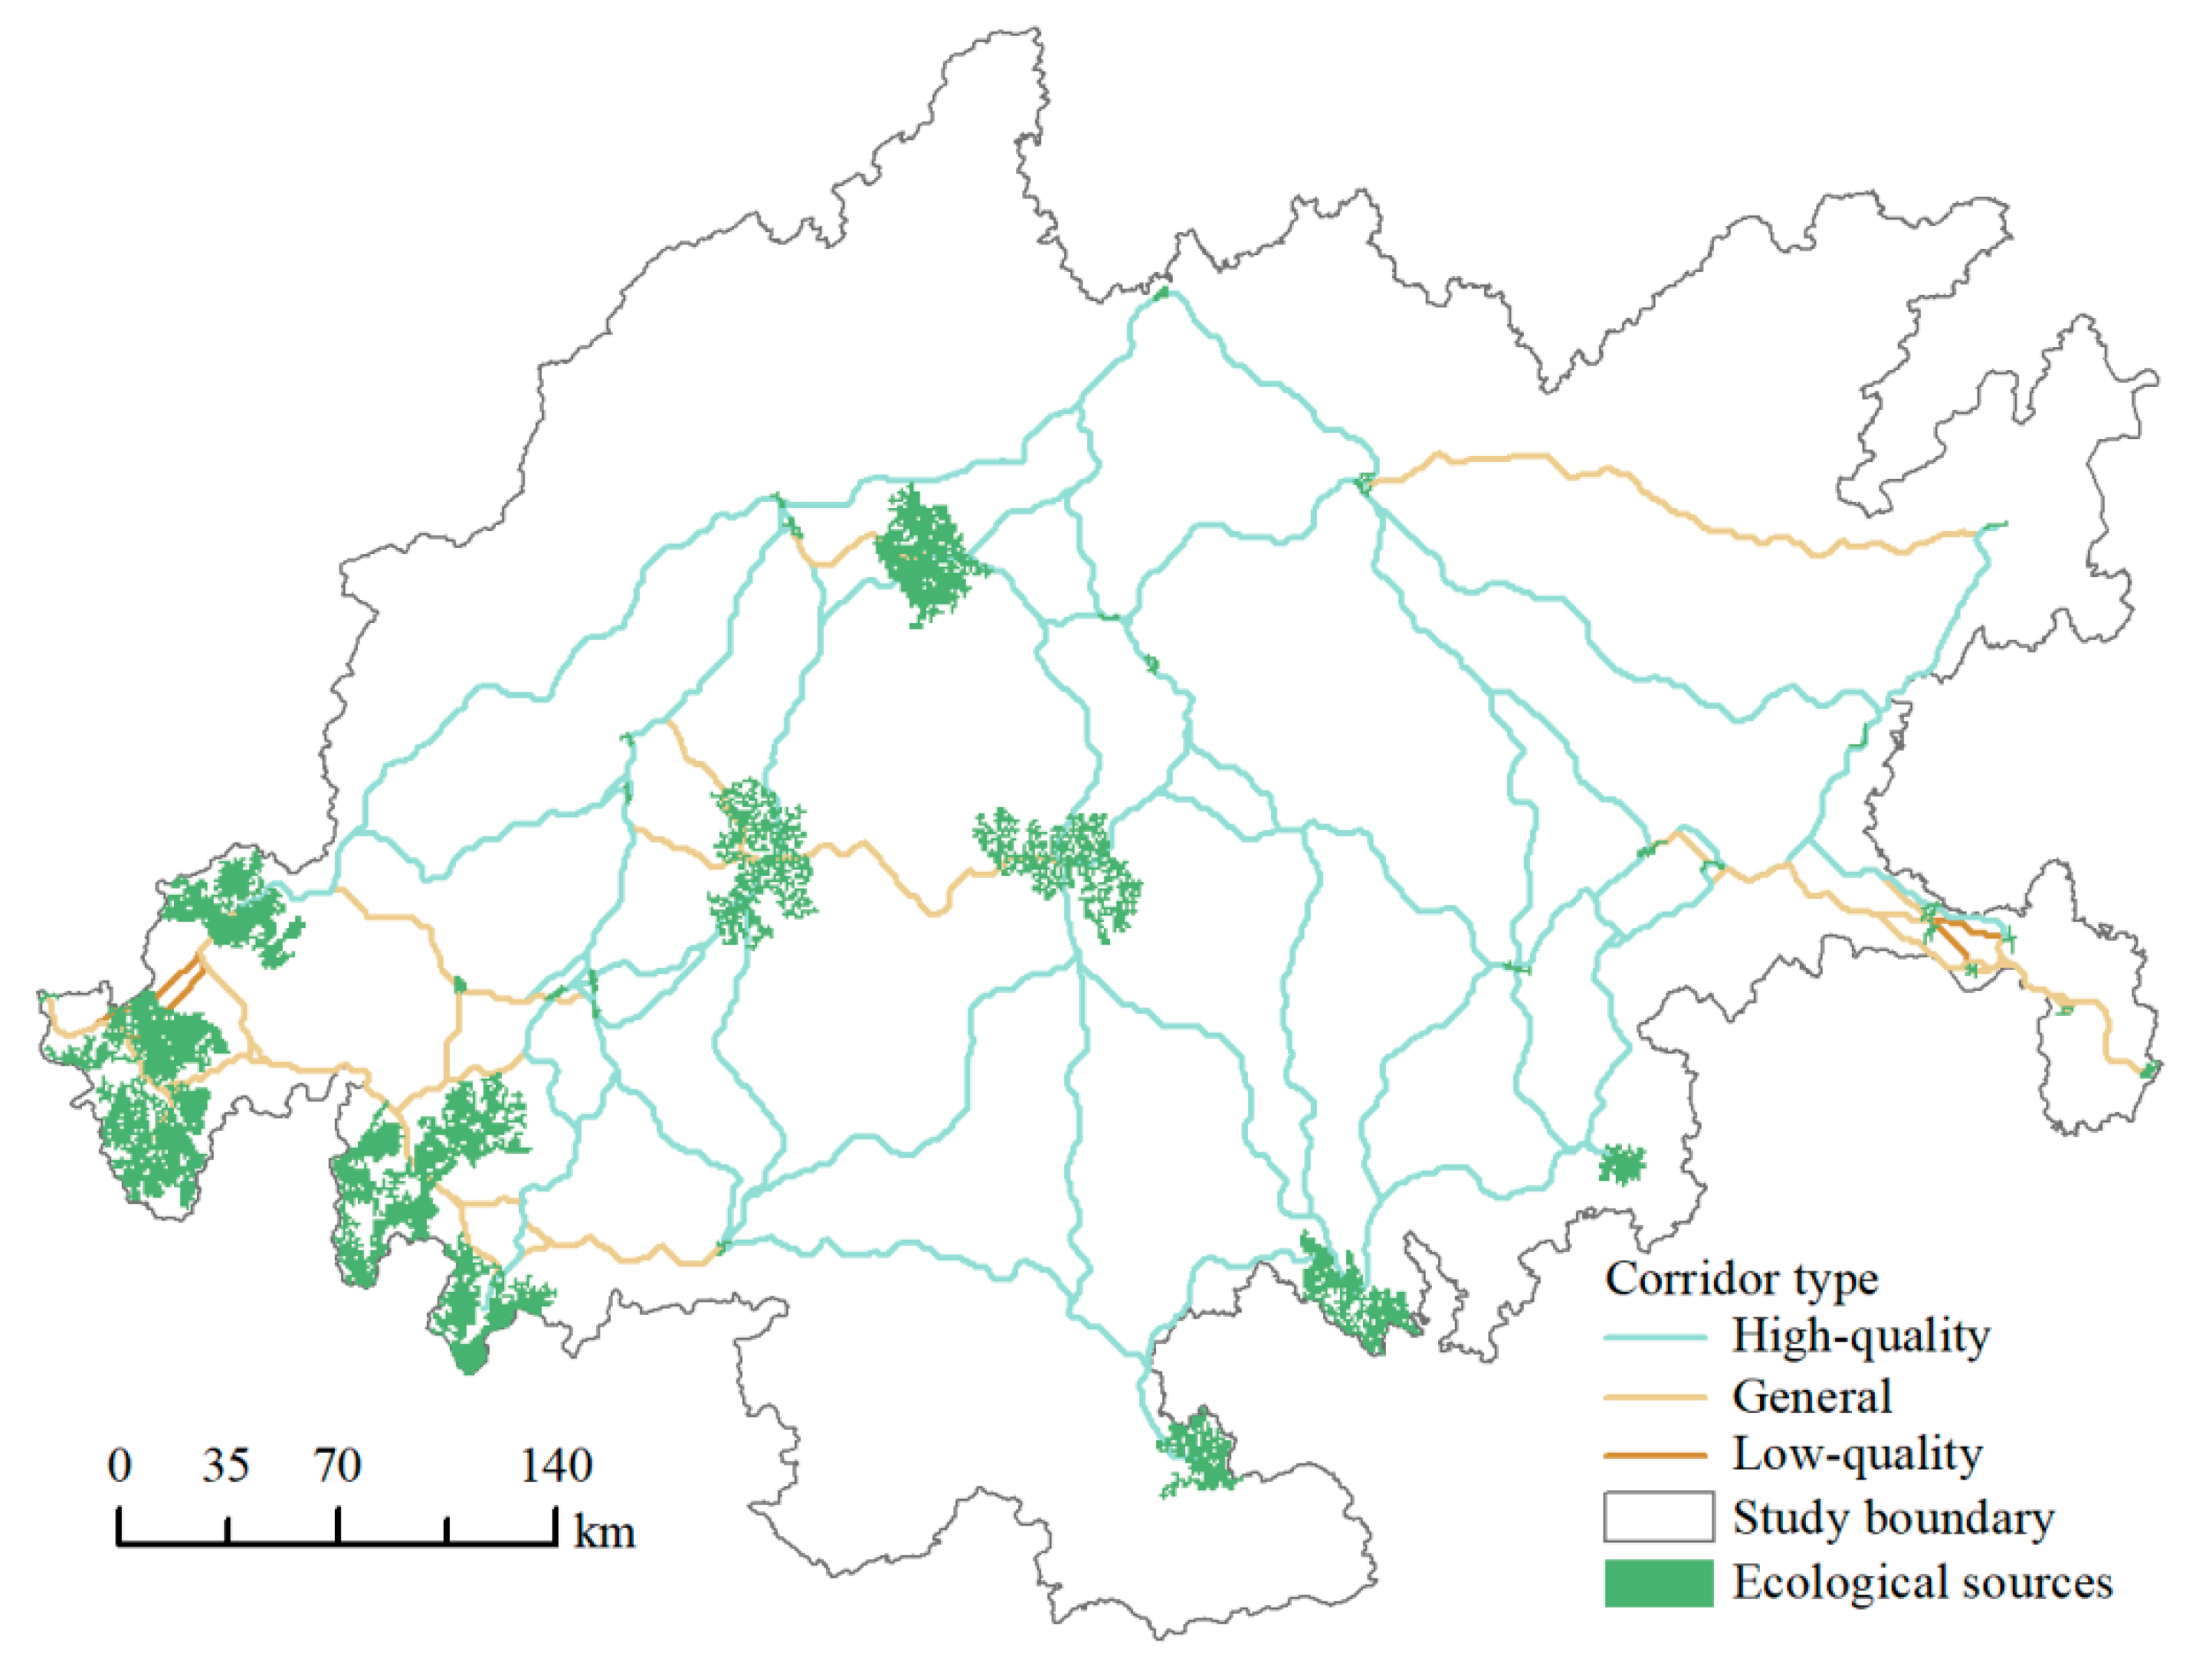
According to the principle of the MCR model, this paper extracted 91 ECs with a combined length of 10,701 km. There were 55 high-quality corridors, 31 general corridors, and five low-quality corridors. From Figure 7, it is evident that the longer ECs mostly appeared in the eastern region with fewer ecological sources. The longest corridor appeared at the junction of the ecological barrier belt of Dalou Mountain and Wuling Mountain in the eastern part of the CCEC, with a length of 321.2 km, while the shortest corridor was only about 10.4 km. Combined with the water systems map of the CCEC, we found that the extracted ECs were mostly river corridors; this reflects the key role of rivers in connecting ESAs, that is, assisting the migration of species and facilitating the transmission of energy.
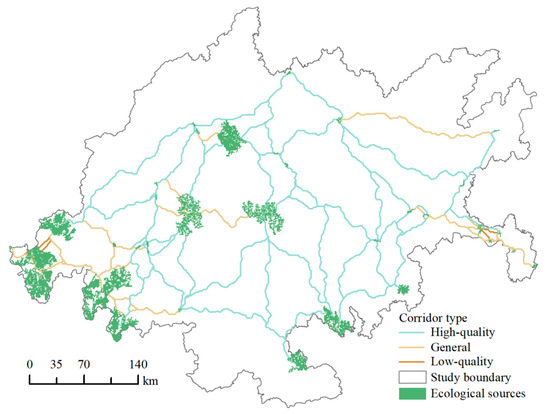
Figure 7.
Spatial distribution of ECs at different levels.
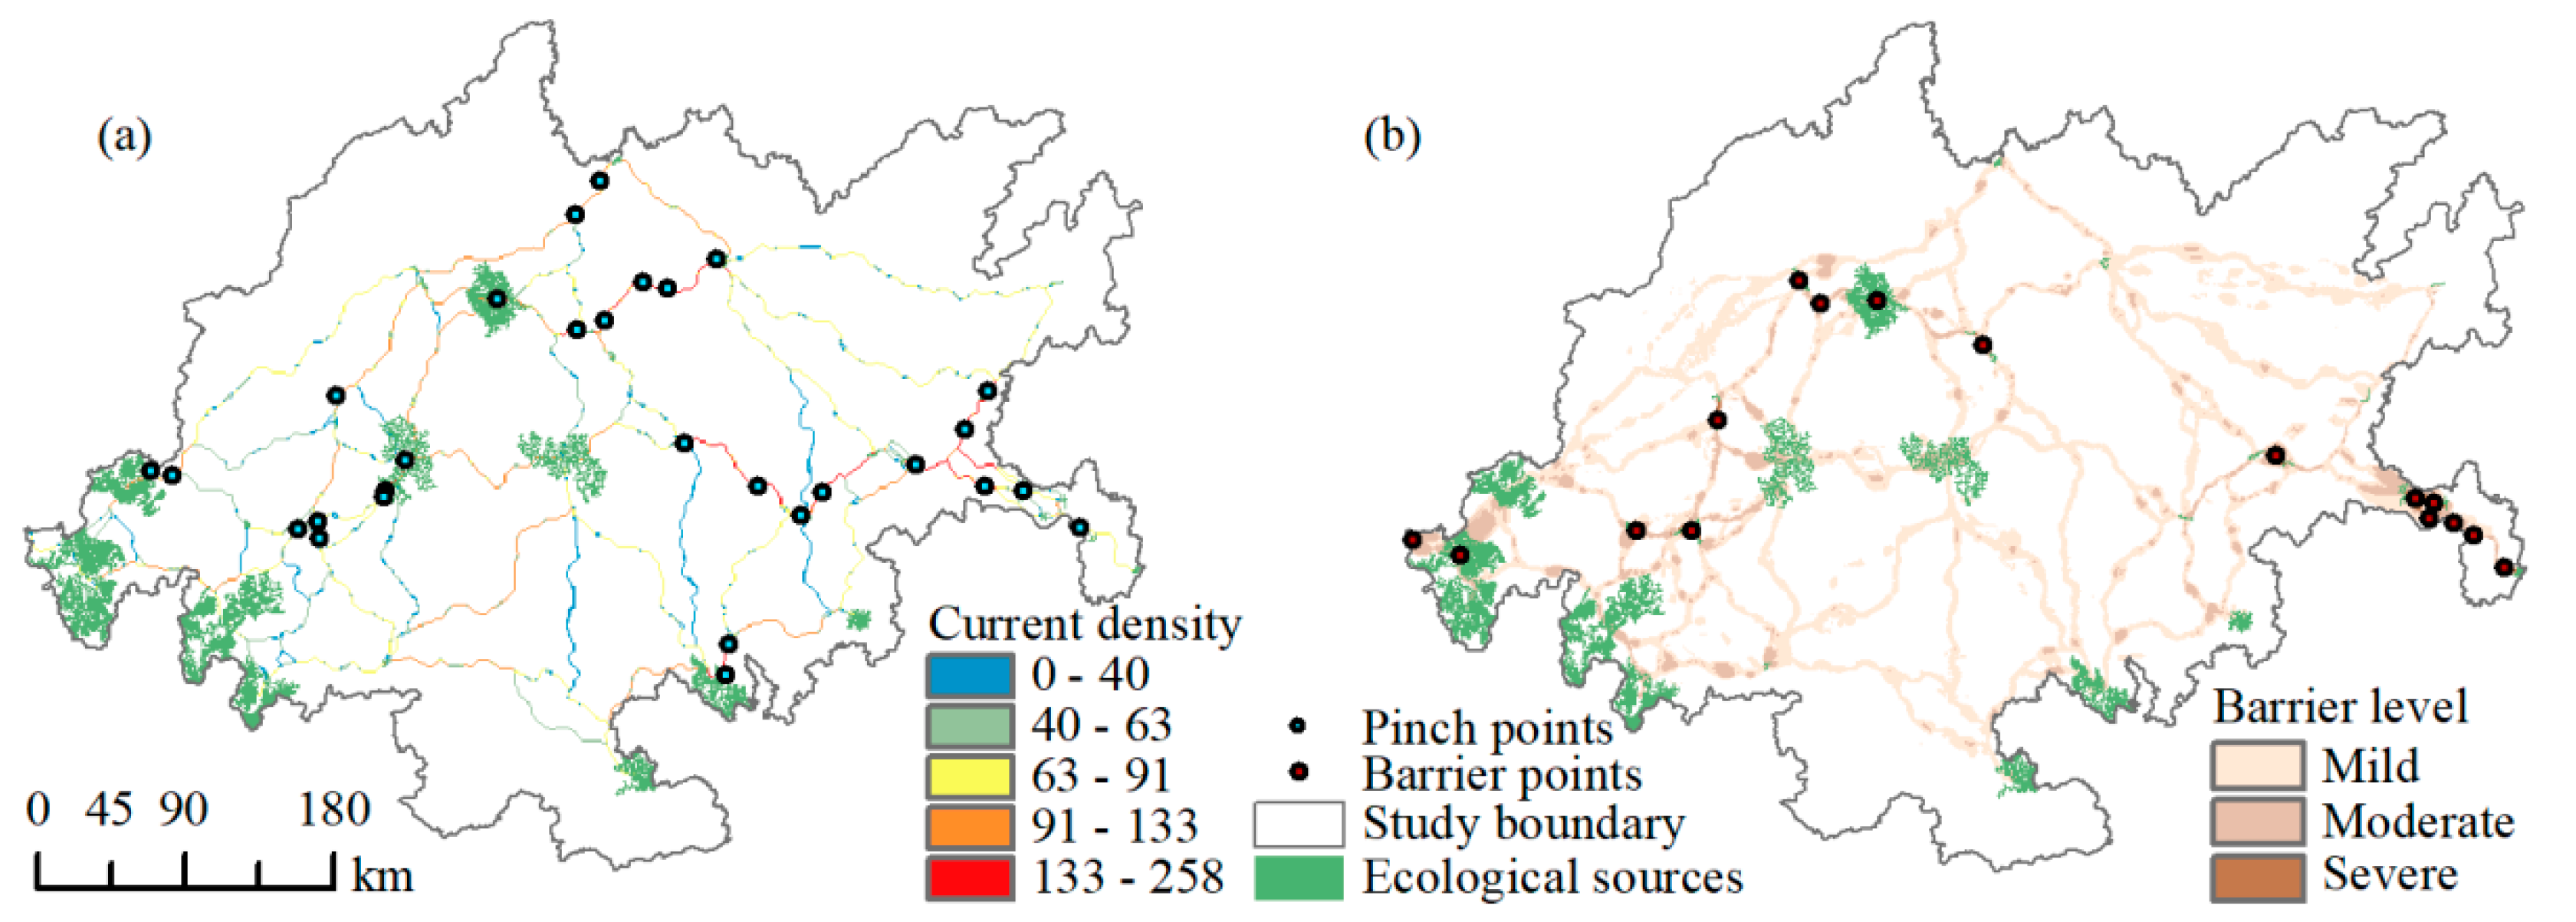
The spatial distribution of ecological nodes obtained by the CT is shown in Figure 8. This paper identified 29 EPPs, encompassing an area of 531 km2. In this paper, the high obstacle areas were defined as EBPs, totaling 16 points and covering a combined area of 536 km2. The space distribution of EPPs was relatively wide, which proved that the overall landscape connectivity in this area is better. Combined with the distribution of ECs, we found that EPPs mostly occur in high-quality corridors. The average resistance of species migrating on such corridors is the smallest, resulting in the EPPs having the highest frequency of passage. For example, there are relatively few EPPs in the southern section of the CCEC, only two in Jiangjin District. It may be due to urban construction that organisms face greater resistance when flowing between ECs in this area, and their biological mobility is low, making it difficult to form EPPs. As the most active area in the ECs, the EPPs are the primary area for ecological protection because of their greater risk of ecological degradation. The distribution of EBPs showed a pattern characterized by “scattered in the western and northwestern, dense in the eastern”, and there were seven EBPs in the east, among which the largest obstacle point was located in Pengshui Autonomous County, covering an area of about 96 km2. The EBPs in the western region are distributed at the junction of Chengdu City and Deyang City, the northern part of Leshan City, and the central part of Meishan City, and most of them are close to the ESAs. Combined with the distribution characteristics of land use type data of the CCEC, it was observed that cultivated land and woodland constituted the predominant EBP types, accounting for 41% and 37.6%, respectively. Under the influence of the farmers frequent agricultural production activities, the resistance of the cultivated land landscape is large, thus easily transforming into an obstacle area where it is difficult to pass on the way of species migration. The woodland is ecological land and is less disturbed by human activities. However, due to the terrain, the woodland in the CCEC is mostly founded in regions characterized by high altitudes and steep slopes, which have a high resistance effect on the flow of organisms, thus forming EBPs. The removal of EBPs will alleviate migration resistance and effectively enhance the connectivity between landscapes.
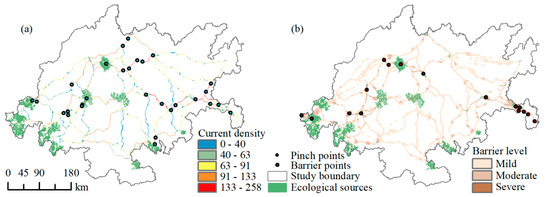
Figure 8.
Spatial distribution of ecological nodes. (a) represent the spatial distribution of EPPs. (b) represent the spatial distribution of EBPs.
3.2.4. ESP and Optimized Zoning
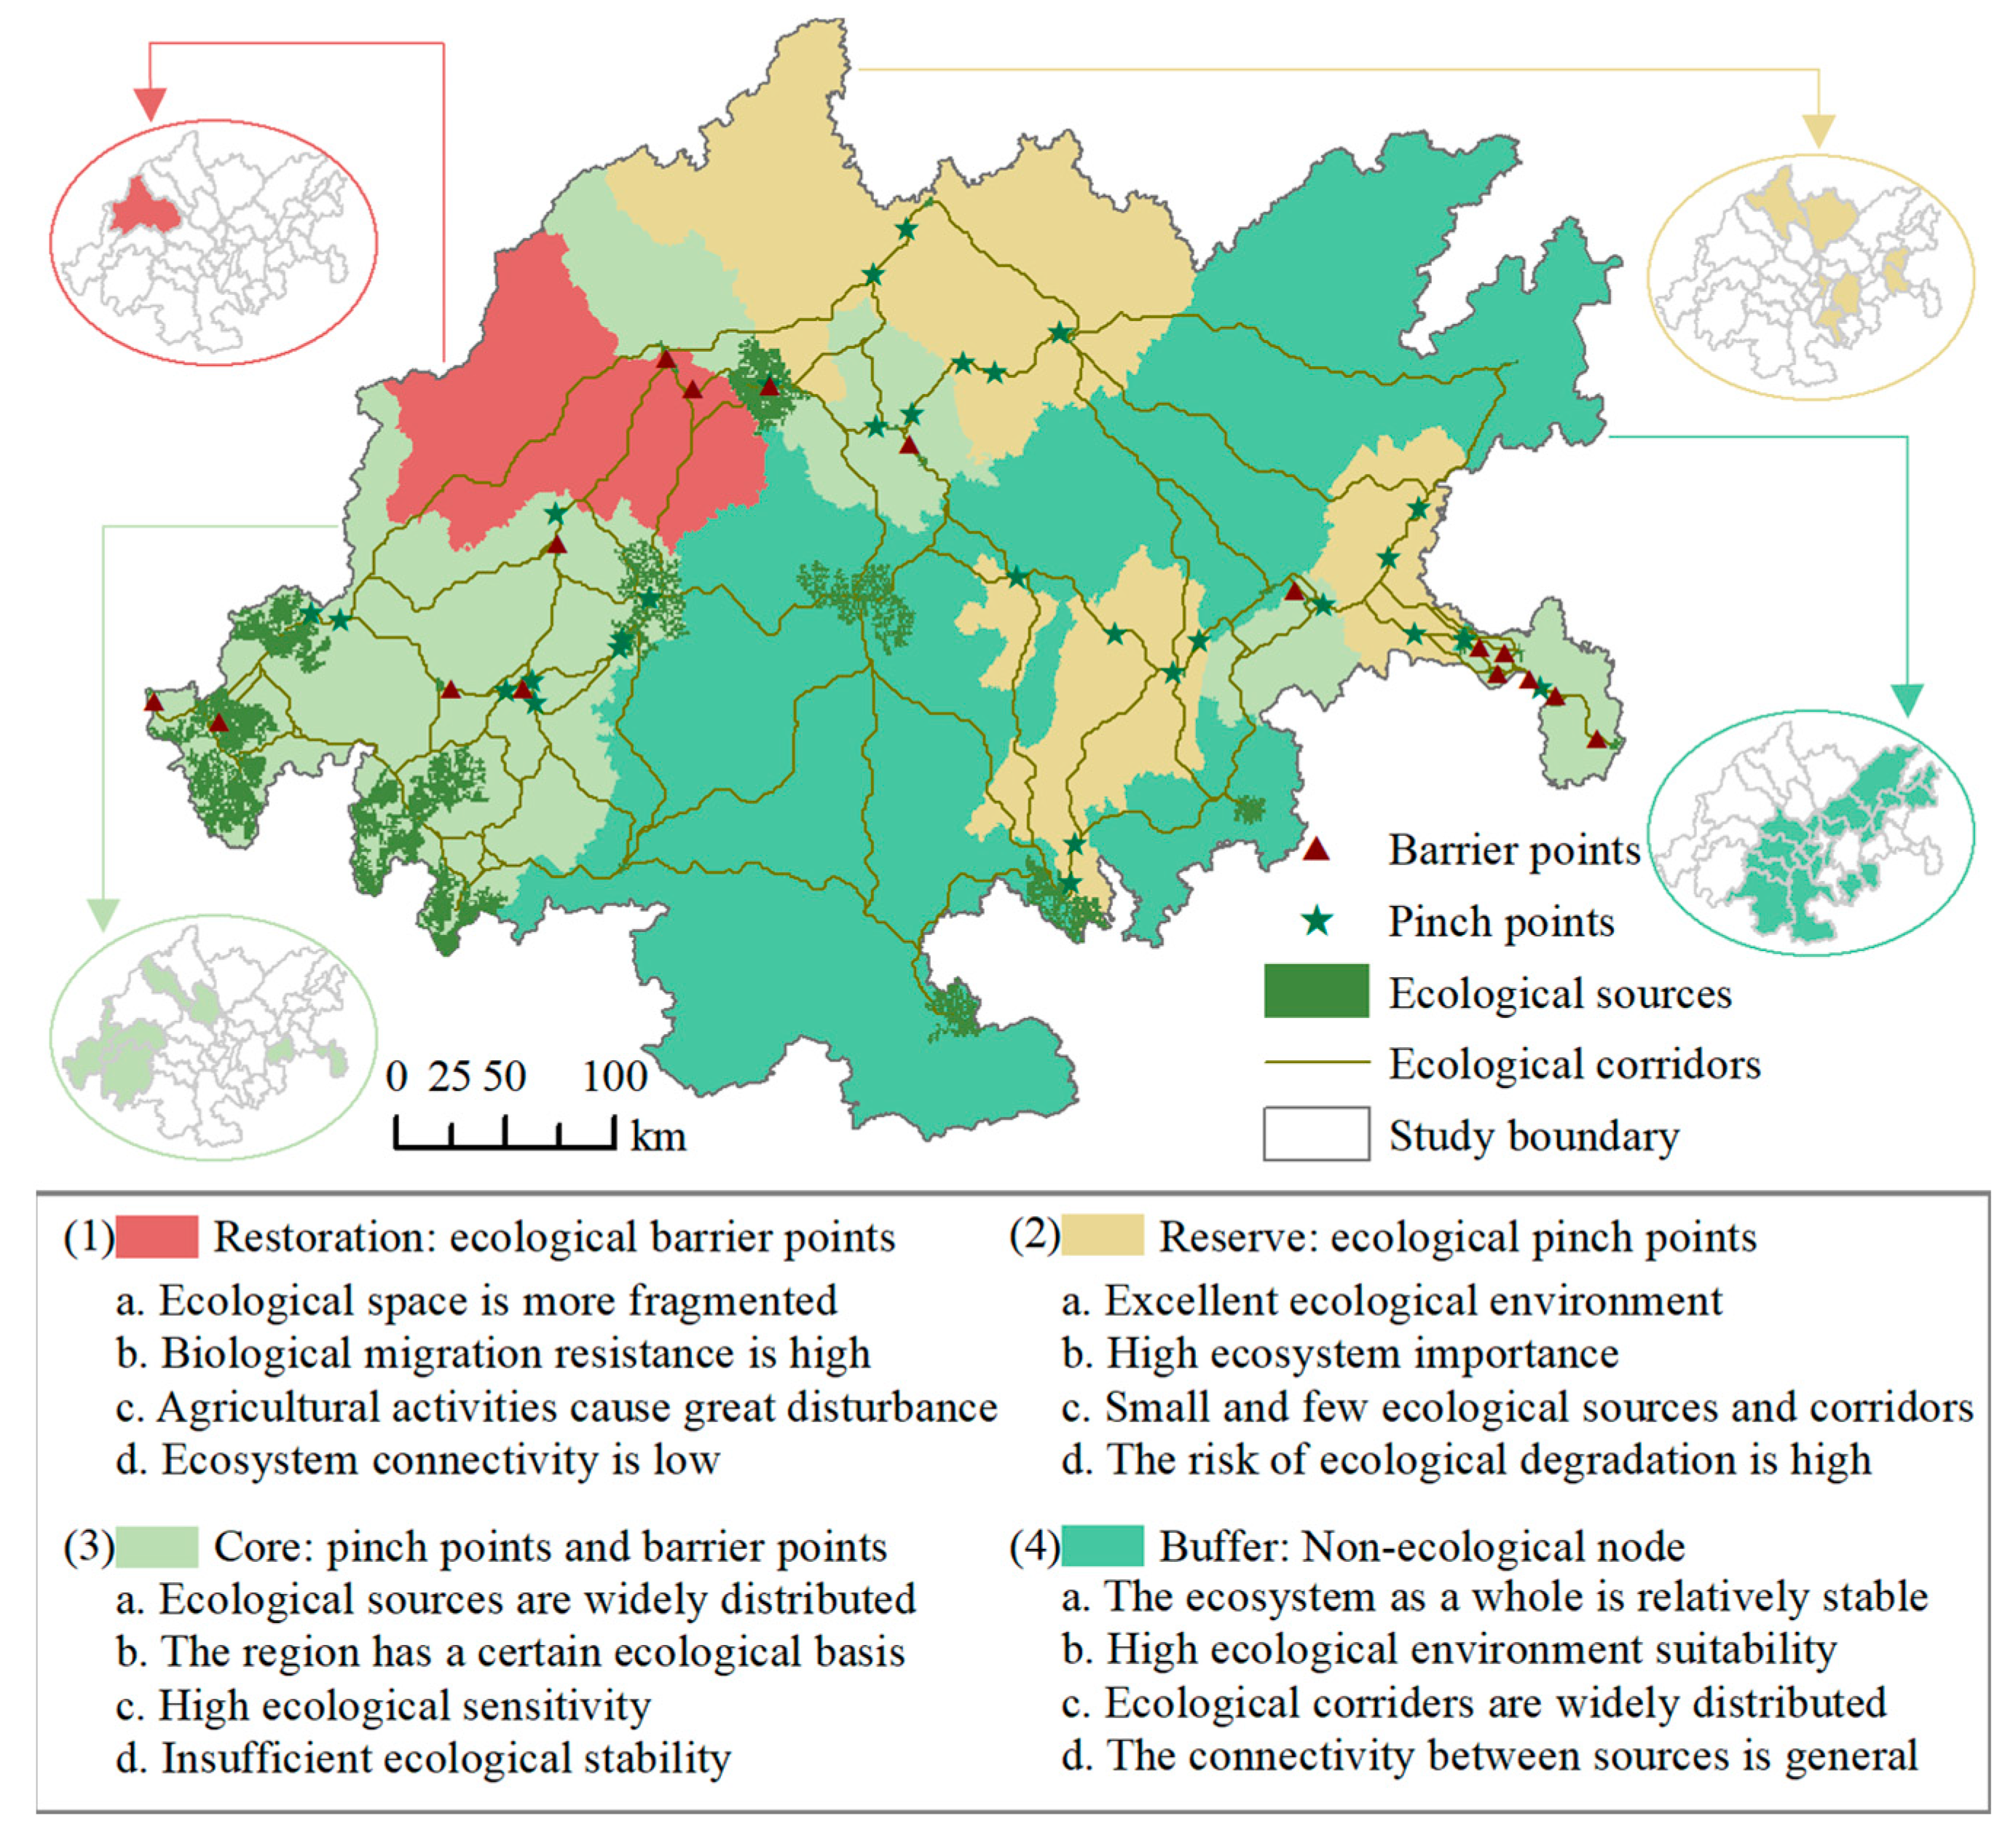
The ESP of the CCEC constructed by the above steps is shown in Figure 9. Delineating security zoning based on the existing ESP network can not only effectively maximize ecological benefits but is also a crucial measure to promote the completeness of the natural ecosystem. EPPs and EBPs are the key nodes affecting the circulation of ECs. Protecting the EPPs and restoring the EBPs are the most important links to implementing the optimization of ESP. As mentioned above, according to the properties and distribution characteristics of different ecological nodes identified by the CT, the ecological security zoning and the basic characteristics of each region are shown in Figure 9.
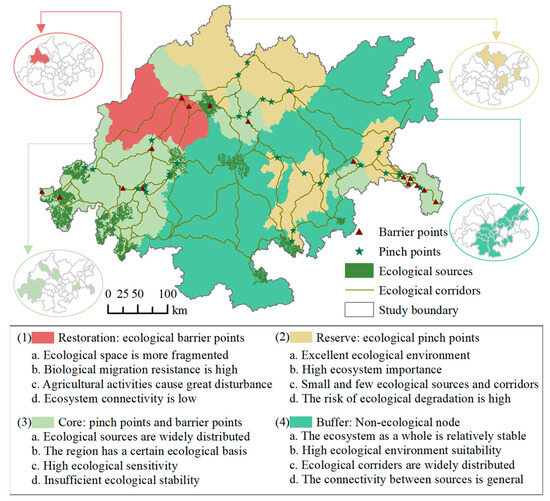
Figure 9.
Ecological security pattern and zoning.
4. Discussion
4.1. Comparative Analysis of ESP Optimization Methods
The research paradigm for the general understanding of the construction of ESP is the study of the four key links: “determine ESAs–construct ERS–extract ECs–identify EPPs and EBPs”. There are many different treatment methods for each link in the construction of the ESP model. By continuously improving these methods to optimize the model, different ESP networks are obtained (Table 6).
Table 6.
Optimization method of ESP.
These research examples not only involve small-scale counties, medium-sized cities, and urban agglomerations but also include a wide range of watersheds and even transnational regions. Among them, small-scale areas such as county and municipal levels are relatively common because of their complete data and convenient research. Many factors, such as angle, scale, method, and data, will influence the research results. Therefore, from different perspectives, using different methods to optimize the ESP has its own advantages but also shortcomings. For example, when choosing ESAs, the direct method has the advantages of easy access to data and simple operation. It is more suitable for small-area research areas, and the boundary division of high-quality habitat patches such as national parks and scenic areas is relatively clear and easy to identify in those areas [44]. The disadvantage is that the method is subjective and lacks rigor. The MSPA method relies on land use data to judge the structure of landscape patches from a complete space, which can enrich the scientific basis of the ESAs selection but does not take into account the ecological attributes of each independent patch itself [45]. This method requires less data, so it has a certain sensitivity to the research scale. If the scale is too large, it is easy to judge mistakes and affect the recognition results of spatial elements. It is more suitable for analyzing the problem of patch fragmentation and landscape connectivity in small-scale areas [21]. The comprehensive evaluation method is to identify the ESAs by selecting diversified indicators to construct various types of evaluation systems from the perspectives of the importance of ESs, the sensitivity of ESs, and the carrying capacity of ESs. This method can select the appropriate evaluation index system according to the ecological background conditions of the selected areas, so its scope of application is relatively extensive [11,46]. During the actual research process, some scholars also combine these three methods in pairs to extract ESAs, which can maximize the identification of all areas that may play an ecological function as ESAs. Taking the Jiaodong Peninsula of China as the research area, Kang et al. extracted ESAs by superimposing nature reserve data on the basis of ecosystem importance evaluation results [53]. The study found that 20 nature reserves and ecologically important areas reached a nearly 70% coincidence rate, which indicated that the research result was relatively accurate. Wang et al. utilized the InVEST model to evaluate the HQ service in the Yunnan section of the Lancang River Basin and then extracted 23 high-quality areas by combining the MSPA and landscape connectivity analysis [54]. The ESAs identified in the study included multiple national nature reserves such as Baima Snow Mountain, Cangshan Erhai, and Xishuangbanna, covering the identification results of the direct method, which also reflected the advantages of multi-method integration. For the extraction of ECs, the existing research is mostly based on the principle of the MCR model, but the subsequent corridor classification methods are different [47]. The classification method of the gravity model can calculate the magnitude of the gravitational interaction between ESAs, thus reflecting the relative importance of those ECs [55]. Spectral graph theory can quantitatively and directly assess the different levels of ECs [49]. The ant colony algorithm can identify the optimum corridor [50]. The data processing of these methods is complex and requires the subjective setting of some key thresholds. Such optimization methods that propose ecological protection and restoration suggestions from different partitions can reflect the current policy orientation and provide some references for government departments, such as ecological management, to formulate relevant policy documents [51,52]. However, such qualitative optimization methods cannot compare the optimization results in time and cannot judge the effectiveness of the methods. In general, these optimization methods or models have their own advantages and disadvantages. Different models are suitable for solving different specific problems, and combining multiple models to give full play to the advantages of each model is an effective way to optimize the ESP.
Above all, this paper combined the three optimization perspectives of source extraction, corridor identification, and policy recommendations to carry out the study of ESP based on the supply and demand ratio of ESs. First of all, in this paper, the selection of sources not only considered the provision of natural ESs but also took into account the requirements of human society. The dominant ESs may vary across different regions, so this paper did not consider the level of the comprehensive ESDR but chose to extract the source from each service separately and then superimpose it. Secondly, for the classification of ECs, the ratio of cost-weighted distance to minimum cost path was employed to classify ECs into different levels. The principle is easy to understand, and the calculation is simple. Finally, based on the constructed ESP, the zoning was carried out, and from the policy perspective, the suggestion for the optimization of ESP for the later period of the CCEC had been proposed. In addition, although this paper has some conclusions, it still has shortcomings. On the one hand, the selection of sources mainly focuses on the function of ESs, without considering the connectivity of sources. On the other hand, this paper only qualitatively puts forward optimization suggestions, without quantitative optimization comparison, which will be the part that should be taken into account in the subsequent research.
4.2. Policy Suggestions
The ecological security of the CCEC was segmented into zones for ecological protection, restoration, core, and buffer areas. Appropriate optimization suggestions have been given for different partitions. The specific recommendations are as follows:
Ecological protection area: In the case that human activities are difficult to control, the radiation range of ESs can be expanded by strengthening forest belt construction near small fragmented patches. This is to increase the ESDR by improving the supply capacity of ESs. By clearly delineating the boundary of nature reserves, the expansion of construction land around them can be prevented from encroaching on the ecological pinch space. For example, Mianyang City should actively respond to the “Eight Actions” for the construction of the CCEC, continue to strengthen the protection of all types of water resources to enhance their supply capacity, accelerate the construction of ECs of Jialing River and Fujiang and their first-level tributaries, and steadily implement coordinated actions for ecological environmental protection.
Ecological restoration area: Add ecological land and set up some ecological stepping stones at the junction between it and the corridor to enhance connectivity among corridors where the barrier points are located. In order to alleviate the resistance of biological migration on the ECs, returning farmland to forest or building an ecological buffer area should be carried out on the cultivated land where the EBPs are densely distributed. According to the requirements of the Overall Land Space Plan of Chengdu (2020–2035), we should vigorously promote the implementation of seven ecological restoration actions, such as comprehensive prevention of regional water and soil erosion problems, vegetation restoration, biodiversity maintenance, and comprehensive management of the water environment. Through the construction and implementation of ecological restoration projects, the supply capacity of ecosystem regulation services in this region can be improved.
Ecological core area: On the basis of protecting the original ecological space, add some green space as much as possible. Optimize the spatial layout of ecological sources to reduce the fragmentation of ecological space. When there is no guarantee that there is enough green space to provide ESs, the government should limit production and construction activities to reduce the demand for natural ecosystems in human society. For example, the Fuling District of Chongqing bears the important responsibility of safeguarding the water environment safety in the reservoir area due to its special geographical location. It should earnestly implement the plans and other relevant policies proposed by the Fuling District regarding the protection of the natural environment.
Ecological buffer area: When the ecological space of a region is saturated, it is necessary to limit human activities to reduce interference with the natural environment. By reducing human demand for ecosystems, we can improve the ESDR. Strengthen the existing urban green space construction to reduce ecological resistance. Share the migration pressure of other ecological corridors as much as possible and ensure the orderly operation of natural systems and the full realization of natural functions in other regions, to maintain the healthy operation of the overall ecosystem. In recent years, Ziyang City has resolutely carried the banner of building ecological civilization and protecting the natural environment, diligently working towards establishing an ecological shield in the Tuojiang River’s midsection. In addition to the restoration and protection of water ecology, the region should also rely on the greening of forest cities to enhance the management of ecological barriers around the city.
5. Conclusions
This paper constructed the ESP of the CCEC by incorporating the ESs, and the specific conclusions are as follows. In 2010, the supply capacity and demand level of five ESs in different regions of the CCEC differed significantly. On the supply side, the general spatial pattern showed a “high value at the periphery and low value within two cities”, and the demand side was the opposite. Furthermore, we found that, except for WC and CR, the supply of the other three ESs can basically meet the needs of human beings in social life. The spatial distribution of the ESDR mainly manifested that the ESs in the central urban areas of Chongqing and Chengdu exhibited a state of loss, of which the most obvious was the CS service. In the ESP network of the CCEC in 2020, there were 35 ESAs, constituting 4.3% of the aggregate area within the CCEC. They were mostly concentrated in woodlands in the southwest and southeast, and Deyang, Meishan, and Ziyang in the central area. We identified 91 ECs spanning a combined length of 10,701 km, and they were distributed extensively. It indicated that biological migration in the region has a certain guarantee. However, the emergence of 29 EPPs and 16 EBPs gave us a certain warning. Therefore, to further optimize and improve the overall ESP of the region, this paper divided the CCEC into ecological protection, restoration, core, and buffer areas based on the current situation of regional ecological background and policy guidance, and put forward some targeted differentiation strategies. The basic paradigm of ESP research has been formed, but most studies have neglected how to combine the theoretical research results with practical policy implementation. Therefore, it is believed that in the future, we should carry out in-depth, comprehensive research based on the research idea of “pattern construction-policy suggestion”. By proposing an ESP optimization scheme with regional characteristics, it provides practical guidance for the formulation of ecological protection policies.
Author Contributions
Conceptualization, D.G., Q.C. and L.Z.; methodology, D.G., Q.C. and L.Z.; formal analysis, D.G., Q.C. and L.Z.; writing—original draft preparation, Q.C.; writing—review and editing, D.G. and L.Z.; supervision, D.G. and L.Z.; funding acquisition, D.G. and L.Z.; software, K.Z. and G.P. All authors have read and agreed to the published version of the manuscript.
Funding
We gratefully thank the National Natural Science Foundation of China [Grant numbers 42171298, 42201333], the Late Project of the National Social Science Foundation in China [Grant numbers 20FJYB035], the Natural Science Foundation of Chongqing, China [Grant numbers CSTB2023NSCQ-LZX0009], and the Found of Graduate Student’s Education Innovation [Grant numbers 2024s0157] for their financial support of this research.
Data Availability Statement
The data presented in this study are available upon request from the corresponding author.
Conflicts of Interest
The authors declare no conflicts of interest.
Abbreviations
ESP, ecological security pattern; ESs, ecosystem services; CS, carbon sequestration; WY, water yield; WC, water conservation; CR, climate regulation; HQ, habitat quality; ESAs, ecological source areas; MCR, minimum cumulative resistance; CT, circuit theory; CCEC, Chengdu–Chongqing economic circle; ERS, ecological resistance surface; ECs, ecological corridors; EPPs, ecological pinch points; EBPs, ecological barrier points; ESDR, ecological supply–demand ratio.
References
- Bi, J.; Hao, R.; Li, J.; Qiao, J. Identifying ecosystem states with patterns of ecosystem service bundles. Ecol. Indic. 2021, 131, 108195. [Google Scholar] [CrossRef]
- Evers, C.R.; Wardropper, C.B.; Branoff, B.; Granek, E.F.; Hirsch, S.L.; Link, T.E.; Olivero-Lora, S.; Wilson, C. The ecosystem services and biodiversity of novel ecosystems: A literature review. Glob. Ecol. Conserv. 2018, 13, e00362. [Google Scholar] [CrossRef]
- Boesing, A.L.; Prist, P.R.; Barreto, J.; Hohlenwerger, C.; Maron, M.; Rhodes, J.R.; Romanini, E.; Tambosi, L.R.; Vidal, M.; Metzger, J.P. Ecosystem services at risk: Integrating spatiotemporal dynamics of supply and demand to promote long-term provision. One Earth 2020, 3, 704–713. [Google Scholar] [CrossRef]
- Huang, L.; Wang, J.; Fang, Y.; Zhai, T.; Cheng, H. An integrated approach towards spatial identification of restored and conserved priority areas of ecological network for implementation planning in metropolitan region. Sustain. Cities Soc. 2021, 69, 102865. [Google Scholar] [CrossRef]
- Li, L.; Huang, X.; Wu, D.; Yang, H. Construction of ecological security pattern adapting to future land use change in Pearl River Delta, China. Appl. Geogr. 2023, 154, 102946. [Google Scholar] [CrossRef]
- Doube, B.M. Ecosystem services provided by dung beetles in Australia. Basic Appl. Ecol. 2018, 26, 35–49. [Google Scholar] [CrossRef]
- Hou, W.; Hu, T.; Yang, L.; Liu, X.; Zheng, X.; Pan, H.; Zhang, X.; Xiao, S.; Deng, S. Matching ecosystem services supply and demand in China’s urban agglomerations for multiple-scale management. J. Clean. Prod. 2023, 420, 138351. [Google Scholar] [CrossRef]
- Yu, Y.; Li, J.; Han, L.; Zhang, S. Research on ecological compensation based on the supply and demand of ecosystem services in the Qinling-Daba Mountains. Ecol. Indic. 2023, 154, 110687. [Google Scholar] [CrossRef]
- Vačkářová, D.; Medková, H.; Krpec, P.; Weinzettel, J. Ecosystem services footprint of international trade: Economic value of ecosystem services lost due to crop production. Ecosyst. Serv. 2023, 64, 101560. [Google Scholar] [CrossRef]
- Liu, J.; Pei, X.; Zhu, W.; Jiao, J. Understanding the intricate tradeoffs among ecosystem services in the Beijing-Tianjin-Hebei urban agglomeration across spatiotemporal features. Sci. Total Environ. 2023, 898, 165453. [Google Scholar] [CrossRef]
- Zhang, J.; He, C.; Huang, Q.; Li, L. Understanding ecosystem service flows through the metacoupling framework. Ecol. Indic. 2023, 151, 110303. [Google Scholar] [CrossRef]
- Sangha, K.K.; Gordon, I.J.; Costanza, R. Ecosystem Services and Human Wellbeing-Based Approaches Can Help Transform Our Economies. Front. Ecol. Evol. 2022, 10, 841215. [Google Scholar] [CrossRef]
- Wu, X.; Fu, B.; Wang, S.; Song, S.; Lusseau, D.; Liu, Y.; Xu, Z.; Liu, J. Bleak prospects and targeted actions for achieving the Sustainable Development Goals. Sci. Bull. 2023, 68, 2838–2848. [Google Scholar] [CrossRef] [PubMed]
- Dashtbozorgi, F.; Hedayatiaghmashhadi, A.; Dashtbozorgi, A.; Ruiz–Agudelo, C.A.; Fürst, C.; Cirella, G.T.; Naderi, M. Ecosystem services valuation using InVEST modeling: Case from southern Iranian mangrove forests. Reg. Stud. Mar. Sci. 2023, 60, 102813. [Google Scholar] [CrossRef]
- Ruiz, I.; Pompeu, J.; Ruano, A.; Franco, P.; Balbi, S.; Sanz, M.J. Combined artificial intelligence, sustainable land management, and stakeholder engagement for integrated landscape management in Mediterranean watersheds. Environ. Sci. Policy 2023, 145, 217–227. [Google Scholar] [CrossRef]
- Ahn, S.R.; Kim, S.J. Assessment of integrated watershed health based on the natural environment, hydrology, water quality, and aquatic ecology. Hydrol. Earth Syst. Sci. 2017, 21, 5583–5602. [Google Scholar] [CrossRef]
- Liu, P.; Hu, Y.; Jia, W. Land use optimization research based on FLUS model and ecosystem services–setting Jinan City as an example. Urban Clim. 2021, 40, 100984. [Google Scholar] [CrossRef]
- Huang, S.; Tian, T.; Zhai, L.; Deng, L.; Che, Y. Understanding the dynamic changes in wetland cultural ecosystem services: Integrating annual social media data into the SolVES. Appl. Geogr. 2023, 156, 102992. [Google Scholar] [CrossRef]
- Belcher, E.H.; Douglas Wellman, J. Confronting the challenge of greenline parks: Limits of the traditional administrative approach. Environ. Manag. 1991, 15, 321–328. [Google Scholar] [CrossRef]
- Wang, Y.; Zhang, F.; Li, X.; Johnson, V.C.; Tan, M.L.; Kung, H.-T.; Shi, J.; Bahtebay, J.; He, X. Methodology for Mapping the Ecological Security Pattern and Ecological Network in the Arid Region of Xinjiang, China. Remote Sens. 2023, 15, 2836. [Google Scholar] [CrossRef]
- Cui, L.; Wang, J.; Sun, L.; Lv, C. Construction and optimization of green space ecological networks in urban fringe areas: A case study with the urban fringe area of Tongzhou district in Beijing. J. Clean. Prod. 2020, 276, 124266. [Google Scholar] [CrossRef]
- Liu, W.; Xu, H.; Zhang, X.; Jiang, W. Green Infrastructure Network Identification at a Regional Scale: The Case of Nanjing Metropolitan Area, China. Forests 2022, 13, 735. [Google Scholar] [CrossRef]
- Sun, Q.; Sun, J.; Baidurela, A.; Li, L.; Hu, X.; Song, T. Ecological landscape pattern changes and security from 1990 to 2021 in Ebinur Lake Wetland Reserve, China. Ecol. Indic. 2022, 145, 109648. [Google Scholar] [CrossRef]
- Wang, W.; Li, B.; Su, F.; Jiang, Z.; Chen, S. Identifying Ecological Security Patterns Meeting Future Urban Expansion in Changsha–Zhuzhou–Xiangtan Urban Agglomeration, China. Remote Sens. 2023, 15, 3141. [Google Scholar] [CrossRef]
- Xu, J.; Xu, D.; Qu, C. Construction of Ecological Security Pattern and Identification of Ecological Restoration Zones in the City of Changchun, China. Int. J. Environ. Res. Public Health 2022, 20, 289. [Google Scholar] [CrossRef] [PubMed]
- Wang, T.; Li, H.; Huang, Y. The complex ecological network’s resilience of the Wuhan metropolitan area. Ecol. Indic. 2021, 130, 108101. [Google Scholar] [CrossRef]
- Zhang, Z.; Hu, B.; Jiang, W.; Qiu, H. Construction of ecological security pattern based on ecological carrying capacity assessment 1990–2040: A case study of the Southwest Guangxi Karst—Beibu Gulf. Ecol. Model. 2023, 479, 110322. [Google Scholar] [CrossRef]
- Wei, Q.; Halike, A.; Yao, K.; Chen, L.; Balati, M. Construction and optimization of ecological security pattern in Ebinur Lake Basin based on MSPA-MCR models. Ecol. Indic. 2022, 138, 108857. [Google Scholar] [CrossRef]
- Bian, H.; Li, M.; Deng, Y.; Zhang, Y.; Liu, Y.; Wang, Q.; Xie, S.; Wang, S.; Zhang, Z.; Wang, N. Identification of ecological restoration areas based on the ecological safety security assessment of wetland-hydrological ecological corridors: A case study of the Han River Basin in China. Ecol. Indic. 2024, 160, 111780. [Google Scholar] [CrossRef]
- Closset-Kopp, D.; Wasof, S.; Decocq, G. Using process-based indicator species to evaluate ecological corridors in fragmented landscapes. Biol. Conserv. 2016, 201, 152–159. [Google Scholar] [CrossRef]
- Vergnes, A.; Kerbiriou, C.; Clergeau, P. Ecological corridors also operate in an urban matrix: A test case with garden shrews. Urban Ecosyst. 2013, 16, 511–525. [Google Scholar] [CrossRef]
- Fu, Q.; Li, B.; Yang, L.; Zhang, X. Importance evaluation of typical ecosystem services in arid regions of northwest China a case study in Altay Prefecture. J. Arid. Land Resour. Environ. 2016, 30, 70–75. [Google Scholar] [CrossRef]
- Nie, W.; Shi, Y.; Siaw, M.J.; Yang, F.; Wu, R.; Wu, X.; Zheng, X.; Bao, Z. Constructing and optimizing ecological network at county and town Scale: The case of Anji County, China. Ecol. Indic. 2021, 132, 108294. [Google Scholar] [CrossRef]
- Zhang, B.; Cao, J.; Chen, D.; Li, X.; Liu, Y.; Wang, J.; Liu, T. Construction of watershed ecological security patterns with integrated of spatial variability: A case study of the Yellow River Basin, China. Ecol. Indic. 2024, 159, 111663. [Google Scholar] [CrossRef]
- Chen, S.; Li, L.; Li, X.; Li, D.; Wu, Y.; Ji, Z. Identification and Optimization Strategy for the Ecological Security Pattern in Henan Province Based on Matching the Supply and Demand of Ecosystem Services. Land 2023, 12, 1307. [Google Scholar] [CrossRef]
- Wu, S.; Zhao, C.; Yang, L.; Huang, D.; Wu, Y.; Xiao, P. Spatial and temporal evolution analysis of ecological security pattern in Hubei Province based on ecosystem service supply and demand analysis. Ecol. Indic. 2024, 162, 112051. [Google Scholar] [CrossRef]
- Gao, M.; Li, C.; Zhao, J.; Zhao, H. Identification of ecological security pattern based on ecosystem service supply and demand in the Yangtze River Delta, China. Geocarto Int. 2023, 38, 2252787. [Google Scholar] [CrossRef]
- Tian, H.; Wang, H.; Lyu, X.; Li, X.; Yang, Y.; Zhang, Y.; Liu, J.; Lu, Y.; Zhao, X.; Qu, T.; et al. Construction and optimization of ecological security patterns in Dryland watersheds considering ecosystem services flows. Ecol. Indic. 2024, 159, 111664. [Google Scholar] [CrossRef]
- Xu, X.; Liu, J.; Zhang, S.; Li, R.; Yan, C.; Wu, S. China Multi-Period Land Use Land Cover Remote Sensing Monitoring Data Set (CNLUCC). Data Registration and Publishing System of Institute of Geographical Sciences and Resources, Chinese Academy of Sciences, 2018. Available online: https://www.resdc.cn/doi/doi.aspx?DOIid=54 (accessed on 1 April 2024).
- Zhao, N.; Liu, Y.; Cao, G.; Samson, E.L.; Zhang, J. Forecasting China’s GDP at the pixel level using nighttime lights time series and population images. GIScience Remote Sens. 2017, 54, 407–425. [Google Scholar] [CrossRef]
- Xiang, S.; Wang, Y.; Deng, H.; Yang, C.; Wang, Z.; Gao, M. Response and multi-scenario prediction of carbon storage to land use/cover change in the main urban area of Chongqing, China. Ecol. Indic. 2022, 142, 109205. [Google Scholar] [CrossRef]
- Zhou, L. Evaluation and Multi-Scenario Simulation of Wetland Ecosystem Services in the Upper Yangtze River. Ph.D. Thesis, Chongqing University, Chongqing, China, 2020. [Google Scholar] [CrossRef]
- Liu, T.; Tang, Y.; Ding, J.; Niu, J.; Hua, G. Spatiotemporal Responses of Habitat Quality to Urban Sprawl in Chengdu-Chongging Economic Circle. J. Ecol. Rural Environ. 2023, 39, 20–28. [Google Scholar] [CrossRef]
- Aminzadeh, B.; Khansefid, M. A case study of urban ecological networks and a sustainable city: Tehran’s metropolitan area. Urban Ecosyst. 2009, 13, 23–36. [Google Scholar] [CrossRef]
- Zhang, H.; Li, J.; Tian, P.; Pu, R.; Cao, L. Construction of ecological security patterns and ecological restoration zones in the city of Ningbo, China. J. Geogr. Sci. 2022, 32, 663–681. [Google Scholar] [CrossRef]
- Chen, Y.; Ma, Y.; Pan, J.; Zhang, S.; Zhang, X.; Wu, R.; Li, X. Integrating ecosystem health diagnosis into the construction of ecological security network—A case study in Qujing City, China. Ecol. Indic. 2023, 146, 109780. [Google Scholar] [CrossRef]
- Zeng, W.; Tang, H.; Liang, X.; Hu, Z.; Yang, Z.; Guan, Q. Using ecological security pattern to identify priority protected areas: A case study in the Wuhan Metropolitan Area, China. Ecol. Indic. 2023, 148, 110121. [Google Scholar] [CrossRef]
- Feng, M.; Zhao, W.; Zhang, T. Construction and Optimization Strategy of County Ecological Infrastructure Network Based on MCR and Gravity Model—A Case Study of Langzhong County in Sichuan Province. Sustainability 2023, 15, 8478. [Google Scholar] [CrossRef]
- Kong, F.; Yin, H.; Nakagoshi, N.; Zong, Y. Urban green space network development for biodiversity conservation: Identification based on graph theory and gravity modeling. Landsc. Urban Plan. 2010, 95, 16–27. [Google Scholar] [CrossRef]
- Pan, J.; Liang, J.; Zhao, C. Identification and optimization of ecological security pattern in arid inland basin based on ordered weighted average and ant colony algorithm: A case study of Shule River basin, NW China. Ecol. Indic. 2023, 154, 110588. [Google Scholar] [CrossRef]
- Bai, H.; Weng, L. Ecological security pattern construction and zoning along the China-Laos Railway based on the potential-connectedness-resilience framework. Ecol. Indic. 2023, 146, 109773. [Google Scholar] [CrossRef]
- Li, S.; Zhao, Y.; Xiao, W.; Yue, W.; Wu, T. Optimizing ecological security pattern in the coal resource-based city: A case study in Shuozhou City, China. Ecol. Indic. 2021, 130, 108026. [Google Scholar] [CrossRef]
- Kang, J.; Zhang, X.; Zhu, X.; Zhang, B. Ecological security pattern: A new idea for balancing regional development and ecological protection. A case study of the Jiaodong Peninsula, China. Glob. Ecol. Conserv. 2021, 26, e01472. [Google Scholar] [CrossRef]
- Wang, Y.; Zhang, L.; Song, Y. Study on the Construction of the Ecological Security Pattern of the Lancang River Basin (Yunnan Section) Based on InVEST-MSPA-Circuit Theory. Sustainability 2022, 15, 477. [Google Scholar] [CrossRef]
- Huo, J.; Shi, Z.; Zhu, W.; Li, T.; Xue, H.; Chen, X.; Yan, Y.; Ma, R. Construction and Optimization of an Ecological Network in Zhengzhou Metropolitan Area, China. Int. J. Environ. Res. Public Health 2022, 19, 8066. [Google Scholar] [CrossRef] [PubMed]


Disclaimer/Publisher’s Note: The statements, opinions and data contained in all publications are solely those of the individual author(s) and contributor(s) and not of MDPI and/or the editor(s). MDPI and/or the editor(s) disclaim responsibility for any injury to people or property resulting from any ideas, methods, instructions or products referred to in the content. |
© 2024 by the authors. Licensee MDPI, Basel, Switzerland. This article is an open access article distributed under the terms and conditions of the Creative Commons Attribution (CC BY) license (https://creativecommons.org/licenses/by/4.0/).