Article

Influences of Vegetation Rehabilitation on Soil Infiltrability and Root Morphological Characteristics in Coastal Saline Soil

by
Linlin Chu
1,
Si Yuan
1,
Dan Chen
1,*,
Yaohu Kang
2,
Hiba Shaghaleh
3,
Mohamed A. El-Tayeb
4,
Mohamed S. Sheteiwy
5,6 and
Yousef Alhaj Hamoud
7
1
College of Agricultural Science and Engineering, Hohai University, Nanjing 210098, China
2
Key Laboratory of Water Cycle and Related Land Surface Processes, Institute of Geographic Science and Natural Resources Research, Chinese Academy of Sciences, Beijing 100101, China
3
College of Environment, Hohai University, Nanjing 210098, China
4
Botany and Microbiology Department, College of Science, King Saud University, Riyadh 12372, Saudi Arabia
5
Department of Integrative Agriculture, College of Agriculture and Veterinary Medicine, United Arab Emirates University, Al Ain P.O. Box 15551, Abu Dhabi, United Arab Emirates
6
Department of Agronomy, Faculty of Agriculture, Mansoura University, Mansoura 35516, Egypt
7
College of Hydrology and Water Resources, Hohai University, Nanjing 210098, China
*
Author to whom correspondence should be addressed.
Land 2024, 13(6), 849; https://doi.org/10.3390/land13060849
Submission received: 23 May 2024 / Revised: 10 June 2024 / Accepted: 12 June 2024 / Published: 14 June 2024

Abstract

:
Soil’s hydraulic properties are an essential characteristic that influences the hydrologic cycle by influencing infiltration and runoff and the transport of soil water and salt in the process of vegetation rehabilitation in coastal saline soils. To date, few studies have specifically addressed the soil’s hydraulic properties and root–soil interactions of coastal saline soil under revegetation. This study aimed to identify the unique hydraulic characteristics of soil, the pore size distribution parameter, Gardner α, and the different contributions of soil’s physical properties and vegetation’s root morphological characteristics with regard to soil infiltration. For this purpose, disc infiltration experiments at different pressure heads were performed on three vegetation types, Salix matsudana (SM), Hibiscus syriacus (HC), and Sabina vulgaris (SV), after two years of vegetation rehabilitation. The results demonstrated that the initial and steady infiltration rate, Gardner α, and soil porosity fraction exhibit significant differences among the three plant species. A correlation analysis indicated that the soil water content, surface area, density, and dry weight of roots had inverse relationships with soil infiltration at heads of pressure of 0 cm and 9 cm. The regulation of soil infiltration was influenced by the root dry weight and root average diameter, which played crucial roles in determining the roots’ morphological properties and the formation of pathways and soil pores.

1. Introduction

Coastal ecosystems are unique due to their position in the land–sea transition zone. The area of saline soils in the coastal zone increases continuously. The northern plain of Jiangsu Province falls along the 852 km coastline of the Yellow Sea and has saline–alkali soils covering an area of 6.53 × 10⁵ ha, accounting for 25% of the saline land area in China [1]. The great agricultural potential of the area can be attributed to its rich light and heat resources. However, the excessive accumulation of salts and high exchangeable sodium content have resulted in the deterioration of the structure and hydraulic properties of this area, and the poor ventilation and water permeability of the soil in this area has increased its vulnerability to crusting and to the imbalance in nutrients that are available to plants [2,3,4]. Consequently, the region only supports salt-tolerant plants.
Vegetation rehabilitation in saline lands is a commonly applied eco-engineering approach in agricultural and urban environments [5,6,7]. The above approach is regarded as one effective solution to enhance soil’s structural quality and chemical and physical characteristics [8,9]. While numerous past studies on the influence of vegetation types on the functions of soil have been conducted, the results of these studies were largely reliant on the structure of the soil and its hydraulic characteristics [10,11,12,13]. In addition, other studies have explored the effects of the underground plant biomass on soil characteristics through the use of species-based comparative approaches [14,15]. These approaches have been shown to be effective in improving ecological rehabilitation. Many past investigations have demonstrated that the rate of infiltration of soil water is generally affected by the soil’s characteristics, as well as the plant root systems [16,17,18,19,20]. Among the various factors influencing soil water infiltration, systems of plant roots are typically regarded as having a larger potential for regulation of the infiltration of soil water compared to soil characteristics [21]. Vegetation has been shown to be an important driver of soil’s infiltrability [12,22,23]. However, a lack of consensus on the influences of different categories of vegetation roots on soil structure remains. Previous studies have demonstrated that shrubs and trees result in higher infiltration compared to grasses during extended periods of management and rehabilitation [5,11,24]. Other studies have demonstrated that the rates of infiltration of shrubland soils are lower than those of barren soils and grassland [16,25,26]. Roots have generally been shown to promote infiltration [27,28,29], whereas other investigations have found that increments in the density of root length always increase infiltration [16,30]. Consequently, Demenois et al. [31] and Wu et al. [28] found that the influences on soil’s hydraulic characteristics by plant roots are highly reliant on the complex associations between the soil characteristics and roots. However, there have been few experimental studies on the relationships between soil’s infiltrability and roots’ morphological traits.
Measurements of the soil surface’s hydraulic properties are crucial to quantify soil infiltration and the ability to transport water. The tension disc infiltrometer [32] has become a widely use infiltration method due to its portability and its easy in situ applicability [33]. It consists of a disc base attached to a water supply reservoir and a bubbling tower to impose a negative pressure head (h) at the disc base. Thereby, methods based on the transient state data analysis can be employed to calculate the hydraulic conductivity (Ks) and Gardner constant α. Hydraulic properties such as soil’s water conductivity Ks and Gardner constant α, which characterizes the soil pore size distribution, are major parameters reflecting soil’s infiltration capacity [34].
The movement of soil moisture in coastal areas is closely related to the movement of soil salinity. Studying the dynamic rule of soil moisture infiltration is of great significance for improving the quality of coastal saline soil, accelerating the leaching process of saline soil, providing the soil’s hydraulic parameters, and accelerating local agricultural development. Our research group applied field experiments for ten years to select the best species of landscape plants in coastal saline soils, and the results showed that among 30 species, the survival rates of Salix matsudana, Hibiscus syriacus, and Sabina vulgari were up to 95% [3,4,5,9]. Thus, the present study assessed the soil’s rate of infiltration of three native vegetation types, namely Salix matsudana+grass(SM), Hibiscus syriacus+grass (HC), and Sabina vulgaris (SV), two years after water–salt regulation was applied. The aim of the current study, in which the quaternary sediment was relatively developed, was to characterize soil infiltration for the reclamation of coastal saline soils on the eastern coast of China, and the soil, with its parent material mainly coming from the Huang-Huai alluvial, has common characteristics with other coastal saline soils in that it is quite saline [16.7 dS/m < mean electrical conductivity of saturated paste extracts (ECe) < 66.7 dS/m] and has the same ionic composition as sea water. The objectives of the present study were to (1) compare temporal changes in infiltration characteristics and hydraulic conductivity properties among different vegetation types; (2) recognize the plausible concomitant alterations in the proportional contribution to flow by each class of soil pore size among different vegetation types; (3) identify the influences of soil characteristics and root morphologic parameters on soil’s hydraulic conductivity (K) and soil’s pore structure; and (4) further determine the dominant related factors influencing the hydraulic conductivity of soil (K) and Gardner α.

2. Materials and Methods
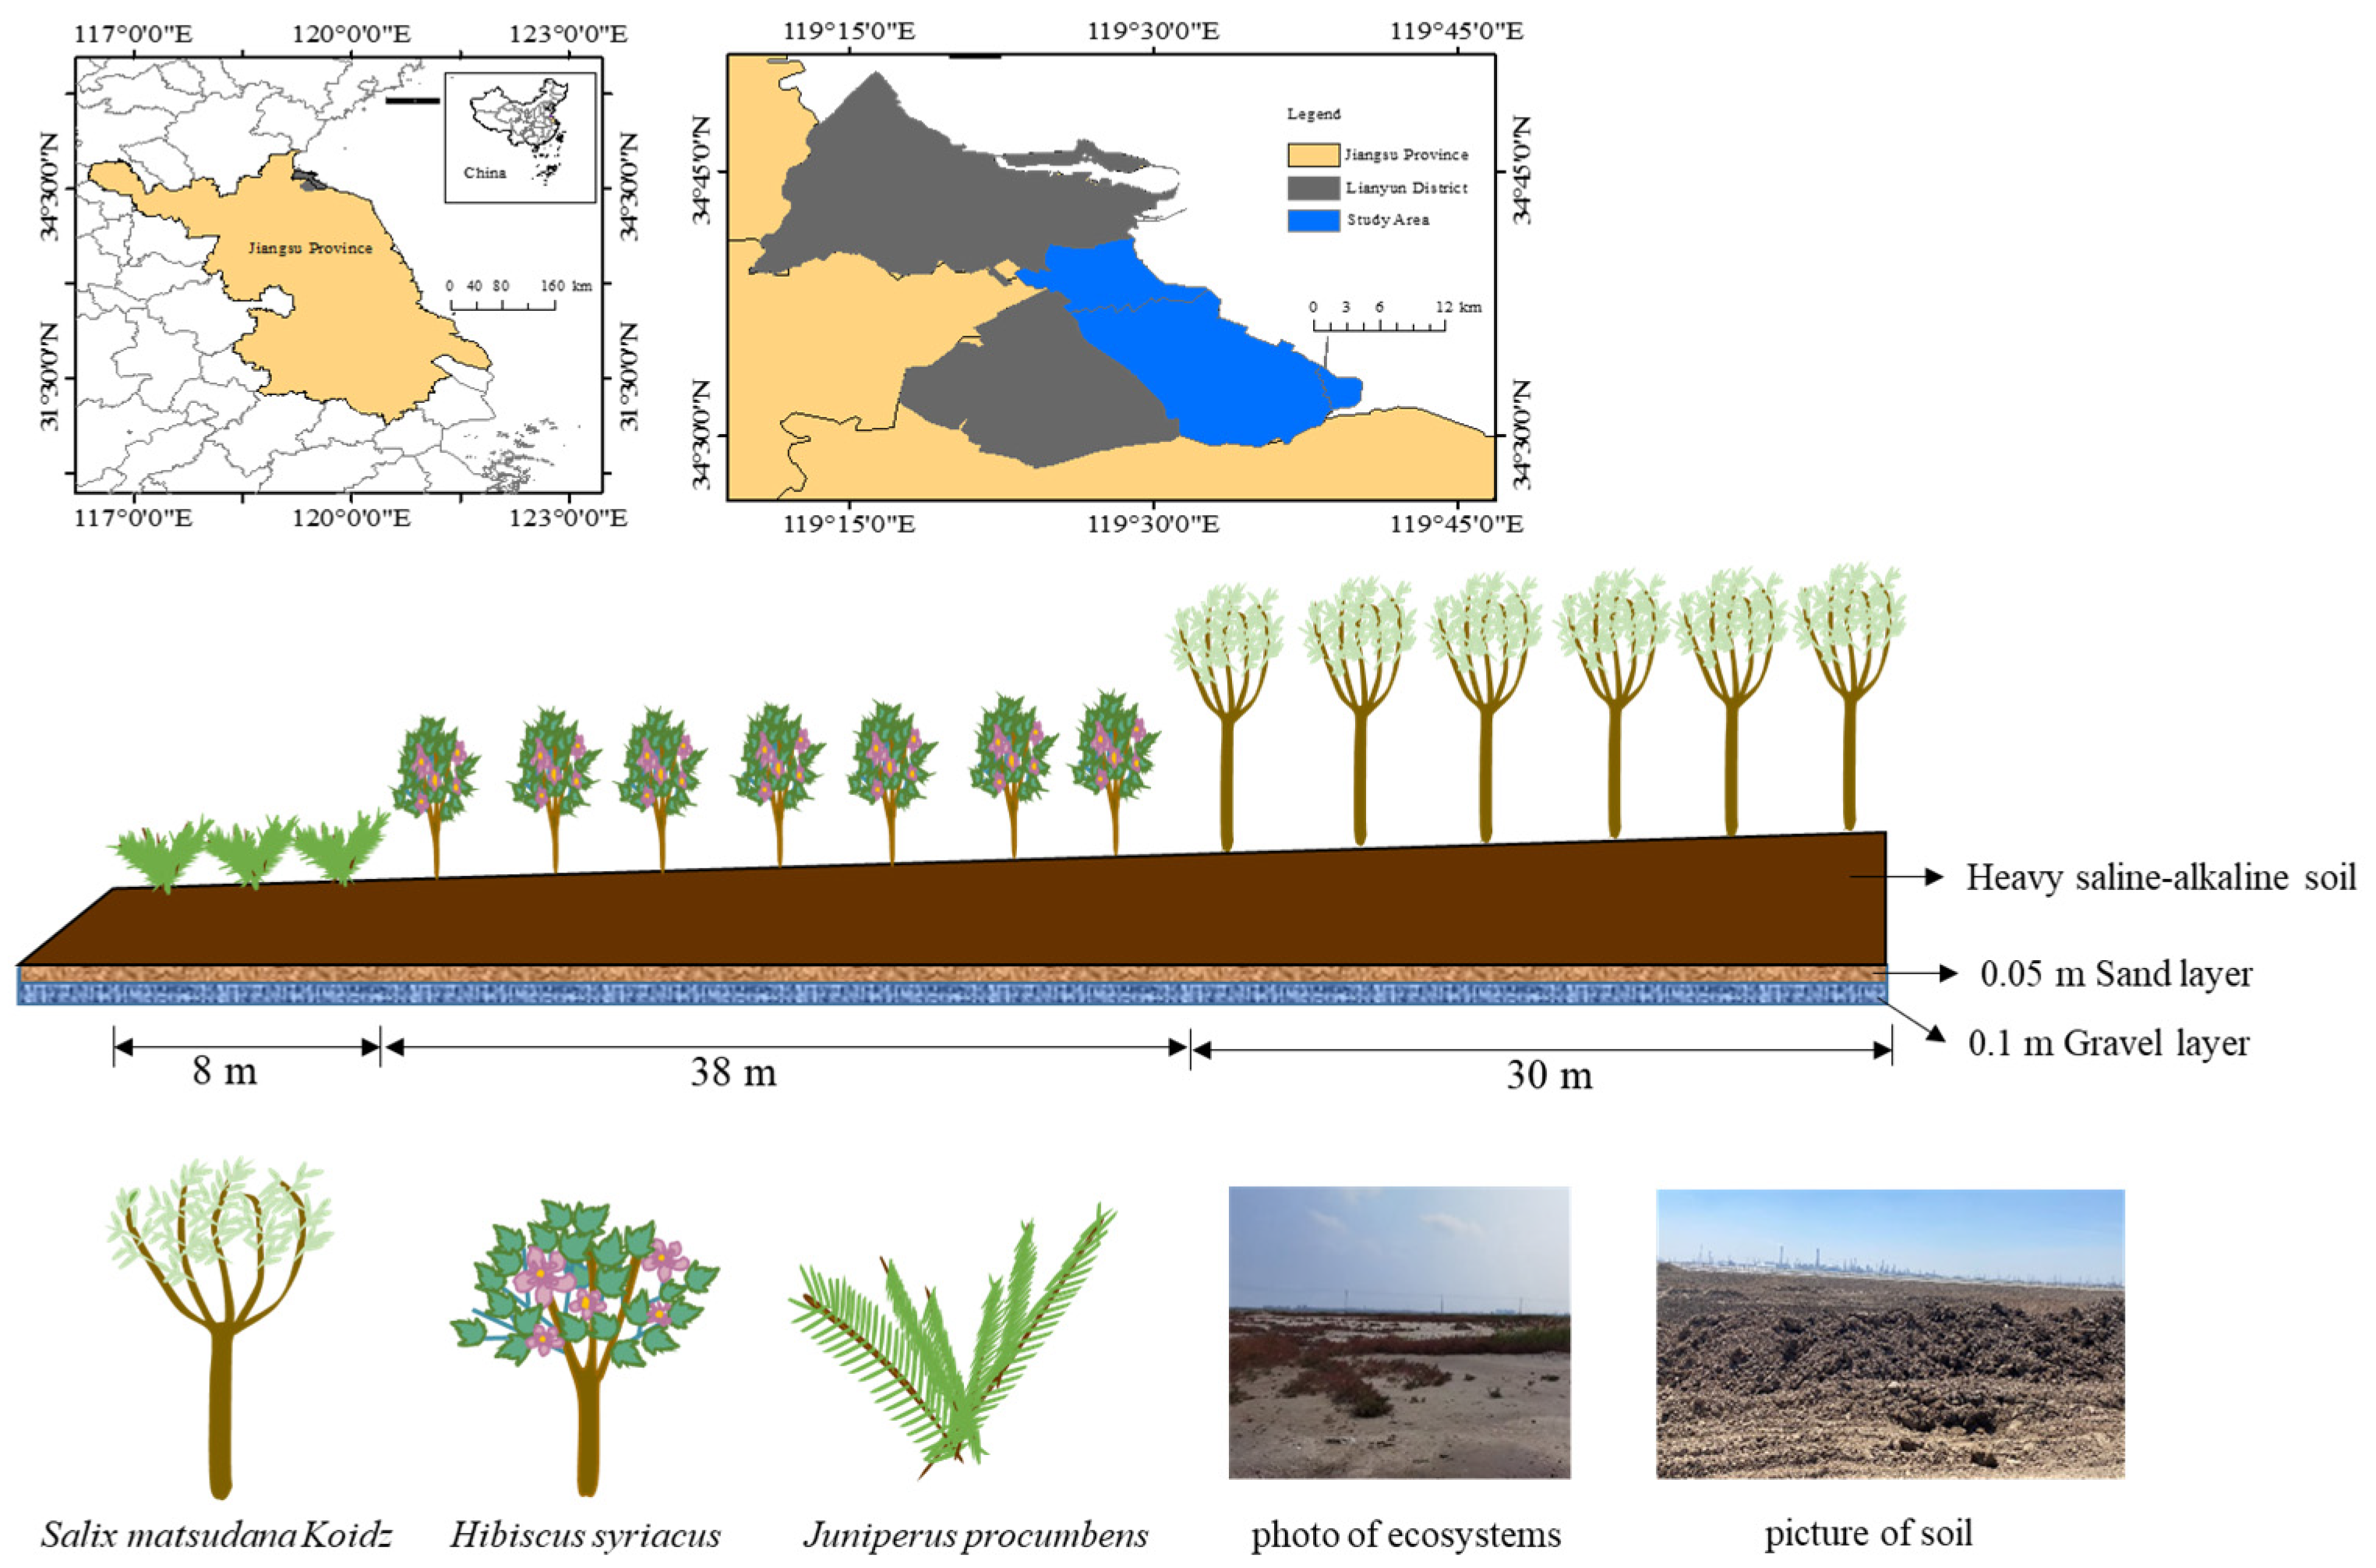
2.1. Area of Study

Experiments were conducted between 2021 and 2022 in Xuwei New district, the eastern coast of Lianyungang City, Jiangsu province (119°17′–119°38′ E, 34°29′–34°40′ N), southeast China (Figure 1). The study area falls within a warm, temperate monsoon and marine climate zone. The yearly mean temperature and yearly mean rainfall are 14.1 °C and 900.9 mm, respectively, with 70% of rainfall falling from June to September. The mean yearly potential evapotranspiration is 855.1 mm, and the frost-free period is 194 days. Prior to the experiment, the perennial average soil groundwater depth in this area was 0.8–2.1 m. The isolation layer was adopted because of the low groundwater depths and to reduce the impact of salt returning to the plant roots as a result of the evaporation of shallow groundwater. The native soil was placed above the isolation layer, which was 0.15 m deep with a 0.1 m thick gravel layer on the bottom and covered by a 0.05 m thick sand layer. Table 1 illustrates the chemical and physical characteristics of the assessed soil. According to the United States Department of Agriculture (USDA) soil classification, the mean soil texture at 0–40 cm and 40–60 cm was silt loam. The average EC, pH, SAR, and organic matter in the 0–100 cm soil layer were 29.28 dS/m, 7.80, 20.54 (mmol/L)0.5, and 5.93 g/kg, respectively, with the soil being classed as heavily saline soil.

2.2. Design of Field Experiments

The measurements were conducted in the field in an area containing SM, HC, and SV, which were planted in 2021, and was applied by a method based on water–salt regulation through drip irrigation during 2021–2022. SM is a major diffuse porous wood species, used for shelterbelts and barren hill afforestation. Consequently, this hardy species dominates the landscape and can flourish in saturated land, land with high salinity and alkalinity, and arid areas. HC is a deciduous small tree with a dense crown and well-developed roots. This species shows strong adaptability to soil in the region and is highly resistant to salt and alkalinity. SV is classed as a coniferous evergreen creeping shrub that does not exceed a height of 1.0 m. The stolon of this species runs along the ground and frequently produces outward-radiating adventitious roots that form a single lamellar shrub layer.
The studied areas of SM, HC, and SC were 76 m × 30 m, 76 m × 38 m, and 76 m× 8 m, with row spacings of 3 m × 3 m, 1.5 m × 1.5 m, and 1.3 m × 1.3 m, respectively. The turf was laid on both the SM and HC areas to reduce interplant evaporation. Each treatment comprised three replicate plots, set according to a random stratified pattern, leading to nine treatments in total. The plots and rows were separated by 2 m, respectively. The regulation of water and salt was achieved by drip irrigation, with the scheduling of the drip irrigation and mode of regulation of water and salt described in Li et al. [3].

2.3. Measurements of Soil’s Hydraulic Properties
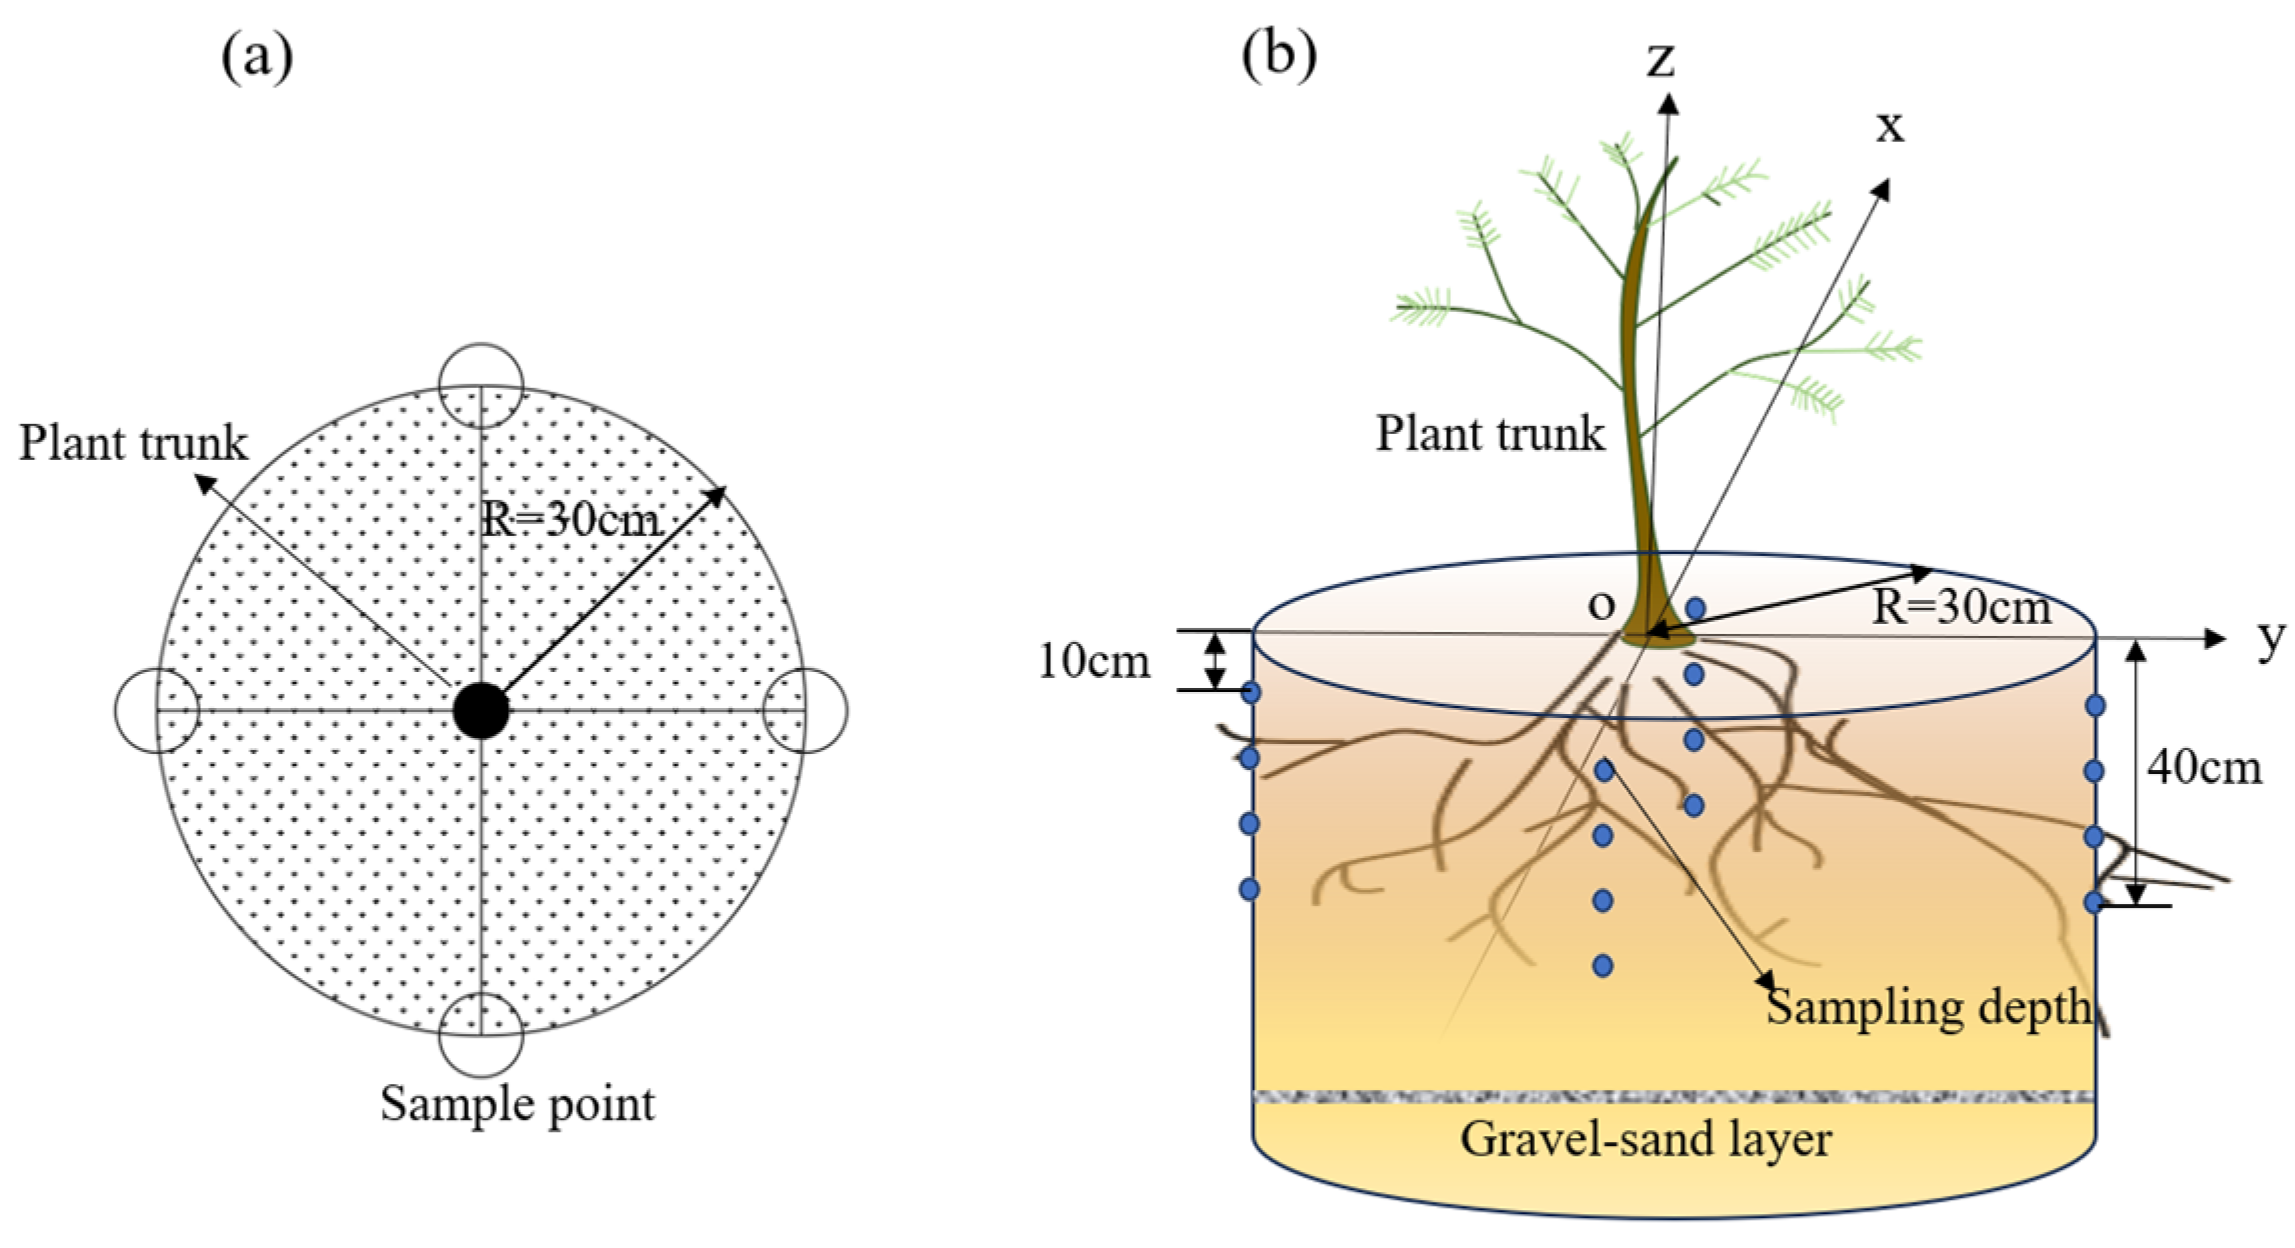
Considering the possibility of hydraulic properties changing due to rainfall, three sets of disc infiltration measurements 30 cm away from the trunk were completed for one day in each vegetation type, with five replicate sequences of infiltration rates being performed for each treatment. At each measuring point, a disc infiltration test was implemented in the order of water supply pressure head (−9 cm, −6 cm, −3 cm, and 0 cm). For the infiltration measurements, an unsmeared cleared soil surface within a radius of 20 cm around the sample point was prepared, and the weeds on the soil surface were scraped with a knife while ensuring that the root system remained undamaged. The soil surface was tiled with 1 mm sieved sand with a thickness of 1 cm. This ensured that the sand had good contact with the semi-permeable membrane of the infiltration disc.
Cumulative infiltration was recorded every 60 s for each infiltration measurement up until steady infiltration. Considering the variabilities in the infiltration rate across spatial scales, 5 repeated experiments were performed for each treatment. Based on the consecutive measurement results, the average infiltration rate for the initial 3 min and the final 5 min were identified as the initial infiltration rate (IIR) and the steady infiltration rate (SIR), respectively. Hydraulic properties such as the soil’s water conductivity K and Gardner constant α, which characterizes the soil’s pore size distribution, are major parameters that reflect the soil’s infiltration capacity [34]. Nonlinear regression analysis [35] was used to calculate the water conductivity K and the Gardner α constant:
i h f = K s exp α h + 4 K S exp α h Π R α
where i(hf) represents the stable infiltration rate under the pressure head of hf, cm/s; R is the infiltration radius of the disk, cm; Ks is the saturated water conductivity, cm/s; and α is the characterized soil pore size distribution, cm−1.
Substituting the fitted saturated conductivity Ks and α into the Gardner exponential equation, we obtain the following:
K f = K s exp α h
According to the theory of capillary water, infiltration at −3, −6, and −9 cm pressure heads excludes water flows with equivalent radii greater than 0.5, 0.25, and 0.1 mm, respectively. Therefore, the pores are divided into 4 grades: macropores (pore half diameter > 0.5 mm), medium pore 1 (pore radius >0.25~0.5 mm), medium pore 2 (pore radius 0.1~0.25 mm), and small pore (pore half diameter <0.1 mm). The contribution rate of different levels of pores to water flow indicates the water conductivity of each level of pores, which is denoted as φ [36]:
φ = K h f K h f 1 K S × 100 % , ( f = 1,2 , , n )
where f denotes the numerical value of the order of measurement, and K (hf) and K(hf−1) are the soil’s water conductivity under 2 continuous pressure heads, cm/s.
In this experiment, the inner diameter of the infiltration disc was 200 mm; the inner diameter and height of the water storage pipe were 60 mm and 1.07 m, respectively; the height of the negative pressure pipe was 0.7 m; and its inner diameter was 60 mm.

2.4. Soil Sampling

Five replicate samples were collected along an “X”-shaped area in each plot. Soil cores were obtained from each plot using an auger (2.0 cm diameter and 15 cm depth). The vertical sample depths were all the same: 0–10, 10–20, 20–30, and 30–40 cm(Figure 2). The five replicated soil samples were mixed into one sample per treatment in this experiment. The soil bulk density (BD) and soil water content were determined using the soil core method using a cutting ring [37]. All soil samples were air-dried and passed through a 2 mm sieve. The samples were made into an extract of a saturated soil paste by a standard method [38]. The Ece and pH were determined by a conductivity meter (DDSJ-3F; Shanghai Instrument and Electrical Science Instrument Co., Ltd. Shanghai city, China) and a pH meter (PHSJ-3F; Shanghai Instrument and Electrical Science Instrument Co., Ltd. Shanghai city, China), respectively. The average ECe and pH of the whole profile was a weighted average value that took the distance and area as weight factors [39].

2.5. Root Parameters

Four sampling points were set up at a distance of 30 cm from the plant trunk, and the lines of each adjacent sampling point to point (O) were perpendicular to each other, with the location of the trunk as the center point (O) (Figure 2a). Root cores were taken from four soil depths (0 to 10 cm, 10 to 20 cm, 20 to 30 cm, 30 to 40 cm) by using a 10 cm diameter root auger (Figure 2b), and then, the mixed root cores from 4 sample points were placed at the same depth, and 240 root cores were collected. The rhizome samples were rinsed to remove excess soil, followed by a washed sample placed in a ventilated area for drying. After no water droplets were observed on the surfaces, they were used for laboratory determination of rhizome parameters. The rhizome image analysis system Win RHIZO was used to scan and analyze the root parameters of each root sample (including the diameter of a root and root length, surface area, volume, and length density). After scanning, the roots were over-dried at 75 °C to a constant weight, and a tray balance measured the dry weight.

2.6. Statistical Assessment

ANOVA was applied to compare the soil’s porosities, rates of infiltration, and root morphological characteristics under the different treatments. When the data demonstrated variance homogeneity, post hoc Tukey HSD tests were applied to assess multiple pairwise associations among all treatments. Nonlinear regression was applied to assess the association between the infiltration rate and infiltration time. Relationships between the soil water rate of infiltration and root morphological characteristics, between the soil characteristics and root biomass, between the soil water rate of infiltration and soil characteristics, and between the soil characteristics and root volume were assessed using Pearson’s correlation analysis. The present study applied stepwise multiple regression analysis to determine the dominant factors affecting the relationships between the soil’s rate of infiltration and root parameters and the properties of the soil. All statistical assessments were conducted in IBM SPSS Statistics 20.0, with significance assumed at p ≤ 0.05 or p ≤ 0.01.

3. Results

3.1. Characterization of Soil

Table 2 summarizes the main properties of soil at varying depths and under different vegetation types. The BD and SWC were significantly affected by the soil depth and vegetation type (p < 0.05, Table 2), respectively, and the EC was significantly influenced by the vegetation type and soil depth (p < 0.05). Also, there were significant effects of the depth and vegetation types on the EC (p < 0.05). The SWC in SM exceeded those in HC and SV at different soil depths. The lowest value of BD was 1.17 g/cm3, identified in SV at a depth of between 0 and 20 cm. The EC in HC exceeded those in other vegetation types, whereas lower EC values were observed in SM. Except for SV, the SWC value was gradually increased at a 0–40 cm soil depth, and its values of SM and HC increased at a depth of soil of 0–30 cm and then declined with increasing depth, decreasing by 12.93% and 48.02%, respectively. It should be noted that the BD and EC in the three vegetation types were higher below a depth of 30 cm and that the SWC values at a depth of soil of 20–30 cm in the two vegetation types of SM and HC were higher than those at the other three soil depths. The highest SWC (0.43 cm3/cm3) and the lowest EC (1.86 dS/m) were observed in SM at 20–30 cm and 0–10 cm, respectively. Increasing the depth resulted in increases in the EC values of the three vegetation types. This observation was particularly clear in SV, with a significantly higher value than those in other vegetation types. After two years of water and salt regulation, the average pH increased at all depths, although it was not significantly influenced by the soil depth or vegetation types.

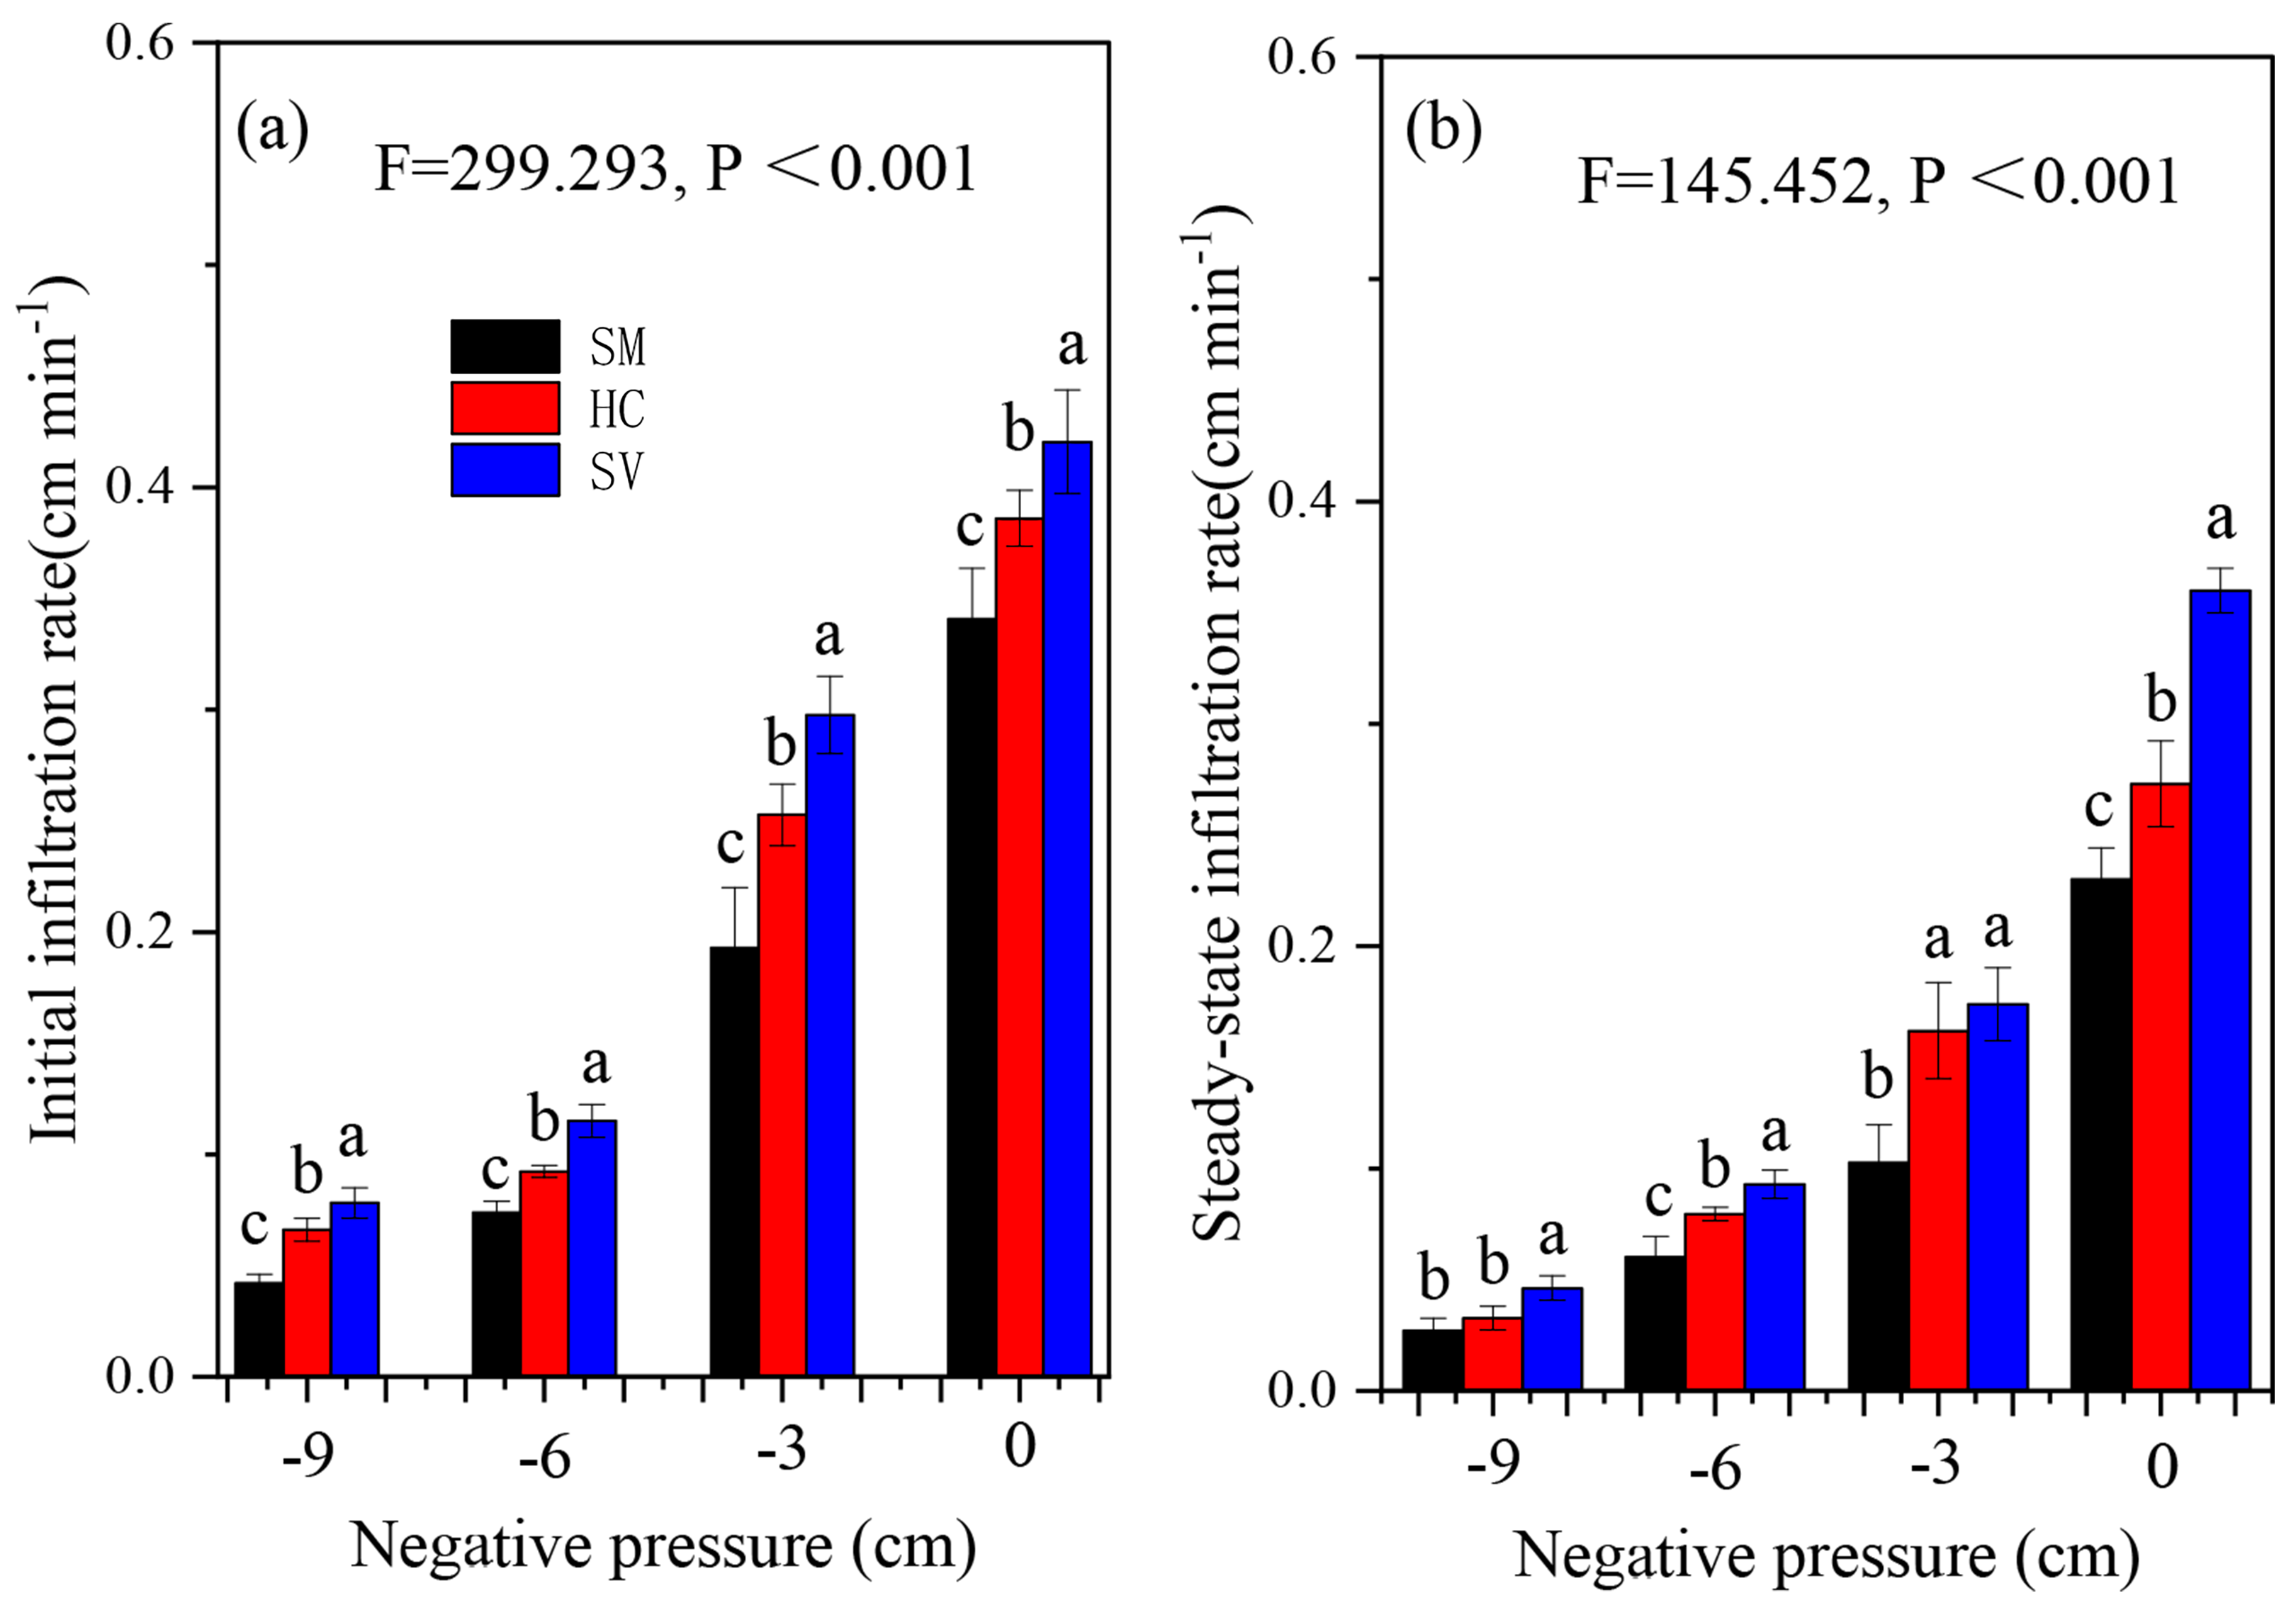
3.2. Infiltration Rate of Soil Water under Different Types of Vegetation

As illustrated in Figure 3, the initial infiltration rate rapidly decreased, followed by stabilization after 15 min. The present study further calculated the IIR and STR for an improved assessment of the capacity for infiltration under different high-pressure heads and types of vegetation, as illustrated in Figure 4. There were significant differences in the rates of infiltration among different types of vegetation (p < 0.05). The ranking of the decrease in IIR and STR was 0, −3, −6, and −9 cm. The IIR and STR of SV were higher in higher heads of pressure of 0 cm than in higher heads of pressure of −9 cm by 710 and 721% (p < 0.01), respectively. The IIR and STR in SV exceeded those in SM and HC. In comparison with those in SV for high-pressure heads of 0 cm, IIR and STR increased by 23.37% (p < 0.01) and 56.52% (p < 0.01) (p < 0.01) in SM and by 8.81% (p < 0.01) and 31.87% (p < 0.01) in HC, respectively.

3.3. Hydraulic Conductivity

The three sets of measurements were pooled for each treatment for the analyses of the possible influences of vegetation types on Gardner α and K. Table 3 shows the soil’s water conduction characteristics under different vegetation types. The soil’s hydraulic conductivity decreased with decreasing heads of pressure. Meanwhile, a Cv value of between 2.6% and 18.19% indicated that the soil’s hydraulic conductivity presented moderate spatial heterogeneity. The average Ks values of SM, HC, and SV exceeded the initial value, reaching 0.12, 0.14, and 0.20 cm/min, respectively. The outcomes of the one-way ANOVA showed significant differences in Gardner α and K (at heads of pressure of 0, −3, −6, and −9 cm) between the three vegetation types. K at higher heads of pressure (0, −3, −6, and −9 cm) increased in the order of SM, HC, and SV, and Gardner α increased in the order of HC, SV, and SM. Furthermore, the mean values for Ks, K3, and K6 for the three types of vegetation exceeded those of K9 by factors of 7.58, 3.84, and 1.96, respectively.

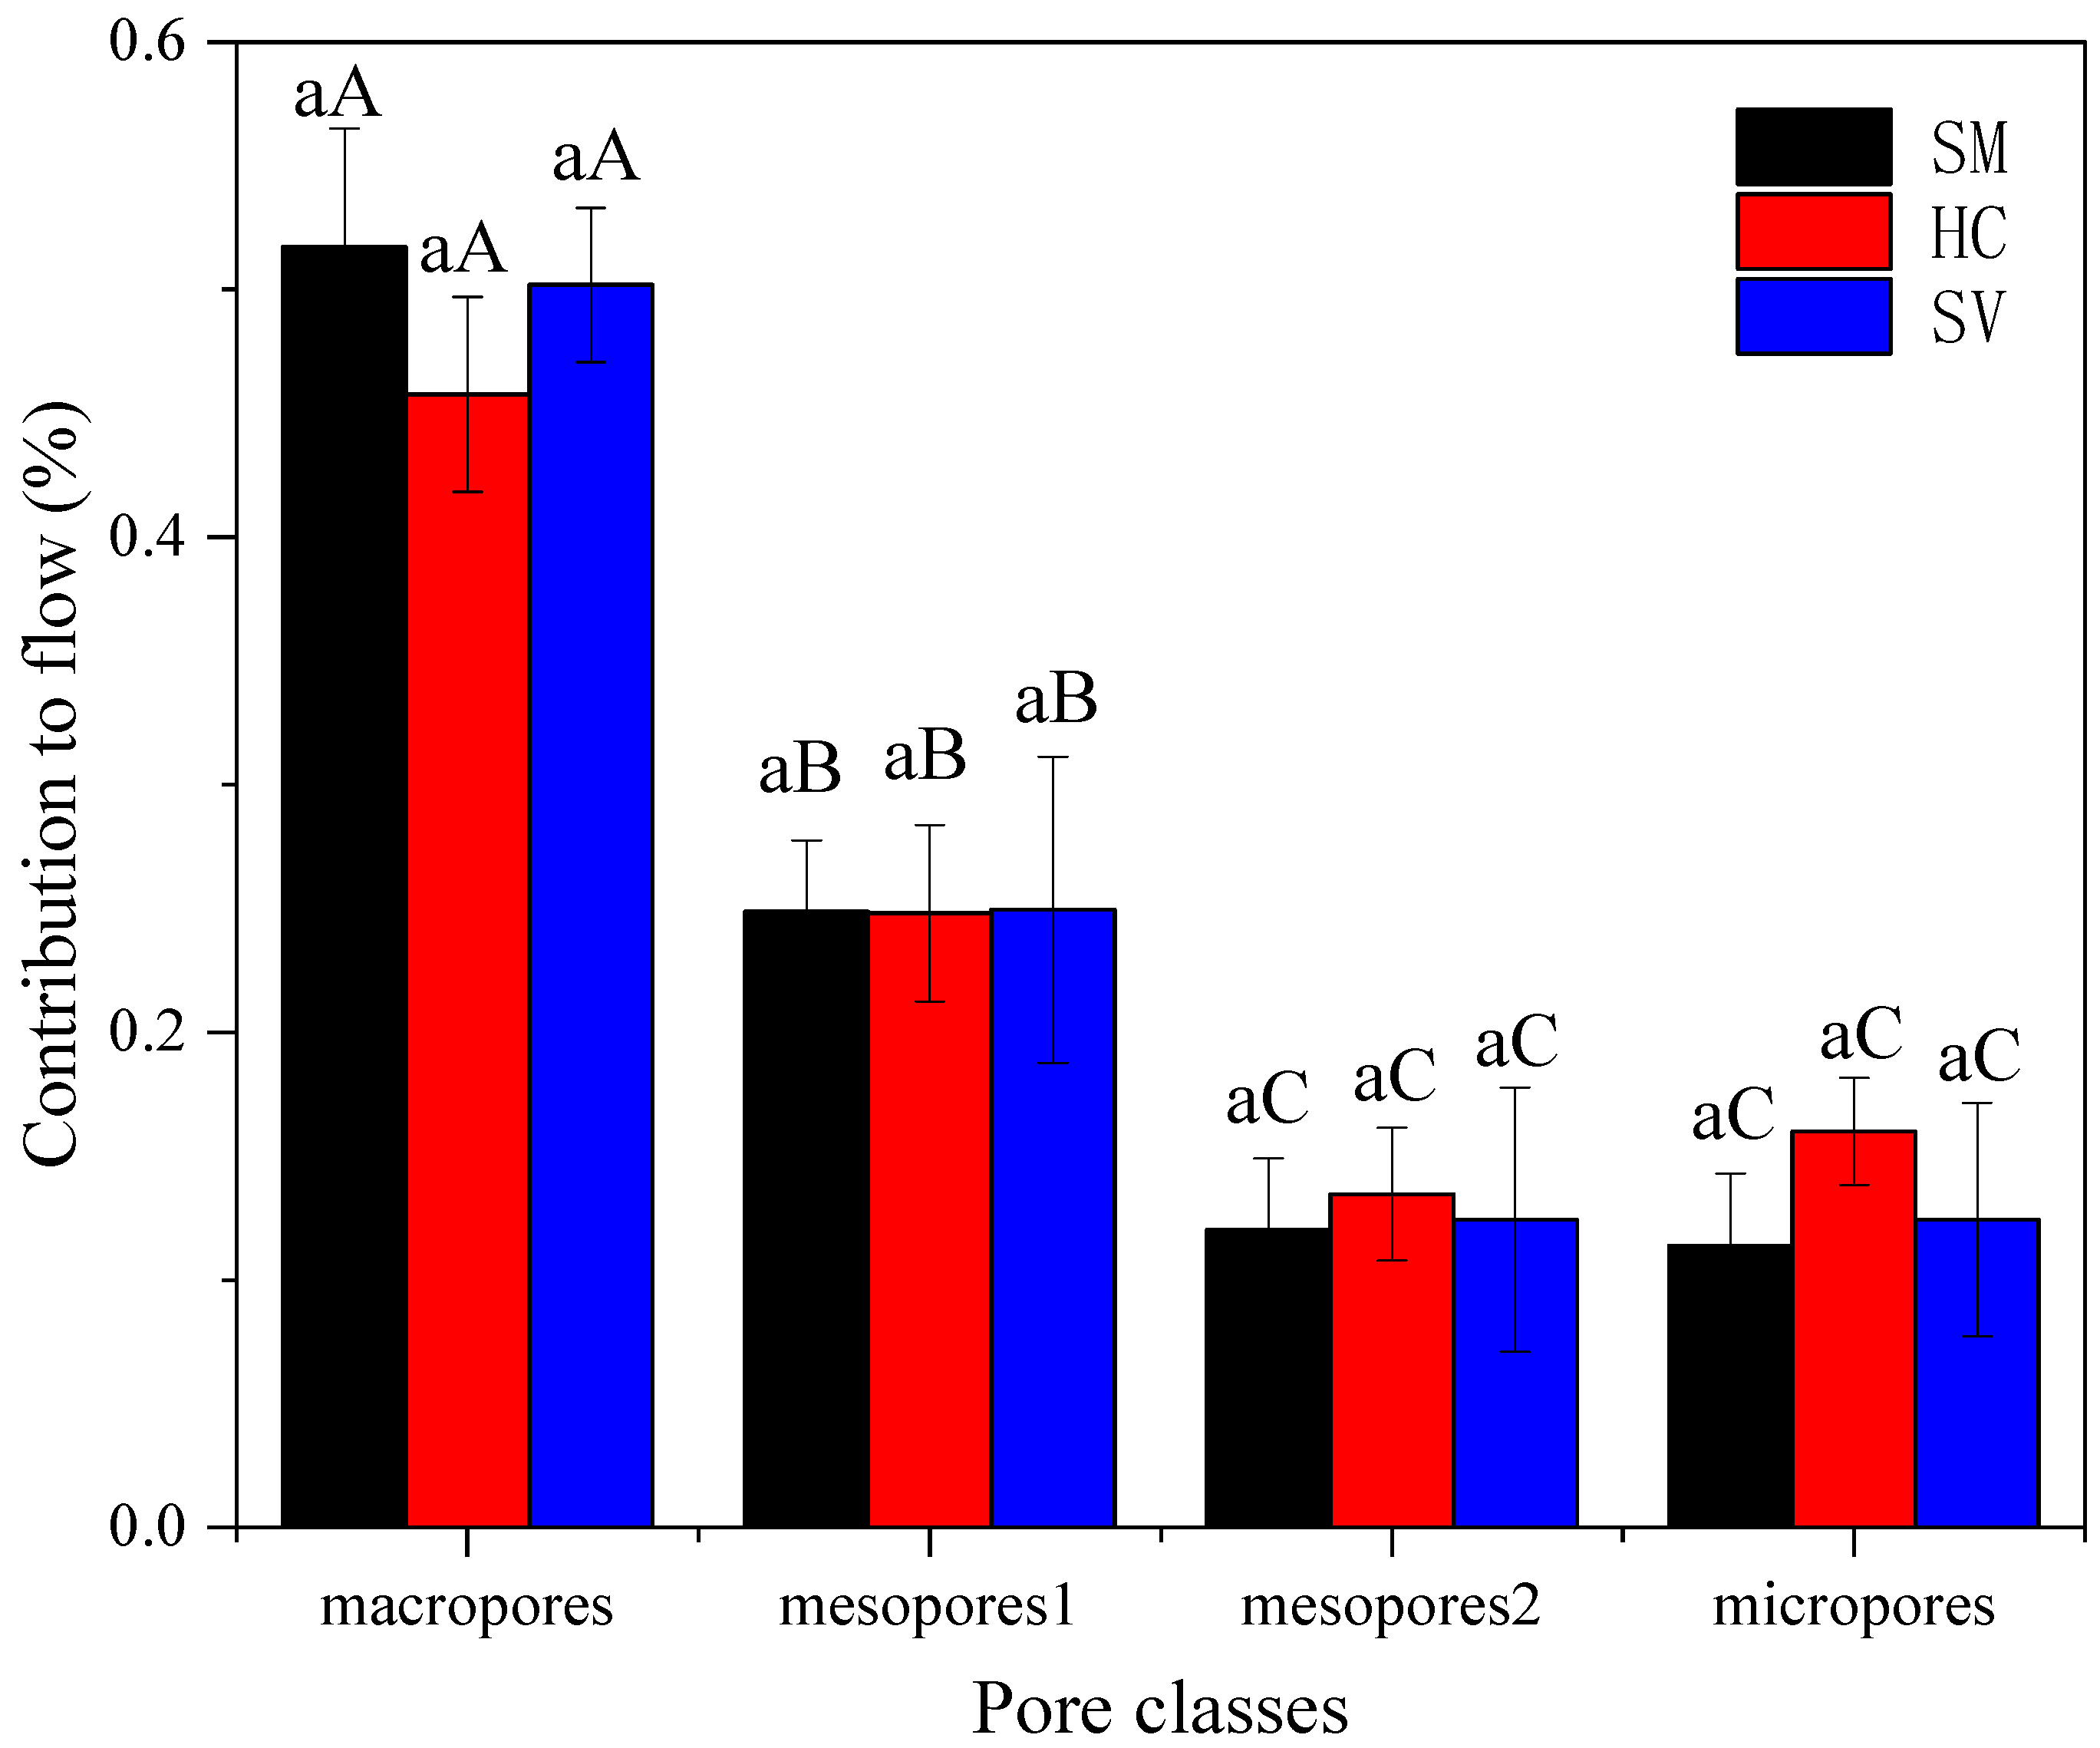
3.4. Impacts of Classes of Pore on Flow

The alterations in K can primarily be attributed to changes in the volume of the soil’s pores and geometry [40]. The influence of each class of pore on the flow of water can also change under different treatments. Figure 5 shows the temporal changes in the contributions of the four classes of pores to the flow of water in the soil for the three types of vegetation, including macropores (>0.5 mm), mesopores 1 (0.5–0.25 mm), mesopores 2 (0.25–0.1 mm), and micropores (<0.1 mm). All three treatments showed similar trends of contributions of proportional classes of pores, i.e., the mean relative proportional contribution of the four pore classes to flow was 4 (macropores): 2 (mesopores1): 1 (mesopores2): 1 (micropores). This indicates a relatively high total flow of water in the macropores, accounting for half of all flow. During the measurement period, the contributions of the macropores and mesopores1 generally decreased in the order of SM, SV, and HC, except for the slight decrease in the contributions of mesopores 2 and micropores in the order of HC, SV, and SM. Post hoc assessments only identified significant differences in the contributions of classes of pores.

3.5. Distribution of Roots and Roots’ Morphological Properties under Different Types of Vegetation

Changes in roots’ morphological properties (root surface area, root mean diameter, density of root length, root volume, and root dry weight) of different vegetation types at different depths of soil are illustrated in Figure 6. The results demonstrated that the root surface area, density of root length, volume of roots, and dry weight of roots showed inverse relationships with the soil depth for all treatments (except for the root average diameter, which was higher at a 20–30 cm soil depth than at 0–20 cm and 30–40 cm). The average root volume and average root dry weight at a depth of soil of 0–20 cm accounted for 68.26% of the total root volume and 61.02% of the total root dry weight, respectively. The outcomes of the one-way ANOVA demonstrated that the vegetation types of HC treatments had higher values of root mean diameter, root surface area, and root volume than the vegetation types of SM and SV treatments at each soil depth interval. The density of the root length for SM exceeded those of the other two types of vegetation (p < 0.05) (Table 4).

3.6. Relationships between Soil’s Rate of Infiltration and Soil and Root Properties

The results of the correlation analyses indicated that under two rates of infiltration at heads of pressure of 0 cm (IIR0 and SIR0), two hydraulic conductivity properties (Ks and α) were primarily negatively correlated with the average values of soil and root properties at depths of soil of 0–40 cm (Figure 7). More specifically, IIR0, SIR0, and Ks showed negative correlations with the SWC, SA, LD, and DW (p < 0.01). In addition, SIR0 and Ks demonstrated inverse correlations with the BD (p < 0.01) and RV (p < 0.05), while α showed inverse relationships with the EC (p < 0.01) and AD (p < 0.05). Except for pH, the soil properties were primarily positively related to root characteristics (p < 0.01). To be specific, the correlations between the SWC, BD SA, LD, and DW were significantly positive. Notably, the EC presented a positive relationship with the SA and AD. In order to further clarify the main factors influencing the soil infiltration process, stepwise multiple regression was applied and showed that the average root dry weight (DW) at depths of soil of 0–40 cm was the most critical factor influencing IIR0, SIR0, and Ks.

4. Discussion

Vegetation rehabilitation is regarded as the primary factor influencing soil’s infiltration properties by altering soil’s physical characteristics [12,41]. Among these, soil’s water content is considered one of the key factors limiting the effects of ecological rehabilitation in saline regions [42]. The results showed the highest content of soil water under trees due to the high-frequency and continuous drip irrigation, resulting in a large total irrigation depth. Additionally, turf protects the surface of soil beneath Salix matsudana, reducing interplant evaporation and increasing the capacity for soil infiltration. Vegetation types have a significant influence on soil’s hydraulic properties, with higher infiltrability under Salix matsudana than under Hibiscus syriacus+grass and Sabina vulgaris +grass (Figure 4). This could principally be attributed to a reduction in the hydraulic gradient by a higher density of bulk soil and increased soil water, thereby decreasing the force driving water infiltration into the soil [43].
All vegetation significantly enhanced the soil-saturated hydraulic conductivity in comparison with initial values. In addition, the initial and steady infiltration rate under different negative pressures varied consistently among the three treatments (Figure 2 and Figure 3). Because of the large gradient of the soil’s matrix potential, the soil’s rate of infiltration remained high during the initial infiltration stage. With the progression of infiltration, the soil’s matrix potential gradient continuously decreased, and the influence on infiltration by the gravity potential gradually increased. The soil’s rate of infiltration showed a significant downward trend and gradually stabilized. At this point, the soil’s matrix potential gradient approached zero, and the soil’s rate of infiltration could be regarded as a stable rate of infiltration of the soil [44]. The initial infiltration rate typically has the highest impact on the leaching stage during initial irrigation stages, and the steady rate of infiltration indicates soil infiltration and soil infiltrability at later states of irrigation [45].
The plant root characterization and water and salt transport mainly influence the hydraulic properties of soil by promoting the development of soil macropores [46]. It is necessary to identify the correlation between the roots’ morphological parameters and soil’s water conductivity in coastal saline areas. The current study found that the rates of the contribution of soil macropores (>0.5 mm) to the flow of water under the three vegetation types, Salix matsudana, Hibiscus syriacus, and Sabina vulgaris, were approximately 50% and exceeded those of other levels of pores (Figure 4). It is confirmed that soil macropores are the preferred channels for the roots of plants [44,46]. Plant roots act precisely on soil’s infiltration capacity by creating macropores of different lengths, architectures, densities, connectivities, and diameters [47]. Roots’ morphological traits such as the density and diameter appear more relevant in their direct effect on runoff, erosion, and drainage via changes in soil’s hydraulic properties [24]. This study drew the same conclusion as the aforementioned one and found that the surface area of roots (SA), the density of root length (LD), and the dry weight of roots (DW) had inverse relationships with the initial infiltration rate at saturated hydraulic conductivity (Ks) (p < 0.01), and the root average diameter (AD) illustrated a positive relationship with the water conductivity at the lower head (Figure 7). Nevertheless, Chen et al. [48] held the view that Ks was significantly correlated with the density of root length but not the root diameter in the acid soil.
Meanwhile, the different effects of the soil’s salinity on the root system determine whether the root diameter is related to the hydraulic conductivity. In the current experiment, the relationship between the root diameter and soil salinity was further explored, and it was found that the soil’s salt content (ECe) could promote the increase in plant root diameter within a certain range (Figure 7). The outcomes of the present study showed that the investigated plants contributed to the restoration of saline soils by increasing the soil’s infiltrability and improving the leaching effect over the entire period.
In conclusion, the coastal saline soil in the experiment is susceptible to clay dispersion and swelling induced by a high SAR, and under the fast wetting by rain or irrigation, it completely seals the soil surface, restricting salt leaching. To create a favorable environment for plant growth, tillage was carried out before the start of the experiment, and we planted suitable halophytes. During the vegetation growth, an increase in the volume of macropores in the soil but a reduction in the volume of mesopores and micropores in the soil were observed, leading to increases in the water content, saturated hydraulic conductivity, soil water diffusivity, and infiltration capacity. While the roots of these halophytes absorb salt ions and reduce the soil’s matrix potential, their growth in the soil also ensures good connectivity of the soil’s macropores and improves the soil’s hydraulic characteristics.

5. Conclusions

In this study, three vegetation types (Salix matsudana, Hibiscus syriacus, and Sabina vulgaris) were examined to assess their impact on the soil characteristics in coastal saline soils. The research focused on differences in K, Gardner α, and vegetation responses to soil properties, as well as the contribution of various pore size classes to water flow. The findings revealed that the soil depth had a significant influence on the bulk density and EC, while the vegetation types played a key role in determining the soil’s water content and EC levels in coastal saline soils. Salix matsudana demonstrated higher infiltration rates compared to Hibiscus syriacus+grass and Sabina vulgaris+grass under varying pressure conditions. When compared to Salix matsudana+grass, both Hibiscus syriacus+grass and Sabina vulgaris showed increased initial and steady infiltration rates at higher pressures. The order of pore classes based on their impact on the water flow was found to be macropores > mesopores1 > mesopores2 > micropores. There was a decrease in root morphological properties with increased soil depth, with these properties being negatively influenced by the soil’s infiltrability. Nevertheless, the weight of the dry roots, density of root length, and root mean diameter were the main factors influencing the soil’s infiltrability. The outcomes of this study can increase our comprehension of the influence of plant roots’ morphological properties on processes of infiltration in vegetation rehabilitation. This study can also increase our understanding of the influence of plant roots on water and salt regulation in the re-vegetation of saline soils through the regulation of salt by drip irrigation. Future studies should focus on other locations and systems to further examine the influences of root properties on soil infiltration.

Author Contributions

All authors listed contributed significantly to this research with the following work: conceptualization, L.C. and Y.K.; data preparation, S.Y.; result analysis, L.C. and S.Y.; paper writing, S.Y.; writing—review and editing, H.S., M.A.E.-T., M.S.S. and Y.A.H.; funding acquisition, D.C. All authors have read and agreed to the published version of the manuscript.

Funding

This research was supported by the Key R&D Plan of Lianyungang City (Grant No. SF2220) and the Researchers Supporting Project (RSPD2024R678), King Saud University, Riyadh, Saudi Arabia.

Data Availability Statement

The data presented in this study are available upon request from the corresponding author. The data are not publicly available due to confidentiality reasons.

Acknowledgments

The authors extend their appreciation to the Key R&D Plan of Lianyungang City (Grant No. SF2220) and the Researchers Supporting Project (RSPD2024R678), King Saud University, Riyadh, Saudi Arabia.

Conflicts of Interest

The authors declare no conflicts of interest.

References

  1. Luo, Y.; Long, X.; Huang, Z.; Liu, L.; Li, Q.; Li, H.; Sun, L.; Liu, Z. Coupling effects of salt and fertilizer application on growth and iron distribution of oil sunflower in coastal mudflat of northern Jiangsu. Soil 2009, 42, 95–100. [Google Scholar]
  2. Akhter, J.; Murray, R.; Mahmood, K.; Malik, K.; Ahmed, S. Improvement of degraded physical properties of a saline–sodic soil by reclamation with kallargrass (Leptochloa fusca). Plant Soil 2004, 258, 207–216. [Google Scholar] [CrossRef]
  3. Li, X.; Kang, Y.; Wan, S.; Chen, X.; Chu, L.; Xu, J. Reclamation of very heavy coastal saline soil using drip—Irrigation with saline water on salt sensitive plants. Soil Tillage Res. 2015, 84, 496–505. [Google Scholar] [CrossRef]
  4. Li, X.; Zhang, C. Effect of natural and artificial afforestation reclamation on soil properties. Catena 2021, 198, 105066. [Google Scholar] [CrossRef]
  5. Chandler, K.; Stevens, C.; Binley, A.; Keith, A. Influence of tree species and forest land use on soil hydraulic conductivity. Geoderma 2018, 310, 120–127. [Google Scholar] [CrossRef]
  6. Stokes, A.; Sotir, R.; Chen, W.; Ghestem, M. Soil bio- and eco-engineering in China: Past experience and future priorities. Ecol. Eng. 2010, 36, 247–257. [Google Scholar] [CrossRef]
  7. Wang, F.; Wang, Z.; Lee, J. Acceleration of vegetation succession on eroded land by reforestation in a subtropical zone. Ecol. Eng. 2007, 31, 232–241. [Google Scholar] [CrossRef]
  8. Zhu, W.; Kang, Y.; Li, X.; Wan, S.; Dong, S. Changes in understory vegetation during the reclamation of saline-alkali soil by drip irrigation for shelterbelt establishment in the Hetao Irrigation Area of China. Catena 2022, 214, 106247. [Google Scholar] [CrossRef]
  9. Li, Y.; Xu, D.; Sa, C.; Wang, X.; Song, K. The study on improvement effect of native species on degraded desert steppe. Chin. J. Grassl. 2022, 44, 36–45. [Google Scholar]
  10. Ali, H.; Reineking, B.; Munkemuller, T. Effects of plant functional traits on soil stability: Intraspecific variability matters. Plant Soil 2017, 411, 359–375. [Google Scholar] [CrossRef]
  11. Huang, Z.; Tian, F.; Wu, G.; Liu, Y.; Dang, Z. Legume grasslands promote precipitation infiltration better than gramineous grasslands in arid regions. Land Degration Dev. 2017, 28, 309–316. [Google Scholar] [CrossRef]
  12. Sun, D.; Yang, H.; Guan, D.; Yang, M.; Wu, J.; Yuan, F.; Jin, C.; Wang, A.; Zhang, Y. The effects of land use change on soil infiltration capacity in China: A meta-analysis. Sci. Total Environ. 2018, 626, 1394–1401. [Google Scholar] [CrossRef] [PubMed]
  13. Van, E.; Boer, H.; Hanegraaf, M.; Bokhorst, J.; Nierop, D.; Bloem, J.; Schouten, T.; Goede, R.; Brussaard, L. Ecosystem services in grassland associated with biotic and abiotic soil parameters. Soil Biol. Biochem. 2010, 42, 1491–1504. [Google Scholar]
  14. Rillig, M.; Aguilar-rigueros, C.; Joana, B.; Erik, V.; Veresoglou, S.; Anika, L. Plant root and mycorrhizal fungal traits for understanding soil aggregation. New Phytol. 2014, 205, 1385–1388. [Google Scholar] [CrossRef] [PubMed]
  15. Freschet, G.; Roumet, C. Sampling roots to capture plant and soil functions. Funct. Ecol. 2017, 31, 1506–1518. [Google Scholar] [CrossRef]
  16. Leung, A.; Garg, A.; Coo, J.; Ng, C.; Hau, B. Effects of the roots of Cynodon dactylon and Schefflera heptaphylla on water infiltration rate and soil hydraulic conductivity. Hydrol. Progresses 2015, 29, 3342–3354. [Google Scholar] [CrossRef]
  17. Cui, Z.; Wu, G.; Huang, Z.; Liu, Y. Fine roots determine soil infiltration potential than soil water content in semi-arid grassland soils. J. Hydrol. 2019, 578, 124023. [Google Scholar] [CrossRef]
  18. Liu, Y.; Guo, L.; Huang, Z.; Lopez-Vicente, M.; Wu, G.L. Root morphological characteristics and soil water infiltration capacity in semi-arid artificial grassland soils. Agric. Water Manag. 2020, 235, 106153. [Google Scholar] [CrossRef]
  19. Wu, G.; Liu, Y.; Yang, Z.; Cui, Z.; Deng, L.; Chang, X.F.; Shi, Z.H. Root channels to indicate the increase in soil matrix water infiltration capacity of arid reclaimed mine soils. J. Hydrol. 2017, 546, 133–139. [Google Scholar] [CrossRef]
  20. Wang, B.; Liu, J.; Li, Z.G.; Morreale, S.J.; Schneider, R.L.; Xu, D.M.; Lin, X.K. The contributions of root morphological characteristics and soil property to soil infiltration in a reseeded desert steppe. Catena 2023, 225, 107020. [Google Scholar] [CrossRef]
  21. Jotisankasa, A.; Sirirattanachat, M. Effects of grass roots on soil-water retention curve and permeability. Can. Geotech. J. 2017, 54, 1612–1622. [Google Scholar] [CrossRef]
  22. Archer, N.; Quinton, J.; Hess, T. Below-ground relationships of soil texture, roots and hydraulic conductivity in two-phase mosaic vegetation in South-east Spain. J. Arid. Environ. 2002, 52, 535–553. [Google Scholar] [CrossRef]
  23. Thompson, S.; Harman, C.; Heine, P.; Katul, G. Vegetation-infiltration relationships across climatic and soil type gradients. J. Geophys. Res.-Biogeosci. 2010, 115, 1–12. [Google Scholar]
  24. Yu, Y.; Loiskandl, W.; Kaul, H.; Peter, M.; Himmelbauer, W.; Wei, L.; Chen, G. Estimation of runoff mitigation by morphologically different cover crop root systems. J. Hydrol. 2016, 538, 667–676. [Google Scholar] [CrossRef]
  25. Eldridge, D.; Wang, L.; Ruiz-Colmenero, M. Shrub encroachment alters the spatial patterns of infiltration. Ecohydrology 2015, 8, 83–93. [Google Scholar] [CrossRef]
  26. Song, L.; Li, J.; Zhou, T.; Fredlund, D. Experimental study on unsaturated hydraulic properties of vegetated soil. Ecol. Eng. 2017, 103, 207–216. [Google Scholar] [CrossRef]
  27. Bodner, G.; Leitner, D.; Kaul, H. Coarse and fine root plants affect pore size distributions differently. Plant Soil 2014, 380, 133–151. [Google Scholar] [CrossRef] [PubMed]
  28. Wu, G.; Yang, Z.; Cui, Z.; Liu, Y.; Fang, N.; Shi, Z. Mixed artificial grasslands with more roots improved mine soil infiltration capacity. J. Hydrodyn. 2016, 535, 54–60. [Google Scholar] [CrossRef]
  29. Wu, G.; Cui, Z.; Huang, Z. Contribution of root decay process on soil infiltration capacity and soil water replenishment of planted forestland in semi-arid regions. Geoderma 2021, 404, 115289. [Google Scholar] [CrossRef]
  30. Vergani, C.; Graf, F. Soil permeability, aggregate stability and root growth: A pot experiment from a soil bioengineering perspective. Ecohydrology 2016, 9, 830–842. [Google Scholar] [CrossRef]
  31. Demenois, J.; Carriconde, F.; Rey, F.; Stokes, A. Tropical plant communities modify soil aggregate stability along a successional vegetation gradient on a Ferralsol. Ecol. Eng. 2017, 109, 161–168. [Google Scholar] [CrossRef]
  32. Perroux, K.; White, I. Designs for disc permeameters. Soil Sci. Soc. Am. J. 1988, 52, 1205–1215. [Google Scholar] [CrossRef]
  33. Angulo-Jaramillo, R.; Vandervaere, J.; Roulier, S.; Thony, J.; Gaudet, J.; Vauclin, M. Field measurement of soil surface hydraulic properties by disc and ring infiltrometers: A review and recent developments. Soil Tillage Res. 2000, 55, 1–29. [Google Scholar] [CrossRef]
  34. Sun, J.; Kang, Y.; Hu, W. Effect of water and salt regulations under drip irrigation on soil hydraulic properties in local coastal saline soil. Trans. CSAE 2012, 28, 107–112. [Google Scholar]
  35. Wooding, R. Steady infiltration from a circular shallow circular pond. Water Resour. Res. 1968, 4, 1259–1273. [Google Scholar] [CrossRef]
  36. Watson, K.; Luxmoore, R. Estimating macroporosity in a forest watershed by use of a tension infiltrometer. Soil Sci. Soc. Am. J. 1986, 50, 578–582. [Google Scholar] [CrossRef]
  37. De Vos, B.; Van Meirvenne, M.; Quataert, P.; Deckers, J.; Muys, B. Predictive quality of pedotransfer functions for estimating bulk density of forest soils. Soil Sci. Soc. Am. J. 2005, 69, 500–510. [Google Scholar] [CrossRef]
  38. Robbins, C.; Wiegand, C. Field and laboratory measurements. In Agricultural Salinity Assessment and Management; Wallender, W.W., Tanji, K.K., Eds.; American Society of Civil Engineers: New York, NY, USA, 1990; pp. 203–219. [Google Scholar]
  39. Dong, S.; Wan, S.; Kang, Y.; Li, X. Prospects of using drip irrigation for ecological conservation and reclaiming highly saline soils at the edge of Yinchuan Plain. Agric. Water Manag. 2020, 239, 106255. [Google Scholar] [CrossRef]
  40. Hu, W.; Shao, M.; Wang, Q.; Fan, J.; Horton, R. Temporal changes of soil hydraulic properties under different land uses. Geoderma 2009, 149, 355–366. [Google Scholar] [CrossRef]
  41. Yimer, F.; Messing, I.; Ledin, S.; ABdelkadir, A. Effects of different land use types on infiltration capacity in a catchment in the highlands of Ethiopia. Soil Use Manag. 2008, 24, 344–349. [Google Scholar] [CrossRef]
  42. Guo, F.; Wang, Y.; Hou, T.; Zhang, L.; Mu, Y.; Wu, F. Variation of soil moisture and fine roots distribution adopts rainwater collection, infiltration promoting and soil anti-seepage system (RCIP-SA) in hilly apple orchard on the Loess Plateau of China. Agric. Water Manag. 2021, 244, 106573. [Google Scholar] [CrossRef]
  43. Liu, H.; Lei, T.; Zhao, J.; Yuan, C.; Fan, Y.; Qu, L. Effects of rainfall intensity and antecedent soil water content on soil infiltrability under rainfall conditions using the run off-on-out method. J. Hydrol. 2011, 396, 24–32. [Google Scholar] [CrossRef]
  44. She, D.; Liu, Y.; Yu, S.; Gao, X.; Zhen, J. Comparison of Soil Hydraulic Properties under Different Land Use Pattern. Trans. Chin. Soc. Agric. Mach. 2014, 45, 175–186. [Google Scholar]
  45. Huang, Z.; Sun, L.; Liu, Y.; Liu, Y.; Lopez-Vicente, M.; Wei, X.; Wu, G. Alfalfa planting significantly improved alpine soil water infiltrability in the QinghaiTibetan Plateau. Agric. Ecosyst. Environ. 2019, 285, 106606. [Google Scholar] [CrossRef]
  46. Kalkhajeh, Y.K.; Huang, B.; Hu, W. The relation of preferential flow pathways to phosphorus leaching from typical plastic shed vegetable production soils of China. Agric. Ecosyst. Environ. 2021, 307, 107218. [Google Scholar] [CrossRef]
  47. Doussan, C.; Pagès, L. Water Uptake by Plants. Soils as a Key Component of the Critical Zone 3. Soils Water Circ. 2018, 3, 85–119. [Google Scholar]
  48. Chen, J.; Wu, Z.; Zhao, T.; Yang, H.; Long, Q.; He, Y. Rotation crop root performance and its effect on soil hydraulic properties in a clayey Utisol. Soil Tillage Res. 2021, 213, 105136. [Google Scholar] [CrossRef]
Figure 1. Location of inset map of studied plot, photo of ecosystems, and picture of soil.
Land 13 00849 g001
Figure 2. Plan view of the sample plot, including information on the soil and root core collection locations (a); a three-dimensional view of subplot a, including information on the sample plot survey and sampling depth (b).
Land 13 00849 g002
Figure 3. Variation in infiltration rate with time for Salix matsudana-grass (SM), Hibiscus syriacus-grass (HC), and Sabina vulgaris (SV).
Land 13 00849 g003
Figure 4. Comparison of different infiltration parameters among Salix matsudana-grass (SM), Hibiscus syriacus-grass (HC), and Sabina vulgaris (SV). Different lower-case letters above bars indicate significant differences (p < 0.01) among plant species under the same negative pressure.
Land 13 00849 g004
Figure 5. Changes in the contribution of each class of pore to flow under three vegetation types. The same lowercase letters in the same pore class indicate a significant difference at p < 0.05. Different capital letters in the same column under the same vegetation restoration type indicate a significant difference at p < 0.05.
Land 13 00849 g005
Figure 6. Changes in root characteristics of different vegetation types at different soil depths. (a) root surf area; (b) root average diameter; (c) root length density; (d) root volume; (e) root dry weight.
Land 13 00849 g006
Figure 7. Pearson correlations for infiltration rates, soil physical properties, and plant root characteristics. IIR0 and IIR9, initial infiltration rate at pressure heads of 0 cm and 9 cm, respectively; SIR0 and IIR9, steady infiltration rate at pressure heads of 0 cm and 9 cm, respectively; Ks, saturated hydraulic conductivity; K9, hydraulic conductivity at pressure heads of 9 cm; BD, soil bulk density matter; SWC, soil moisture content; EC, soil electric conductivity; SA, root surface area; AD, root average diameter; LD, root length density; RV, root volume; DW, root dry weight. Indicated values represent the correlation coefficients. The blue color indicates a positive correlation, and the red color indicates a negative correlation at significant levels of * p < 0.05, ** p < 0.01, and *** p < 0.001.
Land 13 00849 g007
Table 1. Physical and chemical properties of experimental soil.
Soil Depth
(cm)
Particle Composition (%)Soil TextureECe
(dS/m)
pHSAR
(mmol/L)0.5
Organic Matter
(g/kg)
<0.002 mm0.002–0.05 mm0.05–2 mm
0–100.1174.4325.46Silt loam27.057.7919.4811.00
10–200.1177.4122.48Silt loam29.307.8022.0110.22
20–400.0875.0524.87Silt loam32.657.7521.277.37
40–600.0875.2224.70Silt loam27.107.8019.034.52
60–1000.1575.6624.19Silt loam30.307.8920.932.79
Table 2. Characteristics of soil at different depths and for different vegetation types.
Depth (cm)Plant SpeciesBD (g/cm3)SWC (cm3/cm3)EC (dS/m)pH
0–10SM1.29 (0.03)cA0.37 (0.02)bA1.86 (0.11)cB8.302 (0.29)aA
HC1.21 (0.02)cAB0.26 (0.03)bB3.24 (0.12)cA8.218 (0.31)aA
SV1.17 (0.05)cAB0.21 (0.03)bC2.79 (0.25)cB8.176 (0.21)aA
10–20 cmSM1.32 (0.03)cA0.40 (0.04)abA2.07 (0.24)bcB8.278 (0.34)aA
HC1.24 (0.03)cAB0.31 (0.05)abB4.56 (0.62)bcA8.17 (0.26)aA
SV1.21 (0.05)cB0.28 (0.03)abC3.03 (0.10)bcB8.026 (0.32)aA
20–30 cmSM1.38 (0.03)bA0.43 (0.02)aA3.27 (0.27)abB8.188 (0.20)aA
HC1.37 (0.04)bAB0.41 (0.06)aB6.56 (0.27)abA8.028 (0.21)aA
SV1.26 (0.06)bB0.30 (0.03)aC3.31 (0.14)abB8.066 (0.37)aA
30–40 cmSM1.43 (0.05)aA0.42 (0.02)abA3.56 (0.11)aB8.284 (0.23)aA
HC1.39 (0.04)aAB0.38 (0.05)abB6.99 (0.40)aA8.034 (0.15)aA
SV1.35 (0.03)aAB0.31 (0.02)abC3.54 (0.25)aB8.036 (0.42)aA
Summary of ANOVA (p values)
Depth0.001 **0.1120.000 **0.805
Vegetation types0.027 0.000 **0.000 **0.338
Depth × vegetation types0.0900.7180.000 **0.719
Note: Entries in bold indicate the highest value among three vegetation types. The underlined entries indicate the highest value among the four depths. Different capital letters in the same column under the same vegetation type indicate a significant difference at p < 0.05. Different lowercase letters in the same column under the same depth indicate a significant difference at p < 0.05. ** means significant differences at the level of 0.01; BD, soil bulk density; SWC, soil water content; EC, soil electric conductivity.
Table 3. Soil’s water conduction characteristics under different vegetation types.
Vegetation TypesKMinimum ValueMaximum ValueMean ValueCV %
SMKs0.13870.16880.1495c8.11
K30.06490.07820.0720c8.00
K60.02830.04040.0349c12.34
K90.01240.02080.0169b18.19
α0.22040.27640.2434a9.84
HCKs0.15220.19170.1707b9.16
K30.08560.10350.0924b7.49
K60.04810.05590.0501b6.55
K90.02560.03020.0272a6.70
α0.19200.21380.2040b4.71
SVKs0.21750.24210.2317a4.41
K30.11130.11770.1153a2.60
K60.05430.06370.0574a6.54
K90.02610.03450.0287a11.65
α0.20460.24360.2326a6.91
Note: Different lowercase letters in the same column indicate a significant difference at p < 0.05.
Table 4. Root-related parameters of different vegetation types at different soil depths.
TypesDepth
(cm)
SA (cm2)AD (mm)LD (cm/cm3)RV (cm3)DW (Kg/m3)
SM0–1042.2 ± 7.7a0.4 ± 0.1a0.5 ± 0.0a0.4 ± 0.1b0.4 ± 0.1a
10–2042.2 ± 8.5a0.3 ± 0.1a0.6 ± 0.0a0.3 ± 0.1b0.3 ± 0.0b
20–3030.2 ± 5.4a0.4 ± 0.1b0.3 ± 0.0a0.3 ± 0.1a0.4 ± 0.1a
30–4015.7 ± 1.3b0.3 ± 0.0a0.2 ± 0.0b0.1 ± 0.0b0.2 ± 0.0a
HC0–1049.5 ± 8.3a0.4 ± 0.1a0.5 ± 0.0a0.5 ± 0.1a0.3 ± 0.0b
10–2046.6 ± 5.6a0.5 ± 0.2a0.4 ± 0.0b0.6 ± 0.1a0.4 ± 0.0a
20–3027.5 ± 5.5a0.5 ± 0.1a0.3 ± 0.0b0.3 ± 0.1a0.2 ± 0.0b
30–4020.4 ± 4.3a0.3 ± 0.1a0.3 ± 0.0a0.2 ± 0.0a0.2 ± 0.1b
SV0–1021.8 ± 5.3b0.4 ± 0.1a0.2 ± 0.0b0.3 ± 0.1c0.1 ± 0.0c
10–2020.2 ± 4.9b0.5 ± 0.1a0.2 ± 0.0c0.2 ± 0.1b0.1 ± 0.0c
20–308.8 ± 1.1b0.4 ± 0.1ab0.1 ± 0.0c0.1 ± 0.0b0.1 ± 0.0c
30–406.2 ± 0.7c0.4 ± 0.1a0.1 ± 0.0c0.1 ± 0.0c0.1 ± 0.0c
Note: Different lowercase letters in the same column under the same depth indicate a significant difference at p < 0.05. SA, root surface area; AD, root average diameter; LD, root length density; RV, root volume; DW, root dry weight.
Disclaimer/Publisher’s Note: The statements, opinions and data contained in all publications are solely those of the individual author(s) and contributor(s) and not of MDPI and/or the editor(s). MDPI and/or the editor(s) disclaim responsibility for any injury to people or property resulting from any ideas, methods, instructions or products referred to in the content.

