Article

Research on the Impact of Agricultural Socialization Services on the Ecological Efficiency of Agricultural Land Use

College of Public Administration, Huazhong Agricultural University, Wuhan 430070, China
*
Author to whom correspondence should be addressed.
Land 2024, 13(6), 853; https://doi.org/10.3390/land13060853
Submission received: 8 May 2024 / Revised: 4 June 2024 / Accepted: 12 June 2024 / Published: 14 June 2024
(This article belongs to the Topic Low Carbon Economy and Sustainable Development)

Abstract

:
This study intends to build a theoretical mechanism of agricultural socialization services for the eco-efficiency of agricultural land use from two paths, namely the agricultural division of labor and technological progress, and empirically calibrate the Tobit model based on the data of the China Family Tracking Survey (CFPS) for 4453 farming households in 23 provinces (autonomous regions and municipalities) across China. The results of the study show the following: (1) Agricultural socialization services can significantly improve the eco-efficiency of agricultural land use. (2) Hired labor services are more likely to promote eco-efficiency in agricultural land use than farm machinery leasing, especially in major food-producing areas; however, in non-major food-producing areas, the effectiveness of farm machinery leasing services is limited or affected by regional policy differences. (3) In the analysis of the mechanism of agricultural socialization services on the eco-efficiency of agricultural land use, the division of labor in agriculture plays an intermediary role, and the intermediary effect accounts for about 11.4%; however, there is a masking effect of technological progress. This means that China should further develop the role of agricultural socialized services in promoting the ecological efficiency of agricultural land use by developing agricultural socialized service organizations, accelerating the integration of farmers into the modern agricultural division of labor, and promoting the application of green agricultural machinery, among other measures.

1. Introduction

Green development has become a global consensus and is a key factor and inevitable choice for realizing high-quality development [1,2,3]. In the past few decades, China’s agricultural economy has accomplished great achievements and contributed greatly to guaranteeing world food security [4,5,6]. However, the basic national situation of a large country with many small farmers has led to the long-term dependence of China’s agricultural production on high-intensity inputs of production materials such as pesticides, agricultural films, and chemical fertilizers, which has already caused serious damage to the ecological environment and food safety and impeded the sustainable development of agriculture [7,8]. Therefore, it is necessary to introduce a third-party organization to establish a perfect service mechanism to promote the synergy between the government, the market and small farmers, in order to enhance the efficiency of green agricultural production and achieve sustainable agricultural development [6,9]. In the face of the double pressure of resource constraints and environmental damage, agricultural socialization services (referring to a network system formed by agricultural-related economic organizations to meet the needs of the development of agricultural production and provide various services for business entities directly engaged in agricultural production. They are a form of socialized agricultural economic organization that use the strengths of all aspects of society to adapt various types of agricultural production and management units to the needs of the market economy to overcome the drawbacks caused by their own small scale and obtain the benefits of specialization, the division of labor and the scale of intensive services.) have become an effective path for small farmers to connect to modern agriculture through single-segment, multi-segment, or even whole-process agricultural trusteeship models, elucidating whether and how they affect the eco-efficiency of agricultural land use, which is of great theoretical and practical significance for improving farmers’ incomes, changing the mode of agricultural production, and promoting the modernization of agriculture with Chinese characteristics [10,11].
At present, scholars at home and abroad have carried out extensive research on agro-ecological efficiency, mainly focusing on the construction of evaluation indexes, the analysis of spatio-temporal characteristics, the excavation of influencing factors, the analysis of convergence, and so on [12,13,14,15,16,17]; in terms of research scale, it can be divided into the macro perspective, the meso perspective and the micro perspective, and there is a tendency to gradually develop to the micro scale [18,19,20,21]. In terms of research methodology, the DEA model, the SBM model, the super-efficient SBM model, stochastic frontier analysis, ecological footprint [22,23,24,25,26] and other methods are commonly used for measurement. In recent years, with the rapid development of agricultural socialized services, more and more scholars have begun to focus on how to enhance agricultural green productivity through agricultural socialized services. For example, some scholars believe that agricultural socialized services can effectively replace family labor, reduce the ineffective inputs of pesticides and chemical fertilizers, increase food yields and then promote agricultural green production [27,28,29,30]. Some scholars have also further studied the mechanism of the impact of agricultural socialized services on agricultural production efficiency, the results show that agricultural socialized services mainly enhance agricultural green productivity through the intermediary effect of technological progress, and the intermediary effect of technological progress will be more significant with the increase in the participation of farmers [6]. In addition, there are scholars who use input–output and utility theory perspectives to analyze the impact of socialized services on agricultural green productivity, and the results show that the effect of socialized services on agricultural green development is complex and nonlinear, and there is a threshold effect [10].
Existing research affirms the impact of agricultural socialization services on agricultural green productivity, but the measurement of agricultural socialization services is inconsistent, mostly using the decision whether to adopt agricultural socialization services to qualitatively characterize, while neglecting the quantitative expression of the variability of agricultural production links in the whole chain of socialization services. Moreover, the impact of agricultural socialization services on eco-efficiency may be long-term in nature. However, current studies may focus more on short-term effects and less on long-term effects. In addition, most of the previous studies used micro research data to analyze whether the adoption of socialized services by farmers in a specific region has an effect on their farmland use efficiency without considering it at the national scale, ignoring inter-regional variability, mostly using a single pathway to analyze the effect of agricultural socialized services on the eco-efficiency of farmland use, whose theoretical mechanism is not clear. In view of this, this study intends to use agricultural machinery leasing services and hired labor services to characterize agricultural socialization services and build the theoretical mechanism of agricultural socialization services on the ecological efficiency of agricultural land use from two pathways for the agricultural division of labor and technological progress, as well as further use the Chinese Family Tracking Survey (CFPS) data on 4453 farming households in 23 provinces (autonomous regions and municipalities) collected nationwide in 2014, 2016 and 2018 to conduct an empirical calibration, with a view to enriching theoretical research on the agricultural economy and providing a decision-making reference for green agricultural production.

2. Materials and Methods

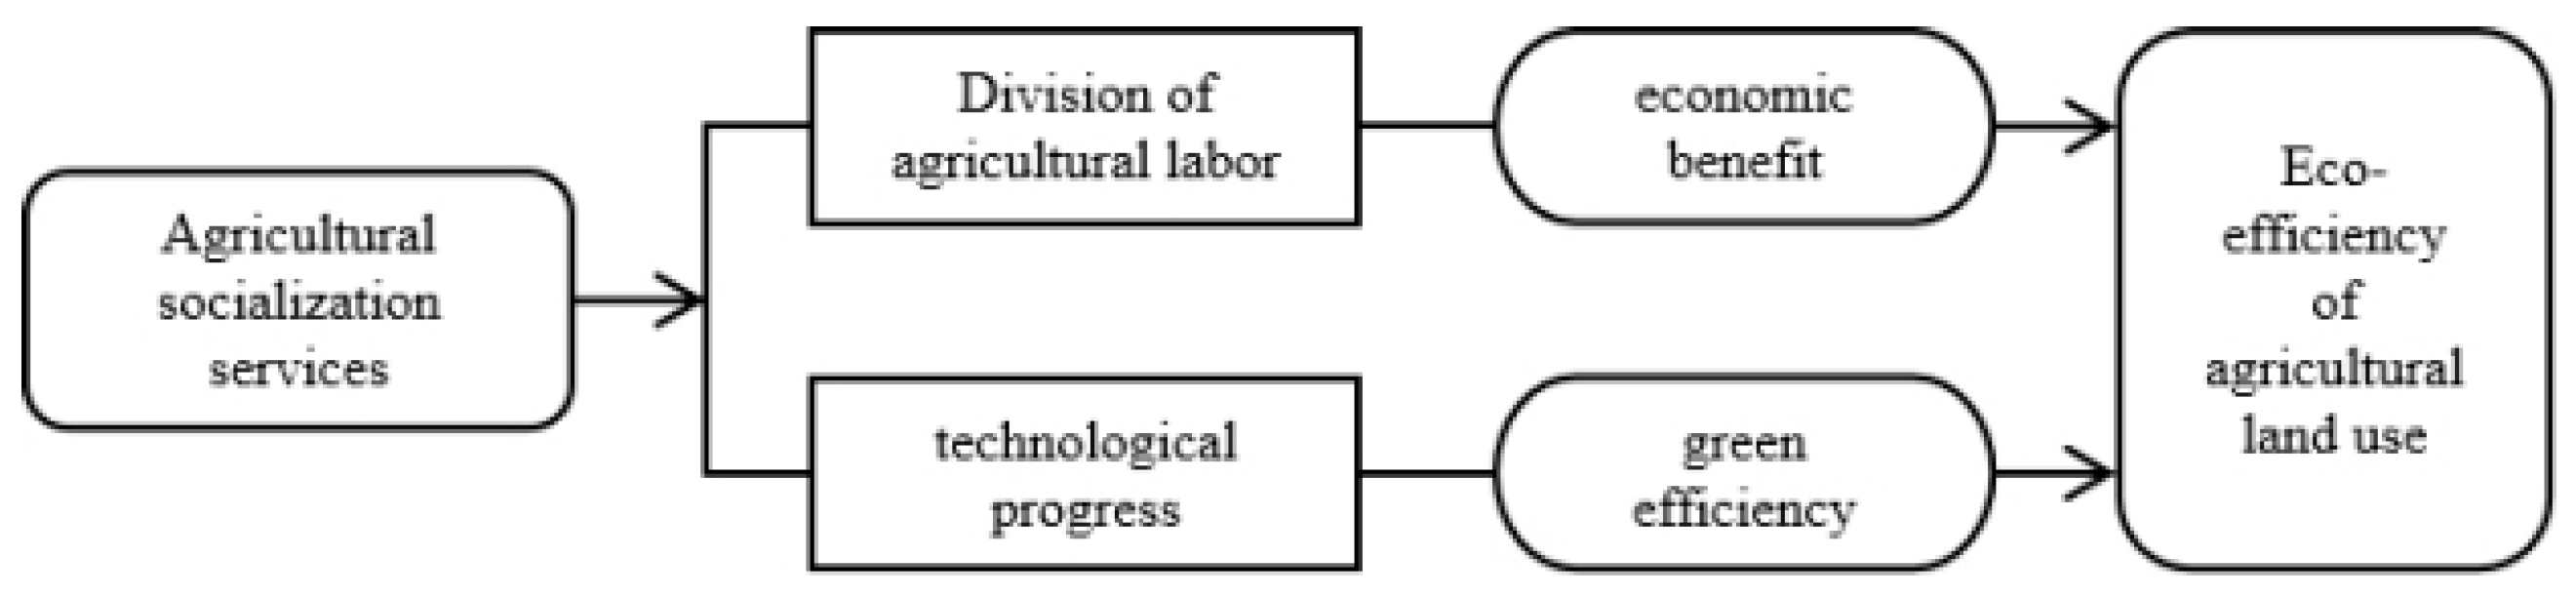
2.1. Theoretical Analysis and Hypotheses

This study intends to construct a theoretical logical framework of agricultural socialized services affecting the ecological efficiency of agricultural land use from the dual perspectives of the agricultural division of labor and technological progress (Figure 1). On one hand, agricultural socialized services break the restriction of farmers’ resource endowment in land-scale operations through the agricultural division of labor, effectively alleviate labor and technology constraints, and realize reasonable matching between its own elements and external elements [31,32,33,34,35] (The division of labor in agriculture refers to the fact that, on the basis of the social division of labor, different regions develop their own distinctive agricultural production according to their own unique conditions and exchange commodities between regions. The agricultural division of labor mainly includes the horizontal and vertical division of labor. The horizontal division of labor allows farmers to concentrate on a particular crop, thereby gaining expertise and increasing their competitiveness. The vertical division of labor, on the other hand, refers to the separation of some farmers to specialize in pre-production, in-production and post-production services for agricultural production, which facilitates the advancement of know-how and technology in that segment, as well as institutional innovation and development.). On the other hand, agricultural socialization services achieve pesticide and fertilizer reduction and use efficiency through technological progress and enhance the Green efficiency of agricultural land use [36,37,38] (Green efficiency comes from the “ISO14000 series of international standards on environmental management organized by the ISO”, which highlights the meaning of “efficiency”, which can be understood as efficiency and performance. Green efficiency is the ability to protect the ecological environment and improve the coordination of the ecological environment, as well as to reduce the load and impact on the environment).

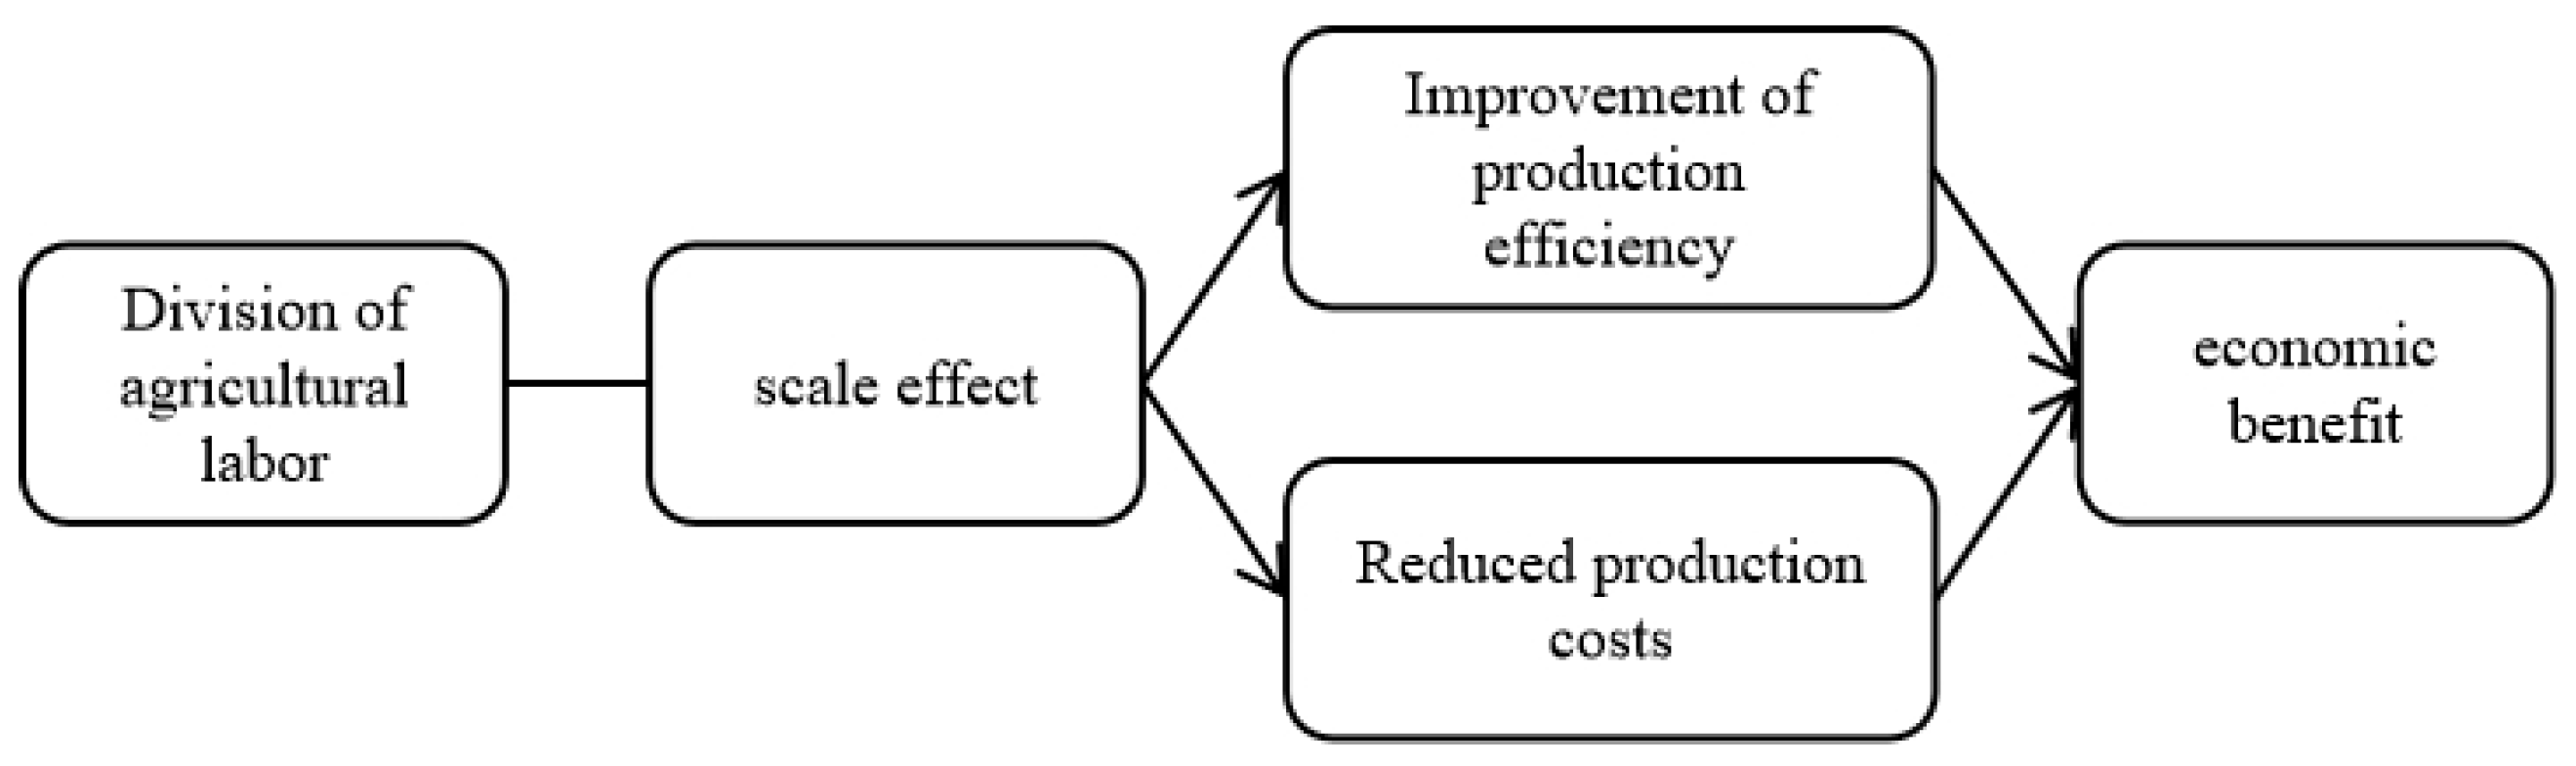
2.1.1. Ways in Which the Division of Labor in Agriculture Affects the Realization of Economic Efficiency

Marshall elaborated the formation path of economies of scale in Principles of Economics. Internal economies of scale involve the optimal use of resources within enterprise to achieve economic efficiency; external economies of scale, on the other hand, rely on the division of labor between enterprises and the optimization of geographical layout. These two paths together constitute the main formation mechanism of the scale economy and have explanatory power for a wide range of economic phenomena. In the field of agriculture, this theory is also applicable. Rural land transfer promotes the formation of internal and external economies of scale by optimizing resource allocation and enhancing production efficiency. There are two main ways in which the division of production among farmers affects economic efficiency (Figure 2).
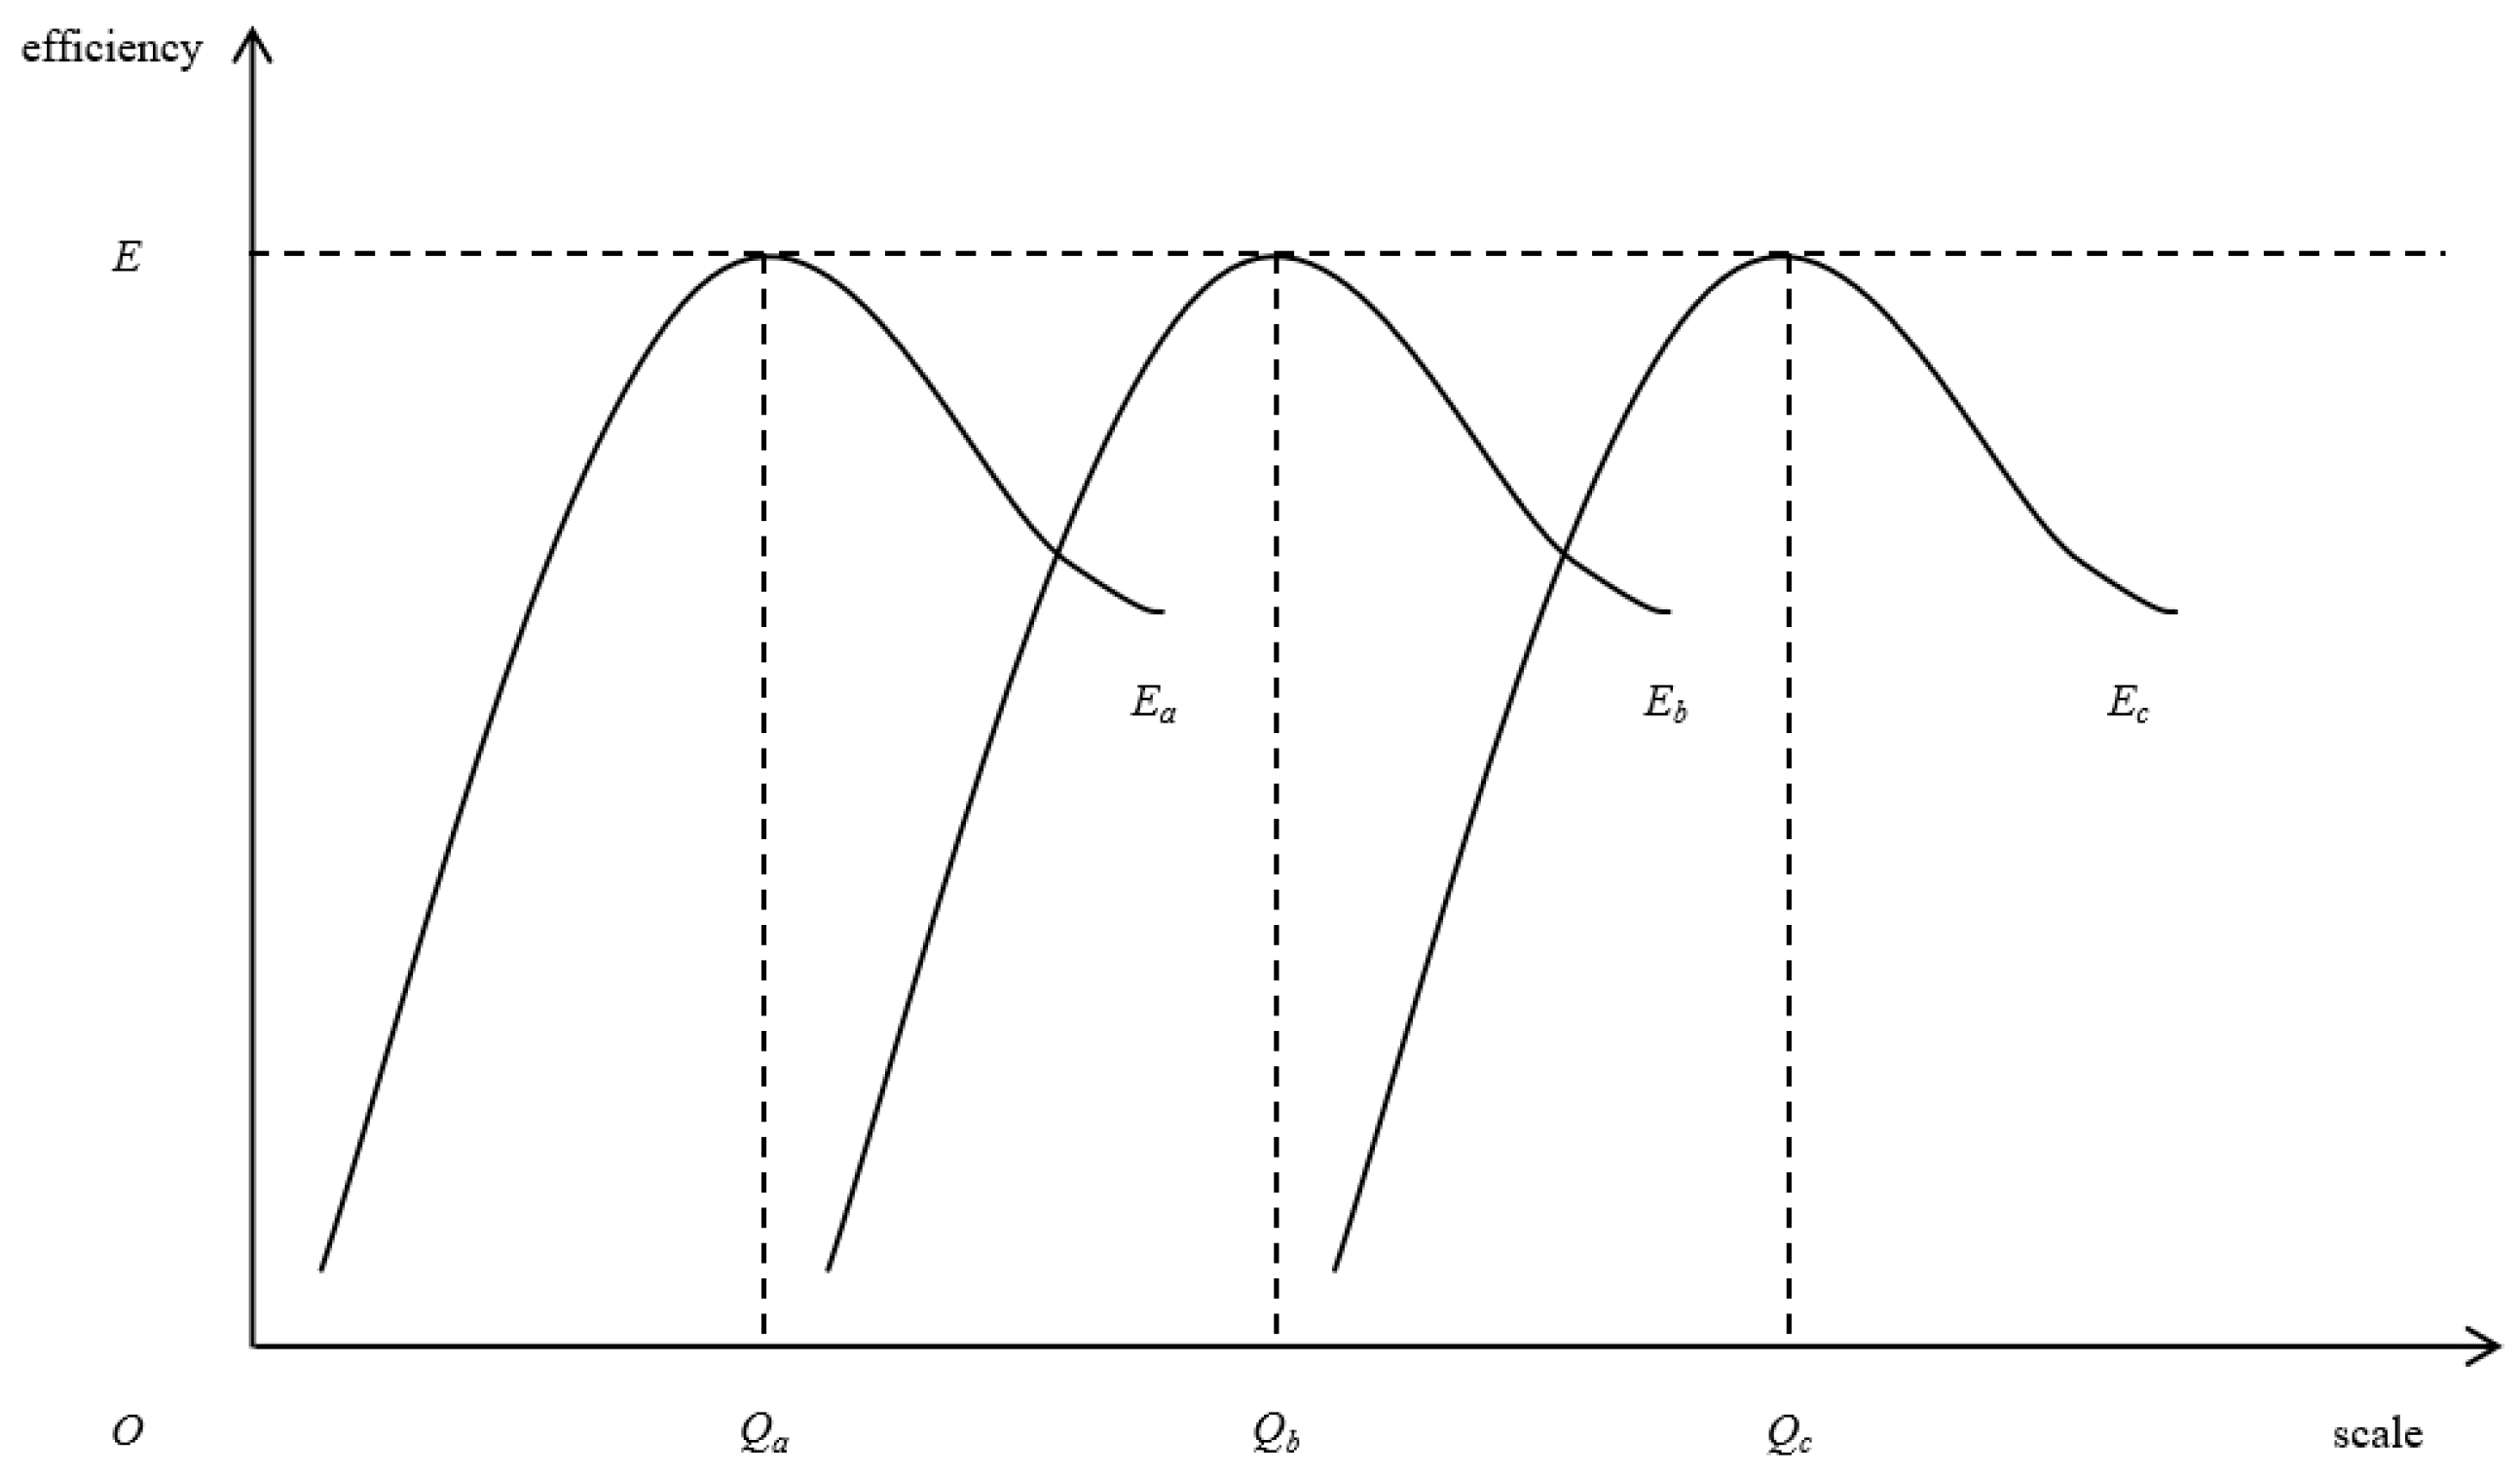
  • The division of labor in agriculture improves economic efficiency. As shown in Figure 3, this study can divide the agricultural production process into several steps. Each step requires different scale conditions to maximize efficiency, so farmers can outsource certain steps or some of the tasks to others according to their agricultural business capacity to achieve the optimal level of economic efficiency through service scaling [39] (In Figure 3, the X-axis represents the scale of production or a service, which can be measured in terms of the quantity of output or the amount of resources invested, while the Y-axis, efficiency, reflects the maximum output for a given input or the minimum input for a given output and is usually measured in terms of indicators such as unit cost or productivity.).
2.
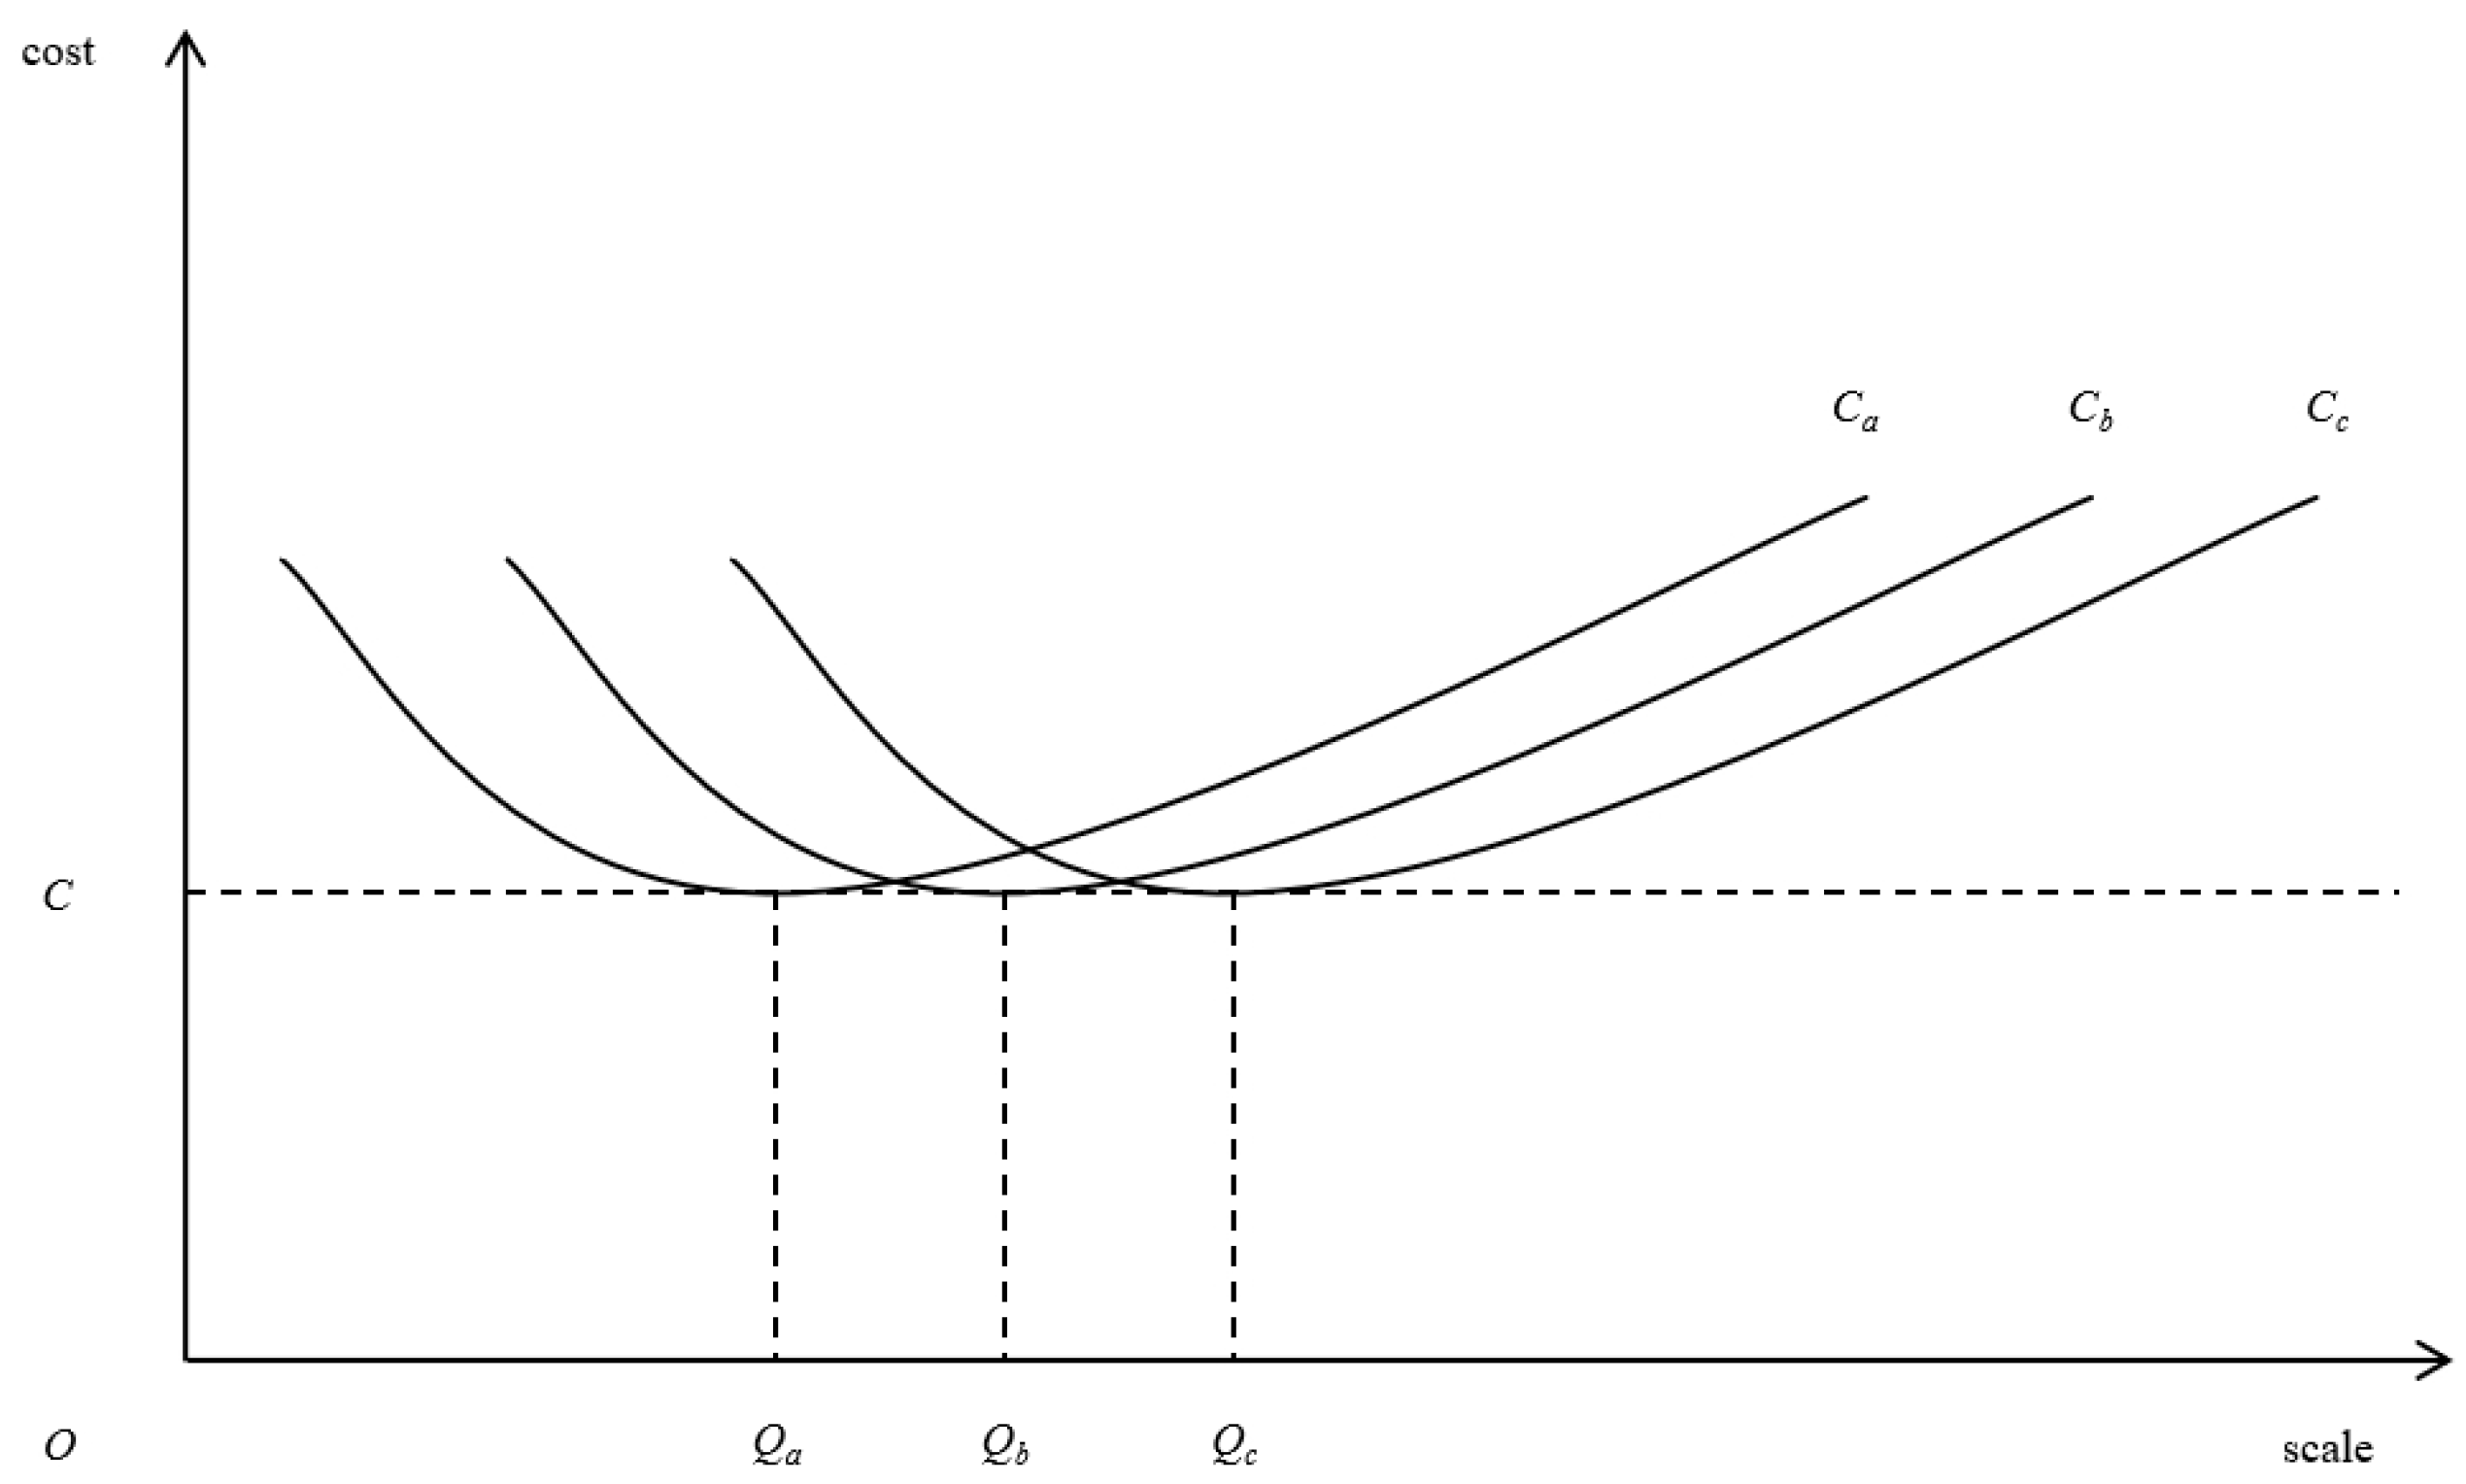
The division of labor in agriculture saves on operating costs. As shown in Figure 4, the definition of economies of scale in agriculture suggests that there is a downward trend in average costs as the land area increases. However, the lowest possible average cost for each process cannot be achieved because of the differences in the production practices of farmers. Therefore, farmers can choose the division of labor to carry out certain aspects of production, to a certain extent, to achieve the scale of production, thus effectively reducing the cost of agricultural production and operation [39] (In Figure 4, the X-axis also represents the scale of production or a service, while costs on the Y-axis refer to the total expenditures required to produce a given quantity of a product or provide a given quality of a service, including the costs of raw materials, labor, the depreciation of equipment and so on. These costs are usually calculated based on the actual financial data of the company).

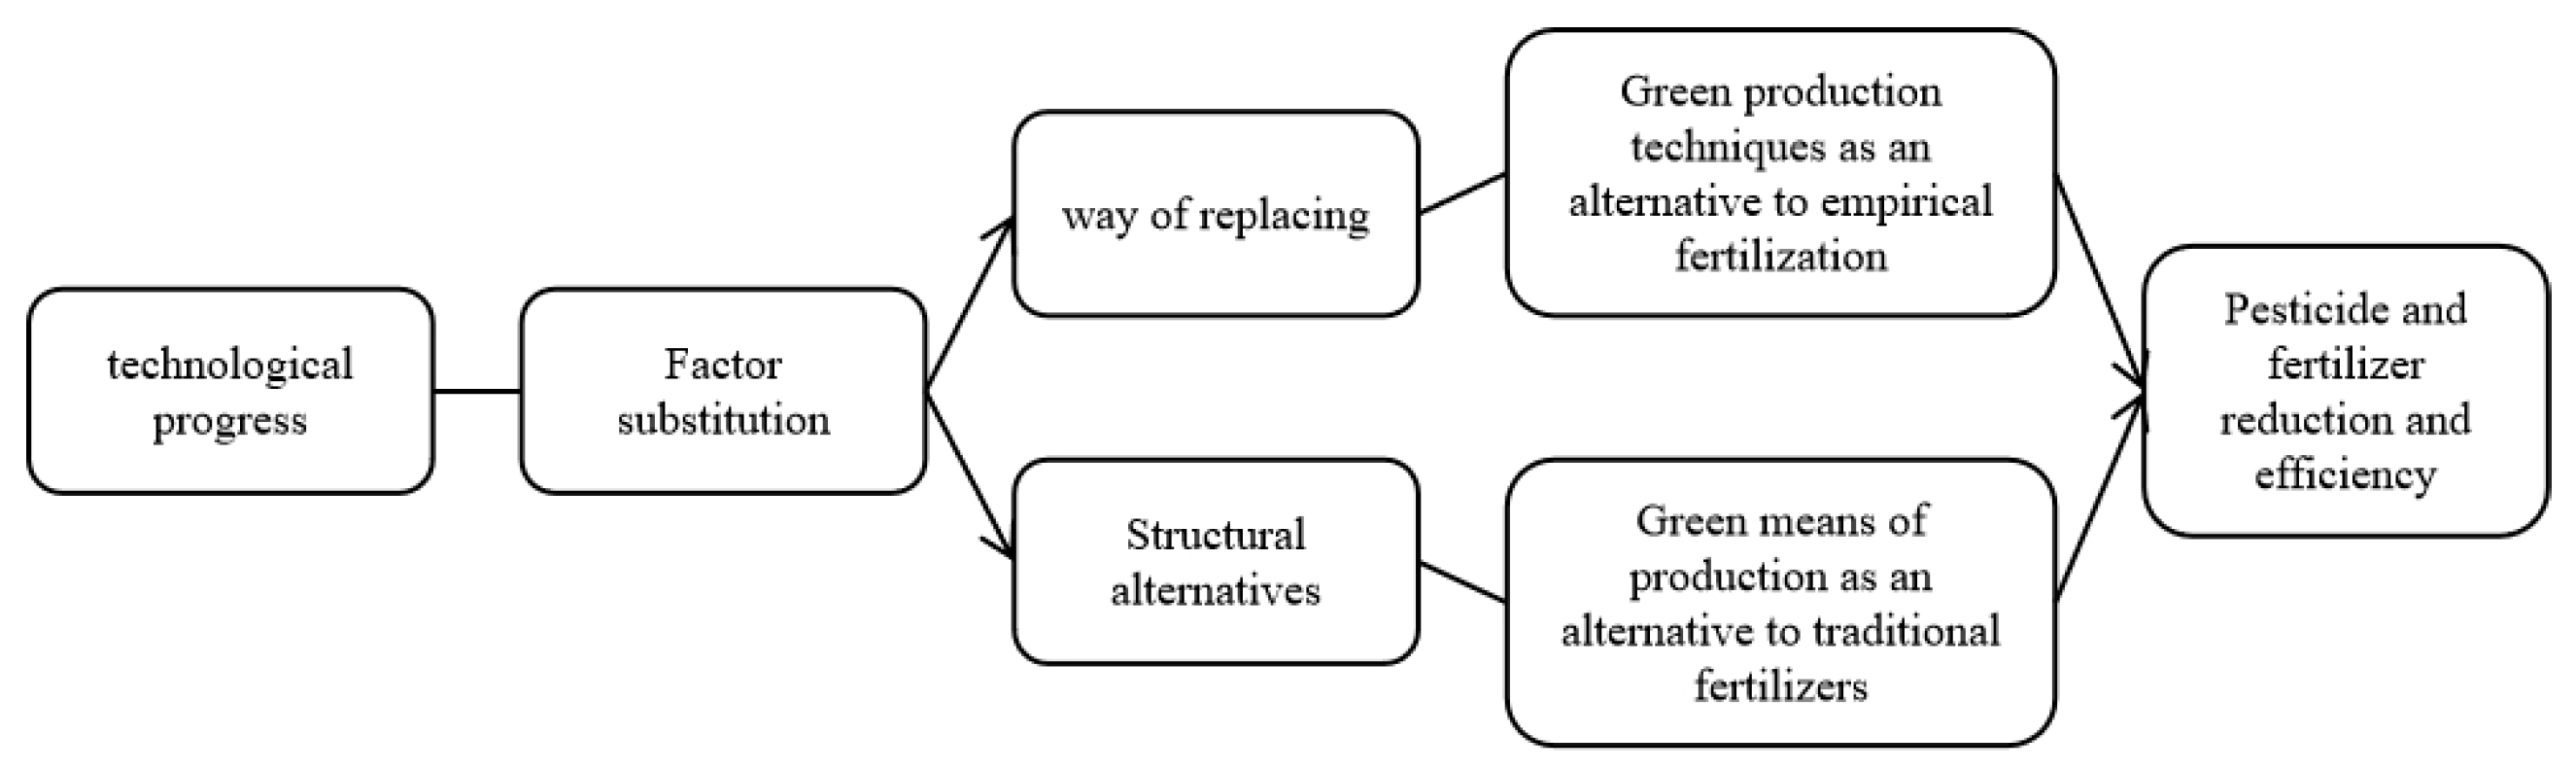
2.1.2. Ways to Realize the Greening Effect of Technological Progress

Farmers are the micro-subjects of pesticide and fertilizer reduction, but the inherent path dependence of production decisions means that the autonomous production processes of farmers generally lack the intrinsic motivation to lose weight [40]. The theory of technological progress suggests that technological progress can promote the effective substitution of factors, this usually refers to the fact that in a production process, due to a change in the price, quality or availability of a factor, a producer may choose to use other factors of production in place of the original factor in order to maintain or improve production efficiency. This substitution effect reflects the relative prices and substitutability of factors of production and is an important aspect of production decisions, thus allowing farmers to achieve pesticide and fertilizer reduction and efficiency [41], as shown in Figure 5:
  • Green production technology replaces the empirical application of drugs and fertilizers. Agricultural socialization services reduce the use of chemical fertilizers and pesticides by adopting comprehensive measures, such as uniform ploughing, deep-water pupae extermination, and timely field resting, in order to achieve green prevention and control [42].
  • Green production materials replace traditional pesticides and fertilizers. Agricultural socialization service agencies have the advantage of screening the chemical dosage and content information, and they can provide professional fertilizer-dispensing services to achieve the quantification and standardization of pesticide and fertilizer use, respectively [42].
Based on the above theoretical analysis, the following research hypotheses are proposed:
Hypothesis 1. 
Agricultural socialization services help to improve the eco-efficiency of agricultural land use.
Hypothesis 2. 
Agricultural socialization services enhance the economic and ecological efficiency of farmers through the division of labor in agriculture and technological advances, which, in turn, enhance the eco-efficiency of agricultural land use.

2.2. Data and Variables

2.2.1. Data Sources

In this study, three batches of data from the China Family Tracking Survey (CFPS) for 2014, 2016 and 2018, which are the most recent national micro household surveys currently publicly available, were selected for this study. This study was screened based on the criteria of farming households (working in agriculture) and ultimately retained a valid statistical sample of 4453 households. At the same time, this study used statistical data from the Cathay Pacific database, the China Statistical Yearbook, and provincial statistical yearbooks. Specifically, this indicator combined data from the CFPS (China Family Tracking Survey) and provincial statistical yearbooks. In particular, the CFPS data provide detailed information on land inputs, labor inputs, capital inputs, and agricultural outputs, while the data on agricultural carbon sinks and agricultural carbon emissions are derived from provincial allocations of statistical data.

2.2.2. Variable Selection

Starting from the theoretical mechanism of this study, drawing on related studies, and considering the accessibility of data, the variables of this study were as follows:
  • Implicit variable: The ecological efficiency of agricultural land utilization. Indicators were selected to measure the eco-efficiency of agricultural land utilization from an input–output perspective (Table 1). As an industry with dual characteristics, agriculture absorbs and releases large amounts of carbon dioxide, so this study treats agricultural carbon absorption as one of the desired outputs and agricultural carbon emissions as one of the non-desired outputs.
  • Independent variable: Agricultural socialization services serve as an important path for smallholder farmers to transition to modern agriculture. Established studies mostly use the dichotomous variable of whether or not to accept (buy) socialized services to characterize, but since this paper uses national-level data for analysis, the impact on micro-agroecological efficiency varies across different regions, structures, and different degrees of socialized services. Especially in the current context of increasing agricultural policy support and the gradual of improvement of the socialized service system, the decision-making behaviors of farmers regarding socialized services are also bound to produce some changes, affecting farmers’ inputs to socialized services, which, in turn, affect the eco-efficiency of agricultural land use at a deeper level. Therefore, this paper abandons the binary measure of whether to adopt or not to adopt the indicator but chooses to adopt the response degree of farmers to agricultural socialized services to refine the characterization of farmers’ socialized service level variables. The reason is as follows: on one hand, the amount of expenditure on socialized services by farmers cannot fully present the structure of agricultural services, but it can reflect the total level of agricultural services of households; on the other hand, due to the differences in the scale of agricultural production of farmers, which leads to the purchase of different scales of services, so that the amount of agricultural services purchased by farmers is not comparable to the absolute indicator, it is necessary to use the relative indicator to measure the amount of agricultural services purchased by farmers. This absolute indicator is not comparable and needs to be replaced by a relative indicator to reflect the differences in the level of the adoption of agricultural services among farm households. The question “how much money is spent on leasing farm machinery and hiring labor?” is used to describe the amount of agricultural socialization services purchased by farmers. From the actual microfoundation data, agricultural socialization services focus on farm machinery leasing and hired labor services because farmers have the highest demand for leasing farm machinery and hiring laborers during production compared to pre-production and post-production [10].
  • Control variables: In order to improve the credibility of the fitted regressions, a series of control variables such as individual virtual household head, household dimensional characteristics and agricultural regional characteristics were introduced in accordance with the real situation of agricultural production and based on the existing literature. In this study, the age of the head of household, physical health status and education level were selected as the variables of the characteristics of the respondents and their families; whether it belongs to a mining area, whether it belongs to a natural disaster-prone area, the distance from the village committee to the township and the per capita net income of the village residence were selected to reflect the regional characteristics. Among them, respondents and their family characteristics and regional characteristics had 6 variables each.
  • Moderating variables: Two variables were chosen to be the moderating variables, namely the scale of the operations of farm households and per capita land area. In the study of the impact of agricultural socialization services on the ecological efficiency of agricultural land use, we chose the scale of the operations of farmers and per capita land area as the regulating variables because the scale of operation directly affects the degree of intensification and efficiency of agricultural production, while the per capita land area reflects the resource endowment and production conditions of farmers. These two variables helped us to more accurately analyze the effect of agricultural socialization services under different conditions and provide a scientific basis for sustainable agricultural development.
  • Mediating variables: The mediating variables were the division of labor in agriculture and technological progress. Among them, the variable of agricultural division of labor was characterized by the commodity rate of agricultural products, that is, the ratio of agricultural commodity quantity (amount) and agricultural production (amount); in addition, the contribution rate of agricultural scientific and technological progress was used to characterize technological progress. The description and descriptive statistics of all relevant variables are detailed in Table 2.

2.3. Research Methodology

2.3.1. Methodology for Measuring Carbon Sinks in Agriculture

Carbon sinks in the agricultural production process only consider carbon sequestration during the entire life cycles of the growth of major crops (rice, wheat, corn, beans, potatoes, peanuts, rapeseed, sugarcane, cotton, melons, vegetables, etc.). So-called crop carbon sequestration refers to the net primary production, i.e., biological yield, formed by crop photosynthesis, and the calculation formula is expressed as follows:
C = i = 1 k C i = i = 1 k c i Y i ( 1 r ) / H I i
where C is the total carbon uptake of crops; C i is the carbon uptake of a certain crop; k is the number of crop species; c i is the carbon absorbed by the crop to synthesize a unit of organic matter through photosynthesis (g C/g); Y i is the economic yield of the crop(t/ha); r is the water content of the economic product part of the crop; H I i is the economic coefficient of the crop(tC/tDM). The carbon uptake rates and economic coefficients of various crops are mainly cited from Wang Xiulan [43] and the other related literature.

2.3.2. Carbon Emission Factor Approach

Currently, the emission factor method (or emission coefficient) is widely used in agricultural carbon emission measurement research, and the calculation process is used to multiply the activity data of agricultural carbon emission sources with the emission factor and then convert them into carbon emission equivalents according to the global warming potential of different gases to identify the final total carbon emissions. The formula is as follows [44]:
E i = T i n × δ i n
E = E i × ω i
where E i denotes the emissions of the ith agricultural GHG; T i n denotes the amount of the nth source of the ith GHG and δ i n denotes the GHG emissions per unit of activity data of the source; E denotes the total carbon emissions from agriculture; ω i denotes the global warming potential of the ith agricultural GHG.

2.3.3. SBM-Undesirable Model

In this paper, drawing on the methodology of Hu Xianhui [45] and others, the SBM-Undesirable model that includes undesired outputs is used to measure the eco-efficiency of agricultural land use. The model expression is as follows:
ρ = min 1 1 m i = 1 m D i x i 0 1 + 1 a + b ( r = 1 a D r e y r 0 e + h = 1 b D h n y h 0 n )
s . t . x 0 = X λ + D , y 0 e = Y e λ D e , y 0 n = Y n λ + D n
D 0 , D e 0 , D n 0 , λ 0
where ρ denotes the value of eco-efficiency of agricultural land use in each province in the study area; m , a , b denote the number of inputs and desired and undesired outputs; D , D e , D n denote the slack variables of inputs and desired and undesired outputs, respectively (the same units as the corresponding variable); x i 0 ,   y r 0 e ,   y h 0 n denote to the values of inputs and outputs of the province at a certain stage (the same units as the corresponding variable); λ denote a vector of weights.

2.3.4. Agricultural Production Function

Drawing on the measurement method of Tao Qunshan [46] and others, this paper adopts the agricultural production function to measure the rate of agricultural science and technology progress in each province. The formula of the agricultural science and technology progress rate can be derived from the agricultural production function:
A t = Y t X 1   α 1 X 2   α 2 X 3   α 3 X 4   α 4
where Y is the gross agricultural product, X 1 is the area of rural agricultural land, X 2 is the number of rural laborers, X 3 is the total power of agricultural machinery, X 4 is the amount of agricultural fertilizer, and A t is the rate of scientific and technological progress in agriculture. In order to estimate the values of parameters alpha1, alpha2, alpha3 and alpha4 of the agricultural production function, the logarithmic regression equation is firstly established according to the variables chosen in this paper: lnY = lnc0 + c1 lnX1+ c2 lnX2 + c3 lnX3 + c4 lnX4. The model was analyzed via multiple regression and the parameters c1 = 0.07, c2 = 0.07, c3 = 0.29, c4 = 0.75, R2 = 0.98, D. W = 2.77. Thus, alpha1 = 0.06, alpha2 = 0.06, alpha3 = 0.25, and alpha4 = 0.63.

2.3.5. Tobit Model

The results of measuring the eco-efficiency of agricultural land use through the SBM-Undesirable model showed that the values were in the range of 0–1; therefore, in order to better assess the restricted dependent variable, the Tobit regression model was chosen for performing the empirical analysis in this study [6].
E = α X + ε
E = M a x ( 0 , Y ) = E , i f   Y 0 E , i f   Y < 0
where E ( or   Y ) is the latent variable; E is the value of eco-efficiency of agricultural land use; X is each factor affecting the eco-efficiency of agricultural land use; α is the parameter estimation coefficient; ε is the random disturbance term. When the latent variable E 0 , E takes the actual observed value; when the latent variable E < 0 , E takes 0.

3. Results

3.1. Benchmark Regression Results

As shown in Table 3, model 1 did not consider the moderating variables, while models 2 and 3 considered the scales of the operations of farm households and land area per capita, and the results showed that the LRχ2 all reached the statistical level of 1%, which indicated that the models were fitted well. The regression results show that there is a significant positive effect of agricultural socialization services on the eco-efficiency of agricultural land use before and after controlling the adjustment variables. This indicates that agricultural socialization services are conducive to improving the eco-efficiency of agricultural land use, and research hypothesis 1 was verified.

3.2. Robustness Tests

In this study, the instrumental variable “adoption rate of socialization services of other farmers in the village” is selected, which can influence the decision of this farmer to adopt socialization services through the “herd effect” and has a certain degree of relevance, but at the same time, the decisions of other farmers will not affect the ecological efficiency of agricultural land use of this farmer. At the same time, other farmers’ decisions on agricultural socialized services will not affect the ecological efficiency of agricultural land use of this farmer, which meets the requirement of exogeneity. According to the test results in Table 4, this study found that the coefficients of both agricultural socialization services and instrumental variables are significantly positive, and the F-value of the first stage is greater than 10, which indicates that there is no weak instrumental variable problem, that there is a strong correlation between instrumental variables and agricultural socialization services, and that the positive impact of agricultural socialization services on the eco-efficiency of agricultural land use is robust.

3.3. Heterogeneity Analysis

3.3.1. Analysis of Different Services

It has been verified in the previous section that the adoption of agricultural socialization services by farmers can significantly enhance the eco-efficiency of agricultural land use, but different agricultural production segments have different needs for hired labor and agricultural machinery leasing services, and it is worthwhile to further explore which specific agricultural socialization services play major roles in the process of enhancing the eco-efficiency of agricultural land use. Therefore, in order to effectively identify the impacts of different types of agricultural socialization services on the enhancement of agricultural land use eco-efficiency, this study further conducted a heterogeneity test, and the test results are shown in Table 5. It can be seen that the cross-term coefficients of hired labor services are highly statistically significant (significance level of 1%), while the cross-term coefficients of agricultural machinery leasing services fail the significance test. Further comparison reveals that the value of the cross-term coefficient of hired labor services is significantly larger than that of farm machinery leasing services, and we reject the hypothesis that there is no significant difference in the effects of the two at the 1% significance level through the Wald test. This result suggests that hired labor services play a more significant role in enhancing the eco-efficiency of agricultural land use compared to farm machinery leasing services. This finding suggests that when promoting the development of agricultural socialization services, more attention should be paid to optimizing the provision of hired labor services to more effectively promote the enhancement of the eco-efficiency of agricultural land use.

3.3.2. Analysis of Different Production Areas

According to the Opinions on Reforming and Improving Certain Policy Measures for Comprehensive Agricultural Development issued by the Ministry of Finance in 2003, a total of 13 provinces (including autonomous regions) in China are major grain-producing areas: Heilongjiang, Henan, Shandong, Sichuan, Jiangsu, Hebei, Jilin, Anhui, Hunan, Hubei, Inner Mongolia, Jiangxi, and Liaoning, while the other provinces are non-major grain-producing areas. Due to significant differences in resource endowment and policy inclination between major food-producing regions and non-major food-producing regions, the impact of agricultural socialization services on the eco-efficiency of agricultural land use may show different effects in the two types of regions. In order to explore this regional difference in depth, we conducted a group test. According to the regression results in Table 6, we can see that in the main grain-producing regions, hired labor services have a significant positive effect on the eco-efficiency of agricultural land use, while agricultural machinery leasing services also have a positive effect, but it is slightly smaller than that of hired labor services. This suggests that in the more resource-rich main production areas, agricultural socialization services enhance the eco-efficiency of agricultural land use to a certain extent. However, in the food non-main grain-producing areas, while hired labor services also had a positive effect on the eco-efficiency of farmland use, agricultural machinery leasing services had a negative effect. This may be related to the resource endowment and policy environment in the non-dominant production areas, which prevented the farm machinery hiring service from playing the expected role in the region. In addition, other factors such as the age of the household head, health status and other personal and regional characteristics also affected the eco-efficiency of farmland utilization to varying degrees.

3.4. Mechanism Testing

Through the analysis of theoretical mechanisms, it can be concluded that agricultural socialization services indirectly enhance the utilization efficiency of agricultural land at the ecological level in the process of promoting the division of labor and technological innovation in agriculture. This mechanism not only optimizes the structure of agricultural production but also makes the use of land resources more environmentally friendly and efficient through the introduction of advanced agricultural technology and management models. In this section, we propose identifying the mechanism of agricultural division of labor and technological progress with the help of the mediation effect test method, and the specific test results are shown in Table 7 and Table 8. Model 9 and Model 10 show that agricultural socialization services have a significant positive effect on the ecological efficiency of agricultural land use and the division of labor in agriculture, which is conducive to promoting the integration of farmers into the modern agricultural division of labor; Model 11 shows that after the introduction of the variable of division of labor into agriculture, both the agricultural socialization services and the division of labor in agriculture still have a significant positive effect on the ecological efficiency of agricultural land use. Similar to the above results, Model 12 and Model 13 show that agricultural socialization services have a significant positive impact on the ecological efficiency of agricultural land use and technological progress, which is conducive to the promotion of the development and application of agricultural machinery; in addition, the results of Model 14 show that after the introduction of the variable of technological progress, agricultural socialization services still have a significant positive impact on the ecological efficiency of agricultural land use, but the coefficient of the division of labor in agriculture is negative, and the coefficient of the division of labor in agriculture is negative.
According to the mediation effect test step [47], it can be seen that the division of labor in agriculture plays a partial mediating role in the relationship between agricultural socialization services affecting the ecological efficiency of agricultural land use, and the mediation effect accounts for 11.4% of the total effect. This mechanism of action can be summarized as follows: the adoption of agricultural socialization services promotes the division of labor in agriculture and improves the eco-efficiency of agricultural land use. There is a masking effect of technological progress between agricultural socialization services and eco-efficiency of agricultural land use. Taken together, this mechanism of action can be summarized as follows: the adoption of agricultural socialization services → agricultural technological progress → a relative decline in the ecological efficiency of agricultural land use (the overall effect remains as follows: the adoption of agricultural socialization services → an increase in the ecological efficiency of agricultural land use).
In summary, research hypothesis 2 was verified.

4. Conclusions and Discussion

4.1. Conclusions

This study deeply discusses the influence of agricultural socialization services on the ecological efficiency of agricultural land utilization and the operation mechanism behind it. The key findings are as follows: (1) The socialized agricultural services have significantly improved the ecological efficiency of agricultural land, and this conclusion is still stable after the test of endogenous problems. (2) By comparing the different service types, we found that employment services, compared to farm machinery leasing, have more advantages in terms of promoting the ecological efficiency of agricultural land use, especially in the major grain-producing areas; yet, in the non-major grain-producing areas, the effect of agricultural machinery leasing service is limited, which may be related to the local regional characteristics or the policy environment. (3) Mechanism analysis reveals that agricultural labor division and technological progress are two important ways for agricultural socialization service to improve the ecological efficiency of agricultural land.
Based on the above findings, the following insights can be drawn: (1) Actively support the development and improvement of the agricultural socialized service system and give full consideration to the enhancement effect of agricultural socialized services on the ecological efficiency of agricultural land use. This includes the government increasing financial input and providing policy support, enterprises strengthening product R&D and innovation and launching products that meet the needs of local farmers, and farmers actively participating in the construction of agricultural socialized service projects and improving their own quality. (2) Focus on the differences between different production areas and different types of agricultural socialized services and conduct targeted research on different types of agricultural socialized services in different production areas to better guide the promotion and development of agricultural socialized services. With the goal of serving small farmers, improving service quality and expanding service functions, it will participate in the agricultural division of labor, integrate into the process of modern agricultural development and improve the level and efficiency of green agricultural production. (3) Accelerate the promotion of the research, development and application of green, efficient and applicable technologies in agriculture and reduce the masking effect of technological progress on the eco-efficiency-enhancing role of agricultural socialized services. This includes strengthening the construction of agricultural scientific and technological personnel, accelerating the pace of the transformation of agricultural scientific and technological innovation achievements, cultivating new rural business subjects, and creating a diversified agricultural industry pattern.

4.2. Discussion

4.2.1. Comparative Analysis and Insights from an International Perspective

Based on empirical data from 4453 farming households in 23 provinces (autonomous regions and municipalities) of China, this study reveals the impact of agricultural socialization services on the eco-efficiency of agricultural land use and analyzes the mediating and masking effects of the agricultural division of labor and technological progress. In the context of global green development, these findings not only have Chinese characteristics but also provide new perspectives for international comparative studies. Compared with global studies, this study also confirms the positive effects of agricultural socialization services on eco-efficiency but places special emphasis on the mediating role of the agricultural division of labor and the masking effect of technological progress, which may be related to the specificity and development stage of Chinese agriculture. The strengths of this study lie in its rich data, in-depth mechanism and unique perspective, which provide a scientific basis for policy formulation. However, the generalizability of the findings needs to be further verified due to China’s specific economic, social, and cultural context, as well as other possible unconsidered factors. These findings provide useful insights for the global promotion of agricultural socialization services and the formulation of strategies for sustainable agricultural development.

4.2.2. Research Prospect

This study faces some limitations in exploring the impact of agricultural socialization services on the eco-efficiency of agricultural land use. First, the assessment system of eco-efficiency is not yet perfect and fails to comprehensively and scientifically measure the impact of agricultural socialization services. Second, this study pays less attention to the role of farmers’ behavioral decisions, which directly affect the eco-efficiency of agricultural land use. In order to overcome these limitations, future research could be further expanded and deepened, including cross-country comparative studies to reveal its generality and specificity and comprehensive analysis of multidimensional influencing factors, such as the policy environment, market structure and farmers’ characteristics, so as to provide a more comprehensive reference for the formulation of global agricultural policies.

Author Contributions

Conceptualization, J.Z., L.H. and P.L.; Methodology, L.H. and P.L.; Data collection, P.L.; Data analysis, P.L.; Data curation, P.L. and H.H.; Drafting of the original manuscript, P.L.; Writing—commenting and editing, L.H. and J.Z.; Visualization, P.L.; Supervision, L.H. and J.Z.; Funding acquisition, Y.S. All authors have read and agreed to the published version of the manuscript.

Funding

This study was funded by the National Natural Science Foundation of China (Grant number 4220103, Grant number 41971240), the Fundamental Research Funds for the Central Universities (Grant number 2662021GGQD002, Grant number 2662022GGYJ002), and the Natural Science Foundation of Hubei Province (Grant number 2022CFB754).

Data Availability Statement

The original contributions presented in the study are included in the article, further inquiries can be directed to the corresponding author.

Acknowledgments

The authors would like to sincerely thank Lijie He, Xinli Ke, Jun Zhang and Yu Song for their guidance, help and support.

Conflicts of Interest

The authors declare no conflicts of interest.

References

  1. Feng, C.; Wang, M.; Liu, G.; Huang, J. Green development performance and its influencing factors: A global perspective. J. Clean. Prod. 2017, 144, 323–333. [Google Scholar] [CrossRef]
  2. Li, J.; Lu, X.; Kuang, B.; Cai, D. How does the industrial land misallocation affect regional green development. China Land Sci. 2021, 35, 43–50. [Google Scholar]
  3. Guo, F.; Tong, L.; Qiu, F.; Li, Y. Spatio-temporal differentiation characteristics and influencing factors of green development in the eco-economic corridor of the Yellow River basin. Acta Geogr. Sin. 2021, 76, 726–739. [Google Scholar]
  4. Liu, Y.; Zou, L.; Wang, Y. Spatial-temporal characteristics and influencing factors of agricultural eco-efficiency in China in recent 40 years. Land Use Pol. 2020, 97, 104794. [Google Scholar] [CrossRef]
  5. Yang, B.; Yang, J.; Wang, Z.; Tan, L. Spatial-temporal pattern and attribution of cultivated land green and low-carbon utilization in the Yangtze River Economic Belt. China Land Sci. 2022, 36, 63–71. [Google Scholar]
  6. Zhang, M.; Tong, T.; Chen, Z. Can socialized service of agricultural production improve agricultural green productivity? South China J. Econ. 2023, 1, 135–152. [Google Scholar]
  7. Zhang, Y.; Peng, C.; Zhang, C. The use of nitrogen element and grain production efficiency: Evidence from national fixed point survey data. J. Manag. World 2019, 35, 109–119. [Google Scholar]
  8. Lv, T.; Fu, S.; Hu, H.; Wang, L.; Geng, C. Dynamic evolution and convergence characteristics of cultivated land green use efficiency based on the constraint of agricultural green transition: Taking the main grain producing areas in the middle reaches of the Yangtze River as an example. China Land Sci. 2023, 37, 107–118. [Google Scholar]
  9. Chen, T.; Rizwan, M.; Abbas, A. Exploring the role of agricultural services in production efficiency in Chinese agriculture: A case of the socialized agricultural service system. Land 2022, 11, 347. [Google Scholar] [CrossRef]
  10. Cheng, Y.; Zhang, D.; Wang, X. Green development effect of agricultural socialized services: An analysis based on farming households’ perspective. Resour. Sci. 2022, 44, 1848–1864. [Google Scholar] [CrossRef]
  11. Wang, L.; Gao, X.; Yuan, R.; Luo, M. Impact and spatial effect of socialized services on agricultural eco-efficiency in China: Evidence from Jiangxi province. Sustainability 2023, 16, 360. [Google Scholar] [CrossRef]
  12. Arabi, B.; Munisamy, S.; Emrouznejad, A.; Toloo, M.; Ghazizadeh, M.S. Eco-efficiency considering the issue of heterogeneity among power plants. Energy 2016, 111, 722–735. [Google Scholar] [CrossRef]
  13. Figge, F.; Givry, P.; Canning, L.; Johnson, E.F.; Thorpe, A. Eco-efficiency of virgin resources: A measure at the interface between micro and macro levels. Ecol. Econ. 2017, 138, 12–21. [Google Scholar] [CrossRef]
  14. Korhonen, J.; Seager, T.P. Beyond eco-efficiency: A re-silence perspective business strategy and the environment. J. Clean. Prod. 2018, 17, 411–419. [Google Scholar]
  15. Huang, H.; Wang, Z. Spatial-temporal differences and influencing factors of agricultural land eco-efficiency in Jiangxi Province: Based on the dual perspective of non-point source pollution and carbon emission. Resour. Environ. Yangtze Basin 2020, 29, 412–423. [Google Scholar]
  16. Akbar, U.; Li, Q.; Akmal, M.A.; Shakib, M.; Iqbal, W. Nexus between agro-ecological efficiency and carbon emission transfer: Evidence from China. Environ. Sci. Pollut. Res 2021, 28, 44581. [Google Scholar] [CrossRef] [PubMed]
  17. Liu, M.; Zhang, A.; Wen, G. Regional differences and spatial convergence in the ecological efficiency of cultivated land use in the main grain producing areas in the Yangtze region. J. Nat. Resour. 2022, 37, 477–493. [Google Scholar] [CrossRef]
  18. Hou, M.; Yao, S. Convergence and differentiation characteristics on agro-ecological efficiency in China from a spatial perspective. China Popul. Resour. Environ. 2019, 29, 116–126. [Google Scholar]
  19. Geffersa, A.G.; Agbola, F.W.; Mahmood, A. Technical efficiency in crop production across agro-ecological zones in Ethiopia: A meta-analysis of Frontier studies. Outlook Agric. 2019, 48, 5–15. [Google Scholar] [CrossRef]
  20. Zhou, J.; Fan, X.; Yang, M.; Jia, H.; Xiao, C. Analysis and prediction of influential factors on ecological efficiency—Case of three counties in southern Ningxia. Res. Soil Water Conserv. 2020, 27, 318–325. [Google Scholar]
  21. Liu, Y.; Cheng, X. Does agro-ecological efficiency contribute to poverty alleviation? An empirical study based on panel data regression. Environ. Sci. Pollut. Res. 2022, 29, 51892–51908. [Google Scholar] [CrossRef] [PubMed]
  22. Rashidi, K.; Shabani, A.; Saen, R.F. Using data envelopment analysis for estimating energy saving and undesirable output abatement: A case study in the Organization for Economic Co-Operation and Development (OECD) countries. J. Clean. Prod. 2015, 105, 241–252. [Google Scholar] [CrossRef]
  23. Arshad, M.; Amjath-Babu, T.S.; Aravindakshan, S.; Krupnik, T.J.; Toussaint, V.; Kächele, H.; Müller, K. Climatic variability and thermal stress in Pakistan’s rice and wheat systems: A stochastic frontier and quantile regression analysis of economic efficiency. Ecol. Indic. 2018, 89, 496–506. [Google Scholar] [CrossRef]
  24. Shang, J.; Ji, X.; Chen, X. Study on the impact of China’s urbanization on agricultural ecological efficiency: Based on panel data of 13 major grain-producing regions in China from 2009 to 2018. Chin. J. Eco-Agric. 2020, 28, 1265–1276. [Google Scholar]
  25. Ji, T.; Raza, A.; Akbar, U.; Ahmed, M.; Popp, J.; Olah, J. Marginal trade-offs for improved agro-ecological efficiency using data envelopment analysis. Agronomy 2021, 11, 365. [Google Scholar] [CrossRef]
  26. Wang, S.; Lin, Y. Spatial evolution and its drivers of regional agro-ecological efficiency in China’s from the perspective of water footprint and gray water footprint. Sci. Geogr. Sin. 2021, 41, 290–301. [Google Scholar]
  27. Chen, C.; Li, Y.; Liao, X. Analysis of the productivity effect of outsourcing rice production chain -- based on panel data from three counties in Jiangsu Province. Chin. Rural Econ. 2012, 5, 86–96. [Google Scholar]
  28. Lyne, M.C.; Jonas, N.; Ortmann, G.F. A quantitative assessment of an outsourced agricultural extension service in the Umzimkhulu District of KwaZulu-Natal, South Africa. J. Agric. Educ. Ext. 2018, 24, 51–64. [Google Scholar] [CrossRef]
  29. Yang, Z. Can outsourcing of agricultural production improve the welfare of farm households? Evidence from rice farmers in Yangtze Valley. Chin. Rural Econ. 2019, 4, 73–91. [Google Scholar]
  30. Cheng, C.; Gao, Q.; Qiu, Y. Assessing the ability of agricultural socialized services to promote the protection of cultivated land among farmers. Land 2022, 11, 1338. [Google Scholar] [CrossRef]
  31. Yang, Z.; Rao, F.; Zhu, P. The impact of specialized agricultural services on land scale management: An empirical analysis from the perspective of farmers’ land transfer-in. Chin. Rural Econ. 2019, 3, 82–95. [Google Scholar]
  32. Cai, B.; Shi, F.; Huang, Y.; Abatechanie, M. The impact of agricultural socialized services to promote the farmland scale management behavior of smallholder farmers: Empirical evidence from the rice-growing region of southern China. Sustainability 2021, 14, 316. [Google Scholar] [CrossRef]
  33. Lu, H.; Zhou, Y.; Zhang, P.; Geng, X. Impact of socialized agricultural services on farmland abandonment: Empirical evidence based on Chinese family database. China Land Sci. 2022, 36, 69–78. [Google Scholar]
  34. Yang, S.; Zhang, F. The impact of agricultural machinery socialization services on the scale of land operation: Evidence from rural China. Agriculture 2023, 13, 1594. [Google Scholar] [CrossRef]
  35. Chen, X.; Liu, T. Can agricultural socialized services promote the reduction in chemical fertilizer? Analysis based on the moderating effect of farm size. Int. J. Environ. Res. Public Health 2023, 20, 2323. [Google Scholar] [CrossRef] [PubMed]
  36. Ying, R.; Xu, B. Effects of regional pest control adoption on pesticides application. China Popul. Resour. Environ. 2017, 27, 90–97. [Google Scholar]
  37. Liu, S.; Cao, J.; Zhang, Y. Research on the relationship between farmers’ organization modes and their technical efficiency—An analysis considering the heterogeneity of farmers. J. Agrotech. Econ. 2019, 12, 68–79. [Google Scholar]
  38. Cheng, Y.; Zhang, D. Theoretical framework and research prospects on the green development effect of agricultural socialization services. Chin. J. Eco-Agric. 2024, 32, 546–558. [Google Scholar]
  39. Liu, H. A Study of the Impact of Differentiation in the Division of Labor in Agricultural Production. Ph.D. Thesis, Southwest University, Chongqing, China, 2017. [Google Scholar]
  40. Liu, X.; Zhang, D.; Xu, Z. Does grain scale farmers also overuse fertilizer?—Based on the heterogeneity of large-sized farmers and small-sized farmers. J. Agrotech. Econ. 2020, 9, 117–129. [Google Scholar]
  41. Dong, Y.; Mu, Y. Research on the role of cooperatives in production factors allocation and management ability of small farmers—Empirical analysis based on PSM-SFA model. J. Agrotech. Econ. 2019, 10, 64–73. [Google Scholar]
  42. Liu, H.; Han, X.; Xue, Y.; Lv, Y. The logic of fertilizer reduction in agricultural production services: Substitution and matching—Based on research data from 741 corn farmers in three northeastern provinces. J. Arid Land Resour. Environ. 2022, 36, 32–38. [Google Scholar]
  43. Wang, X. Carbon Dioxide, Climate Change and Agriculture; Meteorological Press: Beijing, China, 1996; Volume 8. [Google Scholar]
  44. Hu, Y.; Zhang, K.; Hu, N.; Wu, L. Review on measurement of agricultural carbon emission in China. Chin. J. Eco-Agric. 2023, 31, 163–176. [Google Scholar]
  45. Hu, X.; Liu, M.; Wen, G. Spatial-temporal variability of coupling coordination between intensive use of cultivated land and ecological efficiency in China. Resour. Environ. Yangtze Basin 2022, 31, 2282–2294. [Google Scholar]
  46. Tao, Q.; Hu, H. Analysis on the relationship of environmental regulation and agricultural technological progress: Based on the study of Porter’s hypothesis. China Popul. Resour. Environ. 2011, 21, 52–57. [Google Scholar]
  47. Wen, Z.; Ye, B. Analysis of mediating effects: The development of methods and models. Adv. Psychol. Sci. 2014, 22, 731–745. [Google Scholar] [CrossRef]
Figure 1. The mechanism of the impact of agricultural socialization services on the eco-efficiency of agricultural land use.
Land 13 00853 g001
Figure 2. The path of the division of labor in agriculture for economic efficiency.
Land 13 00853 g002
Figure 3. A schematic diagram of changes in the efficiency of agricultural production chains.
Land 13 00853 g003
Figure 4. A schematic illustration of changes in agricultural production chain costs.
Land 13 00853 g004
Figure 5. Logical framework for technological progress in pesticide and fertilizer reduction.
Land 13 00853 g005
Table 1. Evaluation index system of eco-efficiency of agricultural land utilization.
TypeIndicator
Input indicatorsLand input (mu)
Labor input (person)
Capital input (yuan)
Desired outputAgricultural output (yuan)
Agricultural carbon sequestration (tons)
Non-desired outputAgricultural carbon emissions (tons)
Table 2. Descriptive statistical analysis of variables.
Variable TypeVariable NameVariable InterpretationSample SizeMeanStandard DeviationMaximum ValueMedian ValueMinimum Value
Explanatory variableEco-efficiency
of agricultural land use
0-44530.2720.1401.0000.2350.089
Explanatory variableAgricultural
socialization services
(Yuan)44531145.3386684.5232.16 × 1050.0000.000
Hired labor services(Yuan)4453737.9356091.8092 × 1050.0000.000
Agricultural machinery
rental services
(Yuan)4453407.4031290.04050,000.0000.0000.000
Control variable
Characteristics
of respondents
and
their households
Age of head
of household
(years)445350.83912.09388.00050.00014.000
Health status1–544533.2341.2545.0003.0001.000
Educational attainment0–1044531.9681.0936.0002.0000.000
Total household
cash and savings
(Yuan)445318,059.61643,689.7738 × 1051000.0000.000
Share of
agricultural income
(%)4453−199.2842101.8513000.0000.357−6.23 × 10⁴
Number of
agricultural laborers
(number)44532.1831.10710.0002.0001.000
Regional characteristicsWhether it is a
mining area
0. no 1. yes44530.0970.2961.0000.0000.000
Whether it is a natural disaster prone area0. no 1. yes44530.4040.4911.0000.0000.000
Distance from village council to township(meters)44536304.77710,383.1741.3 × 1054000.0001.000
Per capita net income
of village residence
(Yuan)44532712.9171969.21118,000.0002370.0000.000
Proportion of village agricultural labor force(%)44530.5100.2151.0000.5000.000
Level of aging
of village households
(%)44530.1870.0960.7000.1730.009
Moderating variablesFarm household size(mu)445312.13433.3411060.0007.0000.100
Land area per capita(mu/person)44537.63333.462401.7002.6000.100
Mediating variables
Agricultural division of laborAgricultural
commodity rate
(%)44530.4870.3771.0030.545−0.001
Technological progressContribution rate
of scientific
and technological progress in agriculture
(%)44530.0420.0150.1210.0390.018
Health status: 1. very healthy; 2. very healthy; 3. relatively healthy; 4. average; 5. unhealthy. Educational attainment: 0–2. illiterate/semi-literate; 3. elementary school; 4. middle school; 5. high school/secondary school/technical school/vocational high school; 6. college; 7. bachelor’s degree; 8. master’s degree; 9. doctorate degree; 10. never attended school.
Table 3. Impact of agricultural socialization services on eco-efficiency of agricultural land use.
Ecological Efficiency of Agricultural Land Use
Variable NameModel 1Model 2Model 3
Agricultural socialization services0.3245 ***0.2986 ***0.3241 ***
(0.0217)(0.0212)(0.0217)
Scale of farm household operations 0.0007 ***
(0.0000)
Land area per capita −0.0001 *
(0.0001)
Age−0.0002 *−0.0002 *−0.0002 *
(0.0001)(0.0001)(0.0001)
Health status−0.0040 ***−0.0039 ***−0.0040 ***
(0.0012)(0.0012)(0.0012)
Educational level0.00050.00040.0007
(0.0014)(0.0014)(0.0014)
Total household cash and savings0.2364 ***0.2234 ***0.2364 ***
(0.0341)(0.0333)(0.0341)
Percentage of agricultural incomes−0.1161 *−0.1100−0.1153 *
(0.0687)(0.0669)(0.0687)
Number of agricultural laborers−0.0088 ***−0.0088 ***−0.0088 ***
(0.0013)(0.0013)(0.0013)
Whether belongs to mining area−0.0089 *−0.0058−0.0100 *
(0.0053)(0.0052)(0.0053)
Whether belonging to natural disaster-prone areas0.00370.00410.0037
(0.0031)(0.0030)(0.0031)
Distance from the village hall to the township0.5531 ***0.3504 **0.5576 ***
(0.1490)(0.1457)(0.1489)
Per capita net income of village0.4285 ***0.4691 ***0.4365 ***
(0.0888)(0.0866)(0.0889)
Proportion of agricultural laborers in the village0.0286 ***0.0261 ***0.0294 ***
(0.0073)(0.0071)(0.0073)
Village aging level−0.0098−0.0047−0.0114
(0.0158)(0.0154)(0.0158)
Regional dummy variablesControlled ControlledControlled
Constant term0.2328 ***0.2257 ***0.2320 ***
(0.0204)(0.0199)(0.0204)
LRχ2 test3451.61 ***3685.03 ***3454.45 ***
Sample size445344534453
Note: ***, **, and * indicate statistical significance at the 1%, 5%, and 10% confidence levels, respectively. Figures in parentheses use confidence levels. In empirical research, a confidence level, such as 95% or 99%, is usually set to indicate the precision and reliability of the estimate. The confidence level is a measure of the degree of confidence in the estimate.
Table 4. The 2SLS estimation results of agricultural socialization services on the eco-efficiency of agricultural land use.
First Stage Regression (Model 4) Second Stage Regression (Model 5)
Variable NameAgricultural Socialization ServicesEco-Efficiency of Agricultural
Land Use
Agricultural socialization services 0.5052 ***
(0.0631)
Instrumental variable0.1760 ***
(0.0072)
Age of household head0.0229−0.2257 *
(0.0849)(0.1313)
Health status−0.0449−0.3837 ***
(0.0771)(0.1195)
Educational level0.73540.2322
(0.9192)(1.4259)
Total household cash and savings0.1680 ***0.1997 ***
(0.0221)(0.0364)
Share of agricultural income0.0135−0.1224 *
(0.0447)(0.0693)
Number of agricultural laborers−0.0003−0.0087 ***
(0.0009)(0.0014)
Whether belongs to mining area0.0079 **−0.0099 *
(0.0035)(0.0054)
Whether belonging to natural
disaster-prone areas
0.0050 **0.0031
(0.0020)(0.0031)
Distance from the village hall to the township−0.03370.5586 ***
(0.0969)(0.1501)
Per capita net income of village0.02060.4163 ***
(0.0578)(0.0896)
Proportion of agricultural laborers
in the village
0.00390.0278 ***
(0.0048)(0.0074)
Ageing level of the village−0.0060−0.0085
(0.0103)(0.0159)
Constant term−0.0336 **0.2332 ***
(0.0133)(0.0206)
Regional dummy variableControlled Controlled
Sample size44534453
R20.14700.5322
F-value20.02
Note: ***, **, and * indicate statistical significance at the 1%, 5%, and 10% confidence levels, respectively. Figures in parentheses use confidence levels. In empirical research, a confidence level, such as 95% or 99%, is usually set to indicate the precision and reliability of the estimate. The confidence level is a measure of the degree of confidence in the estimate.
Table 5. Heterogeneity analysis of different service types.
Model 6
Variable NameEcological Efficiency of Agricultural Land Use
Hiring services0.3533 ***
(0.0257)
Agricultural machinery hiring services0.0742
(0.1221)
Age of household head−0.0002 *
(0.0001)
Health status−0.0039 ***
(0.0012)
Educational level0.0007
(0.0014)
Total household cash and savings0.2392 ***
(0.0342)
Percentage of agricultural incomes−0.1154 *
(0.0687)
Number of agricultural laborers−0.0088 ***
(0.0013)
Whether belongs to mining area−0.0092 *
(0.0053)
Whether belonging to natural disaster-prone areas0.0038
(0.0031)
Distance from the village hall to the township0.5423 ***
(0.1490)
Per capita net income of village0.4219 ***
(0.0889)
Proportion of agricultural laborers in the village0.0289 ***
(0.0073)
Village aging level−0.0103
(0.0158)
Regional dummy variablesControlled
Constant term0.2329 ***
(0.0204)
Sample size4453
LRχ2 test3455.95 ***
Wald test114.17 ***
Hired labor services vs. farm machinery rental services(0.0000)
Note: *** and * indicate statistical significance at the 1% and 10% confidence levels, respectively. Figures in parentheses use confidence levels. In empirical research, a confidence level, such as 95% or 99%, is usually set to indicate the precision and reliability of the estimate. The confidence level is a measure of the degree of confidence in the estimate.
Table 6. Heterogeneity analysis of different production areas.
Variable NameEcological Efficiency of Agricultural Land Use
Model 7Model 8
Main Production AreaNon-Producing Area
Hiring services0.5493 ***0.3572 ***
(6.71)(12.98)
Agricultural machinery hiring services0.5295 ***−0.3191 **
(2.76)(−2.02)
Age of household head−0.0003−0.0002
(−1.46)(−0.96)
Health status−0.0048 ***−0.0031 *
(−2.76)(−1.91)
Educational level−0.00310.0033 *
(−1.42)(1.76)
Total household cash and savings0.2331 ***0.2644 ***
(4.93)(5.36)
Percentage of agricultural incomes−0.0810−0.1364
(−0.69)(−1.63)
Number of agricultural laborers−0.0095 ***−0.0087 ***
(−4.70)(−4.85)
Whether belongs to mining area−0.0288 ***0.0094
(−3.68)(1.28)
Whether belonging to natural disaster-prone areas0.00620.0026
(1.26)(0.67)
Distance from the village hall to the township0.5660 ***0.3593
(2.87)(1.56)
Per capita net income of village0.4583 ***0.3691 ***
(3.97)(2.60)
Proportion of agricultural laborers in the village0.0377 ***0.0191 **
(3.32)(1.99)
Village aging level0.0194−0.0144
(0.69)(−0.74)
Regional dummy variablesControlledControlled
Constant term0.5557 ***0.2267 ***
(30.01)(9.73)
Sample size44534453
0.0092 ***0.0088 ***
(31.89)(34.78)
LRχ2 test1440.751882.03
Note: ***, **, and * indicate statistical significance at the 1%, 5%, and 10% confidence levels, respectively. Figures in parentheses use confidence levels. In empirical research, a confidence level, such as 95% or 99%, is usually set to indicate the precision and reliability of the estimate. The confidence level is a measure of the degree of confidence in the estimate.
Table 7. The analysis of the mediating effects of the agricultural division of labor.
Ecological Efficiency of Agricultural Land UseAgricultural Division of LaborEcological Efficiency of Agricultural Land Use
Variable NameModel 9Model 10Model 11
Agricultural socialization services0.3245 ***0.4341 ***0.2877 ***
(0.0218)(0.0765)(0.0209)
Division of labor in agriculture 0.0849 ***
(0.0041)
Age of household head−0.0002 *0.0007−0.0003 **
(0.0001)(0.0005)(0.0001)
Health status−0.0040 ***−0.0076 *−0.0033 ***
(0.0012)(0.0042)(0.0011)
Educational level0.00050.0188 ***−0.0011
(0.0014)(0.0050)(0.0014)
Total household cash and savings0.2364 ***0.3239 ***0.2089 ***
(0.0343)(0.1204)(0.0328)
Percentage of agricultural incomes−0.1161 *−0.5639 **−0.0682
(0.0690)(0.2422)(0.0659)
Number of agricultural laborers−0.0088 ***0.0083 *−0.0095 ***
(0.0013)(0.0047)(0.0013)
Whether belongs to mining area−0.0089 *−0.0211−0.0071
(0.0053)(0.0187)(0.0051)
Whether belonging to natural disaster-prone areas0.0037115−0.00750.0043
(0.0031)(0.0109)(0.0030)
Distance from the village hall to the township0.5531 ***−0.9862 *0.6368 ***
(0.1496)(0.5250)(0.1429)
Per capita net income of village0.4285 ***0.31150.4020 ***
(0.0892)(0.3132)(0.0852)
Proportion of agricultural laborers in the village0.0286 ***0.0547 **0.0240 ***
(0.0074)(0.0258)(0.0070)
Village aging level−0.0098−0.0130−0.0087
(0.0159)(0.0557)(0.0152)
Regional dummy variablesControlledControlledControlled
Constant term0.2328 ***0.3993 ***0.1989 ***
(0.0204)(0.0719)(0.0196)
Sample size445344534453
R20.53940.21260.5802
Note: ***, **, and * indicate statistical significance at the 1%, 5%, and 10% confidence levels, respectively. Figures in parentheses use confidence levels. In empirical research, a confidence level, such as 95% or 99%, is usually set to indicate the precision and reliability of the estimate. The confidence level is a measure of the degree of confidence in the estimate.
Table 8. The analysis of the mediating effects of technological progress.
Agricultural Land Use Eco-EfficiencyTechnological ProgressAgricultural Land Use Eco-Efficiency
Variable NameModel 12Model 13Model 14
Agricultural socialization services0.3245 ***0.0035 ***0.3274 ***
(0.0218)(0.0011)(0.0218)
Technical progress −0.8332 ***
(0.3046)
Age of household head−0.0002 *−0.0001 ***−0.0003 **
(0.0001)(0.0000)(0.0001)
Health status−0.0040 ***−0.0001 **−0.0041 ***
(0.0012)(0.0001)(0.0012)
Educational level0.0005−0.00010.0005
(0.0014)(0.0001)(0.0014)
Total household cash and savings0.2364 ***0.0104 ***0.2451 ***
−0.0343(0.0017)(0.0344)
Percentage of agricultural incomes−0.1161 *0.0061 *−0.1110
(0.0690)(0.0034)(0.0690)
Number of agricultural laborers−0.0088 ***0.0000−0.0087 ***
(0.0013)(0.0001)(0.0013)
Whether belongs to mining area−0.0089 *0.0000−0.0089 *
(0.0053)(0.0003)(0.0053)
Whether belonging to natural disaster-prone areas0.00370.00020.0039
(0.0031)(0.0002)(0.0031)
Distance from the village hall to the township0.5531 ***−0.00440.5495 ***
(0.1496)(0.0074)(0.1495)
Per capita net income of village0.4285 ***−0.0077 *0.4221 ***
(0.0892)(0.0044)(0.0892)
Proportion of agricultural laborers in the village0.0286 ***−0.00040.0283 ***
(0.0074)(0.0004)(0.0074)
Village aging level−0.0098−0.0001−0.0099
(0.0159)(0.0008)(0.0159)
Regional dummy variablesControlledControlledControlled
Constant term0.2328 ***0.0783 ***0.2981 ***
(0.0205)(0.0010)(0.0314)
Sample size445344534453
R20.53940.90400.5401
Note: ***, **, and * indicate statistically significant at the 1%, 5%, and 10% confidence levels, respectively. Figures in parentheses use confidence levels. In empirical research, a confidence level, such as 95% or 99%, is usually set to indicate the precision and reliability of the estimate. The confidence level is a measure of the degree of confidence in the estimate.
Disclaimer/Publisher’s Note: The statements, opinions and data contained in all publications are solely those of the individual author(s) and contributor(s) and not of MDPI and/or the editor(s). MDPI and/or the editor(s) disclaim responsibility for any injury to people or property resulting from any ideas, methods, instructions or products referred to in the content.

