Abstract
Amidst escalating global policy uncertainties and the painful transformation phase of the Chinese economy, studying the time-varying characteristics of risk spillover among the real economy, real estate market, and financial system holds substantial practical relevance for preventing and resolving significant systemic risks. This paper employs the TVP-VAR-DY model, selects indices from the real sectors to construct a risk spillover index for the real economy, and incorporates indices from the real estate and financial sectors to develop a trivariate SV-TVP-VAR model for empirically analyzing the time-varying nature of risk spillover relationships among these variables. This study reveals that risk spillover among different sectors of the real economy exhibits asymmetry and volatility, with the industrial sector experiencing the highest degree of risk spillover. The prosperity of the real estate market consistently aligns with that of the financial system; however, shocks during periods of risk accumulation in the real estate market significantly amplify risks in the real economy. The financial system serves the real economy, which suffers lesser impacts. Nonetheless, post-2008, the financial system’s support for the real estate market has gradually diminished. Crises exacerbate the extent of risk spillover, but the causative factors and socio-economic context create heterogeneity in fluctuations. Based on these findings, in response to the current real estate shock, the Chinese government should discuss the real economy, the real estate industry, and the financial system within the same research framework. Policies should primarily focus on fiscal measures to promote the recovery of the real economy more rapidly. Additionally, by allowing local governments to implement tailored policies based on local conditions, potential homebuying demand has been effectively stimulated.
1. Introduction
Amidst U.S.–China trade tensions, rising anti-globalization sentiments, and the global COVID-19 pandemic, the uncertainty surrounding global economic policies has significantly increased [,]. China’s economy is concurrently facing formidable challenges, including a notable slowdown in growth, immense pressure to transform industrial structures, and widespread prevalence of high-leverage operations within enterprises [,,]. Additionally, the surge in non-performing assets, financial crises within real estate enterprises, persistent high levels of hidden debts among local governments, and substantial fluctuations in exchange rates are progressively revealing a series of persistent and potential financial risks [,,,]. These risks have heightened scholarly focus on the intrinsic interconnectedness within China’s real economy, the vulnerability of its financial system, and the speculative bubbles in the real estate market. To forestall further deterioration of the economic situation, the Central Political Bureau meetings of 2024 underscored risk prevention and mitigation as key tasks in real estate endeavors, advocating for active and prudent resolution of real estate risks. Given that real estate remains a potential major source of systemic risk in China, there is an imperative need for vigilance to prevent further escalation and spread of these risks.
In the modern socio-economic development process, financialization-characterized business innovations have become prevalent, fostering tighter connections and synergistic developments between the real economy and financial systems. Internally, the real economy sectors have also formed more complex and close interconnections, thereby broadening the scope and intensity of cross-sectoral risk contagion. In China, the primary function of finance is to serve the real economy, fulfilling enterprises’ financing needs to the best of its ability and invigorating investment activities in the real economy through financial products. Nonetheless, the genesis of financial risks undeniably imposes substantial impacts on the real economy. Moreover, high-leverage activities by non-financial enterprises could transmit risks to upstream and downstream businesses. Should the inherent risks within the real economy converge and erupt, they might trigger risk contagion among independent sectors, leading to significant impacts on the financial system through credit activities and potentially culminating in systemic risks. Recent years have witnessed an expansion in economic scale, drawing scholarly attention to the structure and quality of economic development and revealing significant shifts towards an economy characterized by a growing dominance of the financial and real estate sectors over the real economy [,]. This trend reflects a reciprocal diminishing and waxing between these sectors. In the 2016 Central Economic Work Conference, President Xi Jinping highlighted that “the prominent contradictions and problems faced by our economic operation, though containing cyclical and aggregate factors, fundamentally stem from major structural imbalances, one of which is the ‘imbalance between finance and the real economy’.” The 2023 Central Financial Work Conference proposed “improving institutional roles, supporting state-owned major financial institutions to excel and strengthen, and serving as the main force in servicing the real economy and a ballast for maintaining financial stability”. It is based on this understanding that the financial industry should earnestly fulfill its crucial duty of “enhancing financial services to the real economy” while remaining vigilant against potential risks emanating from a downturn in the real estate market.
Since 2021, numerous real estate enterprises, including Hengda and Rongchuang, have experienced defaults, entering a downturn in the real estate market that has also impacted the real economy and financial system. On one hand, as a pillar enterprise of the national economy, real estate plays a central role in the development of upstream and downstream industries [,]. In 2020, real estate and its industry chain accounted for 17% of China’s GDP, contributing 13.9% to GDP growth (Data source: National Bureau of Statistics of China). The sluggish real estate market poses new challenges for China in entering a new normal of economic growth and exerts pressure on stable economic expansion. On the other hand, real estate constitutes a substantial proportion of collaterals within the Chinese financial system, representing a massive volume of debt relationships between residents and real estate enterprises []. Simultaneously, a plethora of non-standard products have flooded into this domain during the boom times of the real estate market, enhancing the connections between real estate and financial institutions [,]. Defaults by real estate enterprises have led to severe livelihood issues, such as unfinished housing projects, and threaten the stability of the financial system [,]. Taking major risk events in real estate such as the defaults by Hengda and Rongchuang as examples, if the real estate industry continues to decline with persistently low sales, it will further lead to an increase in non-performing assets, obstacles in financing channels, and difficulties in capital turnover []. This period will swiftly affect various financial institutions involved in related investments and lending through channels like bankruptcy of investment targets and defaults on credit assets []. Should market sentiment continue to be negative, it might induce a systemic shock to the entire financial system, potentially leading to “systemic risk” [].
Previous studies have extensively explored the relationship between the real economy and the financial system [,], often overlooking the real estate industry’s significant encroachment on real economy resources, high dependence on the financial system, and speculative nature []. Given the following reasons, this study considers the real economy, real estate market, and financial system as three main subjects. (1) Differing from the real economy, both the real estate and financial industries represent the virtual economy. The composition of housing demand includes both usage and investment demands, with consumers’ investment demands making real estate akin to financial products, where consumers hope to profit by purchasing properties at low prices and selling at high prices [,]. (2) The real estate market can encroach on resources from real economy enterprises through mechanisms like financing constraints, credit allocation, cost, and speculative substitute channels []. (3) The predominantly indirect financing system leads banks to hold extensive credit assets related to real estate, significantly enhancing the linkage between the Chinese financial system and the real estate market [].
Because of the characteristics of loss linkage and risk sharing among the real economy, real estate market, and financial system, their interconnectedness and integrity become the primary sources and accelerators of systemic risk formation and propagation. The fluctuations among these three entities influence each other, and risks are mutually contagious, thereby exacerbating the overall economic system’s uncertainty and volatility, potentially leading to latent financial risks. Therefore, previous studies considering the real estate industry within the real economy need improvement [,]. Focusing on their tripartite relationship is more advantageous for simulating the extent of risk spillover under major external shocks, and regulatory authorities can more effectively prevent and resolve systemic financial risks from the root.
Building on previous research, this paper utilizes the TVP-VAR-DY model to fit the risk spillover index of the real economy, observing the static and dynamic characteristics among real economy sectors, and employs the SV-TVP-VAR model to construct a research framework for risk spillover among the real economy, real estate market, and financial system [,]. The marginal contributions include the following: (1) Previous research mostly did not discuss the aforementioned three entities within the same research framework, thus overlooking the role of the real estate market and financial system in risk spillover. This study focuses on discussing this part, clarifying the role of the real estate market. (2) Based on the TVP-VAR-DY model, the risk spillover index of the real economy is fitted, identifying key internal sectors statically and observing characteristics such as asymmetric fluctuations, frequent fluctuations, and intense degrees dynamically. (3) Based on the SV-TVP-VAR model, the time-varying characteristics of risk spillover among the three entities are observed, describing their trends and characteristics and providing a new perspective for policymaking under different shocks.
2. Literature Review
2.1. Intra-Sectoral Risk Spillover in the Real Economy
Research on the risk within the real economy stems from the broader study of systemic risks. Historically, scholars both domestically and internationally have posited that systemic risks are primarily induced within the financial system [,], focusing on risk contagion between different financial markets [,], identifying systemically important and vulnerable financial institutions [,], and inter-sectoral risk contagion within the finance industry [,]. Therefore, effectively controlling systemic risks is crucial for maintaining financial stability and promoting high-quality economic development. As awareness of systemic risks increased and research deepened, scholars recognized that systemic risks partly arise from external shocks to the overall economy and partly from risk spillovers triggered by severe damage to core industries within the system, leading to studies on risk spillover within and from the real economy [].
In measuring the interactions within the real economy, some researchers have utilized input–output tables to study the industrial chains of various sectors within the overall economic structure [,,]; others have analyzed correlations using industry indices of listed companies [,]; and others have assessed the overall importance of different industries []. However, findings have been mixed. Zhou [] observed that the materials sector exhibited the highest level of systemic risk both in static and dynamic evaluations, while the financial sector ranked high only in dynamic assessments. Bu [] confirmed that finance ranks relatively low in the system of industries. These studies, focusing on the real economy, have not precisely defined what constitutes the real economy, often mixing discussions of the real estate and financial sectors. Thus, this paper employs the TVP-VAR-DY model to extract real economy risk spillover, excluding the impacts of real estate and finance, and establishes a trivariate model to study risk spillover relationships.
2.2. Spillover in the Real Economy, Real Estate Market, and Financial System
The volatility and cyclicality of the real economy mean that certain industries might trigger risk spillover to the financial system during significant unexpected events []. For instance, the COVID-19 pandemic in early 2020 significantly slowed global economic growth and caused a sharp decline in international oil prices, becoming a major shock factor for financial market volatility [,]. Such real economic shocks, through interactions with the financial system, have spurred extensive academic interest. As discussions on the endogenous characteristics of the financial system have deepened, researchers like Zhu [], Baur [], and Chiu [] have analyzed the close connections between the financial system and the real economy and the synchronization of risks and returns from theoretical and empirical perspectives.
Early studies identified the real estate sector as an integral part of the real economy, with its characteristics of risk spillover to the financial system, especially from a procyclical perspective, becoming a focal point of many scholars. Liu [] measured the risk spillover of the Chinese real estate market to the financial system and further studied this characteristic from a procyclical perspective. Sun’s research [] indicated that China’s real estate industry exerts differentiated risk spillover effects on financial institutions, with intensity ranging from highest to lowest as follows: joint-stock banks, urban commercial banks, insurance institutions, trust companies, and state-owned banks. Because China’s financial system is primarily based on indirect financing, research on the risk relationship between real estate and banking has gradually increased. Recent empirical studies have expanded to include the real economy. International researchers such as Chiu, Pena, and Wang [], Silva, Alexandre, and Tabak [], and Brunnermeier, Dong, and Palia [] have confirmed the volatility spillover between the financial sector and real industries, emphasizing its significance. Chinese scholars such as Peng [], Zhu [], Cao [], and Li [] have conducted in-depth discussions on the risk spillover relationship between the two based on different data samples and models.
While current research has gradually expanded to include a broader range of topics, the study of real estate is often considered part of the real economy or discussed as a separate sector. However, the financialized nature of real estate and its encroachment on real economy resources are sufficient to warrant its consideration as an independent subject of discussion. Because of their policies aimed at maintaining property prices to sustain land revenue and enhance urban competitiveness, local governments have gradually developed an excessive reliance on real estate. This not only increases the inflow of speculative capital but also exacerbates financial risks in the real estate sector. Previous studies have emphasized various aspects of the real estate industry’s characteristics and positioning. Huang proposed that real estate functions as a virtual economy, wherein its prosperity raises the cost of capital, creating a gap in real economy funding, leading to capital idling in the financial system, thus further promoting the self-reinforcing cycle of the virtual economy []. Meng [] and Yi [] found that the transition of China’s economic structure from real to virtual is mainly caused by insufficient support from the virtual economy for the real economy. Limited financing for real economy enterprises and the urgent need to improve the maturity of financial markets contrast with the real estate industry’s positive momentum because of rapid growth in M2 and accelerated urbanization. This momentum, coupled with increased investment demand and the exacerbation of financial attributes, ultimately leads to the formation of partial real estate bubbles.
Simultaneously, as research delved deeper into the real estate industry and its impact on other sectors, Zhang argued that the real estate industry not only significantly influences its own sector but also accelerates the development of upstream and downstream industries. It can also suppress the development of other industries [] through various channels such as investment crowding out, cost escalation, and credit and financial channels []. These aspects are crucial considerations for financial stability and the healthy development of the real economy.
Previous studies have also conducted in-depth research on the risk spillover effects of the real estate market on the real economy and financial system. The real estate market often affects the real economy through financing costs, investment, and corporate performance. Zhu [] argued that housing price fluctuations can have various spillover effects on real enterprises, such as increasing financing and labor costs. Zhang [] found that rising housing prices can reduce investment in core business activities through speculative substitution channels, prompting real enterprises to divert internal funds or external borrowings to the real estate market for arbitrage opportunities. Rising housing prices can bring prosperity to related industries, including construction, home appliances, and furniture [].
Regarding the financial system, real estate mainly affects financial supply, demand, and structure. Rising housing prices create financial supply, easing financing constraints faced by businesses and households in debt financing. The value of real estate owned by businesses and households directly influences their debt repayment ability []. According to the resource-based theory, with a fixed amount of resources, the expansion of non-core businesses such as real estate reduces the resources available for real investment [,]. From the perspective of financial structure channels, rising housing prices may distort the credit structure. When the real estate market thrives, real estate-related loans are more attractive than loans to real enterprises because of their lower risk and stable returns [].
2.3. Risk Spillover Measurement Methods
The methods for measuring risk spillover within the financial system are diverse. With the introduction of the real economy perspective, the research framework has gradually expanded to encompass the linkage between the real economy and the financial system. In terms of research directions, one approach focuses on constructing the interactive relationship between macroeconomic variables and the financial system. Abbas et al. employed the DY spillover index to observe the feedback performance of U.S. stock market indicators with 12 macroeconomic variables []. Shang found that financial markets are net risk output sources for real economy sectors using macroeconomic variables and high-frequency financial data []. However, Hu verified that the real economy could be a risk source for the financial system []. Another approach involves using different quantitative methods to represent the real economy and the financial system to study their risk spillover. Huang and others used the Diebold–Yilmaz (DY) spillover index for fitting and discussed the impact of industry characteristics on the spillover index []. Fang performed measurements using the ∆CoVaR method and used event analysis and orthogonal decomposition to explore specific spillover mechanisms []. In recent years, research on risk spillover relationships has increasingly used the generalized variance decomposition network model proposed by Diebold and Yilmaz (DY model) [,]. The DY model performs vector autoregression (VAR) analysis on the volatility levels of each variable, followed by generalized variance decomposition to determine the volatility spillover relationships among variables. Compared with other popular models such as the Granger causality network and ΔCoVar risk network, the DY model’s unique advantage lies in its ability to explore the interactive relationships among variables and examine multi-period feedback relationships, making it more suitable for studying the tripartite issues involved in this research.
Based on the preliminary findings of the DY model, many scholars have refined it according to their specific research needs. For instance, some researchers employ the Time-Varying Parameter Vector Autoregression (TVP-VAR) model to explore the time-varying characteristics of estimated parameters []. Given that certain sectors of the real economy exhibit pronounced cyclicality and that China’s real estate market and financial system are significantly influenced by policies, displaying evident time-varying features, this study adopts the SV-TVP-VAR model to further incorporate nonlinear time-varying analysis. In this model, the coefficients and covariance matrix change dynamically over time, effectively enhancing estimation accuracy. Moreover, the SV-TVP-VAR model, by fitting data under time-varying conditions, generates more reasonable and contextually relevant analytical results, demonstrating significant advantages over traditional models in both theoretical and practical applications. This methodological advancement not only deepens the understanding of the interactions among the real economy, real estate market, and financial system but also provides policymakers with more precise decision support tools.
3. Model Specification and Data Selection
3.1. Construction of the Real Economy Risk Spillover Model
3.1.1. Indicator Selection
Comparing past research [], drawing from the methodologies of Fang and Li [,], the industry indicators for the real economy risk spillover model in this study are derived from the rates of return representing the real economy indices, obtained through fitting the Wind industry indices. Following the industry classification by the Wind database (detailed classifications are presented in Table 1), the rates of return for each real industry are calculated using the following logarithmic return formula:
where represents a specific real sector or financial market and denotes the price index of . Additional steps include the following. First, the logarithmic rates of return for each sector are calculated according to Equation (1). Second, the method outlined in Equation (2) is employed to extract the overall stock market trend, thus accurately depicting the distinctive rate of return characteristics for each industry.
where represents the calculated logarithmic rate of return for industry and is the logarithmic rate of return of the Shanghai Composite Index and denotes the overall trend of the stock market. Observing Equation (2), the residual () represents the actual rate of return for industry . The volatility and risk spillover calculations in subsequent studies are based on the actual rates of return for each industry. The time period selected for the data used in this risk spillover model spans from January 2000 to April 2023, with all data being daily.

Table 1.
Risk spillover in real economy sectors.
3.1.2. Model Construction
To explore the volatility spillover effects among industries within China’s real economy and their time-varying characteristics, this study integrates the Time-Varying Parameter Vector Autoregression (TVP-VAR) model with the spillover index method based on generalized forecast error variance decomposition (DY) to develop the Time-Varying Parameter Vector Autoregression Spillover Index (hereinafter referred to as TVP-VAR-DY) model for empirical analysis []. Unlike Cholesky decomposition, the spillover index of Diebold and Yilmaz allows for the arbitrary ordering of variables in the generalized forecast error variance decomposition [,]. In contrast to previous techniques using rolling windows, this study employs a time-varying parameter approach to observe the time-varying spillover effects. The TVP-VAR-DY model offers several advantages. It is more suitable for large-scale Bayesian computations without losing the hidden useful information in the original data; in addition to measuring the direction of risk spillover, it can also measure the intensity of risk spillover, thus providing a better description of the characteristics of risk contagion within the real economy.
The N-order TVP-VAR process can be represented as shown in Equation (3).
where denotes the idiosyncratic volatilities of N financial markets, represents the intercept vector, , ⋯, signifies the n × n coefficient matrix, and is the disturbance column vector, with each component being independently and identically distributed.
Let , ; assuming that the coefficient vector βt follows an AR (1) stochastic walk, the equation can be expressed as:
In the above framework, follows a normal distribution with a mean of zero and a covariance matrix of . Koop and Korobilis highlight that in fitting high-dimensional state-space models, both Bayesian Monte Carlo simulation and maximum likelihood estimation have computational disadvantages []. Sequential Bayesian inference can be employed to accomplish these estimations, with detailed Bayesian sampling steps provided in Chan and Eisenstat [].
During the Generalized Forecast Error Variance Decomposition (GFEVD) process, represents the directional spillover from variable j to variable i []. It quantifies the proportion of the impact that variable j has on variable i within the forecast error variance decomposition. The specific formulation is as follows:
where J denotes the horizon of the forecast error variance decomposition, and represents a selection vector (which is 1 at the position of variable i and 0 elsewhere). Based on the GFEVD framework, the Total Spillover Index (TCI) can be expressed as follows:
This index can be used to measure the overall spillover level within the system. The External Spillover Effect Index (TO) is defined as follows:
This index can be utilized to measure the level of risk spillover from one industry to other industries. The overall Directional Inflow Index (FROM) can be expressed as follows:
This index is used to measure the level of risk spillover that i industry receives from other industries. The Net Directional Spillover Index (NET) is defined as the difference between the Total Directional Spillover Index (TO) and the Total Directional Inflow Index (FROM) and is calculated as follows:
This can be interpreted as the net spillover effect of i industry on the system. If the Net Directional Spillover Index of i industry is positive (negative), it indicates that the impact of the variable on the system is greater than (less than) the impact it receives from the system. Finally, the spillover index between pairs of variables can be represented as follows:
This represents the net spillover effect of variable i on variable j. If , it implies that the impact of variable i on variable j is greater than (or less than) the influence it receives from variable j.
3.2. Construction of the SV-TVP-VAR Model among the Real Economy, Real Estate Market, and Financial System
3.2.1. Selection of Indicators
From the real economy risk spillover model, the Real Economy Risk Spillover Index (MO) is obtained. After data processing, variables from the real economy (mo), real estate market (re), and financial system (fc) are selected as endogenous variables to establish the SV-TVP-VAR model. This model analyses the potential time-varying characteristics of the interactions among the real economy, real estate market, and financial system. Data for real estate industry indices and financial industry indices are sourced from the Wind database. In this context, the SV-TVP-VAR model converts the daily data from the aforementioned real economy risk spillover model into quarterly data, selecting the time interval from January 2000 to March 2023.
3.2.2. Model Construction
This study utilizes the SV-TVP-VAR model proposed by Nakajima [], comparing past research [] and following the approach of Huang [], to conduct an empirical analysis of the correlations among variables from the real economy, the real estate market, and the financial system. The advantage of this model lies in its capacity to adapt variances and model parameters over time, thereby reflecting the time-varying, non-linear dynamic relationships and characteristics among the variables. As shown in Equation (12), this model is a typical SV-TVP-VAR model.
where the parameters , , , and are dynamically configured to evolve over time, assuming that all time-varying parameters follow a first-order stochastic walk. Concerning the ordering of variables in the VAR model, the principle is that variables listed later do not influence the preceding variables within the current period but exert effects only in subsequent periods through lagged interactions. Following the perspective of Li et al. [], the variables are sequentially organized based on real economy variables, price variables, and financial variables. Consequently, the composition of is as follows: in this formulation, , where , , and correspond to the real economy, real estate, and financial variables, respectively.
The real economy, real estate, and financial variables serve as foundational variables for the SV-TVP-VAR model in this study, each exhibiting varying degrees of inter-relation and differing impacts. Responses to external risks in the financial system significantly surpass those in the real economy and real estate variables, thus justifying their sequential positioning at the end. Research indicates that real estate prices significantly drive actual output, supporting the arrangement of housing prices following real output. Consequently, employing variables such as , , and to establish the VAR model is justified [,].
4. Empirical Analysis
4.1. Volatility Spillover Effects in the Real Economy
4.1.1. Static Analysis of Volatility Spillover Effects among Real Economy Sectors
This section employs the GFEVD DY method to describe the risk spillover effects among various sectors of the real economy from a static perspective. The Akaike Information Criterion (AIC) is used to determine the optimal lag order nlag of 1, and the forecast horizon nfore is set to seven periods. Table 1 presents the risk spillover effects among real economy sectors, and the subsequent discussion focuses on the directional values of risk spillover in this table. In this context, “FROM” denotes the inflow index, and “TO” denotes the outflow index. ENER, MATE, INDU, MAINCO, OPTCO, PHAR, INFO, TELE, and PUB are used to represent the energy sector, materials sector, industrial sector, daily consumption sector, optional consumption sector, healthcare sector, information technology sector, telecommunications services sector, and utilities sector, respectively.
Based on the nine industry explanatory variables delineated in the real economy risk spillover model, a 9 × 9 variance decomposition risk spillover table is computed, as shown in Table 1. This table illustrates the risk spillover effects among different sectors of China’s real economy. Overall, the risk spillover among these sectors exhibits asymmetry, volatility, and interlinked risk contagion. The diagonal values in the table represent the impact of lagged effects on the current period of the respective sectors.
In Table 1, it can be seen that the lagged effect of the telecommunications services sector on its current value is 76.7%. Compared with other sub-sectors, the telecommunications services market is most significantly influenced by its own lagged effects, which are attributable to the characteristics of the industry. The telecommunications services sector has relatively long construction cycles and requires substantial initial capital investment. Projects in this sector often continue to operate over the long term after construction is completed, resulting in the model exhibiting the largest lagged effect.
Based on the directional perspective of risk spillover, the net spillover effects of the energy, materials, daily consumption, telecommunications services, and utilities industries are negative, while those of other sub-industries are positive. It is evident that the energy, materials, industrial, daily consumption, telecommunications services, and utilities industries are more susceptible to risk spillovers from other industries, while the industrial, optional consumption, healthcare, and information technology industries exhibit higher external risk spillover effects.
From the standpoint of risk spillover across different industries, the industrial sector demonstrates the highest degree of risk spillover at 79%. It serves as a primary information disseminator within the real economy and represents a potentially significant source of systemic risk. This underscores the pivotal position of the industrial sector as the foundation and leading industry within the real economy, attracting greater attention and exhibiting higher market information transmission efficiency and transparency.
The information technology sector exhibits a spillover index of 13.7% towards the industrial sector, while the industrial sector’s spillover index towards the information technology sector is 14.8%, indicating a strong bi-directional dynamic spillover effect between the two sectors. In recent years, China has not only addressed a series of technological challenges but also significantly invested in high-tech industries such as technological hardware equipment and semiconductors, enhancing industrial competitiveness and fostering commercial interactions between the information technology and industrial sectors. This has not only elevated China’s position in the global technology arena and increased the technological content of industrial products but also propelled deep integration within domestic-related industry chains, substantially enhancing indigenous innovation capabilities.
During the selected sample period, there was evident risk interconnectivity among various industries within the real economy, with numerous pathways for risk transmission facilitated by supply chains and technological innovation. Calculations reveal that the average spillover of fluctuations within China’s real economy stands at 49.6%, indicating a considerable likelihood of external risk spillovers.
4.1.2. Dynamic Analysis of Volatility Spillover Effects among Real Economy Sectors
- (1)
- Overall Volatility Spillover in the Real Economy
To investigate the time-varying characteristics of risk spillover effects, the variance decomposition spillover index of the TVP-VAR model is calculated, as shown in Figure 1. It can be observed that the overall level of risk spillover in the real economy fluctuates and exhibits uncertainty during the sample period, ranging from 30% to 80% in a “peak-shaped” distribution. Based on the trend changes depicted in the graph, the sample period can be roughly divided into three periods of significant volatility (risk periods) as follows:
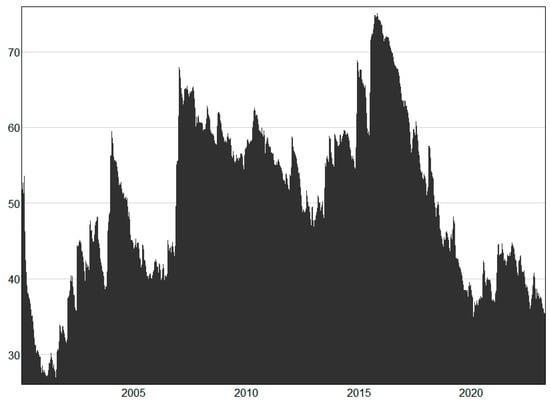
Figure 1.
Overall level of volatility spillover in the real economy.
Period of Economic Overheating (2002–2004): Following China’s accession to the World Trade Organization in 2001, the economy experienced rapid growth, with a substantial increase in imports and exports and a surge in foreign investment, leading to significant job creation. However, this period also revealed numerous issues, including excessive reliance on low-value-added products in the export-oriented light industry and manufacturing sectors, resulting in a single-industry structure. The influx of investments into real estate, infrastructure, and industrial projects led to overheating, even resulting in overcapacity in some sectors and a high-intensity growth model characterized by resource consumption. To address these issues, the central government implemented a series of macroeconomic control measures in 2004 aimed at preventing economic overheating and resource wastage, effectively mitigating the aforementioned problems. These measures included credit tightening, increasing bank reserve requirements, and restricting land supply.
Financial Crisis Period: During the financial crisis period, risks primarily emanated from international transmission, encompassing both the direct impact from the financial crisis epicenter, the United States, and the contagion effects of the financial crisis on various countries, subsequently transmitted to China’s real economy. At that time, as the world’s largest economy, the collapse of subprime mortgages and the bursting of the real estate bubble in the United States triggered significant global economic turmoil. Given China’s heavy reliance on exports as a crucial economic pillar, the sharp decline in foreign trade exports led to a buildup of inventory in many enterprises, widening funding gaps, and dealing a heavy blow to the development of real industries. The impact of export trade quickly spread and intensified within the domestic supply chain.
Stock Market Crash Period (2014–2015): During the stock market crash period, the risk spillover index of the real economy reached its peak, exceeding 70%. During this period, China’s economic growth rate continued to slow down, entering a painful period of economic structural transformation. Traditional manufacturing faced issues of overcapacity, while emerging industries had not yet matured enough to become the primary drivers of economic growth, resulting in overall economic inefficiency. Meanwhile, the flow of funds in the stock market was obstructed, rendering it unable to effectively fulfill its financing function and losing its role in serving the real economy. Because of the bearish market sentiment and excessive deviation in stock market volatility, the liquidity of investment and financing funds dried up, resulting in significant negative effects on the development of the real economy. This affected the normal financing activities of corporate entities, thereby inhibiting consumption and investment behaviors in the real economy. As a result of insufficient domestic consumption confidence, external export challenges, adjustments in the real estate market, and other factors, key economic indicators such as the national GDP growth rate continued to decline, with various real industries experiencing a painful period. Subsequently, targeted policies and measures were proposed, such as the five major tasks of eliminating backward production capacity and upgrading housing in shanty towns, aimed at revitalizing the Chinese economy.
- (2)
- Directional Volatility Spillover Among Real Industries
To study the temporal characteristics of directional spillover effects among different industries in China’s real economy, directional spillover indices and directional inflow indices were employed. Figure 2 illustrates the dynamic spillover effects of a specific real industry on other real industries (“TO others”), while Figure 3 represents the dynamic inflow effects of a specific real industry from other real industries (“FROM others”).
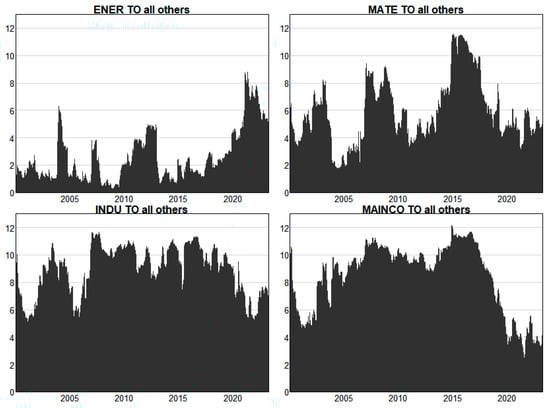
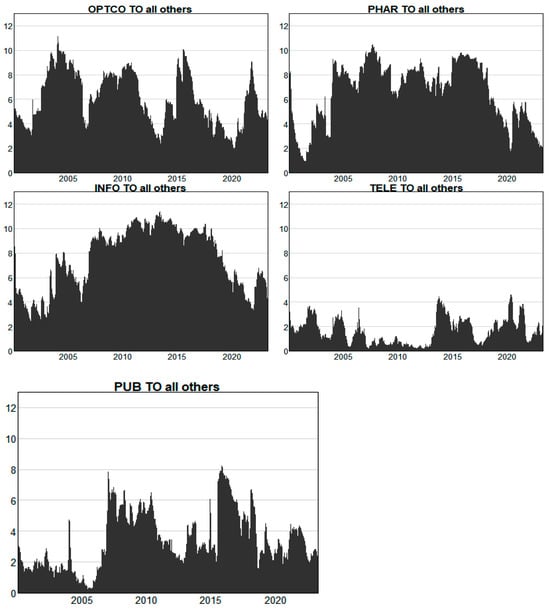
Figure 2.
Directional spillover of volatility among real economy sectors. (To others).
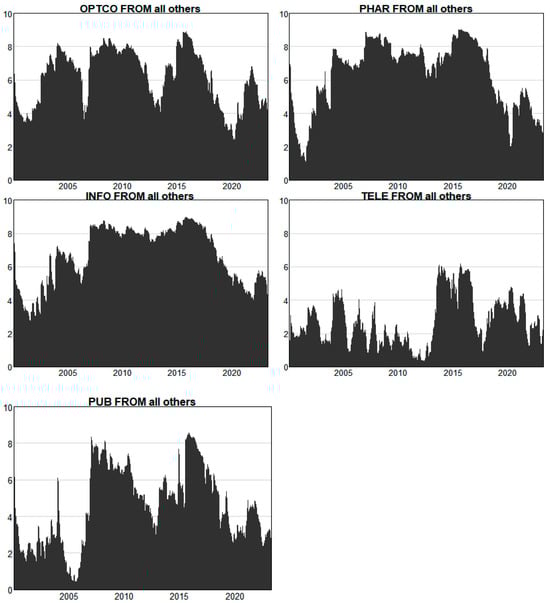
Figure 3.
Directional spillover of volatility among real economy sectors. (From others).
Considering the volatility spillover situation in each industry, the industrial, daily consumption, and information technology sectors emerge as the core risk aggregation sectors within the real economic system, while the energy, telecommunications, and public utilities sectors exhibit relatively stable volatility patterns. Industrial enterprises, as the core competitive force in the manufacturing powerhouse, consistently align with the overall trend in economic development. During critical periods of economic structural transformation, these enterprises experienced several sharp increases in risk, including the aforementioned three volatile periods, as well as a rapid surge in 2020. During the pandemic, disruptions occurred in global supply chains, overseas demand plummeted significantly, and disease control measures led to a decrease in labor efficiency. In the first two months of 2020, the value added of industrial enterprises above designated size fell by 13.5% year-on-year, the service production index declined by 13%, fixed asset investment dropped by 24.5%, the total retail sales of consumer goods decreased by 20.5%, and exports were down by 15.9% (Data source: National Bureau of Statistics of China). In comparison, China’s energy, telecommunications, and public utilities sectors, because of government regulation and partial marketization of prices, exhibited relatively smaller fluctuations in their volatility.
Upon examining the risk inflow and outflow in detail, it is evident from Figure 2 that there are significant heterogeneities in the volatility spillover effects and inflow effects of the energy, materials, and telecommunications industries, especially with the telecommunications industry exhibiting a relatively stable spillover effect but significant volatility in the inflow effect, with similar patterns observed in the other two markets. Both Figure 2 and Figure 3 demonstrate the existence of volatility spillover effects among different industries within the real economy. Clearly, the industrial, daily consumption, and information technology industries consistently exhibit strong risk outputs in different periods, serving as the main risk output channels within the real economy. Conversely, the materials, industrial, daily consumption, optional consumption, healthcare, and information technology industries serve as the primary risk absorbers in the economic system. Generally, industries with risk spillover effects are usually positioned upstream in the industrial chain and serve as foundational industries or play pioneering roles in the real economy. For instance, technological innovations in the information technology sector can be extensively applied across various industries, thereby amplifying its risk spillover effects. Consequently, these innovations exert a more pronounced spillover effect on other sectors. During typical risk periods such as financial crises, it can be observed that the risk spillover effects among industries intensify, especially with a notable increase in the risk spillover degree of the materials and daily consumption industries.
4.2. SV-TVP-VAR Model Empirical Results
4.2.1. Unit Root Test and Optimal Lag Length Selection
To ensure the stationarity of all endogenous variables in the model, unit root tests were conducted on the real economy risk spillover index, real estate index, and financial system index. The final test results are as follows:
The results indicate that MO, RE, and FC are all non-stationary. Next, a cointegration test was conducted on MO, RE, and FC to confirm their stable relationship statistically. The empirical results show that the null hypothesis is not rejected, indicating that no cointegration exists. Therefore, only first-order differencing can be applied to the data. As shown in Table 2, after differencing, the p-values of the variables MO, RE, and FC are all less than 0.05, rejecting the null hypothesis and indicating they are all stationary variables. Finally, based on information criteria such as SC, AIC, HQ, etc., the optimal lag order of the model was determined to be 1 (as shown in Table 3).
Table 2.
Unit root test results.
Table 3.
Optimal lag length selection.
4.2.2. SV-TVP-VAR Model Empirical Results
Based on the previous processing, the SV-TVP-VAR model was constructed using the variables representing the real economy (mo), the real estate market (re), and the financial system(fc) as endogenous variables. Parameter estimation was performed using the Markov Chain Monte Carlo (MCMC) sampling method with 10,000 iterations. Subsequently, the first 1000 samples were discarded as burn-in values, and the remaining 9000 samples were used to estimate the posterior distributions of the parameters.
As shown in Table 4, the posterior means of all parameters fall within the 95% confidence interval, and the standard deviations of each parameter are relatively small. This indicates that the parameter estimation results are relatively good, and the values of the Geweke statistics do not exceed 1.96. At a 5% significance level, these results do not reject the null hypothesis that the MCMC chain converges to the posterior distribution, thereby confirming convergence. The ineffective coefficients of the parameters range from 4.62 to 235.21, with the largest being 235.21. This implies that at most approximately 42 samples (10,000/235.21) can be produced, which are uncorrelated and can be used for effective posterior inference. This indicates that a sufficient number of uncorrelated samples were obtained using the MCMC algorithm, demonstrating good model estimation performance.
Table 4.
Estimation results of parameters to be estimated in the SV-TVP-VAR model.
Figure 4 illustrates the trends and volatility in variables such as mo, re, and fc. It can be observed that the real economic variable peaked in 2004 (during economic overheating), 2007 (during the financial crisis), 2014 (during the stock market crash), 2018 (amidst the U.S.–China trade war), and 2020 (during the COVID-19 pandemic), while in other years it tended towards zero. Under the robust macroeconomic control of the central government, all external shocks stabilized in the short term.
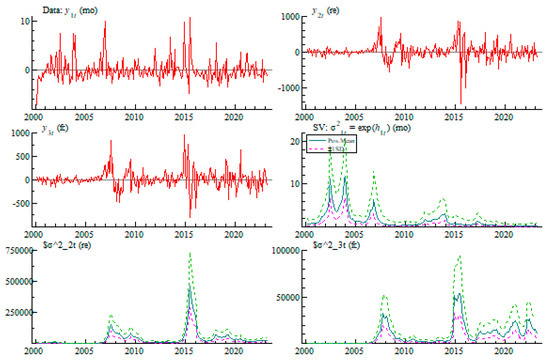
Figure 4.
Time-varying characteristics of variable stochastic volatility.
Before the outbreak of the financial crisis in 2008, the volatility in real estate prices remained stable. With the occurrence of the crisis, the real estate market experienced a brief decline. Simultaneously, because of the significant blow to external trade, economic growth expectations weakened, leading to a decline in household income, further reducing the willingness to purchase real estate. However, with the introduction of the “four trillion” stimulus plan by the Chinese government, the real estate market significantly recovered by 2010, returning to its previous active state. Starting in 2015, the real estate market’s risk sharply increased, especially in third- and fourth-tier cities where oversupply led to a buildup of unsold properties, reaching historic highs. In response to this challenge, the central government launched a series of destocking measures in 2016, particularly targeting the real estate industry, including lowering the threshold for home purchases and advancing the shantytown renovation plan. These measures promptly stabilized the real estate market, restoring it to a steady state. Subsequently, since 2016, the volatility of housing prices has gradually decreased, trending towards stability. In 2019 and 2021, the Chinese real estate market experienced several brief “mini-booms”, primarily benefiting from improvements in the macroeconomic environment, moderate policy relaxations, and economic recovery post-pandemic. These factors collectively contributed to the revitalization of the real estate market after a period of adjustment.
Observing the changes in the financial system reveals its role as a key executor of macroeconomic policies during critical periods. In the event of an economic slowdown or increased external economic pressure, the Chinese government typically adjusts monetary policy to stimulate economic growth through the financial system as an intermediary. Overall, the random volatility in variables in the model is highly consistent with the actual economic situation in China, reflecting the close relationship between policy adjustments and economic responses. This strategy not only contributes to short-term economic stability but also plays a crucial role in formulating and implementing long-term economic adjustment strategies.
As illustrated in Figure 5, the impulse response functions at lags of one period (one quarter), two periods (6 months), and four periods (1 year) respectively portray the short-term, medium-term, and long-term impacts of shocks, aiming to discern the disparities in the effects of shocks during different cycles. The horizontal axis of this graph represents time points in years, while the vertical axis depicts the impulse response values of each variable. The findings reveal that at a lag of one period (one quarter), the impact of shocks on the remaining variables is relatively pronounced for all variables. After two periods (6 months), the impact significantly diminishes, and after four periods (1 year), it essentially diminishes to zero.
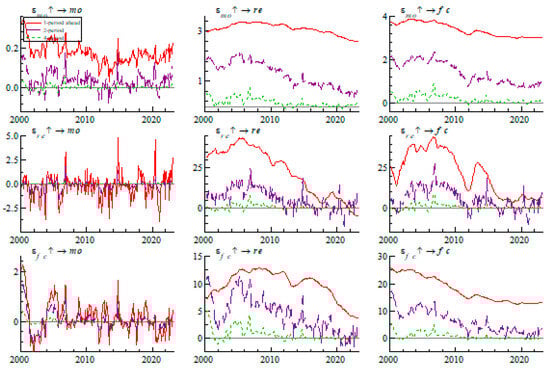
Figure 5.
Equally spaced impulse response function diagram.
Upon analyzing the real estate market and financial system, both exhibit notable lagged effects in the early stages. A one standard deviation shock in the real estate market can yield feedback effects exceeding 20-fold, especially in 2008 when the lagged effect of the real estate market peaked. Subsequently, this intense positive correlation gradually waned, transitioning to a reverse relationship after 2020, signaling significant market dynamics. Regarding the financial system, although its inherent lagged effects have somewhat declined, they remain at relatively elevated levels, particularly after 2010, stabilizing at a level of 10 units. This indicates that while the financial system’s response to shocks has attenuated, it still retains significant market influence. In contrast, the response of the real economy to shocks is notably modest. Faced with a one-unit economic shock, the fluctuation in the real economy is exceedingly small, typically not surpassing 0.3 units. This phenomenon underscores the stability of the real economy and its robust resistance to external shocks. Additionally, it reveals the distinctiveness and minor lagged effects exhibited by the real economy across different time periods.
- (1)
- Impact of Real Estate Market Shocks
The impact of real estate market fluctuations on the real economy’s risk spillover varied throughout the sample period. In certain years marked by real estate market risks, the risk to the real economy was significantly amplified. Conversely, in other phases, there was even a slight attenuation of internal risk fluctuations within the real economy, effectively buttressing China’s economic growth. Notably, in 2007, 2015, and 2020, conspicuous peaks were observed, corresponding to three distinct periods of real estate market risk accumulation. In 2007, real estate was perceived as a prime investment avenue, attracting substantial domestic capital influx and significant foreign investment, swiftly driving up property prices. In 2015, the effective outcomes of urban shantytown redevelopment expedited the urbanization process, albeit accompanied by differentiation; third- and fourth-tier cities faced population outflows and severe inventory backlogs. In 2020, China swiftly controlled the epidemic worldwide while maintaining normal domestic production and living operations. Consequently, localized real estate markets experienced a robust rebound, leading to another significant surge in property prices.
Examining the impact on the financial system, there was pronounced short-term volatility. Pre-2009, the impact remained predominantly positive, gradually decreasing thereafter to relatively lower levels of fluctuation. Comparatively across different cycles, in the short term, the prosperity of the real estate market consistently mirrored that of the financial system. However, in the medium term, there were reverse effects on the financial system. From a long-term perspective, the impact consistently hovered around zero, dissipating gradually over a year or longer timescale. This phenomenon could be attributed to the real estate market’s long-term trends being more significantly influenced by factors such as economic fundamentals and demographic dynamics. The concurrent prosperity of the real estate and financial markets stems from multifaceted factors. Since China’s accession to the World Trade Organization, the national economy has undergone rapid growth, accompanied by increased household income and significant improvements in urbanization and infrastructure levels. These factors collectively elevated residents’ purchasing power and willingness to buy homes, thereby effectively propelling the rapid development of the real estate market. As the real estate market thrived, expectations of future property price increases among residents also rose accordingly, further incentivizing banks to acquire a substantial volume of stable and highly profitable long-term lending businesses, establishing a virtuous cycle of positive feedback. However, the outbreak of the global financial crisis in 2009 disrupted this trend. Because of global economic turbulence, China’s economic growth and household income were affected, leading to a decline in rigid demand in the real estate market. Simultaneously, investment demand reliant on anticipated property price increases also diminished, further weakening the positive feedback loop between the real estate market and the financial system.
- (2)
- Impact of Financial System Shocks
From the perspective of financial system impact, the influence of the financial system on the real economy is significantly less than the latter’s impact on the former, aligning with China’s policy positioning of financial services to the real economy. As the core driver of the Chinese economy, the development of the real economy not only generates a large number of employment opportunities but also serves as the primary source of national income. The prosperity of the real economy’s demand further promotes the development of the financial market, with the financial system serving as an important collaborator in supporting the development of the real economy through the provision of various financial instruments and channels. However, the development of the financial system itself is insufficient to drive the growth of the real economy directly, and its profit-seeking capital characteristics may compete with the real economy for resources. Consequently, the financial system often plays an intermediary role in China’s economic transformation, sacrificing for the real economy, counter-cyclical adjustment, and policy support, thereby indirectly empowering Chinese enterprises.
Regarding the real estate market, the impact of the financial system had a significant positive effect on the real estate market before 2008, indicating that financial support could stimulate real estate market prosperity within a quarter. However, after the 2008 financial crisis, this impact began to decline gradually. By 2013, with the relaxation of local home purchase policies and improvement in credit conditions, there was a short-term reversal in the real estate market. However, since 2016, following the central government’s “housing not for speculation” policy, the supportive role of the financial system in the real estate market has gradually diminished. On the one hand, this is due to the government implementing a series of robust real estate control policies, such as the “three red lines” policy and concentrated land supply strategy. On the other hand, because of the strict regulation of traditional banks, some financial demand shifted to the rapidly growing shadow banking sector, making it difficult for regulatory agencies to capture such demand. Since 2020, although the financial system can still affect the real estate market in the short term, there has been an unusually sustained negative impact. This change reflects the severe challenges facing the real estate market after two decades of prosperity, with shattered expectations of rising property prices and no signs of short-term recovery. In this scenario, a series of policies aimed at stimulating the real estate market have weakened in effect, leading to a continued slump in the Chinese property market, which is one of the primary issues that China presently faces.
- (3)
- Impact of Real Economy Shocks
From the perspective of the impact on the real economy, compared with the impacts of the real estate market and the financial system, the disturbances brought by the real economy are relatively minor and relatively stable, yet they also exhibit characteristics of short-term fluctuations and gradual long-term ineffectiveness. Before 2010, the impact of the real economy retained a minor ripple effect, but after 2010, this impact was typically absorbed by the market within a year, indicating the short-term nature and self-adjusting capability of the impact of the real economy disturbances.
As the mainstay of the economy, when systemic downturns occur, nations typically resort to robust accommodative policies and counter-cyclical measures to cushion such impacts, and these macroeconomic controls have profound implications for both the real estate market and the financial system. During periods of real economic downturn, the real estate market is often viewed as a relatively safe and stable asset, attracting significant capital inflows as a means of value preservation and appreciation. Simultaneously, governments are motivated to stimulate the real estate market to spur overall economic recovery quickly. Given the close interconnection among the real estate industry and multiple upstream and downstream industrial chains, its stimulating effect on the economy is significant. Measures such as tax reductions, interest rate cuts, relaxed lending conditions, and the introduction of housing subsidies are often employed to activate the real estate market, thereby boosting overall economic activity. However, over time, this trend weakens annually, and the medium to long-term impact gradually becomes rational, far below the short-term fluctuations in speculative capital. In addressing the downturn of the real economy, governments typically employ stimulus policies to mitigate economic risks, such as providing special loans, supporting loans to small- and medium-sized enterprises, and implementing targeted credit policies. The financial system plays a crucial intermediary role in this process by supporting the stability and growth of the real economy through financial services.
From the equally spaced impulse response results, it can be observed that the interactions among various variables exhibit strong time-varying characteristics. To further investigate the potential time-varying features of the interactions among the real economy, the real estate market, and the financial system, this study selected the following three impulse time points: the international financial crisis (July 2008), the U.S.–China trade war (March 2018), and the COVID-19 pandemic (January 2020). The resulting impulse response outcomes indicate that the intensity of reactions during crises is more pronounced, significantly exceeding the average levels.
In Figure 6, it can be seen that the impact of the real estate market on the risk spillover to the real economy varies significantly across the three different periods. During the U.S.–China trade war, the spillover effect of real estate market shocks on the real economy’s risk is positive within a lag of two periods, whereas during the financial crisis and the COVID-19 pandemic, this effect turns negative; after three periods, the transmission feedback dissipates. Unlike previous studies, the positive impact observed during the U.S.–China trade war may be attributed to the significant impact on China’s export trade total in the context of tense U.S.–China trade relations, especially affecting the offshore manufacturing sector struggling with tariff issues. Because of the U.S. technological blockade and trade sanctions against high-end manufacturing enterprises, some critical technology firms listed on the Entity List lost parts of the overseas market, directly affecting their normal production activities. Additionally, during the U.S.–China trade war, the significant increase in uncertainty severely undermined the confidence of domestic and foreign investors. Overseas capital grew concerned about China’s market growth prospects, and domestic capital faced confusion and unease about the unclear future. This situation led to a weakened overall investment drive, affecting not only investments in the real economy but also dampening investment sentiment in the real estate market.
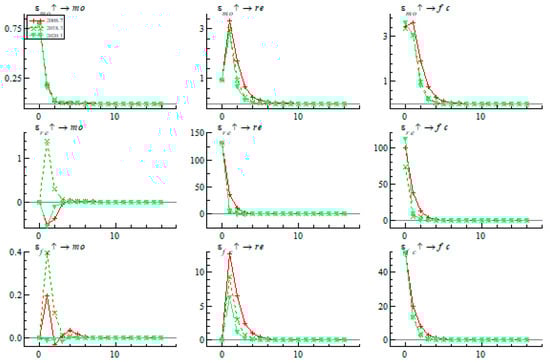
Figure 6.
Time-point impulse response function diagram.
For the financial system, the intense volatility exhibited by real estate, which has investment attributes during crises, caused enormous impacts, potentially surpassing the effects on the real economy by a hundredfold. This impact peaked during the COVID-19 pandemic, while it was relatively smaller during the U.S.–China trade war. However, regardless of whether it was the pandemic or the trade war, these impacts significantly weakened by the second period, approaching zero. During the global financial crisis, the financial system experienced more extensive and profound impacts; yet, a year later, this impact gradually dissipated, nearing zero.
The dynamic performance of financial shocks on the real estate market is characterized by a rapid initial escalation followed by a swift decline. Within a lag of four periods, this impact remains consistently positive; however, after the financial crisis, it remains positive, while during the U.S.–China trade war and the COVID-19 pandemic, this impact gradually converges to zero. Across these three stages, the response trend in the real estate market to financial shocks is similar, remaining significantly positive within four periods and gradually dissipating thereafter. Particularly in 2018 and 2020, relative to 2008, the real estate market’s response to financial volatility weakened. During the financial crisis, China’s real estate market was still in its early development stages, and the growth demand generated by population growth and urbanization provided ample incremental space for the real estate market. Moreover, because of controlled capital flows, the real estate market was relatively less impacted by the financial crisis. Additionally, the proactive fiscal policies implemented in 2008 created conditions for the rapid rebound of the real estate market. In comparison, the impact of the COVID-19 pandemic was more widespread, with the temporary prosperity of the real estate market mainly driven by certain first- and second-tier cities, resulting in a relatively weaker response to financial fluctuations.
In contrast to the real estate market’s response, the response of the real economy market is very weak, not even reaching one standard deviation, reflecting the auxiliary role of financial markets in the real economy. As the primary sector for job creation, goods production, and service provision, the prosperity of the real economy will drive economic growth and social progress, stimulating the demand for more financial instruments and products, thereby promoting the development of the financial industry. The financial system should provide necessary financial support to the real economy, assisting in technological upgrades and expanding reproduction. Furthermore, financial instruments and services can help manage risks and improve operational efficiency while also avoiding the damage caused by financial bubbles and excessive speculation in the real economy.
At the three key shock points, the impact of real economy risk spillover on the real estate market exhibits consistency. Specifically, the risk spillover from the real economy has a positive effect on house prices within a lag of two periods. This phenomenon can be explained by the fact that during periods of real economic downturn, investors typically allocate funds to the relatively stable real estate market for asset allocation and profit maximization considerations. However, this impact gradually weakens between two and six periods. If the downtrend in the real economy does not improve effectively, the upward momentum of the real estate market will weaken and may quickly turn into a downward trend. This indicates that the linkage between the real estate market and the real economy is gradually weakening.
For the financial market, the impact of real economy risk spillover also exhibits certain regularity. Within zero to four periods, the increase in the real economy risk spillover index often leads to increased support from the financial system to the real economy, reflected in the relative stability or growth of the financial market. However, after four periods, the positive effect of real economy risk spillover on the financial market disappears, transitioning to zero. If the recession in the real economy persists and fails to improve effectively, the financial system may also exhibit a sluggish state, reflecting the sensitivity and dependence of financial markets on real economic changes.
5. Conclusions and Recommendations
5.1. Conclusions
The real economy has a close risk spillover relationship with the financial system. Meanwhile, the real estate industry significantly encroaches upon real economic resources, depending highly on the financial system and showing speculative characteristics. Therefore, placing the real economy, real estate market, and financial system within the same research framework is conducive to observing the risk spillover process of these three entities and effectively controlling systemic risks. This study, based on the TVP-VAR-DY model, selects nine types of real sector indices and constructs a real economic risk spillover index, which is essentially consistent with the actual operation of the real economy and can serve as a proxy variable for the real economy. In the construction process, variance decomposition indices are constructed from both static and dynamic perspectives, thus analyzing the risk spillover relationship among different industries and considering the overall feedback linkage of the real economy in terms of intensity and direction. Then, real estate variables and financial variables are introduced, constructing a three-variable SV-TVP-VAR model and selecting important time nodes to analyze the dynamic characteristics of risk spillover among the three.
The empirical research findings of this study include the following. (1) From a static perspective, risk spillover among real economic sectors exhibits asymmetry, volatility, and systemic risk contagion. The degree of risk spillover in the industrial sector is the highest at 79%, with an average risk spillover of 49.6% in China’s real economy, indicating a high possibility of outward risk spillover. From a dynamic perspective, overall risk spillover in the real economy is relatively stable, with significant fluctuations only during risk periods such as economic overheating in 2002–2004, the financial crisis in 2007–2008, and stock market crashes in 2014–2015. The industrial sector, daily consumption sector, and information technology sector maintain strong risk output in different periods, with risk spillover enhanced during risk periods. (2) Under equal variable shocks, the impact is relatively significant within a quarter, significantly reduced within half a year, and essentially zero within a year. The prosperity of the real estate market has always been consistent with the prosperity of the financial system, but the impact significantly increases the risk of the real economy during the accumulation period of risk in the real estate market. The financial system serves the real economy, with the latter being less affected, but the financial system maintained a significant boosting effect on the real estate market before 2008, gradually declining afterward and even turning into a negative impact after 2020. (3) Crises exacerbate the degree of risk spillover, but the causes of crises and socio-economic backgrounds result in heterogeneous fluctuations.
5.2. Recommendations
This study offers certain policy implications. Firstly, by incorporating the real economy, real estate sector, and financial system into a unified research framework, considering their time-varying interactions, this framework represents a significant approach to monitoring systemic risks. For example, before the financial crisis in 2008, overly accommodative monetary policies could be used to stimulate the real estate market, but this effect gradually weakened thereafter and never had a significant impact on the real economy. Faced with significant shocks from major unexpected events, policy interventions should primarily rely on fiscal measures to expedite the recovery of the real economy given the current economic conditions. Secondly, by delineating the internal risk transmission paths within the real economy, particular emphasis should be placed on industries vulnerable to external shocks to prevent them from becoming sources of risk spillover. Therefore, it is imperative to intensively monitor industries with higher risks of spillover before risks fully materialize, effectively halting further risk transmission through targeted risk management by regulatory authorities. Given the deep interdependence between the real estate market and the financial system, a large-scale collapse in the real estate sector, such as widespread unfinished housing projects, would swiftly propagate risks to the financial sector, significantly increasing the non-performing loan ratio of banks. This transmission of risk not only exacerbates credit risks for financial institutions but also substantially amplifies the latent risks faced by the financial system, posing a potential threat to financial stability. Lastly, a more precise understanding of the role of the real estate industry in economic development is crucial. While the concept of “housing not for speculation” has been widely embraced in real estate market regulation, the potential rupture of bubble risks during the regulatory process cannot be overlooked. Therefore, careful consideration should be given to adopting gradual and moderate measures to mitigate these risks smoothly. Alongside stringent control of risks in the real estate industry, stricter policies, such as “guaranteed delivery of completed properties”, should be implemented to mitigate the impact on upstream and downstream industries of the real economy, including providing liquidity and strengthening fund supervision, thus effectively resolving the financial risks brought about by real estate regulation. Moreover, by allowing local governments to implement tailored policies based on local conditions, latent housing demand can be effectively stimulated, thereby alleviating the downward trend in the real estate market to the greatest extent possible. Accompanied by the implementation of more precise measures such as affordable housing construction, urban village transformation, and renovation of old communities, the objective housing needs of low-income populations in major cities can be reasonably addressed.
In recent years, China has intensified efforts to prevent and mitigate systemic financial risks, further consolidating the bottom line of preventing systemic risks and clarifying the transmission channels of systemic risks. These measures aim to adhere to the principle of “housing not for speculation” in the real estate market more effectively, preventing major risk events in real estate enterprises. Given the complexity of the current real estate market and its importance to the economic system, it is anticipated that policymakers will continue to prioritize the real estate market in regulation in the foreseeable future. This will involve accurately positioning the real estate market to ensure its healthy development while avoiding overheating or bubble risks. Additionally, real estate support policies will be integrated into the core components of the macro-prudential policy framework to ensure that these policies effectively promote stable economic growth while preventing and mitigating potential systemic risks. Policymakers also need to find the appropriate balance between supporting the development of the real estate market and maintaining economic stability, which will be an ongoing challenge and policy objective.
At the same time, it must be acknowledged that the current state of the Chinese real estate market remains challenging. Since the beginning of this year, policies including establishing a white list for real estate financing coordination mechanisms and lowering the loan prime rate (LPR) have been implemented. By the end of April 2024, nearly 30 cities had launched policies for “old for new” housing transactions and various cities had comprehensively relaxed restrictions on home purchases. Despite the government’s efforts to promote the healthy development of the real estate sector, the market is facing difficulties. Data show that in the first quarter of 2024, the national sales area of residential buildings decreased by 23.4% year-on-year, and the sales value of residential buildings decreased by 30.7% year-on-year (Data source: National Bureau of Statistics of China). It is believed that stimulating residents’ demand for home purchases and reversing market expectations will continue to be a major challenge for the government. Furthermore, there is concern among the public about the possibility of deflation in China. In July 2023, the Consumer Price Index (CPI) decreased by 0.3% year-on-year but increased by 0.2% month-on-month (Data source: National Bureau of Statistics of China).
Finally, the limitations of this article and directions for further research are summarized as follows. (1) This study is limited to a single perspective focusing on China. If data comparability allows, it would be beneficial to include comparisons with developed countries and other emerging economies to further explore the driving factors behind the impact. (2) Currently, this research is limited to studying the impact itself without an in-depth analysis of the influencing mechanisms. This could be a potential area for future research. (3) Future research can consider incorporating other representative indices to discuss the differences from various perspectives, highlighting the characteristics represented by different indices. Additionally, it would be appropriate to introduce more advanced time-varying models to better capture changes in risk spillovers. (4) This study can serve as a reference for emerging countries similar to China.
Author Contributions
Conceptualization, H.Y. and Y.W.; methodology, H.Y. and Y.W.; software, Y.W.; validation, H.Y.; formal analysis, H.Y. and Y.W.; investigation, Y.H.; resources, Z.D.; data curation, H.Y.; writing—original draft preparation, H.Y. and Y.W.; writing—review and editing, H.Y.; visualization, Y.W.; supervision, Z.D.; project administration, Y.H.; funding acquisition, Z.D. All authors have read and agreed to the published version of the manuscript.
Funding
This research work was partly supported by the National Natural Science Foundation of China under Grant No. 71850014.
Data Availability Statement
The data presented in this study are available on request from the corresponding author.
Conflicts of Interest
The authors declare no conflicts of interest. Informed consent was obtained from all individual participants included in this study.
References
- Gong, X.-L.; Zhao, M.; Wu, Z.-C.; Jia, K.-W.; Xiong, X. Research on tail risk contagion in international energy markets—The quantile time-frequency volatility spillover perspective. Energy Econ. 2023, 121, 106678. [Google Scholar] [CrossRef]
- Huang, C.-L.; Shang, Y.-F.; Liu, X.-L. Industry Characteristics, Risk Spillover of Real Economy and Financial Industry. Macroeconomics 2021, 3, 5–24+110. [Google Scholar]
- Glawe, L.; Wagner, H. China in the middle-income trap? China Econ. Rev. 2020, 60, 101264. [Google Scholar] [CrossRef]
- Yu, X.; Wang, P. Economic effects analysis of environmental regulation policy in the process of industrial structure up-grading: Evidence from Chinese provincial panel data. Sci. Total Environ. 2021, 753, 142004. [Google Scholar] [CrossRef]
- Li, Q.; Wang, S.; Song, V. Product competition, political connections, and the costs of high leverage. J. Empir. Financ. 2023, 74, 101430. [Google Scholar] [CrossRef]
- Cincinelli, P.; Pellini, E.; Urga, G. Leverage and systemic risk pro-cyclicality in the Chinese financial system. Int. Rev. Financial Anal. 2021, 78, 101895. [Google Scholar] [CrossRef]
- Umar, M.; Sun, G. Determinants of non-performing loans in Chinese banks. J. Asia Bus. Stud. 2018, 12, 273–289. [Google Scholar] [CrossRef]
- Zhang, X.; Wei, C.; Lee, C.-C.; Tian, Y. Systemic risk of Chinese financial institutions and asset price bubbles. N. Am. J. Econ. Financ. 2023, 64, 101880. [Google Scholar] [CrossRef]
- Huang, Y.; Pagano, M.; Panizza, U. Local Crowding-Out in China. J. Financ. 2020, 75, 2855–2898. [Google Scholar] [CrossRef]
- Li, H.; Li, J.; Jiang, Y. Exploring the Dynamic Impact between the Industries in China: New Perspective Based on Pattern Causality and Time-Varying Effect. Systems 2023, 11, 318. [Google Scholar] [CrossRef]
- Kun, C.T.S. Research on the Inhibitory Influence of Housing Speculation on Enterprise Real Economy Investment. Soc. Sci. J. 2023, 5, 125–132. [Google Scholar]
- Rogoff, K.; Yang, Y. Has China’s housing production peaked? China World Econ. 2021, 29, 1–31. [Google Scholar] [CrossRef]
- Cai, Z.; Liu, Q.; Cao, S. Real estate supports rapid development of China’s urbanization. Land Use Policy 2020, 95, 104582. [Google Scholar] [CrossRef]
- Fang, Y.; Jin, Z.B.; Ma, X. The Spillover Effect of Chinese Real Estate Marketon Banking Systemic Risk. China Econ. Q. 2021, 6, 24. [Google Scholar]
- Allen, F.; Gu, X.; Li, C.W.; Qian, J.; Qian, Y. Implicit guarantees and the rise of shadow banking: The case of trust products. J. Financial Econ. 2023, 149, 115–141. [Google Scholar] [CrossRef]
- Schwarcz, S.L. Shadow Banking, Financial Markets, and the Real Estate Sector. Rev. Bank. Fin. L. 2012, 32, 179. [Google Scholar] [CrossRef][Green Version]
- Chaney, T.; Sraer, D.; Thesmar, D. The Collateral Channel: How Real Estate Shocks Affect Corporate Investment. Am. Econ. Rev. 2012, 102, 2381–2409. [Google Scholar] [CrossRef]
- Chen, T.; Liu, L.X.; Zhou, L.-A. The crowding-out effects of real estate shocks–evidence from China. Available SSRN 2584302 2015. [Google Scholar] [CrossRef]
- Cuñat, V.; Cvijanović, D.; Yuan, K. Within-Bank Spillovers of Real Estate Shocks. Rev. Corp. Financ. Stud. 2018, 7, 157–193. [Google Scholar] [CrossRef]
- O’Malley, T. The Impact of Repossession Risk on Mortgage Default. J. Financ. 2021, 76, 623–650. [Google Scholar] [CrossRef]
- Fang, Y.; He, W.; Jing, Z. A Study of Risk Spillovers between China’s Real Economy and Financial Markets. J. World Econ. 2021, 44, 3–27. [Google Scholar]
- Xiang, Y.; Borjigin, S. Downside and upside risk spillovers between financial industry and real economy based on linear and nonlinear networks. Int. Rev. Econ. Financ. 2023, 88, 1337–1374. [Google Scholar] [CrossRef]
- Juwei, Z.W.Z. China’s Virtual Economy and Calculation of the Scale of Its Added Value: From the Perspective of Sources of National Income. Soc. Sci. China 2022, 8, 20. [Google Scholar]
- Xu, S.J.; Dong, J.C.; Dong, Z.; Li, X.T. The impact of rising housing prices on investment behavior of real enterprises: An industry chain perspective. Manag. Rev. 2024, 36, 40–48. [Google Scholar] [CrossRef]
- Guo, K.; Kang, Y.; Ma, D.; Lei, L. How do climate risks impact the contagion in China’s energy market? Energy Econ. 2024, 133, 107450. [Google Scholar] [CrossRef]
- Tong, Z.; Xie, X.; Deng, M. A Study on the Social-digestion Mechanism of Banks’ Systemic Risk in China. Econ. Res. J. 2018, 53, 16. [Google Scholar]
- Zihui, Y.; Yinggang, Z. Global Systemic Financial Risk Spillovers and Their External Shocks. Soc. Sci. China 2020, 41, 24. [Google Scholar] [CrossRef]
- Gkillas, K.; Tsagkanos, A.; Vortelinos, D.I. Integration and risk contagion in financial crises: Evidence from international stock markets. J. Bus. Res. 2019, 104, 350–365. [Google Scholar] [CrossRef]
- Asgharian, H.; Nossman, M. Risk contagion among international stock markets. J. Int. Money Finance 2011, 30, 22–38. [Google Scholar] [CrossRef]
- Sun, T. Identifying Vulnerabilities in Systemically Important Financial Institutions in a Macro-Financial Linkages Framework. J. Econ. Asymmetries 2010, 7, 77–103. [Google Scholar] [CrossRef]
- Kleinow, J.; Nell, T. Determinants of systemically important banks: The case of Europe. J. Financ. Econ. Policy 2015, 7, 446–476. [Google Scholar] [CrossRef]
- Pais, A.; Stork, P.A. Contagion risk in the Australian banking and property sectors. J. Bank. Financ. 2011, 35, 681–697. [Google Scholar] [CrossRef]
- Barja, A.; Martínez, A.; Arenas, A.; Fleurquin, P.; Nin, J.; Ramasco, J.J.; Tomás, E. Assessing the risk of default propagation in interconnected sectoral financial networks. EPJ Data Sci. 2019, 8, 32. [Google Scholar] [CrossRef]
- Zhu, Z.; Luo, Q. Inter-industry risk spillover, role reversal, and economic stability. Financ. Res. Lett. 2023, 57, 104246. [Google Scholar] [CrossRef]
- Midmore, P.; Munday, M.; Roberts, A. Assessing industry linkages using regional input–output tables. Reg. Stud. 2006, 40, 329–343. [Google Scholar] [CrossRef]
- Marconi, N.; Rocha, I.L.; Magacho, G.R. Sectoral capabilities and productive structure: An input-output analysis of the key sectors of the Brazilian economy. Braz. J. Politi Econ. 2016, 36, 470–492. [Google Scholar] [CrossRef]
- Titze, M.; Brachert, M.; Kubis, A. The Identification of Regional Industrial Clusters Using Qualitative Input–Output Analysis (QIOA). Reg. Stud. 2011, 45, 89–102. [Google Scholar] [CrossRef]
- Hategan, C.-D.; Curea-Pitorac, R.-I. Testing the Correlations between Corporate Giving, Performance and Company Value. Sustainability 2017, 9, 1210. [Google Scholar] [CrossRef]
- Cao, D.; Long, W.; Yang, W. Sector indices correlation analysis in China’s stock market. Procedia Comput. Sci. 2013, 17, 1241–1249. [Google Scholar] [CrossRef]
- Kai-di, B.L.L. Research on China’s Industry Systemic Importance Evaluation and Systemic Risk Prevention. Financ. Forum 2021, 26, 60–69+80. [Google Scholar]
- Liang, Z. Research on Dynamic Characteristics and Influencing Factors of Industry Systematic Risk. J. Hebei Univ. (Philos. Soc. Sci.) 2020, 45, 108–119. [Google Scholar]
- Li, Y.; Zhang, Z.; Niu, T. Two-Way Risk Spillover of Financial and Real Sectors in the Presence of Major Public Emergencies. Sustainability 2022, 14, 12571. [Google Scholar] [CrossRef]
- Baldwin, R.; Freeman, R. The COVID concussion and supply-chain contagion waves. VoxEU. org 2020, 1. Available online: https://cepr.org/voxeu/columns/supply-chain-contagion-waves-thinking-ahead-manufacturing-contagion-and-reinfection (accessed on 20 May 2024).
- Cecchetti, S.G.; Schoenholtz, K.L. Contagion: Bank runs and COVID-19. Econ. Time COVID-19 2020, 77. Available online: https://www.moneyandbanking.com/commentary/2020/3/2/contagion-bank-runs-and-covid-19 (accessed on 20 May 2024).
- Taihui, Z.X.Z. Rethink about the Relationship between Financial System and Real Economy. Stud. Int. Financ. 2014, 3, 43–54. [Google Scholar]
- Baur, D.G. Financial contagion and the real economy. J. Bank. Financ. 2012, 36, 2680–2692. [Google Scholar] [CrossRef]
- Chiu, W.-C.; Peña, J.I.; Wang, C.-W. Industry characteristics and financial risk contagion. J. Bank. Financ. 2015, 50, 411–427. [Google Scholar] [CrossRef]
- Liu, X.; Gu, S. Research on risk spillovers from the real estate department to financial system based on AR-GARCH-CoVaR. Syst. Eng. Theory Pract. 2014, 34, 106–111. [Google Scholar]
- Sun, L.; Zhang, Y.; Li, J. Study on Systemic Risk Spillover Effect from the Real Estate Industry to Financial Institutions: Empirical Analysis from the Perspectives of Industry and Enterprises. S. China J. Econ. 2019, 38, 33–48. [Google Scholar]
- Silva, T.C.; da Silva, M.A.; Tabak, B.M. Systemic risk in financial systems: A feedback approach. J. Econ. Behav. Organ. 2017, 144, 97–120. [Google Scholar] [CrossRef]
- Brunnermeier, M.K.; Dong, G.N.; Palia, D. Banks’ noninterest income and systemic risk. Rev. Corp. Financ. Stud. 2020, 9, 229–255. [Google Scholar] [CrossRef]
- Peng, Z.; Ke, J. Spillover Effect of the Interaction between Fintech and the Real Economy Based on Tail Risk Dependent Structure Analysis. Sustainability 2022, 14, 7818. [Google Scholar] [CrossRef]
- Yongtan, Z.B.M. Industrial Characteristics, Monetary Policy and Systemic Risk—An Analysis Based on “Economic and Financial” Linkage Network. Stud. Int. Financ. 2018, 4, 22–32. [Google Scholar]
- Liang-hai, C.J.L. Risk Spillover Effect between Financial and Real Sectors via a Dynamic Generalized Delta CoVaR Approach. Syst. Eng. 2019, 37, 122–131. [Google Scholar]
- Li, Z.; Liu, Q.; Liang, Q. A Study on Forestalling China’s Systemic Risk Based on Financial Industry and Real Economy Interacted Network. Stat. Res. 2019, 36, 15. [Google Scholar]
- Huang, Q.H. On the Development of China’s Real Economy at the New Stage. China Ind. Econ. 2017, 9, 5–24. [Google Scholar]
- Meng, X.C.; Zhang, Y.S.; Li, T.Y. The Optimal Macro-prudential Policy for Effective Regulation of the Housing Market and “the Transfer of Capital from the Virtual to the Real”. China Ind. Econ. 2018, 6, 81–97. [Google Scholar]
- Yi, X.R. The transformation of the “real estate-oriented” economy and the establishment of long-term real estate mech-anisms. Explor. Free. Views 2017, 8, 108–114. [Google Scholar]
- Chan, S.; Han, G.; Zhang, W. How strong are the linkages between real estate and other sectors in China? Res. Int. Bus. Financ. 2014, 36, 52–72. [Google Scholar] [CrossRef]
- Wang, R.; Yu, B.; Huang, Y. Performance Recession, Development Cycle and Enterprise Investment Choices: Micro-evidence Based on China’s Manufacturing Industry Listed Enterprises. J. Nanjing Audit. Univ. 2019, 16, 65–73. [Google Scholar]
- Linan, Z.; Gang, Z.; Lianlei, C. Analysis of House Price Spillover Effect Based on ESDA Method and Spatial Econometric Model. J. Ind. Technol. Econ. 2017, 36, 98–106. [Google Scholar]
- Zhang, G.; Guo, K.; Wang, J.; Wang, S. The Effect of Real Estate Price on Real Estate Stock Excess Returns. Manag. Rev. 2014, 26, 8. [Google Scholar]
- Ahuja, A.; Myrvoda, A. The Spillover Effects of a Downturn in China’s Real Estate Investment. IMF Work. Pap. 2012, 12, 1. [Google Scholar] [CrossRef]
- Gan, J. Collateral, debt capacity, and corporate investment: Evidence from a natural experiment. J. Financ. Econ. 2007, 85, 709–734. [Google Scholar] [CrossRef]
- Hu, N.; Wang, X.; Sun, L.; Jin, Q. Can the Housing Purchase Restriction Policy Promote the Enterprises to “Shift from the Fictitious Economy to the Real Economy”? A Research Based on the DID Design. Nankai Bus. Rev. 2019, 22, 20–31. [Google Scholar]
- Martínez-García, E.; Grossman, V. Explosive dynamics in house prices? An exploration of financial market spillovers in housing markets around the world. J. Int. Money Financ. 2020, 101, 102103. [Google Scholar] [CrossRef]
- Abbas, G.; Bashir, U.; Wang, S.; Zebende, G.F.; Ishfaq, M. The return and volatility nexus among stock market and macroeconomic fundamentals for China. Phys. A Stat. Mech. Appl. 2019, 526, 121025. [Google Scholar] [CrossRef]
- Yaming, H.C.M. The Effect of Strong Financial Supervision on Extreme Risk Bidirectional Spillover between Financial Insti-tutions and Real Economy. Stud. Int. Financ. 2022, 9, 56–66. [Google Scholar]
- Diebold, F.X.; Yilmaz, K. Measuring Financial Asset Return and Volatility Spillovers, with Application to Global Equity Markets. Econ. J. 2009, 119, 158–171. [Google Scholar] [CrossRef]
- Diebold, F.X.; Yilmaz, K. Better to give than to receive: Predictive directional measurement of volatility spillovers. Int. J. Forecast. 2012, 28, 57–66. [Google Scholar] [CrossRef]
- Korobilis, D.; Yilmaz, K. Measuring dynamic connectedness with large Bayesian VAR models. Available SSRN 3099725 2018. [Google Scholar] [CrossRef]
- Athari, S.A.; Kondoz, M.; Kirikkaleli, D. Dependency between sovereign credit ratings and economic risk: Insight from Balkan countries. J. Econ. Bus. 2021, 116, 105984. [Google Scholar] [CrossRef]
- Koop, G.; Korobilis, D. Large time-varying parameter VARs. J. Econ. 2013, 177, 185–198. [Google Scholar] [CrossRef]
- Chan, J.C.C.; Eisenstat, E. Bayesian model comparison for time-varying parameter VARs with stochastic volatility. J. Appl. Econ. 2018, 33, 509–532. [Google Scholar] [CrossRef]
- Pesaran, H.; Shin, Y. Generalized impulse response analysis in linear multivariate models. Econ. Lett. 1998, 58, 17–29. [Google Scholar] [CrossRef]
- Nakajima, J. Time-varying parameter VAR model with stochastic volatility: An overview of methodology and empirical ap-plications. Monet. Econ. Stud. 2011, 107–142. [Google Scholar]
- Kondoz, M.; Kirikkaleli, D.; Athari, S.A. Time-frequency dependencies of financial and economic risks in South American countries. Q. Rev. Econ. Finance 2021, 79, 170–181. [Google Scholar] [CrossRef]
- Rong, L.I.; Qian, Z.X.; Ting, S. A study on the effectiveness and interaction between China’s monetary policy and stock price based on SVAR model. Econ. Theory Bus. Manag. 2017, 3, 48–60. [Google Scholar]
- Fang, H.; Gu, Q.; Xiong, W.; Zhou, L.-A. Demystifying the Chinese Housing Boom. NBER Macroecon. Annu. 2016, 30, 105–166. [Google Scholar] [CrossRef]
- Xindong, Z. The Fluctuation of China’s Real Estate Price and the Macroeconomy: A Research Based on the SVAR Model. Econ. Rev. 2010, 1, 8. [Google Scholar]
Disclaimer/Publisher’s Note: The statements, opinions and data contained in all publications are solely those of the individual author(s) and contributor(s) and not of MDPI and/or the editor(s). MDPI and/or the editor(s) disclaim responsibility for any injury to people or property resulting from any ideas, methods, instructions or products referred to in the content. |
© 2024 by the authors. Licensee MDPI, Basel, Switzerland. This article is an open access article distributed under the terms and conditions of the Creative Commons Attribution (CC BY) license (https://creativecommons.org/licenses/by/4.0/).