Article

Assessment of Ecosystem Service Values of Urban Wetland: Taking East Lake Scenic Area in Wuhan as an Example

1
Wuhan Natural Resources Conservation and Utilization Center, Wuhan 430014, China
2
School of Urban Design, Wuhan University, Wuhan 430072, China
3
School of Digital Construction and Explosives Engineering, Jianghan University, Wuhan 430056, China
4
Wuhan Land Arranging Storage Center, Wuhan 430014, China
*
Author to whom correspondence should be addressed.
Land 2024, 13(7), 1013; https://doi.org/10.3390/land13071013
Submission received: 25 June 2024 / Accepted: 6 July 2024 / Published: 8 July 2024
(This article belongs to the Special Issue Dynamics of Urbanization and Ecosystem Services Provision II)

Abstract

:
Urban wetlands represent a significant ecosystem type within urban landscapes. The quantitative assessment of their ecological service value holds great significance in guiding and improving the urban habitat. However, due to the insufficient spatial resolution of traditional low-to-medium resolution remote sensing imagery for surface monitoring, previous studies have conducted relatively limited research on the ecosystem services of urban wetlands. In this paper, based on multi-source data including multi-scale remote sensing data, a spatial-temporal fusion model and multiple ecological parameter inversion models were employed to invert three key ecological parameters at high spatial resolution, thereby assessing the ecosystem service values (ESVs) of urban wetlands. Taking the East Lake Scenic Area (ELSA) in Wuhan as an example, the dynamics of its ecosystem services’ value components were comparatively analyzed. The results indicate that, while the total value of ecosystem services declined slightly in 2015 compared to 2011, there was a notable increase in their value to CNY 3.219 billion by 2019, which represents a doubling of the total value relative to 2011. This trend could be primarily attributed to a significant rise in cultural services within the region. Specifically, the value of tourism services reached CNY 2.090 billion in 2019, representing a threefold increase compared to 2011. This demonstrates that ecosystem services in the ELSA have been significantly optimized and enhanced through associated ecological projects. Further research should investigate the mechanisms by which urbanization affects these crucial ecosystem services, particularly the characterization of cultural services in urban wetlands, and develop more effective strategies to enhance urban resilience and sustainable development.

1. Introduction

Wetlands play a crucial role as natural elements in cities, providing a range of ecosystem services that enhance the built environment and human well-being [1,2,3]. However, the continuous erosion and shrinkage of the wetlands’ ecological space has led to a gradual weakening of the ecosystem function and services of the wetlands [4]. It has been estimated that more than 60% of wetlands have been lost since the 20th century [5]. The main cause of urban wetland loss is urbanization [6,7]. The process of urbanization has resulted in both socio-economic development and a gradual reduction in the area of wetlands within the urban environment [8]. In China, the rate of urbanization-induced wetland loss was 2.8 times higher between 2000 and 2010 than between 1990 and 2000 [9]. Given the significant decline in wetland habitats, it is important to conduct a comprehensive and accurate assessment of the benefits that wetlands provide.
As a crucial bridge between ecosystems and socio-economic systems, ecosystem services have been a popular topic in the fields of ecological economics and urban management [10,11,12,13]. Urban wetlands are the natural ecosystems that are frequently encountered by urban residents, making them an important component of urban environments [14,15]. The ecosystem services classification most commonly recognized in the context of urban wetlands is that proposed by the United Nations in the 2005 Millennium Ecosystem Assessment (MEA). Based on natural ecological processes and functions, the MEA divided ecosystem services into four major types: support services, production services, regulating services, and cultural services [2]. In comparison to natural wetland, urban wetlands exhibit a number of distinctive characteristics [16,17]. They are often characterized by uneven distribution, smaller areas, and low connectivity of wetland patches. Firstly, these are distinguished by a greater degree of habitat fragmentation and pronounced alterations in microclimatic conditions [18]. Secondly, their social service functions have been significantly enhanced [19]. Thirdly, they are frequently subjected to artificial disturbances and governance, which may be either fully artificial or semi-artificial in nature.
The continuous development of remote sensing technology has led to the widespread use of monitoring methods, such as ecological element identification [20,21,22] and ecological physicochemical parameter inversion [23,24,25,26] based on remote sensing data. Various ecosystem services, such as forests, lakes and grasslands, have been extensively and deeply studied at different scales, including global [27,28], regional [29,30,31] and watershed [7,32,33]. Although the selected ecosystem services assessed are largely comparable, the valuation is a multifaceted endeavor with diverse approaches and outcomes due to the inherent complexity of ecosystem processes. This is because their functioning depends on various ecosystem processes at different scales, which means that ecosystem services of different types and at different scales will not be identical in nature [34]. Currently, there are two main methods for valuing ecosystem services: the equivalent factorization method and the functional values method [35]. The former is widely used because it only requires land cover data and a small amount of socio-economic data in the region and is relatively simple to calculate. However, the equivalent factorization method fails to account for spatial heterogeneity within ecosystems, which makes it difficult to identify finer spatial value distributions. The latter method is challenging to generalize due to the large amount of empirical data, socio-economic data, and ecological parameters required for the calculation of various ecosystem services [36].
Urban wetlands differ from natural ecosystems in that they have been significantly impacted by human activities. The declining habitat quality of urban wetlands leads to the degradation of their ecological functions, as well as a reduction in biodiversity and species richness [37,38]. Moreover, the diverse topography of urban areas gives rise to a multitude of intricate and diverse ecosystem features, as well as a plethora of distinct ecosystem services offered by urban wetlands. Scholars have conducted research on the ecological service value of certain typical wetlands, such as Sanyang wetland [14], Kilombero wetland [39], New Zealand wetland [40], South Sudan wetland [41], Poyang Lake [42], and Hangzhou Bay Wetland [43]. However, the monitoring accuracy requirements for urban wetlands using traditional low- and medium-resolution remote sensing imagery are difficult to meet due to their relatively small scale [44]. In addition, existing studies on urban wetlands tend to focus on a particular point in time [45,46], which makes it difficult to investigate how changes in their ecosystem services respond to the urbanization process.
Based on the above context, the following three research questions are addressed in the study: (1) How can the value of ecosystem services provided by urban wetlands be accurately assessed? (2) What is the value composition of the ecosystem services provided by urban wetlands? (3) What is the change trend in the value of ecosystem services within urban wetlands in the context of human activities? To answer the above questions, this paper combines remote sensing (RS) and geographic information system (GIS) methods to calculate three key ecological parameters pertaining to urban wetlands at a fine-grained level, and to assess the ecosystem service values (ESVs) of urban wetlands. Taking Wuhan East Lake Scenic Area (ELSA) as an example, this paper explored the value of ecosystem services and their change trends in ELSA for the three years, 2011, 2015, and 2019, during which several infrastructural projects were implemented in this area and had significant impacts on its ecological environment. This analysis offers a detailed understanding of the changing status of ecosystem services under major human activities and to provide some foundations for their protection and development.

2. Materials and Methods
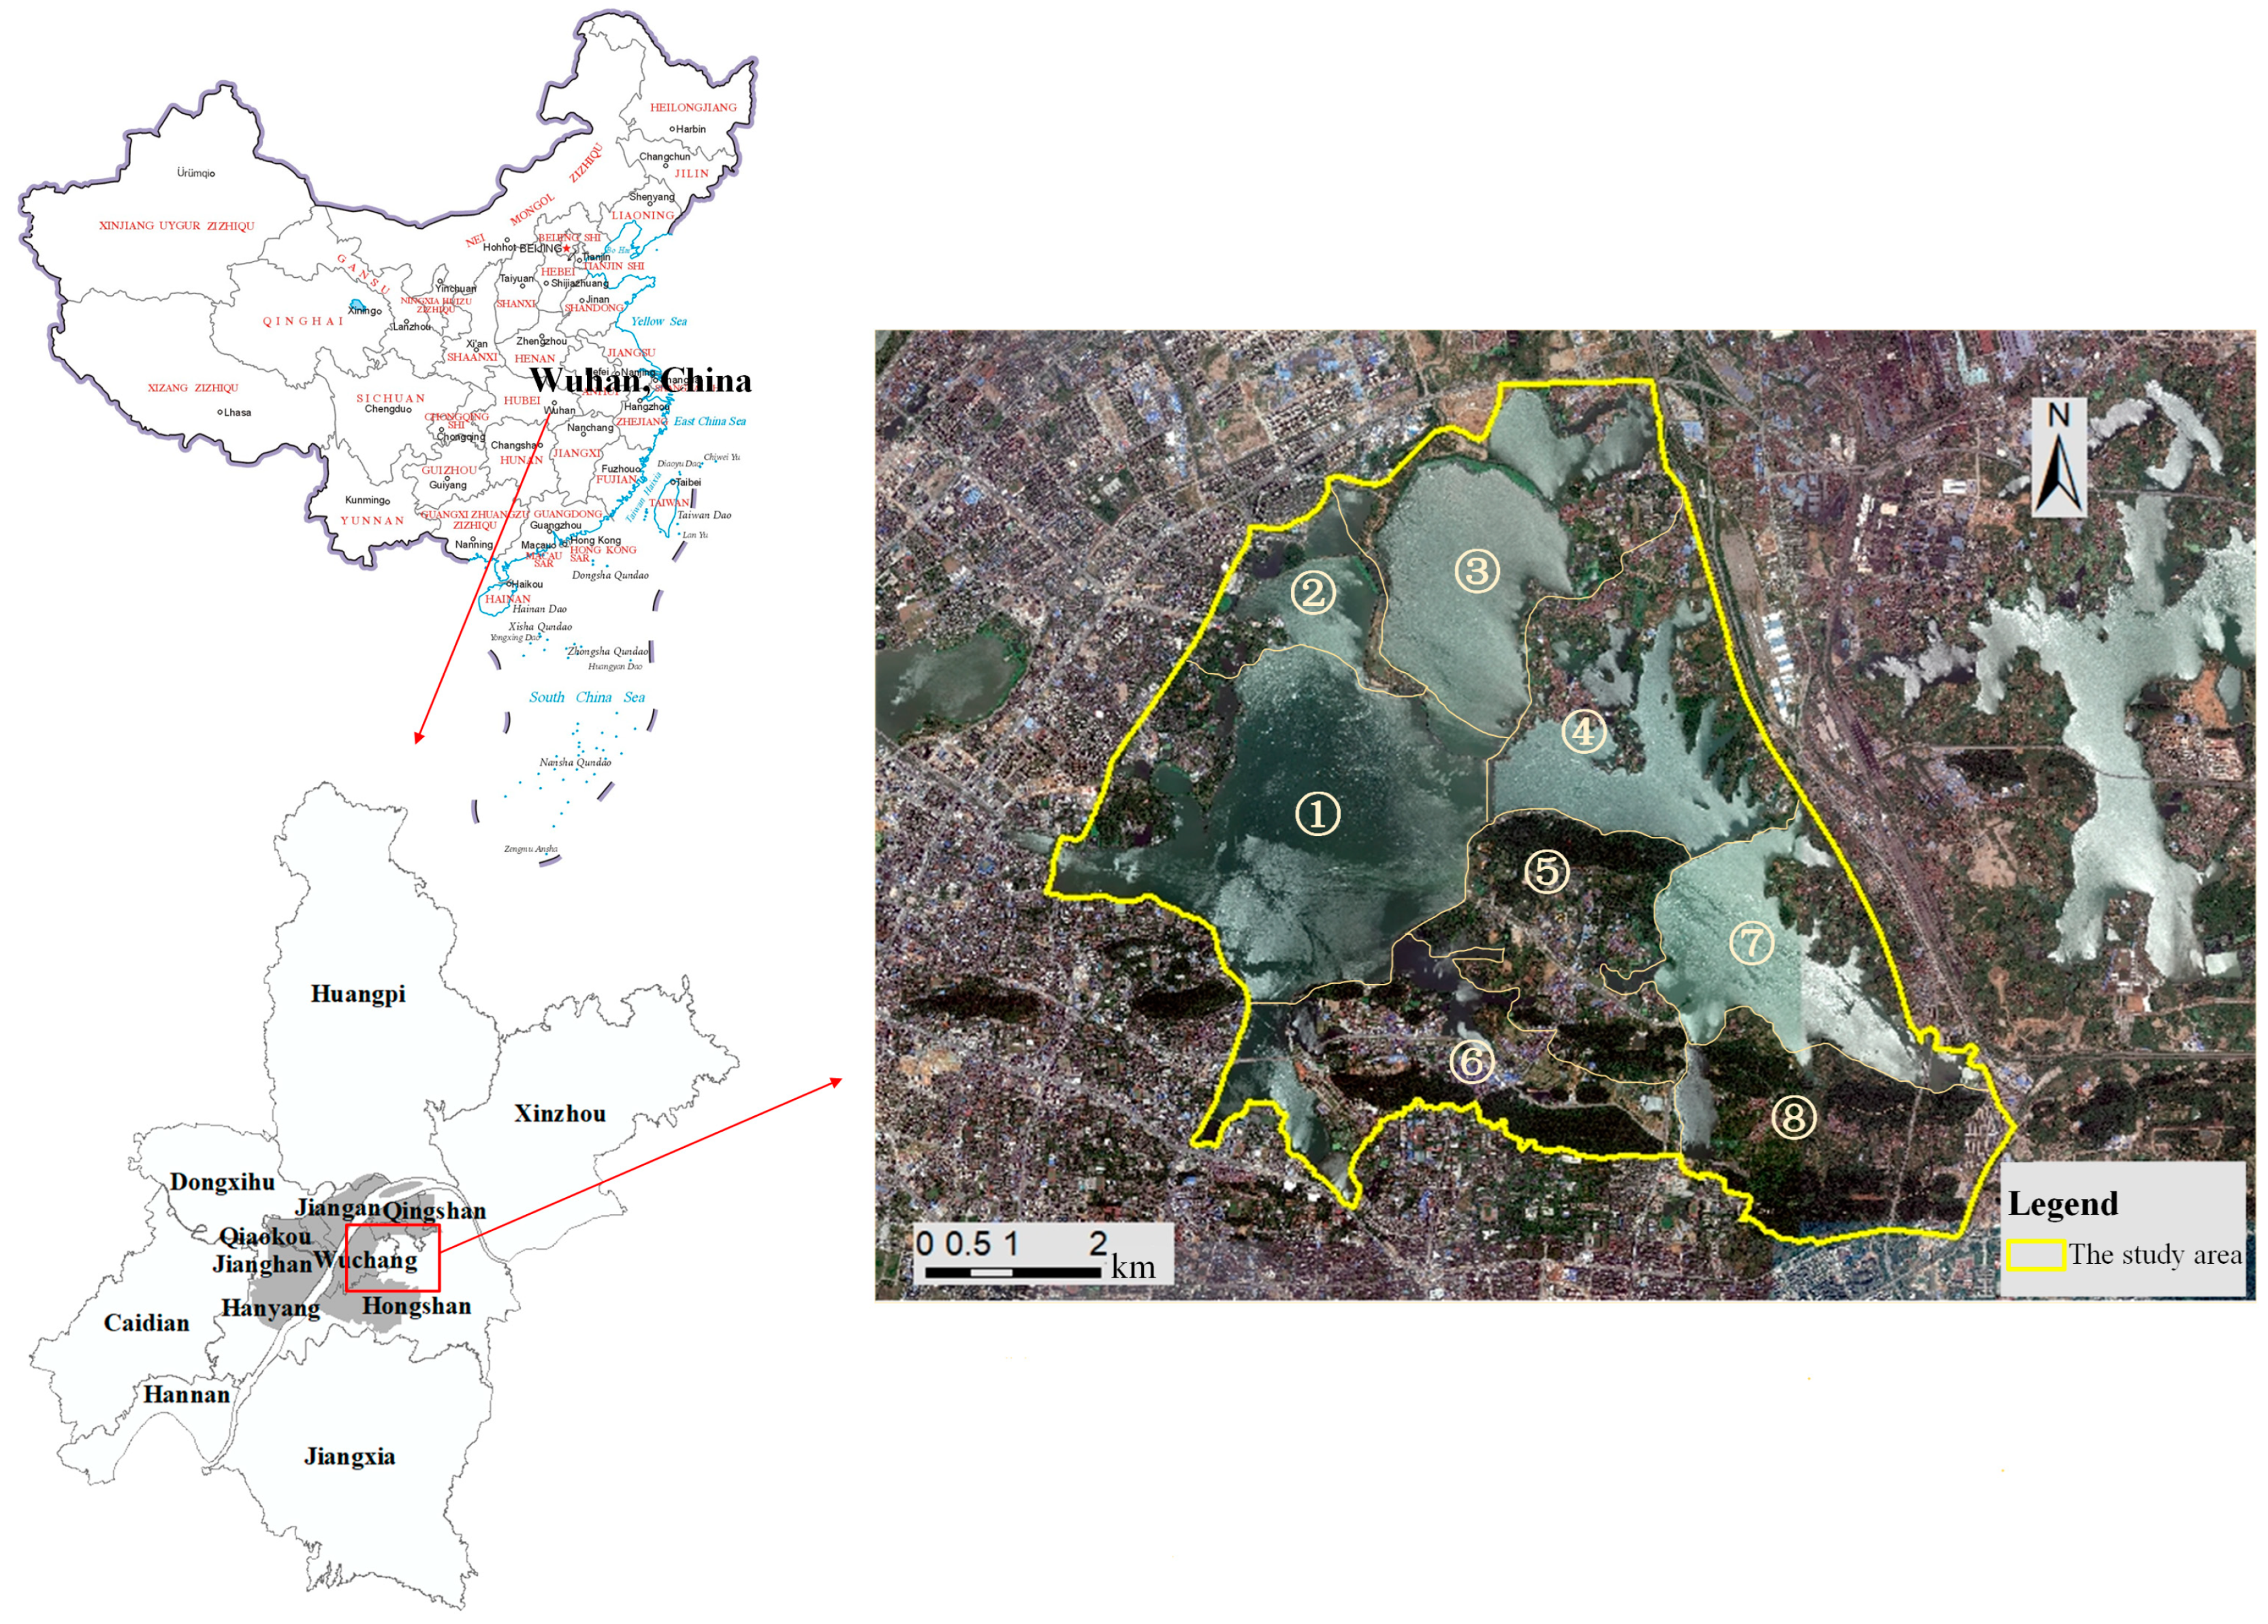
2.1. Study Area

The Wuhan East Lake wetland is located in the eastern section of Wuhan City, occupying the second-largest urban lake area within the city limits. The area is located in the eastern part of the Jianghan Plain and belongs to the subtropical monsoon climate zone. The total area of the region is approximately 62 km2, with the lake’s water area covering about 33 km2. The lake comprises several sub-lakes, including Guozheng Lake, Tangling Lake, and Lingjiao Lake, which are connected by culverts [47]. In 1982, it was approved by the State Council as one of the first national scenic spots. In 2013, it was rated as a national 5A-level tourist attraction. Thanks to the unique natural and humanistic landscape of East Lake and its superior geographic location, the East Lake Scenic Area provides urban residents with rich ecological wetland corridors along the lake, and expands the public outdoor activity spaces for residents. Currently, it has formed a comprehensive ecological space with a large natural lake as the core, integrating 5A-level tourist attractions, a national wetland park, and national ecological tourism demonstration areas.
As a typical urban wetland, the Wuhan East Lake wetland has experienced a significant change due to urban expansion and development. In this study, the ELSA was selected based on the actual construction land status and the division of administrative units in the region. As shown in Figure 1, the scope covers an area of 61.85 km2 and comprises eight scenic areas around East Lake wetland: Tingtao, Yuguang, Chuidi, Houhu, Luoyan, Moshan, Yujiashan and Baima scenic area.

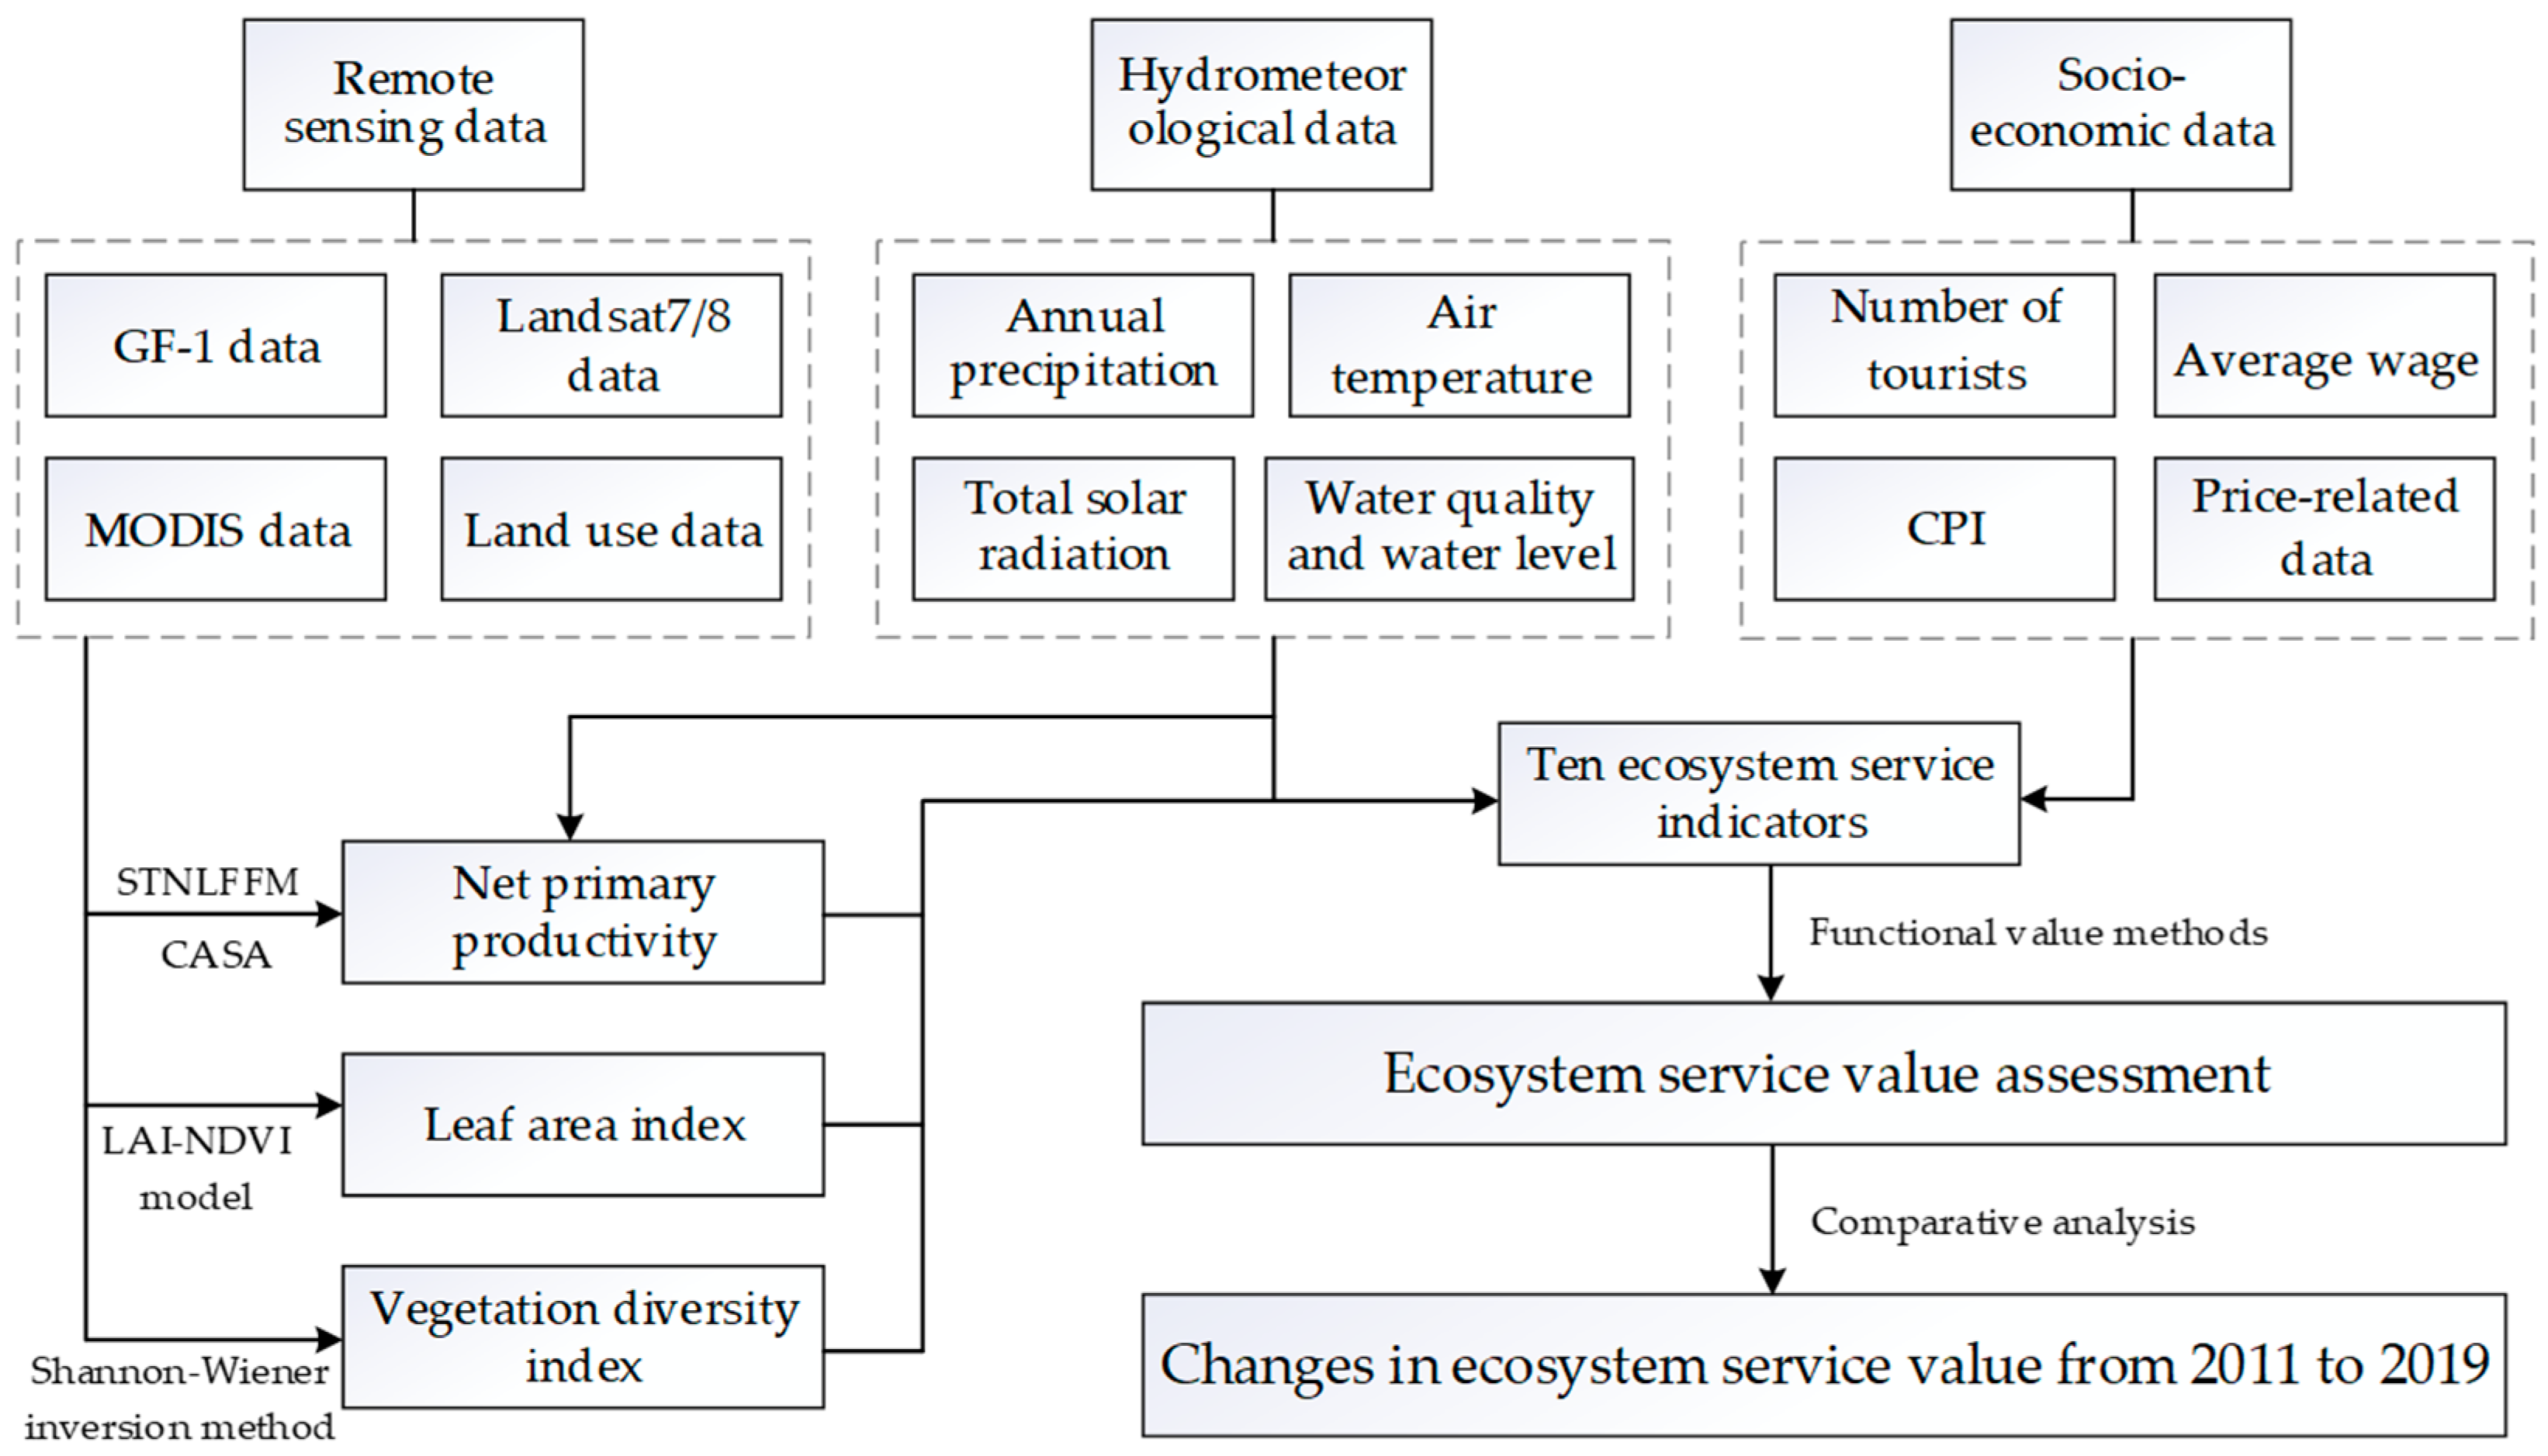
2.2. Data Collection

Four main categories of data were utilized in this study: basic geographic data, multi-source remote sensing data and products, hydrometeorological data, and socio-economic data. Basic geographic data consisted of study area boundaries, digital elevation model (DEM) data, and other relevant geo-information. Remote sensing data included GF-1 and Landsat-8 image data, land use data, and month-by-month normalized difference vegetation index (NDVI) data. The GF-1 and Landsat-8 image data were obtained from the geospatial data cloud (https://www.gscloud.cn/, accessed on 10 November 2023) with a spatial resolution of 2 m and 30 m. The land use data were obtained from the Landcover land cover dataset of Tsinghua University in 2017 with a spatial resolution of 10 m [21]. The month-by-month NDVI data were selected from MODIS 13Q1 data from Terra satellite data with a spatial resolution of 250 m and a temporal resolution of 16 days. The hydrometeorological data, including annual precipitation, air temperature, total solar radiation, and water quality and water level data, were provided by the National Ecosystem Observation and Research Network [48]. The socio-economic data such as price-related data, number of tourists, average wage of employees, and consumer price index (CPI) were obtained from the Wuhan Statistical Yearbooks [49,50,51], National Standards Documents [52], and related research literature.

2.3. Methods

The study employs a structured approach that consists of three key phases. Figure 2 illustrates the methodology framework of this study. First, a comprehensive review of extensive literature was conducted, along with a rigorous data collection effort. Based on the characteristics of urban wetlands and the availability of data, the types of ecosystem services associated with urban wetlands were identified in the study area. Subsequently, the calculation of three key ecological parameters was performed, upon which the quantity of physical quality and value of each ecosystem service was determined in conjunction with relevant data. Finally, a thorough analysis was performed to examine the dynamic changes that occurred over the three year periods, providing valuable insights into the temporal evolution of the urban wetland ecosystem services.

2.3.1. Key Ecological Parameter Calculations

  • Net primary productivity
Due to the different electromagnetic radiation characteristics between terrestrial vegetation and water surface, commonly used remote sensing inversion algorithms have difficulty in accurately estimating the true performance of net primary productivity (NPP) in water bodies, leading to severely underestimated water body vegetation growth conditions. Therefore, in the study, the NPP of terrestrial and aquatic ecosystems was calculated separately.
For the terrestrial vegetation part, the spatial–temporal non-local filtering fusion model (STNLFFM) [53] was used to effectively fuse the spatial and temporal complementary information of multi-source remote sensing data, thereby generating monthly high-resolution NDVI spatial distribution data. Considering that the high-resolution image data used in this study has a resolution of 2 m and the MODIS time-series NPP data has a resolution of 250 m, the resolution gap between the two types of data is too large. Therefore, a spatial fusion resolution of 8 m was ultimately determined. Then combined with regional land cover and meteorological data, an improved CASA model was used to calculate the NPP of terrestrial vegetation [54].
For the aquatic plants part, the research on the coverage area of aquatic plants in East Lake by Landsat image inversion conducted by Jiang et al. [47] was used, combined with the average density parameters of aquatic plants in East Lake measured in the relevant literature for estimation.
2.
Leaf area index
Leaf area index (LAI) is one of the important indicators for evaluating leaf density of the vegetation canopy. Based on the correlation between LAI and remote sensing surface reflectance, the LAI-NDVI regression model established for green areas in Wuhan by Li et al. [55] was used to retrieve LAI in the region. The regression model used is as follows:
L A I = 8.937 46.371 N D V I + 78.812 N D V I 2 35.358 N D V I 3     ( R 2 = 0.750 )
where LAI is the average leaf area index within the pixel, and NDVI is the normalized vegetation index within the pixel.
3.
Vegetation diversity index
Considering the availability of data in ELSA, the Shannon–Wiener diversity index was employed to quantitatively analyze the ecological diversity characteristics of the vegetation in ELSA. Reference to previous research on the inversion of vegetation species diversity [56], the study adopted the Shannon–Wiener inversion method based on Landsat 8 images. The formula for calculating the average species diversity of vegetation in the East Lake Scenic Area is as follows:
H a v g = 1 n i = n n H i
H i = 0.096 N D V I + 0.131 T C 2 + 0.143 T C 3 + 1.673       ( R 2 = 0.637 )
where H i is the Shannon–Wiener diversity index of the i-th pixel, T C 2 and T C 3 are the greenness and humidity components based on the Larson–Jorgensen Cap transform of Landsat multispectral remote sensing images.
The value of biodiversity is referenced to the opportunity cost of species loss under different diversity classes in the Specification for the Assessment of Forest Ecosystem Service Functions, as shown in Table 1.

2.3.2. Ecosystem Service Value Assessment

Based on the classification of ecosystem services in the Millennium Ecosystem Assessment, the assessment indicators of ESVs in ELSA were determined by combining with the actual ecological service characteristics of the study area. Considering that the East Lake, as the main urban wetland, has mainly assumed the functions of ecological environment regulation and social and cultural services in recent years, the original production of aquatic products has lost its corresponding ecological value. At the same time, in the forest ecosystem in ELSA, as an important component of urban green spaces, its timber output is not the main ecological function. Therefore, only the value of water storage in the lakes for the surrounding industrial and agricultural water supply is considered in terms of ecological products of wetland and forest, and the economic value contained in the corresponding aquatic products and forests is not calculated.
Therefore, considering the ecological benefits of the lakes and forest ecosystems in the region, 10 indicators, including water supply, carbon sequestration, oxygen release, climate regulation, flood regulation, dust reduction, water quality purification, biodiversity conservation, education and scientific research and tourism services were selected in the study. Based on the connotation of each indicator, appropriate methods for calculating material and value quantity were selected. The selected indicators and relevant methods are shown in Table 2. Furthermore, in order to facilitate the comparison of value quantities across different years, the monetary value calculations for the three years were aligned to 2019 based on the CPI for each year.

3. Results

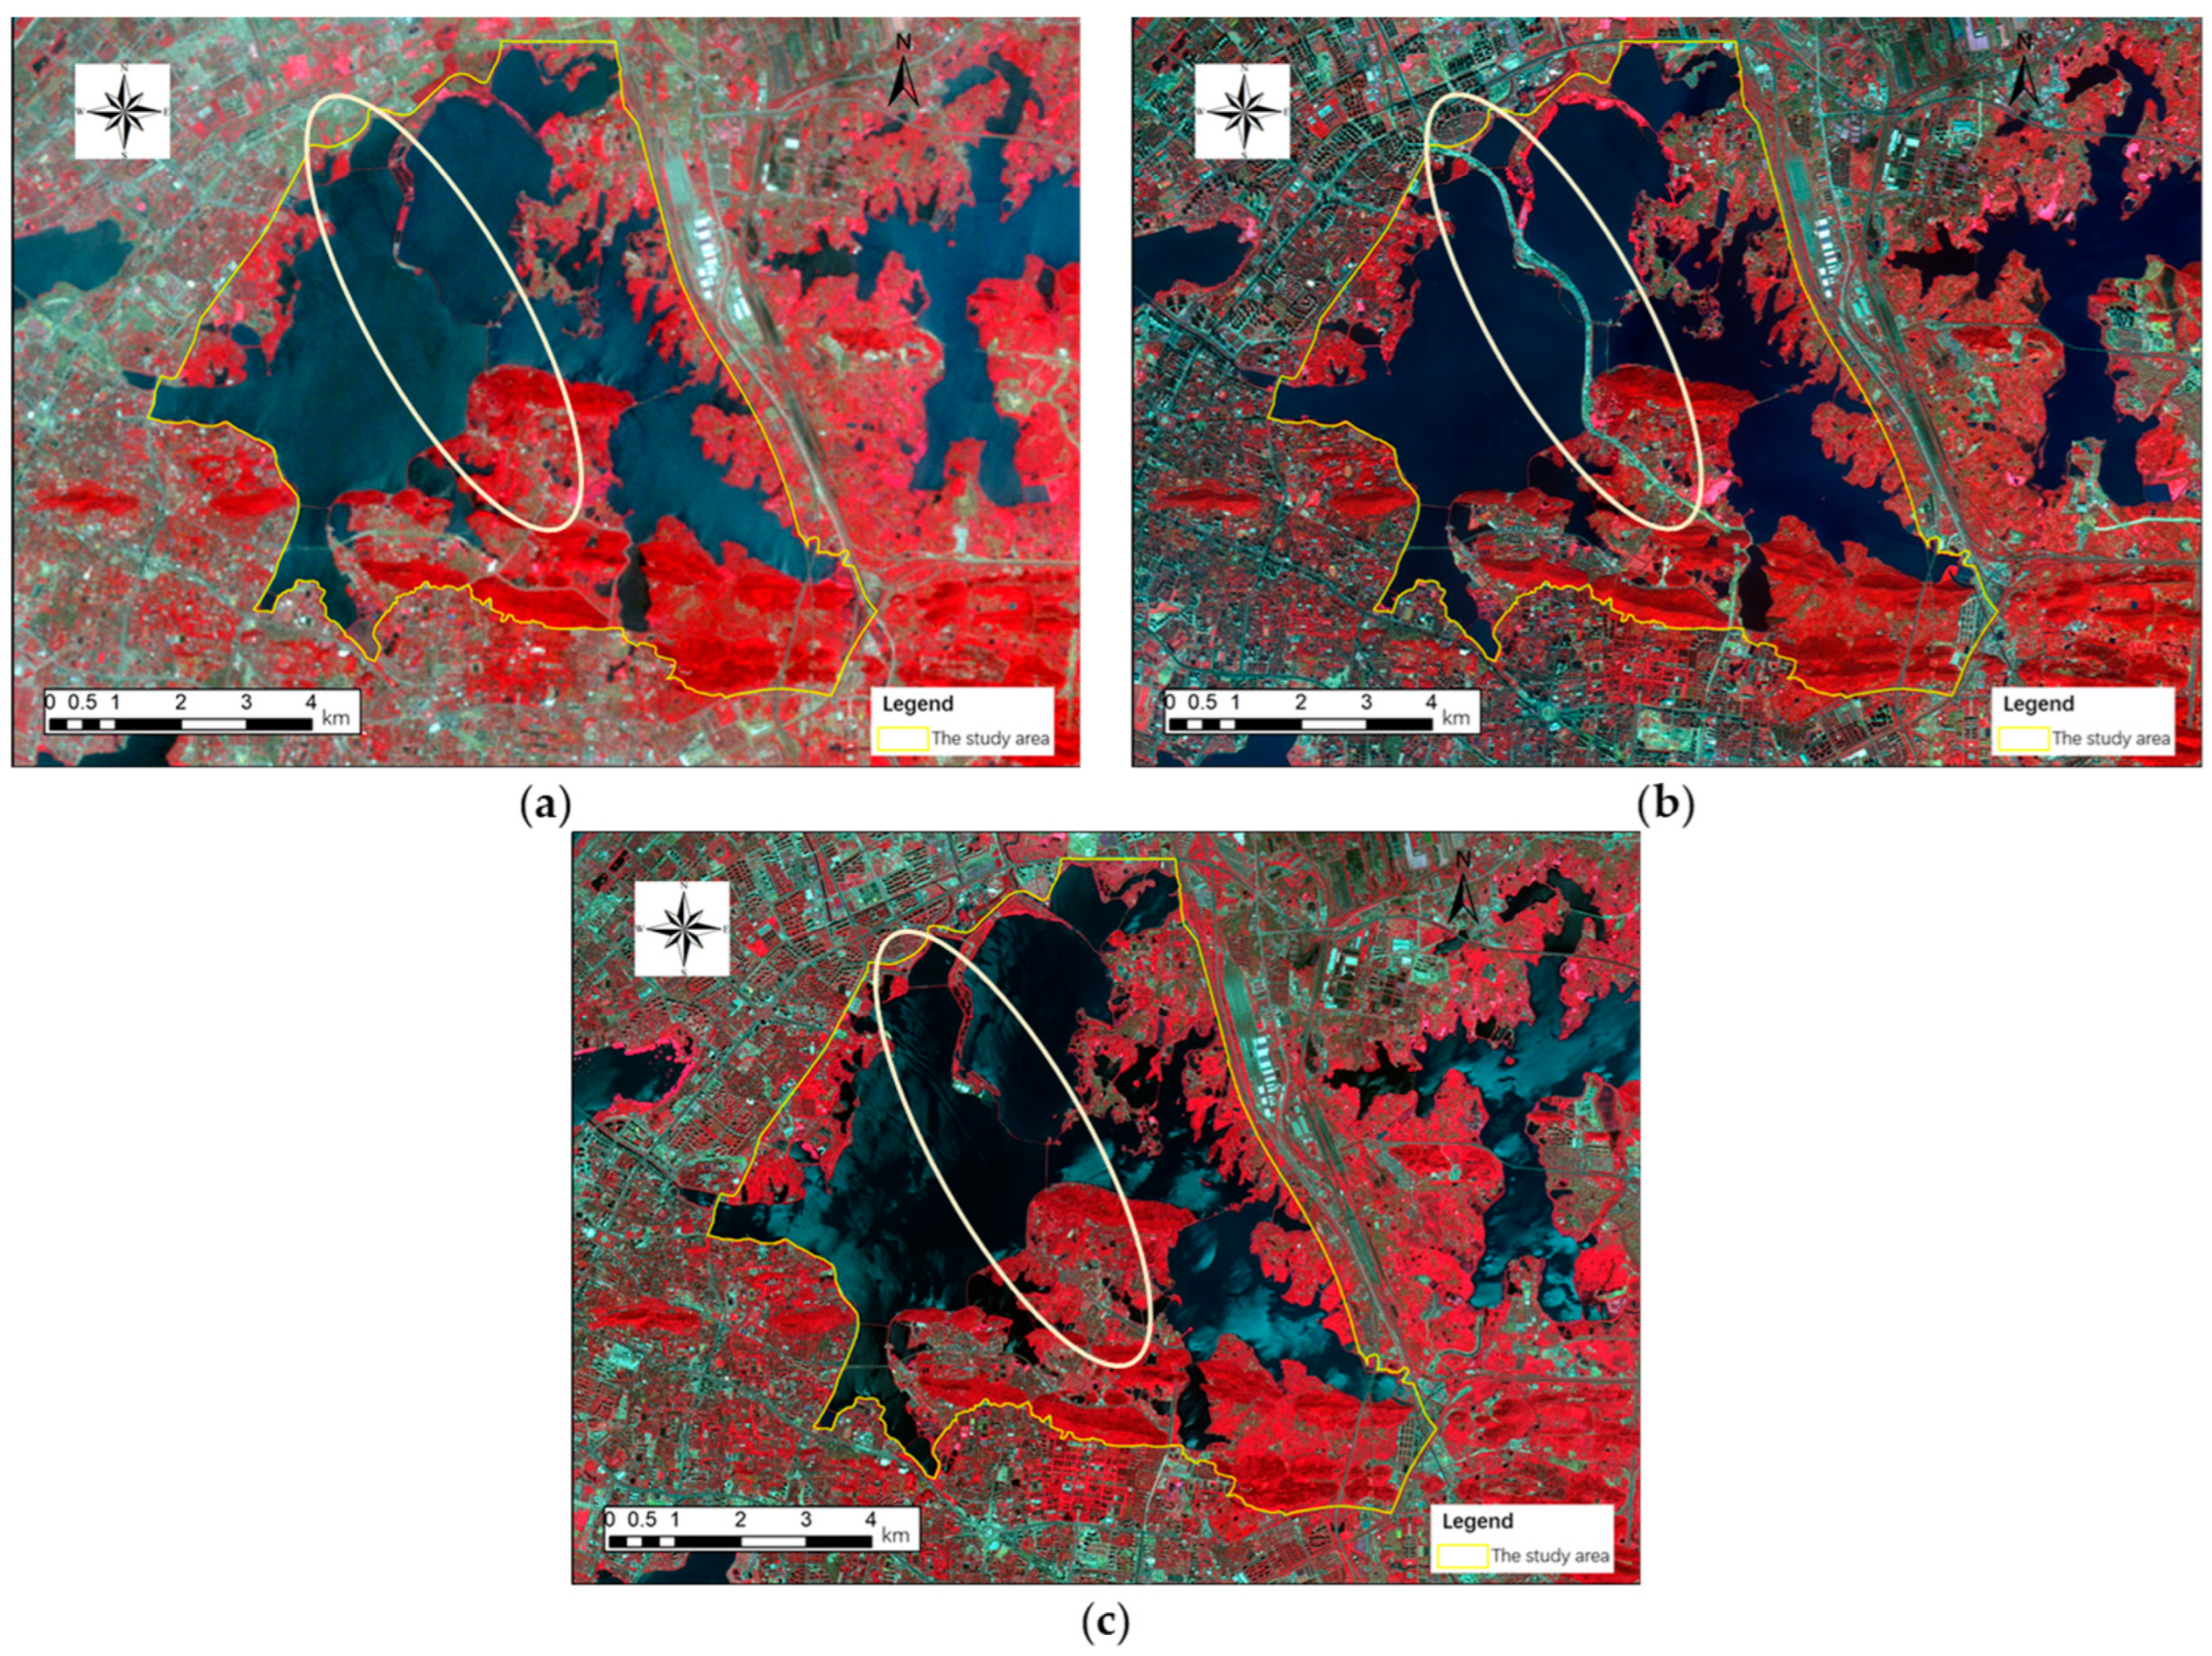
3.1. Changes in Land Cover in ELSA from 2010 to 2019

Changes in the ELSA over the years can be observed through the remote sensing image presented in Figure 3. To enhance the visibility of land cover changes, false-color images within the near-infrared (NIR)-red-green spectral band were employed for analysis. In these figures, vegetation was rendered in red, water bodies appeared in darker hues, and the built environment was depicted in lighter colors.
The imagery captured in 2011 highlights a notable phenomenon: the presence of a road traversing the center of the lake, effectively partitioning it into distinct sub-lakes. In 2015, the implementation of the East Lake Tunnel Project is evident. This was executed via the utilization of cofferdam excavation techniques, leading to a distinct demarcation and transformation of East Lake. The observed changes align precisely with the intended direction of the project, spanning from the northwest towards the southeast. By 2019, upon the completion of construction activities, the cofferdam was subsequently removed, and the lakebed was covered with soil. This restoration measure effectively eradicated any visual indications of the previous division created by the project.

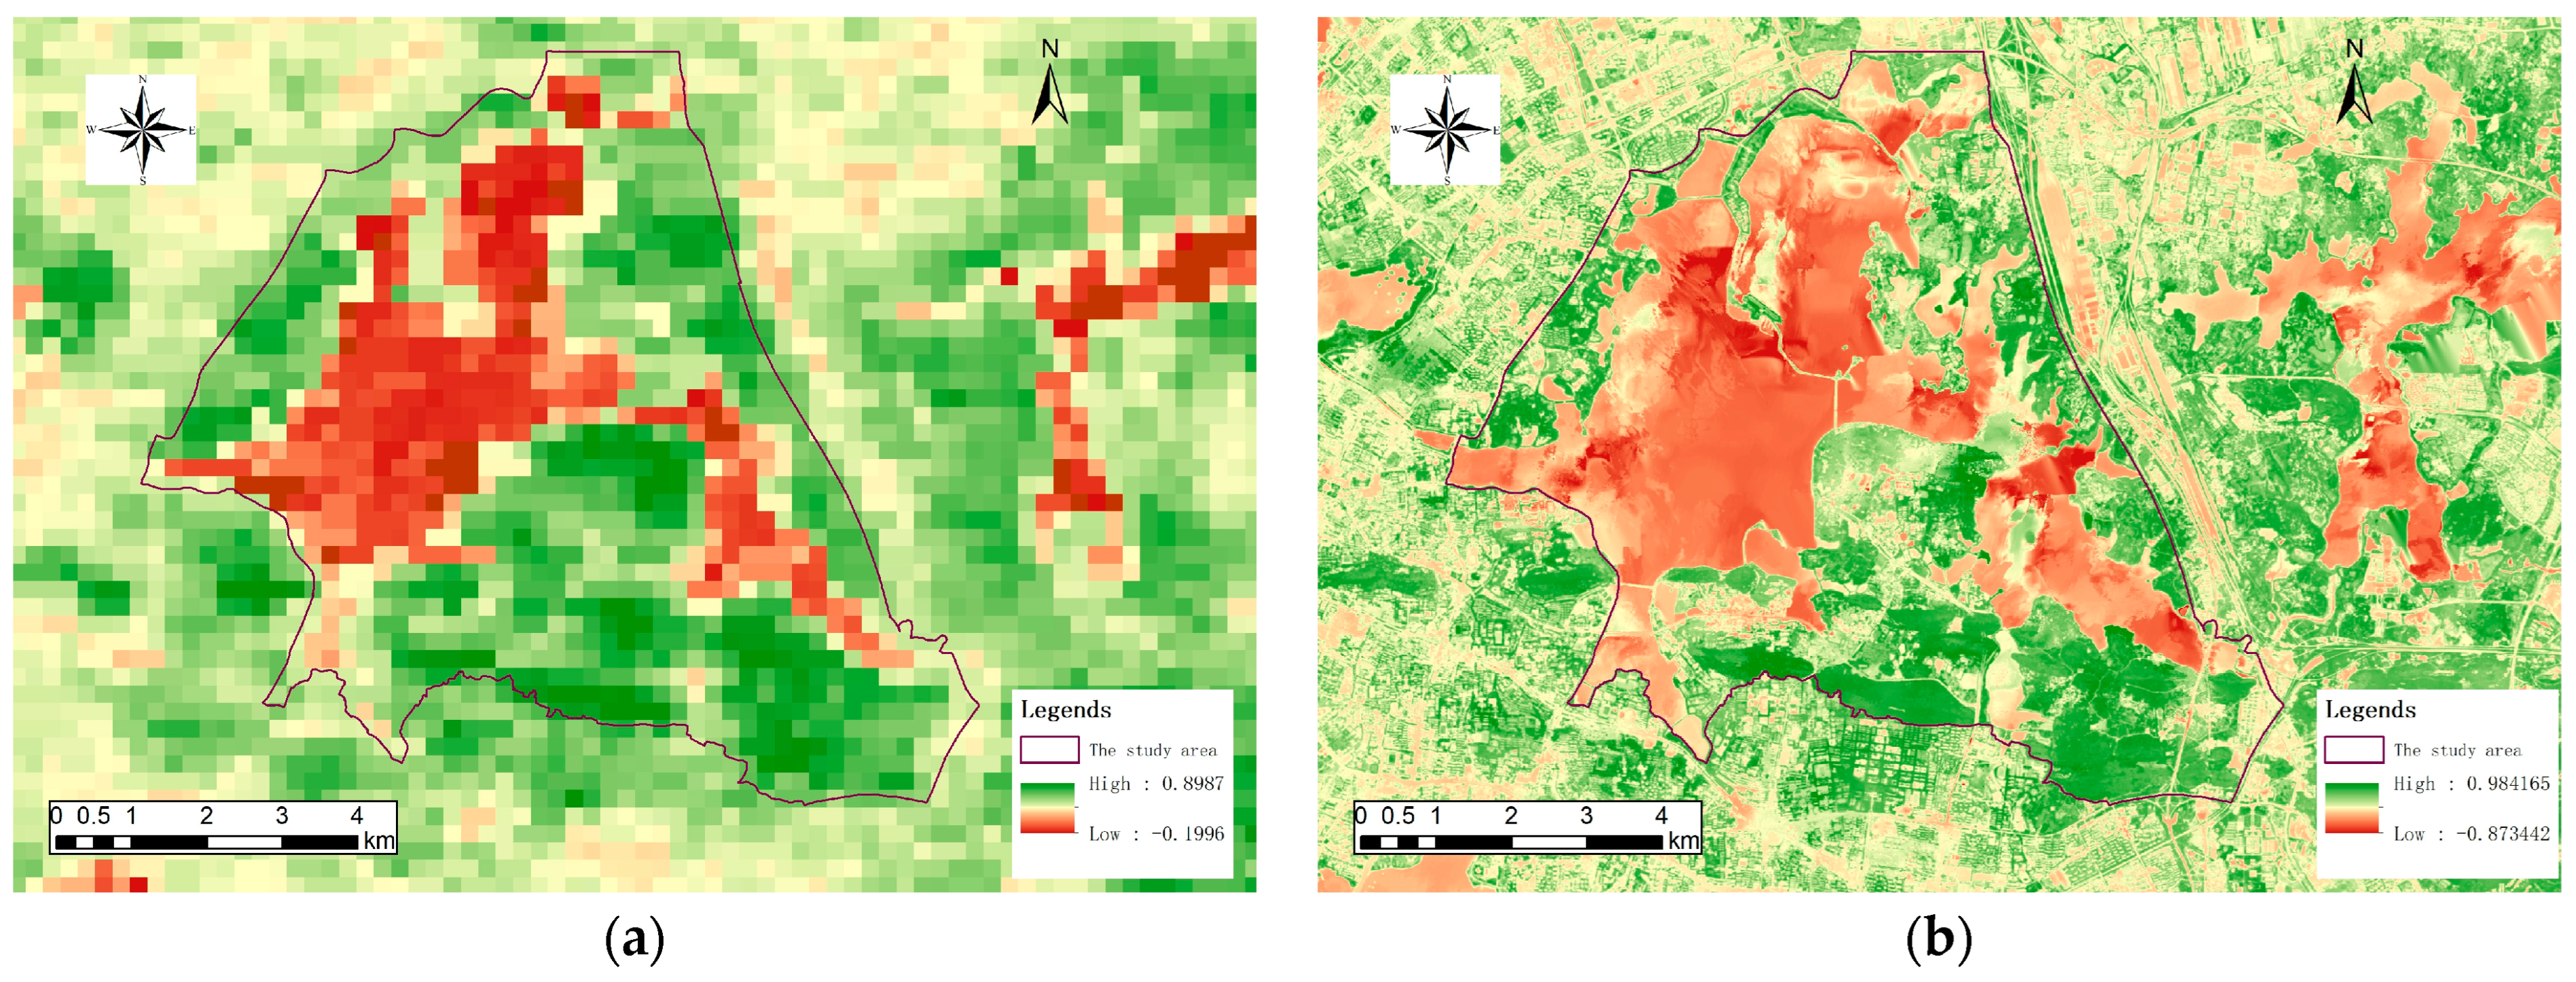
3.2. Key Ecological Parameters

3.2.1. Net Primary Productivity

Taking 2019 as an example, combining the October 2019 GF-6 remote sensing imagery, and the NDVI temporal products derived from MODIS 13Q1 data with a spatial resolution of 16 days and a temporal resolution of 250 m, the STNLFFM model was used to temporally and spatially fuse the spatial and temporal complementary information from the multi-source remote sensing data, thereby obtaining the month-by-month NDVI distribution information in 2019. The June 2019 NDVI fusion result is shown in Figure 4; it can be seen that the fused results permit a more detail characterization of the distribution of vegetation in the region.
The improved CASA model was employed to calculate the distribution characteristics of net primary productivity (NPP) in the region. As illustrated in Figure 5, in 2019, the maximum value of NPP is 767.45 gC·m−2·a−1, the minimum value is 0 gC·m−2·a−1, and the average value is 129.52 gC·m−2·a−1.

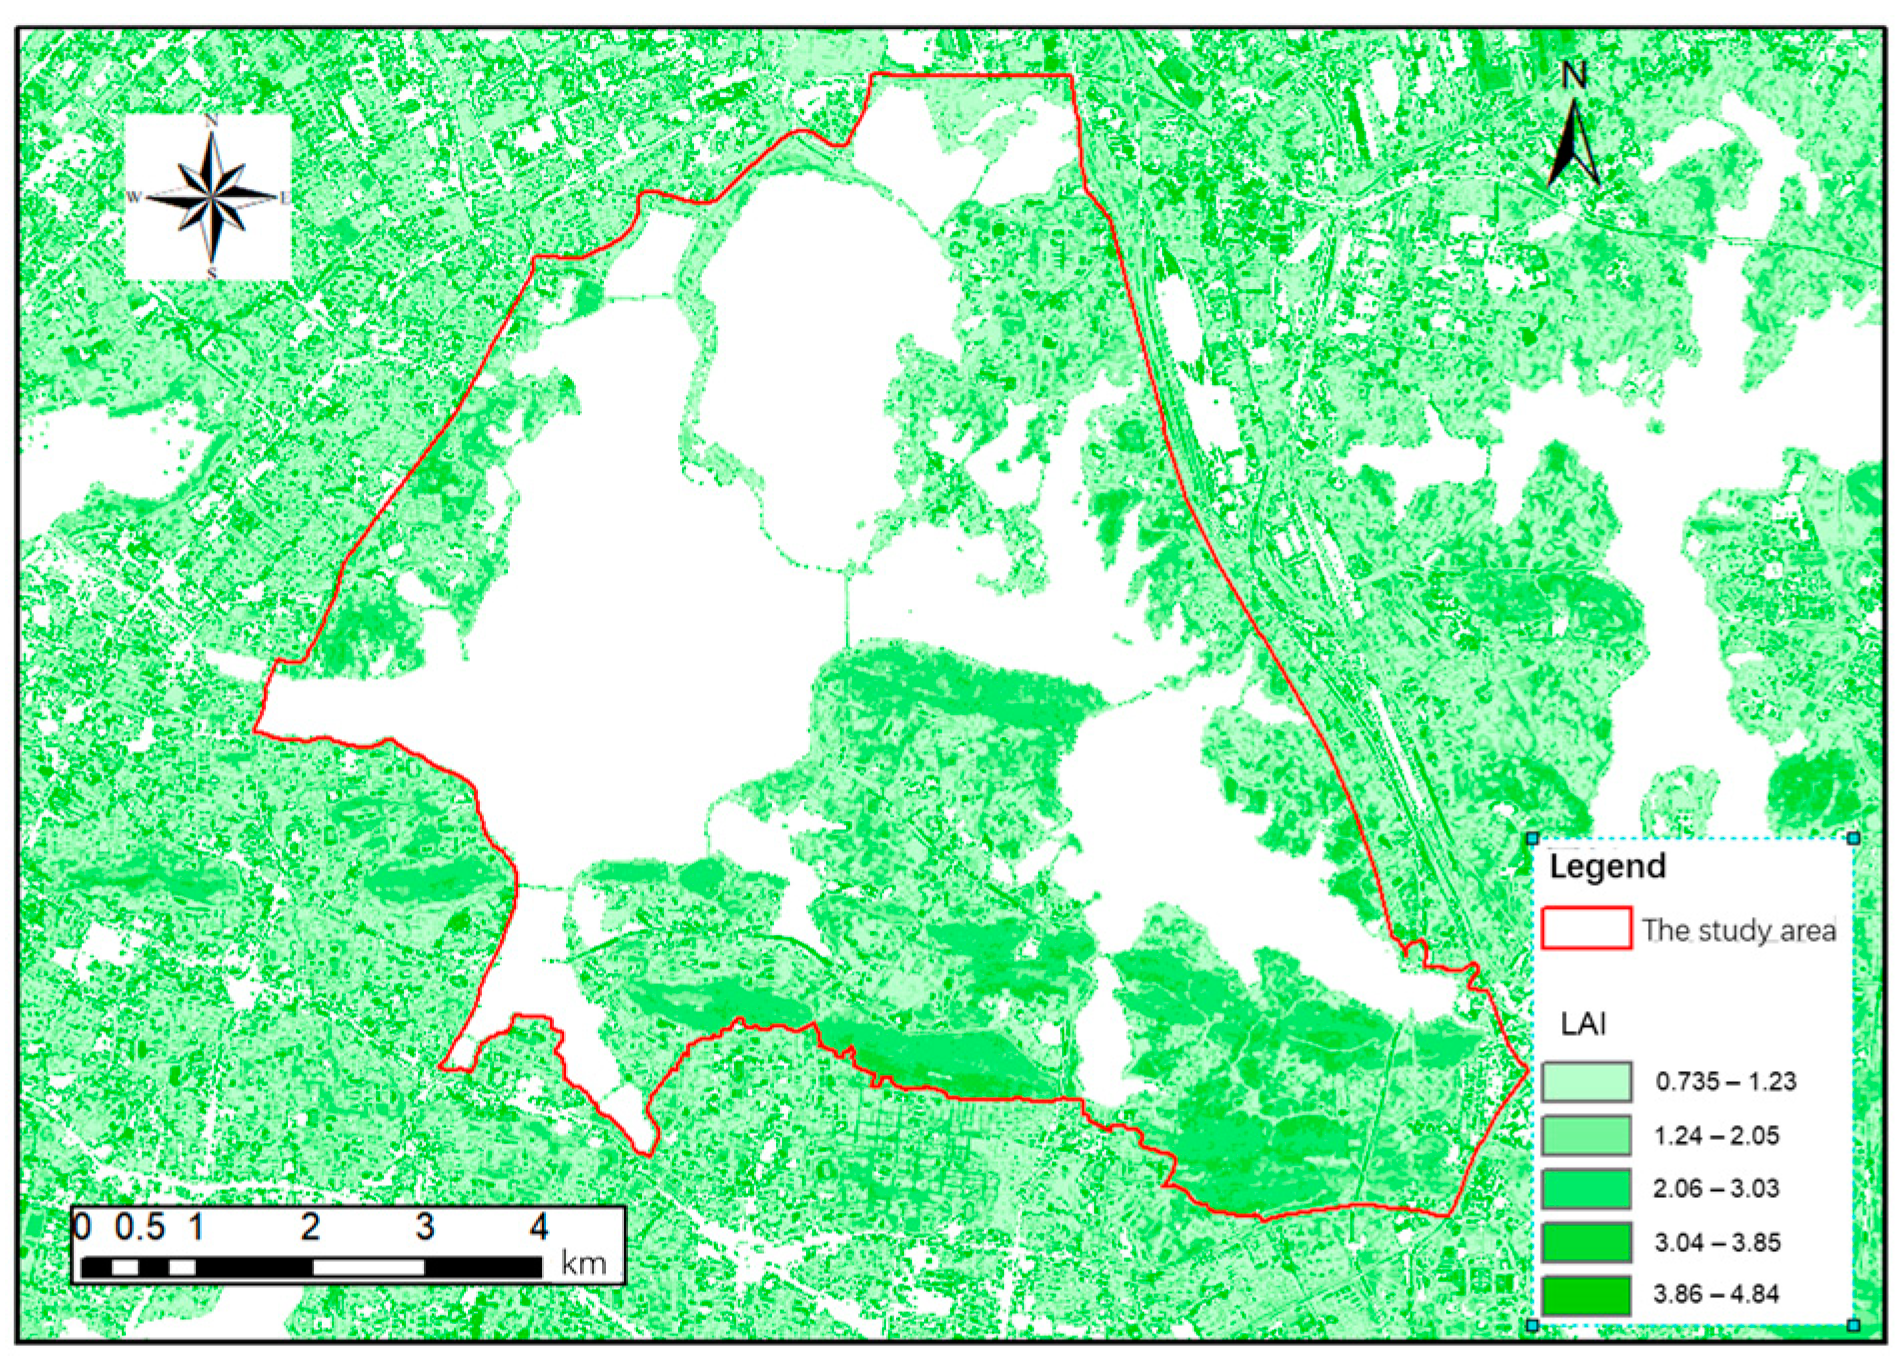
3.2.2. Leaf Area Index

The high-resolution NDVI distribution calculated in Section 3.2.1 was utilized to perform an inversion of the leaf area index (LAI) in the region. This was accomplished through the application of the LAI-NDVI regression model developed by Li Lu et al. The results of this process are presented in Figure 6, which depicts the range of LAI values observed in the study area, spanning from 0 to 4.84. In conjunction with the land cover characteristics, the statistical characteristics of the leaf area index distribution for different vegetation types, including forests, grasslands, and shrubs, were derived (Table 3).

3.2.3. Vegetation Diversity Index

The diversity index calculation necessitates the utilization of tasseled cap transformation based on multispectral bands. However, the current high-resolution remote sensing imagery is devoid of the requisite band information. Consequently, the Landsat-8 images were employed in this study for the inversion calculation of diversity index. A calculation based on the 2019 Landsat imagery data indicates that the region’s vegetation diversity is between 1.94 and 2.35.

3.3. Changes in ESVs in ELSA from 2010 to 2019

3.3.1. Dynamic Changes in the Total Value of Ecosystem Services

Using the multi-source remote sensing data and socio-economic data for the ELSA for the three periods of 2011, 2015 and 2019, the value of ecosystem services of the ELSA was evaluated to be derived between different years, as shown in Figure 7. It can be seen that the total value of ecosystem services of ELSA was CNY 1.606 billion, CNY 1.588 billion and CNY 3.219 billion for the years of 2011, 2015 and 2019, respectively. The rate of change in its total amount between 2011 and 2015 is −1.13%, with a slight decrease in the total value; the rate of change between 2015 and 2019 is 102.76%, with a significant increase in the total value; and the total rate of change between 2011 and 2019 is 100.47%, with a significant increase in the total value of ecosystem services.

3.3.2. Dynamic Changes in the Value of Individual Ecosystem Services

Table 4 shows that the ESVs of the water provisioning services remained stable over the three study periods. However, there was a slight decrease of −4.95% in 2015. This change may be related to the impacts on the lake surface caused by the construction of the East Lake Greenway and the East Lake Tunnel during this period.
The value of ecosystem services related to carbon sequestration and oxygen release in regulating services increased continuously at a rate of 69.11% from 2011 to 2019. This suggests a significant improvement in the capacity of terrestrial ecosystems, such as forests and grasslands in the ELSA, to sequester carbon and release oxygen. However, in 2015, the levels of climate regulation, flood storage, dust reduction, and water purification decreased in varying degrees. In 2019, these aspects returned to a higher level.
In terms of support services, biodiversity decreased slightly in 2015 but improved significantly in 2019. The value amount for biodiversity increased by 17.15% in 2019 compared to 2011. This may be related to the disturbance of forests, grasslands, and other ecosystems in the region by human activities. Measures need to be taken to maintain the health and stability of the ecosystems.
Regarding cultural services, there were different trends in scientific research and tourism services over the three study periods. In 2015, scientific research services experienced a significant decline with a rate of change of 59.09%. This decline may be attributed to the constraints imposed by the construction of the East Lake Tunnel and the Greenway Project on related scientific research activities. Tourism services increased significantly during the period, indicating that the demand for such services in ELSA by urban residents had not been affected by the aforementioned projects.

3.3.3. Dynamic Changes in the Composition of the Value of Ecosystem Services

Figure 8 shows the proportion of individual ESVs in the total value volume. It is evident from the figure that the composition of the ESVs of ELSA underwent significant changes during the period of 2011–2019. In 2011, climate regulation services had the highest value share in ELSA ecosystem services, followed by recreation, water supply, and flood regulation. This emphasizes the significant importance of climate regulation services. However, in 2015, the value of tourism services increased rapidly, surpassing all other ecosystem services in value share. In contrast, the value share of climate regulation, water supply, and flood regulation decreased accordingly. By 2019, the value volume of tourism services had increased even further, with its value share reaching 65.21%. The results indicate that tourism services have become the most important type of ecosystem services in ELSA. Furthermore, the proportion of services such as climate regulation, water supply, and flood regulation continue to decrease. This reinforces the importance of tourism services in the ELSA ecosystem.

4. Discussion

4.1. The Differences in ESVs between Urban and Natural Wetlands

In this study, multi-source data including remote sensing data, ground observation data, and socio-economic data were used. In order to capture the ecological characteristics of urban wetlands at finer scales, multiple remote sensing data at different scales were integrated for the inversion of high-resolution ecological parameters. In terms of the composition of the ecosystem services, ELSA’s cultural services accounted for a relatively high proportion of ecosystem services in all three time periods, with a peak of 65.21% observed in 2019. In other studies, regulatory and support services are typically identified as the main ecosystem service components on natural wetlands [4,40,43]. This observation further confirms that urban residents have a greater need for cultural services related to urban wetlands compared to natural wetlands.

4.2. Changes in ESVs in the ELSA Region

Based on the above analysis, it can be clearly observed that the value of the ecosystem services of the ELSA has changed significantly between 2011 and 2019. In 2011, its total value was CNY 16.06 × 10⁸, of which the value of climate regulating services accounted for the largest proportion. In 2015, due to the construction of the East Lake Tunnel Project by means of cofferdam open excavation, the catchment area of the East Lake was slightly reduced, resulting in a decrease in the value of some ecosystem services. However, with the completion of the construction project and the implementation of the related ecological restoration project, the ecosystem function of the lake water was effectively restored, leading to an increase in the amount of corresponding ESVs. By 2019, the total ESVs of the ELSA reached CNY 32.19 × 10⁸. Therefore, although the construction of the East Lake Tunnel Project had a certain impact on the lake’s watershed, resulting in a reduction in some ecosystem services, the lake’s ecosystem function has been restored through effective ecological restoration measures, which in turn has increased the total value of ecosystem services.
There was a gradual increase in carbon sequestration and oxygen release over the three periods. Additionally, tourism also showed a similar trend. Although the reduction in water surface area appears to have resulted in a decline in aquatic vegetation, the overall carbon sequestration capacity and oxygen release exhibited a rising tendency, suggesting an enhanced provision of these two ecosystem services by terrestrial vegetation. The growth in the tourism service’s volume is primarily attributed to the annual increase in the number of tourists. This implies that while the construction of the East Lake Tunnel Project may have affected the ecological environment and playing conditions in the lake area of East Lake, the land area’s ecological space may have been the primary attraction for residents during this period. Moreover, the East Lake Greenway project has enhanced the quality of the ecological space in the area, resulting in a doubling in the number of visitors to the region in 2019 compared to 2015. This has led to a significant increase in the volume of cultural services.

4.3. The Culture Service Value in the ELSA Region

Urban wetlands, as the main open space accessible to residents, have garnered extensive scholarly attention for their cultural services, particularly in regard to their impact on resident health and social interactions [57,58]. For instance, studies in several cities have shown that regular visits to urban wetlands by residents positively correlate with improved mental health and reduced stress levels [59]. The green spaces and natural habitats within these wetlands provide residents with a respite from the urban hustle and bustle, fostering a sense of relaxation and well-being. Additionally, these spaces often host community events, festivals, and other gatherings, promoting interactions between residents of diverse backgrounds.
In this paper, the values of tourism services and scientific research were assessed based on the number of tourist visits and the number of published academic papers, respectively. Comparing various ecosystem services between 2011 and 2019, it was shown that tourism services were the fastest-growing service type within the region as the wetlands were constructed and environmentally enhanced. Moreover, the utilization of perceived behavior data derived from the participation GIS and social media platforms has emerged as a research focus for quantifying the value of cultural services [60,61].
Consequently, a deeper examination of cultural services within the ELSA area would be both significant and necessary. Unlike the trade-off relationships in previous studies [62,63,64], ELSA’s ecosystem service was optimized and enhanced through the significant enhancement of cultural services while maintaining the original amount of natural ecosystem services. This process reveals the synergistic relationships of the East Lake region in terms of ecosystem services, further highlighting the interaction between human activities and natural ecosystems. Therefore, it is important to continue focusing on maintaining the stability and health of the natural ecosystem while also fully utilizing the potential of cultural services and promoting their further enhancement in the region.

4.4. Limitations and Future Works

Although this study conducted a refined inversion of ecosystem services in urban wetlands, the type and refinement of ecosystem services still need to be further improved due to the lack of data and the incompleteness of the model. For example, in the inversion of NPP, the terrestrial NPP was accurately inverted in the study, and the NPP of aquatic plants was measured by acquiring the inversion results from related literature, which may lead to the wrong estimation of aquatic plant productivity. Furthermore, due to the lack of data on plant and animal species in the study area, particularly aquatic organisms, the diversity value was calculated based on terrestrial vegetation data, which resulted in an underestimation of the region’s diversity. Additionally, the cultural services indicator can be refined by incorporating specific activities of residents in the region. In future studies, further data collection can be conducted to construct more refined inverse models of ecological parameters. This foundation allows for further investigation into the impact of urbanization on the evolution of various ecosystem services.

5. Conclusions

The assessment of ESVs in urban wetlands is crucial for understanding their ecological and social importance and for informing decision-making in urban planning and management. The present study has provided a comprehensive assessment of the changes in the ESVs of the ELSA in Wuhan, China over a three study periods from 2011 to 2019. The utilization of remote sensing and geographic information system techniques has enabled a fine-grained quantitative analysis of key ecological parameters, thereby revealing the dynamic nature of urban lake wetlands and their associated ecosystem services. The results indicate that, despite a slight decline in the total value of ecosystem services in 2015 compared to 2011, the value experienced a notable increase by 2019, reaching CNY 3.219 billion. This significant growth can be primarily attributed to the remarkable enhancement of tourism services in the ELSA. This outcome highlights the importance of urban wetlands in providing valuable recreational opportunities for city residents.
The optimization and enhancement of the ESVs in the ELSA demonstrate the potential for urban wetlands to serve as valuable natural resources, not only for biodiversity conservation but also for human well-being. The study further highlights the necessity for continued monitoring and management of urban wetlands in order to ensure their sustainability and the optimal utilization of their ecosystem services. In light of the rapid urbanization and growing demand for natural resources, it is important to achieve a balance between development and conservation, ensuring the protection of urban wetlands and the preservation of their ecological functions.

Author Contributions

Conceptualization, Z.S. and D.K.; data curation, Z.S.; formal analysis, Z.S.; funding acquisition, Z.S., W.X. and Z.P.; investigation, Z.S. and D.K.; methodology, Z.S.; project administration, Z.P.; supervision, D.K. and Z.P.; validation, Z.S.; visualization, Z.S. and D.K.; writing—original draft, Z.S.; writing—review and editing, Z.S., W.X. and Z.P. All authors have read and agreed to the published version of the manuscript.

Funding

This research was funded by the National Natural Science Foundation of China (grant number 51978535), Hubei Post doc Innovation and Application Funding (grant number 202320) and Hubei Provincial Natural Science Foundation Program Youth Project (grant number 2023AFB510).

Data Availability Statement

The original contributions presented in the study are included in the article, further inquiries can be directed to the corresponding author.

Conflicts of Interest

The authors declare no conflicts of interest.

References

  1. King, D.M.; Wainger, L.A.; Bartoldus, C.C.; Wakeley, J.S. Expanding Wetland Assessment Procedures: Linking Indices of Wetland Function with Services and Values; Defense Technical Information Center: Fort Belvoir, VA, USA, 2000. [Google Scholar]
  2. Millennium Ecosystem Assessment. Ecosystems and Human Well-Being; World Resources Institute: Washington, DC, USA, 2005; ISBN 1-56973-597-2. [Google Scholar]
  3. Maltby, E.; Acreman, M.C. Ecosystem Services of Wetlands: Pathfinder for a New Paradigm. Hydrol. Sci. J. 2011, 56, 1341–1359. [Google Scholar] [CrossRef]
  4. Adekola, O.; Mitchell, G. The Niger Delta Wetlands: Threats to Ecosystem Services, Their Importance to Dependent Communities and Possible Management Measures. Int. J. Biodivers. Sci. Ecosyst. Serv. Manag. 2011, 7, 50–68. [Google Scholar] [CrossRef]
  5. Davidson, N.C. How Much Wetland Has the World Lost? Long-Term and Recent Trends in Global Wetland Area. Mar. Freshw. Res. 2014, 65, 934. [Google Scholar] [CrossRef]
  6. Hu, S.; Niu, Z.; Chen, Y.; Li, L.; Zhang, H. Global Wetlands: Potential Distribution, Wetland Loss, and Status. Sci. Total Environ. 2017, 586, 319–327. [Google Scholar] [CrossRef]
  7. Huang, Q.; Zhao, X.; He, C.; Yin, D.; Meng, S. Impacts of Urban Expansion on Wetland Ecosystem Services in the Context of Hosting the Winter Olympics: A Scenario Simulation in the Guanting Reservoir Basin, China. Reg. Environ. Chang. 2019, 19, 2365–2379. [Google Scholar] [CrossRef]
  8. Xu, Z.; Peng, J.; Qiu, S.; Liu, Y.; Dong, J.; Zhang, H. Responses of Spatial Relationships between Ecosystem Services and the Sustainable Development Goals to Urbanization. Sci. Total Environ. 2022, 850, 157868. [Google Scholar] [CrossRef] [PubMed]
  9. Mao, D.; Wang, Z.; Wu, J.; Wu, B.; Zeng, Y.; Song, K.; Yi, K.; Luo, L. China’s Wetlands Loss to Urban Expansion. Land Degrad. Dev. 2018, 29, 2644–2657. [Google Scholar] [CrossRef]
  10. Fisher, B.; Turner, R.K.; Morling, P. Defining and Classifying Ecosystem Services for Decision Making. Ecol. Econ. 2009, 68, 643–653. [Google Scholar] [CrossRef]
  11. Braat, L.C. The Value of the Ecosystem Services Concept in Economic and Biodiversity Policy. In Ecosystem Services; Elsevier: Amsterdam, The Netherlands, 2013; pp. 97–103. ISBN 978-0-12-419964-4. [Google Scholar]
  12. Ouyang, Z.; Zheng, H.; Xiao, Y.; Polasky, S.; Liu, J.; Xu, W.; Wang, Q.; Zhang, L.; Xiao, Y.; Rao, E.; et al. Improvements in Ecosystem Services from Investments in Natural Capital. Science 2016, 352, 1455–1459. [Google Scholar] [CrossRef]
  13. Costanza, R.; de Groot, R.; Braat, L.; Kubiszewski, I.; Fioramonti, L.; Sutton, P.; Farber, S.; Grasso, M. Twenty Years of Ecosystem Services: How Far Have We Come and How Far Do We Still Need to Go? Ecosyst. Serv. 2017, 28, 1–16. [Google Scholar] [CrossRef]
  14. Tong, C.; Feagin, R.A.; Lu, J.; Zhang, X.; Zhu, X.; Wang, W.; He, W. Ecosystem Service Values and Restoration in the Urban Sanyang Wetland of Wenzhou, China. Ecol. Eng. 2007, 29, 249–258. [Google Scholar] [CrossRef]
  15. Zhou, L.; Guan, D.; Huang, X.; Yuan, X.; Zhang, M. Evaluation of the Cultural Ecosystem Services of Wetland Park. Ecol. Indic. 2020, 114, 106286. [Google Scholar] [CrossRef]
  16. Radford, K.G.; James, P. Changes in the Value of Ecosystem Services along a Rural–Urban Gradient: A Case Study of Greater Manchester, UK. Landsc. Urban Plan. 2013, 109, 117–127. [Google Scholar] [CrossRef]
  17. Datri, L.A.; Lopez, M.; Buchter, S.; Pazcel, E.M.; Gandini, M. Functional Urban Wetlands in Dysfunctional Cities. Curr. Landsc. Ecol. Rep. 2024, 9, 21–30. [Google Scholar] [CrossRef]
  18. Manzo, L.M.; Epele, L.B.; Grech, M.G.; Kandus, P.; Miserendino, M.L. Wetland Genesis Rules Invertebrate Spatial Patterns at Patagonian Ponds (Santa Cruz, Argentina): A Multiscale Perspective. Ecol. Eng. 2019, 126, 43–54. [Google Scholar] [CrossRef]
  19. Das, A.; Das, M.; Gupta, R. Comparison of Ecosystem Services Provided by an Urban and a Riverine Wetland: A Multi-Scale Evaluation from Lower Gangetic Plain, Eastern India. Environ. Sci. Pollut. Res. 2022, 29, 79529–79544. [Google Scholar] [CrossRef] [PubMed]
  20. Cao, J.; Leng, W.; Liu, K.; Liu, L.; He, Z.; Zhu, Y. Object-Based Mangrove Species Classification Using Unmanned Aerial Vehicle Hyperspectral Images and Digital Surface Models. Remote Sens. 2018, 10, 89. [Google Scholar] [CrossRef]
  21. Gong, P.; Liu, H.; Zhang, M.; Li, C.; Wang, J.; Huang, H.; Clinton, N.; Ji, L.; Li, W.; Bai, Y.; et al. Stable Classification with Limited Sample: Transferring a 30-m Resolution Sample Set Collected in 2015 to Mapping 10-m Resolution Global Land Cover in 2017. Sci. Bull. 2019, 64, 370–373. [Google Scholar] [CrossRef]
  22. Chen, C.; Chen, H.; Liang, J.; Huang, W.; Xu, W.; Li, B.; Wang, J. Extraction of Water Body Information from Remote Sensing Imagery While Considering Greenness and Wetness Based on Tasseled Cap Transformation. Remote Sens. 2022, 14, 3001. [Google Scholar] [CrossRef]
  23. Mohammadi, J.; Shataee, S. Possibility Investigation of Tree Diversity Mapping Using Landsat ETM+ Data in the Hyrcanian Forests of Iran. Remote Sens. Environ. 2010, 114, 1504–1512. [Google Scholar] [CrossRef]
  24. Tian, F.; Qiu, G.; Lü, Y.; Yang, Y.; Xiong, Y. Use of High-Resolution Thermal Infrared Remote Sensing and “Three-Temperature Model” for Transpiration Monitoring in Arid Inland River Catchment. J. Hydrol. 2014, 515, 307–315. [Google Scholar] [CrossRef]
  25. Zhu, Y.; Liu, K.; Liu, L.; Myint, S.; Wang, S.; Liu, H.; He, Z. Exploring the Potential of WorldView-2 Red-Edge Band-Based Vegetation Indices for Estimation of Mangrove Leaf Area Index with Machine Learning Algorithms. Remote Sens. 2017, 9, 1060. [Google Scholar] [CrossRef]
  26. Torresani, M.; Rocchini, D.; Sonnenschein, R.; Zebisch, M.; Marcantonio, M.; Ricotta, C.; Tonon, G. Estimating Tree Species Diversity from Space in an Alpine Conifer Forest: The Rao’s Q Diversity Index Meets the Spectral Variation Hypothesis. Ecol. Inform. 2019, 52, 26–34. [Google Scholar] [CrossRef]
  27. De Groot, R.; Brander, L.; Van Der Ploeg, S.; Costanza, R.; Bernard, F.; Braat, L.; Christie, M.; Crossman, N.; Ghermandi, A.; Hein, L.; et al. Global Estimates of the Value of Ecosystems and Their Services in Monetary Units. Ecosyst. Serv. 2012, 1, 50–61. [Google Scholar] [CrossRef]
  28. Keil, P.; Chase, J.M. Global Patterns and Drivers of Tree Diversity Integrated across a Continuum of Spatial Grains. Nat. Ecol. Evol. 2019, 3, 390–399. [Google Scholar] [CrossRef] [PubMed]
  29. Huang, B.; Li, R.; Ding, Z.; O’Connor, P.; Kong, L.; Xiao, Y.; Xu, W.; Guo, Y.; Yang, Y.; Li, R.; et al. A New Remote-Sensing-Based Indicator for Integrating Quantity and Quality Attributes to Assess the Dynamics of Ecosystem Assets. Glob. Ecol. Conserv. 2020, 22, e00999. [Google Scholar] [CrossRef]
  30. Xu, C.; Jiang, W.; Huang, Q.; Wang, Y. Ecosystem Services Response to Rural-Urban Transitions in Coastal and Island Cities: A Comparison between Shenzhen and Hong Kong, China. J. Clean. Prod. 2020, 260, 121033. [Google Scholar] [CrossRef]
  31. Wang, Y.; Chang, Q.; Fan, P.; Shi, X. From Urban Greenspace to Health Behaviors: An Ecosystem Services-Mediated Perspective. Environ. Res. 2022, 213, 113664. [Google Scholar] [CrossRef] [PubMed]
  32. Hamel, P.; Hamann, M.; Kuiper, J.J.; Andersson, E.; Arkema, K.K.; Silver, J.M.; Daily, G.C.; Guerry, A.D. Blending Ecosystem Service and Resilience Perspectives in Planning of Natural Infrastructure: Lessons from the San Francisco Bay Area. Front. Environ. Sci. 2021, 9, 601136. [Google Scholar] [CrossRef]
  33. Ashrafi, S.; Kerachian, R.; Pourmoghim, P.; Behboudian, M.; Motlaghzadeh, K. Evaluating and Improving the Sustainability of Ecosystem Services in River Basins under Climate Change. Sci. Total Environ. 2022, 806, 150702. [Google Scholar] [CrossRef]
  34. Ehrenfeld, J.G. Evaluating Wetlands within an Urban Context. Ecol. Eng. 2000, 15, 253–265. [Google Scholar] [CrossRef]
  35. Li, F.; Wang, F.; Liu, H.; Huang, K.; Yu, Y.; Huang, B. A Comparative Analysis of Ecosystem Service Valuation Methods: Taking Beijing, China as a Case. Ecol. Indic. 2023, 154, 110872. [Google Scholar] [CrossRef]
  36. Zhao, Q.; Wang, Q. Water Ecosystem Service Quality Evaluation and Value Assessment of Taihu Lake in China. Water 2021, 13, 618. [Google Scholar] [CrossRef]
  37. Mondal, B.; Dolui, G.; Pramanik, M.; Maity, S.; Biswas, S.S.; Pal, R. Urban Expansion and Wetland Shrinkage Estimation Using a GIS-Based Model in the East Kolkata Wetland, India. Ecol. Indic. 2017, 83, 62–73. [Google Scholar] [CrossRef]
  38. Das, A.; Basu, T. Assessment of Peri-Urban Wetland Ecological Degradation through Importance-Performance Analysis (IPA): A Study on Chatra Wetland, India. Ecol. Indic. 2020, 114, 106274. [Google Scholar] [CrossRef]
  39. Koko, I.A.; Misana, S.B.; Kessler, A.; Fleskens, L. Valuing Ecosystem Services: Stakeholders’ Perceptions and Monetary Values of Ecosystem Services in the Kilombero Wetland of Tanzania. Ecosyst. People 2020, 16, 411–426. [Google Scholar] [CrossRef]
  40. Schallenberg, M.; de Winton, M.D.; Verburg, P.; Kelly, D.J.; Hamill, K.D.; Hamilton, D.P. Ecosystem Services of Lakes. In Ecosystem Services in New Zealand: Conditions and Trends; Manaaki Whenua Press: Lincoln, New Zealand, 2013; pp. 203–225. [Google Scholar]
  41. Mulatu, D.W.; Ahmed, J.; Semereab, E.; Arega, T.; Yohannes, T.; Akwany, L.O. Stakeholders, Institutional Challenges and the Valuation of Wetland Ecosystem Services in South Sudan: The Case of Machar Marshes and Sudd Wetlands. Environ. Manag. 2022, 69, 666–683. [Google Scholar] [CrossRef] [PubMed]
  42. Liu, C.; Liu, Y.; Giannetti, B.F.; Almeida, C.M.V.B.; Sevegnani, F.; Li, R. Spatiotemporal Differentiation and Mechanism of Anthropogenic Factors Affecting Ecosystem Service Value in the Urban Agglomeration around Poyang Lake, China. Ecol. Indic. 2023, 154, 110733. [Google Scholar] [CrossRef]
  43. Lin, W.; Xu, D.; Guo, P.; Wang, D.; Li, L.; Gao, J. Exploring Variations of Ecosystem Service Value in Hangzhou Bay Wetland, Eastern China. Ecosyst. Serv. 2019, 37, 100944. [Google Scholar] [CrossRef]
  44. De Valck, J.; Beames, A.; Liekens, I.; Bettens, M.; Seuntjens, P.; Broekx, S. Valuing Urban Ecosystem Services in Sustainable Brownfield Redevelopment. Ecosyst. Serv. 2019, 35, 139–149. [Google Scholar] [CrossRef]
  45. Zhang, B.; Shi, Y.; Liu, J.; Xu, J.; Xie, G. Economic Values and Dominant Providers of Key Ecosystem Services of Wetlands in Beijing, China. Ecol. Indic. 2017, 77, 48–58. [Google Scholar] [CrossRef]
  46. Díaz-Pinzón, L.; Sierra, L.; Trillas, F. The Economic Value of Wetlands in Urban Areas: The Benefits in a Developing Country. Sustainability 2022, 14, 8302. [Google Scholar] [CrossRef]
  47. Jiang, Y.; Chen, X.; Yang, X. Changes of Aquatic Plants in Donghu Lake of Wuhan Based 1990-2020 Landsat Images. Chin. J. Plant Ecol. 2022, 46, 1551–1561. [Google Scholar] [CrossRef]
  48. National Ecosystem Research Network of China Chinese National Ecosystem Observation Research Network Science and Technology Resource Service System. Available online: http://www.cnern.org.cn. (accessed on 31 October 2023).
  49. Wuhan Municipal Statistics Bureau. Wuhan Statistical Yearbook—2011; Wuhan Municipal Statistics Bureau: Wuhan, China, 2011. [Google Scholar]
  50. Wuhan Municipal Statistics Bureau. Wuhan Statistical Yearbook—2015; Wuhan Municipal Statistics Bureau: Wuhan, China, 2015. [Google Scholar]
  51. Wuhan Municipal Statistics Bureau. Wuhan Statistical Yearbook—2019; Wuhan Municipal Statistics Bureau: Wuhan, China, 2019. [Google Scholar]
  52. GB/T38582—2020; Forest Ecosystem Service Function Assessment Specification. State Administration for Market Regulation: Beijing, China, 2020.
  53. Cheng, Q.; Liu, H.; Shen, H.; Wu, P.; Zhang, L. A Spatial and Temporal Nonlocal Filter-Based Data Fusion Method. IEEE Trans. Geosci. Remote Sens. 2017, 55, 4476–4488. [Google Scholar] [CrossRef]
  54. Zhu, W.; Pan, Y.; Zhang, J. Estimation of Net Primary Productivity of Chinese Terrestrial Vegetation Based on Remote Sensing. Chin Jour Plan Ecolo 2007, 31, 413–424. [Google Scholar] [CrossRef]
  55. Li, L.; Zhou, G.; Yao, C. Study on the Green Volume of Different Types of Urban Green Spaces. Chin. Landsc. Archit. 2015, 31, 17–21. [Google Scholar]
  56. Zhang, C.; Li, W.; Hu, Z.; Zhu, J.; Yan, Q. Distribution Pattern of Tree Layer Species Diversity Based on RS and GIS: A Case Study of Water Conservation Forests in Montane Regions of Eastern Liaoning Province of China. Chin. J. Ecol. 2009, 28, 1749. [Google Scholar]
  57. Pedersen, E.; Weisner, S.E.B.; Johansson, M. Wetland Areas’ Direct Contributions to Residents’ Well-Being Entitle Them to High Cultural Ecosystem Values. Sci. Total Environ. 2019, 646, 1315–1326. [Google Scholar] [CrossRef]
  58. Wang, K.; Sun, Z.; Cai, M.; Liu, L.; Wu, H.; Peng, Z. Impacts of Urban Blue-Green Space on Residents’ Health: A Bibliometric Review. Int. J. Environ. Res. Public Health 2022, 19, 16192. [Google Scholar] [CrossRef]
  59. Stigsdotter, U.K.; Ekholm, O.; Schipperijn, J.; Toftager, M.; Kamper-Jørgensen, F.; Randrup, T.B. Health Promoting Outdoor Environments—Associations between Green Space, and Health, Health-Related Quality of Life and Stress Based on a Danish National Representative Survey. Scand. J. Public Health 2010, 38, 411–417. [Google Scholar] [CrossRef]
  60. Ko, H.; Son, Y. Perceptions of Cultural Ecosystem Services in Urban Green Spaces: A Case Study in Gwacheon, Republic of Korea. Ecol. Indic. 2018, 91, 299–306. [Google Scholar] [CrossRef]
  61. Lingua, F.; Coops, N.C.; Griess, V.C. Valuing Cultural Ecosystem Services Combining Deep Learning and Benefit Transfer Approach. Ecosyst. Serv. 2022, 58, 101487. [Google Scholar] [CrossRef]
  62. Jopke, C.; Kreyling, J.; Maes, J.; Koellner, T. Interactions among Ecosystem Services across Europe: Bagplots and Cumulative Correlation Coefficients Reveal Synergies, Trade-Offs, and Regional Patterns. Ecol. Indic. 2015, 49, 46–52. [Google Scholar] [CrossRef]
  63. Luo, Q.; Zhou, J.; Zhang, Y.; Yu, B.; Zhu, Z. What Is the Spatiotemporal Relationship between Urbanization and Ecosystem Services? A Case from 110 Cities in the Yangtze River Economic Belt, China. J. Environ. Manag. 2022, 321, 115709. [Google Scholar] [CrossRef]
  64. Zhou, Z.X.; Li, J.; Guo, Z.Z.; Li, T. Trade-Offs between Carbon, Water, Soil and Food in Guanzhong-Tianshui Economic Region from Remotely Sensed Data. Int. J. Appl. Earth Obs. Geoinf. 2017, 58, 145–156. [Google Scholar] [CrossRef]
Figure 1. The study area located in the eastern part of Wuhan city center. (Scenic areas: ①Tingtao, ②Yuguang, ③Baima, ④Luoyan, ⑤Moshan, ⑥Yujiashan, ⑦Houhu, ⑧Chuidi.).
Land 13 01013 g001
Figure 2. The methodological framework of this study.
Land 13 01013 g002
Figure 3. Remote sensing false-color composite images of ELSA from 2011 to 2019. (a) 2011, (b) 2015. (c) 2019.
Land 13 01013 g003
Figure 4. The result of spatial-temporal fusion of high-resolution NDVI in June 2019. (a) Pre-fusion. (b) Post-fusion.
Land 13 01013 g004
Figure 5. Distribution of net primary productivity within the study area in 2019.
Land 13 01013 g005
Figure 6. Distribution of leaf area index with in the study area in 2019.
Land 13 01013 g006
Figure 7. Ecosystem service values in ELSA from 2011 to 2019.
Land 13 01013 g007
Figure 8. Changes in the share of ecosystem service values of the ELSA in different years.
Land 13 01013 g008
Table 1. Ranking of different Shannon–Wiener indices and their corresponding values.
LevelShannon–Wiener IndexValue (CNY/hm2·a)
1Index ≥ 650,000
25 ≤ Index < 640,000
34 ≤ Index < 530,000
43 ≤ Index < 420,000
52 ≤ Index < 310,000
61 ≤ Index < 25000
7Index < 13000
Table 2. Evaluation indicators and methods of ecosystem service values of ELSA.
Ecosystem ServiceIndicatorCalculation FormulaDescriptionEvaluation Method
ProvisionWater supply V W S = i = 1 n A i × H i × K W S A i :   the   area   of   the   i - th   sub - lake   ( m 2 ) ;   H i :   the   depth   of   the   i - th   sub - lake   ( m ) ;   K W S : price of industrial water (CNY/m3).Market value method
RegulationClimate
regulation
V C R = C T P + C L a k e 81.8 × 189 × 24 × 0.7 × 0.573
C T P = L T R × L A I × A v e g × D
  C L a k e = L E v a × A L a k e × C × δ T
L T R :   Transpiration   heat   uptake   rate   per   unit   area   of   leaf   blade   ( J / m 2 · d ) ;   L A I :   leaf   area   index ;   A v e g :   vegetation   area   ( m 2 ) ;   D :   days   ( d ) ;   L E v a :   evapotranspiration   ( mm ) ;   A L a k e : lake   area   ( m 2 ) ;   C :   specific   heat   capacity   of   water .   ( J / kg · ° C ) ;   δ T : Difference between annual mean temperature and 100 °C (°C)Alternative engineering method
Flood
regulation
V F R = A L a k e × H m a z H a v g + i A T P i × C T P _ i × P × K A R
H m a z :   annual   maximum   water   level   of   the   lake   ( m ) ;   H a v g :   average   annual   water   level   of   lakes   ( m ) ;   A T P _ i :   area   covered   by   vegetation   type   i   ( m 2 ) ;   C T P _ i :   rainwater   retention   rate   of   vegetation   type   i ;   P :   total   rainfall   for   the   year   ( mm ) ;   K A R : construction cost of artificial reservoirs per unit capacity (CNY/m3)Shadow engineering method
Water
purification
V W P = V T O P + V T O N
V T O P = C L a k e × M T O P + C A P _ T O P × K T O P
V T O N = C L a k e × M T O N + C A P _ T O N × K T O N
C L a k e :   size   of   lake   storage   ( m 3 ) ;   M T O P   and   M T O N :   total   phosphorus   and   nitrogen   concentration   in   lake   ( g / m 3 ) ;   C A P _ T O P   and   C A P _ T O N :   total   phosphorus   and   nitrogen   content   of   aquatic   plants   ( g ) ;   K T O P   and   K T O N : treatment costs for total phosphorus and nitrogen pollutants (CNY/g).Outcome reference method
Air
purification
V A P = A L a k e × L D R + i A T P _ i L A I i L i × K D R A L a k e :   lake   area   ( m 2 ) ;   L D R :   dust   retention   per   unit   of   lake   water   surface   ( g / m 2 ) ;   A T P _ i :   area   covered   by   vegetation   type   i   ( m 2 ) ;   L A I i :   leaf   area   index   of   vegetation   type   i ;   L i :   dust   retention   per   unit   area   of   vegetation   type   i   ( g / m 2 ) ;   K D R : charges for dust emissions (CNY/g).Outcome reference method
Carbon sequestration and oxygen release V C S = ( A T P N P P T P / 45 % + M A P   ) × 1.63 × K C S
  V O R = ( A T P × N P P T P / 45 % + M A P   ) × 1.19 × K O R
N P P T P :   Annual   net   primary   productivity   of   terrestrial   plants   ( g / m 2 · a ) ;   M A P :   Amount   of   aquatic   plant   material   ( g ) ;   K C S :   carbon   tax   rate   ( CNY / g ) ;   K O R : industrial oxygen price (CNY/g).Carbon tax method; shadow engineering method
Support Biodiversity V B i o = A F o r e s t × K D V A F o r e s t :   area   of   forest   cover   ( m 2 ) ,   K D V : opportunity cost of species loss per unit area of vegetation (CNY/m2)Outcome reference method
Cultural Tourism V T o u r = V T E + V c s + V T O C
  V T E = C v i s i t o r s × K a v g _ c o s t
  V c s = V T E × 40 %  
  V T O C = C v i s i t o r s × T v i s i t o r s × K i n c o m e × 30 %
V T E : travel expenses;
V c s : consumer surplus;
V T O C : time opportunity cost;
C v i s i t o r s :   total   number   of   visitors ;   K a v g _ c o s t :   per   capita   travel   cos ts   ( CNY ) ;   T v i s i t o r s :   travel   time   per   capita   ( h ) ;   K i n c o m e : hourly payroll costs (CNY/h).
Travel cost method
Scientific research V S R = C R P × K A R C C R P :   number   of   academic   research   papers ;   K A R C : average research cost per academic paper (CNY/paper)Outcome reference method
Table 3. Statistic results of leaf area index for different land cover types.
Land CoverMeanStd
Forest2.200.83
Grassland1.961.65
Shrub1.480.87
Table 4. Rates of change in ecosystem service values of ELSA from 2011 to 2019.
Ecosystem Service Service Indicator2011–20152015–20192011–2019
Supply serviceWater supply−4.956.71 1.43
Regulation serviceCarbon sequestration38.6321.98 69.11
Oxygen release38.6321.98 69.11
Climate regulation−34.9048.32 −3.45
Flood regulation−3.255.09 1.67
Air purification−26.4159.10 17.08
Water purification−20.04 9.81 −12.19
Support serviceBiodiversity−5.04 23.37 17.15
Culture serviceScientific research−59.09 188.89 18.18
Tourism42.43 198.51 325.17
Total −1.13102.76100.47
Disclaimer/Publisher’s Note: The statements, opinions and data contained in all publications are solely those of the individual author(s) and contributor(s) and not of MDPI and/or the editor(s). MDPI and/or the editor(s) disclaim responsibility for any injury to people or property resulting from any ideas, methods, instructions or products referred to in the content.

