Article

Spatiotemporal Distribution and Driving Mechanisms of Cropland Long-Term Stability in China from 1990 to 2018

by
Yuchen Zhong
1,†,
Jun Sun
1,†,
Qi Wang
1,
Dinghua Ou
1,2,
Zhaonan Tian
1,
Wuhaomiao Yu
1,
Peixin Li
1 and
Xuesong Gao
1,2,*
1
College of Resources, Sichuan Agricultural University, Chengdu 611130, China
2
Key Laboratory of Investigation and Monitoring, Protection and Utilization for Cultivated Land Resources, Ministry of Natural Resources, Chengdu 611130, China
*
Author to whom correspondence should be addressed.
These authors contributed equally to this work.
Land 2024, 13(7), 1016; https://doi.org/10.3390/land13071016
Submission received: 26 May 2024 / Revised: 4 July 2024 / Accepted: 5 July 2024 / Published: 8 July 2024
(This article belongs to the Special Issue Land Use Policy and Food Security)

Abstract

:
Long-term stability is crucial in cropland for maintaining stable agricultural production and ensuring national food security. However, relatively few studies have been conducted on the long-term stability of cropland at the national level. This study assessed the long-term stability of cropland in China from 1990 to 2018 using a fine-resolution land use dataset. The experimental results indicated that the average area of unstable cropland in China from 1990 to 2018 amounted to 2.08 ×   10 6 km2, 47.31% of the total. The Qinghai–Tibet Plateau exhibited the highest average proportion of unstable cropland at 65.9%, followed by the northern arid and semiarid region, Southern China, and the Yunnan–Guizhou Plateau. The quantity of unstable cropland in China initially declined before increasing, reaching a final growth rate of 5.09%. Furthermore, this study explored the relevant driving factors of cropland’s long-term stability from both natural factors and human activities based on artificial neural networks. The relative importance of distance to vegetation reached a value of 0.30, indicating that it had the most significant influence on the long-term stability of cropland, followed by relief amplitude and soil type. This phenomenon may be attributed to the inadequate execution of the Grain for Green Policy and the requisition–compensation balance of cropland policy, along with the depletion of young and middle-aged laborers due to urban migration from rural areas. Local governments should focus on addressing the unsustainable exploitation of sloped land in rural mountainous or hilly regions while preventing urban developers from appropriating fertile cropland to compensate for less fertile areas.

Graphical Abstract

1. Introduction

As global challenges such as population growth, depletion of natural resources, accelerated climate change, heightened occurrences of extreme weather events, and geopolitical tensions continue to escalate, the issue of global food security has come under significant strain [1,2,3]. Cropland serves as the cornerstone of food production and security, warranting global attention to its preservation. However, since the 1960s, increasing urbanization has posed a widespread threat to global cropland, leading to its gradual destabilization [4,5,6]. Existing studies underscore the significance of protecting cropland in developing nations to uphold food security, with a particular focus on China [7,8,9]. China sustains 21% of the global population, with only 9% of the world’s cropland [10]. However, problems such as the spatial mismatch in cropland distribution and the large-scale transfer of cropland to marginal land have progressively compromised food security and environmental sustainability in China [11,12,13]. As a crucial factor in food security, the stability of cropland designated for food production serves as a fundamental pillar in ensuring food security. The long-term stable use of cropland can help improve the sustainability of food production, thereby ensuring food security [14,15].
Existing studies define “long-term stable cropland” as the cropland that has been stably utilized over a long period and distinguish this type of cropland from recently reclaimed cropland or frequently abandoned and reclaimed cropland [16,17]. Research suggests that consistent use of cropland over a prolonged period fosters an optimal environment for crop growth. With appropriate farmland management practices, cropland that has not been abandoned always has higher agro-environmental endowments than newly built or idle cropland [18,19,20,21]. Unstable cropland, which is characterized by fluctuating land use and cover changes, deviates from the conventional definitions of cropland and ecological land. It is often disturbed during utilization, which may disrupt the restoration of natural ecosystems and the formation of long-term stable cropland [22,23]. However, the concept of cropland stability and its evaluation have yet to be globally standardized [24].
There are two primary methodological approaches for studying cropland stability: a priori evaluation and empirical identification. An a priori evaluation involves the establishment of an index system to assess cropland stability based on existing disciplinary knowledge. This method assumes that sufficient prior knowledge can determine the stable utilization of cropland. Previous studies have proposed various approaches to evaluate cropland stability based on different disciplinary backgrounds, reflecting a more developed methodology [24,25,26,27,28,29,30]. However, these approaches often lack practical validity and generalizability. In contrast, empirical identification assesses cropland stability based on historical utilization patterns without directly relying on prior disciplinary knowledge, making it an empirical approach [16,17,31]. However, existing research predominantly views the distribution patterns of long-term stable cropland as the geographic scope of specific studies, employing it to analyze other cropland use phenomena rather than systematically summarizing and investigating the long-term stability of cropland and its underlying mechanisms [16,17,32]. Although a few studies have qualitatively discussed the driving mechanisms behind the distribution patterns of long-term stable cropland, there remains a lack of quantitative analyses of specific driving factors [22,33].
Artificial neural networks (ANNs) are vast, continuous-time, dynamic systems characterized by significant nonlinearity, comprising large numbers of interconnected processing units [34]. These networks offer inherent benefits such as self-learning, associative storage, robust generalization capability (i.e., proficient performance on unseen data), and resilience to data errors [35]. Unlike conventional linear regression models, artificial neural networks excel in capturing the complexity and nonlinearity inherent in environmental processes, thereby bridging knowledge and data gaps; this is especially beneficial for analyzing cropland change scenarios [36,37,38,39].
Therefore, to fill existing research gaps, this study proposed a method for evaluating cropland stability through the empirical identification of long-term stable cropland (i.e., long-term stability), and employed artificial neural networks to quantitatively analyze the driving mechanisms influencing the long-term stability of cropland. The empirical nature of the proposed method allows for generalization, which also provides an opportunity to validate the efficiency of existing a priori evaluation methods by analyzing the underlying driving mechanisms. The major objectives of this study are as follows: (1) to evaluate the cropland long-term stability in China from 1990 to 2018; (2) to analyze the evolution of quantity distribution and spatial pattern of cropland long-term stability across various agricultural zones in China from 1990 to 2018; and (3) to analyze the driving mechanisms behind the cropland long-term stability in China.

2. Materials and Methods

2.1. Study Area

China is located in the eastern part of the Eurasian continent along the western coast of the Pacific Ocean. China’s elevation rose sharply from the eastern plains (less than 100 m) to the western mountains (more than 4000 m), with croplands primarily located in the eastern and central plateaus. [40]. Diverse elevations contribute to varied topography, leading to spatial heterogeneity in climate and soil distribution [41,42,43]. China experiences a mean annual temperature of around 9 °C and a mean annual precipitation of approximately 636 mm. The soils in China exhibit a zonal distribution, characterized by Argosols and Aridisols, primarily in the northern regions, and Anthrosols and Ferralosols, predominately in the southern regions. China has the third-largest global cropland area. However, owing to its substantial population, the per-capita cropland area is less than half the global average [32]. According to the agricultural potential productivity, geographical features, and administrative boundaries, the cropland of China is categorized into nine agricultural zones [44,45], including the Northeast China Plain (NCP), the Huang–Huai–Hai Plain (HHHP), the Loess Plateau (LP), the Northern Arid and Semiarid Region (NASR), the Sichuan Basin and Surrounding Regions (SBSR), the Qinghai–Tibet Plateau (QTP), the Middle–Lower Yangtze Plain (MLYP), the Yunnan–Guizhou Plateau (YGP), and Southern China (SC) (Figure 1).

2.2. Data Sources

The land use data used in this study were obtained from the China Land Cover Dataset (CLCD), compiled by Yang and Huang [46], which has a time–series range of 1985–2022 and a spatial resolution of 30 m. Digital elevation model (DEM) data were obtained from NASADEM (www.earthdata.nasa.gov) (accessed on 10 October 2023). Annual precipitation and mean annual temperature data were obtained from Peng et al. [47]. Soil organic matter data were obtained from Shangguan et al. [48], drawing upon the Second National Soil Census of China, Harmonized World Soil Database, and additional databases. These data were supplemented by field survey sampling to compile a comprehensive dataset detailing the soil surface properties across China. Soil erosion data were obtained from the Geographic Data Sharing Infrastructure (www.gis5g.com) (accessed on 11 October 2023). Population density and soil type data were obtained from the Resource and Environment Science Data Platform (www.resdc.com) (accessed on 12 October 2023). Notably, the topography and soil properties exhibited minimal changes over a relatively long time–series; thus, the DEM and soil data were static in this study [49]. Owing to limitations in data availability, the population density data for China with a 1 km resolution in 2018 were substituted with data from 2019; this substitution has been allowed in similar studies [50]. Efforts were made to maintain consistency across all data throughout the time–series (Table 1).

2.3. Cropland Long-Term Stability

We defined cropland long-term stability (LTS) as the ability of a defined cropland to retain its size over an extended period. Thus, any changes in cropland patches, whether shrinking or growing, are considered disturbances, indicating a lack of long-term stability in their use. In contrast to prior studies that assessed the LTS of cropland patches based on historical performance [17], this study evaluated it by summarizing the future performance of cropland patch sizes using historical land use data, grounding this approach in empirical evidence. Drawing on the existing research on cropland abandonment and long-term stable use, we established a 5-year evaluation period [16,32,51].
A spatial offset phenomenon exists in the temporal evolution of land use patches within the same geographic location in the CLCD dataset, hindering the identification of cropland spatial utilization. To accurately assess cropland scale changes and their implications for LTS, we calculated them by quantifying the change in cropland quantity within a 1 km grid. The commonly used fine resolution for analyzing data at the national scale is 1 km [52,53,54], and this resolution is also the original resolution of most Chinese geospatial datasets selected for this study (Table 1). We employed a 1 km × 1 km grid to partition the CLCD dataset and counted the proportion of cropland within the grid, reflecting both the gain and loss of cropland in the region by proportion change, and used it to calculate the LTS of the cropland. The proportion of cropland ranges from 0 to 1. A proportion of one indicates exclusive arable land, whereas zero denotes its absence, resulting in its exclusion from the calculations.
L T S was calculated based on the fluctuation of the cropland proportion within the 1 km grid over the subsequent five years. The coefficient of variation was used to measure fluctuations in the increase or decrease in the cropland proportion to reflect the shrinking and expansion of cropland patches within the grid.
C . V = i = 1 n x i x ¯ n x ¯ × 100
L T S = α C . V
where x i is the proportion of cropland within a grid in the ith year; n is the evaluation time period of cropland L T S , in this study n = 5 ; α = 0.98 , which is obtained from trial-and-error. The L T S values range from 0 to 1, with higher values indicating greater stability. Based on the distribution of values, the L T S was categorized into two types: stable (ranging from 1.0 to 0.7) and unstable (ranging from 0.7 to 0). The calculation was performed using ArcGIS Pro 3.0.2.

2.4. Spatial Autocorrelation Analysis

We conducted a spatial autocorrelation analysis of cropland LTS to delineate the spatial distribution patterns. Spatial autocorrelation analysis studies spatial dependence and heterogeneity by exploring spatial correlation patterns, clustering, or hotspots, providing a unique advantage in understanding spatial clustering relationships and inter-regional change characteristics of geographic variables [55,56]. Global Moran’s I was employed to evaluate the degree of spatial correlation of cropland LTS across China, whereas local Moran’s I was employed to depict the spatial clustering distribution of cropland LTS within the grid and its neighbors [57]. The global Moran’s I is calculated as:
I = n i = 1 n j = 1 n w i j x i x ¯ x j x ¯ i = 1 n j = 1 n w i j i = 1 n x i x ¯ 2
where n is the total number of grids; w i j is the weight matrix that considers the spatial distribution of the spatial unit; x i and x j is the cropland L T S of grid i and j; x ¯ is the average L T S of China. Global Moran’s I value ranges from −1 to 1: values nearing 1 suggest positive spatial correlation and clustering of cropland L T S distributions; values nearing −1 suggest negative spatial correlation and dispersed cropland L T S distributions; values nearing 0 indicate no correlation in spatial distribution. Z-scores and p-values were calculated to denote the statistical significance of spatial differences. Z-scores are multiples of standard deviations, whereas p-values are probabilities that the observed spatial patterns were created by random processes. Significantly higher (positive) or lower (negative) Z-scores and lower p-values indicate greater confidence in rejecting the null hypothesis of random processes.
The local Moran’s I (LISA) is calculated as:
I i = x i x ¯ S i 2 j = 1 , j i n w i j x j x ¯
S i 2 = j = 1 , j i n x j x ¯ 2 n 1
LISA identified four local cluster types: High–High, Low–Low, Low–High, and High–Low, based on a threshold of 0. A pseudo p-value was calculated to assess the significance of LISA using a conditional permutation test with 999 permutations. This test involved random permutations of observations, excluding the focal grid i, where i = 1 , and evaluated how often the neighbor j count reached or surpassed the original value. Global and local Moran’s I analyses were conducted using ArcGIS Pro 3.0.2.

2.5. Analysis of Driving Mechanisms of Cropland LTS

Given the dual influences of natural and anthropogenic factors, as well as data availability, we selected ten representative variables as potential driving factors of cropland long-term stability and analyzed the underlying driving mechanisms [58]. These variables included elevation, relief amplitude, distance to built-up land, distance to water bodies, distance to vegetation, climate production potential, soil erosion, soil organic matter, soil type, and population density. Elevation and relief amplitude can affect climate and precipitation, thereby indirectly affecting the distribution of cropland [25,59]. The distance to built-up land, water bodies, and vegetation can affect the risk of encroachment by urban and rural residential land expansion to different extents [27] and also influence cropland use owing to their distinct land use functions [60,61]. The climate production potential directly affects the hydrothermal conditions of cropland [62]. Soil erosion can lead to land degradation and fertility loss [28]. Population density serves as both an indicator of anthropogenic disturbance and a resource for agricultural labor [25,63]. Soil type and organic matter content can affect soil fertility and cropland quality [27,64]. Some factors have also been considered in previous studies that evaluated cropland stability, providing an opportunity to validate the effectiveness of their evaluation indicator systems. The specific definitions and calculation methods are shown in Section S1 of the supplementary materials.
Artificial neural networks (ANNs) serve as conceptual computational models for discerning intricate patterns and relationships within datasets, and offer diverse types and architectures [65]. We chose a multilayer perceptron (MLP) as the specific model to analyze the driving mechanisms of L T S in cropland [66,67]. We constructed a three-layer MLP, consisting of input, hidden, and output layers. The input layer is a collection of the assumed driving factors. The output layer was the cropland LTS, expressed as a Boolean value ( 1 = s t a b l e ,   0 = u n s t a b l e ) . The hidden layer comprises unobservable neurons, with each neuron’s value being a function of one of the predictor variables, and the number of neurons being determined automatically by the model. Cropland LTS data, along with the corresponding data of driving factors in China for each year, were input into the model for training. The model utilizes 50% of the samples for calibration and 50% for validation, terminating the training round once the accuracy reaches the upper limit [68]. The overall percent correct (OPC) of the model predictions and the area under curve (AUC) of the receiver operating characteristic (ROC) curve were calculated to assess the overall accuracy of the model. Higher values of both OPC and AUC indicate better model performance [69,70,71]. The model was executed using SPSS Modeler 18.0.

3. Results

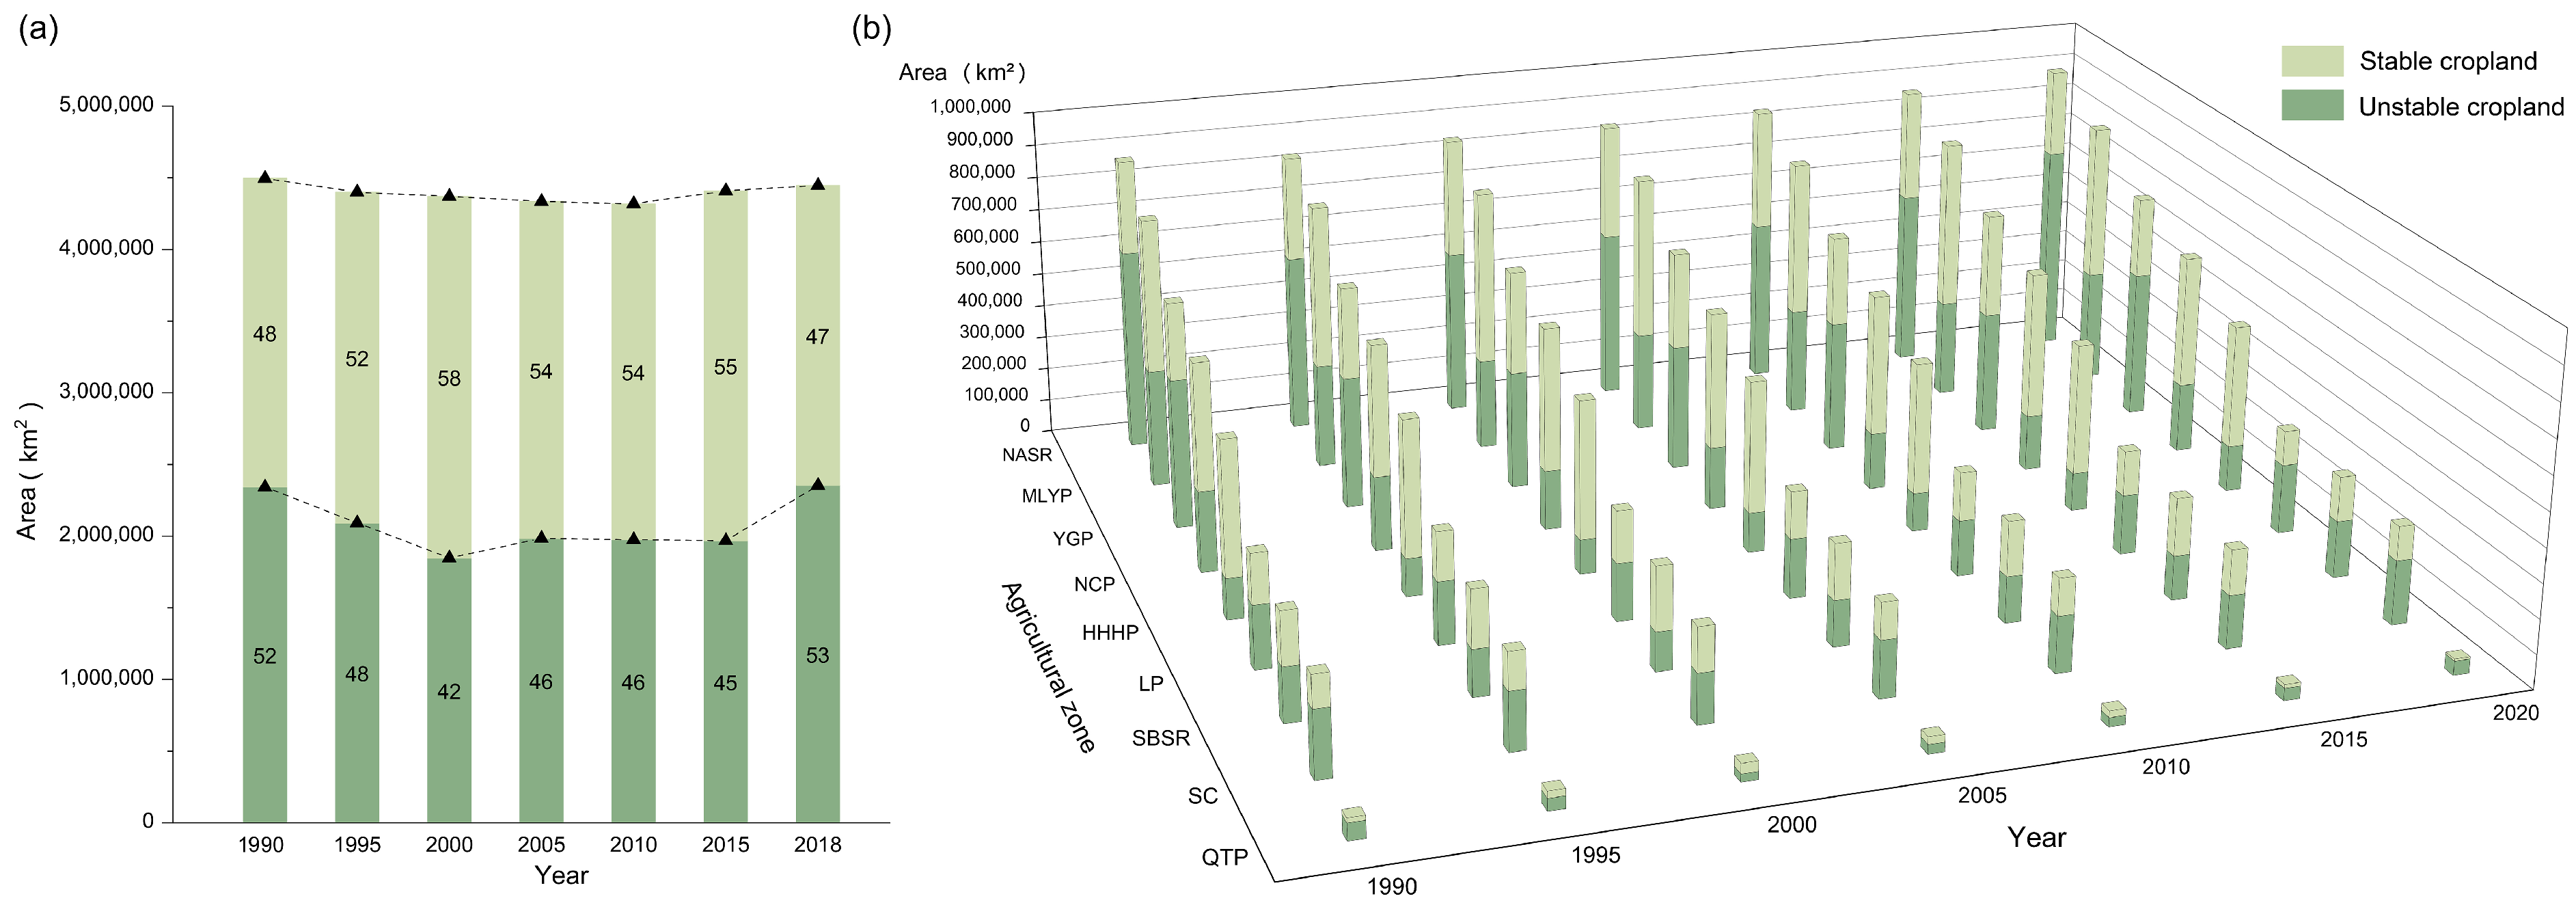
3.1. Quantitative Differentiation of Cropland LTS in China during 1990–2018

From 1990 to 2018, the number of unstable cropland areas first decreased slightly and then increased slightly, with a turning point occurring in 2000 (Figure 2). On average, the percentage of unstable cropland area was 47.31%, with an overall growth rate of 0.83% from 1990 to 2018. The lowest percentage was observed in 2000 (42.26%), whereas the highest was recorded in 2018 (52.94%). Similar patterns of decreasing and increasing unstable cropland quantities are observed in each agricultural zone. The QTP exhibited the highest average proportion of unstable cropland (65.9%), followed by the NASR, SC, and YGP. Conversely, the HHHP had the lowest average proportion of unstable cropland (22.94%), followed by the NCP, MLYP, and SBSR. The QTP and HHHP exhibited the largest and smallest change rates in the unstable cropland during 1990–2018, at 44.13% and 7.17%, respectively. The LP had the highest positive growth rate (10.65%), followed by the QTP, SBSR, HHHP, and NASR. The NCP showed the largest negative growth rate (−4.65%), followed by the SC, MLYP, and YGP (Figure 2). Areas of stable and unstable cropland for each agricultural zone in each year are presented in Table S1.

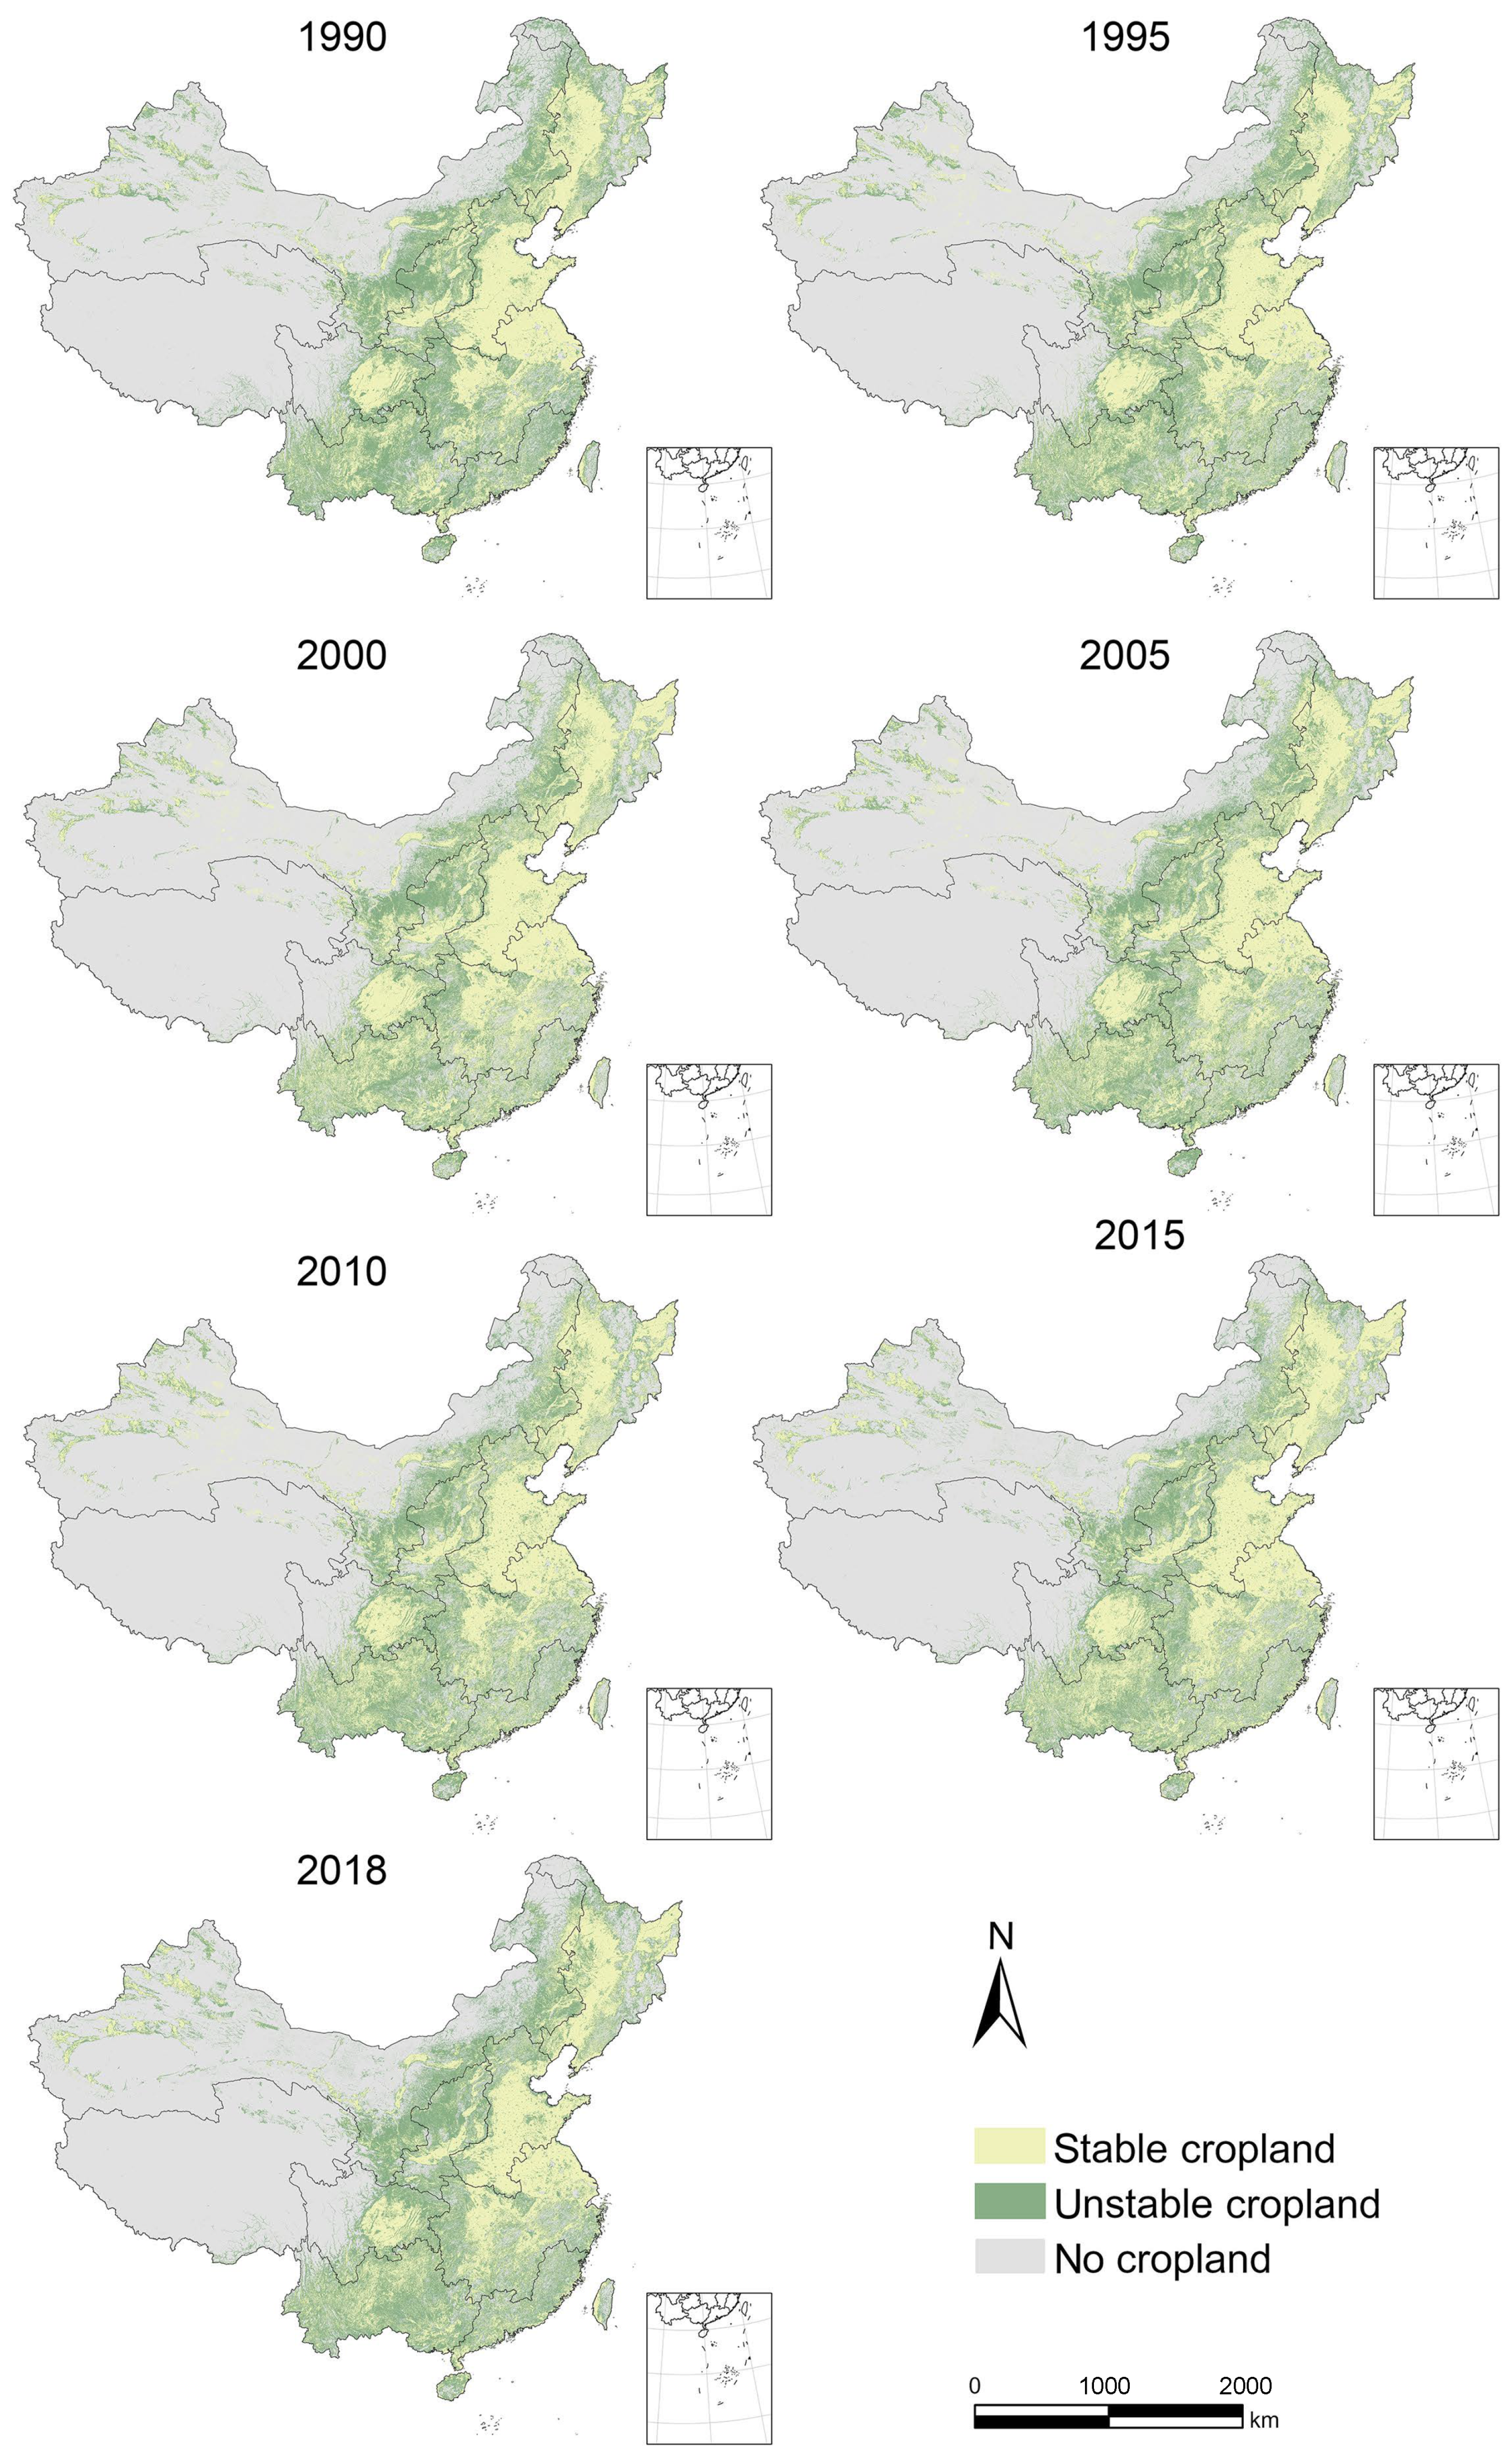
3.2. Spatiotemporal Differentiation of Cropland LTS in China during 1990–2018

The LTS patterns of cropland from 1990 to 2018 exhibited a consistent distribution throughout the study period. Spatially, LTS distribution on cropland exhibited clustering in the NCP, HHHP, MLYP, NASR, LP, QTP, and SBSR. Conversely, the LTS distribution in the SC and YGP appeared fragmented. Unstable cropland situated in areas with a clustered LTS distribution exhibited a trend of initially shrinking and then expanding over the study period. Conversely, unstable cropland located in regions with a dispersed LTS distribution showed a pattern of initial dispersion, followed by clustering over the study period (Figure 3).
The spatial distribution patterns of the local Moran’s I HH and LL values in China mirrored those of stable and unstable croplands. HH values were clustered in the NCP, HHHP, MLYP, and SBSR, whereas LL values were more dispersed, especially in the NASR, LP, YGP, QTP, and SC, with the LP exhibiting greater clustering. Non-significant areas were observed primarily in the YGP and SC groups. Over the study period, HH values underwent expansion and contraction, whereas LH and HL values and non-significant areas gradually expanded, indicating a fragmented clustering pattern (Figure 4).
The average global Moran’s I value for cropland LTS in China from 1990 to 2018 was 0.3375, indicating significant spatial clustering throughout the study period. Following a trend similar to that of the temporal dynamics of the cropland LTS quantity, the global Moran’s I value started at 0.4583 in 1990, declined gradually to its lowest value of 0.3602 in 2010 and then increased to 0.4257 by 2018 (Figure 4). The detailed results of the global Moran’s I calculations are presented in Table S2.

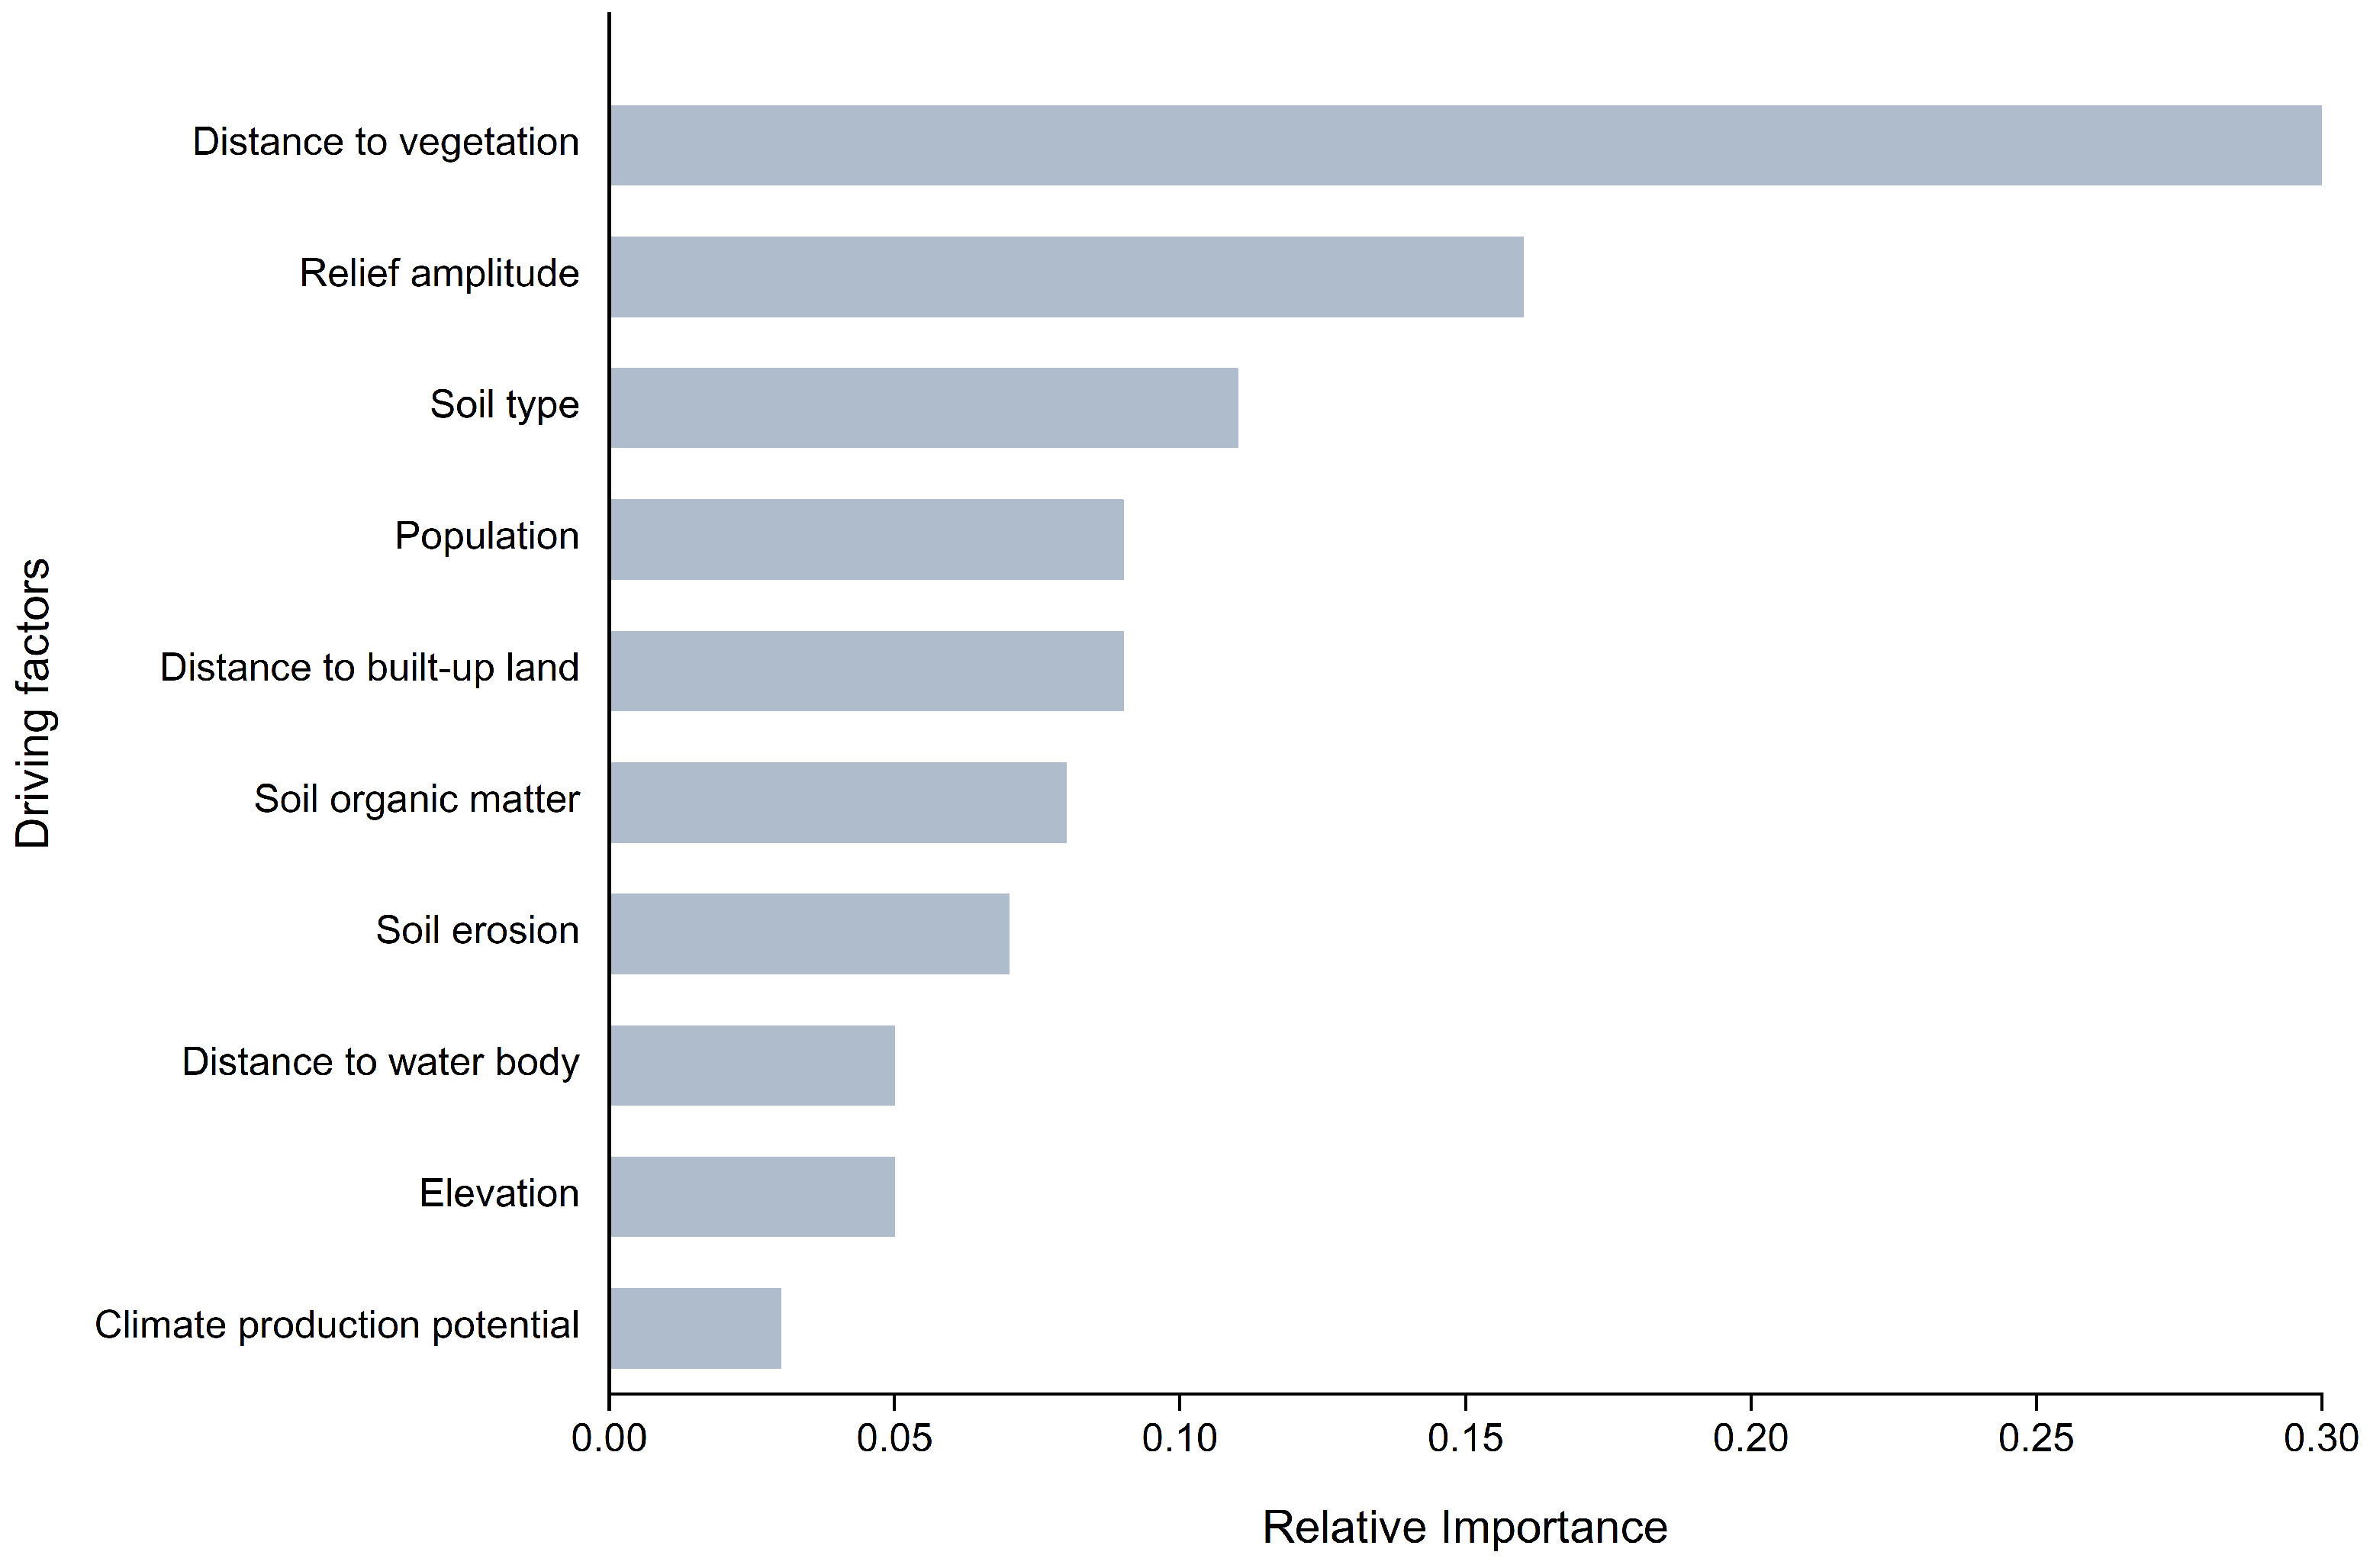
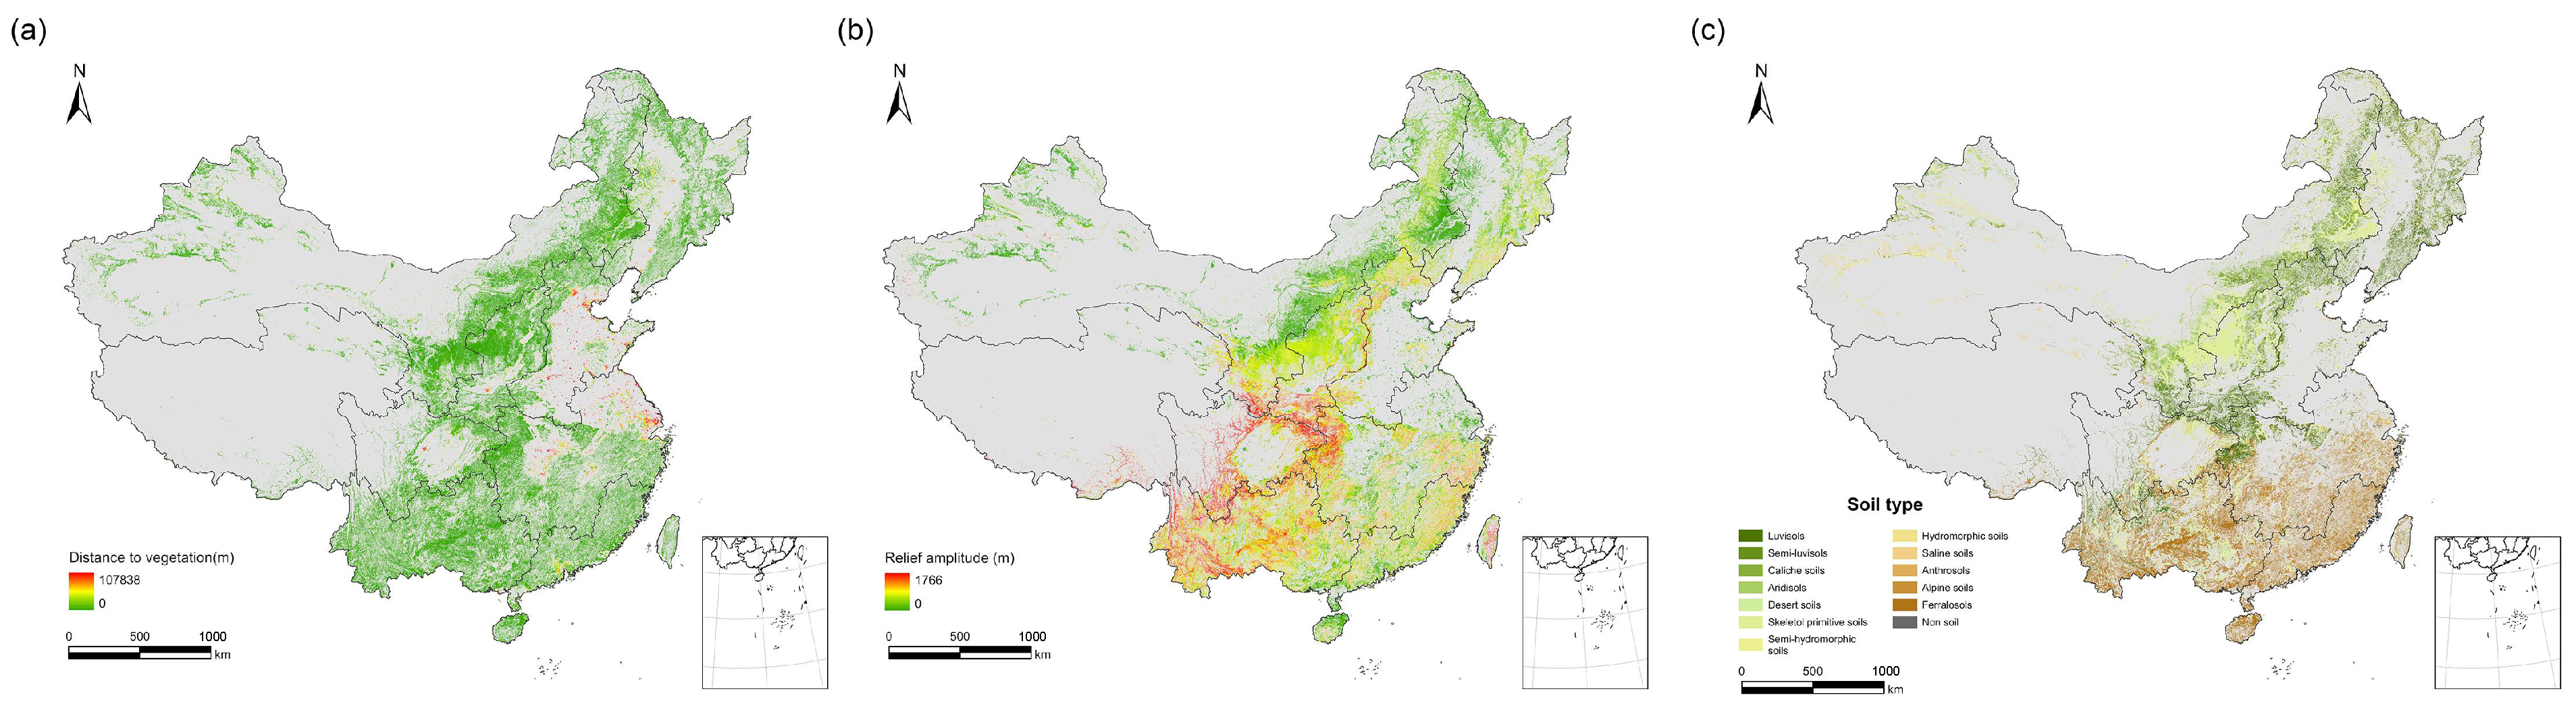
3.3. Relative Importance of Driving Factors of Cropland LTS in China during 1990–2018

The model achieved an OPC of 75.2% with an AUC value of 0.80, indicating high classification accuracy. During the study period, the distance to vegetation had the highest relative importance at 0.30, followed by relief amplitude at 0.16, and soil type at 0.10. The remaining factors, ranked population density, distance to built-up land, soil organic matter, soil erosion, distance to water bodies, elevation, and climate production potential, all had contributions below 0.1 (Figure 5).
An overlay of cropland LTS and distance to vegetation layers revealed that unstable cropland predominantly occurred closer to vegetation in the NASR, NCP, LP, QTP, SBSR, YGP, and SC (excluding areas around provincial capitals), with the HHHP exhibiting a prevalence of unstable cropland in areas farther from the vegetation. In the MLYP, unstable cropland far from vegetation is predominantly distributed in the northeast. Unstable cropland with lower relief amplitude is prevalent in the NCP, NASR, and HHHP, whereas that with higher relief amplitude is predominant in the SBSR, LP, and YGP. Unstable cropland in the SC and MLYP exhibited relatively discrete relief amplitude patterns, whereas the relief amplitude of unstable cropland in the QTP was clustered, with lower values in the north and higher values in the south. Further analysis revealed two distinct patterns in the distribution of distance to vegetation and relief amplitude in unstable cropland: areas with a shorter distance to vegetation tended to exhibit a higher relief amplitude, and vice versa. These patterns were most common in 2000 (Figure 6). Soil type emerged as the third most influential factor in the LTS of cropland, with unstable cropland predominantly found in red earth (Ferralosols) in the YGP and SC, yellow–brown earth (Luvisols), and loessial soils (Skeletol primitive soils) in the LP, and desert soils in the NASR (Figure 6). Other factors did not exhibit significant patterns within unstable cropland during the study period.

4. Discussion

4.1. Comparison to Relative Research

In our study, we evaluated the long-term stability (LTS) of cropland by analyzing the actual fluctuation amplitude of the cropland area per 1 km grid over the next five years. Furthermore, we enhanced the analysis of cropland LTS by integrating it with previous studies in China. The quantity and spatial distribution of stable cropland areas identified in our study aligned closely with those reported by Li et al. [17]. They reported a total area of long-term stable cropland from 2001 to 2019 of approximately 2.08 × 10 6 km2, which closely resembles the stable cropland area in 2018 of approximately 2.09 × 10 6 km2 in our study. This confirms the capacity of our method to accurately depict the long-term stable use of cropland. Liang et al. [24] found that stable cropland, which has remained unchanged for the past 30 years, is predominantly concentrated in the NCP, HHHP, MLYP, and SBSR, which is consistent with the findings of our study. The proportion of unstable cropland productivity in the study by Han et al. [16] was 44.12%, which closely corresponds to the proportion of unstable cropland (46.73%) in our study. However, they overlooked the widespread unstable cropland in the NASR despite the minimal fluctuation in cropland productivity within this agricultural zone. Our findings indicate a significantly greater proportion of unstable cropland compared to the study by Yang et al. [22], which may by attributed to the coarser resolution (250 m) of the land use data used in their research, leading to the exclusion of unstable cropland in the NCP, HHHP, and MLYP. Notebly, Li et al. [17] and Yang et al. [22] employed the same method (sliding-window method) for data processing, but they differed in their interpretation: Li et al. [17] considered anomalous land use changes within the time–series window as errors and filtered them out, whereas Yang et al. [22] interpreted them as indications of unstable use of cropland. The sliding-window method is frequently employed to detect changes in land use dynamics and associated anomalies [72,73]. However, varying identification mechanisms can significantly influence study outcomes, thereby increasing uncertainty. The method we employed mitigated the controversy stemming from divergent interpretations of the sliding-window method, while rectifying errors in the original dataset resulting from spatial offset phenomena, thereby demonstrating better performance.
Our study examined the impacts of specific driving factors on cropland long-term stability, thereby validating the effectiveness of the evaluation indicators proposed in previous studies. For instance, whereas Fan et al. [25] prioritized the distance of cropland to built-up land in their indicator system, our findings emphasize the greater importance of distance to vegetation, a factor overlooked in their study. Kuang et al. [27] suggested that a closer distance to vegetation reduces the risk of cropland being encroached upon by built-up land, thereby promoting stable cropland use. However, our study found significant instability in cropland near vegetation, suggesting that Kuang et al. [27] focused solely on urban expansion, neglecting other potential driving mechanisms. Quantitative analysis of the driving mechanisms behind cropland long-term stability at the national level helped identify the limitations of existing a priori evaluation systems when generalized beyond specific regions.
Furthermore, this study quantitatively analyzed the driving mechanisms influencing cropland long-term stability in China using a machine learning model, an approach that has not been employed in previous research [16,17,32,33]. Although Yang et al. [22] qualitatively summarized the various driving mechanisms affecting global cropland long-term stability patterns, their study lacked quantitative insights into the impacts of these mechanisms, resulting in a limited focus on the primary challenges in global cropland stability. In contrast, our study quantified the relative importance of different driving factors, revealing that policy influences and urban expansion could have a greater impact than climate change and ecological disturbances on the long-term stability of cropland in China, as discussed in Section 4.2.

4.2. Driving Mechanisms of Cropland LTS in China

Distinct patterns in the distribution of distance to vegetation and relief amplitude in unstable cropland may reflect two significant social phenomena in China during 1990–2018: the implementation of the Grain for Green Policy and rapid urban expansion (Figure 6). The former corresponds to unstable slope cropland with a low distance to vegetation and high relief amplitude in the LP, SBSR, and YGP, whereas the latter corresponds to cropland in the peri-urban areas in the NCP, HHHP, MLYP, and cities in the SBSR.
The implementation of the Grain for Green project has resulted in varied marginal impacts on yields in agricultural zones such as the SBSR, YGP, and LP, causing instability in the LTS of slope cropland near vegetation in these areas [74]. Upon the conclusion of the local Grain for Green Project, subsidies were gradually withdrawn. Farmers in mountainous and hilly regions confronted with food self-sufficiency challenges often revert to reclaiming land previously designated for forest return or unsuitable slopes to meet their livelihood needs [75]. Nevertheless, rapid urbanization and the outflow of rural labor rendered it unsustainable to maintain these re-cultivated croplands, exacerbating their instability cropland in these areas [76].
Changing patterns of cropland utilization in peri-urban areas can be categorized into two types: rough expansion of built-up land with encroachment on cropland and a requisition–compensation balance approach to adjust the cropland layout [77,78]. Following the market-oriented economic reforms in the 1980s, China has pursued an unbalanced urbanization strategy, resulting in significant cropland loss around cities [79]. To mitigate cropland loss, the government introduced a requisition–compensation balance policy in 1996, requiring that any occupied cropland be compensated by an equal or greater amount of additional cropland, ensuring quantitative security in cropland utilization. However, this policy still allows the exchange of low-quality cropland for high-quality ones [80]. Furthermore, the policy, focusing solely on the area, overlooked the effect of slope at vertical levels. Consequently, developers reclaim slopes in peri-urban areas to meet quantity targets after occupying flat croplands for construction purposes. Newly reclaimed croplands are often abandoned because of poor soil conditions, which exacerbates cropland instability in these areas [81].
The global Moran’s I value of cropland LTS in China decreased significantly in 1995 and remained low until increasing again in 2018. This trend was driven by the repeated reclamation and abandonment of croplands within the LL value clusters, characterized by cropland proximity to vegetation and sloped terrain. The unstable use of cropland further contributed to the discrete evolution pattern of the LL value clusters (Figure 4).
Our study revealed that soil fertility, as indicated by soil organic matter content, had minimal impact on the LTS of cropland. This could be attributed to China’s persistent shortage of cropland resources, prompting operators to utilize land regardless of its fertility, even if this results in excessive chemical fertilizer application [82]. Concurrently, to compensate for the massive encroachment of cropland by rapid coastal urban expansion, substantial new croplands have been reclaimed in the less productive northern regions [83]. The soil type significantly influences the LTS of croplands because soils within these areas are typically unsuitable for cultivation, leading to cropland instability. Our study identified climate factors as minor contributors to cropland LTS, suggesting that, although climate change may have impacted cropland productivity in China [84], it did not significantly alter cropland utilization patterns.
In light of these mechanisms, it is suggested for local governments in the NCP, NASR, LP, QTP, SBSR, YGP, SC, and western MLYP to prioritize thorough investigation of the current conditions of sloped land utilization in rural areas and restructure the utilization strategies for sloped cropland. They could also develop forest food resources (similar to non-wood forest products in Europe) to support farmers affected by the Grain for Green Policy, which ensures their sustainable livelihoods [85,86]. Concurrently, governments in the HHHP and northeastern MLYP should control the unreasonable expansion of built-up land and ensure effective implementation of the cropland requisition–compensation balance policy. The recent policy directive from the Chinese government, which advocates for a net increase in stable-use cropland and sets it as the maximum limit for cropland encroachment, promotes stable cropland utilization in these areas [86]. We recommend integrating quality assessment as a stringent criterion for gained cropland to further enhance its long-term stability in these regions.

4.3. Limitations and Prospects

In this study, the long-term stability of cropland was assessed by calculating the changes in the proportion of cropland over subsequent five years. This method provided empirical validity to our study but also brought about the first limitation. Our approach presumes the current stability of cropland based on its future use, thereby hindering the direct calculation of long-term stability when future land use data (e.g., to assess cropland long-term stability in the current year) are unavailable. This explains why we only assessed cropland long-term stability in China from 1990 to 2018 based on data availability and consistency (the last year of employed land use data was 2022). Future studies may attempt to predict the spatial patterns of cropland long-term stability based on the identified driving mechanisms or adopt methods from other land use simulation studies to predict cropland use changes [50,87].
Additionally, this study calculated the long-term stability of cropland in China using 1 km grids as spatial units, resulting in calculation results with a spatial resolution of 1 km. Although adequate at the national level, this resolution may be insufficient at provincial, river basin, city, and county scales. Furthermore, our method may not fully capture minor changes within 1 km grids, and the effects of cropland fragmentation on productivity and abandonment rates could influence the analysis of the driving mechanisms of cropland long-term stability [88]. Prior studies on long-term cropland stability have predominantly focused on cropland non-agriculturalization (from cropland to non-cropland), neglecting other phenomena such as cropland non-grainization (from food crops to economic crops, such as fruits and herbs) and transformations between paddy fields and dry lands, which may also indicate unstable utilization of cropland [89,90]. Future research should enhance the precision of the cropland use classification to better evaluate the long-term stable use of regional cropland.
Moreover, although this study refers to existing studies on cropland stability and other related research to identify the potential influencing factors, several driving mechanisms remain unexplored. For instance, how do topological relationships among cropland patches (e.g., contiguity and fractal dimensions) affect the long-term stable use of cropland? However, the specific mechanisms underlying these effects require further investigation [27]. Additionally, some factors may exhibit nonlinear effects on cropland long-term stability, such as intensive and large-scale cropland utilization, which may have marginal impacts [91]. Future research could establish thresholds tailored to the characteristics of these new driving factors to enhance the analysis of the driving mechanisms of regional cropland long-term stability.
Finally, this study revealed distinct distribution patterns of cropland long-term stability across different agricultural zones. Although this study conducted a quantitative analysis of the driving mechanisms of cropland long-term stability in China, precise quantitative analyses specific to different agricultural zones remain inadequate. Considering the similarities and differences in the distribution patterns of cropland long-term stability across agricultural zones, adjusting regional boundaries based on China’s overall cropland long-term stability distribution, and conducting specific analyses could elucidate the geographical, climatic, cultural, and economic disparities among these regions.

5. Conclusions

In this study, we evaluated the spatiotemporal distribution of the long-term stability of cropland in China from 1990 to 2018, and analyzed its driving mechanisms. Our findings indicate that nearly half of China’s cropland was unstable during the study period, with the majority of unstable croplands located in the northern arid and semiarid region, the Loess Plateau, the Qinghai–Tibet Plateau, the Yunnan–Guizhou Plateau, and Southern China. The area of unstable cropland initially decreased and then increased from 1990 to 2018, mirroring trends that are observed in Global Moran’s I values. Spatial correlation patterns resembled those of cropland long-term stability distribution. High–High values concentrated in the Northeastern China Plain, the Huang–Huai–Hai Plain, the Sichuan Basin, and the northeastern Middle–Lower Yangtze Plain, whereas Low–Low values relatively dispersed in other regions. We identified distance to vegetation and relief amplitude as primary factors influencing cropland long-term stability in China. These patterns potentially explain the instability of marginal cropland in mountainous and hilly areas due to the Grain for Green Policy and rural hollowing, as well as instability in peri-urban regions due to unbalanced urban expansion and improper implementation of the cropland requisition–compensation balance policy. Local governments should prioritize improving the efficiency of the cropland requisition–compensation balance policy in the Huang–Huai–Hai Plain and northeastern Middle–Lower Yangtze Plain, whereas addressing the unintended consequences of the Grain for Green Policy in other regions. Our study underscores the importance of focusing on the long-term stable utilization of cropland to safeguard food security in China.

Supplementary Materials

The following supporting information can be downloaded at: https://www.mdpi.com/article/10.3390/land13071016/s1, The Supplementary Material S1 includes definition and calculation of driving factors. Table S1: Stable and unstable cropland areas in China from 1990 to 2018; Table S2: Global Moran’s I index and its significance test of cropland LTS in China from 1990 to 2018.

Author Contributions

Conceptualization, Y.Z. and J.S.; methodology, J.S. and Y.Z.; validation, Q.W., D.O. and W.Y.; formal analysis, Q.W. and X.G.; investigation, Y.Z., J.S., P.L., Q.W. and Z.T.; resources, X.G.; writing—original draft preparation, Y.Z., J.S. and P.L.; writing—review and editing, J.S., Q.W. and X.G.; visualization, Y.Z. and W.Y.; supervision, D.O. and X.G.; project administration, X.G.; funding acquisition, X.G. All authors have read and agreed to the published version of the manuscript.

Funding

The authors are grateful for the funding provided by the Ministry of Science and Technology of China, National Key Research and Development Plan (No.2022YFD1901403).

Data Availability Statement

The data that support the findings of this study are available on request from the corresponding author.

Acknowledgments

The authors thank the anonymous reviewers for the helpful comments that improved this manuscript.

Conflicts of Interest

The authors declare no conflicts of interest.

Abbreviations

The following abbreviations are used in this manuscript:
LTSlong-term stability
NCPthe Northeast China Plain
HHHPthe Huang–Huai–Hai Plain
LPthe Loess Plateau
NASRthe Northern Arid and Semiarid Region
SBSRthe Sichuan Basin and Surrounding Regions
QTPthe Qinghai–Tibet Plateau
MLYPthe Middle–Lower Yangtze Plain
YGPthe Yunnan–Guizhou Plateau
SCthe Southern China
ANNartificial neural network
MLPmultilayer perceptron
OPCoverall percent correct
ROCthe receiver operating characteristics curve
AUCarea under the ROC curve
CLCDChina Land Cover Dataset

References

  1. Lutz, W. Changing population size and distribution as a security concern. In Facing Global Environmental Change: Environmental, Human, Energy, Food, Health and Water Security Concepts; Springer: Berlin/Heidelberg, Germany, 2009; pp. 203–213. [Google Scholar]
  2. Mehrabi, Z.; Delzeit, R.; Ignaciuk, A.; Levers, C.; Braich, G.; Bajaj, K.; Amo-Aidoo, A.; Anderson, W.; Balgah, R.A.; Benton, T.G.; et al. Research priorities for global food security under extreme events. One Earth 2022, 5, 756–766. [Google Scholar] [CrossRef] [PubMed]
  3. Steven, D.; O’Brien, E.; Jones, B.D. The New Politics of Strategic Resources: Energy and Food Security Challenges in the 21st Century; Brookings Institution Press: Washington, DC, USA, 2014. [Google Scholar]
  4. Lu, X.; Huang, S. Barriers and solutions to China’s cultivated land protection. Int. J. Environ. Stud. 2010, 67, 223–232. [Google Scholar] [CrossRef]
  5. Vesterby, M.; Heimlich, R.E.; Krupa, K.S. Urbanization of Rural Land in the United States; Number 673; US Department of Agriculture, Economic Research Service: Washington, DC, USA, 1994.
  6. Wu, Y.; Mo, Z.; Peng, Y. Renewal of land-use term for urbanization in China: Sword of Damocles or Noah’s Ark? Land Use Policy 2017, 65, 238–248. [Google Scholar] [CrossRef]
  7. Li, H.; Song, W. Spatial transformation of changes in global cultivated land. Sci. Total Environ. 2023, 859, 160194. [Google Scholar] [CrossRef] [PubMed]
  8. Meng, H.; Xing, L.; Hu, J.; Shen, C.; Zhang, H.; Wu, J. Exploring the characteristics and drivers of virtual cropland trade of major agricultural products in China. J. Clean. Prod. 2024, 448, 141392. [Google Scholar] [CrossRef]
  9. Zhai, J.; Pu, L.; Lu, Y.; Huang, S. Is the boom in staple crop production attributed to expanded cropland or improved yield? A comparative analysis between China and India. Sci. Total Environ. 2024, 933, 173151. [Google Scholar] [CrossRef] [PubMed]
  10. Liu, Y.; Zhou, Y. Reflections on China’s food security and land use policy under rapid urbanization. Land Use Policy 2021, 109, 105699. [Google Scholar] [CrossRef]
  11. Kuang, W.; Liu, J.; Tian, H.; Shi, H.; Dong, J.; Song, C.; Li, X.; Du, G.; Hou, Y.; Lu, D.; et al. Cropland redistribution to marginal lands undermines environmental sustainability. Natl. Sci. Rev. 2022, 9, nwab091. [Google Scholar] [CrossRef]
  12. Li, T.; Long, H.; Zhang, Y.; Tu, S.; Ge, D.; Li, Y.; Hu, B. Analysis of the spatial mismatch of grain production and farmland resources in China based on the potential crop rotation system. Land Use Policy 2017, 60, 26–36. [Google Scholar] [CrossRef]
  13. Li, F.; Wu, S.; Liu, H.; Yan, D. Biodiversity loss through cropland displacement for urban expansion in China. Sci. Total Environ. 2024, 907, 167988. [Google Scholar] [CrossRef]
  14. Kraemer, R.; Prishchepov, A.V.; Müller, D.; Kuemmerle, T.; Radeloff, V.C.; Dara, A.; Terekhov, A.; Frühauf, M. Long-term agricultural land-cover change and potential for cropland expansion in the former Virgin Lands area of Kazakhstan. Environ. Res. Lett. 2015, 10, 054012. [Google Scholar] [CrossRef]
  15. Lark, T.J.; Spawn, S.A.; Bougie, M.; Gibbs, H.K. Cropland expansion in the United States produces marginal yields at high costs to wildlife. Nat. Commun. 2020, 11, 4295. [Google Scholar] [CrossRef]
  16. Han, B.; Jin, X.; Yeting, F.; Chen, H.; Jin, J.; Xu, W.; Ren, J.; Zhou, Y. Trend and spatial pattern of stable cropland productivity in China based on satellite observations (2001–2020). Environ. Impact Assess. Rev. 2023, 101, 107136. [Google Scholar] [CrossRef]
  17. Li, G.; He, T.; Zhang, M.; Wu, C. Spatiotemporal variations in the eco-health condition of China’s long-term stable cultivated land using Google Earth Engine from 2001 to 2019. Appl. Geogr. 2022, 149, 102819. [Google Scholar] [CrossRef]
  18. Bissett, A.; Richardson, A.E.; Baker, G.; Thrall, P.H. Long-term land use effects on soil microbial community structure and function. Appl. Soil Ecol. 2011, 51, 66–78. [Google Scholar] [CrossRef]
  19. Li, C.; Li, Y.; Tang, L. The effects of long-term fertilization on the accumulation of organic carbon in the deep soil profile of an oasis farmland. Plant Soil 2013, 369, 645–656. [Google Scholar] [CrossRef]
  20. Niemiec, M.; Chowaniak, M.; Sikora, J.; Szeląg-Sikora, A.; Gródek-Szostak, Z.; Komorowska, M. Selected properties of soils for long-term use in organic farming. Sustainability 2020, 12, 2509. [Google Scholar] [CrossRef]
  21. Ouyang, W.; Xu, Y.; Hao, F.; Wang, X.; Siyang, C.; Lin, C. Effect of long-term agricultural cultivation and land use conversion on soil nutrient contents in the Sanjiang Plain. Catena 2013, 104, 243–250. [Google Scholar] [CrossRef]
  22. Yang, R.; Xu, S.; Gu, B.; He, T.; Zhang, H.; Fang, K.; Xiao, W.; Ye, Y. Stabilizing unstable cropland towards win-win sustainable development goals. Environ. Impact Assess. Rev. 2024, 105, 107395. [Google Scholar] [CrossRef]
  23. Long, Y.; Sun, J.; Wellens, J.; Colinet, G.; Wu, W.; Meersmans, J. Mapping the Spatiotemporal Dynamics of Cropland Abandonment and Recultivation across the Yangtze River Basin. Remote Sens. 2024, 16, 1052. [Google Scholar] [CrossRef]
  24. Liang, X.; Jin, X.; Dou, Y.; Zhang, X.; Li, H.; Wang, S.; Meng, F.; Tan, S.; Zhou, Y. Mapping sustainability-oriented China’s cropland use stability. Comput. Electron. Agric. 2024, 219, 108823. [Google Scholar] [CrossRef]
  25. Fan, W.; Kong, X.; Men, M.; Xu, H.; Li, C. Evaluation on Cultivated Land Resources Stability in Beijing Daxing District. China Land Sci. 2009, 23, 48–53+80. (In Chinese) [Google Scholar]
  26. Fan, J.; Wang, L.; Qin, J.; Zhang, F.; Xu, Y. Evaluating cultivated land stability during the growing season based on precipitation in the Horqin Sandy Land, China. J. Environ. Manag. 2020, 276, 111269. [Google Scholar] [CrossRef] [PubMed]
  27. Kuang, L.; Ye, Y.; Zhao, X.; Guo, X.; Xie, W. Delineation of basic farmland based on the quality and spatial stability: A case study of Yingtan City, China. Environ. Sci. Pollut. Res. 2022, 29, 88737–88750. [Google Scholar] [CrossRef] [PubMed]
  28. Sui, H.; Song, G.; Liu, W.; Zhang, Y.; Su, R.; Wang, Q.; Ren, G.; Mi, Y. Spatiotemporal variation of cultivated land ecosystem stability in typical regions of Lower Liaohe Plain China based on stress-buffer-response. Sci. Total Environ. 2023, 858, 160213. [Google Scholar] [CrossRef] [PubMed]
  29. Yan, Y.; Guan, Q.; Shao, W.; Wang, Q.; Yang, X.; Luo, H. Spatiotemporal dynamics and driving mechanism of arable ecosystem stability in arid and semi-arid areas based on Pressure-Buffer-Response process. J. Clean. Prod. 2023, 421, 138553. [Google Scholar] [CrossRef]
  30. Gao, H.; Gong, J.; Ye, T.; Maier, M.; Liu, J. Constructing cropland ecological stability assessment method based on disturbance-resistance-response processes and classifying cropland ecological types. Sci. Total Environ. 2024, 930, 172673. [Google Scholar] [CrossRef] [PubMed]
  31. Potapov, P.; Turubanova, S.; Hansen, M.C.; Tyukavina, A.; Zalles, V.; Khan, A.; Song, X.P.; Pickens, A.; Shen, Q.; Cortez, J. Global maps of cropland extent and change show accelerated cropland expansion in the twenty-first century. Nat. Food 2022, 3, 19–28. [Google Scholar] [CrossRef]
  32. Zhang, M.; Li, G.; He, T.; Zhai, G.; Guo, A.; Chen, H.; Wu, C. Reveal the severe spatial and temporal patterns of abandoned cropland in China over the past 30 years. Sci. Total Environ. 2023, 857, 159591. [Google Scholar] [CrossRef]
  33. He, T.; Li, J.; Zhang, M.; Zhai, G.; Lu, Y.; Wang, Y.; Guo, A.; Wu, C. Uphill cropland and stability assessment of gained cropland in China over the preceding 30 years. J. Geogr. Sci. 2024, 34, 699–721. [Google Scholar] [CrossRef]
  34. Patterson, D.W. Artificial Neural Networks: Theory and Applications; Prentice Hall PTR: Hoboken, NJ, USA, 1998. [Google Scholar]
  35. Pijanowski, B.C.; Pithadia, S.; Shellito, B.A.; Alexandridis, K. Calibrating a neural network-based urban change model for two metropolitan areas of the Upper Midwest of the United States. Int. J. Geogr. Inf. Sci. 2005, 19, 197–215. [Google Scholar] [CrossRef]
  36. Lakes, T.; Müller, D.; Krüger, C. Cropland change in southern Romania: A comparison of logistic regressions and artificial neural networks. Landsc. Ecol. 2009, 24, 1195–1206. [Google Scholar] [CrossRef]
  37. Wang, J.; Chen, Y.; Shao, X.; Zhang, Y.; Cao, Y. Land-use changes and policy dimension driving forces in China: Present, trend and future. Land Use Policy 2012, 29, 737–749. [Google Scholar] [CrossRef]
  38. Panda, K.C.; Singh, R.M.; Singh, S.K. Advanced CMD predictor screening approach coupled with cellular automata-artificial neural network algorithm for efficient land use-land cover change prediction. J. Clean. Prod. 2024, 449, 141822. [Google Scholar] [CrossRef]
  39. Wen, S.; Wang, Y.; Song, H.; Liu, H.; Sun, Z.; Bilal, M.A. Integrated Predictive Modeling and Policy Factor Analysis for the Land Use Dynamics of the Western Jilin. Atmosphere 2024, 15, 288. [Google Scholar] [CrossRef]
  40. Office of the Third National Land Resource Survey Leading Group of the State Council. Major Data Bulletin of the Third National Land Resource Survey. Available online: https://www.gov.cn/xinwen/2021-08/26/content_5633490.htm (accessed on 16 May 2024). (In Chinese)
  41. Ren, Y.; Liu, J.; Willems, P.; Liu, T.; Pham, Q.B. Detection and Assessment of Changing Drought Events in China in the Context of Climate Change Based on the Intensity–Area–Duration Algorithm. Land 2023, 12, 1820. [Google Scholar] [CrossRef]
  42. Li, C.; Ou, S. Soils of China; Science Press: Beijing, China, 1990. (In Chinese) [Google Scholar]
  43. Yu, D.S.; Shi, X.Z.; Wang, H.J.; Sun, W.X.; Warner, E.D.; Liu, Q.H. National scale analysis of soil organic carbon storage in China based on Chinese soil taxonomy. Pedosphere 2007, 17, 11–18. [Google Scholar] [CrossRef]
  44. National Agricultural Zoning, C. Agricultural Resources and Regional Planning in China; Agriculture Press: Beijing, China, 1991. (In Chinese) [Google Scholar]
  45. Yu, E.; Liu, D.; Yang, J.; Sun, J.; Yu, L.; King, M.P. Future climate change for major agricultural zones in China as projected by CORDEX-EA-II, CMIP5 and CMIP6 ensembles. Atmos. Res. 2023, 288, 106731. [Google Scholar] [CrossRef]
  46. Yang, J.; Huang, X. 30 m annual land cover and its dynamics in China from 1990 to 2019. Earth Syst. Sci. Data 2021, 13, 3907–3925. [Google Scholar] [CrossRef]
  47. Peng, S.; Ding, Y.; Liu, W.; Li, Z. 1 km monthly temperature and precipitation dataset for China from 1901 to 2017. Earth Syst. Sci. Data 2019, 11, 1931–1946. [Google Scholar] [CrossRef]
  48. Shangguan, W.; Dai, Y.; Liu, B.; Zhu, A.; Duan, Q.; Wu, L.; Ji, D.; Ye, A.; Yuan, H.; Zhang, Q.; et al. A China data set of soil properties for land surface modeling. J. Adv. Model. Earth Syst. 2013, 5, 212–224. [Google Scholar] [CrossRef]
  49. Teklay, A.; Dile, Y.T.; Setegn, S.G.; Demissie, S.S.; Asfaw, D.H. Evaluation of static and dynamic land use data for watershed hydrologic process simulation: A case study in Gummara watershed, Ethiopia. Catena 2019, 172, 65–75. [Google Scholar] [CrossRef]
  50. Liang, X.; Guan, Q.; Clarke, K.C.; Liu, S.; Wang, B.; Yao, Y. Understanding the drivers of sustainable land expansion using a patch-generating land use simulation (PLUS) model: A case study in Wuhan, China. Comput. Environ. Urban Syst. 2021, 85, 101569. [Google Scholar] [CrossRef]
  51. Yin, H.; Brandão, A., Jr.; Buchner, J.; Helmers, D.; Iuliano, B.G.; Kimambo, N.E.; Lewińska, K.E.; Razenkova, E.; Rizayeva, A.; Rogova, N.; et al. Monitoring cropland abandonment with Landsat time series. Remote Sens. Environ. 2020, 246, 111873. [Google Scholar] [CrossRef]
  52. Li, F.; Ma, S.; Liu, X. Changing multi-scale spatiotemporal patterns in food security risk in China. J. Clean. Prod. 2023, 384, 135618. [Google Scholar]
  53. Liu, S.; Xiao, W.; Ye, Y.; He, T.; Luo, H. Rural residential land expansion and its impacts on cultivated land in China between 1990 and 2020. Land Use Policy 2023, 132, 106816. [Google Scholar] [CrossRef]
  54. Wang, Y.; Wang, J.; Li, F.; Liu, X.; Zhao, D. Can the transition of multiple cropping systems affect the cropland change? Agric. Syst. 2024, 214, 103815. [Google Scholar]
  55. Tian, G.; Duan, J.; Yang, L. Spatio-temporal pattern and driving mechanisms of cropland circulation in China. Land Use Policy 2021, 100, 105118. [Google Scholar] [CrossRef]
  56. Wang, L.; Zhang, S.; Xiong, Q.; Liu, Y.; Liu, Y.; Liu, Y. Spatiotemporal dynamics of cropland expansion and its driving factors in the Yangtze River Economic Belt: A nuanced analysis at the county scale. Land Use Policy 2022, 119, 106168. [Google Scholar] [CrossRef]
  57. Anselin, L. Local indicators of spatial association—LISA. Geogr. Anal. 1995, 27, 93–115. [Google Scholar] [CrossRef]
  58. Wang, Q.; Xiong, M.; Li, Q.; Li, H.; Lan, T.; Deng, O.; Huang, R.; Zeng, M.; Gao, X. Spatially explicit reconstruction of cropland using the random forest: A case study of the Tuojiang River Basin, China from 1911 to 2010. Land 2021, 10, 1338. [Google Scholar] [CrossRef]
  59. Wang, B.; Cheng, W. Geomorphic influences on land use/cover diversity and pattern. Catena 2023, 230, 107245. [Google Scholar] [CrossRef]
  60. Prishchepov, A.V.; Müller, D.; Dubinin, M.; Baumann, M.; Radeloff, V.C. Determinants of agricultural land abandonment in post-Soviet European Russia. Land Use Policy 2013, 30, 873–884. [Google Scholar] [CrossRef]
  61. Zhang, L.; Zhang, K.; Zhu, X.; Chen, H.; Wang, W. Integrating remote sensing, irrigation suitability and statistical data for irrigated cropland mapping over mainland China. J. Hydrol. 2022, 613, 128413. [Google Scholar] [CrossRef]
  62. Qin, Y.; Liu, J.; Shi, W.; Tao, F.; Yan, H. Spatial-temporal changes of cropland and climate potential productivity in northern China during 1990–2010. Food Secur. 2013, 5, 499–512. [Google Scholar] [CrossRef]
  63. Klein Goldewijk, K.; Beusen, A.; Van Drecht, G.; De Vos, M. The HYDE 3.1 spatially explicit database of human-induced global land-use change over the past 12,000 years. Glob. Ecol. Biogeogr. 2011, 20, 73–86. [Google Scholar] [CrossRef]
  64. Cui, J.; Zhu, M.; Liang, Y.; Qin, G.; Li, J.; Liu, Y. Land use/land cover change and their driving factors in the Yellow River Basin of Shandong Province based on google earth Engine from 2000 to 2020. ISPRS Int. J. Geo-Inf. 2022, 11, 163. [Google Scholar] [CrossRef]
  65. Yilmaz, A.S.; Özer, Z. Pitch angle control in wind turbines above the rated wind speed by multi-layer perceptron and radial basis function neural networks. Expert Syst. Appl. 2009, 36, 9767–9775. [Google Scholar] [CrossRef]
  66. Darvishi, A.; Yousefi, M.; Marull, J. Modelling landscape ecological assessments of land use and cover change scenarios. Application to the Bojnourd Metropolitan Area (NE Iran). Land Use Policy 2020, 99, 105098. [Google Scholar] [CrossRef]
  67. Tayyebi, A.; Pijanowski, B.C.; Tayyebi, A.H. An urban growth boundary model using neural networks, GIS and radial parameterization: An application to Tehran, Iran. Landsc. Urban Plan. 2011, 100, 35–44. [Google Scholar] [CrossRef]
  68. Mozumder, C.; Tripathi, N.K. Geospatial scenario based modelling of urban and agricultural intrusions in Ramsar wetland Deepor Beel in Northeast India using a multi-layer perceptron neural network. Int. J. Appl. Earth Obs. Geoinform. 2014, 32, 92–104. [Google Scholar] [CrossRef]
  69. Lane, M.M.; Czyzewski, D.I.; Chumpitazi, B.P.; Shulman, R.J. Reliability and validity of a modified Bristol Stool Form Scale for children. J. Pediatr. 2011, 159, 437–441. [Google Scholar] [CrossRef]
  70. Lee, J.; Oh, Y.G.; Yoo, S.H.; Suh, K. Vulnerability assessment of rural aging community for abandoned farmlands in South Korea. Land Use Policy 2021, 108, 105544. [Google Scholar] [CrossRef]
  71. Wang, Q.; Ren, Q.; Liu, J. Identification and apportionment of the drivers of land use change on a regional scale: Unbiased recursive partitioning-based stochastic model application. Agric. Ecosyst. Environ. 2016, 217, 99–110. [Google Scholar] [CrossRef]
  72. Kulanuwat, L.; Chantrapornchai, C.; Maleewong, M.; Wongchaisuwat, P.; Wimala, S.; Sarinnapakorn, K.; Boonya-Aroonnet, S. Anomaly detection using a sliding window technique and data imputation with machine learning for hydrological time series. Water 2021, 13, 1862. [Google Scholar] [CrossRef]
  73. Li, X.; Gong, P.; Liang, L. A 30-year (1984–2013) record of annual urban dynamics of Beijing City derived from Landsat data. Remote Sens. Environ. 2015, 166, 78–90. [Google Scholar] [CrossRef]
  74. Feng, Z.; Yang, Y.; Zhang, Y.; Zhang, P.; Li, Y. Grain-for-green policy and its impacts on grain supply in West China. Land Use Policy 2005, 22, 301–312. [Google Scholar] [CrossRef]
  75. Chen, Y.; Wang, K.; Lin, Y.; Shi, W.; Song, Y.; He, X. Balancing green and grain trade. Nat. Geosci. 2015, 8, 739–741. [Google Scholar] [CrossRef]
  76. Guo, A.; Yue, W.; Yang, J.; Xue, B.; Xiao, W.; Li, M.; He, T.; Zhang, M.; Jin, X.; Zhou, Q. Cropland abandonment in China: Patterns, drivers, and implications for food security. J. Clean. Prod. 2023, 418, 138154. [Google Scholar] [CrossRef]
  77. Liu, C.; Song, C.; Ye, S.; Cheng, F.; Zhang, L.; Li, C. Estimate provincial-level effectiveness of the arable land requisition–compensation balance policy in mainland China in the last 20 years. Land Use Policy 2023, 131, 106733. [Google Scholar] [CrossRef]
  78. Song, W.; Pijanowski, B.C. The effects of China’s cultivated land balance program on potential land productivity at a national scale. Appl. Geogr. 2014, 46, 158–170. [Google Scholar] [CrossRef]
  79. Cao, S.; Lv, Y.; Zheng, H.; Wang, X. Challenges facing China’s unbalanced urbanization strategy. Land Use Policy 2014, 39, 412–415. [Google Scholar] [CrossRef]
  80. Liu, L.; Liu, Z.; Gong, J.; Wang, L.; Hu, Y. Quantifying the amount, heterogeneity, and pattern of farmland: Implications for China’s requisition–compensation balance of farmland policy. Land Use Policy 2019, 81, 256–266. [Google Scholar] [CrossRef]
  81. Chen, H.; Tan, Y.; Xiao, W.; Li, G.; Meng, F.; He, T.; Li, X. Urbanization in China drives farmland uphill under the constraint of the requisition–compensation balance. Sci. Total Environ. 2022, 831, 154895. [Google Scholar] [CrossRef]
  82. Wu, Y.; Xi, X.; Tang, X.; Luo, D.; Gu, B.; Lam, S.K.; Vitousek, P.M.; Chen, D. Policy distortions, farm size, and the overuse of agricultural chemicals in China. Proc. Natl. Acad. Sci. USA 2018, 115, 7010–7015. [Google Scholar] [CrossRef]
  83. Zuo, L.; Zhang, Z.; Carlson, K.M.; MacDonald, G.K.; Brauman, K.A.; Liu, Y.; Zhang, W.; Zhang, H.; Wu, W.; Zhao, X.; et al. Progress towards sustainable intensification in China challenged by land-use change. Nat. Sustain. 2018, 1, 304–313. [Google Scholar] [CrossRef]
  84. Piao, S.; Ciais, P.; Huang, Y.; Shen, Z.; Peng, S.; Li, J.; Zhou, L.; Liu, H.; Ma, Y.; Ding, Y.; et al. The impacts of climate change on water resources and agriculture in China. Nature 2010, 467, 43–51. [Google Scholar] [CrossRef] [PubMed]
  85. Lovrić, M.; Da Re, R.; Vidale, E.; Prokofieva, I.; Wong, J.; Pettenella, D.; Verkerk, P.J.; Mavsar, R. Non-wood forest products in Europe–A quantitative overview. For. Policy Econ. 2020, 116, 102175. [Google Scholar] [CrossRef]
  86. Central Committee of the Communist Party of China and the State Council. Opinions on Learning and Applying the Experience of the “Thousand Demonstration Villages and Ten Thousand Renovation Villages” Project to Powerfully and Effectively Promote Comprehensive Rural Revitalization. Available online: https://www.gov.cn/zhengce/202402/content_6929934.htm (accessed on 1 July 2024). (In Chinese)
  87. Liang, X.; Liu, X.; Li, D.; Zhao, H.; Chen, G. Urban growth simulation by incorporating planning policies into a CA-based future land-use simulation model. Int. J. Geogr. Inf. Sci. 2018, 32, 2294–2316. [Google Scholar] [CrossRef]
  88. Deng, O.; Ran, J.; Huang, S.; Duan, J.; Reis, S.; Zhang, J.; Zhu, Y.G.; Xu, J.; Gu, B. Managing fragmented croplands for environmental and economic benefits in China. Nat. Food 2024, 5, 230–240. [Google Scholar] [CrossRef]
  89. Li, X.; Ma, J.; Yang, Y.; Hou, H.; Liu, G.J.; Chen, F. Short-term response of soil microbial community to field conversion from dryland to paddy under the land consolidation process in North China. Agriculture 2019, 9, 216. [Google Scholar] [CrossRef]
  90. Lu, D.; Wang, Z.; Su, K.; Zhou, Y.; Li, X.; Lin, A. Understanding the impact of cultivated land-use changes on China’s grain production potential and policy implications: A perspective of non-agriculturalization, non-grainization, and marginalization. J. Clean. Prod. 2024, 436, 140647. [Google Scholar] [CrossRef]
  91. Yan, Z.; Wang, D.; Li, W.; Tong, Z.; Zhu, Y.; Shen, F. Treat and halt: Occurrence of spatially heterogeneous cropland degradation in the peri-urban area. Environ. Impact Assess. Rev. 2024, 104, 107366. [Google Scholar] [CrossRef]
Figure 1. Cropland distribution and agricultural zones in China (2018). Note: Data on cropland distribution in 2018 were obtained from Yang and Huang [46].
Land 13 01016 g001
Figure 2. Quantitative differentiation of LTS in China (a) and nine agricultural zones (b) during 1990–2018.
Land 13 01016 g002
Figure 3. Spatial distribution of cropland L T S in China during 1990–2018.
Land 13 01016 g003
Figure 4. Global Moran’s I and spatial autocorrelation of cropland L T S during 1990–2018.
Land 13 01016 g004
Figure 5. Relative importance of driving factors.
Land 13 01016 g005
Figure 6. Spatial patterns of distance to vegetation (a), relief amplitude (b), and soil type (c) of unstable cropland in 2000.
Land 13 01016 g006
Table 1. List of ancillary data used in this study.
CategoryOriginal
Spatial Resolution
YearData Source
Land use30 m1990–2022Yang and Huang [46]
DEM30 m2020https://www.earthdata.nasa.gov
(accessed on 10 October 2023)
Annual precipitation1 km1990, 1995, 2000,
2005, 2010, 2015, 2018
Peng et al. [47]
Mean annual
temperature
1 km1990, 1995, 2000,
2005, 2010, 2015, 2018
Peng et al. [47]
Soil erosion1 km1990, 1995, 2000,
2005, 2010, 2015, 2018
http://www.gis5g.com
(accessed on 11 October 2023)
Population density1 km1990, 1995, 2000,
2005, 2010, 2015, 2019
https://www.resdc.cn
(accessed on 12 October 2023)
Soil type1 km1995https://www.resdc.cn
(accessed on 12 October 2023)
Soil organic matter1 km2013Shangguan et al. [48]
Disclaimer/Publisher’s Note: The statements, opinions and data contained in all publications are solely those of the individual author(s) and contributor(s) and not of MDPI and/or the editor(s). MDPI and/or the editor(s) disclaim responsibility for any injury to people or property resulting from any ideas, methods, instructions or products referred to in the content.

