Abstract
Incorporating green and low-carbon building targets into the rural planning management system requires scientific and quantitative methods for assessing carbon emissions from rural land use. At present, the research in this field mainly focuses on urban areas, but there are fewer theoretical and practical studies on the assessment of carbon emissions from rural land use. This paper proposes a new carbon emission assessment method based on land use modes, and the model can not only assess carbon emissions but also directly reflect the carbon emission intensity of different land use spaces in rural areas and guide the carbon emission control of construction land in village planning. In this paper, we take suburban rural areas in Hunan Province as an example and establish a land use carbon emission assessment model with 13 indicators in five dimensions: total carbon emission, carbon emission efficiency, carbon emission intensity per unit of land use, carbon emission structure of land use, and carbon emission intensity of buildings, based on the bottom-up field research data. We practised our method in Jinlong Town, Hunan Province, and gave examples of model applications. It was found that the carbon emission calculation method based on the carbon emission intensity of land use can be used to calculate the current status of carbon emissions in different villages in Jinlong Town. At the same time, the carbon emission assessment results can be used as a scientific basis for carbon emission control in detailed village planning in Jinlong Town. In general, the carbon emission assessment model can complete the assessment of land carbon emissions in rural areas and provide a low-carbon land use management tool for the government.
1. Introduction
Carbon emissions are an important cause of global warming. Scholars around the world have been paying extensive attention to the study of carbon emissions in urban areas and have obtained abundant research results. China has also been committed to taking responsibility for mitigating global warming and has proposed policies to reduce carbon dioxide emissions in both urban and rural areas. Since China’s proactive response to global climate change by announcing the goal of “carbon peaking and carbon neutrality”, research on rural carbon emissions has gradually gained widespread attention. Not only for urban areas, some developed provinces in China have also proposed pragmatic activities to promote peak carbon in the rural construction sector, such as Jiangsu Province, which issued the “Implementation Program for Peak Carbon in Urban and Rural Construction Sectors” in 2023 with the goal of building a green and low-carbon rural layout. According to the China Rural Statistical Yearbook, per capita carbon emissions in the countryside have increased 2.4 times faster than in urban areas over the past decade, and the total carbon emissions have exceeded 45% of the total value, making the countryside a major emitter of carbon emissions. The vast majority of the carbon emissions from energy consumption are caused by energy consumption on built-up land [1]. A large number of studies on carbon emissions in rural areas mainly focus on carbon emission measurement from the perspective of bioenergy and agricultural production, with fewer studies on the assessment of carbon emissions from land use. The structure and mode of land use are closely related to land energy use [2]. In fact, carbon emissions from energy use generated by projects such as improving rural living conditions and building infrastructure all occur on land [3,4]. In the process of urbanisation, a large amount of agricultural land in China has been converted into built-up land, the number of land use patches has increased, the amount of unused land has decreased, and the space for ecological land is facing challenges [5]. At the same time, a large number of studies have shown that the growth of built-up land in the process of urbanisation has a positive effect on carbon emissions, so measuring carbon emissions at the level of rural land in the process of rural revitalisation has become important [6,7].
But at the moment, the method of measuring carbon emissions is based on the regional final energy consumption in the Statistical Yearbook, which can only calculate the total carbon emissions of counties/regions and cannot reflect the intensity and level of carbon emissions in rural areas; On the other hand, it is based on the fixed sources of carbon emissions in rural areas (including carbon emissions from fuel combustion, carbon emissions from buildings, carbon emissions from street lighting, carbon emissions from waste water, and carbon emissions from household waste), and the mobile sources of carbon emissions (carbon emissions from transport) to calculate the total amount of carbon emissions in rural communities. Many carbon emission studies for rural areas are based on the above top-down measures of end-use energy consumption, e.g., Gao et al. (2024) [8], calculate the impact of urbanisation on carbon emissions from household energy consumption in China using data from the China Family Panel Study (CFPS) database from 2012–2018. Hu et al. (2023) [9], compare the regional differences in carbon emissions from rural residents’ living consumption in different regions of China based on data from the China Rural Statistical Yearbook, the China Economy Net Statistics database, and the CSMAR database; Yun et al. (2023) [10], measure the efficiency of China’s rural energy carbon emissions in terms of the two dimensions of agricultural production and rural residents’ living consumption based on data from the China Energy Statistical Yearbook. There are also studies that measure rural carbon emissions by combining energy statistical yearbooks with field surveys, but in general, carbon emissions based on end-use energy consumption are measured for the whole of China, a certain province or region, and other large scales.
In general, the data sources of the existing studies mainly include the China Energy Statistical Yearbook and the China Rural Statistical Yearbook, as well as global CO2 emission databases established by relevant research institutes, such as the CO2 spatial grid data provided by the ODIAC open source database, the database of the World Bank (WB), the International Energy Agency (IEA), the Emissions Database for Global Atmospheric Research of the Netherlands Environmental Assessment Agency (PBL), the Global Carbon Budget (GCB), and the Carbon Dioxide Information Analysis Centre (CDIAC) of the Oak Ridge National Laboratory in the United States. There are also some CO2 databases for China, such as the China Greenhouse Gas Emission Coefficient Library for Product Life Cycle, China Emission Accounts and Datasets (CEADS), China Carbon Accounting Database (CCAD), Accounts and Datasets (CEADs), and Multi-Resolution Emission Inventory for China (MEIC).
It is undeniable that some scholars have also proposed to assess carbon emissions based on night-time lighting data, but the scope of application is large-area and urban-scale in China [11,12]. When we consider the low-carbon construction level or low-carbon land use situation of a specific township or rural community, both calculation methods cannot directly reflect the carbon emission intensity of different land uses in rural areas, and it is impossible to make a horizontal comparison of the carbon emission intensity and carbon emission level of construction land in rural areas. The result cannot directly guide the control and management of carbon emissions from building land in village planning. Therefore, it is necessary to evaluate the carbon emissions of different land uses based on “bottom-up” basic data research. For example, Hao et al., 2017, obtained the energy consumption intensity of a specific region of the countryside by means of field energy surveys, such as the measurement of carbon emissions from rural transport based on the statistics of vehicle traffic in a certain region during a certain period of time. It must be acknowledged that the instantaneous carbon emission model based on the bottom-up survey method can obtain an accurate emission inventory and emission intensity.
A review of relevant studies shows that foreign researchers mainly focus on the impact of land use change on climate, such as the effect of changes in surface vegetation on carbon storage [13]. And land use carbon emissions in China are mostly considered from the perspective of macro land management, focusing on the measurement of land use carbon emissions and influencing factors, and other research on the pre-action mechanism [14,15,16,17,18]; For example, carbon emissions from different land use types [19,20], effects of land use structure change on ecosystem carbon storage [21], carbon emission effects of different land use patterns [22,23], land use efficiency under carbon emission constraints [24]; Some scholars have also conducted research from the perspective of low-carbon land use management, studying the impact of adjusting urban land use structure on carbon emissions and proposing strategies for low-carbon urban land use management [25]. We can find that most of the existing studies on land use carbon emissions are focused on urban areas, and few studies are focused on rural areas.
The research currently available that addresses low-carbon land use has mainly focused on the “low-carbon planning” perspective, and it is about “carbon emissions from agricultural land use” [26], “rural low-carbon economy and development model research” [27,28], and “low-carbon development model research” [29]. For example, some scholars estimated the land use change and resulting CO2 emissions associated with sugarcane cultivation in Brazil [30]. Other scholars have also studied the link between carbon emissions and the sustainability of mixed-use communities, showing that, contrary to conventional wisdom, communities with higher carbon emissions are more sustainable [31]. Some scholars have actively explored ways to link the greenhouse gas inventory system and land use planning. A team of researchers from Zhejiang University in China, using rural communities in Zhejiang Province as an example, carried out a rural carbon emissions measurement based on energy consumption, studied the relationship between different levels of space and carbon emissions, and proposed low-carbon building strategies for rural communities [32,33]. The evaluation of low-carbon planning provides references for the study of carbon assessment systems in rural areas. However, the carbon emission source of rural areas and the carbon emission intensity of land use are different from those of urban areas, and the carbon emission coefficient of land use in urban areas cannot be applied to rural areas, and the carbon emission intensity of rural areas with different levels of development is not the same. The real and effective carbon intensity data of land use can effectively guide rural land use planning.
Under the current national spatial planning system in China, the detailed planning of rural areas (in 2019, the State Council issued several opinions on establishing a territorial spatial planning system and supervising its implementation, positioning village planning as the detailed planning of rural areas) has made implementation arrangements for the use and development intensity of specific land parcels. The Annual Development Research Report on Building Energy Efficiency in China 2020, published by the Building Energy Efficiency Research Centre of Tsinghua University, shows that the average rural household energy consumption in Hunan among the southern regions is at the forefront, with a high proportion of rural commodity energy consumption in Hunan exceeding 70 percent. The central region is an important base for China’s rural reform and development, and its rural development and construction model is bound to have an important impact on the sustainable development of China’s urban and rural habitat construction. Considering the decisive role of land use carbon emission intensity on total rural carbon emissions. This study attempts to construct a bottom-up transient model based on land use carbon emission intensity to measure rural carbon emissions. On the one hand, it makes up for the inadequacy of the current small-scale methods for measuring carbon emissions in rural communities, and on the other hand, it serves the low-carbon assessment and control of the detailed planning of rural land space. We chose to investigate the real energy carbon emission intensity of different construction sites in rural areas and construct a rural land use carbon emission assessment model. An empirical study was carried out using a town in Hunan Province. The study proves that the land use carbon emission assessment model can complete the evaluation of carbon emissions from land use in rural areas and provide a management tool for the government on low-carbon land use. The main purpose of this study was to construct a rural carbon emission assessment tool based on land use, to serve the work of rural land use carbon emission assessment, and to propose a low-carbon land use control strategy to provide reference for the construction of low-carbon villages.
2. Methods
2.1. Research Path
The preparation of a “site-based” carbon inventory is essential for the development of a low-carbon city plan, and therefore the preparation of a carbon inventory is the first step in the assessment of carbon emissions [34]. Firstly, the relationship between land use and rural carbon emission sources should be clarified. Secondly, according to the land use planning and control indicators of land use planning in the national spatial planning, what the spatial planning and control contents that affect the total amount of carbon emissions and the intensity of carbon emissions in current national spatial planning should be sorted out. Finally, the carbon emission assessment index system based on the carbon intensity of different land use types should be established at the detailed planning level. The method is innovative in that: (1) it is a carbon emission measurement method based on instantaneous carbon emission intensity from field surveys, and the results are closer to reality, which is applicable to the carbon emission measurement of a specific rural community at a small scale; (2) it is a carbon emission efficiency measurement for land use planning in rural areas, which can guide the adjustment of the detailed spatial planning of national territory according to the results of the measurement, and the carbon emission measurement here is not only a number but also has practical guidance; (3) The bottom-up calculation of carbon intensity for different site types can be applied anywhere and is a methodology for calculating carbon emissions that can be replicated and used universally.
- (1)
- Rural carbon inventory
Some scholars have analysed the influencing factors of carbon emissions in rural habitat environments in Hunan [35]. The preliminary inventory of rural carbon emissions within the spatial system of human settlements corresponding to different types of land was determined, as shown in Table 1 below.

Table 1.
Inventory of carbon emission accounting for rural habitats in Hunan Province.
- (2)
- Low-carbon control content of sites based on detailed planning
Focusing on the overall goal of carbon emission control based on detailed planning, and referring to the existing low-carbon research [36,37,38,39] on the content of village spatial planning, it can be clarified that the control content at the level of detailed planning includes four types of land use elements: land use scale, land use pattern, land use structure, and land use layout. The relationship between the different land use elements and carbon emissions is shown in Figure 1 below.
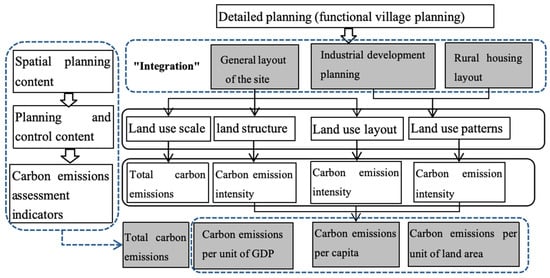
Figure 1.
Relationship between land use elements and carbon emissions.
- (3)
- Data sources
The carbon intensity of different land use types was calculated based on a study of energy consumption in different locations in 20 case villages in Hunan Province. Carbon emission intensity is calculated using the factor coefficient method through energy consumption and the corresponding carbon emission factor. The carbon emission intensity calculation formula is as follows:
denotes the carbon emission intensity of a site; denotes the amount of energy used per unit of site area, where the subscript denotes different site types, such as agricultural land, residential land, manufacturing land, transport land, etc., and the denotes different energy categories; and denote the standard coal conversion factor for fossil energy sources and the carbon emission factor for different energy sources, respectively. The carbon emission coefficients of each carbon source/sink are mainly determined by referring to the IPCC and the results of existing literature at home and abroad, among which the carbon emission coefficients of electric power, charcoal, and firewood are referred to in the Guidelines for the Preparation of Provincial Greenhouse Gas Inventories (2011), as shown in Table 2 below.
Table 2.
Standard coal conversion factors and carbon emission factors for different energy sources (IPCC).
2.2. Land Use Modelling for Carbon Emissions Assessment
- (1)
- Establishing the indicator system
According to the principle of “quantifiable, evaluable and controllable”, 13 major carbon emission evaluation indexes for land use at the detailed planning level, such as total annual carbon emissions, carbon emissions per unit of GDP, carbon emissions per capita, and carbon emissions per unit of land used for construction, were finally determined to establish a carbon emission assessment modelling that is consistent with the management of the village planning, as shown in Table 3 below.
Table 3.
Carbon emission assessment modelling for rural areas.
- (2)
- Carbon emission indicators and measurement methods for land use
A1 Total Carbon Emissions: Using the same assessment model and calculation method, the total amount of carbon emissions is comparable and is the main indicator for building a low-carbon rural community.
Among them, is the total carbon emission from rural land, is the total carbon emission from built-up land, is the total carbon emission from agricultural land, and is the total carbon sink from ecological land.
① Carbon emission from built-up land: is the sum of carbon emission from all built-up land, all types of built-up land according to the function of the land and the major energy consumption categories multiplied by the carbon emission coefficients of different energy sources to obtain the corresponding carbon emission intensity, and the area of the land is the amount of carbon emission prediction for the application of land types. The calculation method is as follows:
Carbon emissions from all types of built-up land are calculated using a full life cycle approach, including 3 parts: indirect carbon emissions from construction materials, carbon emissions from the construction process, and carbon emissions from the operational phase of project construction, using the following formula:
is the amount of different materials used, is the indirect carbon emission intensity of the corresponding materials; is the energy consumed in the transport phase of the materials, and is the carbon emission generated by the transport; is the energy consumed in the construction phase, and is the carbon emission intensity of the corresponding energy; is the energy consumed in the operation phase, and is the carbon emission intensity of the corresponding energy. The above data have been obtained by surveying the energy consumption of typical dwellings in the countryside, and the items to be investigated are mainly the type of energy use, the amount of energy used, the amount of energy used, the amount of energy used, and the amount of energy used.
② Carbon emissions from agricultural land are the sum of carbon emissions from agricultural land and carbon sequestration by land such as wooded grassland wetlands.
where , is the area of a particular type of agricultural land, and is the carbon emission intensity or carbon sink intensity of that type of land.
③ Carbon emissions from ecological areas are the sum of carbon sequestration from watersheds and other ecological land that act as carbon sinks.
where is the total amount of carbon sinks, is the area of ecological land, and is the carbon sink intensity of the corresponding ecological land.
B2 carbon emissions per unit of GDP and B3 per capita carbon emissions are used as indicators of overall carbon emission efficiency.
B4, B5, and B6 land use carbon intensity: the ratio of the total carbon emissions of different built-up areas to the total built-up area. These are the main indicators to evaluate and compare the carbon emission efficiency of rural built-up land horizontally. The carbon intensity of each type of built-up land was determined based on field research.
is the carbon emission efficiency of building land, is the carbon emission intensity of different types of construction land, is the carbon emission intensity of different types of construction land areas; includes 3 categories of built-up land, like residential land, public service land, and business land.
B7 carbon emissions per unit of agricultural land: an important indicator reflecting the level of carbon emissions from agricultural land and the effect of low-carbon agricultural construction.
Among them, is the carbon emission efficiency of agricultural land, is the carbon emission intensity of agricultural land, is the area of agricultural land, which is only counted in the two parts of arable land and garden land, and is the total area of agricultural land.
C8 carbon emission structure: This is the ratio of carbon emission intensity of various types of built-up land.
C9 carbon sink capacity of ecological land: The total carbon sink of ecological land, is an important indicator to measure the effect of carbon neutrality on rural ecological land. In this study, based on the agro-ecosystem in rural areas of China, the productive land needed to consume carbon emissions is transformed into four land types: forest, grassland, farmland, and watershed.
NEP reflects the carbon sequestration capacity of vegetation, i.e., the amount of carbon absorbed by 1 hectare of vegetation in 1 year [40]. NEP (net ecosystem productivity) is used to reflect the carbon sequestration capacity of different vegetation. The net ecosystem productivity (NEP) indicator was used to reflect the carbon sequestration capacity of different vegetation types, i.e., the amount of carbon absorbed by one hectare of vegetation in one year. The NEP of forests, grasslands, and waters was referred to in previous studies on China [41,42,43]. The NEP of forests, grasslands, waters, and other agricultural land is 0.6125 kg/m2.a, 0.0205 kg/m2.a, 0.0253 kg/m2.a, and 0.0005 kg/m2.a, respectively.
C10 carbon exchange rate: an indicator that responds to the capacity of ecological carbon sinks and which responds to the carbon footprint.
In the formula, is the total amount of carbon sinks over the study period, and is the total amount of carbon sources over the study period.
D11 intensity of carbon emissions within the plot: This is the carbon emissions per unit of residential floor area and the level of residential CO2 emissions.
where is the carbon emission per unit of floor area, is the annual energy consumption of the building, is the carbon emission factor for each type of energy, and is the total floor area of the building.
D12 The carbon emission intensity of public buildings: This indicator represents the carbon intensity of residential land plots, and calculated by the following formula:
D13 the carbon emissions per unit of transport land: This indicator represents the carbon emission intensity within the transport land parcel and was obtained from a survey of average household travel distances and modes of transport.
2.3. Determination of Carbon Emission Intensity: A Case Study of Rural Areas in Hunan Province
Hunan is located in the middle of China, and the central region is an important base for rural reform and development. Hunan’s rural low-carbon development model and carbon emission intensity measurement method are bound to have an important impact on the sustainable development of rural areas in the country. The “Hunan Province Land and Spatial Planning Land Use Classification (Trial)” methodology aligns the rural land use carbon emission assessment methodology with the township-level land and spatial planning land use classification methodology, specifically including the four sectoral carbon emission sources of buildings, transportation, industry, and agriculture. As villages in different geographical locations in China have different economic levels, the intensity of energy consumption for production and living of rural residents is different. The peri-urban type of villages, which are closer to cities, has significantly higher carbon emissions than other types of villages due to its better economic level, so in this paper, by studying rural areas in different parts of Hunan, the carbon emission intensity of the different types of land described below was determined.
2.3.1. Carbon Emission Intensity
The calculation of land use intensity involves guiding different types of land use. In this paper, the land use categories are divided into three categories: construction land, agricultural land, and ecological land, with reference to the land use categories of Hunan Province’s land use spatial planning. Construction land is divided into rural residential land, village public administration and public service facilities, village parks and green areas, village industrial logistics land, and village infrastructure land. Agricultural land is divided into arable land, garden land, forest land, grassland, and other land. Ecological land is divided into watersheds and other land. The carbon intensity data for the different land uses were obtained from a field survey of suburban villages in Hunan.
- (1)
- Carbon intensity of rural residential land use
The spatial forms of different types of case villages in Hunan are investigated, as shown in Table 4 below. The rural residential land in Hunan is mainly a kind of residential land, and the residential building types mainly include brick-concrete structure, frame structure, and wooden structure, of which the proportion of brick-concrete structure reaches 52.98% in Table 5 below. After investigation, the material usage data are obtained from the actual research and are estimated according to the sufficient amount of materials used during the construction process, without considering the manual errors during the construction; the area is based on 330.76 m2 as the standard. The carbon emission of brick-concrete residential buildings is about 157,477.14 kg in the construction phase, and about 4425.70 kg/a in the operation phase and with reference to the “Guidelines for the Preparation of Village Layout Plans for the Township Area of Hunan Province (2016) for the floor area, the carbon emission intensity in the operational phase is about 22.79 kg/m2. Among them, the carbon emissions in the operation phase of residential buildings are higher than those of ordinary farmers, at about 19,788.27 kg/a. And the carbon emission intensity is about 59.83 kg/m2, whereas the carbon intensity of buildings was calculated only for the operational phase.
Table 4.
Spatial patterns of different types of rural communities.
Table 5.
Main building types in Hunan.
- (2)
- Carbon intensity of transport land use
The main modes of transport for residents of peri-urban villages are cars and motorcycles, and the main source of carbon emissions from transport is petrol energy consumption. The intensity of transport energy consumption is related to the distance and frequency of travel. The average value of carbon emissions from average household transport trips in the surveyed tourist-type villages is 1891.40 kgCO2/a, and the average value of carbon emissions from average household transport trips in all case villages is 723.15 kgCO2/a.
- (3)
- Carbon intensity of land used for public administration and public service facilities in villages
The carbon emission intensity of the public service land is mainly investigated in the electricity consumption data of Changsha suburban rural schools, village, and township governments. Some typical cases are shown in Table 6 below. It can be found that public administration and public service facility land use has a larger carbon emission intensity in the operation phase of buildings and a smaller carbon emission from transport. Among them, education land and commercial land have the highest carbon emission intensity in the operation phase, which is 117.6749 kg and 120.9076 kg, respectively. Medical and healthcare land has a carbon emission intensity of 107.1558 kg, according to the survey data of township hospitals. Culture and sports land and tour reception land are often shared with the public activity centre of village collectives, with the same carbon emission intensity of 83.9568 kg. Management land is the office building of village committees, with a carbon emission intensity of about 95.3945 kg. The carbon intensity of land used for agricultural production services is 72.7765, according to the energy consumption survey of agricultural machinery service stations and irrigation stations. The carbon emission intensity of village infrastructure land is mainly the carbon emission of the construction process of infrastructure projects, and the carbon emission intensity of the construction of village road land and transport facility land both refer to the carbon emission intensity of the construction process of road transport (346.8 kg). The village utility land is referenced to the intensity of the agricultural and irrigation stations, again at 72.7765 kg.
Table 6.
Inventory of carbon intensity of public services locations in peri-urban villages.
- (4)
- Carbon intensity of industrial land use
Industry is mainly a type of industrial land (mainly including automobile manufacturing, tea industry, and construction manufacturing). Through the field survey of industrial rural enterprises electricity consumption, rural industrial land carbon intensity according to the annual energy consumption carbon emissions are as specified in Table 7. It can be found that the carbon intensity of rural industrial land cannot be generalised in terms of the type of industry, and the maximum value can be up to 96.33 Kwh/m2, with reference to the existing studies as specified below. The carbon intensity of rural industrial land in the suburbs of Hunan is 96.33 Kwh/m2. The carbon intensity of traffic on industrial production sites is estimated to be 38 kg based on the energy consumption of corporate transport, and the carbon intensity of traffic on logistics and warehousing sites is estimated to be 124 kg based on a survey of vehicles travelling in and out of traffic.
Table 7.
Inventory of energy carbon intensity in industrial villages.
- (5)
- Carbon intensity of agriculture land use
Unlike the carbon emission intensity of construction land, which is obviously affected by the economic level, the carbon emission intensity of agricultural land in different regions of China is relatively close. Therefore, the carbon emission intensity of agricultural land is referred to in the existing research results. The main sources of carbon emissions from agricultural land are cropland and gardens, with carbon emission intensities of about 0.4595 kgCO2/m2 and 0.007 kgCO2/m2, respectively. The carbon sink intensity of ecological land was calculated by referring to relevant literature [41,44].
Finally, according to the above survey and statistics on the carbon emission intensity of different land use types in the suburban villages of Hunan Province, the energy intensity of different sites in rural peri-urban Hunan was finally determined based on the average value of their carbon intensity, as shown in Table 8 below.
Table 8.
Carbon intensity of different types of land use in peri-urban rural areas of Hunan Province.
2.3.2. The Standard Value of the Indicator
It is assumed that rural construction can realise a controlled and orderly low-carbon emission scenario, change the rough development pattern, and control the scale of land development. Referring to the existing low-carbon development reports and planning documents, the reference value of each indicator under the low-carbon scenario is determined by the reference assessment standard of the relevant indicators, as shown in Table 9. Among them, As the aim of the evaluation model is to achieve a side-by-side comparison of the carbon intensity of sites in different villages, A1 total carbon emissions from land use, C8 carbon emission ratio of different types of construction land, and C9 total carbon sinks do not have the significance of horizontal comparison. So the three indicators A1 C8, C9 are not involved in weight assignment. B5 carbon emissions per unit of residential land and D11 carbon emissions per unit of public floor area have the same significance and are both measurements of the carbon intensity of residential buildings, and B6 carbon emissions per unit of land for public service facilities have the same significance as D12 carbon emissions per unit of public building area. All are carbon intensity measurements for public service buildings. So B5, B6 do not participate in the scoring. According to relevant research [45], the main sources of carbon emissions in rural China are agricultural production and residential life, but with the continuous development of green and energy-saving agricultural production methods, the contribution of agricultural production to carbon emissions in rural areas has been decreasing. Therefore, carbon emissions from residential energy consumption have gradually become the main source of carbon emissions in rural areas, and the energy consumption of operational construction land is even higher. Some studies [46] have also shown that carbon emissions from China’s urban industrial sector are gradually shifting to rural areas, leading to a rapid growth in rural CO2 emissions. Commercial and industrial land are both operational building land, and both are major sources of carbon emissions in rural areas. The carbon emission intensity of operational construction land is relatively high, and it is also the main source of carbon emissions in rural areas, so the weight is set at 20 points; Since the evaluation indicator focuses more on the horizontal comparison of the carbon emission intensity of different rural lands, the carbon exchange rate is more reflective of the carbon sink efficiency of the countryside than the total carbon sink. The intensity of carbon sinks in rural areas is different from that in urban areas, and the amount of carbon sinks accounts for a larger proportion [47], so the weight of the carbon exchange rate is set at 20 points, and the weight of other indicators is set at 10 points.
Table 9.
Indicators and criteria for assessing carbon emissions from rural land use.
The evaluation system is based on a percentage system, and the standard values of each low-carbon indicator in the table are determined and evaluated as follows:
① Total carbon emissions with reference to the National Development and Reform Commission’s 2015 Guidelines for the Pilot Construction of Low-Carbon Communities and the Five-Year Action Plan for the Implementation of Low-Carbon Development in Hunan Province (2016–2020), according to the level of per capita carbon emissions with the population of Hunan’s rural areas, the total amount of carbon emissions in 2018 will be 10,286,800 tonnes, and it should decrease to 87,066,500 tonnes in 2020, according to the year-on-year decrease calculated as 8%, according to the share of total carbon emissions with Hunan Province scoring, the larger the share, the lower the score;
② Overall carbon emission efficiency: carbon emissions per unit of GDP with reference to the Changsha City Low Carbon Development Indicator System (2015–2025) 2020 planning for 0.297 million tonnes/million yuan, the larger the value the lower the score; per capita carbon emissions with reference to the “Beijing Low Carbon Community Evaluation Indicator System” rural per capita carbon emissions baseline value of 2.14 tonnes/person, the larger the value the lower the score;
③ Carbon emission efficiency of construction land: The average value of carbon emission efficiency of construction land in 30 provinces and cities in China in 2020 is calculated to be 136.71 kg/m2, of which 111.15 kg/m2 in Hunan Province. According to the total energy consumption requirement of the “13th Five-Year Plan for Energy Conservation and Emission Reduction of Hunan Province”, the total amount of energy consumption will be controlled within 178.49 million tonnes of standard coal (the carbon emission coefficient of standard coal will be 0.68) in 2023, and with reference to the data on urban and rural construction land use in Hunan Province,1 estimates that the carbon emission efficiency of the construction land use in rural areas will be 101.23 kg/m2;
④ Carbon emissions per unit of agricultural land: according to Liu Shuai’s “Research on the content and path of new rural construction in Qingdao based on low carbon economy”, the baseline value of carbon emissions per unit of agricultural land is 0.05 tonnes/ha; the larger the value, the lower the score;
⑤ Total ecological carbon sinks: the total indicator is area related, not comparable between regions, and is only used to compare different time periods in the same region; the default value may refer to the carbon sinks in the base year;
⑥ Carbon exchange rate: if the carbon exchange rate is 1, it means that the total amount of carbon sinks is equal to the carbon emissions, and the carbon emissions can be fully absorbed; the smaller the carbon exchange rate is, the lower the carbon sink capacity of the ecological land area and the lower the score;
⑦ Carbon emissions per unit of residential floor area: refer to the China Building Energy Consumption Research Report (2020), the carbon emissions intensity per unit of residential floor area in rural areas in China is taken as 21 kgCO2/m2; the larger the value, the lower the score;
⑧ Carbon emissions per unit of public building area: Referring to the China Building Energy Consumption Research Report (2020), the energy consumption per unit area of rural public buildings in China is 26 kgCO2/m2.
⑨ Transport carbon emissions per capita: According to the report, which analyses green travel and its carbon emissions in Chinese cities, the carbon emissions from transport per capita of urban residents in China are 0.26 tonnes/year.
3. Results–Evaluation Results of Land Use Carbon Emission in Jinlong Town
Jinlong Town is located in Hunan Province, adjacent to Changsha, as shown in Figure 2 below. It is a model area for the integrated development of urban-rural areas in Hunan Province, with a rural population of 10,000 people and 1.4 square kilometres of building land. The township has built a modern agricultural demonstration site and an idyllic complex demonstration site, so Jinlong Township can be used as a typical case of rural areas on the outskirts of the city.
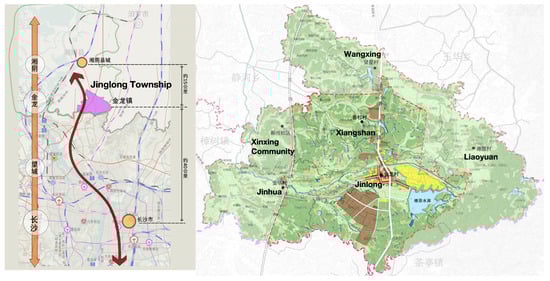
Figure 2.
Map of Jinglong Township.
Based on the above model, the assessment of carbon emissions from land use in Jinlong Town was carried out, and the results are as follows:
- (1)
- Total annual carbon emissions
The total annual carbon emissions of Jinlong Town are 2,812,500 tonnes, of which 2,565,283.41 tonnes are in the township (106,174.33 tonnes in Xinxing Community), 10,520,202.41 tonnes are in Jinhua Village, 74,409.69 tonnes are in Xiangshan Village, 40,812.62 tonnes are in Liaoyuan Village, and 26,818.32 t are in Wangxing Village. It can be seen that the total amount of carbon emissions in the rural area has a close relationship with the land use development model. It can be seen that the total carbon emission of rural areas is closely related to the development mode of land use, and the carbon emission of industrial type (township) is higher, the integrated type (emerging community) ranks second, the tourism type of rural areas (Jinhua and Liaoyuan) follows, and the carbon emission of agricultural type (Wangxing and Xiangshan) is relatively the lowest. The total amount of carbon emissions from each land use type is shown in Figure 3 below, and the proportion of carbon emissions from each land use type is shown in Figure 4, in which industrial land use has the highest carbon emissions among construction land uses, followed by infrastructure land use and residential buildings. Based on the GIS classification of the total carbon emissions and the comparison with the planning map, it is found that the corresponding areas in the high carbon emission zone are industrial land, educational land, and second-class residential land, as shown in Figure 5 below.
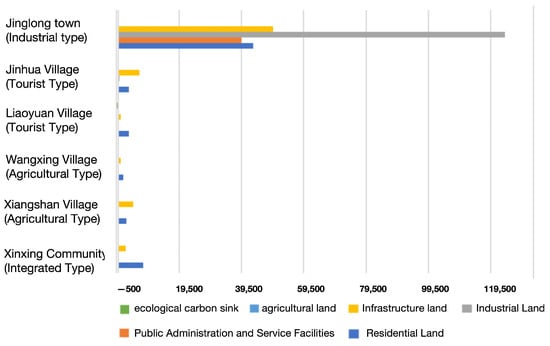
Figure 3.
Total carbon emissions by land use.
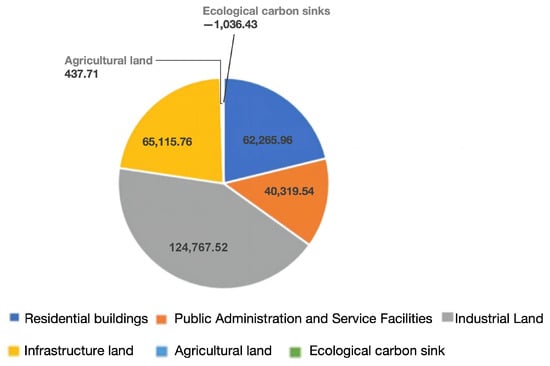
Figure 4.
Share of carbon emissions by land use.
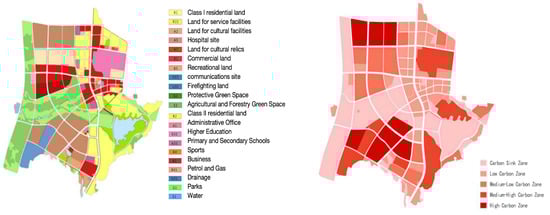
Figure 5.
Comparison of land use planning maps and carbon hierarchy maps. Photo credit: author’s own drawing.
- (2)
- Carbon emission efficiency
Jinlong Township had a GDP of 33.183 billion yuan in 2018 and a population of 161,000 people. The total carbon emission of the township was calculated to be 2.8125 million tonnes, the carbon emission per unit of GDP was 0.8476 million tonnes per million yuan, and the per capita carbon emission was 17.48 tonnes per person, all of which are much higher than the standard value of carbon emission efficiency in Hunan Province. Among them, the per capita carbon emission in townships is 16.98 tonnes/person, and the per capita carbon emission in formed villages is 21.16 tonnes/person. It can be seen that the per capita carbon emission in formed villages is larger than that in townships, and it also verifies that the rural energy utilisation rate is lower than that in townships.
- (3)
- Carbon intensity of land use
The annual carbon emissions from the built-up land and agricultural land of each village unit can be compared horizontally with the low-carbon land use, as shown in Table 10 below. From which it can be seen that Jinlong Town, as an industrial-type community, has the highest carbon emission efficiency of the built-up land. Xiangshan Village, as an agricultural-type rural area, has a high carbon emission intensity of the built-up land, and it can be seen through the review of the data that the carbon emissions mainly come from the land of the infrastructure, especially the construction of the road, which shows that the high efficiency of the rural infrastructure planning and construction of low-carbon is also an important part of rural It can be seen that the efficient and low-carbon planning and construction of rural infrastructure is also an important part of low-carbon development in rural areas.
Table 10.
Carbon emission efficiency of land use of units in villages.
From the calculation results of agricultural carbon emission efficiency, it can be seen that the carbon emissions per unit of agricultural land in Jinlong Township are all below the standard value of 0.05, the average value is 0.0192 tCO2/ha, and the low-carbon effect of agricultural land is better.
- (4)
- Annual carbon emissions per unit of floor area
The research found that the annual carbon emission per unit area of rural residential buildings in Jinlong Town was 22.7168 kg in the operation stage and 25.6674 kg in public buildings.
- (5)
- Total ecological carbon sinks and carbon exchange rates
The total carbon sink of Jinlong Town was calculated to be 10,364.05 tonnes, with a carbon exchange rate of 23.85%, indicating that carbon emissions are 23.85 times the amount of carbon sinks and that not only carbon emissions should be reduced but also carbon sinks should be increased at the same time in low-carbon construction.
Through this scoring of indicator values, the final result of the land use carbon emission assessment of Jinlong Town is shown in Table 11, with a total score of 60.8, of which B3 per capita carbon emission and C10 carbon exchange rate scores are low.
Table 11.
Carbon Emission Evaluation Results of the Jinlong Town Site Plan.
4. Discussion
Combined with the results of the evaluation of carbon emissions from several cases of rural land in Jinlong Township, the findings of this section of the paper are discussed in relation to previous research by scholars in this direction.
4.1. Land Use Pattern Selection
From the overall evaluation results, Jinlong Town has the highest proportion of land use pattern indicator scores, and the carbon emission efficiency scores per unit of built-up land and agricultural land are at a good level, but the scores of carbon emissions per unit of GDP and per capita are low, which indicates that the overall carbon emissions of Jinlong Town still have a great potential for emission reduction. The calculation results of the total carbon emission in Figure 3 show that the carbon emission intensity of agricultural-type and tourism-type rural areas is smaller than that of industrial-type communities, and the carbon emission per unit area of the industrial-type Jinlong community is 6–30 times higher than that of other agricultural-type and tourism-type communities, so that modern agriculture and ecotourism should become the main development modes of the rural areas. However, it is important to emphasise that adaptive co-management planning that pays attention to residents’ diverse and changing place meanings is essential [48]. Lu Zhang et al. [49] found that there is a unidirectional causal relationship between rural energy consumption, rural carbon emissions, and rural economic growth and that higher economic growth driven by industry is associated with higher carbon emissions. Zhu et al.’s study of rural Zhejiang Province also found that the sustainability of villages varied by industry type, with tourism communities having the lowest overall sustainability, while manufacturing and trading communities had higher levels of sustainability but were also associated with higher carbon emissions [31]. This is consistent with this paper’s finding that industrial-type land use patterns produce higher carbon emissions. Therefore, in the process of upgrading rural industries, it is still worth exploring how to consider the relationship between economic and ecological benefits in an all-round way and how to develop green industries to achieve farmers’ income while reducing carbon emissions and improving the ecological environment.
4.2. Land Use Restructuring
From the overall evaluation results, the carbon emission efficiency of built-up land in Jinlong Town is higher than the standard value of the indicator by about 33%, while the carbon emission efficiency of agricultural land is comparable to the standard value, the ecological carbon sink index is low, and the carbon sink efficiency of ecological land is low. From the results of carbon emissions from different types of land in each community, Jinhua Village is positioned as a tourist-type rural village, but its carbon emissions from industrial land account for 3.25% of the total carbon emissions. Compared with the same type of rural areas, its industrial land is on the high side, and it should appropriately reduce the area of industrial land and increase the area of special agriculture or landscape green space planting. Increasing the area of green space is undoubtedly an effective way to absorb and neutralise carbon emissions from land use [50,51]. Jinlong Town, as an industrial rural development, should increase the area of ecological land to mitigate carbon emissions, increase the proportion of public green space and subsidiary green space, grass area, and also increase the area of green roofs. The carbon emissions of Wangxing Village, Xiangshan Village, and Xinxing Township are mainly from residential buildings, so while ensuring the red line of ecological land, the uncontrolled expansion of residential land should be controlled, and green building technology should be used to reduce carbon emissions from residential buildings. Studies have already shown that the more stringent the constraints on land use, the lower the level of carbon emissions by residents [52,53]. At the same time, the effects of low-carbon planning techniques and clean energy technologies on rural carbon reduction have been verified, such as encouraging the construction of townhouses and multi-storey windbreaks and the development of energy sources adapted to the characteristics of the local climate, such as solar energy, biogas, and wind energy [54].
Rural industrial land is the core area of carbon emissions, which are significantly higher than other areas and should be the key object of attention in rural low-carbon construction. On the one hand, it encourages enterprises to carry out spontaneous low-carbon transformation through policy promotion and a carbon emission restriction index so as to prevent the carbon emission value of localised land from growing too fast. Smart growth is an inevitable choice for sustainable growth of industrial-type villages in China with constraints on resources and the environment [55]. On the other hand, it increases the ecological land to balance the localised carbon emissions.
4.3. Low-Carbon Land Use Layout and Form
The layout of the construction land, including the combination of residential buildings, the location of public service facilities, and the location of industrial sites, are all closely related to the carbon intensity of the land area. As an agricultural village, Xiangsan Village has a high carbon emission intensity of infrastructure land. Therefore, the planning layout of infrastructure land should take into account the living environment, traffic distribution, and coordination of public facilities, while at the same time minimising the carbon emission intensity of the land area [11]. In addition, the relationship between the functional mix of land use [56], the spatial compactness of land use [57], and carbon emissions was confirmed for rural communities.
From the perspective of the overall carbon exchange rate and ecological carbon sink index of Jinlong Town, both are far less than the standard value. While controlling carbon emissions per unit of land area, ecological carbon sink efficiency is an indicator that needs to be focused on the construction and improvement of Jinlong Town. Rural landscape greening camping is a key element to achieve emission reduction and sink improvement. Low-carbon landscape planning can improve the landscape appearance while enhancing the soil carbon sink capacity [58]. During the research, it was also found that some rural communities in Jinlong Town have perfect infrastructure and a good village appearance, but the landscape greening area is relatively small, so the measures of creating multi-layered landscapes, constructing wetland landscapes in combination with watersheds, and selecting strong carbon sink tree species are the important contents of improving the quality of the human environment and low-carbon construction in rural communities in Jinlong Town.
According to the results of the land use carbon emission assessment of Jinlong Town, the directions that need to be adjusted in the future detailed planning of land space in Jinlong Town include: (1) determining the development mode of the countryside for the rural resource elements and avoiding the industrial-type land use mode; (2) controling the scale of industrial land use and the disorderly expansion of residential land use; and (3) considering the improvement of energy use efficiency through the reasonable layout of construction land use. For example, adjusting the layout of public service facilities and industrial land to reduce unnecessary carbon emissions from transport.
5. Conclusions
Low-carbon rural construction is an important way for sustainable rural development, and the construction of a rural land use carbon emission assessment model is conducive to the quantitative study of rural carbon emissions and optimisation of land use structure. This paper mainly focuses on mitigating the growth trend in rural land use carbon emissions, hoping to measure and assess the carbon emissions from rural land use, guide the planning at the level of rural detailed planning, and achieve the control of rural carbon emissions through the optimisation of land use structure and land use layout. Taking Hunan Province as an example, we have analysed the influencing factors of rural carbon emissions, identified the main sources of carbon emissions in rural areas, and finally established a rural land use carbon emission assessment model with 13 indicators to effectively assess and predict the impact of rural land use carbon emissions. Taking Jinlong Town as an example, the assessment found that: Firstly, rural carbon intensity measurements based on bottom-up energy intensity surveys are more accurate and feasible in rural areas but require more work and time. Secondly, the carbon emission intensity of rural areas near the city must be different from that of rural areas farther away from the city, and the model for carbon emission measurement can be universally applied, but the carbon emission intensity of different sites in different types of rural areas must be different. Finally, based on the results of the carbon emission measurement model in this study, it is possible to identify the specific types of land in the countryside with high carbon emission intensity, which can guide the detailed planning of different land in the countryside.
Land use carbon emission evaluation should be added to the process of rural planning and construction so as to have a comprehensive understanding of the current carbon sources, sinks, and total carbon emissions of the planning area and to include land use carbon emission control targets at the level of detailed territorial spatial planning so as to realise the carbon emission control targets through the adjustment of the land use structure and layout. Low-carbon land use planning must be based on the principle of “assess the carbon emission of land use-set low-carbon target-design the planning programme-manage the planning implementation”.
China’s rural construction has brought about significant changes in the economic level, village appearance, and ecological environment of rural areas, improved the rural habitat, and generally improved the quality of life. However, under the constraints of limited resources, environment, and space, China’s rural areas must follow the path of low-carbon environmental protection and a green economy. Different provinces have different levels and modes of rural development, and their carbon emission intensity values are not the same, but the assessment of carbon emissions in the process of rural construction should be generally paid attention to, and the method of carbon emission assessment of land use planning schemes should be deeply understood, so as to differentiate the construction of the carbon emission assessment model for rural land use and put forward targeted low-carbon land use optimisation strategies that are useful for guiding low-carbon construction in the countryside. It is of great significance to guide low-carbon construction in rural areas. It should be noted that this paper also has some shortcomings, such as Hunan Province as an example of research to estimate the carbon emission intensity of various types of land, but the research sample is not enough and will be deepened and improved in the later study.
Author Contributions
Conceptualization, L.S., J.C. and J.Y.; Methodology, L.S. and J.C.; Software, L.S. and J.Y.; Validation, J.Y.; Formal analysis, L.S. and J.C.; Investigation, L.S. and J.Y.; Resources, J.C. and J.Y.; Data curation, L.S., J.C. and J.Y.; Writing—original draft, L.S. and J.Y.; Writing—review & editing, L.S. and J.C.; Supervision, L.S. All authors have read and agreed to the published version of the manuscript.
Funding
This work was supported by “the Fundamental Research Funds for the Central Universities” (2024QN11085).
Data Availability Statement
The original contributions presented in the study are included in the article, further inquiries can be directed to the corresponding author.
Conflicts of Interest
The authors have no competing financial or nonfinancial interests to declare that are relevant to the content of this article.
Note
| 1 | Referring to the official data of the National Bureau of Statistics, Hunan Province has an area of 163,600 hectares of urban construction land and 167,0253 hectares of rural construction land in 2017. |
References
- Chen, X.W.; Jia, F.; Tao, Y.Q.; Wang, K. Study on low-carbon rural planning based on integrated land use patterns. Fresenius Environ. Bull. 2020, 29, 5106–5110. [Google Scholar]
- Chuai, X.; Huang, X.; Lu, Q.; Zhang, M.; Zhao, R.; Lu, J. Spatiotemporal changes of built-up land expansion and carbon emissions caused by the Chinese construction industry. Environ. Sci. Technol. 2015, 49, 13021–13030. [Google Scholar] [CrossRef] [PubMed]
- Wu, S.; Hu, S.G.; Frazier, A.E. Spatiotemporal variation and driving factors of carbon emissions in three industrial land spaces in China from 1997 to 2016. Technol. Forecast. Soc. Chang. 2021, 169, 120837. [Google Scholar] [CrossRef]
- Zhou, Y.; Chen, M.; Tang, Z.; Mei, Z. Urbanization, land use change, and carbon emissions: Quantitative assessments for city-level carbon emissions in Beijing-Tianjin-Hebei region. Sustain. Cities Soc. 2021, 66, 102701. [Google Scholar] [CrossRef]
- Shen, Y.; Ma, Z.; Zeng, Y. Research on urban and rural land use and management adapted to the development of new urbanisation—Taking Hunan Province as an example. Hunan Agric. Sci. 2015, 04, 125–128. [Google Scholar]
- Mao, X.; Lin, J.; Mong, J. Impact of construction land growth on carbon emissions in China. China Popul.-Resour. Environ. 2011, 21, 34–40. [Google Scholar]
- Zhang, L.; Chen, S.; Wang, W.; Xu, X.W. Measurement and trend prediction of carbon emission effect of construction land changes in Anhui Province in the past 15 years—Based on STIRPAT model. J. Environ. Sci. 2013, 33, 950–958. [Google Scholar]
- Gao, M.; Wang, M.; Cao, H.; Yan, Z.; Xu, J. The impact of urbanization on carbon emissions of rural households: A study based on micro-level measurement. In Clean Technologies and Environmental Policy; Springer: Berlin/Heidelberg, Germany, 2024. [Google Scholar]
- Hu, C.; Ma, X. Regional Differences, Dynamic Evolution and Convergence of Carbon Emissions from Rural Residents’ Living Consumption: Evidence from China. Energies 2023, 16, 5951. [Google Scholar] [CrossRef]
- Tian, Y.; Wang, R.; Yin, M.; Zhang, H. Study on the Measurement and Influencing Factors of Rural Energy Carbon Emission Efficiency in China: Evidence Using the Provincial Panel Data. Agriculture 2023, 13, 441. [Google Scholar] [CrossRef]
- Zhao, J.C.; Chen, Y.L.; Ji, G.X.; Wang, Z. Residential carbon dioxide emissions at the urban scale for county-level cities in China: A comparative study of nighttime light data. J. Clean. Prod. 2018, 180, 198–209. [Google Scholar] [CrossRef]
- Wei, W.; Zhang, X.; Cao, X.; Zhou, L.; Xie, B.; Zhou, J.; Li, C. Spatiotemporal dynamics of energy-related CO2 emissions in China based on nighttime imagery and land use data. Ecol. Indic. 2021, 131, 108132. [Google Scholar] [CrossRef]
- Liu, M.; Chen, Y.; Chen, K.; Chen, Y. Progress and Hotspots of Research on Land-Use Carbon Emissions: A Global Perspective. Sustainability 2023, 15, 7245. [Google Scholar] [CrossRef]
- Long, H. Land use policy in China: Introduction. Land Use Policy 2014, 40, 1–5. [Google Scholar] [CrossRef]
- Lin, Q.; Zhang, L.; Qiu, B.; Zhao, Y.; Wei, C. Spatiotemporal Analysis of Land Use Patterns on Carbon Emissions in China. Land 2021, 10, 141. [Google Scholar] [CrossRef]
- Zhao, C.; Liu, Y.; Yan, Z. Effects of land-use change on carbon emission and its driving factors in Shaanxi Province from 2000 to 2020. Environ. Sci. Pollut. Res. 2023, 30, 68313–68326. [Google Scholar] [CrossRef] [PubMed]
- Li, K.; Mao, D.; Jiang, Z.; Li, K. Decomposition of carbon emission factors and decoupling effect of land use in Changzhutan urban agglomeration. Ecol. Econ. 2019, 35, 28–34. [Google Scholar]
- Wu, H.; Deng, K.; Dong, Z.; Meng, X.; Zhang, L.; Jiang, S.; Yang, L.; Xu, Y. Comprehensive assessment of land use carbon emissions of a coal resource-based city, China. J. Clean. Prod. 2022, 379, 134706. [Google Scholar] [CrossRef]
- Peng, Y.; Zhou, C.; Jin, Q.; Ji, M.; Wang, F.; Lai, Q.; Shi, R.; Xu, X.; Chen, L.; Wang, G. Tidal variation and litter decomposition co-affect carbon emissions in estuarine wetlands. Total Environ. 2022, 839, 156357. [Google Scholar] [CrossRef]
- Guo, R.; Wu, X.; Wu, T.; Dai, C. Spatial–Temporal Pattern Characteristics and Impact Factors of Carbon Emissions in Production–Living–Ecological Spaces in Heilongjiang Province, China. Land 2023, 12, 1153. [Google Scholar] [CrossRef]
- Chuai, X.; Huang, X.; Qi, X.; Li, J.; Zuo, T.; Lu, Q.; Li, J.; Wu, C.; Zhao, R. A Preliminary Study of the Carbon Emissions Reduction Effects of Land Use Control. Sci. Rep. 2016, 6, 36901. [Google Scholar] [CrossRef]
- Wang, Y.; Fan, H.; Wang, H.; Che, Y.; Wang, J.; Liao, Y.; Lv, S. High-carbon expansion or low-carbon intensive and mixed land-use? Recent observations from megacities in developing countries: A case study of Shanghai, China. J. Environ. Manag. 2023, 348, 119294. [Google Scholar] [CrossRef] [PubMed]
- Yuan, Y.; Chuai, X.; Xiang, C.; Gao, R. Carbon emissions from land use in Jiangsu, China, and analysis of the regional interactions. Environ. Sci. Pollut. Res. 2022, 29, 44523–44539. [Google Scholar] [CrossRef] [PubMed]
- Wang, Y.; Chai, J.; Zhang, H.; Yang, B. Evaluating construction land use efficiency under carbon emission constraints: A comparative study of China the, USA. Environ. Sci. Pollut. Res. 2022, 29, 49998–50009. [Google Scholar] [CrossRef] [PubMed]
- Xia, C.; Zhang, J.; Zhao, J.; Xue, F.; Li, Q.; Fang, K.; Shang, Z.; Zhang, J.; Li, S.; Zhou, J. Exploring potential of urban land-use management on carbon emissions—A case of Hangzhou, China. Ecol. Indic. 2023, 146, 109902. [Google Scholar] [CrossRef]
- Zhao, X.C.; Song, L.M. Study on the relationship between carbon emissions from agricultural land use and agricultural economy in Hunan Province. J. Ecol. Rural. Environ. 2018, 34, 18–23. [Google Scholar]
- Guan, L.; Ding, H.; Zhang, Y. Rhyme path selection for new rural construction under the perspective of low carbon economy. Mod. Agric. Sci. Technol. 2011, 19, 396–397. [Google Scholar]
- Qing, D.; Yao, Y. Low carbon: New connotation of socialist new rural construction and development. Ecol. Econ. 2012, 12, 65–68. [Google Scholar]
- Wang, Z.; Xiang, Y.; Wu, Y. Consensus, Dilemma and Strategy-Exploration of Low-Carbon Rural Camping in Yangtze River Delta Region. New Archit. 2016, 4, 33–39. [Google Scholar]
- Guarenghi, M.M.; Garofalo, D.F.T.; Seabra, J.E.A.; Moreira, M.M.R.; Novaes, R.M.L.; Ramos, N.P.; Nogueira, S.F.; de Andrade, C.A. Land Use Change Net Removals Associated with Sugarcane in Brazil. Land 2023, 12, 584. [Google Scholar] [CrossRef]
- Zhu, X.; Zhang, Z.; Chen, X.; Jia, F.; Chai, Y. Nexus of mixed-use vitality, carbon emissions and sustainability of mixed-use rural communities: The case of Zhejiang. J. Clean. Prod. 2022, 330, 129766. [Google Scholar] [CrossRef]
- Luo, X. Research on Rural Low-Carbon Ecological Evaluation System Based on Carbon Emission Accounting; Zhejiang University: Hangzhou, China, 2017. [Google Scholar]
- Wu, Y.; Wang, Z.; Zhu, X.Q. Discussion on the research progress, connotation and camping path of low-carbon rural community. Cent. China Archit. 2016, 34, 06–10. [Google Scholar]
- Gu, C. Research on urban carbon emission inventory and its planning application. S. Archit. 2013, 04, 4–12. [Google Scholar]
- Song, L.M.; Xu, F. Study on carbon emission measurement and influencing factors of rural habitat under the background of rural revitalisation. West. Habitat J. 2021, 36, 36–45. [Google Scholar]
- Zhu, Z.Y.; Miao, J.J.; Cui, W. Carbon emission efficiency analysis of intensive use of urban construction land. Geogr. Res. Dev. 2016, 35, 98–103. [Google Scholar]
- Zhou, Y.; Zhao, W. Research on carbon emission accounting and low carbon optimisation of land use structure in Xi’an. Ecol. Econ. 2018, 34, 21–25. [Google Scholar]
- Zhang, M.; Gan, C.L.; Chen, Y.R.; Chen, L. Carbon emission efficiency analysis and low-carbon optimisation of construction land development intensity in Chinese cities. Resour. Sci. 2016, 38, 265–275. [Google Scholar]
- Chen, Z.Q.; Lin, X.B.; Li, L.L.; Li, G.C. Does urban spatial pattern affect carbon emission?—Analysis based on data from 110 prefecture-level cities across China. Ecol. Econ. 2016, 32, 22–26. [Google Scholar]
- He, J.N.; Kang, W.X. Estimation of carbon emissions from fossil fuels and industrial processes in Hunan Province. J. Cent. South Univ. For. Sci. Technol. 2008, 28, 52–58. [Google Scholar]
- Peng, W.F.; Zhou, J.M.; Xu, X.L.; Luo, H.L.; Zhao, J.F.; Yang, C.J. Spatial and temporal patterns of carbon emissions and carbon footprint effects in Sichuan Province based on land use change. J. Ecol. 2016, 36, 7244–7259. [Google Scholar]
- Zhao, R.Q.; Qin, M.Z. Spatial and temporal differences in carbon sources/sinks in some farmland ecosystems in coastal areas of China. J. Ecol. Rural Environ. 2007, 23, 11. [Google Scholar]
- Li, K.J. Land Use Change and Net Greenhouse Gas Emissions and Carbon Cycle in Terrestrial Ecosystems; Meteorological Press: Beijing, China, 2000; p. 260. [Google Scholar]
- Bian, X.F. Research on Carbon Emissions and Carbon Footprints of Different Land Use Modes—Taking 30 Provinces, Autonomous Regions and Municipalities Directly under the Central Government in China as an Example. Ph.D. Thesis, Northwest Normal University, Lanzhou, China, 2014. [Google Scholar]
- Zhang, H.; Li, S. Carbon emissions’ spatial-temporal heterogeneity and identification from rural energy consumption in China. J. Environ. Manag. 2022, 304, 114286. [Google Scholar] [CrossRef]
- Wang, Q.; Hang, Y.; Su, B.; Zhou, P. Contributions to sector-level carbon intensity change: An integrated decomposition analysis. Energy Econ. 2018, 70, 12–25. [Google Scholar] [CrossRef]
- Tang, X.F.; Hao, G.Z.; Wang, Y.H. Research on an equilibrium development model between urban and rural areas of Henan including carbon sink assets under the dual carbon goal. Front. Environ. Sci. 2023, 10, 1037286. [Google Scholar]
- Li, J.; Stoffelen, A.; Meijles, E.; Vanclay, F. Local peoples sense of place in heavily touristified protected areas: Contested place meanings around the Wulingyuan World Heritage Site, China. Landsc. Urban Plan. 2023, 237, 104792. [Google Scholar] [CrossRef]
- Zhang, L.; Pang, J.; Chen, X.; Lu, Z. Carbon emissions, energy consumption and economic growth: Evidence from the agricultural sector of China’s main grain-producing areas. Sci. Total Environ. 2019, 665, 1017–1025. [Google Scholar] [CrossRef] [PubMed]
- Guo, P.; Guo, K.; Ren, Y.; Shi, Y.; Chang, J.; Tani, A.; Ge, Y. Biogenic volatile organic compound emissions in relation to plant carbon fixation in a subtropical urban-rural complex. Landsc. Urban Plan. 2013, 119, 74–84. [Google Scholar] [CrossRef]
- Liu, X.; Li, T.; Zhang, S.; Jia, Y.; Li, Y.; Xu, X. The role of land use, construction and road on terrestrial carbon stocks in a newly urbanized area of western Chengdu, China. Landsc. Urban Plan. 2016, 147, 88–95. [Google Scholar] [CrossRef]
- Glaeser, E.L.; Kahn, M.E. The Greenness of Cities: Carbon Dioxide Emissions and Urban Development. Nber Work. Pap. 2010, 67, 404–418. [Google Scholar] [CrossRef]
- Ke, Y.; Yi, X. Path selection for low-carbon economic land use pattern in China. Energy Procedia 2011, 5, 452–456. [Google Scholar] [CrossRef][Green Version]
- Xu, D.M.; Zhao, T.Y.; Cheng, W. Study on Low-Carbon and Energy-Saving New Rural Countryside Construction in the Northeastof China. Adv. Mater. Res. 2011, 280, 179–182. [Google Scholar] [CrossRef]
- Wang, L.J.; Zhang, L.; Chen, X.Q.; Gao, X.; Huang, Q. Evaluation on the Efficiency of Smart Land Use under Rational Urbanization. In Proceedings of the International Conference on Agro-Geoinformatics, Tianjin, China, 18–20 July 2016; pp. 334–339. [Google Scholar]
- Zhu, X.; Zhang, T.; Gao, W.; Mei, D. Analysis on spatial pattern and driving factors of carbon emission in urban–rural fringe mixed-use communities: Cases study in east Asia. Sustainability 2020, 12, 3101. [Google Scholar] [CrossRef]
- Schubert, J.; Wolbring, T.; Gill, B. Settlement Structures and Carbon Emissions in Germany: The Effects of Social and Physical Concentration on Carbon Emissions in Rural and Urban Residential Areas. Env. Pol. Gov. 2013, 23, 13–29. [Google Scholar] [CrossRef]
- Song, L.; Xu, F.; Sheng, M.; Wen, B. The Relationship between Rural Spatial Form and Carbon Emission—A Case Study of Suburban Integrated Villages in Hunan Province, China. Land 2023, 12, 1585. [Google Scholar] [CrossRef]


Disclaimer/Publisher’s Note: The statements, opinions and data contained in all publications are solely those of the individual author(s) and contributor(s) and not of MDPI and/or the editor(s). MDPI and/or the editor(s) disclaim responsibility for any injury to people or property resulting from any ideas, methods, instructions or products referred to in the content. |
© 2024 by the authors. Licensee MDPI, Basel, Switzerland. This article is an open access article distributed under the terms and conditions of the Creative Commons Attribution (CC BY) license (https://creativecommons.org/licenses/by/4.0/).