


Integrating Future Multi-Scenarios to Evaluate the Effectiveness of Ecological Restoration: A Case Study of the Yellow River Basin

Abstract

1. Introduction
2. Materials and Methods
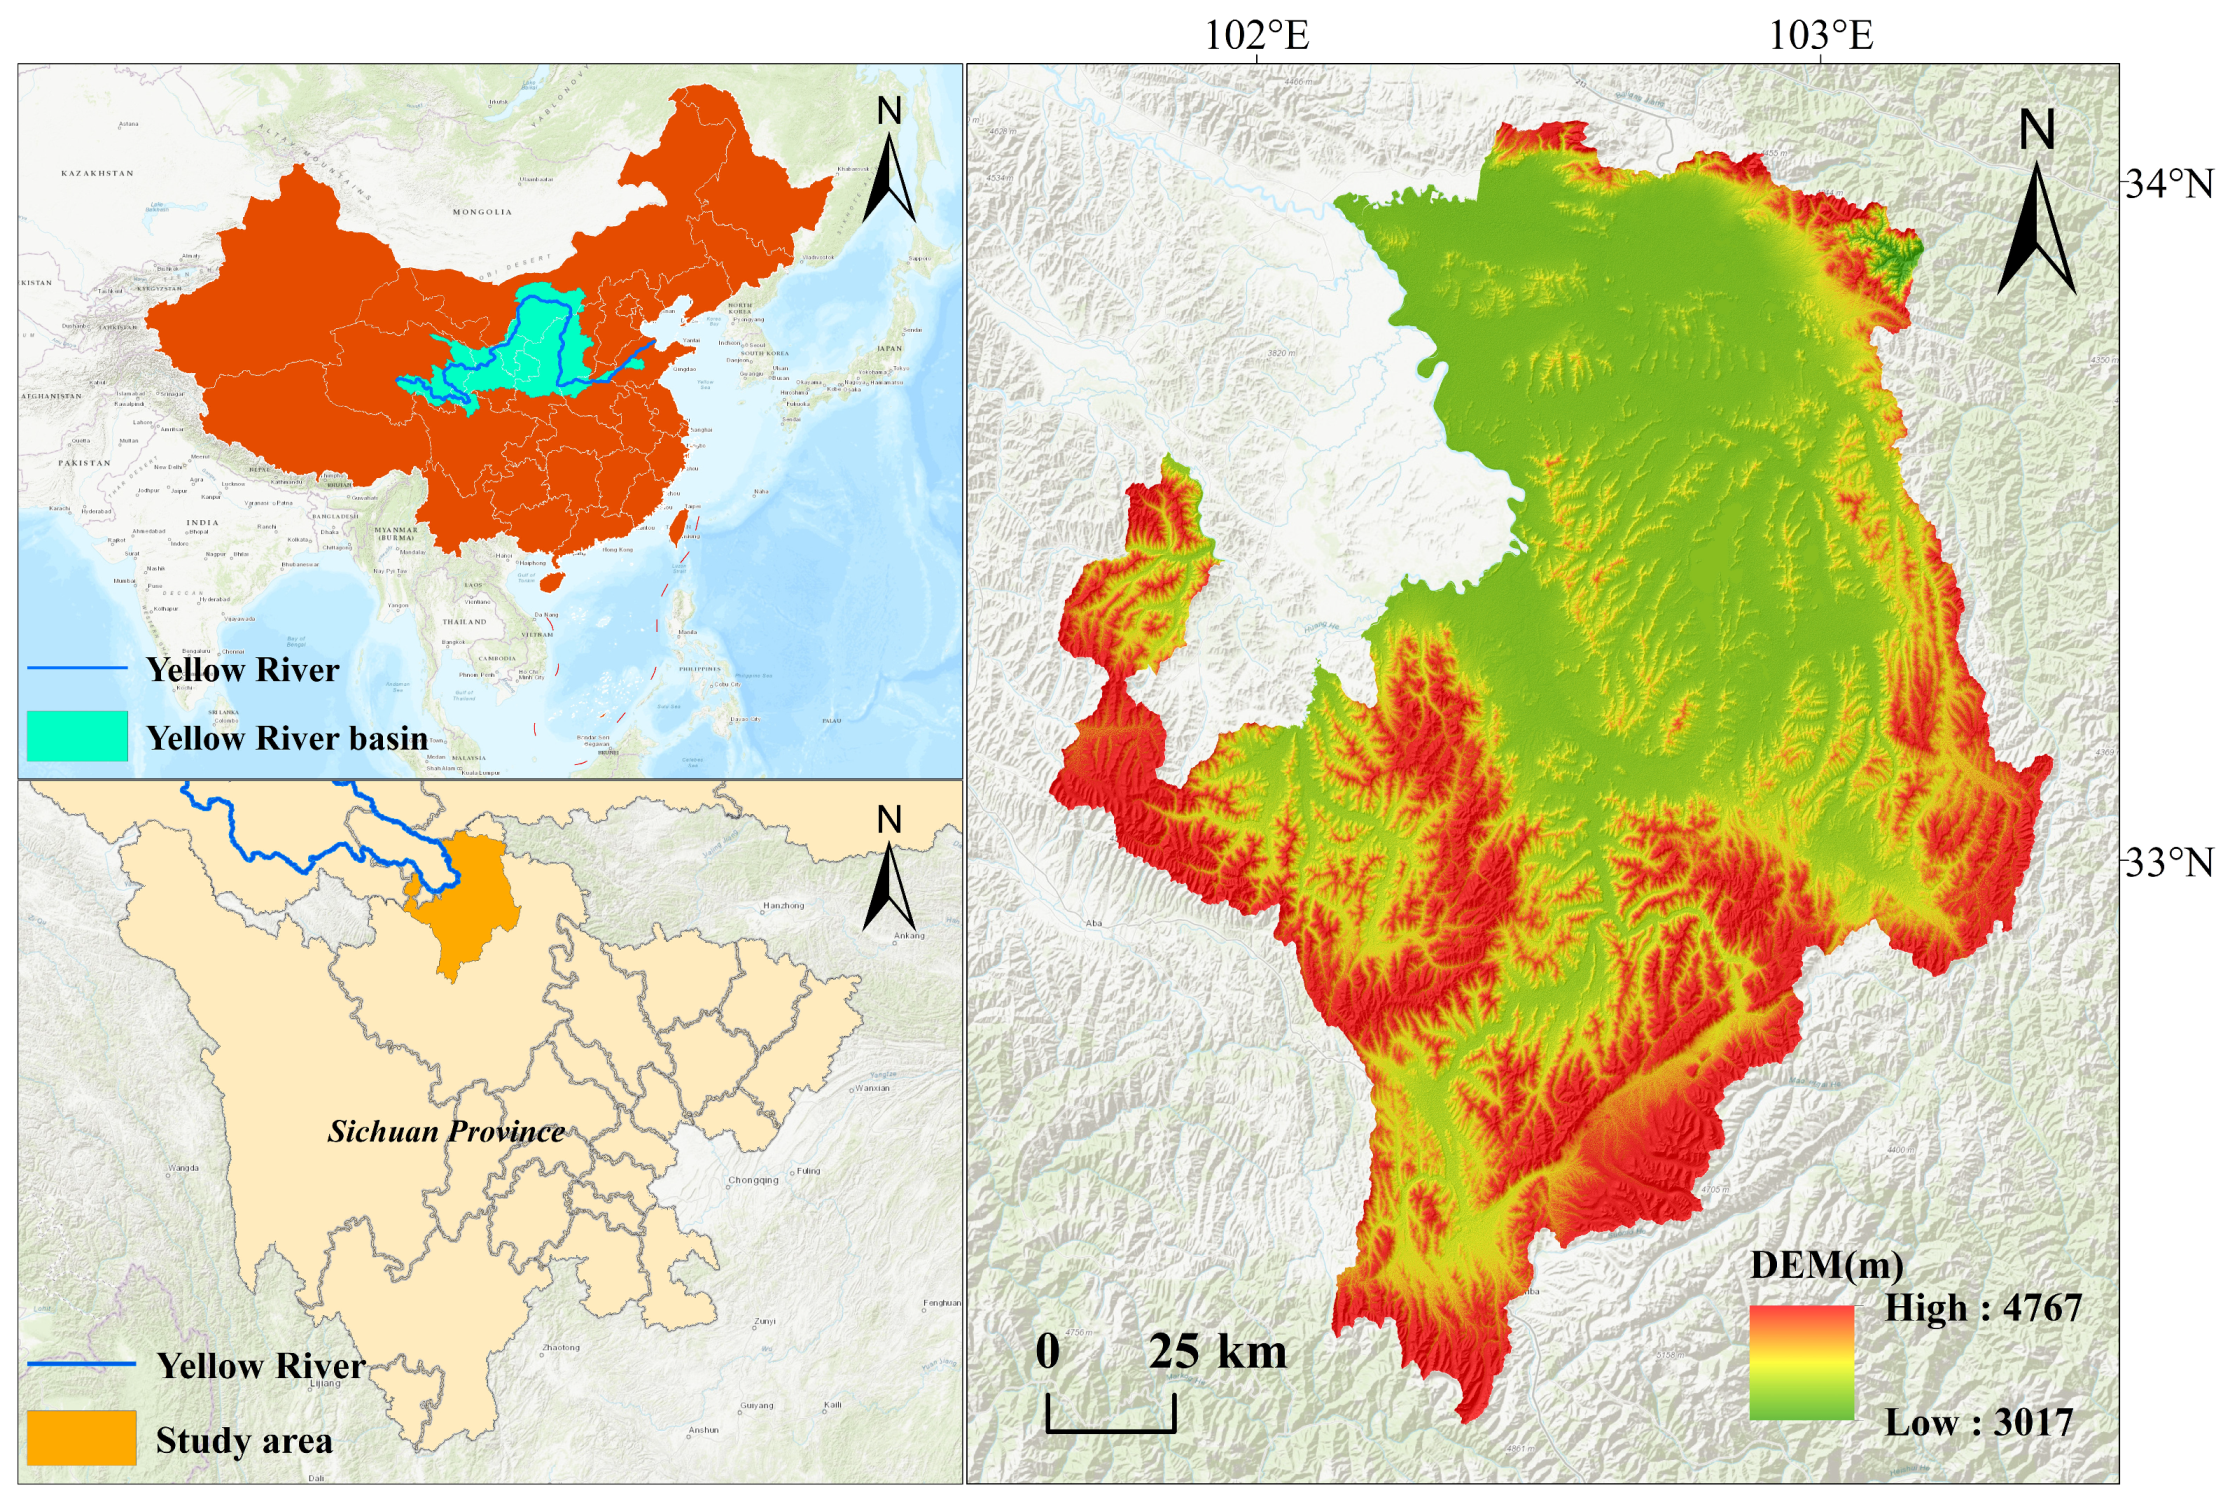
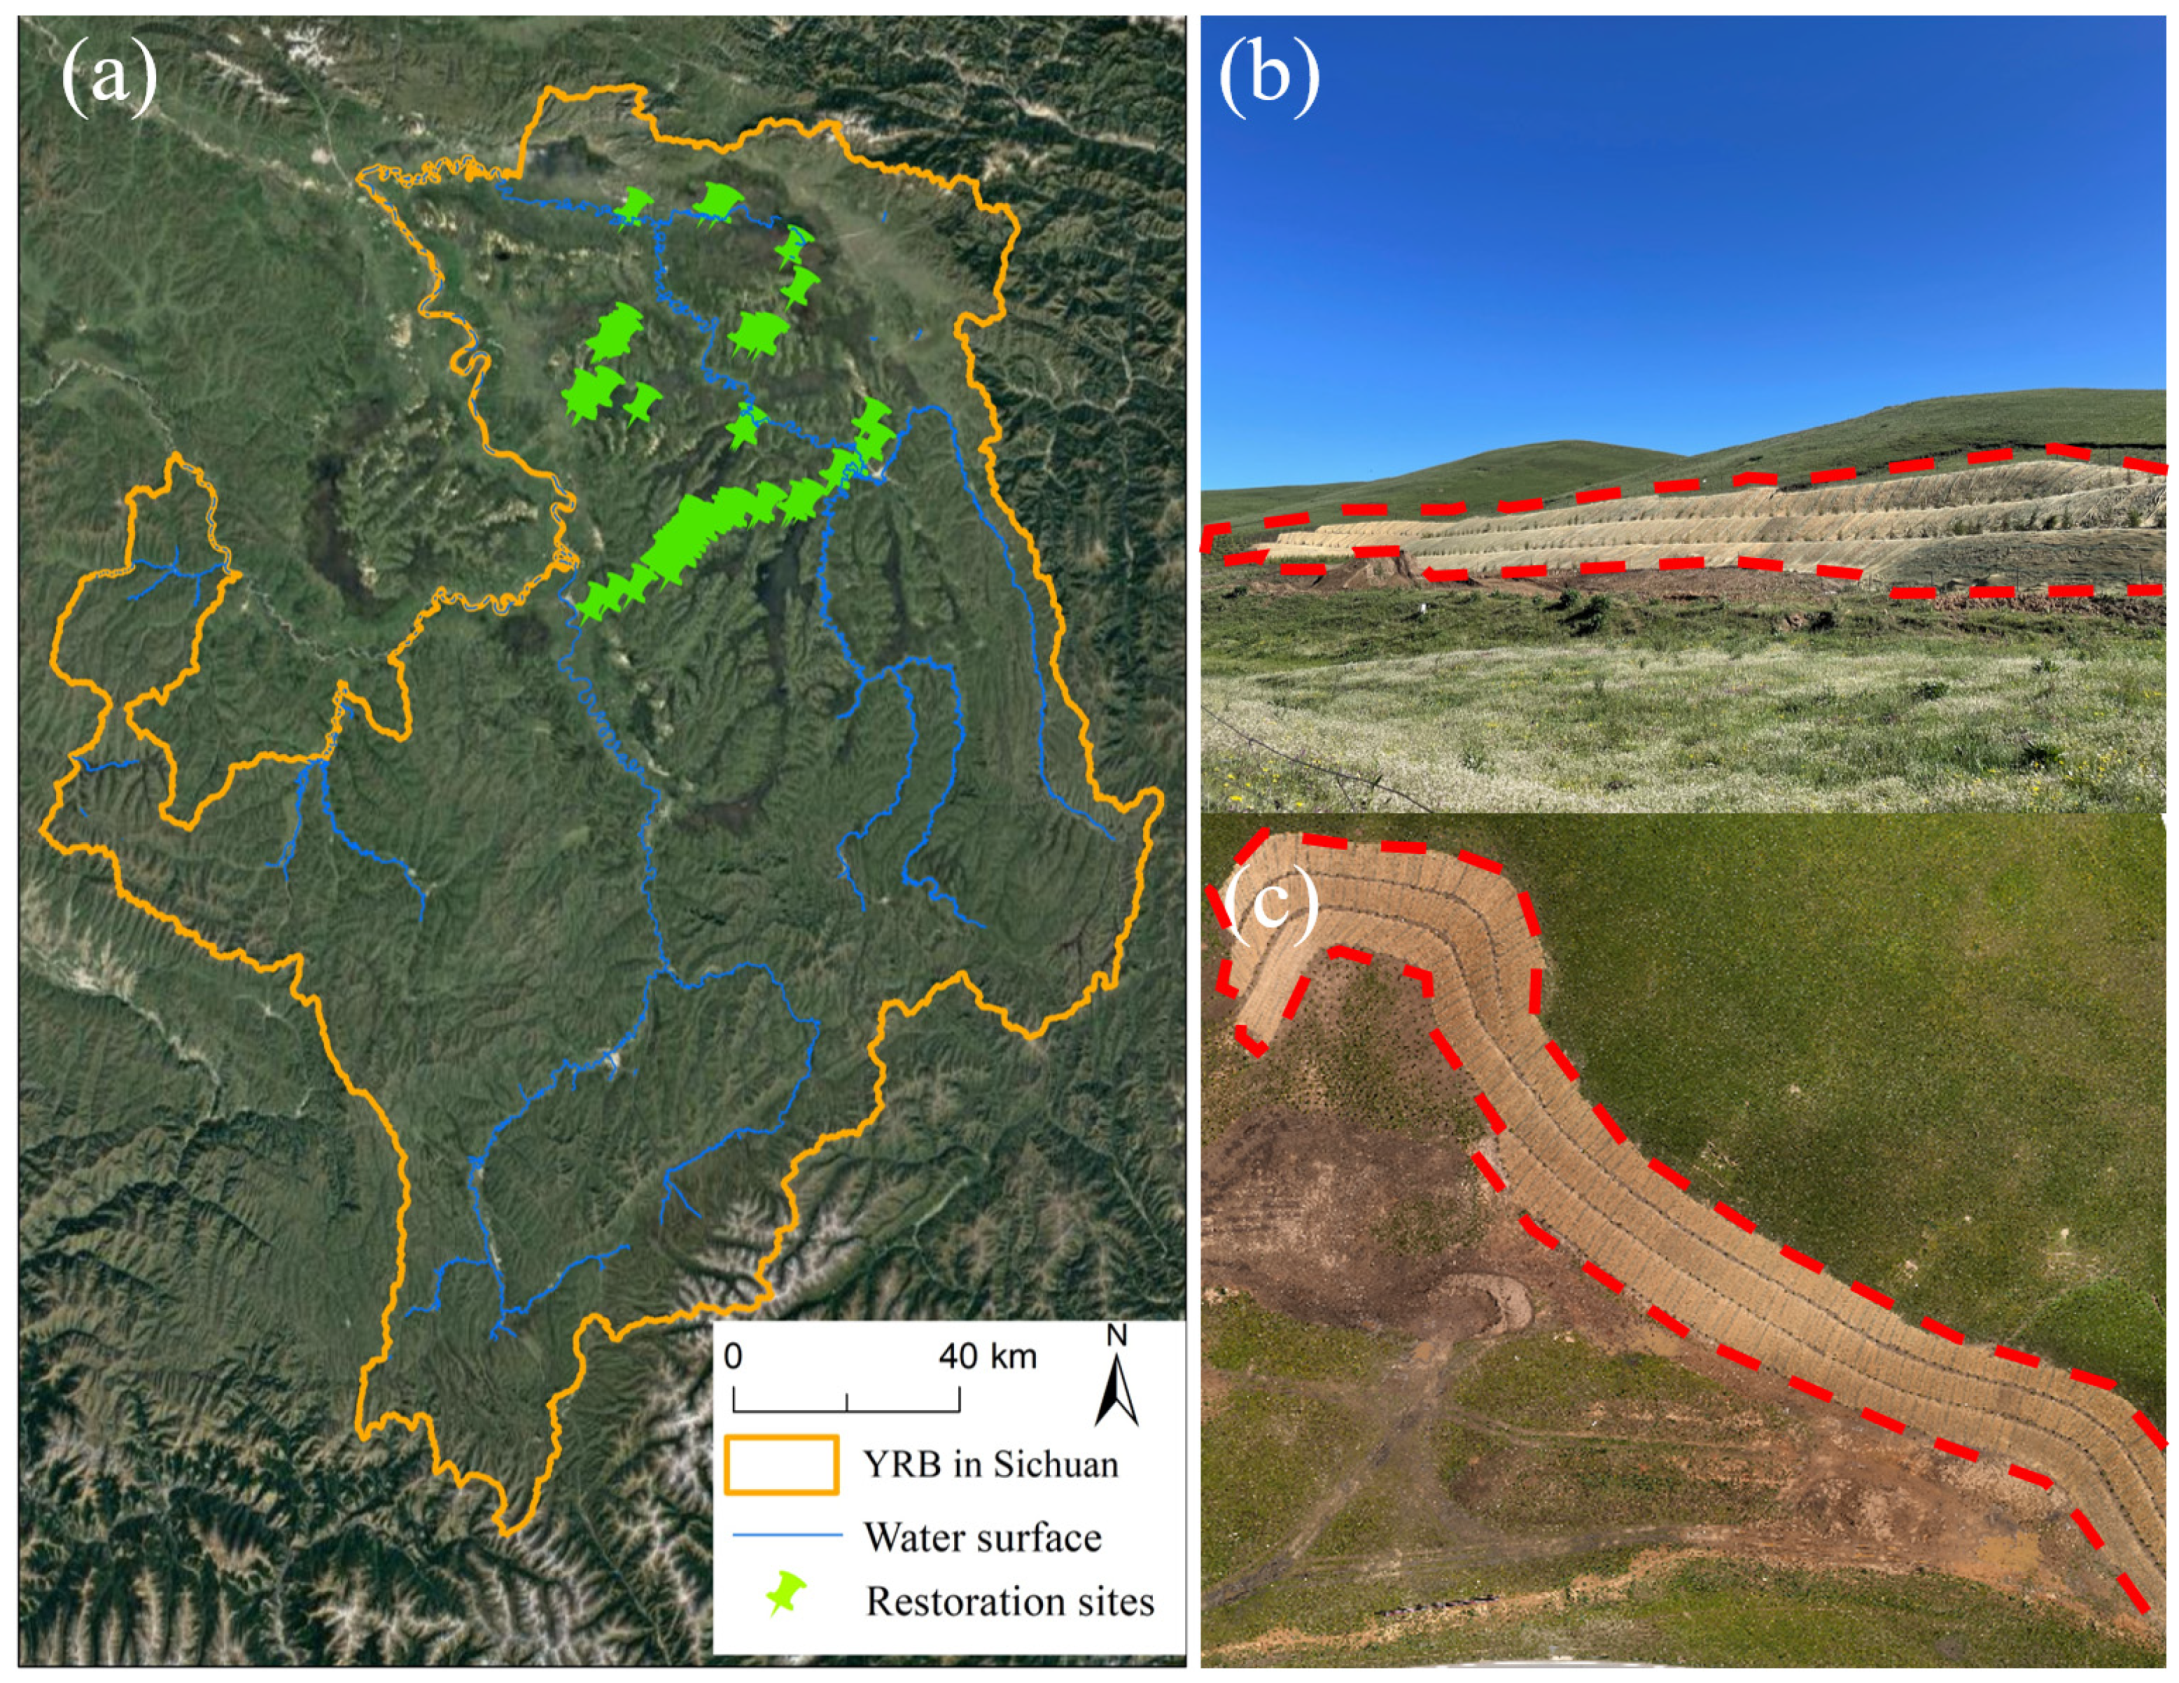
2.1. Study Area
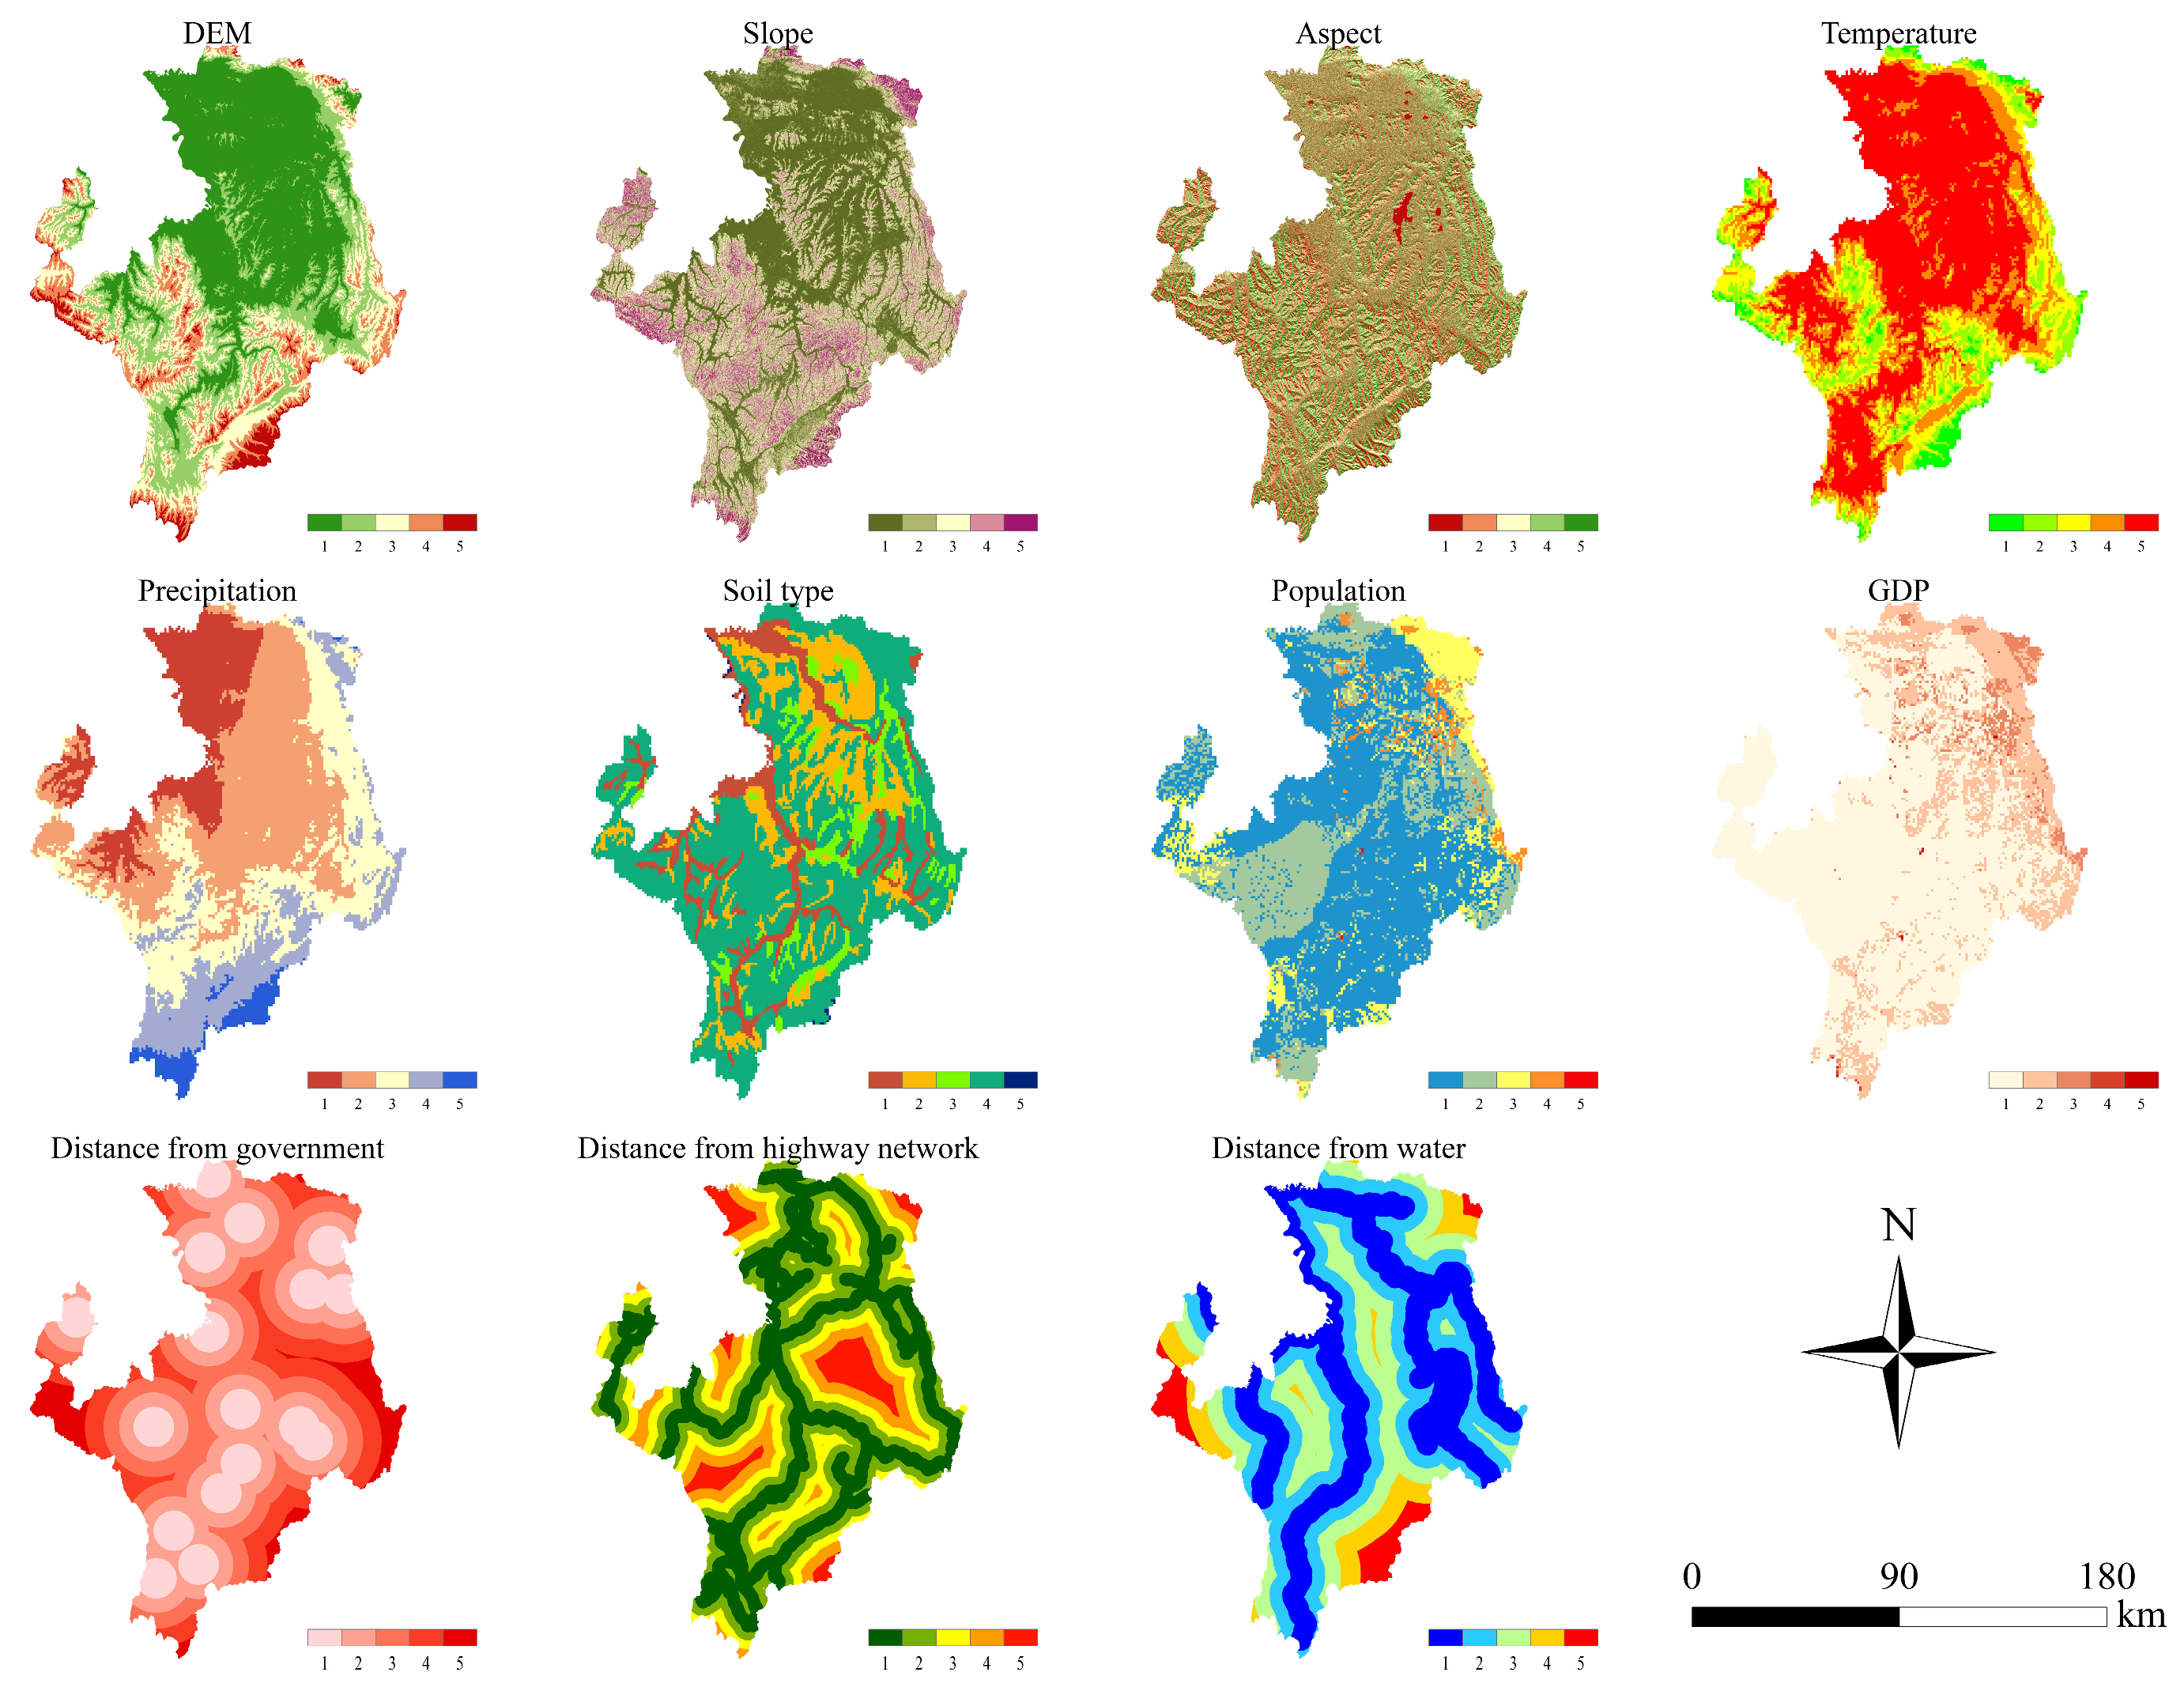
2.2. Data Sources
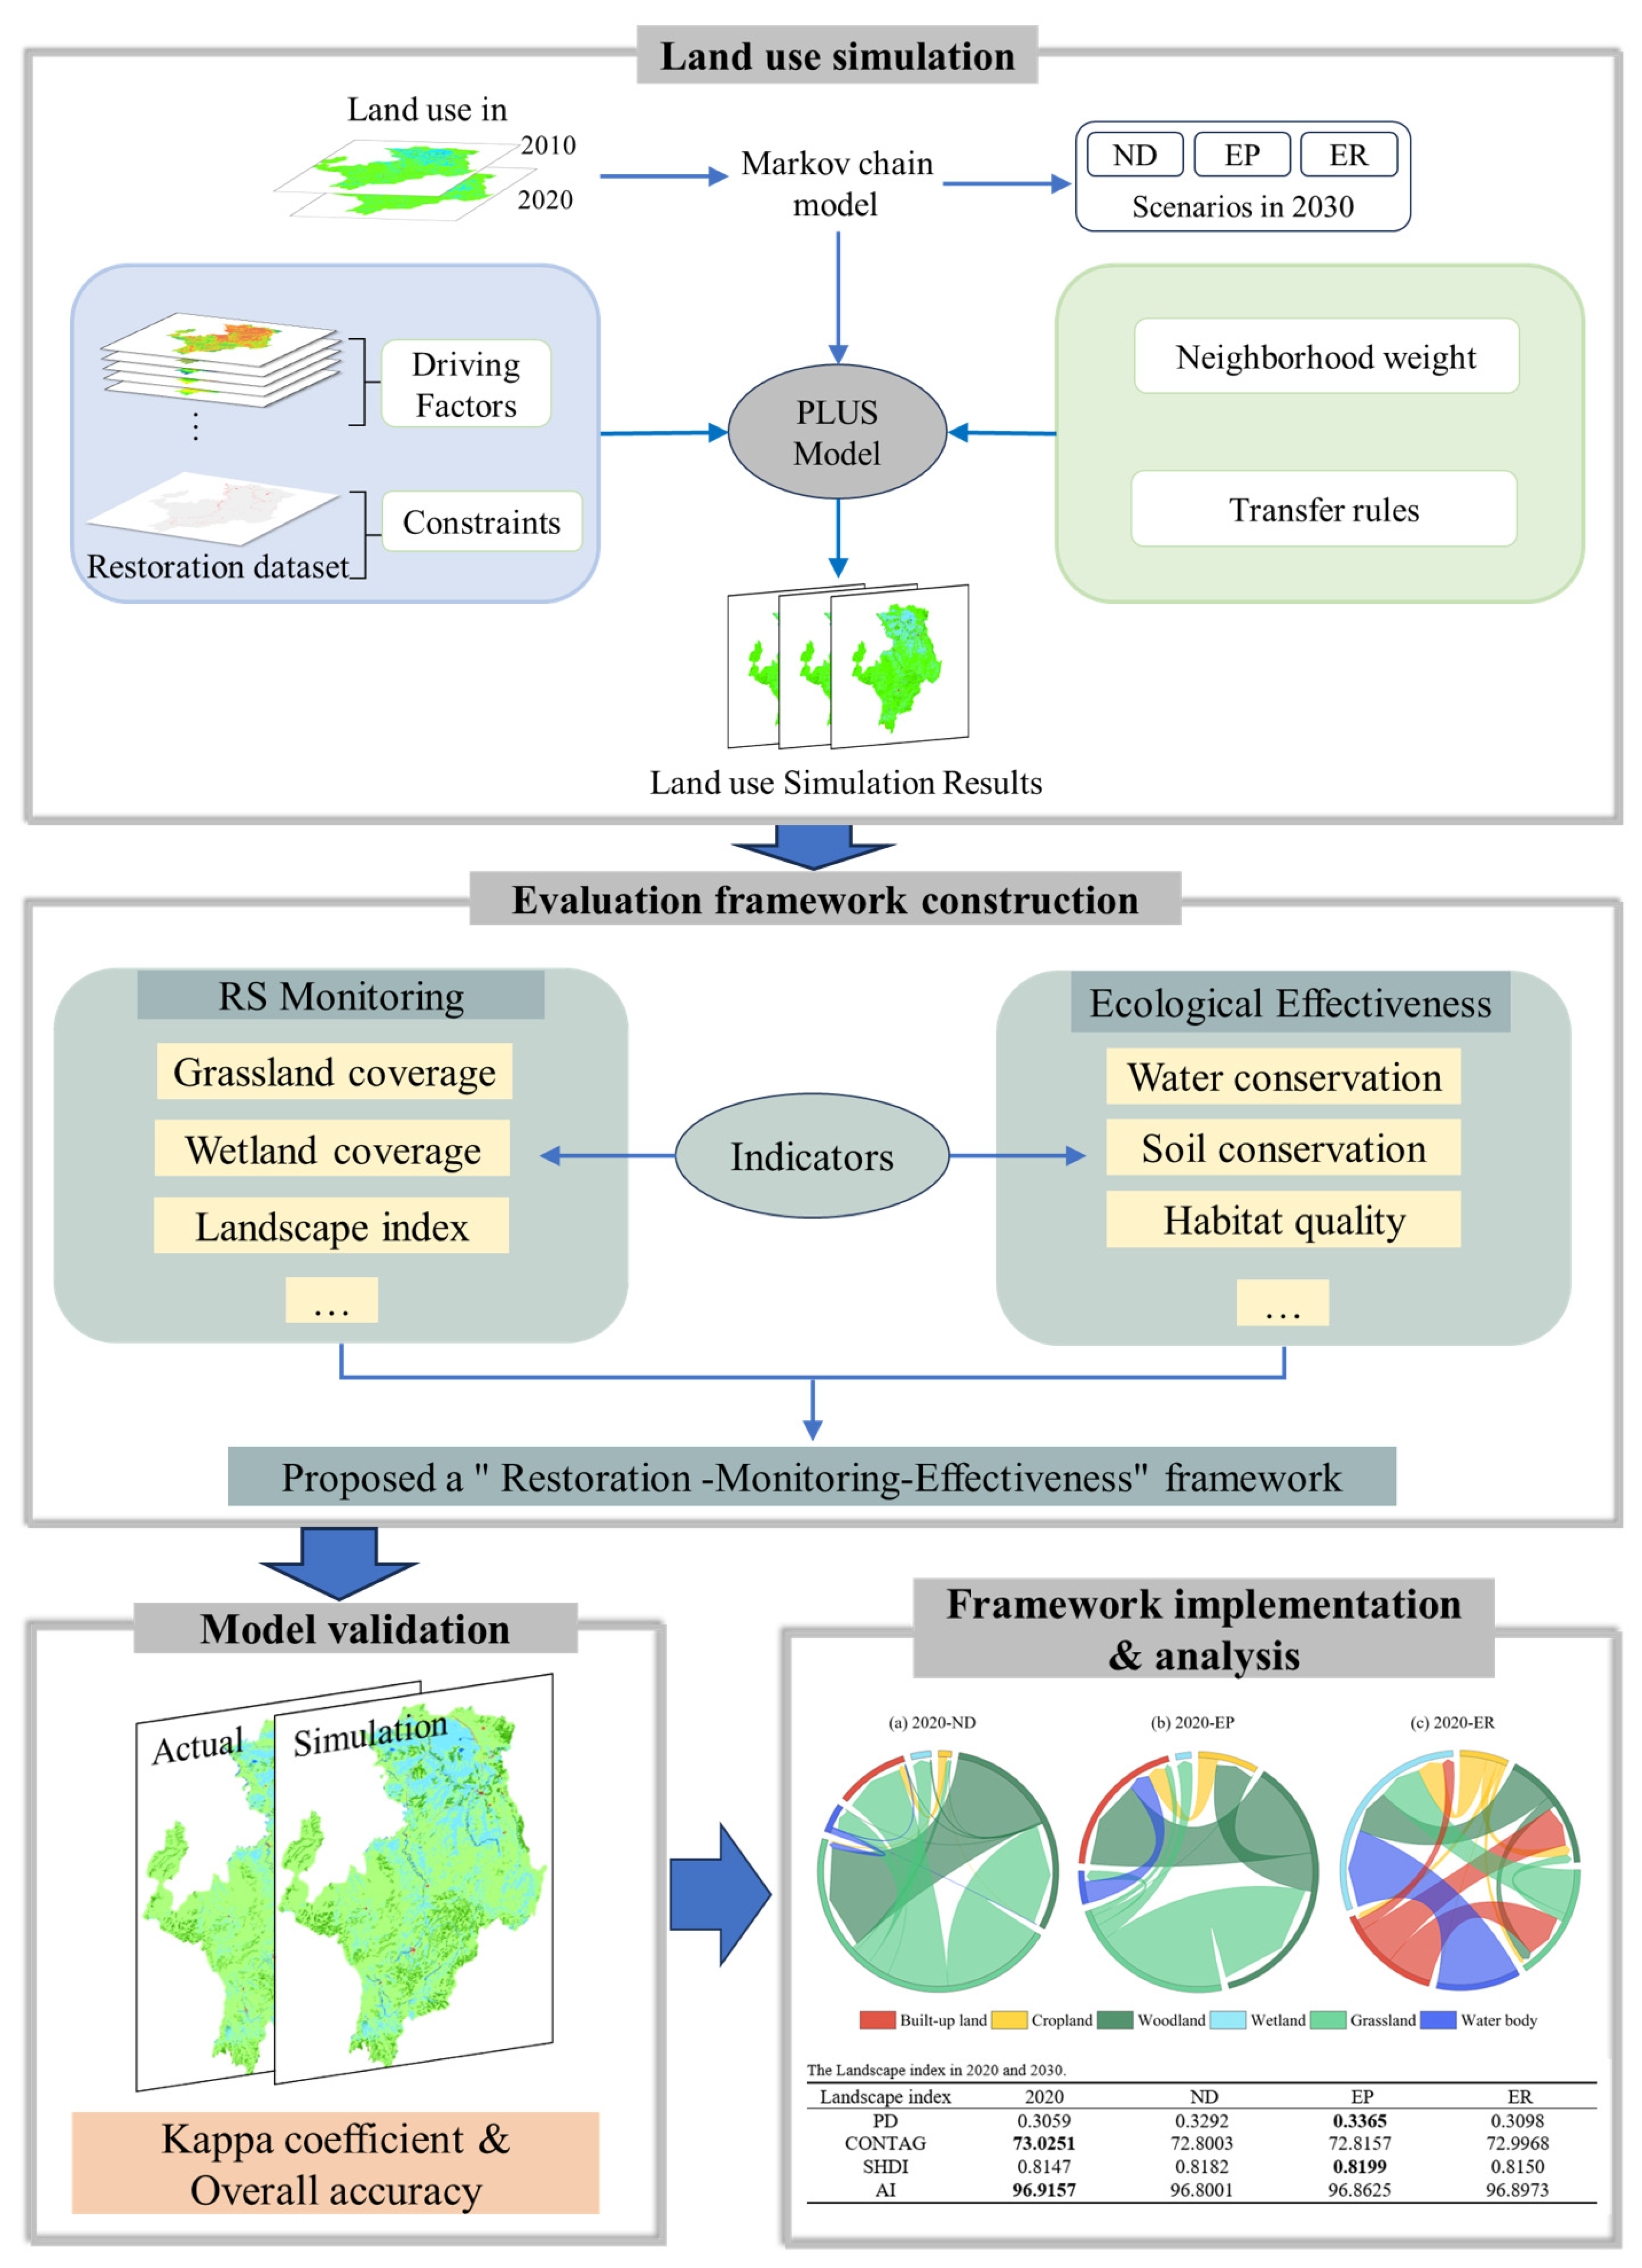
2.3. Research Framework
2.4. Land Use Simulation
2.4.1. Scenario Design
- (1)
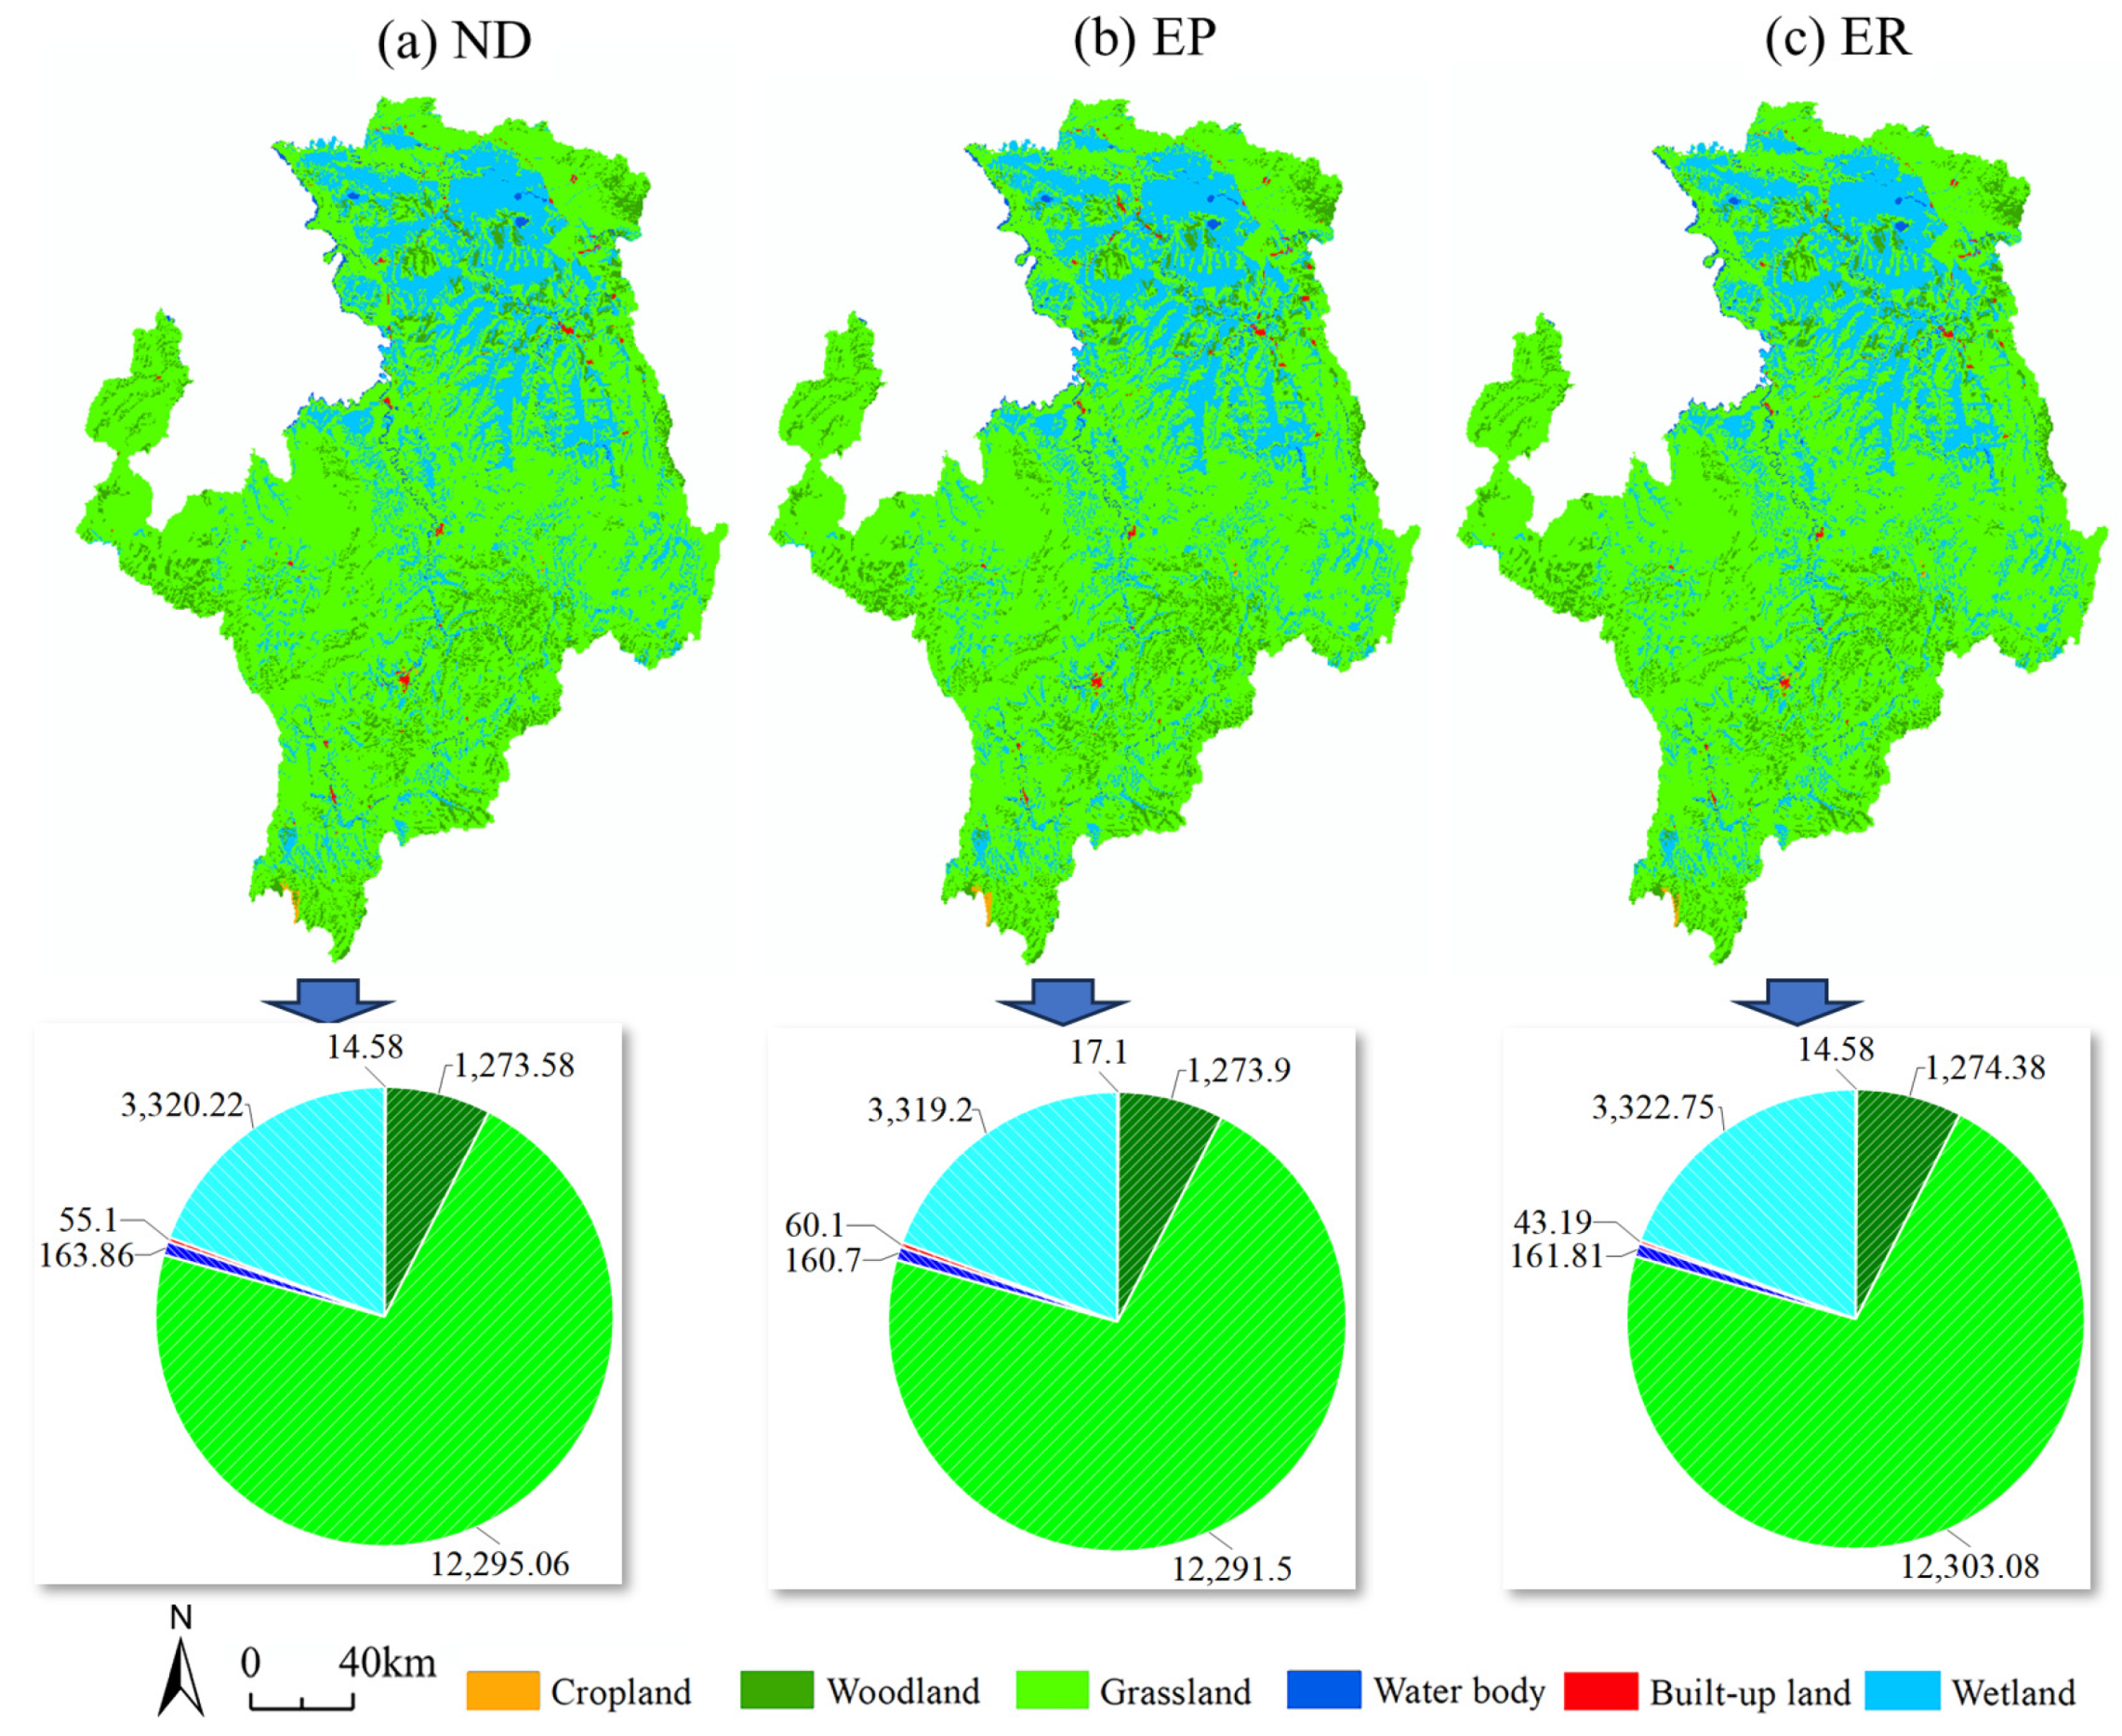
- ND scenario: It is assumed that there is no change in the trends of land use from 2020 to 2030. This scenario does not introduce new policies or external interventions, and the change in land use type mainly depends on the existing socio-economic and natural change trends.
- (2)
- EP scenario: This scenario aims to promote economic development and expand the scale of urbanization. During the forecast period, the probability of grassland, wetland, and woodland being converted into built-up land and farmland is increased. The probability of built-up areas being converted into other landscape types is reduced. In this scenario, land use change is mainly based on maximizing economic benefits, which may lead to more natural land being developed into urban or agricultural land.
- (3)
- ER scenario: The goal of this scenario is to implement ecological restoration projects to protect local ecosystems and reduce human interference. During the forecast period, the probability of other land use types being converted to built-up land is reduced, and the probability of built-up land being converted to ecological land (such as grassland, wetlands, and woodlands) is increased. The restoration dataset is used as an ecological constraint to ensure that ecological restoration measures are effectively implemented. This scenario emphasizes environmental protection and ecological restoration and improves the ecological environment by reducing development pressure and increasing the area of ecological land.
2.4.2. PLUS Model
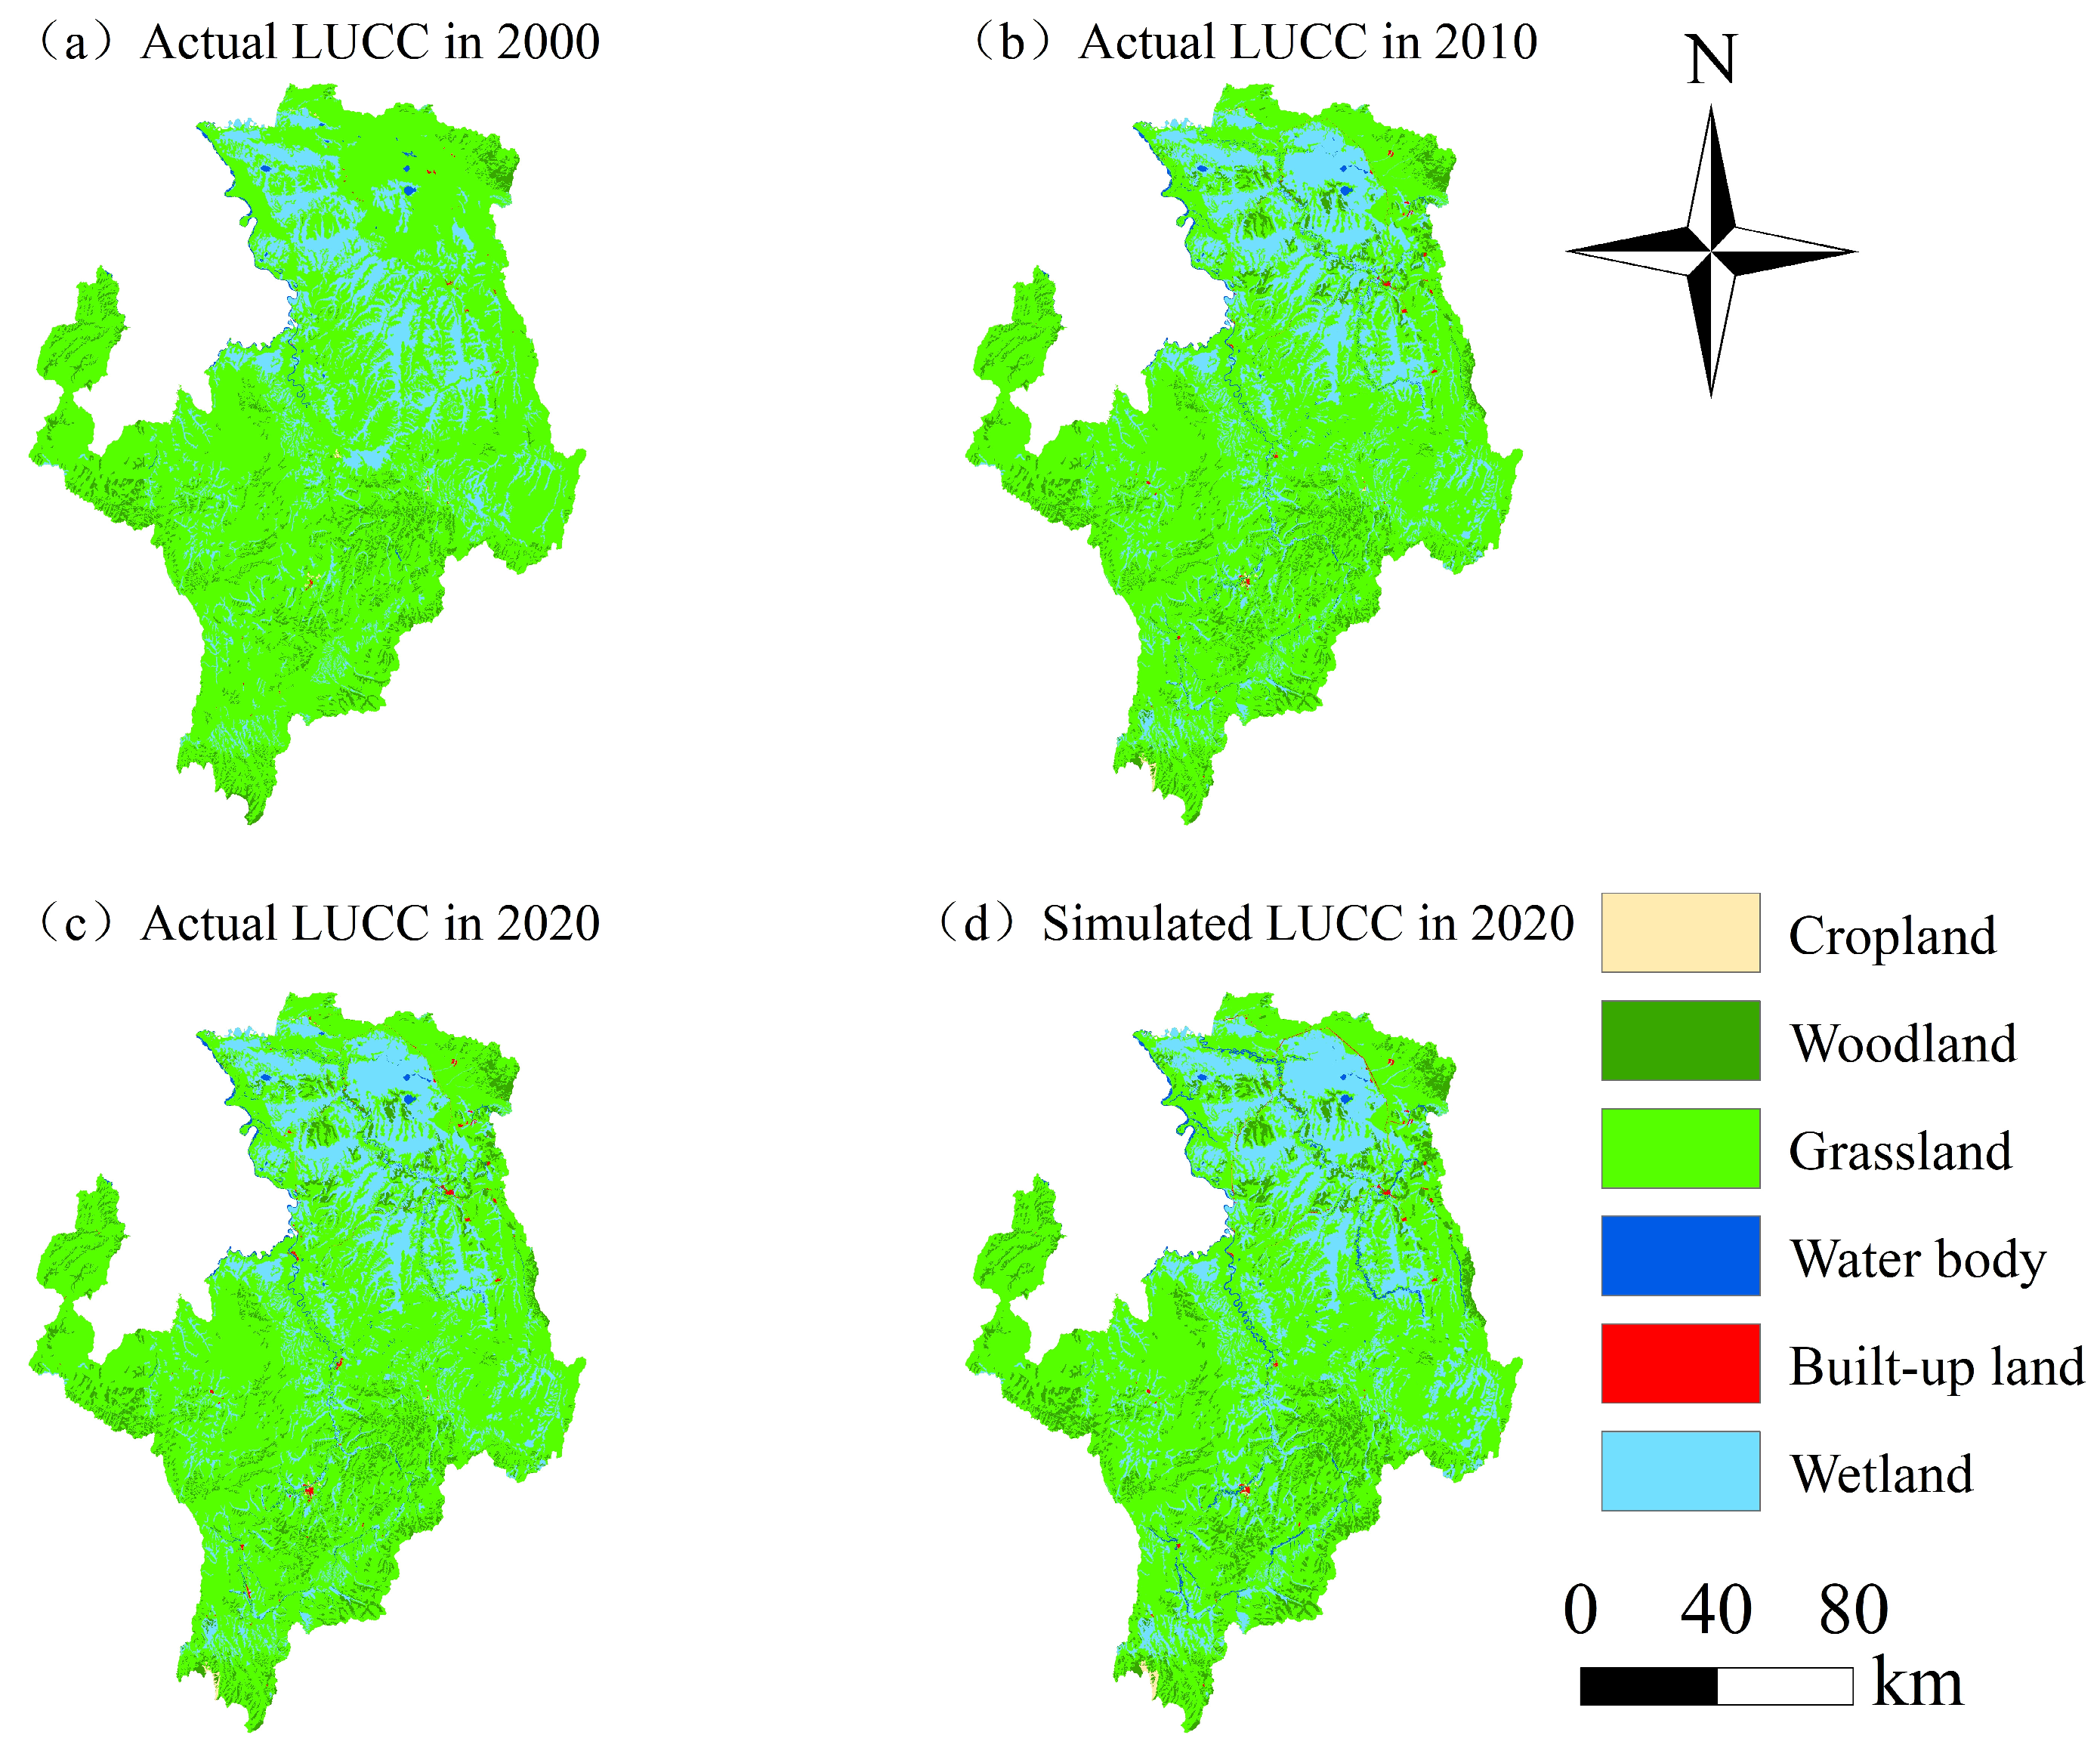
2.4.3. Model Verification
2.5. Evaluation Framework Construction
2.5.1. Remote-Sensing Monitoring
2.5.2. Effectiveness of Ecosystem Services
2.5.3. Proposed RME Evaluation Method
3. Results
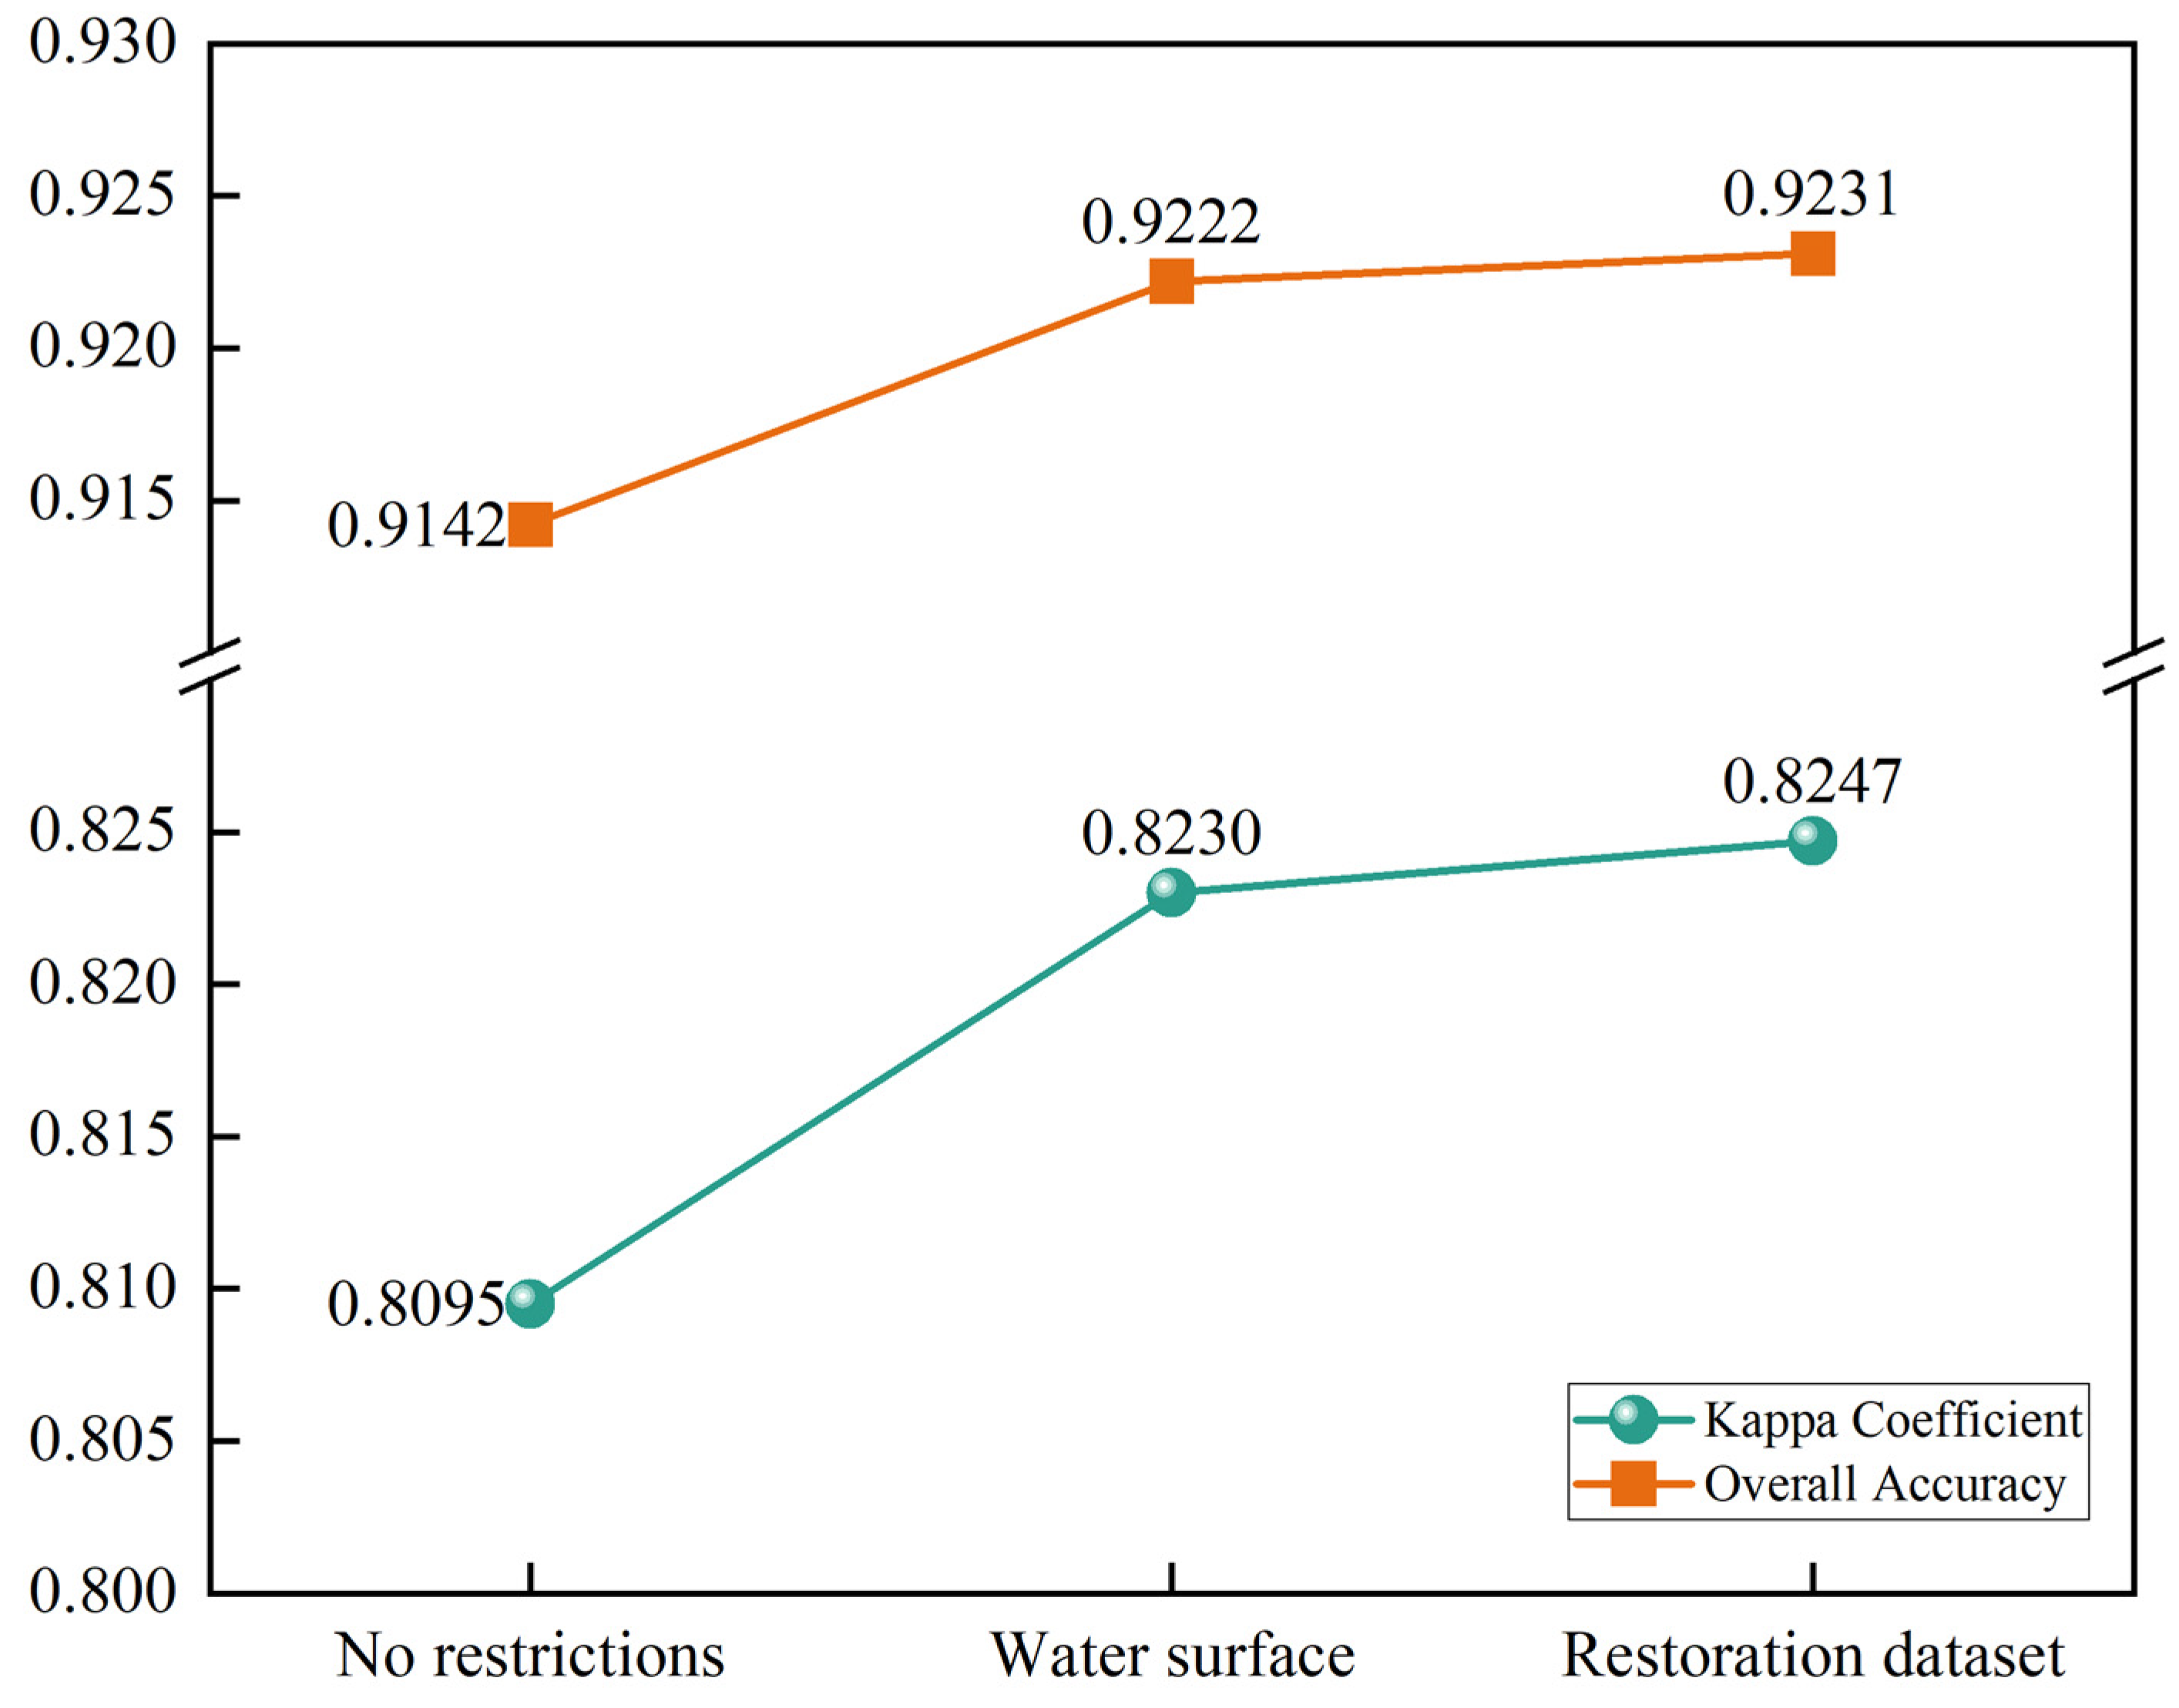
3.1. Model Accuracy Verification
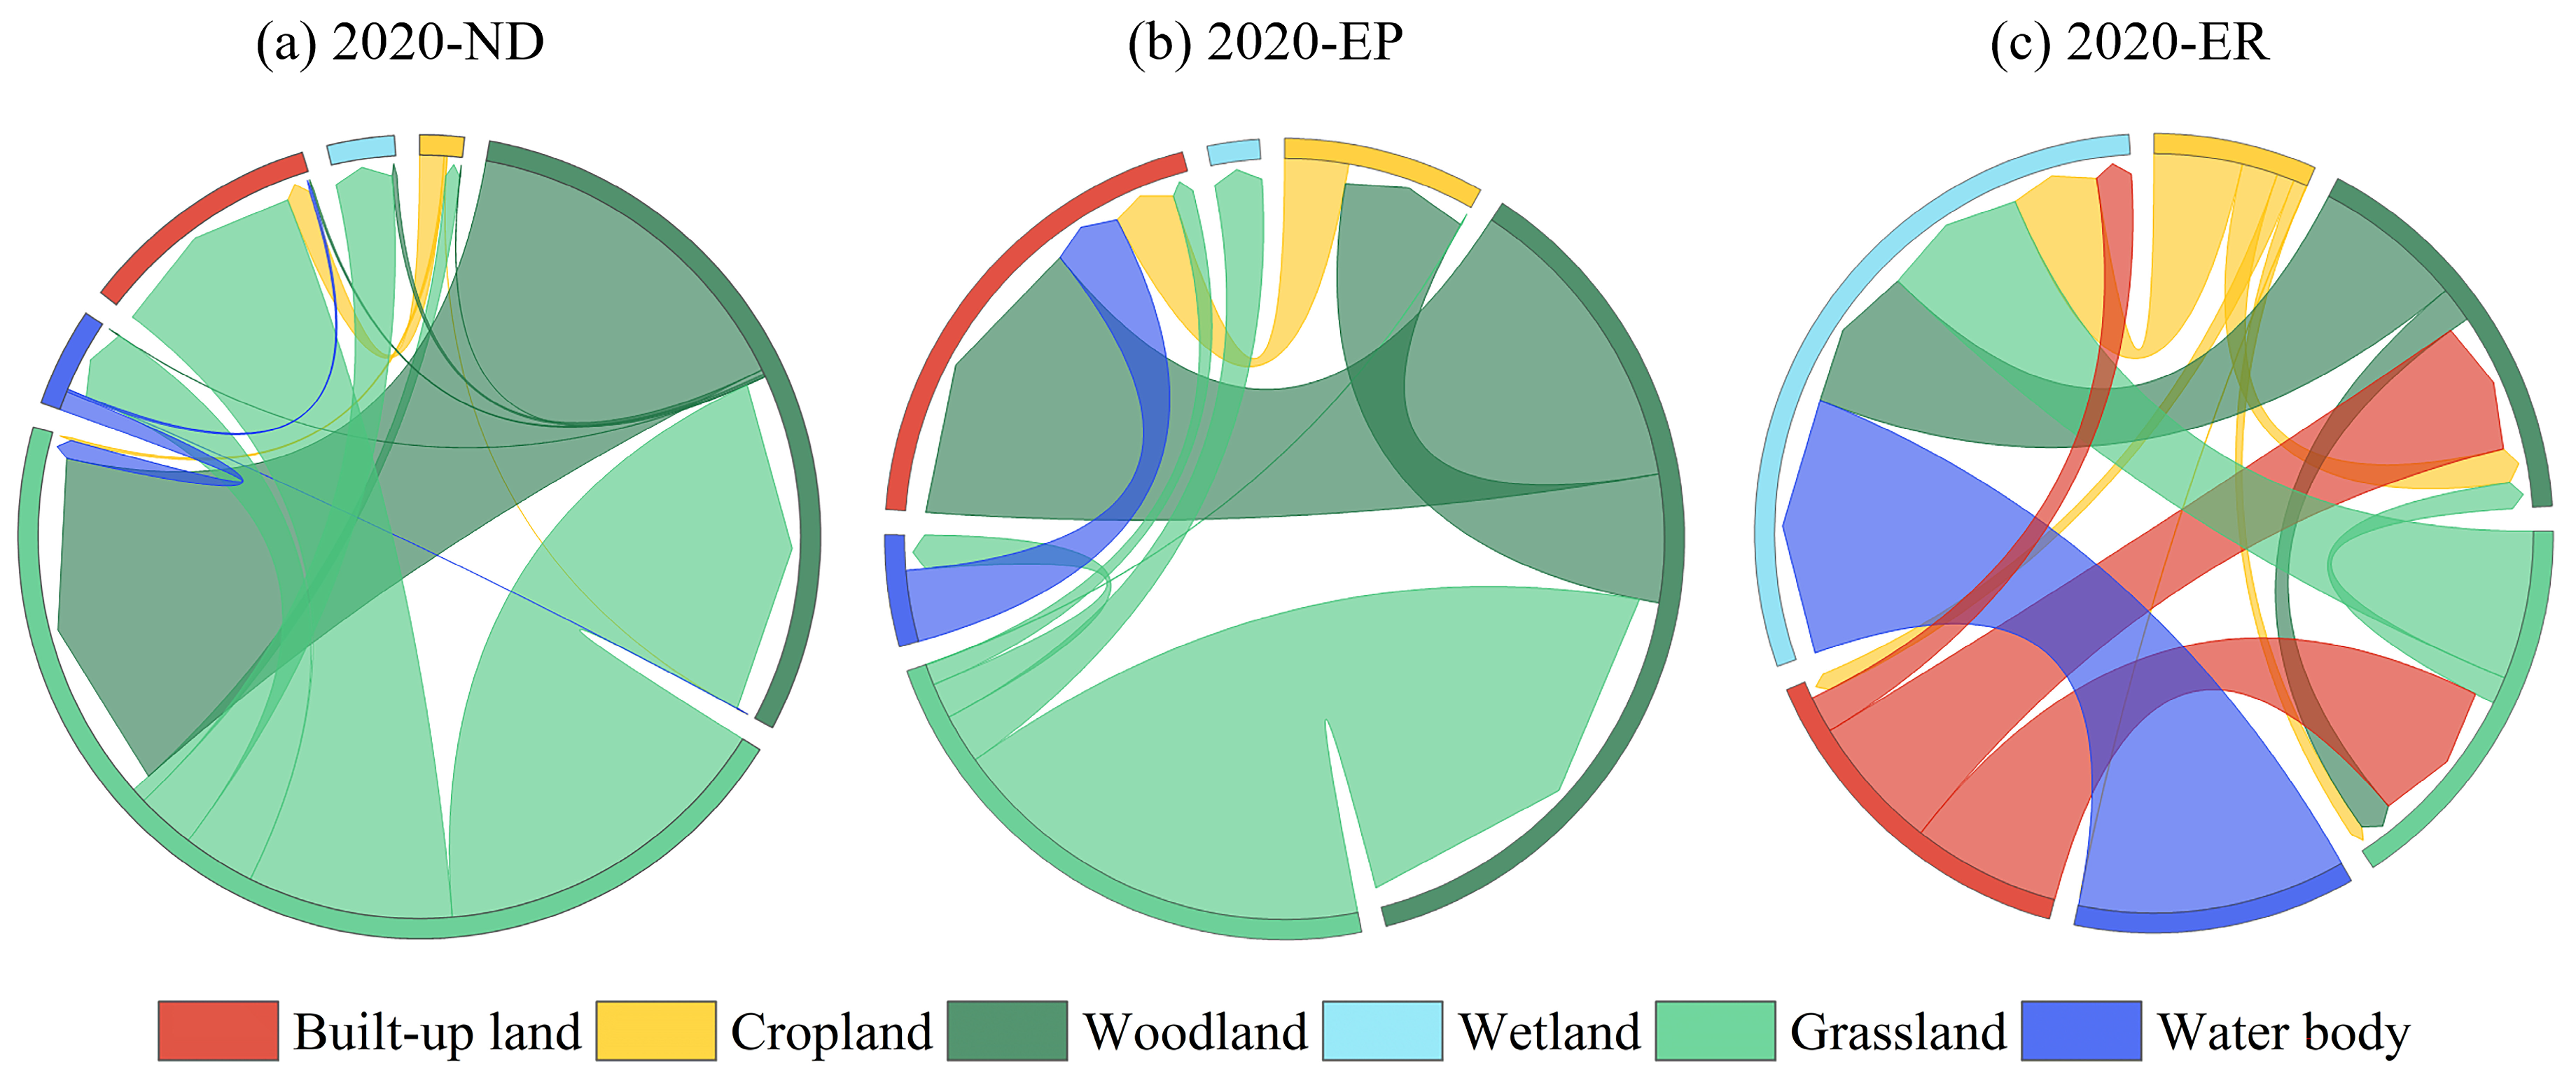
3.2. Land Use Change during 2020–2030
3.3. Implementation of the Evaluation Framework
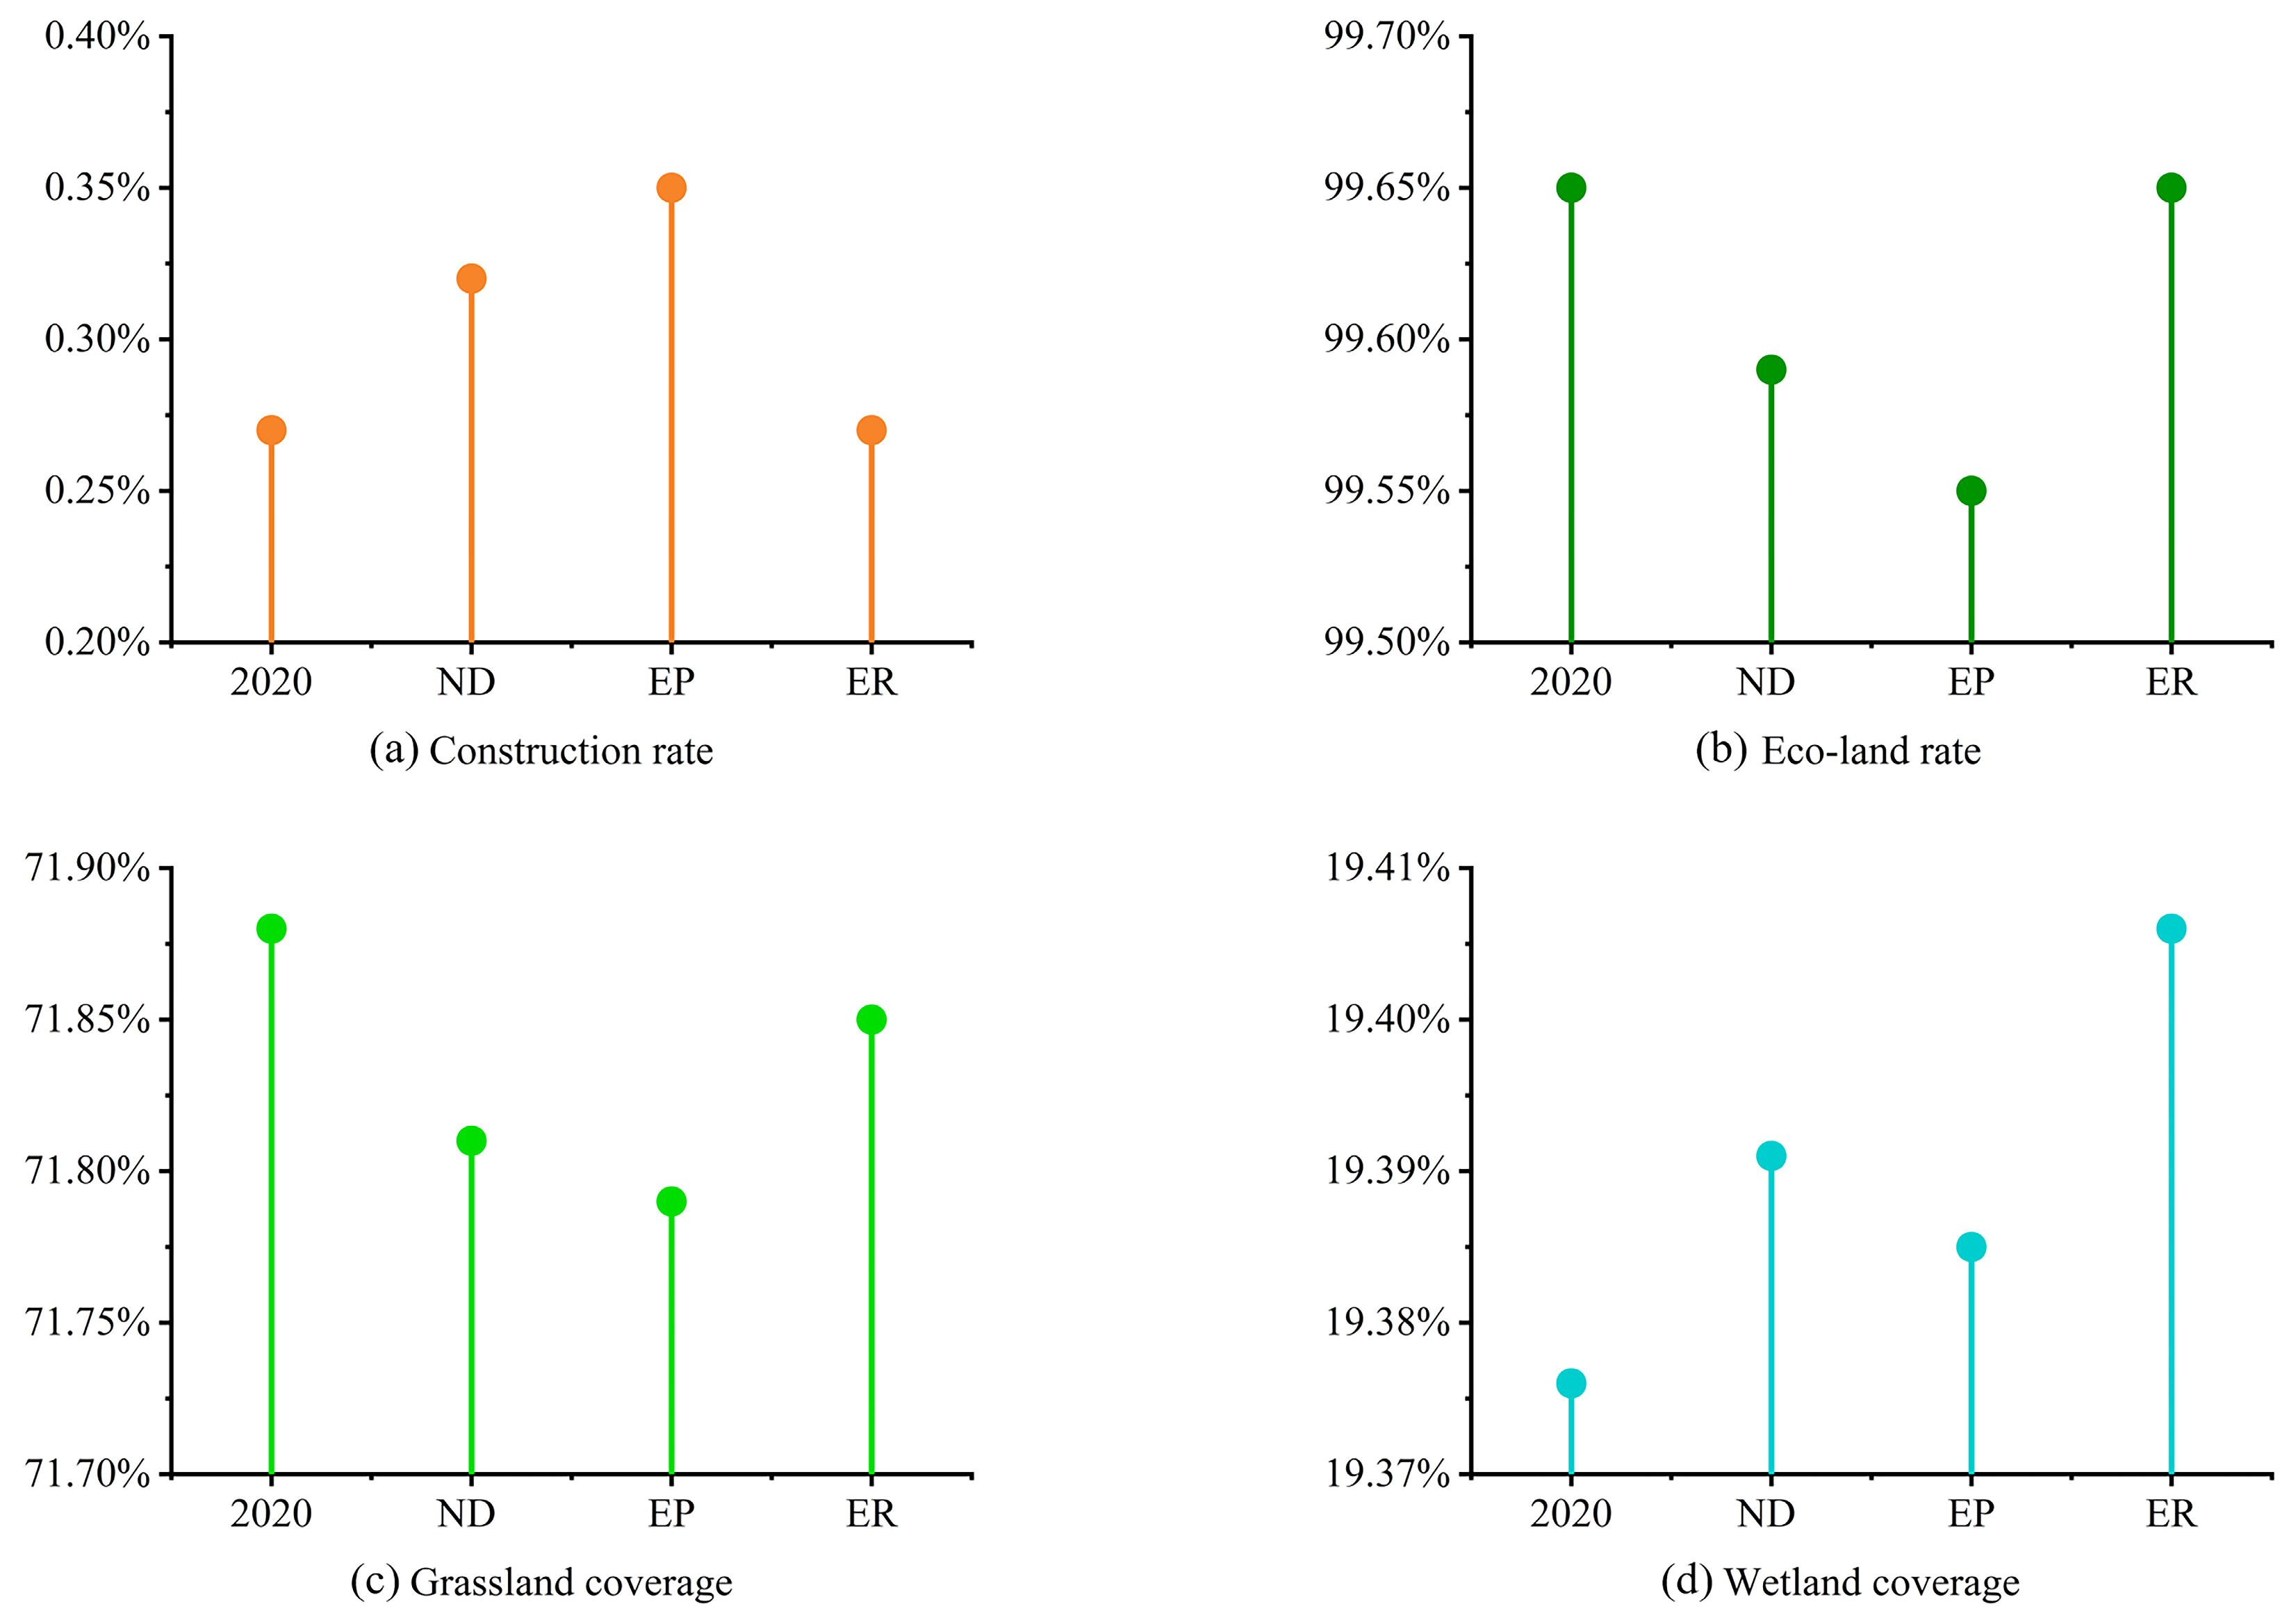
3.3.1. Changes in Monitoring Indicators under Multiple Scenarios
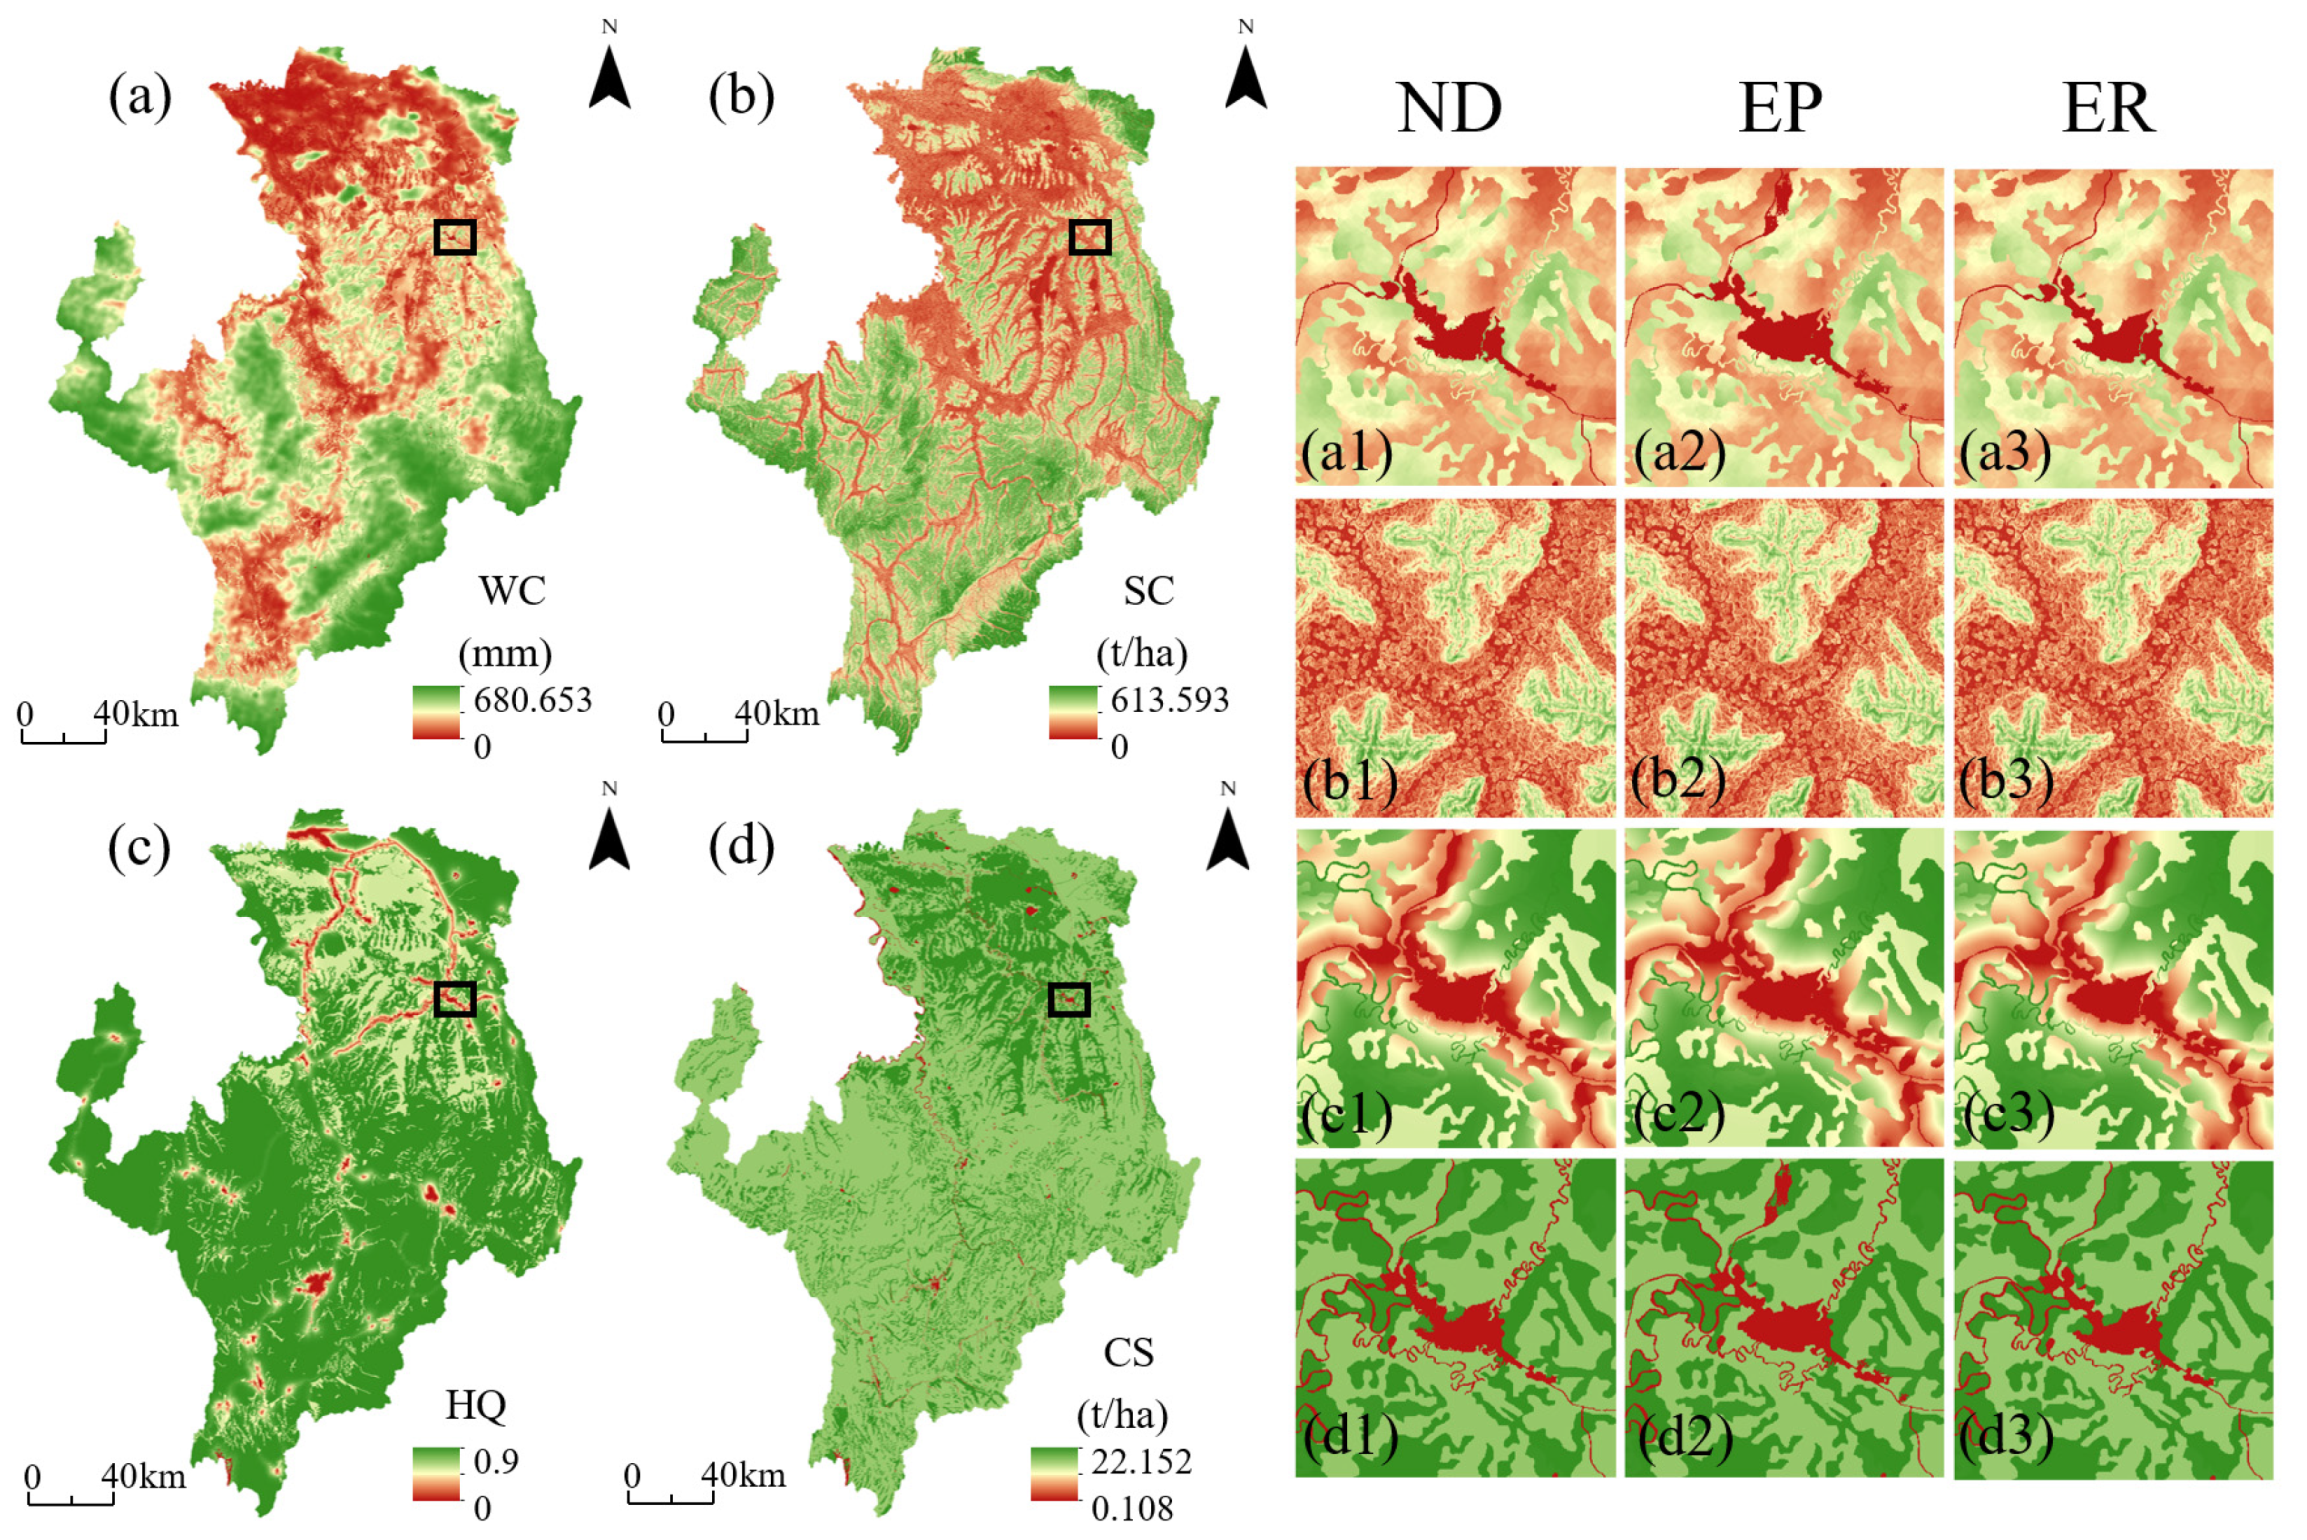
3.3.2. Analysis of Ecosystem Services Changes in 2030
4. Discussion
4.1. Impact of the Restoration Dataset on Accuracy of the PLUS Model
4.2. Spatial Distribution Characteristics of Ecosystem Services in Each Scenario
4.3. Analysis of the Overall Ecological Effects under Different Scenarios
4.4. Limitations and Prospects
5. Conclusions
Author Contributions
Funding
Data Availability Statement
Conflicts of Interest
References
- Feng, Y.J.; Zhu, A.K. Spatiotemporal differentiation and driving patterns of water utilization intensity in Yellow River Basin of China: Comprehensive perspective on the water quantity and quality. J. Clean. Prod. 2022, 369, 133395. [Google Scholar] [CrossRef]
- Jiang, W.; Pang, Z.; Lv, J.; Ju, H.; Li, L.; Fu, J. Satellite observations reveal decreasing soil erosion in Northeast Inner Mongolia, China, over the past four decades. Front. Earth Sci. 2022, 10, 988521. [Google Scholar] [CrossRef]
- Jin, F.; Yang, W.; Fu, J.; Li, Z. Effects of vegetation and climate on the changes of soil erosion in the Loess Plateau of China. Sci. Total Environ. 2021, 773, 145514. [Google Scholar] [CrossRef] [PubMed]
- Tang, W.; Pei, Y.; Zheng, H.; Zhao, Y.; Shu, L.; Zhang, H. Twenty years of China’s water pollution control: Experiences and challenges. Chemosphere 2022, 295, 133875. [Google Scholar] [CrossRef]
- Wang, M.; Janssen, A.B.G.; Bazin, J.; Strokal, M.; Ma, L.; Kroeze, C. Accounting for interactions between Sustainable Development Goals is essential for water pollution control in China. Nat. Commun. 2022, 13, 730. [Google Scholar] [CrossRef] [PubMed]
- Goncalves-Souza, D.; Vilela, B.; Phalan, B.; Dobrovolski, R. The role of protected areas in maintaining natural vegetation in Brazil. Sci. Adv. 2021, 7, eabh2932. [Google Scholar] [CrossRef] [PubMed]
- Tian, L.; Tao, Y.; Fu, W.; Li, T.; Ren, F.; Li, M. Dynamic Simulation of Land Use/Cover Change and Assessment of Forest Ecosystem Carbon Storage under Climate Change Scenarios in Guangdong Province, China. Remote Sens. 2022, 14, 2330. [Google Scholar] [CrossRef]
- Outhwaite, C.L.; McCann, P.; Newbold, T. Agriculture and climate change are reshaping insect biodiversity worldwide. Nature 2022, 605, 97–102. [Google Scholar] [CrossRef] [PubMed]
- Gong, J.; Cao, E.; Xie, Y.; Xu, C.; Li, H.; Yan, L. Integrating ecosystem services and landscape ecological risk into adaptive management: Insights from a western mountain-basin area, China. J. Environ. Manag. 2021, 281, 111817. [Google Scholar] [CrossRef]
- Xu, H.T.; Song, Y.C.; Tian, Y. Simulation of land-use pattern evolution in hilly mountainous areas of North China: A case study in Jincheng. Land Use Policy 2022, 112, 105826. [Google Scholar] [CrossRef]
- Ye, Q. Quality Evaluation of Ecological Restoration of Urban Water Pollution based on Analytic Hierarchy Process. J. Coast. Res. 2020, 104, 10–13. [Google Scholar] [CrossRef]
- Han, B.; Jin, X.; Xiang, X.; Rui, S.; Zhang, X.; Jin, Z.; Zhou, Y. An integrated evaluation framework for Land-Space ecological restoration planning strategy making in rapidly developing area. Ecol. Indic. 2021, 124, 107374. [Google Scholar] [CrossRef]
- Liu, H.; Hao, H.; Zhang, W.; Liu, P.; Sun, L. Evaluation of Ecological Protection and Restoration Effectiveness Based on “Pattern-Quality-Service” in Irtysh River Basin. Res. Environ. Sci. 2022, 35, 2495–2507. [Google Scholar]
- Yuan, M.; Ouyang, J.; Zheng, S.; Tian, Y.; Sun, R.; Bao, R.; Li, T.; Yu, T.; Li, S.; Wu, D.; et al. Research on Ecological Effect Assessment Method of Ecological Restoration of Open-Pit Coal Mines in Alpine Regions. Int. J. Environ. Res. Public Health 2022, 19, 7682. [Google Scholar] [CrossRef] [PubMed]
- Xiao, W.; Ruan, L.-L.; Yue, W.-Z.; Zhou, Y.; Zhang, L.-J.; Hu, Y.-M. Construction of a multi-scale effectiveness evaluation system for ecological restoration and protection of territorial space. Ying Yong Sheng Tai Xue Bao = J. Appl. Ecol. 2023, 34, 2566–2574. [Google Scholar] [CrossRef]
- Yang, Y.; Song, G.; Lu, S. Assessment of land ecosystem health with Monte Carlo simulation: A case study in Qiqihaer, China. J. Clean. Prod. 2020, 250, 119522. [Google Scholar] [CrossRef]
- Long, X.; Lin, H.; An, X.; Chen, S.; Qi, S.; Zhang, M. Evaluation and analysis of ecosystem service value based on land use/cover change in Dongting Lake wetland. Ecol. Indic. 2022, 136, 108619. [Google Scholar] [CrossRef]
- Wang, X.; Wu, J.; Liu, Y.; Hai, X.; Shanguan, Z.; Deng, L. Driving factors of ecosystem services and their spatiotemporal change assessment based on land use types in the Loess Plateau. J. Environ. Manag. 2022, 311, 114835. [Google Scholar] [CrossRef] [PubMed]
- Han, S.M.; Jing, Y.D.; Liu, Y.C. Simulation of land use landscape pattern evolution from a multi-scenario simulation: A case study of Nansi Lake Basin in China. Environ. Monit. Assess. 2023, 195, 830. [Google Scholar] [CrossRef] [PubMed]
- Wang, S.; Zhao, Y.; Xu, Z.; Yang, G.; Huang, T.; Ma, N. Landscape pattern and economic factors’ effect on prediction accuracy of cellular automata-Markov chain model on county scale. Open Geosci. 2020, 12, 626–636. [Google Scholar] [CrossRef]
- Zhang, X.; Zhou, J.; Song, W. Simulating Urban Sprawl in China Based on the Artificial Neural Network-Cellular Automata-Markov Model. Sustainability 2020, 12, 4341. [Google Scholar] [CrossRef]
- Beroho, M.; Briak, H.; Cherif, E.K.; Boulahfa, I.; Ouallali, A.; Mrabet, R.; Kebede, F.; Bernardino, A.; Aboumaria, K. Future Scenarios of Land Use/Land Cover (LULC) Based on a CA-Markov Simulation Model: Case of a Mediterranean Watershed in Morocco. Remote Sens. 2023, 15, 1162. [Google Scholar] [CrossRef]
- Zhang, H.; Yan, Q.; Xie, F.; Ma, S. Evaluation and Prediction of Landscape Ecological Security Based on a CA-Markov Model in Overlapped Area of Crop and Coal Production. Land 2023, 12, 207. [Google Scholar] [CrossRef]
- Mamanis, G.; Vrahnakis, M.; Chouvardas, D.; Nasiakou, S.; Kleftoyanni, V. Land Use Demands for the CLUE-S Spatiotemporal Model in an Agroforestry Perspective. Land 2021, 10, 1097. [Google Scholar] [CrossRef]
- Zhang, Y.; Yu, M.; Ye, Y. Spatial Land Use Optimization Using the CLUE-S Model: A Case Study in the Keerqinzuoyihou Banner, China. Pol. J. Environ. Stud. 2022, 31, 5963–5974. [Google Scholar] [CrossRef] [PubMed]
- Liao, G.; He, P.; Gao, X.; Lin, Z.; Huang, C.; Zhou, W.; Deng, O.; Xu, C.; Deng, L. Land use optimization of rural production-living-ecological space at different scales based on the BP-ANN and CLUE-S models. Ecol. Indic. 2022, 137, 108710. [Google Scholar] [CrossRef]
- Li, Z.; Cheng, X.; Han, H. Future Impacts of Land Use Change on Ecosystem Services under Different Scenarios in the Ecological Conservation Area, Beijing, China. Forests 2020, 11, 584. [Google Scholar] [CrossRef]
- Chen, X.; He, X.; Wang, S. Simulated Validation and Prediction of Land Use under Multiple Scenarios in Daxing District, Beijing, China, Based on GeoSOS-FLUS Model. Sustainability 2022, 14, 428. [Google Scholar] [CrossRef]
- Li, Y.; Liu, Z.; Li, S.; Li, X. Multi-Scenario Simulation Analysis of Land Use and Carbon Storage Changes in Changchun City Based on FLUS and InVEST Model. Land 2022, 11, 647. [Google Scholar] [CrossRef]
- Zhu, K.; Cheng, Y.; Zang, W.; Zhou, Q.; El Archi, Y.; Mousazadeh, H.; Kabil, M.; Csoban, K.; David, L.D. Multiscenario Simulation of Land-Use Change in Hubei Province, China Based on the Markov-FLUS Model. Land 2023, 12, 744. [Google Scholar] [CrossRef]
- Lin, Z.; Peng, S. Comparison of multimodel simulations of land use and land cover change considering integrated constraints- A case study of the Fuxian Lake basin. Ecol. Indic. 2022, 142, 109254. [Google Scholar] [CrossRef]
- Xu, L.; Liu, X.; Tong, D.; Liu, Z.; Yin, L.; Zheng, W. Forecasting Urban Land Use Change Based on Cellular Automata and the PLUS Model. Land 2022, 11, 652. [Google Scholar] [CrossRef]
- Liang, X.; Guan, Q.; Clarke, K.C.; Liu, S.; Wang, B.; Yao, Y. Understanding the drivers of sustainable land expansion using a patch-generating land use simulation (PLUS) model: A case study in Wuhan, China. Comput. Environ. Urban Syst. 2021, 85, 101569. [Google Scholar] [CrossRef]
- Zhang, S.; Zhong, Q.; Cheng, D.; Xu, C.; Chang, Y.; Lin, Y.; Li, B. Landscape ecological risk projection based on the PLUS model under the localized shared socioeconomic pathways in the Fujian Delta region. Ecol. Indic. 2022, 136, 108642. [Google Scholar] [CrossRef]
- Wang, X.; Duan, L.; Zhang, T.; Cheng, W.; Jia, Q.; Li, J.; Li, M. Ecological vulnerability of China’s Yellow River Basin: Evaluation and socioeconomic driving factors. Environ. Sci. Pollut. Res. 2023, 30, 115915–115928. [Google Scholar] [CrossRef] [PubMed]
- Zhang, X.; Liu, K.; Wang, S.; Wu, T.; Li, X.; Wang, J.; Wang, D.; Zhu, H.; Tan, C.; Ji, Y. Spatiotemporal evolution of ecological vulnerability in the Yellow River Basin under ecological restoration initiatives. Ecol. Indic. 2022, 135, 108586. [Google Scholar] [CrossRef]
- Yang, L.; Zhao, G.; Tian, P.; Mu, X.; Tian, X.; Feng, J.; Bai, Y. Runoff changes in the major river basins of China and their responses to potential driving forces. J. Hydrol. 2022, 607, 127536. [Google Scholar] [CrossRef]
- Liu, C.; Zhang, X.; Wang, T.; Chen, G.; Zhu, K.; Wang, Q.; Wang, J. Detection of vegetation coverage changes in the Yellow River Basin from 2003 to 2020. Ecol. Indic. 2022, 138, 108818. [Google Scholar] [CrossRef]
- Zhou, Z.; Sun, X.; Zhang, X.; Wang, Y. Inter-regional ecological compensation in the Yellow River Basin based on the value of ecosystem services. J. Environ. Manag. 2022, 322, 116073. [Google Scholar] [CrossRef]
- Wu, H.; Lin, A.; Xing, X.; Song, D.; Li, Y. Identifying core driving factors of urban land use change from global land cover products and POI data using the random forest method. Int. J. Appl. Earth Obs. Geoinf. 2021, 103, 102475. [Google Scholar] [CrossRef]
- Xu, D.; Zhang, K.; Cao, L.; Guan, X.; Zhang, H. Driving forces and prediction of urban land use change based on the geodetector and CA-Markov model: A case study of Zhengzhou, China. Int. J. Digit. Earth 2022, 15, 2246–2267. [Google Scholar] [CrossRef]
- Huo, J.; Shi, Z.; Zhu, W.; Xue, H.; Chen, X. A Multi-Scenario Simulation and Optimization of Land Use with a Markov-FLUS Coupling Model: A Case Study in Xiong’an New Area, China. Sustainability 2022, 14, 425. [Google Scholar] [CrossRef]
- Zhang, Z.; Wang, X.; Zhang, Y.; Gao, Y.; Liu, Y.; Sun, X.; Zhi, J.; Yin, S. Simulating land use change for sustainable land management in rapid urbanization regions: A case study of the Yangtze River Delta region. Landsc. Ecol. 2023, 38, 1807–1830. [Google Scholar] [CrossRef]
- Luo, J.; Fu, H. Construct the future wetland ecological security pattern with multi-scenario simulation. Ecol. Indic. 2023, 153, 110473. [Google Scholar] [CrossRef]
- Song, W.; Song, W.; Gu, H.H.; Li, F.P. Progress in the Remote Sensing Monitoring of the Ecological Environment in Mining Areas. Int. J. Environ. Res. Public Health 2020, 17, 1846. [Google Scholar] [CrossRef] [PubMed]
- Liu, Z.; Xu, J.; Liu, M.; Yin, Z.; Liu, X.; Yin, L.; Zheng, W. Remote sensing and geostatistics in urban water-resource monitoring: A review. Mar. Freshw. Res. 2023, 74, 747–765. [Google Scholar] [CrossRef]
- Yang, Z.; Yu, X.; Dedman, S.; Rosso, M.; Zhu, J.; Yang, J.; Xia, Y.; Tian, Y.; Zhang, G.; Wang, J. UAV remote sensing applications in marine monitoring: Knowledge visualization and review. Sci. Total Environ. 2022, 838, 155939. [Google Scholar] [CrossRef]
- Camarretta, N.; Harrison, P.A.; Bailey, T.; Potts, B.; Lucieer, A.; Davidson, N.; Hunt, M. Monitoring forest structure to guide adaptive management of forest restoration: A review of remote sensing approaches. New For. 2020, 51, 573–596. [Google Scholar] [CrossRef]
- Sun, M.; Hu, J.; Chen, X.; Lu, Y.; Yang, L. Comparison of Five Models for Estimating the Water Retention Service of a Typical Alpine Wetland Region in the Qinghai-Tibetan Plateau. Remote Sens. 2022, 14, 6360. [Google Scholar] [CrossRef]
- Tang, Y.; Gao, C.; Wu, X. Urban Ecological Corridor Network Construction: An Integration of the Least Cost Path Model and the InVEST Model. ISPRS Int. J. Geo-Inf. 2020, 9, 33. [Google Scholar] [CrossRef]
- Li, P.; Chen, J.; Li, Y.; Wu, W. Using the InVEST-PLUS Model to Predict and Analyze the Pattern of Ecosystem Carbon storage in Liaoning Province. China Remote Sens. 2023, 15, 4050. [Google Scholar]
- Peng, B.; Yang, J.; Li, Y.; Zhang, S. Land-Use Optimization Based on Ecological Security Pattern—A Case Study of Baicheng, Northeast China. Remote Sens. 2023, 15, 5671. [Google Scholar] [CrossRef]
- Nie, W.; Xu, B.; Ma, S.; Yang, F.; Shi, Y.; Liu, B.; Hao, N.; Wu, R.; Lin, W.; Bao, Z. Coupling an Ecological Network with Multi-Scenario Land Use Simulation: An Ecological Spatial Constraint Approach. Remote Sens. 2022, 14, 99. [Google Scholar] [CrossRef]
- Chen, H.; Deng, S.; Zhang, S.; Shen, Y. Urban Growth and Its Ecological Effects in China. Remote Sens. 2024, 16, 1378. [Google Scholar] [CrossRef]
- Zhang, Y.Q.; Zhao, X.; Gong, J.; Luo, F.; Pan, Y.P. Effectiveness and driving mechanism of ecological restoration efforts in China from 2009 to 2019. Sci. Total Environ. 2024, 910, 168676. [Google Scholar] [CrossRef]


| Type | Data | Resolution | Source |
|---|---|---|---|
| Land use | CNLUCC | 30 m | http://www.resdc.cn/ (accessed on 21 July 2023) |
| Natural factors | DEM | 30 m | http://www.resdc.cn/ (accessed on 25 July 2023) |
| Slope | 30 m | Calculated from DEM | |
| Aspect | 30 m | ||
| Annual mean temperature | 1 km | http://www.resdc.cn/ (accessed on 25 July 2023) | |
| Annual mean precipitation | 1 km | ||
| Soil type | 1 km | ||
| Social factors | Population density | 1 km | http://www.resdc.cn/ (accessed on 28 July 2023) |
| GDP | 1 km | ||
| Location factors | Distance from government | 30 m | Open Steet Map (https://www.openstreetmap.org/ (accessed on 2 August 2023)) |
| Distance from highway network | 30 m | ||
| Distance from water | 30 m | ||
| Restoration dataset | Restoration sites and water surfaces | / | Based on visual interpretation and field verification |
| Evaluation Content | Evaluation Indicators | Meaning of Indicators |
|---|---|---|
| Land use change | Construction rate | Proportion of built-up land out of total area |
| Eco-land rate | Proportion of eco-land out of total area | |
| Grassland coverage | Proportion of grassland out of total area | |
| Wetland coverage | Proportion of wetland out of total area | |
| Landscape patterns | Patch density | Water conservation |
| Contagion index | Soil conservation | |
| Aggregation index | Carbon storage | |
| Shannon diversity index | Habitat quality |
| Indicator Type | Evaluation Content | Indicator Layer | Unit |
|---|---|---|---|
| Monitoring indicators | Land use change | Construction rate | % |
| Eco-land rate | % | ||
| Grassland coverage | % | ||
| Wetland coverage | % | ||
| Landscape patterns | Patch density | / | |
| Contagion index | / | ||
| Aggregation index | / | ||
| Shannon diversity index | / | ||
| Effectiveness indicators | Ecosystem services | Water conservation | mm |
| Soil conservation | (t/ha) | ||
| Carbon storage | / | ||
| Habitat quality | (t/ha) |
| ES | Average | Change | ||||||
|---|---|---|---|---|---|---|---|---|
| 2020 | ND | EP | ER | ND | EP | ER | ||
| WC | (mm) | 287.8259 | 287.7307 | 287.6542 | 287.8568 | −0.0952 | −0.1717 | 0.0309 |
| SC | (t/ha) | 62.2719 | 62.2722 | 62.2703 | 62.2722 | 0.0003 | −0.0016 | 0.0003 |
| HQ | - | 0.6671 | 0.6666 | 0.6664 | 0.6670 | −0.0004 | −0.0007 | −0.0001 |
| CS | (t/ha) | 20.4151 | 20.4022 | 20.3986 | 20.4159 | −0.0129 | −0.0165 | 0.0008 |
Disclaimer/Publisher’s Note: The statements, opinions and data contained in all publications are solely those of the individual author(s) and contributor(s) and not of MDPI and/or the editor(s). MDPI and/or the editor(s) disclaim responsibility for any injury to people or property resulting from any ideas, methods, instructions or products referred to in the content. |
© 2024 by the authors. Licensee MDPI, Basel, Switzerland. This article is an open access article distributed under the terms and conditions of the Creative Commons Attribution (CC BY) license (https://creativecommons.org/licenses/by/4.0/).
Share and Cite
Huang, X.; Ye, C.; Tao, H.; Zou, J.; Zhou, Y.; Zheng, S. Integrating Future Multi-Scenarios to Evaluate the Effectiveness of Ecological Restoration: A Case Study of the Yellow River Basin. Land 2024, 13, 1032. https://doi.org/10.3390/land13071032
Huang X, Ye C, Tao H, Zou J, Zhou Y, Zheng S. Integrating Future Multi-Scenarios to Evaluate the Effectiveness of Ecological Restoration: A Case Study of the Yellow River Basin. Land. 2024; 13(7):1032. https://doi.org/10.3390/land13071032
Chicago/Turabian StyleHuang, Xinbei, Chengming Ye, Hongyu Tao, Junjie Zou, Yuzhan Zhou, and Shufan Zheng. 2024. "Integrating Future Multi-Scenarios to Evaluate the Effectiveness of Ecological Restoration: A Case Study of the Yellow River Basin" Land 13, no. 7: 1032. https://doi.org/10.3390/land13071032
APA StyleHuang, X., Ye, C., Tao, H., Zou, J., Zhou, Y., & Zheng, S. (2024). Integrating Future Multi-Scenarios to Evaluate the Effectiveness of Ecological Restoration: A Case Study of the Yellow River Basin. Land, 13(7), 1032. https://doi.org/10.3390/land13071032