Article

Supporting Efficiency Measurement and Tradeoff Optimization Methods of Ecosystem Services on Grain Production

1
Institute of Mountain Hazards and Environment, Chinese Academy of Sciences, Chengdu 610299, China
2
University of Chinese Academy of Sciences, Beijing 100049, China
3
College of Resources and Environment, University of Chinese Academy of Sciences, Beijing 100049, China
4
China-Pakistan Joint Research Center on Earth Sciences, CAS-HEC, Islamabad 45320, Pakistan
*
Author to whom correspondence should be addressed.
Land 2024, 13(7), 1040; https://doi.org/10.3390/land13071040
Submission received: 15 May 2024 / Revised: 3 July 2024 / Accepted: 9 July 2024 / Published: 11 July 2024

Abstract

:
Grain production (GP) is inherently dependent on ecosystem services (ESs). However, the increasing grain demand heightens the conflict between ESs and GP. This tension is further fueled by unstable natural, socio-economic, and political factors. To reconcile this issue and promote their mutual growth, quantifying the extent to which ESs support GP is essential. This study is designed to present a scientific method for measuring the impact of ESs on GP, thereby enhancing the objectivity and scientific rigor of strategies for ecological and food security. This study, by deconstructing the functional relationship between ESs and GP, employs the Super-SBM model to analyze the mathematical relationships between them, thereby achieving the quantification of the efficiency of ESs in supporting GP. The findings reveal the following key points: (1) the Super-SBM model offers a viable and scientifically robust approach for quantifying the supporting efficiency of ESs on GP; (2) the supporting efficiency of ESs for GP in 93.94% of the counties in the Hengduan Mountainous Region (HMR) is less than 1, indicating that both the efficiency and capacity of regional ESs to support GP are relatively low; (3) an obvious spatial mismatch in allocation is evident between the provision of ESs and the demands of GP in the HMR, which leading to regional supply–demand imbalance; (4) the slack relationships and quantity between ESs and grain output assessed by the Super-SBM model provide a scientific basis and optimization direction for crafting sustainable development strategies between ESs and GP. Supporting efficiency research, as an exploration of the relationship between ESs and GP in the quantitative dimension, represents a deepening of qualitative research, it serves to enhance the scientific basis for sustainable development decisions in the ecological environment and agricultural production, holding a certain degree of positive significance.

1. Introduction

Ecosystem services (ESs) are a crucial foundation for grain production (GP) and a fundamental guarantee of food security, and are widely recognized as such in the academic community [1,2]. As an industry with high consumption of ESs resources [3], GP is directly reliant on the quantity and quality of regional ESs [4]. Among these, the supporting services of ecosystems are the necessary foundation of the conducting of GP activities [1,4,5]. The provisioning services of ecosystems directly supply essential material resources necessary for human survival [4]. GP activities obtain essential nutrients and water resources through the processes of ESs, such as soil conservation, nutrient cycling, gas regulation and climate regulation [6]. Meanwhile, the food chain process of the ecosystem effectively controls agricultural pests [7]. Additionally, it utilizes chemical interactions among organisms to reduce the threat of agricultural diseases [8]. In short, GP activities cannot exist independently of ESs [1,9] and significantly impact the sustainable development of ESs at the same time [2]. However, ESs, as the foundation of GP, are facing a severe test generated by GP itself.
GP can bring benefits to regional ESs, but it also significantly impacts the health of ecosystems. Research indicates that engaging in organic and diversified agricultural practices can significantly boost the richness and vitality of soil microbial communities, elevate soil fertility and overall quality [10], and augment the levels of organic matter within the soil [11]. It can enhance ecosystem water conservation capacity [12] and increase carbon sink capacity [13] and the like. And also, it is essential to maintain the stability of soil structure and improve soil productivity. The interplay between GP and ESs is intricately complex. GP is not merely contingent upon the provision of ESs; it is also a key contributor to the depletion of ESs [2]. Modern GP replaces functions that were originally supplied by ecosystems by increasing inputs such as chemicals and other resources [14]. Crop productivity constraints have been lifted to the maximum extent possible through irrigation, inorganic nutrient addition, crop breeding, mechanical tillage, and pesticide use [6,15]. Agricultural intensification has greatly enhanced the productivity per unit area of agriculture, thereby easing the predicament of food scarcity [15,16]. However, the degradation of ecosystems caused by GP activities has begun to emerge [1,5]. Studies have shown that GP has a certain impact on the upward succession of ecosystems [17]. It impedes ecosystem nutrient cycling such as carbon [13,18], nitrogen and phosphorus [5], and harms biodiversity [19]. Meanwhile, it endangers environmental health [5,20], affects aquatic ecosystem stability [16] and the quantity and quality of water resources [20]. Moreover, it impacts ecosystem climate regulation [20], soil conservation, carbon sinks [21] and enhances greenhouse gas emissions and the like. An increasing amount of research confirms that GP is increasingly threatening the health of ecosystems [21,22]. In summary, GP is greatly affecting the ecological environment and impairing the supply capacity of ESs.
The tension between GP and ESs is intensifying, highlighting the urgent need for collaborative scientific management strategies. Agricultural production activities with GP as the main goal have become one of the main driving forces of global change [5,9,15]. global population growth [23], climate change [24], environmental destruction [25], epidemics, poverty [26], and local military conflicts are all profoundly affecting the stability of GP and the accessibility of food [22,27]. In addition, with the growth of population and consumption, the demand for food will continue to expand, leading to a rapid expansion of the GP industry [5,28]. Food security and the stability of the ecological environment are becoming the key constraints that affect the sustainable development of humanity [2,22]. GP inevitably entails a demand on the ecological environment. However, considering the current situation, the ecological foundation of GP is not promising in many regions around the world, and there is still a considerable gap between the actual food output and the potential output capacity [28]. With phosphorus and other nutrient shortages [25], the tragedy of the commons in ESs is significant [1]. The widespread and extensive use of chemicals [14], and the loss of biodiversity [29], all continue to intensify the contradiction between GP and ESs. Scientific management reduces the negative feedback effect of GP industry activities on the ecosystem, and ensures GP capacity and development potential [20] have become one of the key challenges for the sustainable development of humanity. In summary, GP cannot exist independently of ESs, and its negative impact on ESs is becoming increasingly severe. The importance and urgency of the sustainable development of both GP and the ecological environment are becoming more prominent, and there is an urgent need for scientific coordinated management strategies.
Quantifying the relationship and intensity of ESs on GP is essential for their synergistic and optimal management. ESs support regional GP significantly. Meanwhile, GP reciprocally affects the structure, function, and processes of the regional ecosystem [6]. Currently, the role, mechanisms, and processes of ESs in relation to GP have been widely studied from a qualitative perspective. However, quantitative research on the contribution of ESs to GP, the intensity or efficiency of their role, is still relatively lacking [6,30]. Additionally, there are relatively few studies on the synergistic or tradeoff relationship between individual or multiple ESs and GP yield and quality [31]. In addition, the increasing negative impact of ecosystem degradation caused by human activities on the global food security pattern [1,2], has made it increasingly urgent to scientifically address the contradiction between the ecological environment and GP, and to ensure the coordinated development of the ecological environment and GP, which intensifies the necessity and urgency of quantitatively understanding the intensity and efficiency of the role of ESs in GP. Overall, under current circumstances, there is an urgent need for scientific collaborative management strategies to address the increasingly severe conflicts between GP and ESs.
In summary, as one of the important foundations of GP, ESs are increasingly under pressure in the relationship with GP. This study attempts to analyze the foundational supportive role of ESs in GP from a quantitative perspective, to enhance the scientific and objective understanding of their relationship. At the same time, taking the tradeoff relationship between the two as the entry point, it provides data and theoretical support for the scientific formulation of sustainable development strategies for both.

2. Materials and Methods

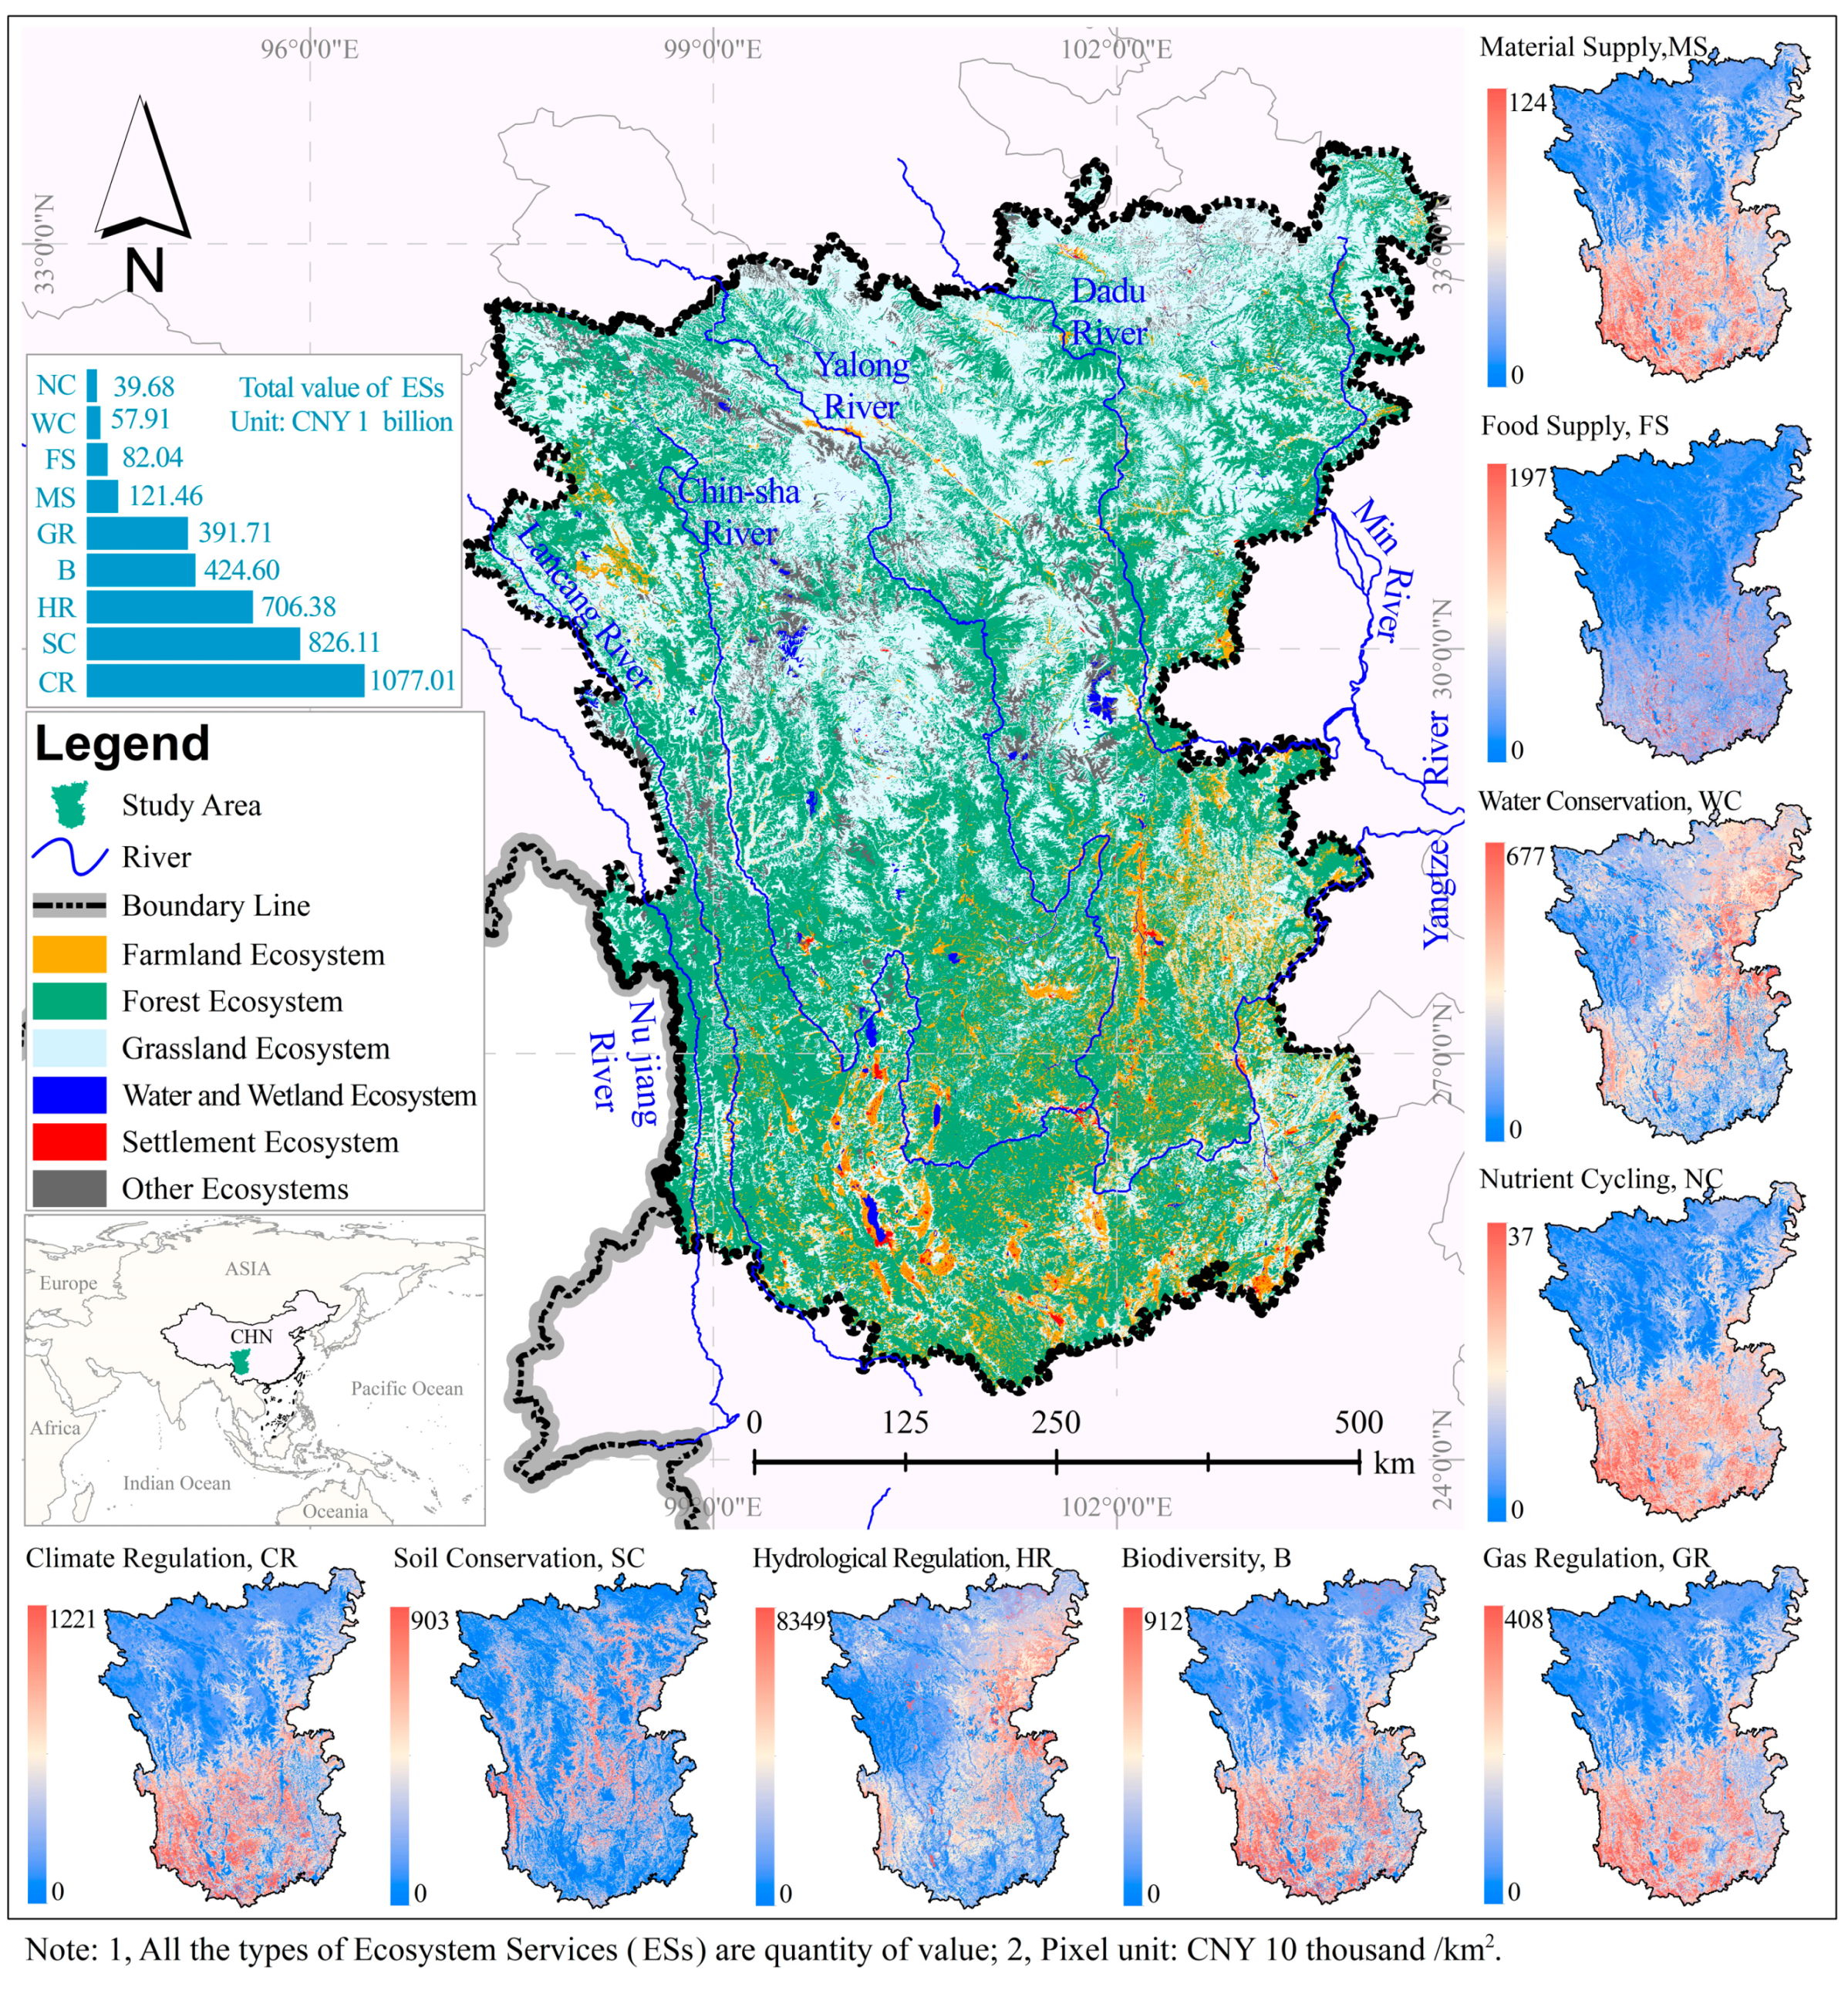
2.1. The Study Area Overview

The Hengduan Mountainous Region (HMR) is situated in the southeastern part of the Qinghai-Xizang plateau and is located at 24°30′–33°43′ N and 97°10′–104°25′ E, spanning an area of approximately 44.98 × 10⁴ km2. This covers three provinces, namely Sichuan, Yunnan, and Xizang, and includes 99 county-level administrative units (Table 1), accounting for 4.69% of China’s land area. The northern part of the HMR has high mountains and deep valleys, while the southern part is relatively flat, with an average elevation of over 4000 m. The annual average precipitation ranges from 487.7 to 2066.3 mm. This region has abundant water resources due to the distribution of the Nu jiang River (after flowing into Myanmar, it is known as the Salween River), the Lancang River, the Chin-sha River, the Yalong River, the Dadu River, and the Min River. The ecosystems of the HMR are predominantly composed of forest and grassland ecosystems, which account for 87.68% of the total area. Influenced by factors such as terrain and topography, agricultural ecosystems are relatively dispersed in the southern region of the HMR. The supply of ESs generally exhibits a spatial distribution pattern where there is a higher abundance in the south compared to the north, and in the east compared to the west. The total value of various ESs provided amounts to CNY 3726.89 billion. The climate regulation services (CR) are valued at CNY 1077.01 billion, while soil conservation services (SC) amount to CNY 826.11 billion, together accounting for 51.06% of the total supply. In contrast, the provision of material resources (MS), food supply (FS), water conservation (WC), and nutrient cycling (NC) services only make up 8.08% of the total supply, highlighting the significant imbalance in the distribution of ESs in the HMR (Figure 1). Simultaneously, the HMR is also one of the key areas in China where social and economic development is relatively lagging. The northern part of HMR, constrained by terrain and other factors, has relatively backward social and economic levels, while the south is comparatively more developed. The industry is primarily agricultural. Due to the influence of natural, social, and economic factors, there is a significant disparity in grain yield (GY) and capacity among the counties. In 2020, 34.34% of the counties in HMR had GY exceeding 100 thousand tons, with the highest producing county reaching over 460 thousand tons. However, there are still 13.13% of counties where GY is less than 10 thousand tons. Overall, the GP methods in the HMR are relatively traditional, with a strong dependence on the ecological environment, and there is a clear conflict between GP and the ecological environment.

2.2. Data Sources

The data used in this study primarily includes information on the main types of ESs, land use, and GY of counties within HMR (Table 2). According to the official website, as of 18 December 2023, the ecosystem service data and land use data [32,33] have been downloaded a total of 118,600 times. The reference index on China National Knowledge Infrastructure (CNKI) (https://www.cnki.net/) (accessed on 18 December 2023) shows that the data have been cited 4400 times, indicating that they have been tested and verified by a large number of studies in the relevant fields, demonstrating strong scientific validity and authority. The GY data of counties represent an authoritative dataset released by the state and are generally considered credible. To facilitate calculation and analysis, the ESs data are accounted for in monetary terms (unit: CNY), and the GY data are accounted for in physical quantity (unit: tons).

2.3. Methodology

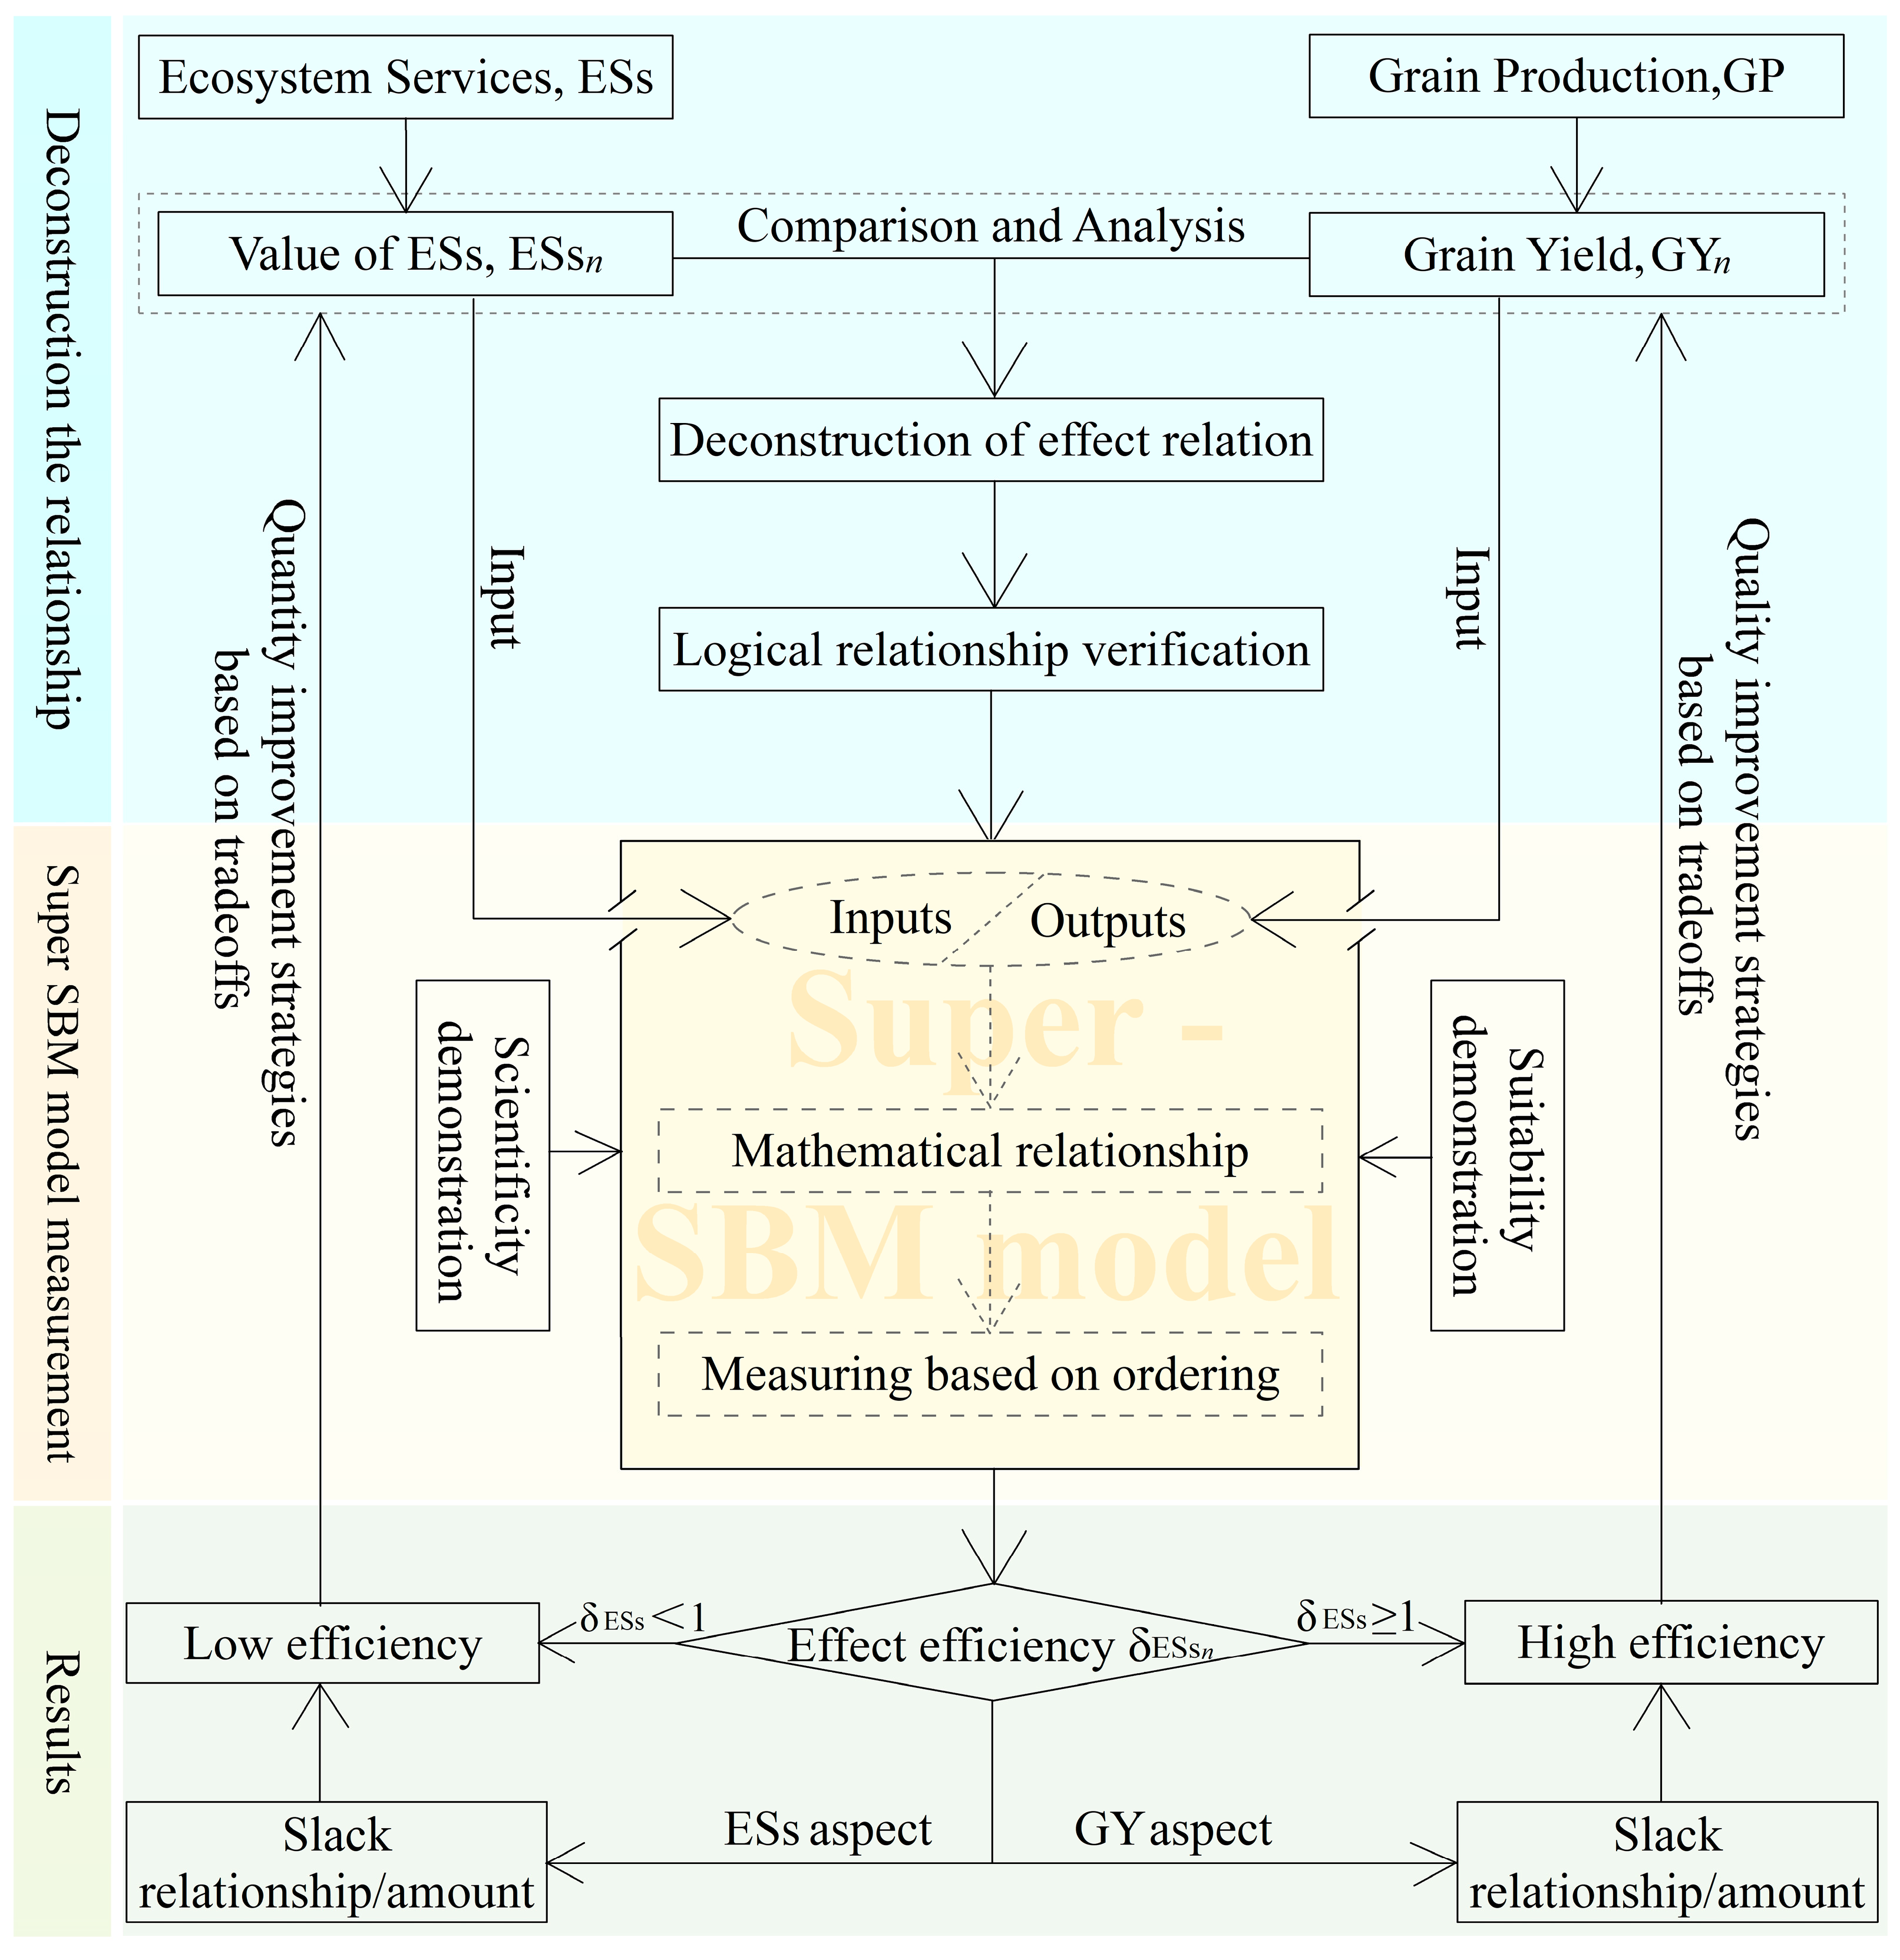
2.3.1. Logical Framework and Technical Approach

This study aims to propose a scientific method to quantify ESs’ efficiency in supporting GP, in order to contribute to the coordinated development of ecological and food security. It mainly covers four aspects: (1) the deconstruction of the relationship between regional ESs and GP, simplifying the complex GP process into a simplified input–output issue; (2) the introduction of the Super-SBM model based on slack measurement to assess the support efficiency of ESs for GP in the study area; (3) the validation of the measurement method’s scientific basis, appropriateness, and effectiveness; (4) the analysis of the interaction and support efficiency between ESs and GP, and the proposal of optimization strategies for tradeoff ecological environment and GP. The specific research process is depicted in Figure 2.

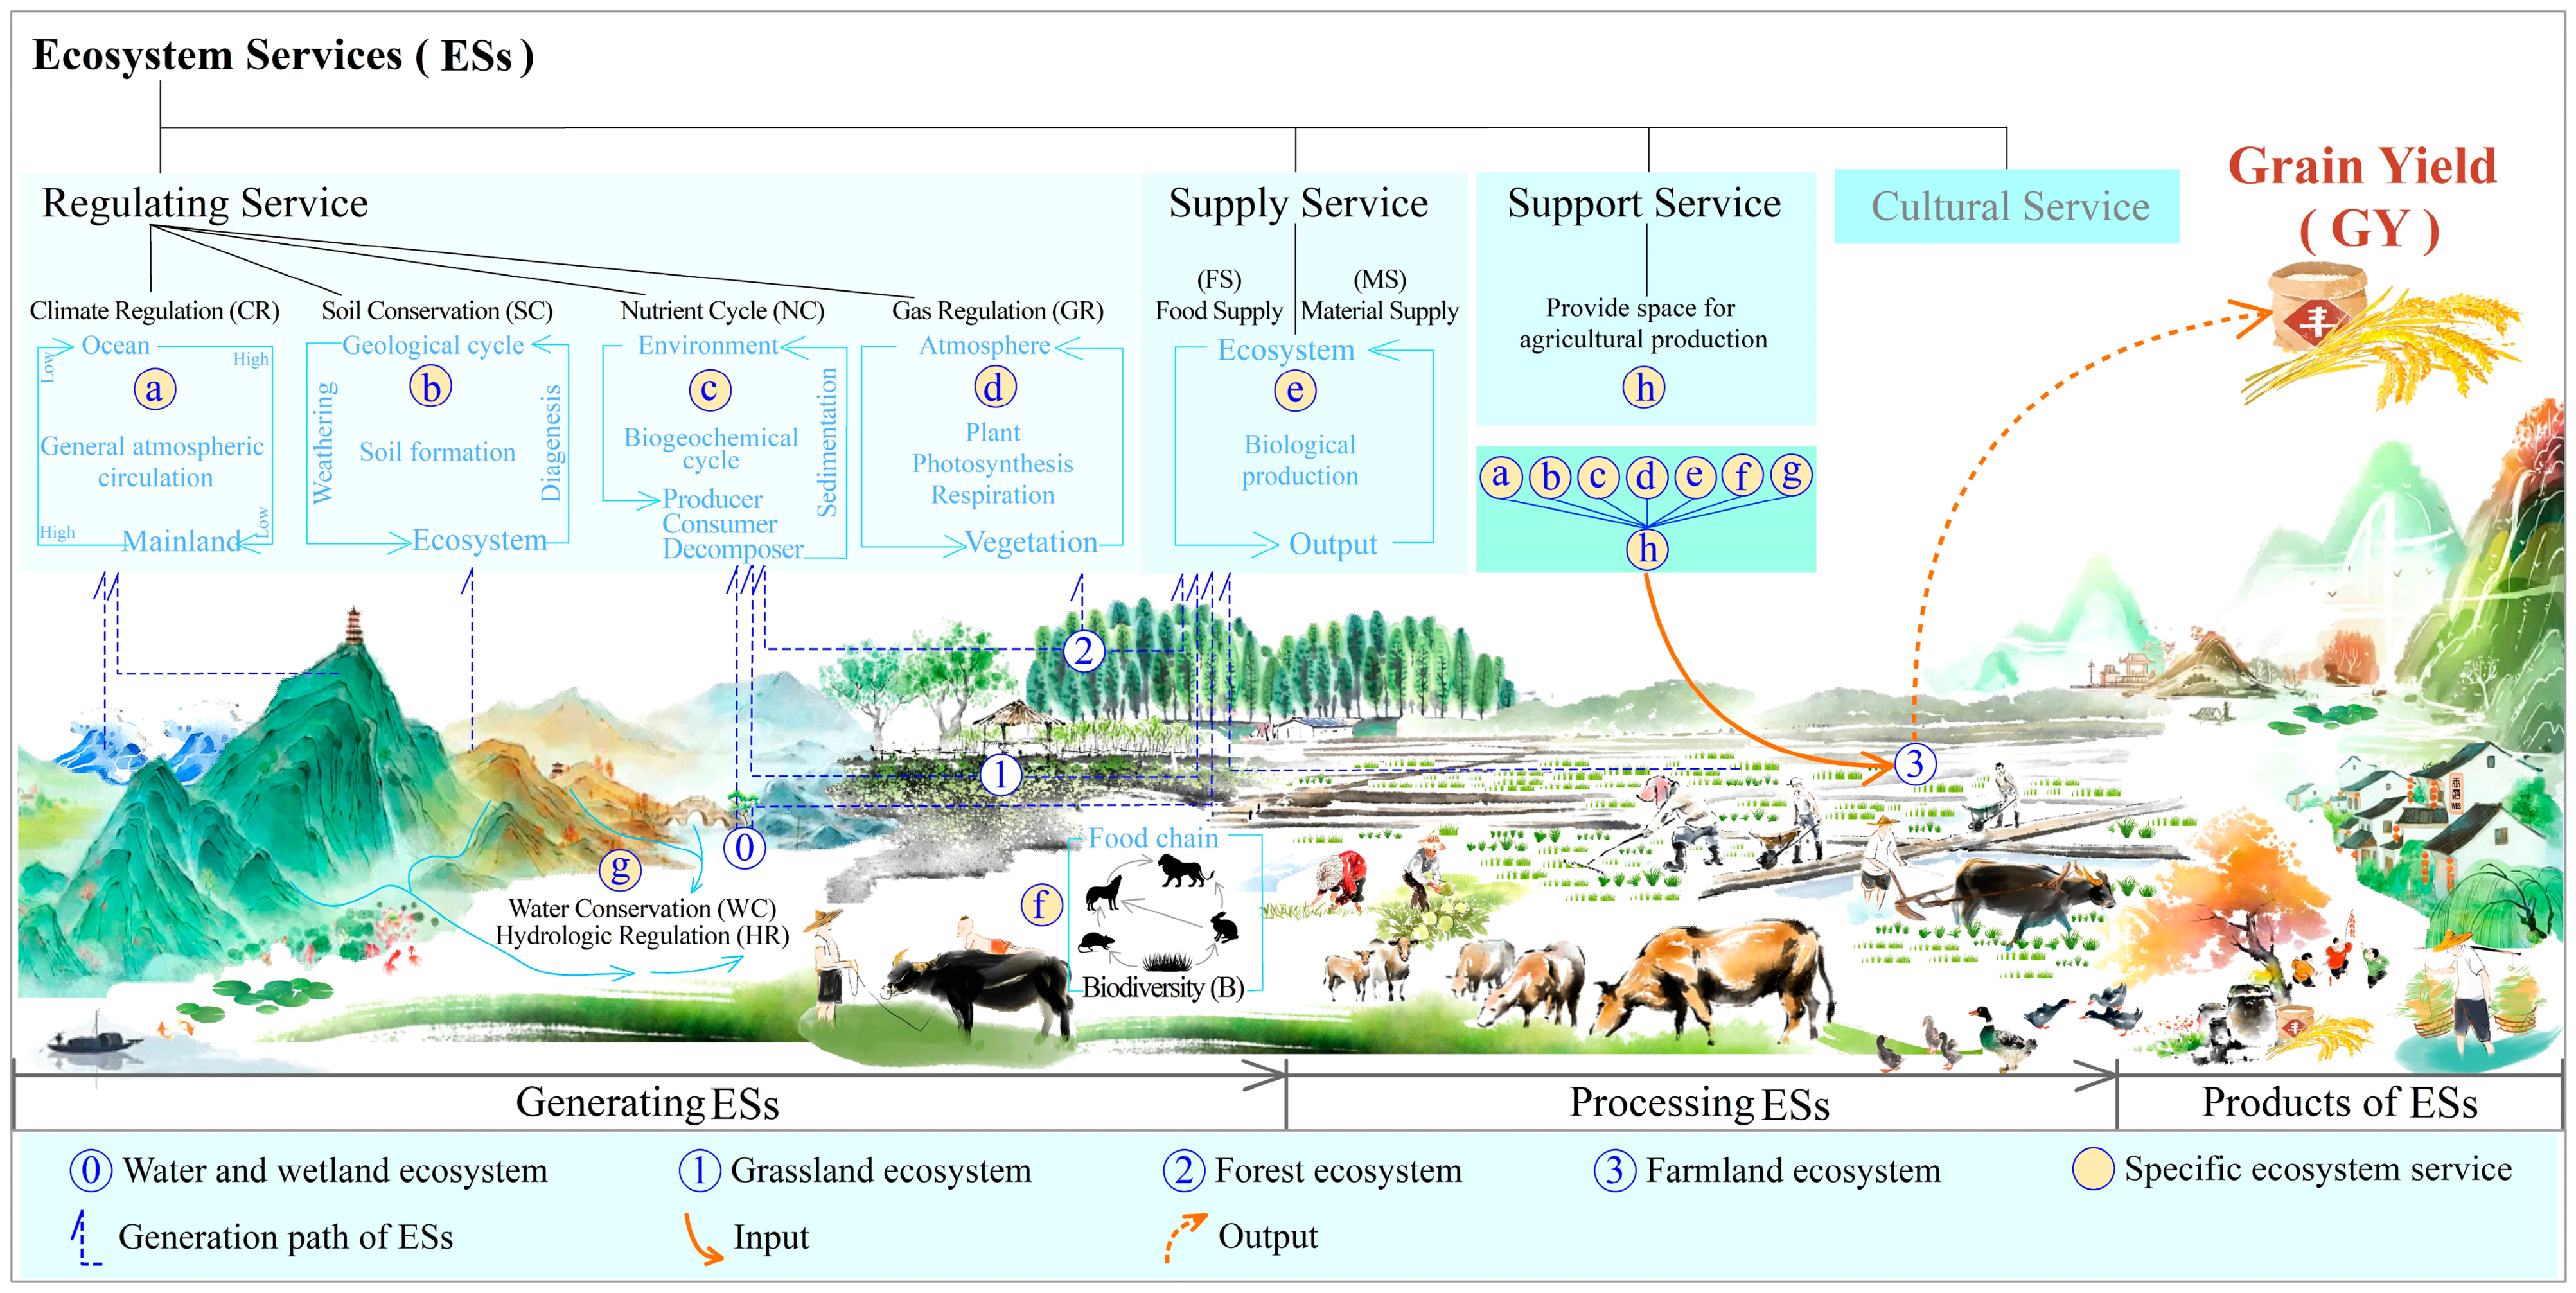
2.3.2. Deconstruction of the Role Mechanism of ESs in GP

ESs serve as a necessary foundation for GP, their role in GP is a composite process. As defined by Costanza et al. [34], ESs are the benefits that humans derive from ecosystems. These benefits are primarily manifested in the aspects illustrated in Figure 3: (1) Ecosystem support services are the foundation that underpins all human production and living activities and are essential for the existence and development of GP [5,35]. (2) GP is inevitably based on the suitable climate environment generated by ecosystem climate regulation services [6]. (3) The water supply generated by water conservation services is a necessary foundation for GP [36]. (4) Soil formation and conservation is another indispensable condition for GP [35]. (5) Biodiversity services control agricultural pests through the food chain to a certain extent [7]. (6) Based on gas regulation services, plants accumulate and cycle nutrients through photosynthesis and respiration [37]. (7) Ultimately, the various types of ESs mentioned above affect the GP process by impacting the ecosystem supply services, thereby forming an influence on the supply of GP (indicated by grain yield, GY). Overall, GP is an industrial form based on supporting services, relying on regulating services, and achieved through supply services [1,6,9]. In other words, GP relies on the supply of various Ess; therefore, this study takes ESs as inputs and GY as outputs, abstracting the complex GP process into a simple input–output issue, and introducing efficiency measurement methods from economics to measure the efficiency of ESs in supporting GY.
Integrating the aforementioned and other relevant findings, and based on the deconstruction of the relationship between ESs and their role in GP, this study has comprehensively identified nine categories of ESs that have a significant impact on GP: (a) climate regulation (CR); (b) soil conservation (SC); (c) nutrient cycling (NC); (d) gas regulation (GR); (e) food supply (FS); (e) material supply (MS); (f) biodiversity (B); (g) water retention (WR); and (g) hydrological regulation (HR) (Figure 3). These categories serve as the foundational elements for the research on the supporting efficiency relationship between ESs on GP.

2.3.3. Basic Simulation Logic of the Super-SBM Model

The Super-SBM model is utilized in this research for the supporting efficiency of ESs on GP. The Super-SBM model was developed by Kaoru Tong in 2001, based on the Data Envelopment Analysis (DEA) model originally created by Charnes and colleagues [38]. It is based on the stochastic frontier production function as the fundamental principle [28], which is typically used for measuring the efficiency relationships between multiple input and output factors in production processes [39]. The Super-SBM model has been extensively applied in multiple domains currently, showing strong adaptability. The Super-SBM model has not only been widely used in research on the efficiency of traditional industrial production [40], low-carbon economy [41], and energy production [42], but it has also been introduced into the efficiency measurement studies in areas such as atmosphere and environment [43], carbon emission reduction [44], ecological efficiency [45], policy efficiency [46], fiscal subsidies [47], green and innovative development [39] and other sectors. There are also relevant studies that have analyzed and calculated the gap between global GP and potential based on the principle of the stochastic frontier production function and found a significant correlation between food production efficiency and irrigation, market influence, labor force, and regional slope [28]. In summary, the Super-SBM model is a well-established tool for measuring the intensity of complex relationships and has been extensively applied in multiple fields, demonstrating excellent adaptability. This provides a feasible basis for introducing it into the research on measuring the efficiency of the role of ESs in GP.
The efficiency measured by the Super-SBM model refers to the analysis and measurement of the relative position and distance between decision-making units (DMUs) and in essence, the efficient frontier. The Super-SBM model involves two main aspects: DMUs and the efficient frontier. DMU refers to the elementary unit used for measurement, while the efficient frontier refers to the multi-dimensional space formed by the efficient DMUs [38,48]. The efficiency is measured by detecting the relative position and distance from the DMUs to the efficient frontier. The Super-SBM model is a non-parametric approach for measuring the relative efficiency of the input and output processes of multiple DMUs [48]. The basic principle is as follows: taking single-factor inputs and outputs as an example (Figure 4). The Super-SBM model initially determines the relative position of each DMU (A, A’, B, C) by utilizing the mathematical relationships (δ) between inputs (x) and outputs (y). Subsequently, the set of relative positions of the DMUs with δ = 1 is taken as the efficiency frontier. Then, the efficiency of each DMU is determined based on its relative position to the efficient frontier. The DMUs (A and A’) are considered efficient when δ = 1, and the DMU (C) is super-efficient when δ > 1. Otherwise, the DMU (B) is considered to have low efficiency when δ < 1. Concurrently, the Super-SBM model measures the slacks ( h B 1 z , h C 1 z ) between inputs and outputs by calculating the distance of each DMU to the efficient frontier, serving as a basis for tradeoff in optimizing strategies between inputs and outputs [38,48]. Ultimately, in research based on the Super-SBM model, the simulation of the efficient frontier necessitates a significant number of DMUs to ensure its effectiveness and precision to the greatest extent [48].

2.3.4. Simulation Method of the Super-SBM Model

The Super-SBM model is an improved model based on the SBM model, comprised of two merged simulation stages [49]. Starting from the general issue of an input–output problem, the number of DMUs is n, each DMU is constituted by an input vector (x) and an output vector (y). Assuming that m types inputs are put into DMUj and s types of outputs are produced, the inputs are denoted as x j ,   ( x j = x 1 j , , x m j ) , and the outputs are represented by y j ( y j = y 1 j , , y s j ) . Assuming that m > 0, and s > 0, the production possibility set (PPS) can be defined as follows (Equation (1)):
P P S x , y = x , y x j = 1 n λ j x j ,   y j = 1 n λ j y j , λ j 0 , j = 1 , , n R + m + s
Theoretically, PPS includes all possible activities of all DMUs, the efficient DMUs are usually located on the boundary of PPS, while low-efficiency DMUs are located elsewhere. Based on this general principle, the SBM model was proposed by Tone [38], which is used to measure the efficiency relationship between inputs and outputs of DMUs. This is the first stage, and the simulation method is described as follows (Equation (2)):
δ E S s n = m i n 1 1 m i = 1 m s i x i n 1 + 1 s r = 1 s s r + y r n   ,       s . t . j = 1 n λ j x i j + s i = x i n               i = 1 , , m j = 1 n λ j y r j s r + = y r n             r = 1 , , s λ j , s i , s r + 0                               j , i , r
The SBM model is applicable to the measurement of efficiency values for DMUs with an efficiency range of 0 < δ ≤ 1 [38], as illustrated in Figure 4 the DMU A, A’, and B. However, this is not applicable for the DMUs with δ > 1, in such cases, it is necessary to employ the second simulation stage; the methodology can be described as follows (Equation (3)):
δ E S s n = m i n 1 m i = 1 m x i ¯ x i n 1 s r = 1 s y ¯ r y r n ,   s . t . j = 1 j n n λ j x i j x ¯ i ,                           i = 1 , , m j = 1 j n n λ j y r j y ¯ r ,                           r = 1 , , s x i n x ¯ i     i ,     y r n y ¯ r     r ,   λ j , y ¯ r 0     j , r
where δ E S s n denotes the supporting efficiency of ESs in contributing to GY; λ represents the intensity variable; s i and s r + , respectively, represent excess and deficiency, which are the slacks of the model. The positivity or negativity of slacks correspond solely to the high or low efficiency of DMUs. When δ E S s n < 1 , the slacks are positive, the slack of input indicates the amount by which inputs can be reduced, while the slack of output indicates the amount by which output can be increased under the current efficiency level. Conversely, when δ E S s n 1 , the slacks are negative, the slack of input represents the amount by which inputs can be increased, while the slack of output indicates the amount by which output can be decreased at the current level of efficiency [48,50].
The following basic simulation conditions are established in the simulation process in this study: (1) taking the counties in the HMR as DMUs (Table 1); (2) taking the value of ESs (Table 3) supply as the input factors (x) and GY as the output factor (y); (3) the simulation is conducted using the current period; (4) it is assumed that there are constant returns to scale between inputs and outputs; (5) the simulation is conducted without a specified input–output orientation.

2.3.5. Justification for the Suitability of the Modeling Approach

The methodology aligns with the Super-SBM model’s logic, possessing a scientific basis. The simulation process of the Super-SBM model is essentially a black-box process [49,51], suitable for studying the efficiency of complex interactions between multi-type inputs and outputs [48]. This research takes multi-type ESs as inputs and GY as the output, abstracting their complex interrelationship into a black-box process to simulate the supporting efficiency of ESs on GY, which is in line with the basic logic of the Super-SBM model.
The methodology adheres to the requirements of the Super-SBM model. The measurement process requires a large number of DMUs to ensure the scientific validity and rationality of the results [51]. This study encompasses a total of 99 DMUs (Table 1), which is sufficiently large to meet the Super-SBM model’s demand for the quantity of DMUs.
The supporting efficiency of ESs on GY aligns with the objective rules and fundamental characteristics of GP. This study introduces the grain production efficiency from a more objective perspective to further validate the effectiveness and scientific nature of the supporting efficiency. The production efficiency of grain is the result of the combined effects of various elements, including natural, social, and economic factors. Generally speaking, the stronger or weaker this composite effect is, the higher or lower the corresponding grain production efficiency will be. The supporting efficiency of ESs for GP should typically follow the same basic pattern of change as the grain production efficiency. Based on the above objective laws, this study has calculated the grain production efficiency at the county level in the HMR. The specific calculation method is as follows (Equation (4)):
R n = G Y n F A n
where R represents the grain production efficiency; GY represents the total grain yield; FA denotes the total area of agricultural land (including paddy fields, dry land, and all other land used for GP); n indicates the number of counties. Based on the correlation analysis method, the analysis of δ E S s n and R n revealed that δ E S s n and R n show a significant positive correlation at the 0.001 level, with a correlation coefficient exceeding 0.6. This implies that δ E S s n and R n maintain the same pattern of variation, with R n increasing as δ E S s n rises and the relationship holds true in reverse as well. In summary, the variation pattern of δ E S s n is consistent with the basic laws and general characteristics of GP.
Overall, the process by which ESs contribute to GP aligns with the fundamental patterns of input–output relationships. The Super-SBM model is one of the more effective methods for studying input–output efficiency issues in economics and operational research, and it has a certain rationality when applied to the study of the supporting efficiency of ESs on GP. Moreover, the research content and methodology established in this study are aligned with the requirements for measurement with the Super-SBM model, and the results also correspond with the objective realities and general patterns. Therefore, the application of the Super-SBM model to measure the supporting efficiency of ESs for GP is both feasible and scientifically sound.

3. Results

3.1. The Efficient Frontier of ESs to GP

ESs exhibit a relatively low level of support for GP in most counties of the HMR. According to the efficiency frontier of ESs on GP (Figure 5), 93.94% of the counties in HMR exhibit a low supporting efficiency ( δ E S s n ) of ESs to GP, while only 6.06% are in an effective or super-efficient state. Notably, Xiangyun County in Yunnan Province, Xichang City and the Dong District of Panzhihua City in Sichuan Province constitute the efficiency frontier for ESs supporting GP in the HMR. Meanwhile, Huize County, Midu County in Yunnan Province and the West District of Panzhihua City in Sichuan Province exhibit super-efficiency status, the remaining counties exhibit low efficiency. Specifically, counties with δ E S s n ≤ 0.4 account for 67.68% of the total counties in HMR. From the perspective of ESs utilization, the majority of counties in the HMR have a low level of GP and are lagging in development.
The efficiency frontier of ESs for GP in the counties of HMR conforms to the objective reality of regional GP. From the perspective of GY, Xiangyun County and Huize County in Yunnan Province, and Xichang City in Sichuan Province are counties with relatively high GY, all with outputs exceeding 200 thousand tons, with Huize County reaching up to 462.3 thousand tons. In terms of grain production efficiency ( R n ), Xianyun County and Huize County in Yunnan Province, Midu County, and the Eastern and Western districts of Panzhihua City are counties with relatively high R n , which can reach more than 400 tons per square kilometer. Considering the aforementioned dimensions, the efficiency frontier measured by the Super-SBM model conforms to the objective reality of regional GP and can reflect the basic characteristics of regional GP.

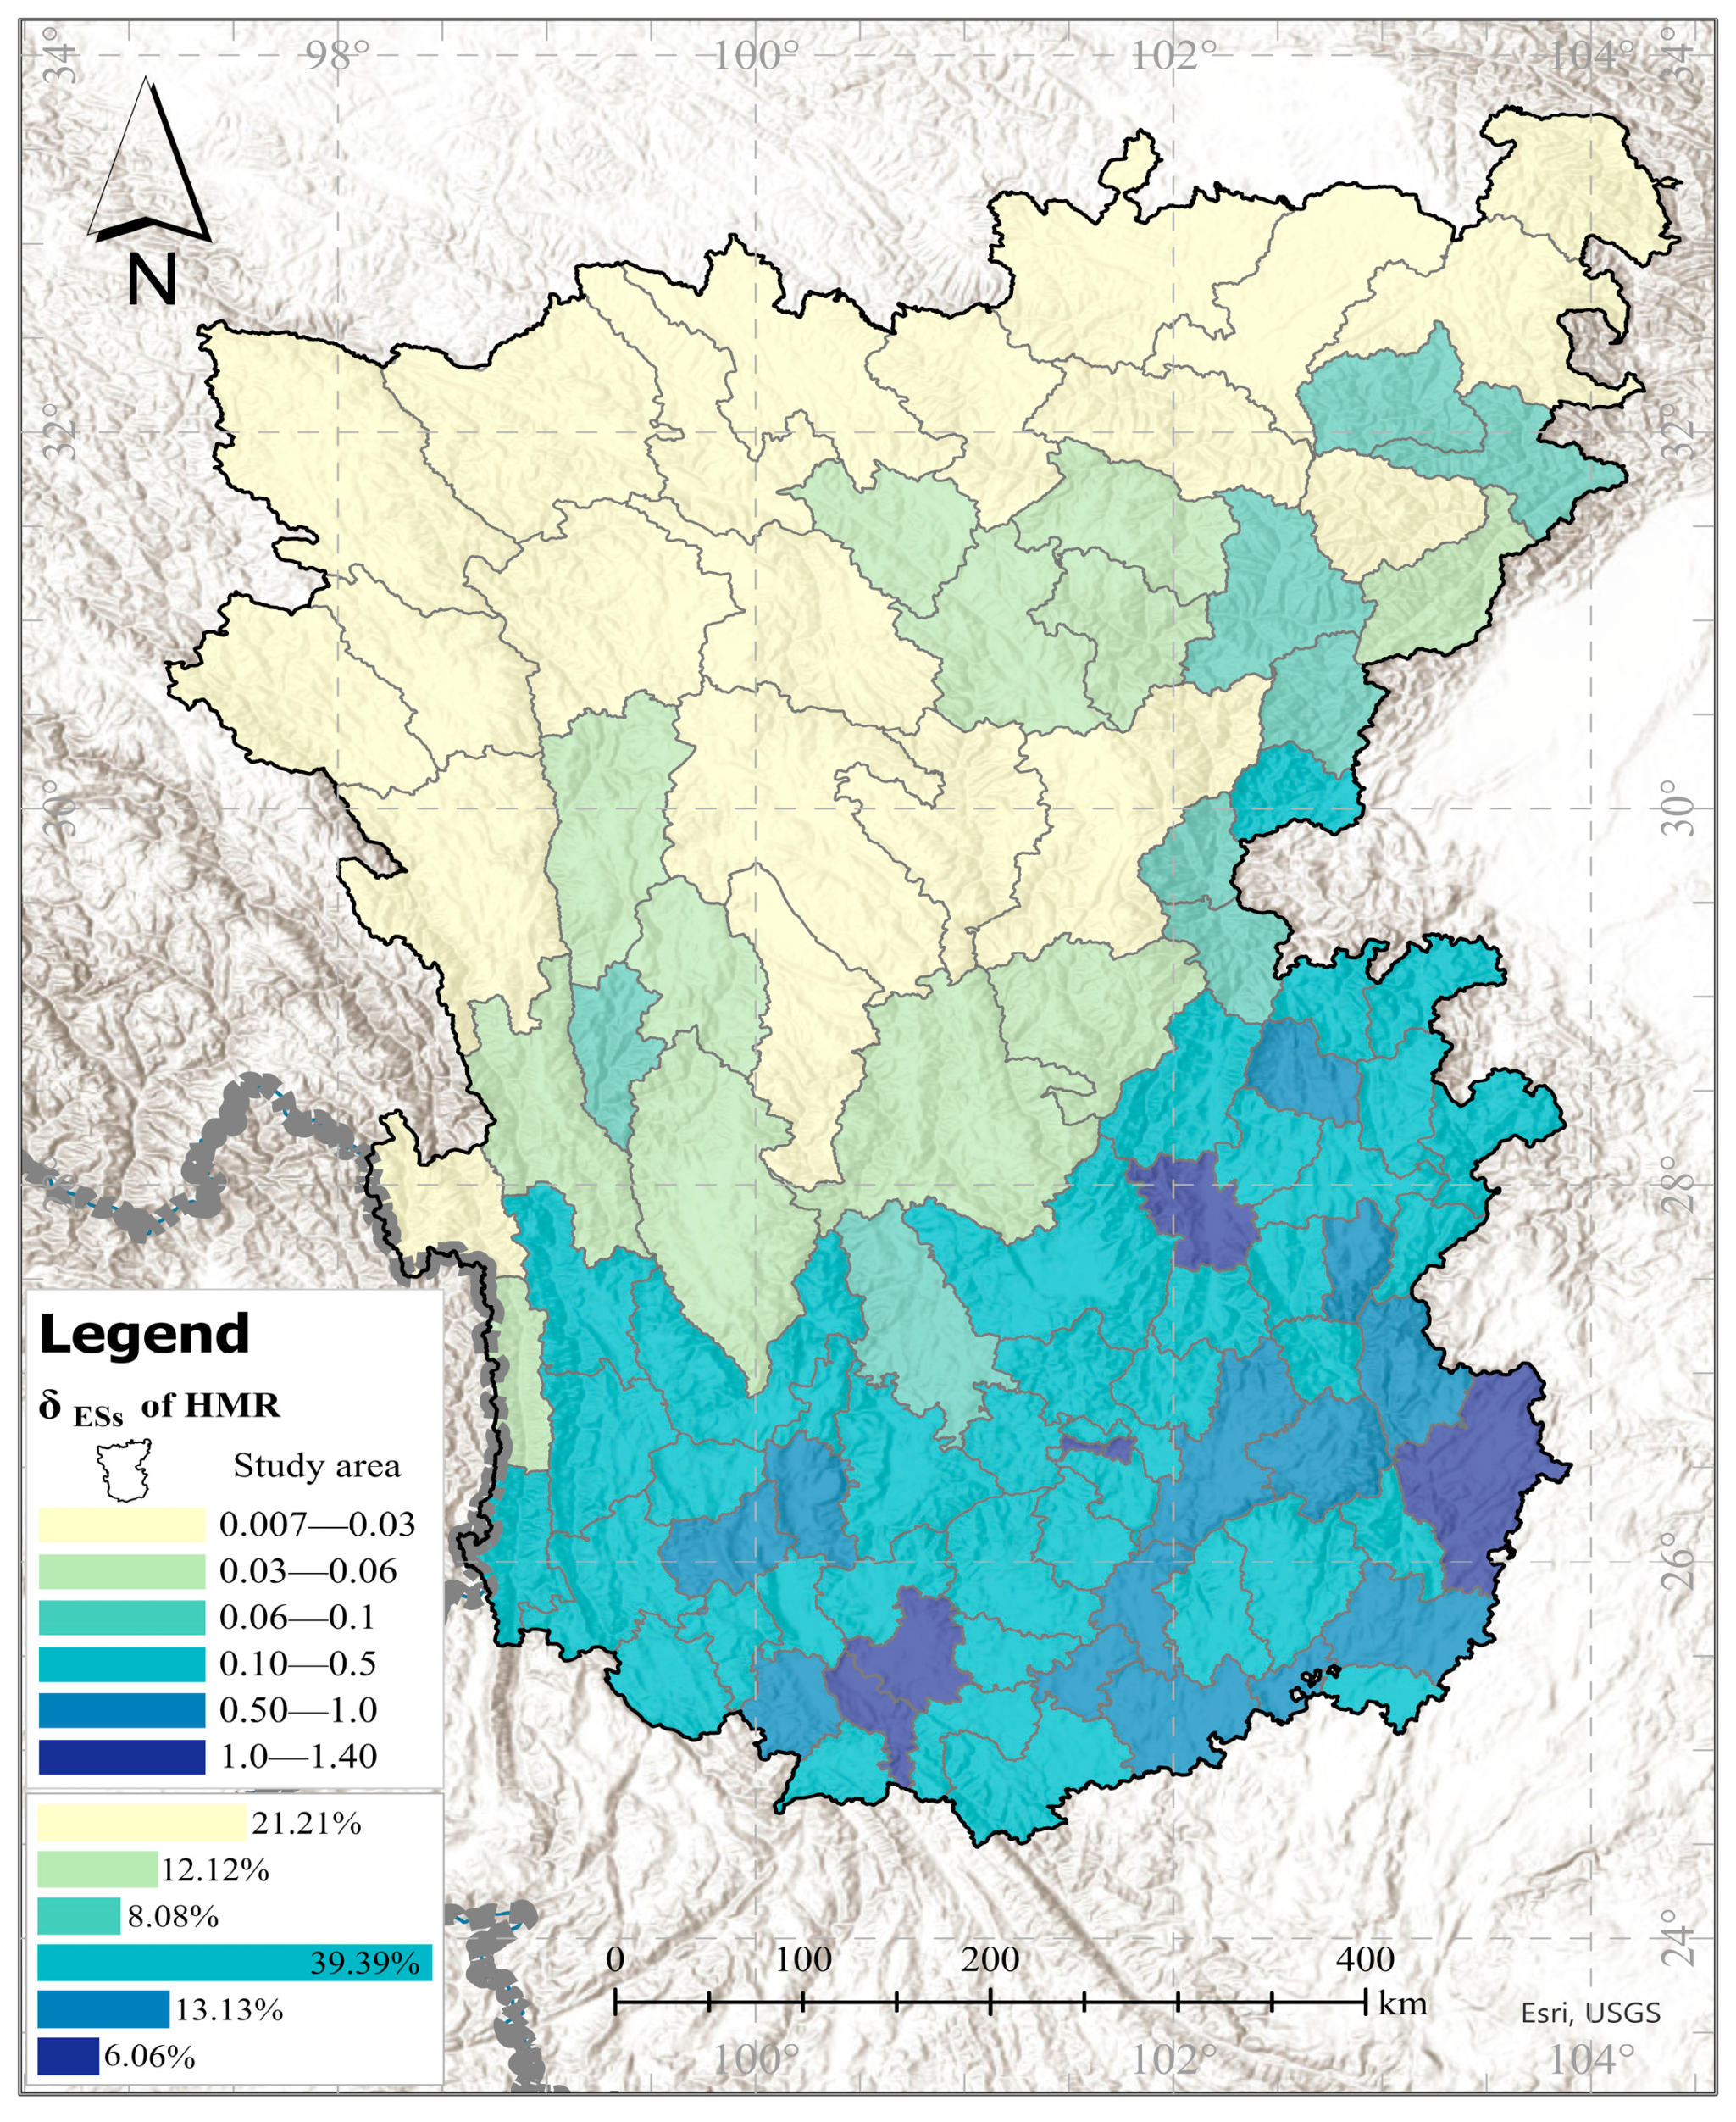
3.2. Supporting Efficiency of ESs to GP

The δ E S s n in the HMR generally exhibits a spatial distribution pattern of being higher in the south and lower in the north. In the northern counties, the δ E S s n is mostly below 0.06 accounting for 33.33% of the total counties. Notably, the δ E S s n is mostly below 0.01 in the northwestern region of the HMR, with the lowest value being only 0.007 (Seda County in Sichuan Province). In contrast, the δ E S s n in the southern counties is relatively higher, often above 0.06. Counties with δ E S s n values between 0.06 and 0.1 make up 39.39% of the total number of counties. Additionally, among the southern counties, six counties have δ E S s n values that exceed 1.0. Among them, Huize County in Yunnan Province has a δ E S s n reaching 1.40, which is the highest δ E S s n in the entire HMR (Figure 6). From the analysis of the differences in extreme values, the δ E S s n ranges from a high of 1.40 to a low of 0.007, showing a disparity of over 200 times, which indicating that there are huge gaps in the capacity and level of utilization of ESs for GP among counties in the HMR. Overall, the δ E S s n in the HMR markedly presents a differentiated spatial distribution pattern with a stronger efficiency in the south and a weaker one in the north, most counties have a low level of ESs utilization and insufficient capacity to GP, which may be one of the main factors impeding the development of regional agriculture.
The supporting efficiency of ESs for GP in HMR aligns with the spatial distribution patterns of the area’s natural, social, and economic conditions. The δ E S s n depends not only on the total amount of ESs supply but is also greatly influenced by various factors such as regional population, labor force, types of industries and their development status, and economic scale. In terms of spatial distribution, the southern part of HMR features relatively flat terrain, and a solid foundation for agricultural industry development. The population is concentrated, establishing a relatively good industrial base and technological level, making it an area with relatively high levels of social and economic development. Comparing the spatial pattern of δ E S s n (Figure 6), it can be observed that δ E S s n is generally consistent with the spatial distribution of the region’s social and economic patterns. Overall, the δ E S s n measured by Super- SBM model conforms to the general patterns demonstrated by the region’s social and economic conditions.

3.3. Slacks in ESs and GP

There is a notable issue of spatial misallocation between the supply of ESs and the demand for GP in the HMR. Based on the implications of slack in the Super-SBM model, and in conjunction with the spatial pattern of slack in GY and the supply of ESs in the counties of the HMR (Figure 7), there is a severe slack in GY in the northern counties, with the slack being 120 thousand tons or more, and the maximum reaching 179.4 thousand tons, this indicates a significant potential for GY increase and a correspondingly large demand for ESs. However, the supply of ESs in the northern counties is relatively limited (Figure 1). In contrast, the central and southern counties have a smaller slack in GY overall, with less demand for ESs in GY. However, the supply slack of multiple types of ESs in the central counties is relatively large, exhibiting a state of oversupply. Among them, the supply slack of soil conservation services is the greatest, amounting to CNY 41.763 billion. Overall, there is a spatial mismatch in the supply–demand relationship between ESs and GY between the northern and the central counties. Based on the analysis of the extreme values of slack, in the counties with low value of δ E S s n (accounting for 93.94% of the total counties in the HMR), the maximum slack in GY is 179,400 tons, while the minimum slack in the supply of ESs is zero, highlighting a significant disparity and further emphasizing the imbalance between the supply and demand of ESs and GY. Integrating the patterns of input (Figure 1) and slack (Figure 7), there is a significant spatial mismatch between the supply of ESs and the demand for GY in the HMR, establishing the fundamental relationship of imbalance between the supply and demand of ESs and GY in the counties of HMR.

3.4. Classification of Tradeoffs Based on Slack Relationships

A significant tradeoff relationship is evident between the supply of ESs and GY. Among the 93 counties with low value of δ E S s n   in the HMR , 83 counties (excluding 10 counties with the slack of 0) have a slack state in GY, with an increase space of 0.63 to 17.94 × 10⁴ tons, this indicates that there is an insufficiency in GY in these counties. There are 71 to 93 counties that have a slack state in the supply of ESs, with a reduction space of CNY 0.02 to 41.76 billion, indicating that there is an excess of ESs inputs in these counties. Meanwhile, in the counties with effective or high efficiency δ E S s n , there is up to a 12.32 × 10⁴ tons reduction pressure in GY and an additional demand of CNY 1.81 billion for ESs (Figure 7). Overall, there is a significant supply–demand conflict between ESs and GY, and coupled with spatial mismatch, this conflict underscores the need for sustainable development strategies focused on the ecological environment and GY. These strategies should be informed by a scientific analysis of the tradeoff relationship between ESs and GY.
The tradeoff relationship is an overall reflection of the level of conflict between ESs and GY. The slack relationship in the Super-SBM model reflects the sufficiency of input and output elements. Based on the slack relationship between ESs and GY, all counties in HMR are categorized into three types of tradeoff relationships: no tradeoff, weak tradeoff, and strong tradeoff (Table 4). Regarding the slack relationship, when both the slack of GY and the supply of ESs are positive (Slack > 0), GY has a high growth potential, and the supply of ESs is relatively abundant. The conflict between GY and the supply of ESs is relatively minor, and the tradeoff relationship is not obvious. Therefore, in this type of county, GY and the supply of ESs exhibit no tradeoff relationship (I). When there is no slack in GY (Slack = 0), the pressure of GY on the supply of ESs begins to appear, leading to certain conflicts. In this type of county, GY and the supply of ESs exhibit a weak tradeoff relationship (II, III). When the slack of both GY and ESs supply is negative (Slack < 0), there is significant pressure on both GY increase and ESs supply, with notable conflicts. In this type of county, GY and the supply of ESs exhibit a strong tradeoff relationship (IV). The classification results show that among these counties, 83 counties have a high potential for GY increase and low pressure on ESs supply, indicating no significant tradeoff relationship between ESs supply and GY. There are 15 counties that exhibit relatively small potential for GY increase and ESs supply pressure, showing a weak tradeoff relationship. Additionally, there is a county that has relatively high pressure for both GY increase and ESs supply, presenting a strong tradeoff relationship. Overall, the majority of counties show no tradeoff relationship between ESs and GY in the HMR, with no significant conflict. However, there are still some counties exhibiting varying degrees of conflict, indicating a certain level of pressure in the tradeoff between ESs and GY.

3.5. Optimized Strategies Based on Tradeoff Relationships

The scientific assessment and categorization of tradeoff relationships provide a foundation for the better realization of scientifically optimizing development strategies for ESs and GY. In the aforementioned discussion, this study categorized the tradeoff relationships of all counties in the HMR based on slack relationships (Table 4). For the purpose of facilitating analysis, this study selects four typical counties with different slack relationships as case studies, including Seda County, Mianning County, Midu County, and Huize County (Table 5). They are used to analyze the optimization of sustainable development strategies for ESs and GY under different slack relationships.
Seda County exhibits the I slack type (Table 4 and Table 5). This county has a low supporting efficiency ( δ E S s n   = 0.07). The potential for GY increase reaches 17.94 × 10⁴ tons, while all types of ESs show a state of supply redundancy, and there is no significant tradeoff relationship between the supply of ESs and GY. Counties of this type have a good ecological environment foundation, but their GP level is still in an early stage. If guided by a priority on GP, moderately expanding the scale of GP in such counties could achieve an increase in GY with minimal ecological and environmental costs. This strategy has no technical barriers, low economic costs, and can well fit the relatively backward social, economic, and technological background of this type of county.
Mianning County exhibits the II slack type (Table 4 and Table 5). This county has a low supporting efficiency ( δ E S s n = 0.44), and there is a certain amount of slack in the supply of ESs, but the slack in GY is zero, suggesting limited potential for GY increase. In counties with the II slack type, there is already a certain degree of tradeoff relationship between GY and ESs. Although the supply of ESs is superfluous, there is still a certain level of pressure on GY increase under the existing productive conditions. If guided by a priority on GP, for counties of this type, GY could be enhanced by slightly expanding the scale of GP. However, a greater focus should be placed on improving the level and capability of utilizing ESs in existing GP activities. By increasing the efficiency of utilization, the goal of increasing GY can be achieved with relatively low ecological and environmental costs, thus ensuring the sustainable development of ESs and GP.
Midu County exhibits the III slack type (Table 4 and Table 5). Which expresses a super-efficient supporting level ( δ E S s n = 1.35), and the overall supply of ESs is insufficient, and the potential for GY increase is limited, presenting a weak tradeoff state. GY increase and the supply of ESs both face pressure to varying degrees. From the perspective of sustainable development, counties of this type need to implement certain ecological environment protection and restoration measures, and, based on a thorough consideration of the regional ecological environment’s carrying capacity, enhance GY efficiency through moderate human intervention, such as increasing inputs of materials, funds, and technology in existing GP processes, to achieve a scientific and rational increase in GY.
Huize County exhibits the IV slack type (Table 4 and Table 5). Which shows a super-efficient supporting level ( δ E S s n = 1.40), with GY and the supply of ESs indicating a strong tradeoff relationship. GP in this county has reached a relatively high level of development, and has severely impacted the supply of regional ESs, GP and the sustainable development of ecosystems both face huge pressures and challenges. Against the backdrop of sustainable development, counties of with the IV slack type should prioritize ecological environment protection, advance ecological conservation strategies, strictly control the conversion of ecological land use, prevent the continuous decline in the supply of ESs and reduce the risk of GY reduction due to insufficient ESs supply.
In summary, the slack relationship clearly indicates the tradeoff between the supply of ESs and GY. Based on this tradeoff relationship, and in conjunction with development demands, optimal development strategies can be realized for sustainable development of the ecological environment and GP under different development orientations. Therefore, the tradeoff decision-making method based on slack relationships can scientifically and flexibly optimize strategies for the ecological environment and GP, and has a positive role and significance in contributing to regional food security and sustainable development of the ecological environment.

4. Discussion

4.1. Links and Differences with Related Studies

Research on supporting efficiency serves as an exploration of the relationship between ESs and GP, representing a deepening of qualitative research. The foundational supportive role of ESs in GP has become a widely accepted consensus [4,6]. An increasing number of studies call for a detailed deconstruction of the interaction between ESs and GY, aiming for an objective understanding of the complex and multifaceted connections between the two aspects [52]. This study explores the internal mechanisms of the relationship between ESs and GP based on the black-box principle, further deepening the understanding of their interaction on the basis of qualitative research.
Quantitative studies offer a more objective understanding of the relationship between ESs and GP than qualitative studies. ESs play a fundamental and supportive role in GP, as demonstrated by numerous qualitative studies [9]. However, the strength of the relationship of ESs on GY, cannot be objectively reflected [6,30]. As a quantitative study, the support efficiency study accurately describes the intensity of the relationship between ESs and GP and makes it easier to objectively grasp the current state of their interaction.
Quantitative-based studies provide clearer direction and are more actionable when it comes to optimization strategies. Unlike many qualitative studies that rely on subjective judgments or empirical summaries and thus fail to specify the intensity and scope of policy implementation. The slack relationship of this study not only clarifies the direction of tradeoff but also quantitatively expresses the magnitude of the adjustments between ESs and GY, providing a quantified basis for the scientific optimization strategies, which is more objective and operable.

4.2. Consistency of the Results with General Rules

The supporting efficiency ( δ E S s n ) is highly consistent with the general laws of GP. Generally speaking, under the condition that social, economic, and technological factors remain unchanged, the higher the supporting efficiency of ESs for GP, the higher the relative per-unit-area output will be, which in turn corresponds to a higher total GY, and vice versa. This study measured the correlation coefficients between δ E S s n and per-unit-area grain output, as well as total grain yield for all counties in the study area. The correlation is significantly positive at the 0.01 level, with Spearman’s rank correlation coefficients reaching 0.60 and 0.78, respectively. The δ E S s n exhibits the same pattern of change as the per-unit-area grain output and total grain yield of the counties, which is highly consistent with the general principles of GP. This further indicates that the δ E S s n measured in this study possesses a certain degree of rationality and scientific validity.

4.3. Limited Assistance to the Optimization Strategy

The study of the supporting efficiency of ESs for GP serves the foundation for sustainable development decisions in both ecological environment and GP, possessing limited referential and auxiliary value. The interactive relationship between ESs and GP is the result of a comprehensive driving force involving multiple elements such as natural, social, and economic factors [53]. The interaction process between ESs and GP is a complex composite process. The Super-SBM model estimates the efficiency based on the analysis of the mathematical relationships between input and output elements. However, due to the black-box processes of the mechanisms of action and the response intensity of the ESs and GP, this research method reflects the interaction patterns between ESs input and GP to a certain extent, but it is not entirely objective or complete. Therefore, the model method of this study has a certain auxiliary role in the decision-making process, but its overall impact is limited.

4.4. Objective Cognitive Model Measurement Results

It is important to objectively recognize and understand the supporting efficiency and slack to avoid one-sided and blind application in practical activities. The supporting efficiency and slack relationship measured in this study effectively reflect the degree of support that regional ESs provide for GP, as well as potential directions for optimization. However, when it comes to guiding practice, it is necessary to objectively and accurately grasp their specific implications:
(1) An objective understanding of the dual nature of supporting efficiency. There is an inevitable tradeoff between ESs provision and GP. If there is a singular pursuit of high GY, it will inevitably lead to a decline in ecosystem functions and even environmental damage. Conversely, if the focus is solely on the high-quality development of the ecological environment, it will inevitably affect the GP and, subsequently, food security. Therefore, the supporting efficiency of ESs on GP is not necessarily better when higher. It is necessary to consider comprehensively based on objective reality, avoiding the blind pursuit of high supporting efficiency while neglecting the sustainable development of the ecosystem. Existing research has found that traditional monoculture crop farming is not only detrimental to the sustainable development of the agricultural industry but also impacts the sustainable development of the ecological environment to a certain extent. However, agricultural practices such as intercropping legumes with cereals and organic grain farming systems both actively promote the sustainable development of ESs and GP.
(2) An objective understanding of the slack between input and output. The slack between ESs and GY calculated in this study represents theoretical values under the current levels of natural, social, economic, and technological factors, and possesses strong referential value and directionality guidance for policy implementation. However, it should only serve as an auxiliary factor in decision-making. The formulation of scientific strategies cannot rely solely on blind judgments based on the slack. It is necessary to conduct a comprehensive and objective analysis that takes into account the integration of all essential factors.

4.5. Problems and Shortcomings

The δ E S s n has a certain positive effect, but it also has some limitations: (1) the foundational supportive role of ESs for GP has been sufficiently confirmed in qualitative dimensions at present. However, due to the relative scarcity of quantitative research, coupled with differences and limitations in aspects such as the study area, data structure, and data connotations, the δ E S s n is not comparable with the results of related research, which precludes the comparative validation of simulation accuracy with other studies. This leads to a lack of quantitative verification for the accuracy of the measurement results in this study, which could be considered as one of the most critical limitations of the study. (2) The δ E S s n partially reflects the strength of the supporting role of ESs for GP across different counties, representing a relative value in terms of the intensity of impact, rather than a traditional efficiency value. As such, it is not suitable for comparative studies, and therefore the δ E S s n does not possess broad comparability beyond the spatial and temporal scope defined by this study. (3) This study is based on a simplified abstraction of the role of ESs in GP. However, this abstraction may not fully and objectively reflect the mechanisms and laws by which ESs support GP. Furthermore, the measurement results have not been subjected to sufficient accuracy tests, which leads to a significant degree of uncertainty in the δ E S s n . (4) The input structure of counties with efficiency or super efficiency ( δ E S s n ≥ 1) in the measurement process is deemed to be in a state of high efficiency by the Super-SBM model. Consequently, the suggestion will be given that there is no need for optimization of the input elements, in which results are significantly different from the actual conditions, and thus, the model has certain limitations in describing the slack situation in counties with efficiency and super efficiency.

5. Conclusions

The measurement of support efficiency of ESs to GP based on the Super-SBM model is feasible and scientific. The measurement results reveal a spatial distribution in the HMR where the supporting efficiency of ESs for GP is higher in the south and lower in the north. Unfortunately, the majority of counties exhibit ESs that support GP with low efficiency, and the capacity of GP to utilize regional ESs is limited, indicating that production methods in these counties are extensive and the development of the agricultural industry is lagging behind. In terms of the demand for GP, there is a spatial mismatch in the supply of ESs, and a significant imbalance exists between the supply and demand of ESs and GP. Additionally, notable differences in slack further exacerbate this imbalance. Furthermore, the slack relationships and quantities measured by the Super-SBM model effectively reflect the tradeoff relationship and intensity between ESs and GY, providing direction for optimization and data support for the development of sustainable strategies for the ecological environment and the agricultural industry. However, a scientific and comprehensive sustainable development strategy must integrate natural, social, economic, and technological factors, in addition to the findings of this research, for a holistic judgment. This could be one of the significant directions for future research in this field.

Author Contributions

Conceptualization, B.W. and X.H. (Xueyuan Huang); Methodology, B.W., Y.F., X.H. (Xueyuan Huang) and X.H. (Xinjun He); Validation, B.W.; Formal analysis, B.W.; Investigation, B.W.; Resources, B.W., Y.F., X.H. (Xueyuan Huang) and X.H. (Xinjun He); Data curation, B.W., Y.F., X.H. (Xueyuan Huang) and X.H. (Xinjun He); Writing—original draft, B.W.; Writing—review & editing, B.W., X.H. (Xueyuan Huang) and X.H. (Xinjun He); Visualization, B.W.; Supervision, Y.F., X.H. (Xueyuan Huang) and X.H. (Xinjun He); Project administration, B.W., Y.F. and X.H. (Xinjun He); Funding acquisition, Y.F. All authors have read and agreed to the published version of the manuscript.

Funding

This research was financially supported by the National Natural Science Foundation of China (Grant No. 42171209).

Data Availability Statement

The raw data supporting the conclusions of this article will be made available by the authors on request.

Acknowledgments

The authors would like to thank the anonymous reviewers for a set of constructive, specific, and thoughtful comments that significantly improved the quality of our manuscript. We would also like to thank the editors for the efficient handling of the review process.

Conflicts of Interest

The authors declare no conflict of interest.

References

  1. Millennium Ecosystem Assessment. Ecosystems and Human Well-Being: Synthesis; Island Press: Washington, DC, USA, 2005; Available online: https://millenniumassessment.org/zh/index.html (accessed on 16 September 2023).
  2. Poppy, G.M.; Jepson, P.C.; Pickett, J.A.; Birkett, M.A. Achieving food and environmental security: New approaches to close the gap. Philos. Trans. R. Soc. B-Biol. Sci. 2014, 369, 20120272. [Google Scholar] [CrossRef] [PubMed]
  3. Smith, E.N.; van Aalst, M.; Tosens, T.; Niinemets, U.; Stich, B.; Morosinotto, T.; Alboresi, A.; Erb, T.J.; Gomez-Coronado, P.A.; Tolleter, D.; et al. Improving photosynthetic efficiency toward food security: Strategies, advances, and perspectives. Mol. Plant 2023, 16, 1547–1563. [Google Scholar] [CrossRef] [PubMed]
  4. Olesen, R.S.; Hall, C.M.; Rasmussen, L.V. Forests support people’s food and nutrition security through multiple pathways in low- and middle-income countries. One Earth 2022, 5, 1342–1353. [Google Scholar] [CrossRef]
  5. Tilman, D.; Fargione, J.; Wolff, B.; D’Antonio, C.; Dobson, A.; Howarth, R.; Schindler, D.; Schlesinger, W.H.; Simberloff, D.; Swackhamer, D. Forecasting agriculturally driven global environmental change. Science 2001, 292, 281–284. [Google Scholar] [CrossRef] [PubMed]
  6. Bommarco, R.; Kleijn, D.; Potts, S.G. Ecological intensification: Harnessing ecosystem services for food security. Trends Ecol. Evol. 2013, 28, 230–238. [Google Scholar] [CrossRef] [PubMed]
  7. Letourneau, D.K.; Armbrecht, I.; Salguero Rivera, B.; Montoya Lerma, J.; Jimenez Carmona, E.; Constanza Daza, M.; Escobar, S.; Galindo, V.; Gutierrez, C.; Duque Lopez, S.; et al. Does plant diversity benefit agroecosystems? A synthetic review. Ecol. Appl. 2011, 21, 9–21. [Google Scholar] [CrossRef] [PubMed]
  8. Tamm, L.; Thürig, B.; Fliessbach, A.; Gottlieb, A.E.; Karavani, S.; Cohen, Y. Elicitors and soil management to induce resistance against fungal plant diseases. Njas-Wagening. J. Life Sci. 2011, 58, 131–137. [Google Scholar] [CrossRef]
  9. Foley, J.A.; DeFries, R.; Asner, G.P.; Barford, C.; Bonan, G.; Carpenter, S.R.; Chapin, F.S.; Coe, M.T.; Daily, G.C.; Gibbs, H.K.; et al. Global consequences of land use. Science 2005, 309, 570–574. [Google Scholar] [CrossRef] [PubMed]
  10. Dungan, R.S.; Leytem, A.B.; Moore, A.D.; Bjorneberg, D.L.; Grace, P.R.; Brunk, C.; Rowlings, D.W. Growing and non-growing season nitrous oxide emissions from a manured semiarid cropland soil under irrigation. Agric. Ecosyst. Environ. 2023, 348, 108413. [Google Scholar] [CrossRef]
  11. Gardner, J.B.; Drinkwater, L.E. The fate of nitrogen in grain cropping systems: A meta-analysis of 15 N field experiments. Ecol. Appl. 2009, 19, 2167–2184. [Google Scholar] [CrossRef]
  12. Kravchenko, A.N.; Robertson, G.P. Whole-Profile Soil Carbon Stocks: The Danger of Assuming Too Much from Analyses of Too Little. Soil Sci. Soc. Am. J. 2011, 75, 235–240. [Google Scholar] [CrossRef]
  13. Sukhoveeva, O.; Karelin, D.; Lebedeva, T.; Pochikalov, A.; Ryzhkov, O.; Suvorov, G.; Zolotukhin, A. Greenhouse gases fluxes and carbon cycle in agroecosystems under humid continental climate conditions. Agric. Ecosyst. Environ. 2023, 352, 108502. [Google Scholar] [CrossRef]
  14. Pretty, J.; Bharucha, Z.P. Sustainable intensification in agricultural systems. Ann. Bot. 2014, 114, 1571–1596. [Google Scholar] [CrossRef] [PubMed]
  15. Matson, P.A.; Parton, W.J.; Power, A.G.; Swift, M.J. Agricultural intensification and ecosystem properties. Science 1997, 277, 504–509. [Google Scholar] [CrossRef] [PubMed]
  16. Moss, B. Water pollution by agriculture. Philos. Trans. R. Soc. B-Biol. Sci. 2008, 363, 659–666. [Google Scholar] [CrossRef] [PubMed]
  17. Cassman, K.G.; Dobermann, A.; Walters, D.T.; Yang, H. Meeting cereal demand while protecting natural resources and improving environmental quality. Annu. Rev. Environ. Resour. 2003, 28, 315–358. [Google Scholar] [CrossRef]
  18. Chen, B.M.; Feng, W.T.; Jing, X.; Wang, Y.G. Dryland agricultural expansion leads to lower content and higher variability of soil inorganic carbon in topsoil. Agric. Ecosyst. Environ. 2023, 356, 108620. [Google Scholar] [CrossRef]
  19. Adams, W.M.; Aveling, R.; Brockington, D.; Dickson, B.; Elliott, J.; Hutton, J.; Roe, D.; Vira, B.; Wolmer, W. Biodiversity conservation and the eradication of poverty. Science 2004, 306, 1146–1149. [Google Scholar] [CrossRef] [PubMed]
  20. Gaba, S.; Lescourret, F.; Boudsocq, S.; Enjalbert, J.; Hinsinger, P.; Journet, E.P.; Navas, M.L.; Wery, J.; Louarn, G.; Malézieux, E.; et al. Multiple cropping systems as drivers for providing multiple ecosystem services: From concepts to design. Agron. Sustain. Dev. 2015, 35, 607–623. [Google Scholar] [CrossRef]
  21. Lal, R. Soil carbon sequestration impacts on global climate change and food security. Science 2004, 304, 1623–1627. [Google Scholar] [CrossRef]
  22. Lobell, D.B.; Burke, M.B.; Tebaldi, C.; Mastrandrea, M.D.; Falcon, W.P.; Naylor, R.L. Prioritizing climate change adaptation needs for food security in 2030. Science 2008, 319, 607–610. [Google Scholar] [CrossRef] [PubMed]
  23. Gaupp, F. Extreme Events in a Globalized Food System. One Earth 2020, 2, 518–521. [Google Scholar] [CrossRef] [PubMed]
  24. Wheeler, T.; von Braun, J. Climate Change Impacts on Global Food Security. Science 2013, 341, 508–513. [Google Scholar] [CrossRef] [PubMed]
  25. Cordell, D.; Drangert, J.O.; White, S. The story of phosphorus: Global food security and food for thought. Glob. Environ. Chang.-Hum. Policy Dimens. 2009, 19, 292–305. [Google Scholar] [CrossRef]
  26. Sundram, P. Food security in ASEAN: Progress, challenges and future. Front. Sustain. Food Syst. 2023, 7, 1260619. [Google Scholar] [CrossRef]
  27. Aragie, E.; Balie, J.; Morales, C.; Pauw, K. Synergies and trade-offs between agricultural export promotion and food security: Evidence from African economies. World Dev. 2023, 172, 106368. [Google Scholar] [CrossRef]
  28. Neumann, K.; Verburg, P.H.; Stehfest, E.; Müller, C. The yield gap of global grain production: A spatial analysis. Agric. Syst. 2010, 103, 316–326. [Google Scholar] [CrossRef]
  29. Calvin, K.; Cowie, A.; Berndes, G.; Arneth, A.; Cherubini, F.; Portugal-Pereira, J.; Grassi, G.; House, J.; Johnson, F.X.; Popp, A.; et al. Bioenergy for climate change mitigation: Scale and sustainability. Glob. Chang. Biol. Bioenergy 2021, 13, 1346–1371. [Google Scholar] [CrossRef]
  30. Liu, L.Q.; Wang, X.Y.; Meng, X.Z.; Cai, Y.Y. The coupling and coordination between food production security and agricultural ecological protection in main food-producing areas of China. Ecol. Indic. 2023, 154, 110785. [Google Scholar] [CrossRef]
  31. Tylianakis, J.M.; Didham, R.K.; Bascompte, J.; Wardle, D.A. Global change and species interactions in terrestrial ecosystems. Ecol. Lett. 2008, 11, 1351–1363. [Google Scholar] [CrossRef]
  32. Xu, X.L.; Liu, J.Y.; Zhang, S.W.; Li, R.D.; Yan, C.Z.; Wu, S.X. China Multi-Period Land Use Remote Sensing Monitoring Dataset (CNLUCC); Institute of Geographic Sciences and Natural Resources Research, Chinese Academy of Sciences (CAS): Beijing, China, 2018. [Google Scholar] [CrossRef]
  33. Xu, X.L. Spatial Distribution Data of Ecosystem Types in China across Multiple Periods; Institute of Geographic Sciences and Natural Resources Research, Chinese Academy of Sciences (CAS): Beijing, China, 2023. [Google Scholar] [CrossRef]
  34. Costanza, R.; dArge, R.; deGroot, R.; Farber, S.; Grasso, M.; Hannon, B.; Limburg, K.; Naeem, S.; Oneill, R.V.; Paruelo, J.; et al. The value of the world’s ecosystem services and natural capital. Nature 1997, 387, 253–260. [Google Scholar] [CrossRef]
  35. El Mujtar, V.; Muñoz, N.; Mc Cormick, B.P.; Pulleman, M.; Tittonell, P. Role and management of soil biodiversity for food security and nutrition; where do we stand? Glob. Food Secur.-Agric. Policy Econ. Environ. 2019, 20, 132–144. [Google Scholar] [CrossRef]
  36. Yuan, M.H.; Lo, S.L. Ecosystem services and sustainable development: Perspectives f1 rom the food-energy-water Nexus. Ecosyst. Serv. 2020, 46, 101217. [Google Scholar] [CrossRef]
  37. Rehman, A.; Farooq, M.; Lee, D.J.; Siddique, K.H.M. Sustainable agricultural practices for food security and ecosystem services. Environ. Sci. Pollut. Res. 2022, 29, 84076–84095. [Google Scholar] [CrossRef] [PubMed]
  38. Tone, K. A slacks-based measure of efficiency in data envelopment analysis. Eur. J. Oper. Res. 2001, 130, 498–509. [Google Scholar] [CrossRef]
  39. Li, Y.; Chen, Y.Y. Development of an SBM-ML model for the measurement of green total factor productivity: The case of pearl river delta urban agglomeration. Renew. Sustain. Energy Rev. 2021, 145, 111131. [Google Scholar] [CrossRef]
  40. Lotfi, F.H.; Saen, R.F.; Moghaddas, Z.; Vaez-Ghasemi, M. Using an SBM-NDEA model to assess the desirable and undesirable outputs of sustainable supply chain: A case study in wheat industry. Socio-Econ. Plan. Sci. 2023, 89, 101699. [Google Scholar] [CrossRef]
  41. Zhang, J.R.; Zeng, W.H.; Wang, J.N.; Yang, F.L.; Jiang, H.Q. Regional low-carbon economy efficiency in China: Analysis based on the Super-SBM model with CO2 emissions. J. Clean. Prod. 2017, 163, 202–211. [Google Scholar] [CrossRef]
  42. Shah, W.U.H.; Hao, G.; Yasmeen, R.; Kamal, M.A.; Khan, A.; Padda, I.U.H. Unraveling the role of China’s OFDI, institutional difference and B&R policy on energy efficiency: A meta-frontier super-SBM approach. Environ. Sci. Pollut. Res. 2022, 29, 56454–56472. [Google Scholar] [CrossRef]
  43. Huang, L.; Zhang, Y.; Xu, X. Spatial-Temporal Pattern and Influencing Factors of Ecological Efficiency in Zhejiang-Based on Super-SBM Method. Environ. Model. Assess. 2023, 28, 227–243. [Google Scholar] [CrossRef]
  44. Chen, F.; Zhao, T.; Xia, H.; Cui, X.; Li, Z. Allocation of carbon emission quotas in Chinese provinces based on Super-SBM model and ZSG-DEA model. Clean Technol. Environ. Policy 2021, 23, 2285–2301. [Google Scholar] [CrossRef]
  45. Zhang, R.L.; Liu, X.H. Evaluating ecological efficiency of Chinese industrial enterprise. Renew. Energy 2021, 178, 679–691. [Google Scholar] [CrossRef]
  46. Lu, X.H.; Chen, D.L.; Kuang, B.; Zhang, C.Z.; Cheng, C. Is high-tech zone a policy trap or a growth drive? Insights from the perspective of urban land use efficiency. Land Use Policy 2020, 95, 104583. [Google Scholar] [CrossRef]
  47. Liu, G.W.; Fu, X.Y.; Zhuang, T.Z.; Huang, R.P.; Wu, H.J. Provincial performance assessment of neighborhood regeneration based on a super-SBM model and the Malmquist indices: A China study. Sustain. Prod. Consum. 2022, 32, 593–606. [Google Scholar] [CrossRef]
  48. Tone, K.; Toloo, M.; Izadikhah, M. A modified slacks-based measure of efficiency in data envelopment analysis. Eur. J. Oper. Res. 2020, 287, 560–571. [Google Scholar] [CrossRef]
  49. Lee, H.S. Integrating SBM model and Super-SBM model: A one-model approach. Omega-Int. J. Manag. Sci. 2022, 113, 102693. [Google Scholar] [CrossRef]
  50. Lin, R.Y.; Yang, W.; Huang, H.L. A modified slacks-based super-efficiency measure in the presence of negative data. Comput. Ind. Eng. 2019, 135, 39–52. [Google Scholar] [CrossRef]
  51. Lin, S.G.; Shi, H.L.; Wang, Y.M. An integrated slacks-based super-efficiency measure in the presence of nonpositive data. Omega-Int. J. Manag. Sci. 2022, 111, 102669. [Google Scholar] [CrossRef]
  52. Rasul, G.; Hussain, A.; Adhikari, L.; Molden, D.J. Conserving agrobiodiversity for sustainable food systems in the Hindu Kush Himalaya. Int. J. Agric. Sustain. 2022, 20, 1117–1135. [Google Scholar] [CrossRef]
  53. Delzeit, R.; Zabel, F.; Meyer, C.; Václavík, T. Addressing future trade-offs between biodiversity and cropland expansion to improve food security. Reg. Environ. Chang. 2017, 17, 1429–1441. [Google Scholar] [CrossRef]
Figure 1. Overview of ecosystem types and ecosystem services in the study area.
Land 13 01040 g001
Figure 2. Diagram of the logical framework.
Land 13 01040 g002
Figure 3. Deconstructing the supporting relationships of ESs for GP.
Land 13 01040 g003
Figure 4. Fundamental of SBM model simulating.
Land 13 01040 g004
Figure 5. Efficiency frontier of ESs on GP in the counties of the HMR.
Land 13 01040 g005
Figure 6. Spatial pattern of the supporting efficiency δ E S s n at the county scale in the HMR.
Land 13 01040 g006
Figure 7. Spatial pattern of the slacks in GP and ESs at county scale in the HMR.
Land 13 01040 g007
Table 1. List of counties in the study area and basic information.
ProvinceCityCountyQuantity
XizangQamdoChagyab, Gonjo, Gyamda, Markham4
YunnanDaliBinchuan, Dali, Eryuan, Heqing, Jianchuan, Midu, Nanjian, Weishan, Xiangyun, Yangbi, Yongping, Yunlong12
ChuxiongChuxiong, Dayao, Lufeng, Mouding, Nanhua, Wuding, Yao’an, Yongren, Yuanmou9
DiqingDeqin, Weixi, Shangri-la3
KunmingDongchuan, Fumin, Luquan, Xundian, Songming5
LijiangThe Old Town, Huaping, Ninglang, Yongsheng, Yulong5
NujiangFugong, Gongshan, Lanping, Lushui4
QujingHuize1
ZhaotongQiaojia1
SichuanAbaNgapa, Heishui, Hongyuan, Jinchuan, Jiuzhaigou, Li, Barkam, Mao, Rangtang, Songpan, Xiaojin, Wenchuan12
GanziBatang, Baiyu, Danba, Daocheng, Daofu, Dege, Derong, Ganzi, Jiulong, Kangding, Litang, Luhuo, Seda, Xiangcheng, Xinlong, Yajiang, Luding17
LeshanEbian1
Liangshan Butuo, Dechang, Ganluo, Huidong, Jinyang, Leibo, Meigu, Mianning, Muli, Ningnan, Puge, Xichang, Xide, Yanyuan, Yuexi, Zhaojue, Huili17
PanzhihuaDongqu, Xiqu, Renhe, Miyi, Yanbian5
Ya’anBaoxing, Shimian, Tianquan3
total99
Note: All names of provinces, cities, and counties in the table are abbreviated.
Table 2. List of key data and their sources.
NumberData TypeData Publishing AuthorityData SourceTime
1Ecosystem Services (ESs).Chinese Academy of Sciencesthe Center for Resource and Environmental Science and Data (http://www.resdc.cn/DOI)
(accessed on 18 October 2023)
2020
2Land useChinese Academy of Sciencesthe Center for Resource and Environmental Science and Data (http://www.resdc.cn/DOI)
(accessed on 18 October 2023)
2020
3Grain Yield (GY) National Bureau of Statistics of ChinaChina County Statistical Yearbook (County and City Volume) (https://www.stats.gov.cn/)
(accessed on 18 October 2023)
2020
Table 3. List of ESs as x in the Super-SBM model.
TypesESs of MASelectedThe ESs as x in Super-SBM ModelReason
Supporting ServicesSoil formationSoil conservationDirectly support GP
Nutrient cyclingNutrient cyclingDirect supply of nutrients needed for GP
Primary production×Emphasis on process, including GP itself
Provisioning ServicesFoodFood supplyDirectly Affecting GP
FuelwoodMaterial supplyActing as an auxiliary, indirectly affecting GP
FiberMaterial supplyActing as an auxiliary, indirectly affecting GP
Fresh water Water conservationProvide water resources quantity needed for GP
BiodiversityBiodiversityControl of pests and diseases in the process of GP
Genetic resources×Determines the sustainability of GP, has no impact on the process of GP
Regulating ServicesWater regulation Water conservationProvide sustainable water resources for GP
Climate regulationClimate regulationProvide suitable climatic conditions for GP
Hydrologic regulationHydrologic regulationRegulate water resources of GP in terms of time and space
Gas regulationGas regulationSupply and regulate the gases needed for GP
Water purification×Not serving the process of GP
Cultural ServicesSpiritual×Not serving the process of GP
Religious×Not serving the process of GP
Recreation×Not serving the process of GP
Ecotourism×Not serving the process of GP
Aesthetic×Not serving the process of GP
Inspirational×Not serving the process of GP
Educational×Not serving the process of GP
Sense of place×Not serving the process of GP
Cultural heritage×Not serving the process of GP
Table 4. Classification of tradeoffs between ESs and GY in the counties of the HMR.
EfficiencyThe Slack RelationshipsMeaningNumber of CountiesSlack TypesTradeoff Types
δ E S s n < 1
Low efficiency
Slack of GY > 0 and
Slack of ESs > 0
High increasing potential of GY and low supply pressure of ESs83INo
tradeoff
Slack of GY = 0 and
Slack of ESs ≥ 0
Low increasing potential of GY and low supply pressure of ESs10IIWeak tradeoff
δ E S s n ≥ 1
High efficiency
Slack of GY = 0 and
Slack of ESs ≤ 0
Low increasing potential of GY and low supply pressure of ESs5III
Slack of GY < 0 and
Slack of ESs < 0
High increasing pressure of GY and high supply pressure of ESs1IVStrong tradeoff
Table 5. The slacks of ESs and GY in typical counties in the HMR.
CountySlack Types δ E S s InputsOutputs
NCSCBGRHRCRMSWCFSGY
SedaI0.071.0983.2918.9012.3496.4834.813.338.650.2817.94
MianningII0.442.5691.5427.4825.7266.4472.468.125.195.380
MiduIII1.35−0.66−3.31−5.81−5.64−11.58−15.26−1.97−0.92−1.600
HuizeIV1.400.00−18.140.000.000.000.000.000.000.00−12.23
Note: 1, Unit of ESs: RMB CNY 1 hundred million; 2, Unit of GY: 10 thousand tonnes.
Disclaimer/Publisher’s Note: The statements, opinions and data contained in all publications are solely those of the individual author(s) and contributor(s) and not of MDPI and/or the editor(s). MDPI and/or the editor(s) disclaim responsibility for any injury to people or property resulting from any ideas, methods, instructions or products referred to in the content.

