Abstract
People’s reduced connection with nature has led to many health problems. In the NBS framework, urban wildscapes (UWSs) are considered an important solution. They can contribute to improving the health of residents and ecosystems within the city. However, overly wild green spaces may also be offensive to residents. It is necessary to understand the public’s acceptance of UWSs. Current studies on the acceptance of UWSs have used vague terms to generalize the “wildness degree”. In this study, we attempted to quantify the degree of wildness using plant height and plant abundance in Japan and analyzed the results through mediated effect analysis. We discovered the following: 1. Japanese residents have low acceptance of UWSs in vacant lots. 2. The use of “height” and “abundance” may be a more objective way to quantify wildness. 3. The negative effects of abundance can be minimized. The negative effect of height cannot be controlled. This study addresses a gap in the study of Asian cities and proposes a novel approach to quantifying “wildness.” It improves the health benefits of UWSs. Furthermore, it can offer guidance on the management and construction of urban green spaces.
1. Introduction
Over the past few decades, the world’s population has been rapidly converging toward cities, with the United Nations predicting that 68% of the global population will be urban dwellers in 2050 [1]. The expansion and densification of urban areas has largely isolated people from their natural environment, a major factor in mental illnesses such as anxiety and depression among urban dwellers [2,3], and has even led to increased rates of dementia and cardiovascular disease [4,5]. Studies have proven that insufficient contact with wild nature in childhood inhibits willingness to visit natural areas in adulthood [6], leading to more health problems. In today’s world, where urbanization is a growing problem, this represents a vicious cycle.
Urban green spaces (UGSs) are an important natural resource in cities, serving to reduce stress [7], enhance social cohesion [8], and encourage outdoor activities among residents [6,8]. Despite the obvious health benefits of UGSs, their standard in many cities is far below that recommended by governments and experts [9]. It has been suggested that UGSs may still fail to meet the needs of residents in densely populated environments [10]. This is because in some countries and regions, governments find it difficult to build and manage new urban green spaces in cities due to increased fiscal pressures caused by negative economic growth and declining populations, especially in countries and regions where economic growth has peaked and cities have begun to shrink [11]. For example, Japan’s budget for public infrastructure (including UGSs) has declined every year since 1997 [12]. The paradox of a lack of urban green space and fiscal constraints may hinder the healthy development of urban residents.
To mitigate this contradiction, researchers and policymakers have proposed numerous approaches and ideas. NBS is a framework that has gained increasing acceptance in recent years, and one of the ways in which it can be used is through the intentional abandonment of greenfield management and the promotion of wilderness to maximize the provision of ecosystem services and improve urban residents’ quality of life [13]. Urban wildscapes (UWSs) are considered the most significant way in which this is manifested. Jorgensen and Keenan (2012) define urban UWSs as “lands in cities dominated by nature rather than by human forces, especially those places where vegetation grows freely in the course of natural succession” [6]. In recent years, scholars have gradually shifted their attention from traditional urban green spaces to urban UWSs.
UWSs can benefit cities in multiple ways. First, as part of the green infrastructure of cities, they can optimize air quality and reduce noise, carbon dioxide, and the urban heat island effect [14,15,16,17].
Second, wild urban ecosystems can further benefit humans by improving ecological aesthetics, educational opportunities, and health due to their spatial and temporal diversity, unique composition, and contribution to urban ecosystems [18]. Gandy (2022) argues that this challenges aesthetic norms and ecological hierarchies, prompting a reassessment of what is considered valuable or desirable in urban nature [19]. Along with better stability in the face of global warming [20], UWSs also have the ability to considerably increase the biodiversity of Informal Urban Green Spaces (IGSs) in traditional cities [21] as well as arthropod abundance and taxa richness in grasslands [22]. It has been demonstrated that increasing the complexity of urban ecosystems benefits nature and humans in cities [23], such as by improving mental fatigue, strengthening self-identity [24], and increasing willingness to visit green spaces [6]. More importantly, when people experience nature, perceived wildness is positively correlated with positive impacts such as improved well-being and place attachment [25,26]. People can generally derive more positive impacts from wilder green spaces than from urban green spaces. In addition, as some national and local governments lack the funds to develop new urban parks [27], the low management expenditure of UWSs can ensure that the benefits of urban green spaces are also accessible to people in these areas. Thanks to their unique ecological and social roles, UWSs will become more and more important in future landscapes [18], with scholars becoming increasingly aware of this and conducting related research. In recent years, the United States and some European countries have realized the benefits of UWSs [28,29] and have developed policies related to reducing green space management and increasing the degree of wildness of these areas [30,31,32]. There are also cases and policies in Japan. For example, “Shimokita Nohara” in Setagaya-ku, Tokyo, is a park that relies on spontaneous vegetation as its landscape [33]. In the case of “Ginza no Nohara” in Ginza, Tokyo, a small green area in the Ginza street was planted with native wild plants, and the landscape effect was experimented with by implementing extensive management for the next year [34]. In “21st Century Forest and Square” in Matsudo City, Chiba Prefecture, a portion of the park’s common lawn was planned without mowing. In addition, a completely wild “Natural Ecological Area” was set up in the park as a channel through which people can contact and learn about UWSs [35].
However, while UWSs can be beneficial to city dwellers, they can also be offensive to residents. Some studies have argued that excessively wild green spaces can increase fear of danger [36], increase the risk of crime [37], and cause discomfort [38]. In addition to this, overly wild plants can accumulate around and even invade roads and become an obstacle for people. There is also an economic aspect. The presence of excessive UWSs in one’s neighborhood can cause one to fear that the price of the land will fall, resulting in economic damage. Sarah Whatmore critiques this view of nature and culture as opposites and calls for a more flexible and inclusive framework for recognizing the connections between nature, culture, and society [39]. Today, the perceptions of such green spaces span a wide range, with some considering them to be “distasteful” and others perceiving them as “recreational” [40]. The evidence suggests that there are limits to the extent to which residents will accept the wildness of green spaces. Simandan D‘s seminal paper (2011) states that intelligent individuals should strike a balance between conforming to their current environment and striving to change it [41]. Obviously, controlling the “wildness” of natural environments within appropriate limits is an important prerequisite for effectively maximizing the health benefits of UWSs, and it is therefore important to understand the public’s acceptance of them.
To date, there have been several studies related to citizen acceptance of UWSs. A study in France demonstrated better acceptance of intermediate grassy wilderness than initial grassy or scrubby wilderness [40]. A study in Singapore concluded that the public could accept park environments with a moderate degree of wilderness and streetscape environments with a low degree of wilderness [42]. A study by Weber et al. (2014) in Germany found that wild, urban roadside vegetation received a high level of acceptance [43], and Phillips et al. (2021) demonstrated that the public seemed to accept more untidiness at the larger IGS scale while preferring tidier streets [21]. A study in Latin America found that citizens preferred formal green spaces, but once the benefits of UWSs were understood, wild vegetated spaces became more appreciated than formally vegetated spaces [44]. Most of these studies describe a “threshold effect”, whereby the public has a higher preference for UWSs with intermediate stages of biodiversity [21]. However, these studies typically quantify the degree of wilderness in terms of the “natural successional stages of plants” and “ moderateness wild” [40,42,43,44]. However, it is important to note that different environments produce different plant communities [20]. The heterogeneity of plant communities means that even at the same stage of natural succession, they may take on completely different shapes and appearances, thus affecting the judgment of the landscape’s degree of wildness. For example, details such as the density and structure of vegetation can significantly affect its perception [45]. Therefore, the use of vague terms such as “successional stage” and “maintained/wild vegetation” to generalize “wildness” may lead to significant biases. This may lead to significant discrepancies between the results of the studies, which may affect decision-makers’ understanding and management of UWSs. Therefore, we need a standardized and quantifiable indicator to objectively measure the “degree of wildness”. In addition, studies that suggest a trend toward the acceptance of urban wild landscapes pertain to Europe, America, Latin America, and tropical Asia [42], and few studies have considered temperate Asian cities. Since different social backgrounds and cultures lead to different preferences for nature aesthetics [46], these studies do not represent the degree of acceptance of wild landscapes among residents of other regions. More evidence from different regional and national contexts is therefore needed to fill this gap.
Therefore, in order to successfully implement UWSs and determine their potential value, it is first necessary to assess the public’s response to UWSs and the factors involved [42]. To this end, this study selected vacant spaces in Chiba Prefecture, Japan, and used composite photographs to understand respondents’ acceptance of UWSs in a process that attempted to quantify the degree of wildness by measuring plant height and abundance. Additionally, the results underwent Analyses of Mediating Effects. This study aimed to achieve the following goals: 1. to understand the acceptance of UWSs among Japanese city dwellers and explore their potential to mitigate urban environmental health problems in Japan; 2. to analyze the degree of wildness by assessing “plant height” and “plant abundance”, and to measure the degree of wildness using quantifiable indicators; 3. to conduct Analyses of Mediating Effects for the influence of “plant height” and “plant abundance” on the acceptance of different degrees of wildness among residents and explore the differences; 4. to propose management strategies to maximize the health benefits of UWSs in response to differences in height and abundance.
2. Materials and Methods
2.1. Study Site
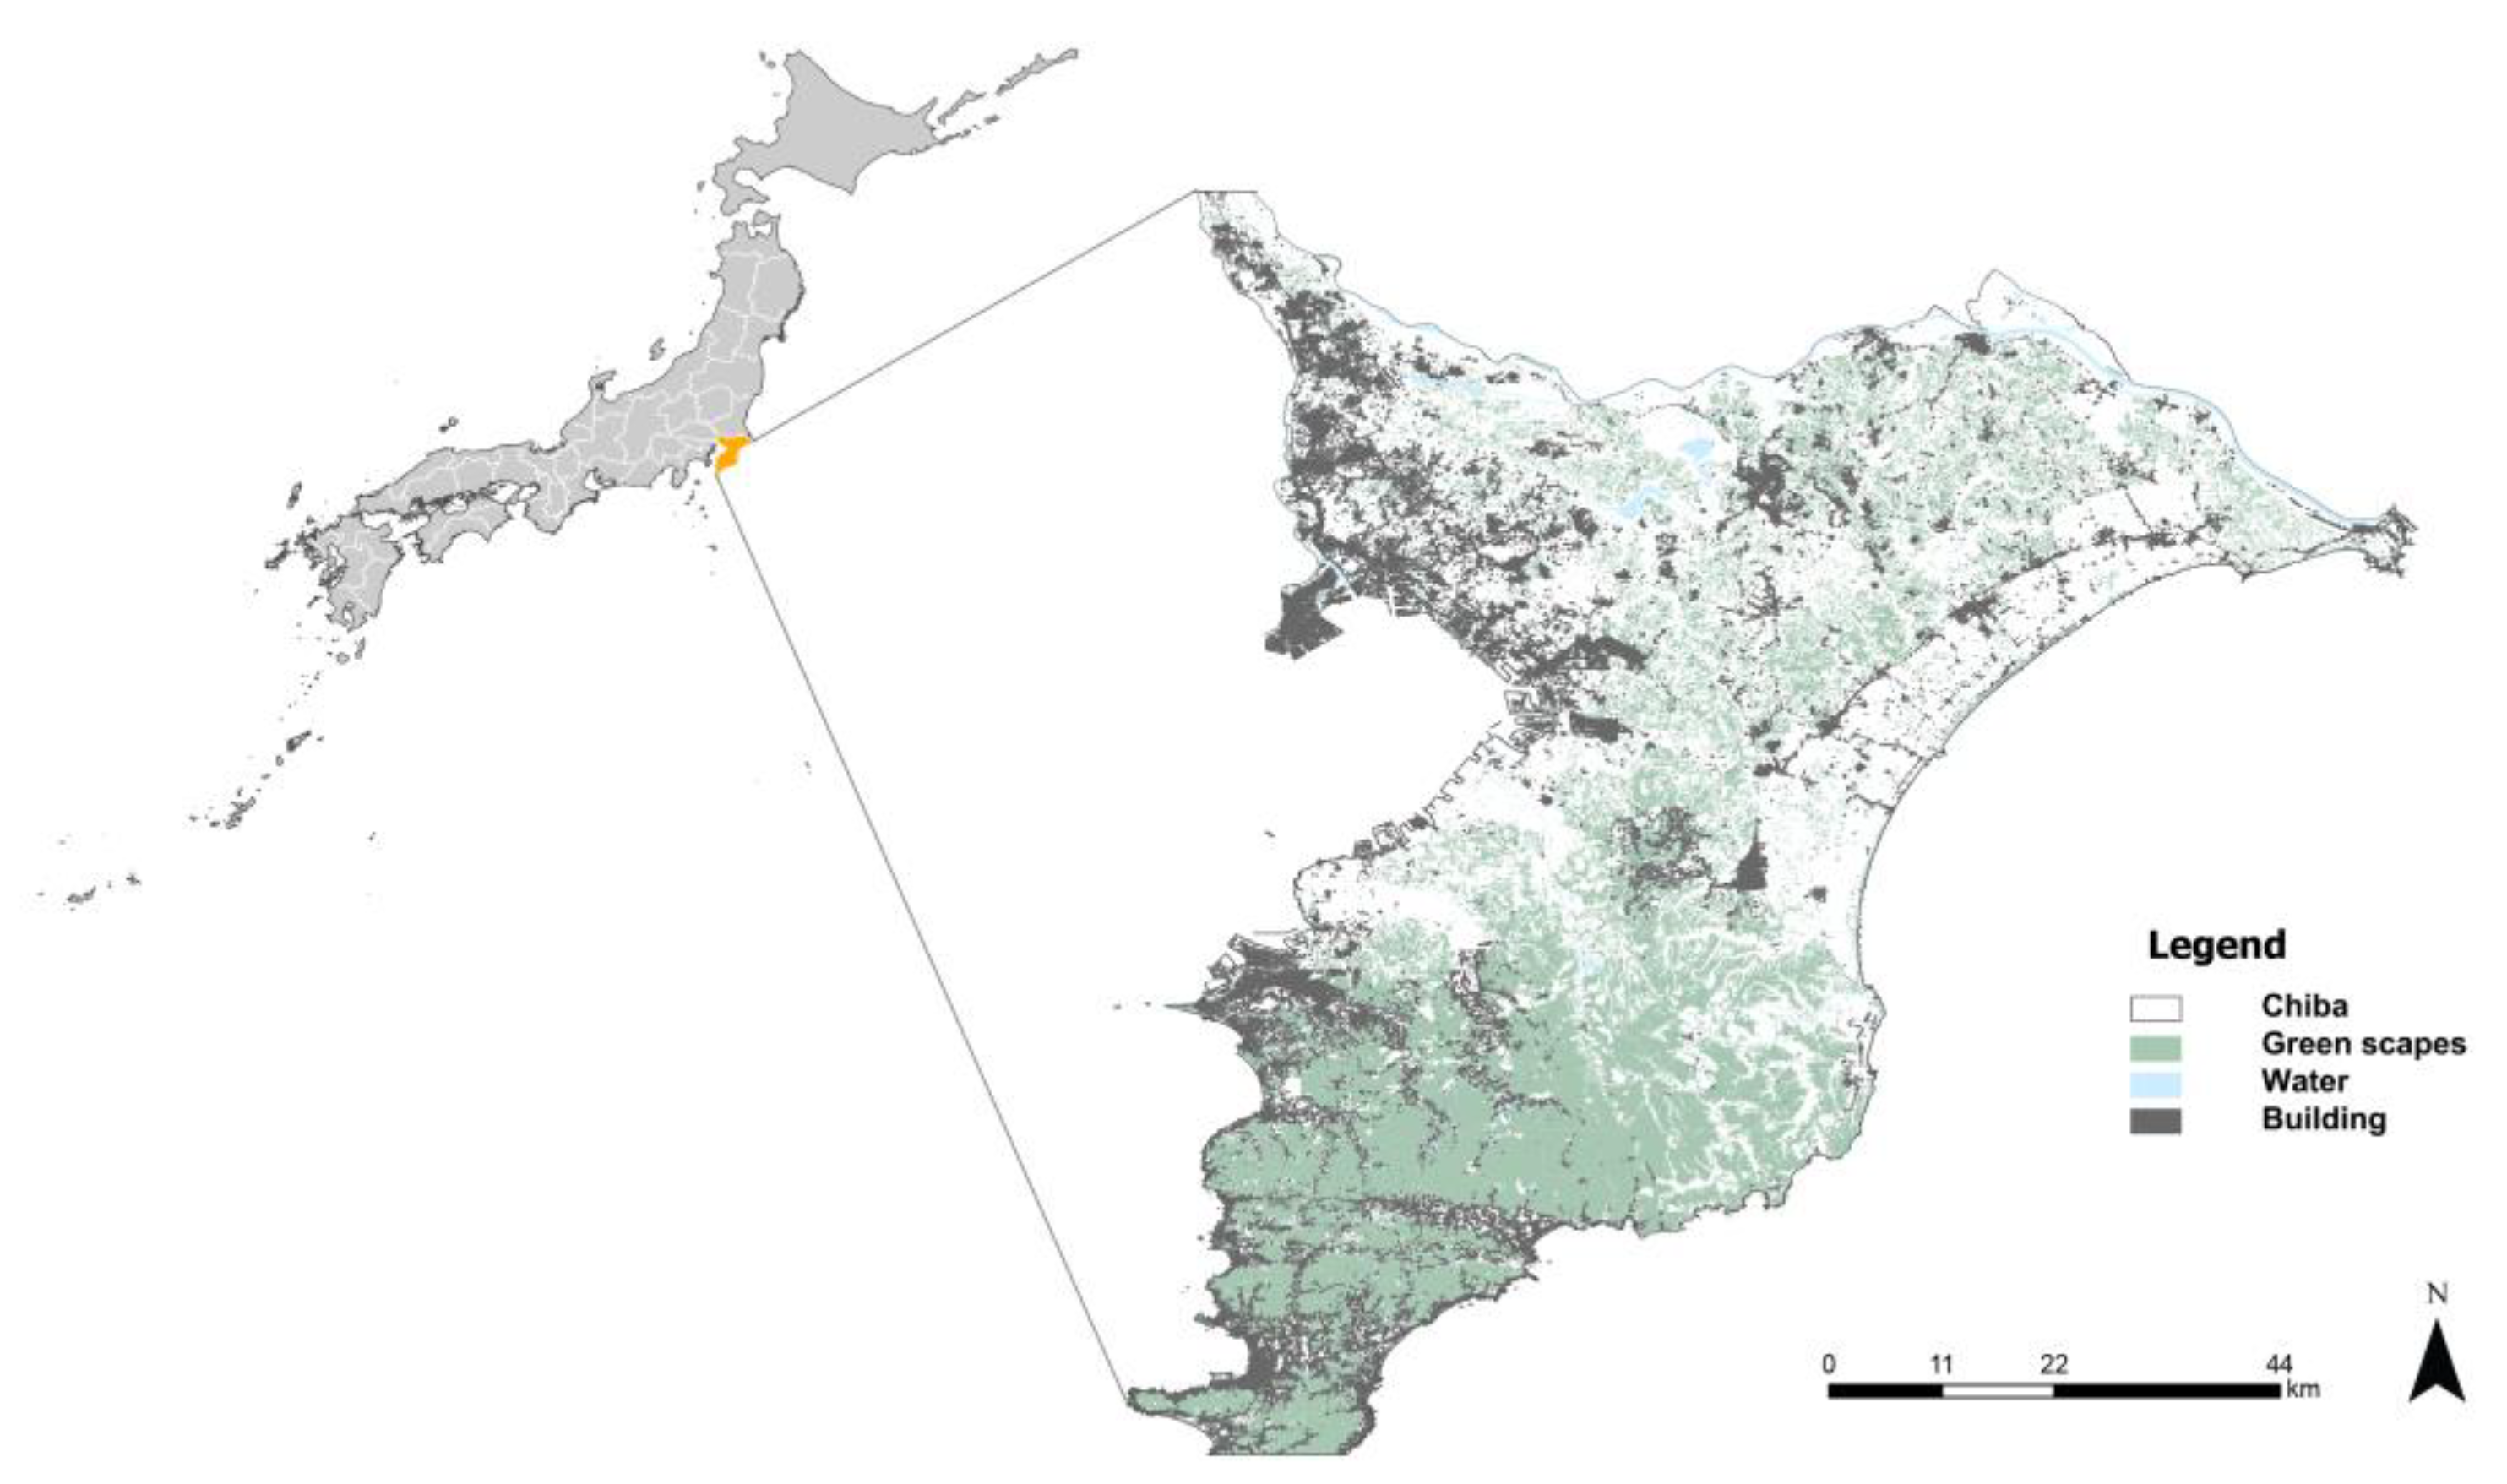
The study site was Chiba Prefecture, located in the Kanto region of Japan, which has a total population of 6,272,245 [47] and an area of 5156.74 square kilometers (Figure 1). Due to its proximity to the Tokyo metropolitan area, three waves of rapid population influx have occurred, which, together with an aging population, has led to the emergence of many abandoned houses (akiya) [48], vacant lots, and UWSs, such as the IGS in Chiba Prefecture, over the last 10 years [49]. While the increase in vacant lots has created a vehicle for social problems, it is also the best research object for this study.

Figure 1.
The spatial location of the study area.
2.2. Survey Questionnaire
This study was photo-inspired using composite photographs, which were shown to respondents to understand their acceptance of UWSs. Roth M (2006) demonstrated that the results obtained when landscape perception studies are conducted via the Internet are similar to face-to-face results [50]. Buijs et al. (2009) also verified the feasibility of this method in their study [51].
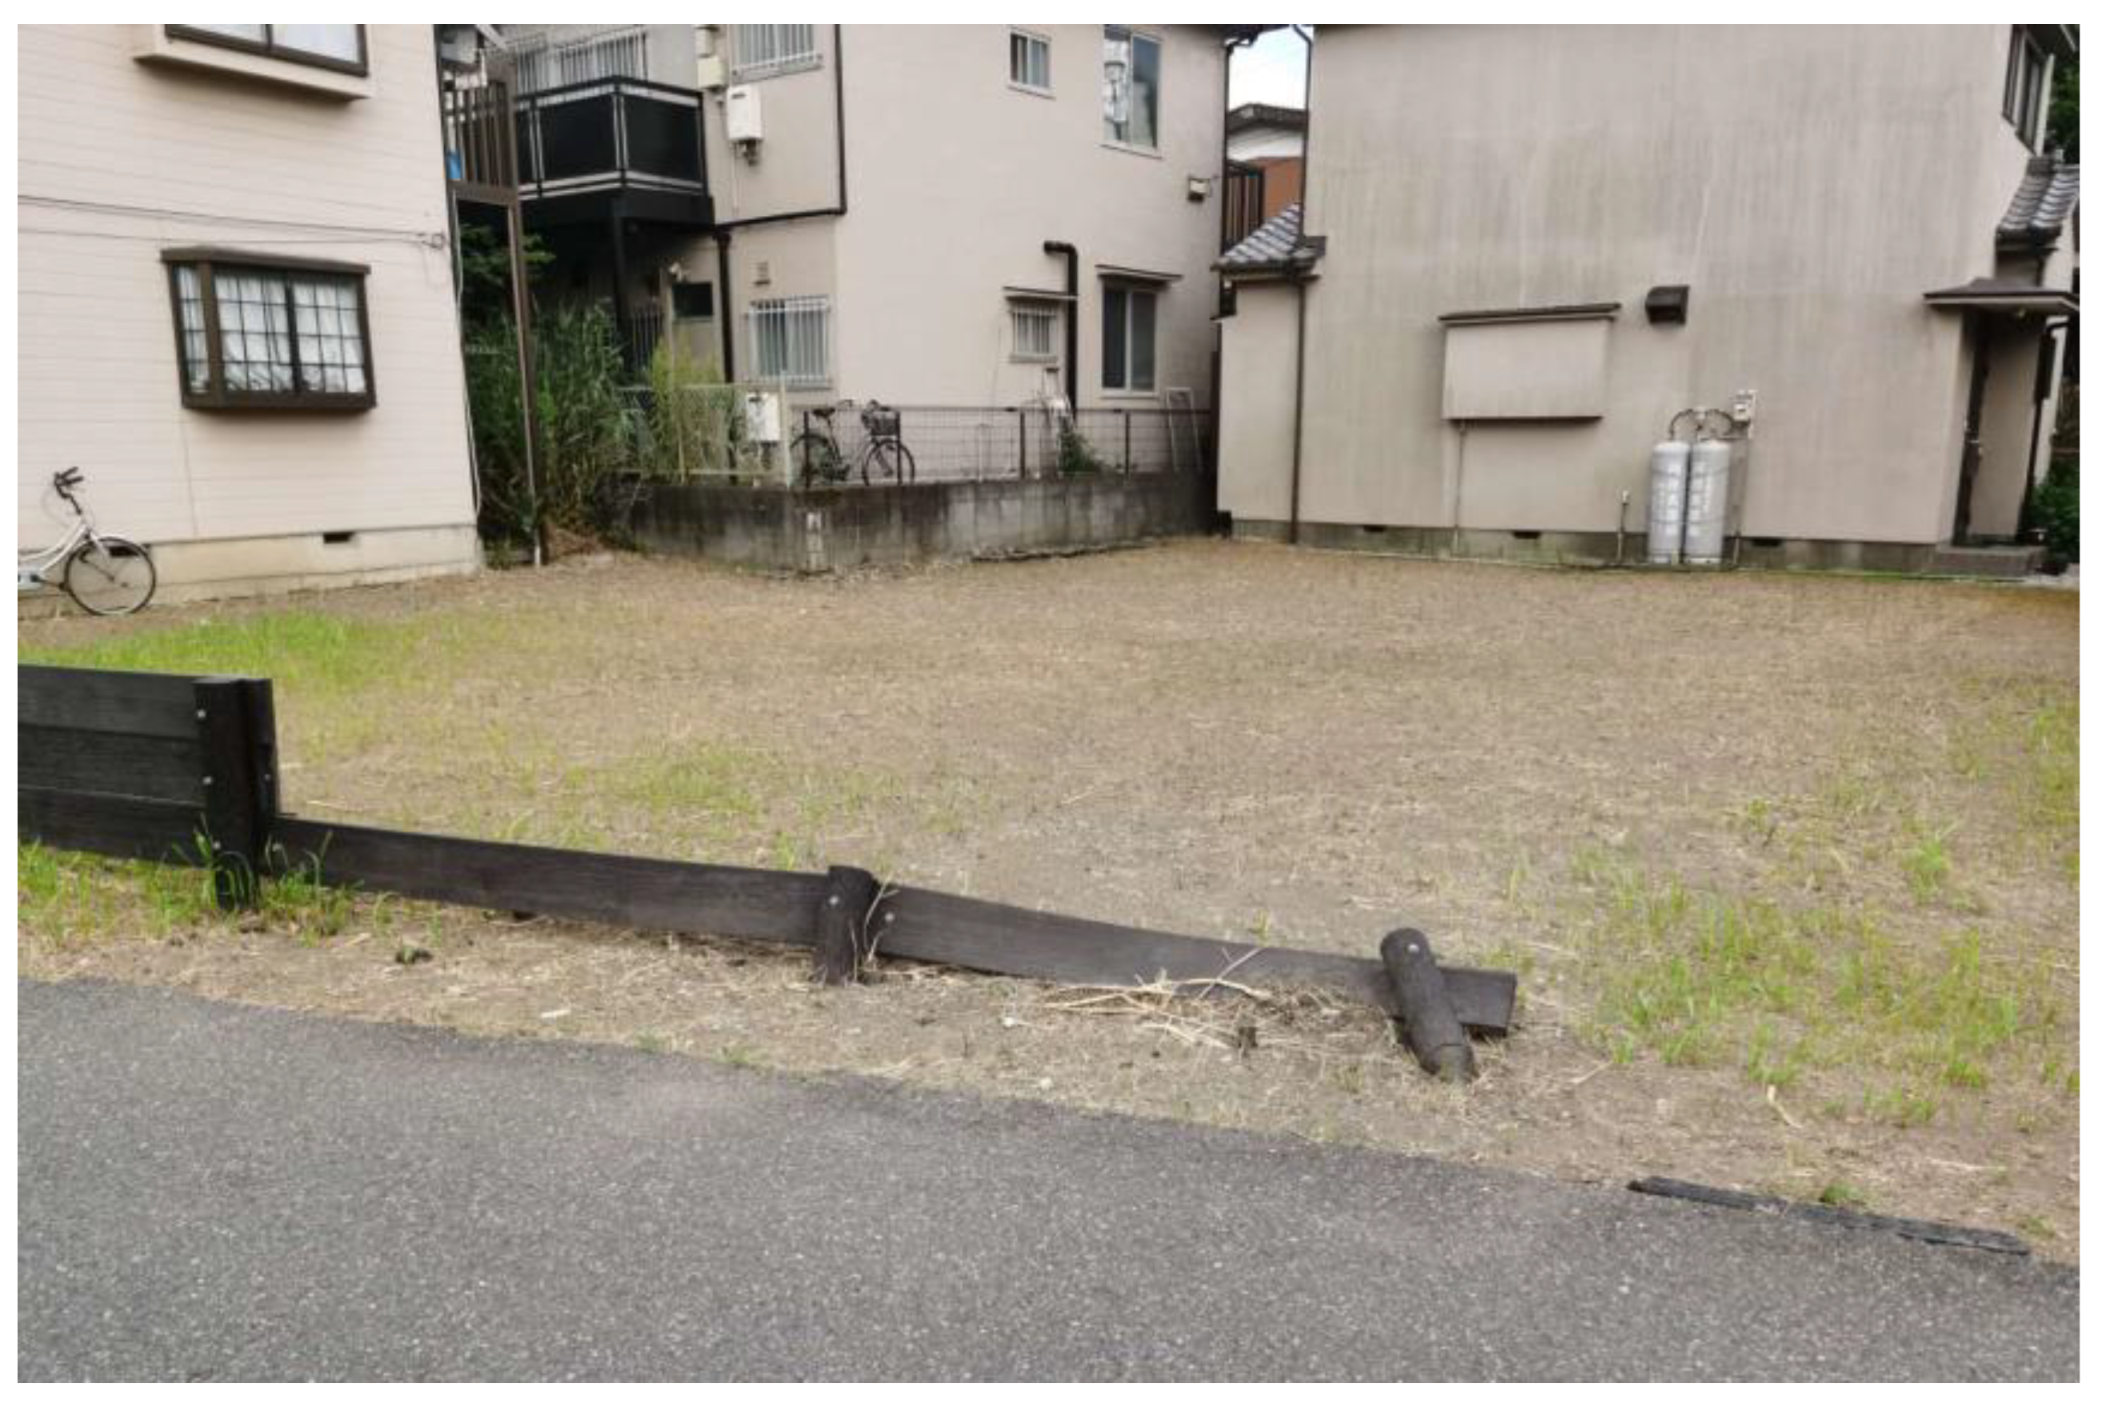
To increase the accuracy of this study, all photo material was taken at the height of a person’s eyeline, at the same angle and distance as the place where it was taken. The original sizes of the photographs were between 15 MB and 20 MB to ensure sufficient detail. Additionally, all photos were taken between 13:00 and 16:00 during the plants’ growing season (August to October). Plant heights were measured at the time of taking the photographs and categorized into three classes—h1: 0 to 30 cm; h2: 30 to 70 cm; h3: above 70 cm. Plant abundance was evaluated by 11 landscape experts based on the photographs and categorized into 3 grades—a1: low; a2: medium; a3: high. In addition, in order to exclude other factors as much as possible, we omitted sites with negative impacts such as graffiti and garbage, and sites with positive impacts such as rivers and potted plants. In the end, a photograph of a vacant lot was chosen as the basis (Figure 2), and autochthonous plants from other vacant lots were composited onto this photograph to exclude interference from different environments [52]. The reasons for choosing this photograph were as follows: 1. The site was surrounded by houses, which is the most common type of vacant lot in Japan. 2. The site did not have overly complex plants, which made it easy to composite the photograph. 3. There was a wooden fence at the front of the site, which would assist the respondents in judging the height of the plants. It should be emphasized that all the photo material used in this study was taken in the residential area of Matsudo City, Chiba Prefecture. This area is located on the border of Tokyo and Chiba prefectures and has a high population and housing density. People in Japan do not usually have to worry about the presence of wildlife in such vacant lots and, therefore, can rule out potential impacts of wildlife on people.
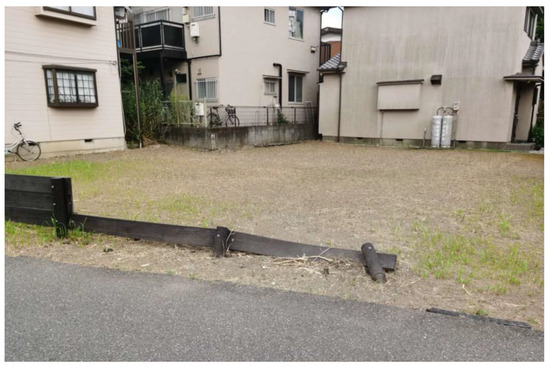
Figure 2.
Base photograph.
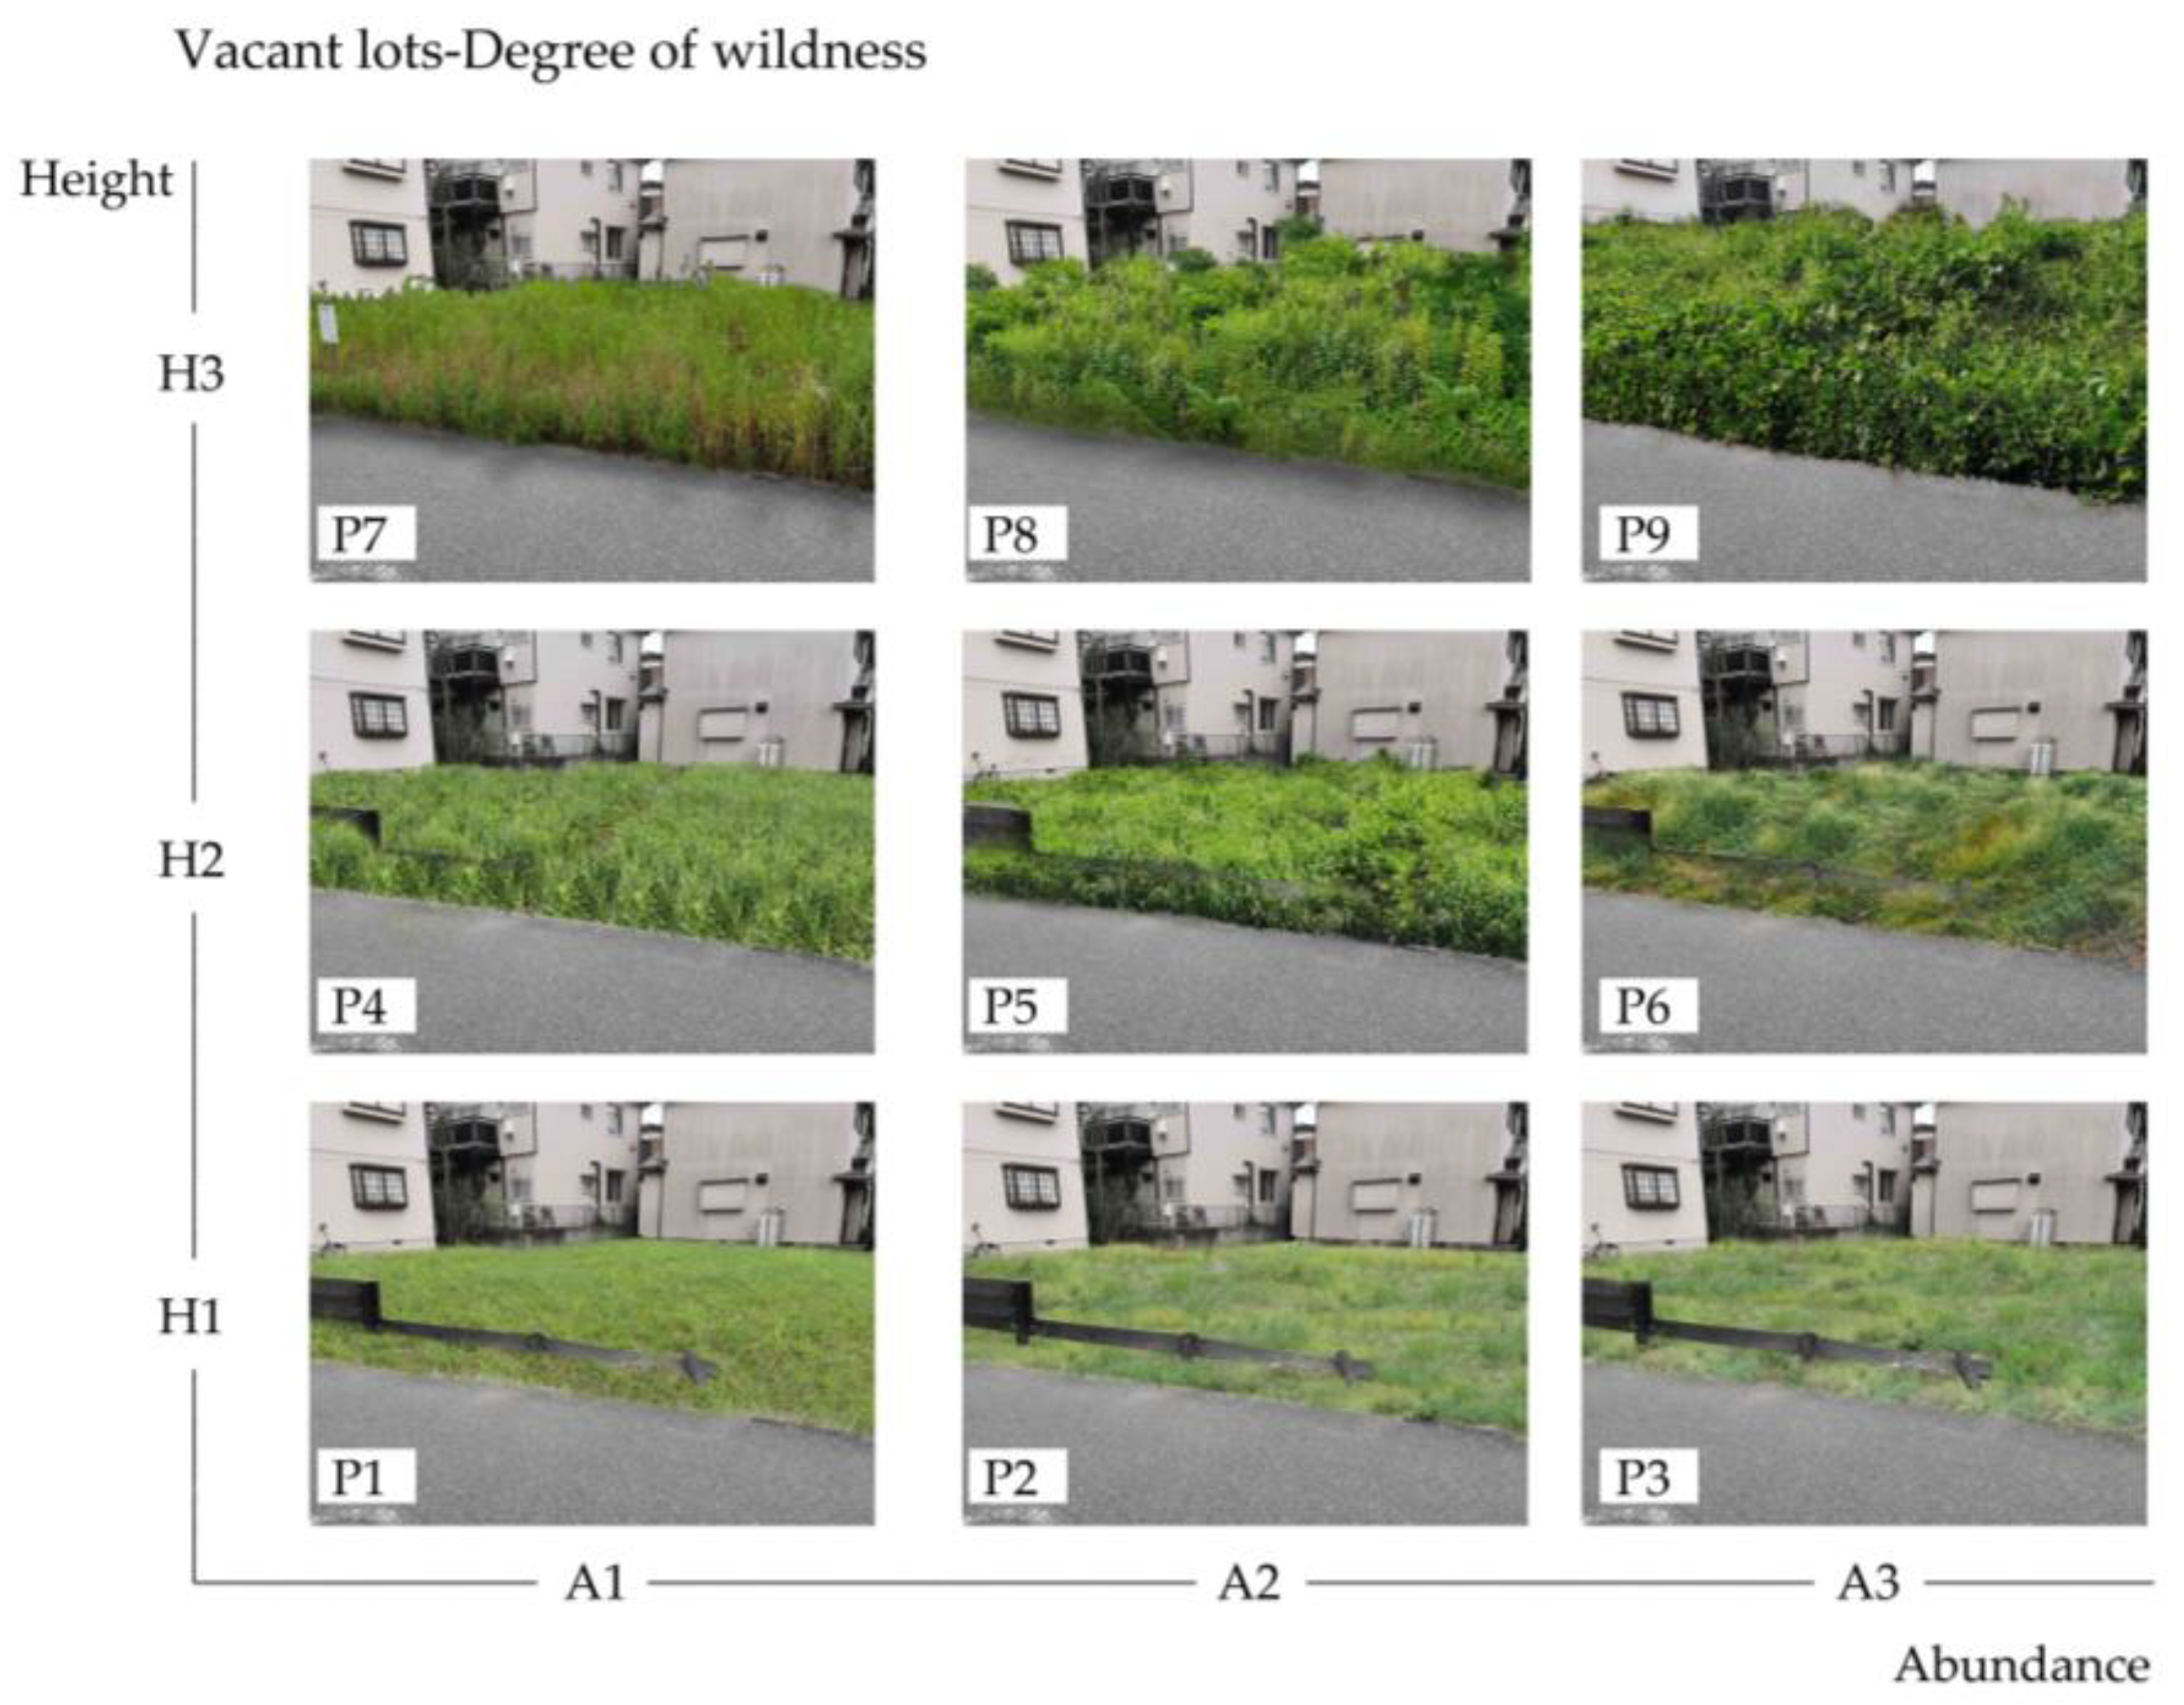
Plants from other sites were extracted and composited using Photoshop CC 2018 to avoid species that do not exist locally or unreasonable plant combinations. A total of 9 images were composited with the combinations “H1A1”, “H1A2”, “H1A3”, “H2A1”, “H2A2”, “H2A3”, “H3A1”, “H3A2 “, and “H3A3” (Figure 3).

Figure 3.
Nine images for the questionnaire. (P1–P9 are images of different height abundance combinations).
In the questionnaire, six declarative sentences were described for each composite photograph. The first article measured the respondents’ intuitive preference for the composite site, the second measured the respondents’ perception of the aesthetics of the site, the third measured the perception of relaxation, and the fourth measured whether respondents perceived the site as natural. These dimensions are often used to assess people’s preference for proximity to nature. The fifth tested respondents’ perceptions of safety at the site, and the sixth tested whether respondents could accept this green space. Respondents were asked to choose the degree to which they agreed with each statement on a 5-point Likert scale. On a Likert scale, “1” means “strongly disagree” and “5” represents “strongly agree”. The six statements were as follows: 1. I like this site; 2. I think this site is beautiful; 3. This site relaxes me; 4. I think this site is natural; 5. I think this site is safe; 6. I can accept that such a site exists near my home.
Finally, in order to ensure the scientific rigor and validity of the questionnaire, it was stated at the beginning of the questionnaire that the responses were anonymous. Relevant terms were also explained to ensure that the respondents could fully understand the questionnaire and provide accurate information.
2.3. Survey Process
A web-based questionnaire was sent to people between the ages of 15 and 69 in Chiba Prefecture, Japan, by the web-based questionnaire company “Freeasy”. All respondents were required to read the informed consent form thoroughly and could only begin the questionnaire after clicking the [Agree] button. Additionally, participants were informed that they could withdraw from the survey at any time during the process. From 5 December 2022 to 7 December 2022, a total of 400 people participated in the survey, including 200 men and 200 women. After removing invalid completed questionnaires, a total of 355 valid questionnaires were obtained, with a validity rate of 88.7%. There were two conditions for determining an invalid questionnaire: 1. those in which all the same options were chosen; 2. those with a clear pattern of choices; 3. those that took too little time to complete. Table 1 summarizes the sociodemographic statistics of the respondents.

Table 1.
Sociodemographic statistics.
2.4. Data Analysis
We performed reliability and validity analyses as well as descriptive analyses using SPSS (ver. 25). In order to understand how “plant height” and “plant abundance” affect residents’ acceptance of wildness, we conducted Analyses of Mediating Effects [53] on the data, to explore the degree to which an independent variable, X (plant height, plant abundance), influences an outcome, Y (acceptance of wildness), through a mediator, M (e.g., preference, relaxation, safety). We assumed p < 0.05 as the level of significance. Analyses of Mediating Effects were performed using R (ver. 4.3.2), and additionally the MEDIATION package [54] was used to perform a bootstrap method to determine the statistical significance of the outgoing mediating effects with 95% confidence intervals, with a randomization of n = 1000 samples.
3. Results
3.1. Reliability and Validity Analyses
We tested Cronbach’s α for each of the six questions for each composite photo. All the Cronbach’s α values were greater than 0.8, proving that the internal consistency was acceptable. In addition, this study used KMO and Bartlett tests to assess the validity of the questionnaire. The KMO sampling validity was 0.963 and for Bartlett’s ball test, p < 0.001, which can be considered valid.
3.2. Descriptive Statistics
Table 2 presents the mean respondent ratings of the nine pictures for the six questions. Out of all the pictures, only P1 obtained more than three ratings in the sixth question.
Table 2.
Descriptive statistics.
3.3. Analysis of Mediating Effects
To understand how “plant height” and “plant abundance” affect residents’ acceptance of wildness, we conducted Analyses of Mediating Effects, the results are as follows.
3.3.1. Results of the Analysis with “Preference” as the Mediating Variable
The results of the Analyses of Mediating Effects are summarized in Table 3, and the results of the Bootstrapping test are shown in Figure 4 and Figure S1.
Table 3.
Analysis of Mediating Effects models (Preference).

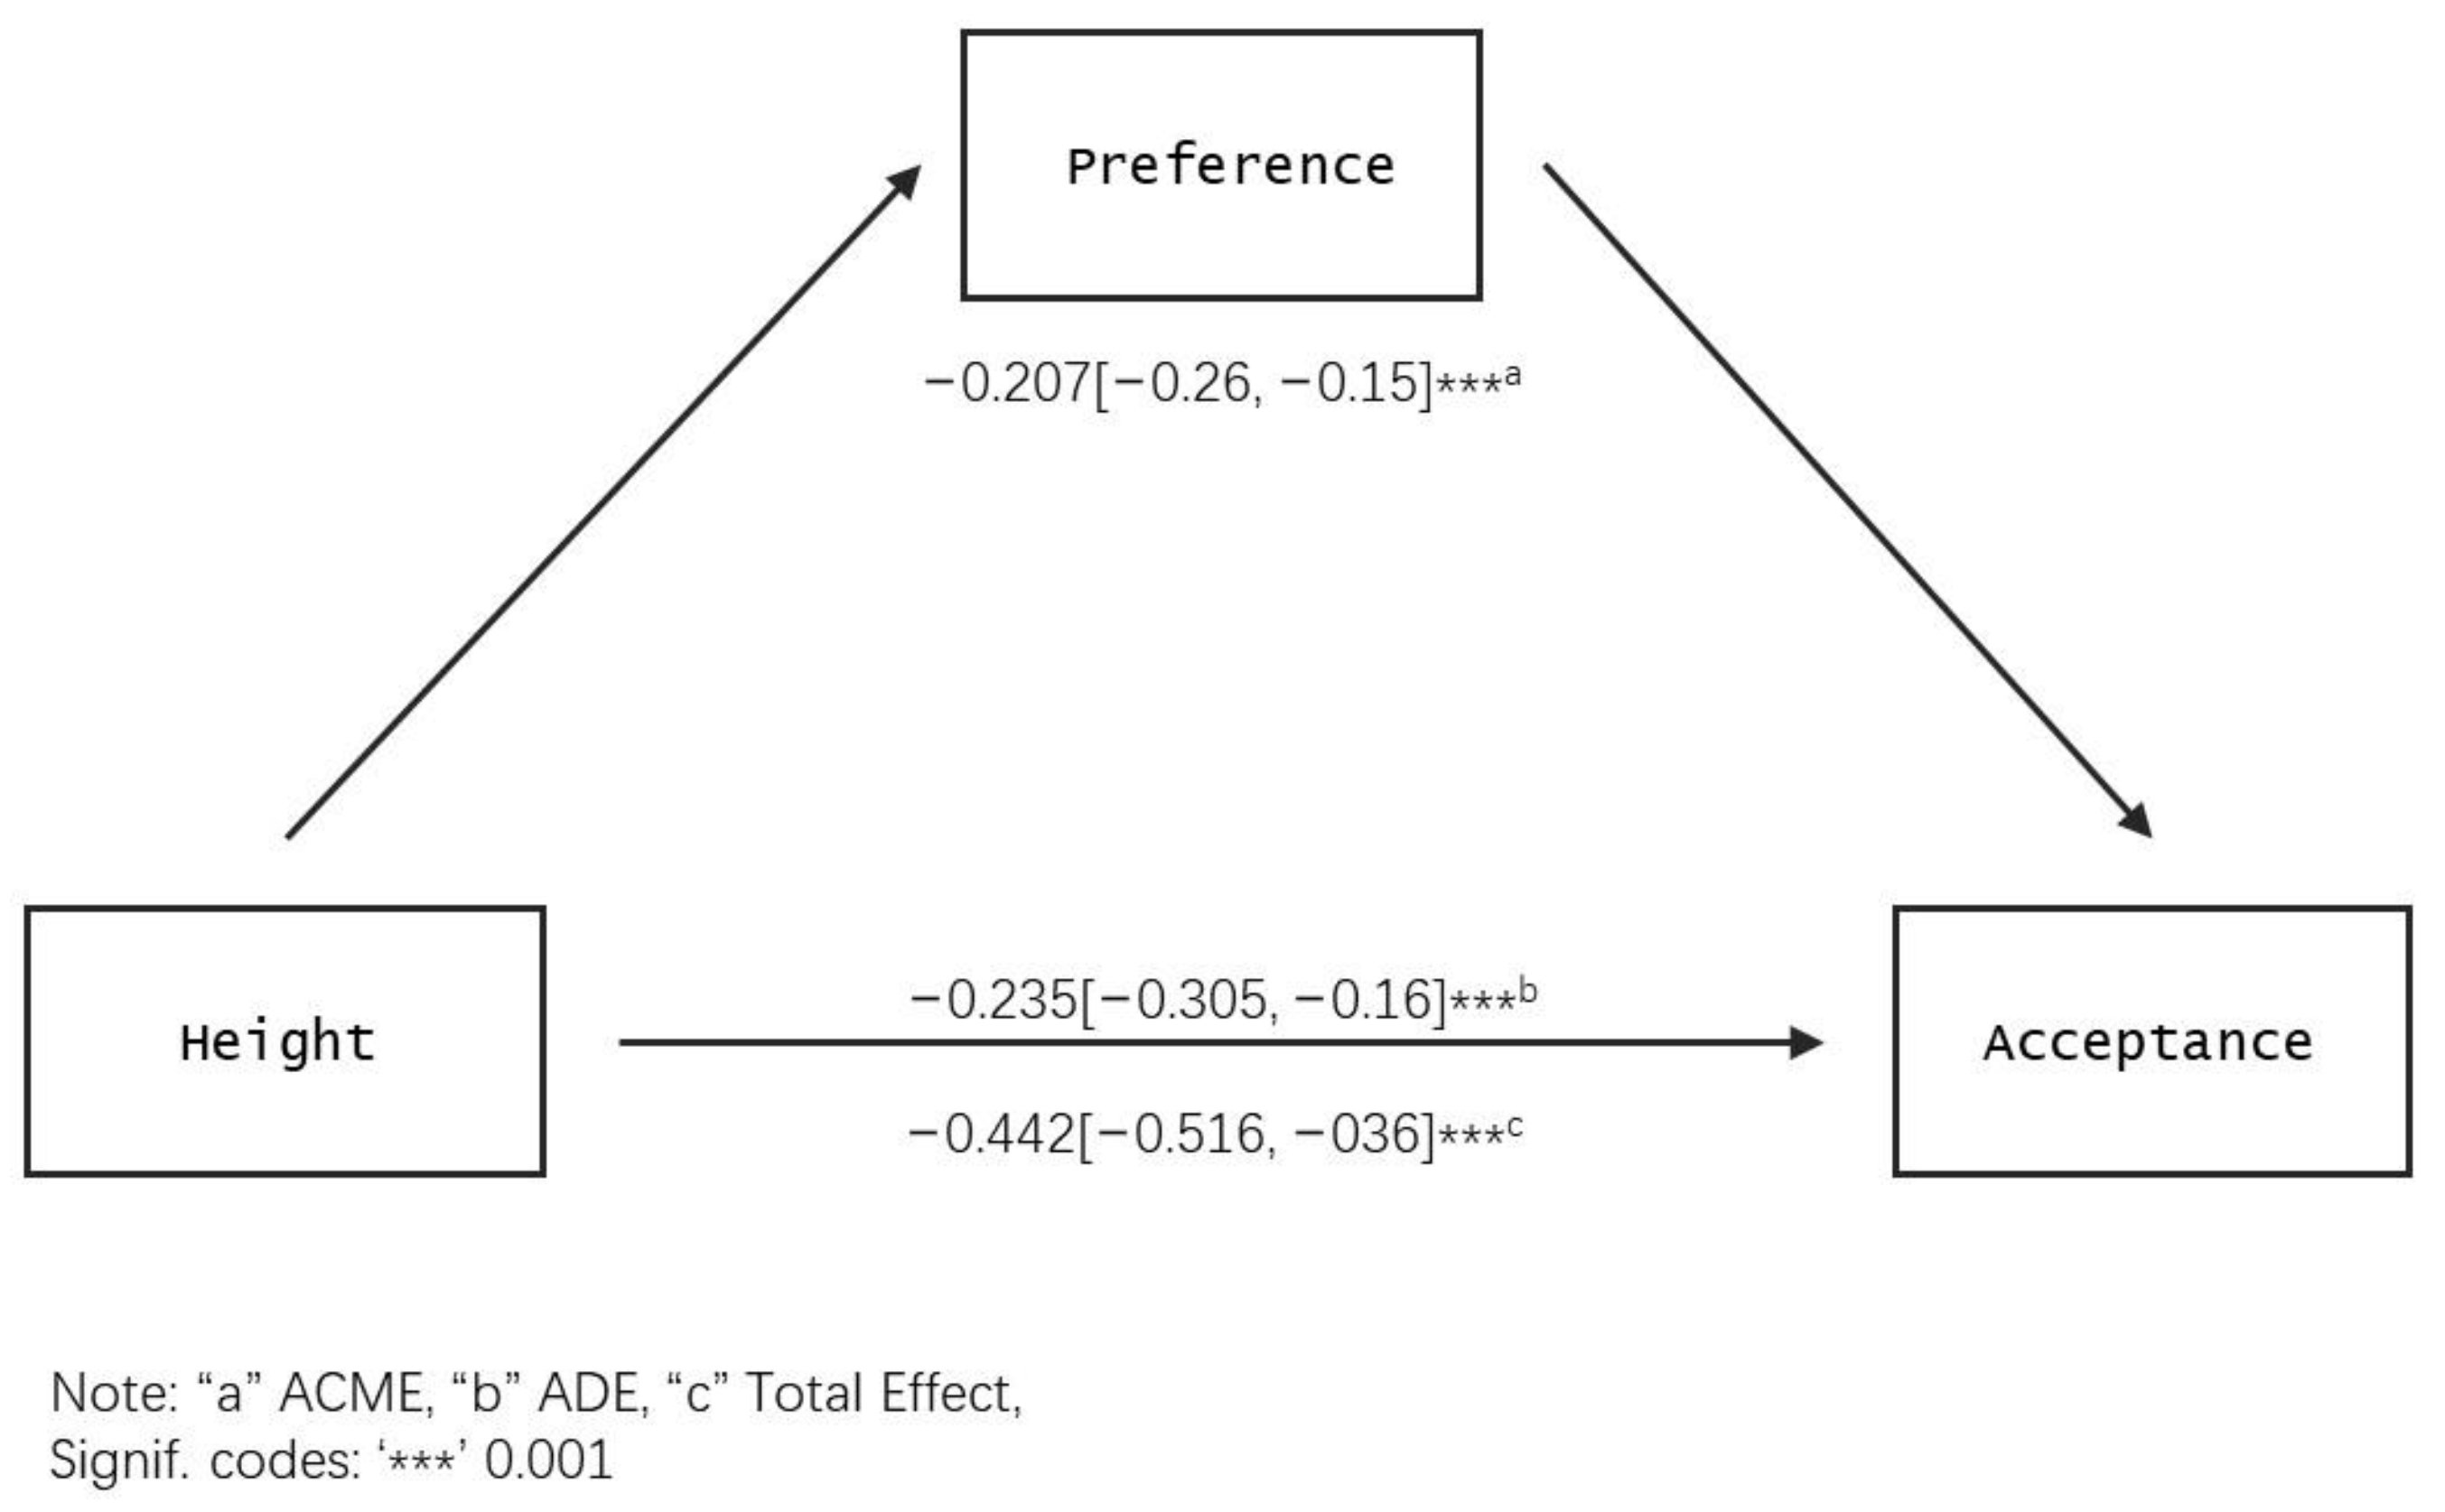
Figure 4.
Bootstrapping test of height (Preference).
As shown in Table 3, based on the variable “height”, in the first step of the test (model.1), we only added the independent variables (“height” and “abundance”) and covariates (sex, age, marital status, etc.) to the model for the operation. Compared to Height_1, Height_2 has a coefficient of acceptance of −0.442 *** and a p-value of <0.01; the coefficient of acceptance for Height_3 compared to Height_1 is −0.876 ***, and the p-value is <0.01, which is significant. This indicates that the total effect is valid. In the second step of the test (model.2), the coefficient of the influence of Height_2 on the mediating variable “preference” is −0.296 *** compared to Height_1, with a p-value of <0.01; the coefficient of the influence of Height_3 on “Preference” compared to Height_1 is −0.573 ***, with a p-value of <0.01. Meanwhile, in the third step of the test (model.3), the coefficient of the influence of Height_2 on “acceptance” compared to Height_1 is −0.235 ***, with a p-value of <0.01; the coefficient of the influence of Height_3 on acceptance compared to Height_1 is −0.474 ***, with a p-value of <0.01. Additionally, the coefficient of the effect of the mediating variable “preference” on “acceptance” is 0.701 ***, with a p-value of <0.01.
Figure 4 shows the results of the Bootstrapping test based on the independent variable “height”. The results show that the 95% CI Lower for ACME (average causal mediation effect) is −0.26, the 95% CI Upper is −0.15, the 95% CI does not include 0, and p < 0.001 ***, indicating a significant mediation effect; the p-value for ADE (average direct effect) is <0.001 ***. The p-value for total effect is <0.001 ****, and the ratio of mediating effect to total effect is about 47% (Prop. Mediated = 0.47 ***). Therefore, the mediating role of “preference” in the model is valid and shows partial mediation.
Based on the variable “Abundance”, in the testing of model.1 (Table 3), the coefficient of “Acceptance” for Abundance_2 compared to Abundance_1 is −0.108 **, with a p-value of <0.05; the coefficient of “acceptance” for Abundance_3 compared to Abundance_1 is −0.182 ***, with a p-value of <0.01. There is a significant difference, and the total effect is established. In the second step of the test, the coefficient of Abundance_2 compared to Abundance_1 for the mediating variable “preference” is −0.05, with a p-value of >0.05; the coefficient of the influence of Abundance_3 on “preference” compared to Abundance_1 is −0.069, with a p-value of >0.05. In the third step of the test (model.3), the effect of Abundance_2 compared to Abundance_1 on “acceptance” is −0.073 **, with a p-value of <0.05; The coefficient of the influence of Abundance_3 on “acceptance” compared to Abundance_1 is −0.133 ***, with a p-value of <0.01. Figure S1 shows the results of the Bootstrapping test for the independent variable “abundance”. The 95% CI for ACME contains 0, and the mediation effect does not hold.
3.3.2. Results of the Analysis with the Mediating Variable “Beauty”
The results of the mediation effect analysis based on the mediating variable “beauty” are summarized in Table 4, and the results of the Bootstrapping test are shown in Figure 5 and Figure 6.
Table 4.
Analysis of Mediating Effects models (Beauty).
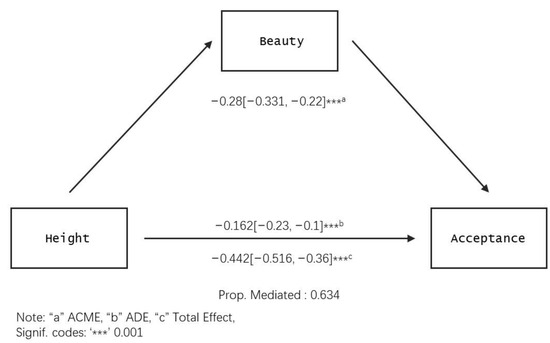
Figure 5.
Bootstrapping test of height (Beauty).
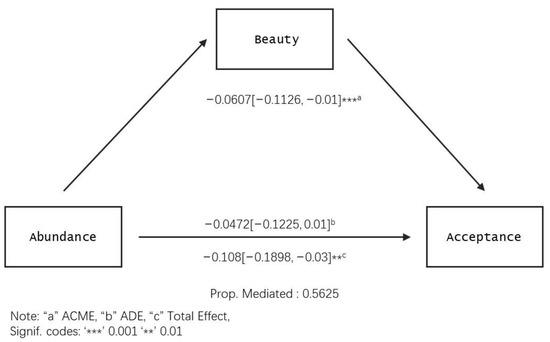
Figure 6.
Bootstrapping test of abundance (Beauty).
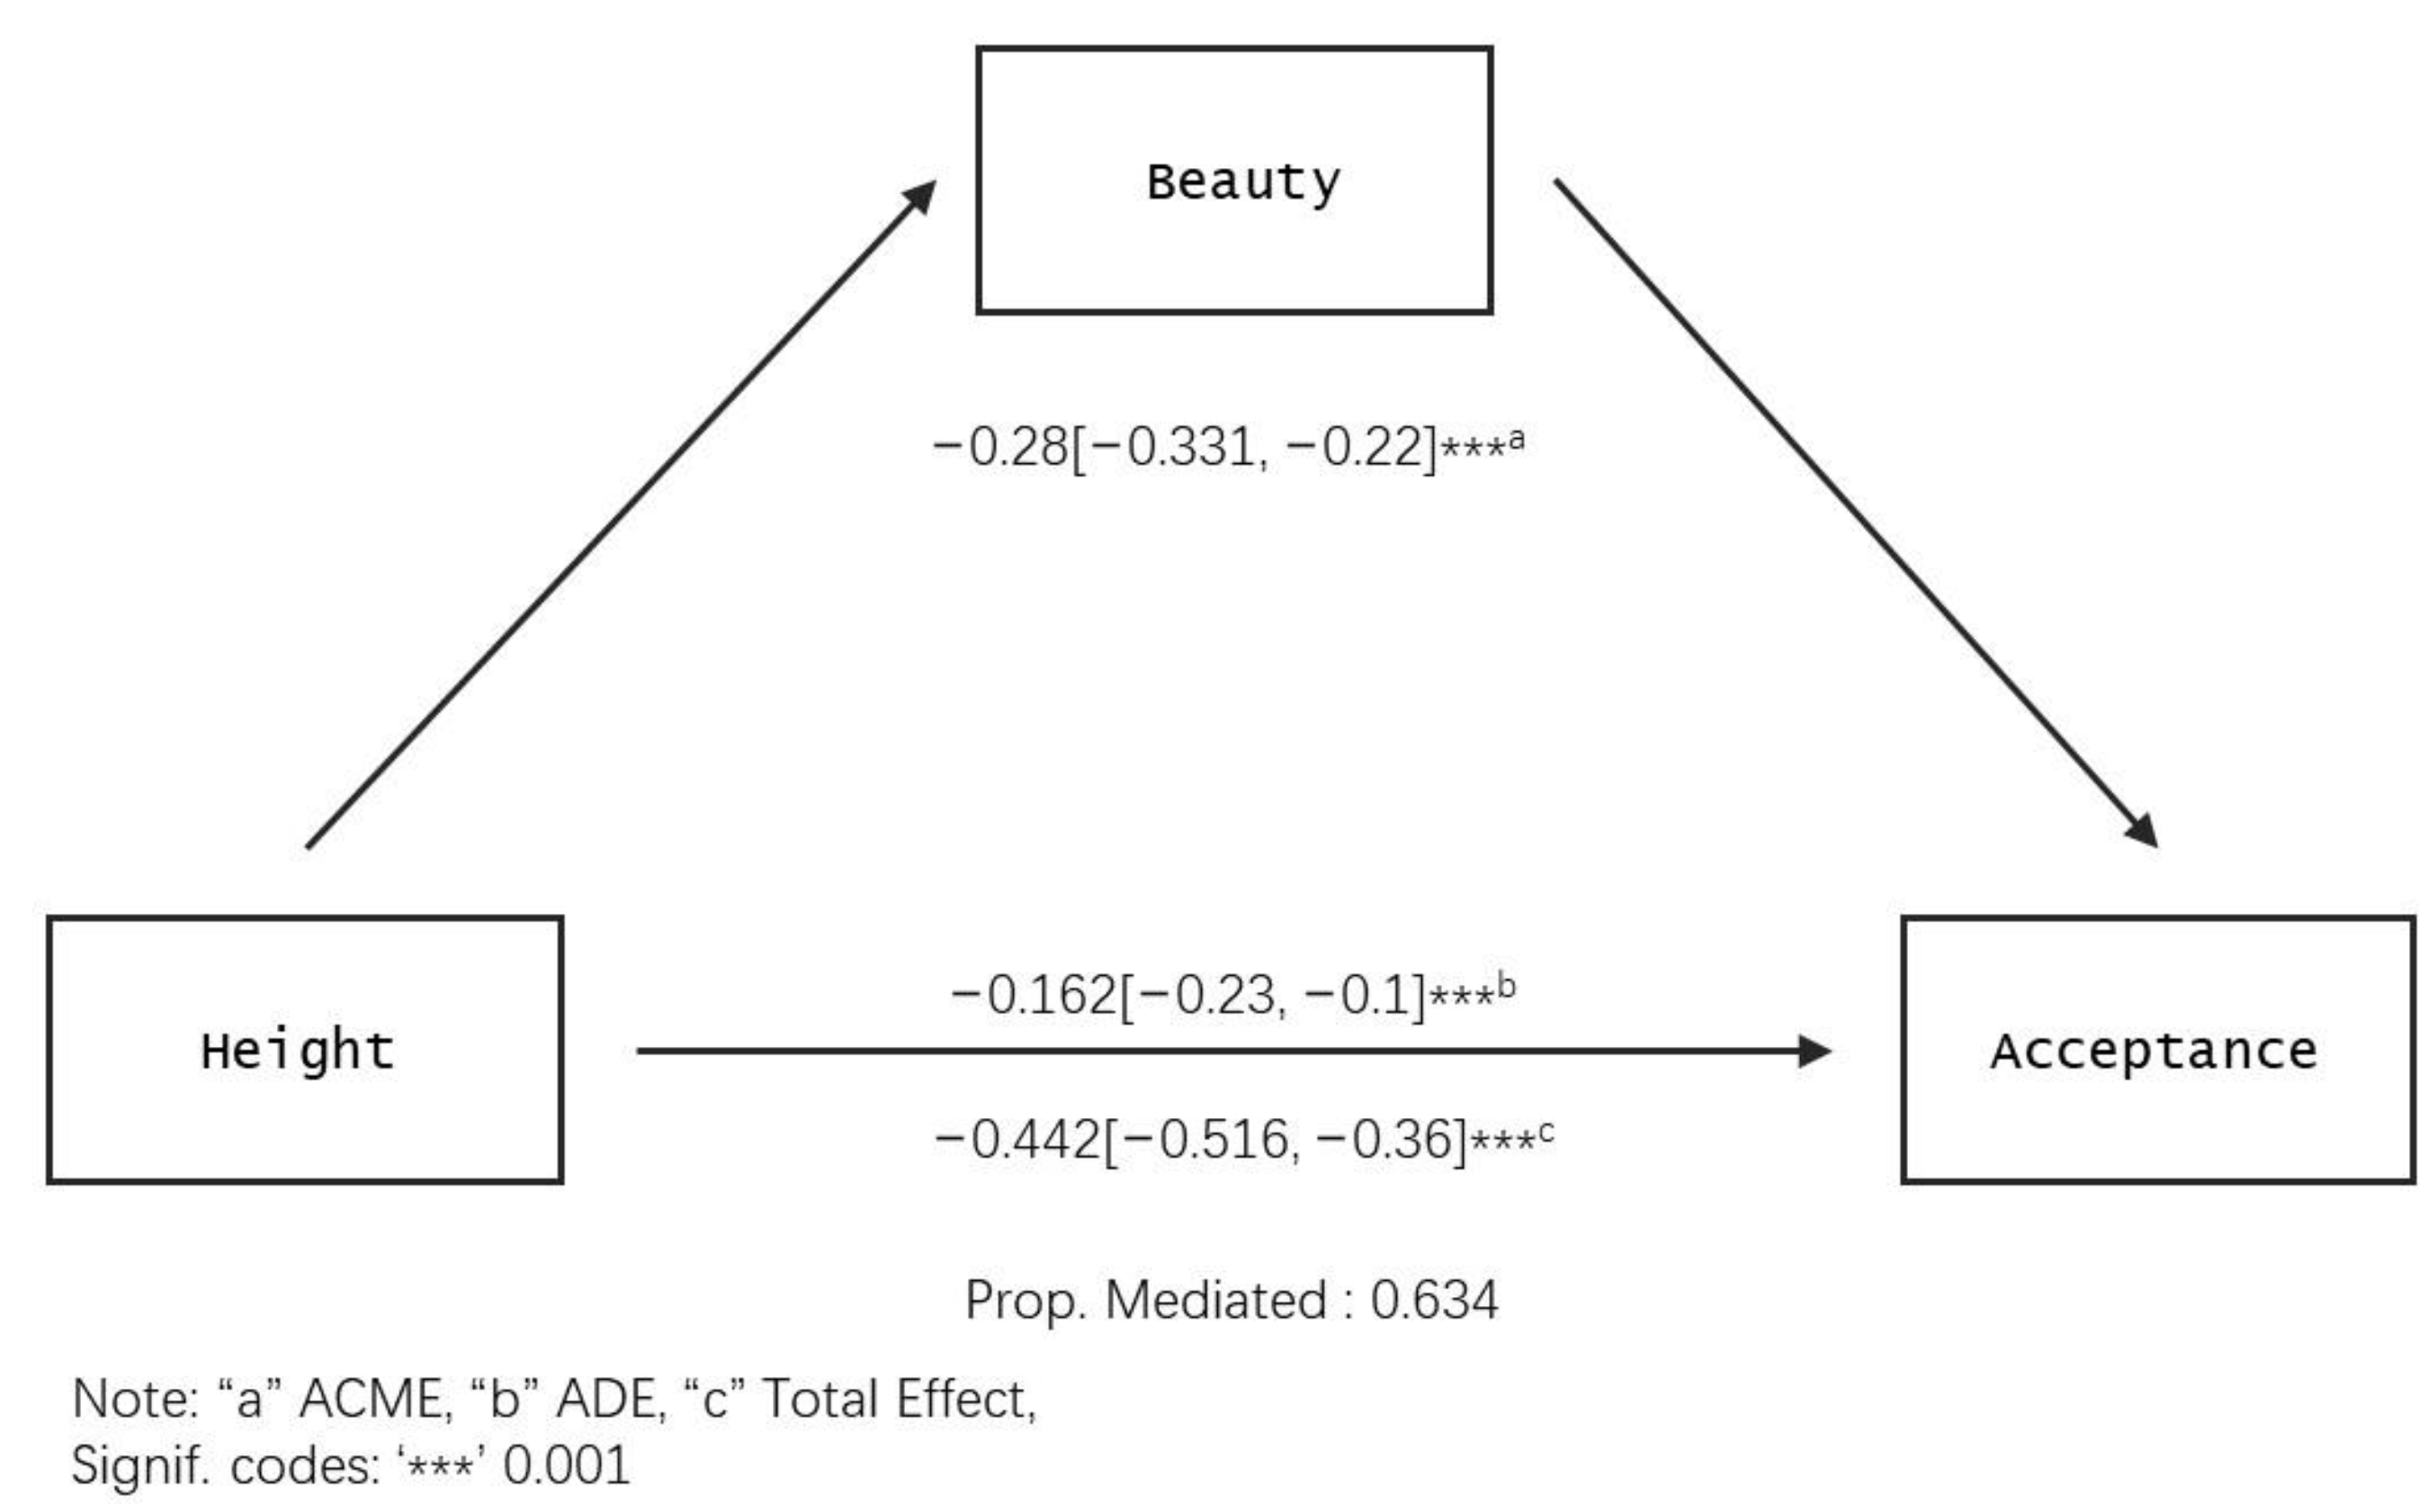
The results of the mediation effect test based on the independent variable “height” when the mediating variable is “beauty” are shown in Table 4. Therefore, the results of the other mediating variables will be omitted from the first step of the test (model.1). In the second step of the test (model.2), the coefficient of the influence of Height_2 on the mediating variable “beautiful” is −0.394 ***, with a p-value of <0.01 compared to Height_1; the coefficient of the influence of Height_3 on “Beauty” compared to Height_1 is −0.669 ***, with a p-value of <0.01. In the third step of the test (model.3), the coefficient of the influence of Height_2 on “Acceptance” compared to Height_1 is −0.162 ***, with a p-value of <0.01; the coefficient of the influence of Height_3 on “acceptance” compared to Height_1 is −0.4 ***, with a p-value < 0.01. Additionally, the coefficient of the influence of the mediating variable “beauty” on “acceptance” is 0.711 ***, with a p-value of <0.01.
Figure 5 shows the results of the Bootstrapping test based on the independent variable “height”. The 95% CI Lower for ACME is −0.331, the 95% CI Upper is −0.22, the 95% CI does not include 0, and the p-value is <0.001 ***; the p-value for ADE is <0.001 ***. The p-value for total effect is <0.001 ****, and the ratio of mediated effect to total effect is about 63.2% (Prop. Mediated = 0.632 ***). Therefore, the mediation effect of “beauty” in the model is valid and it shows partial mediation.
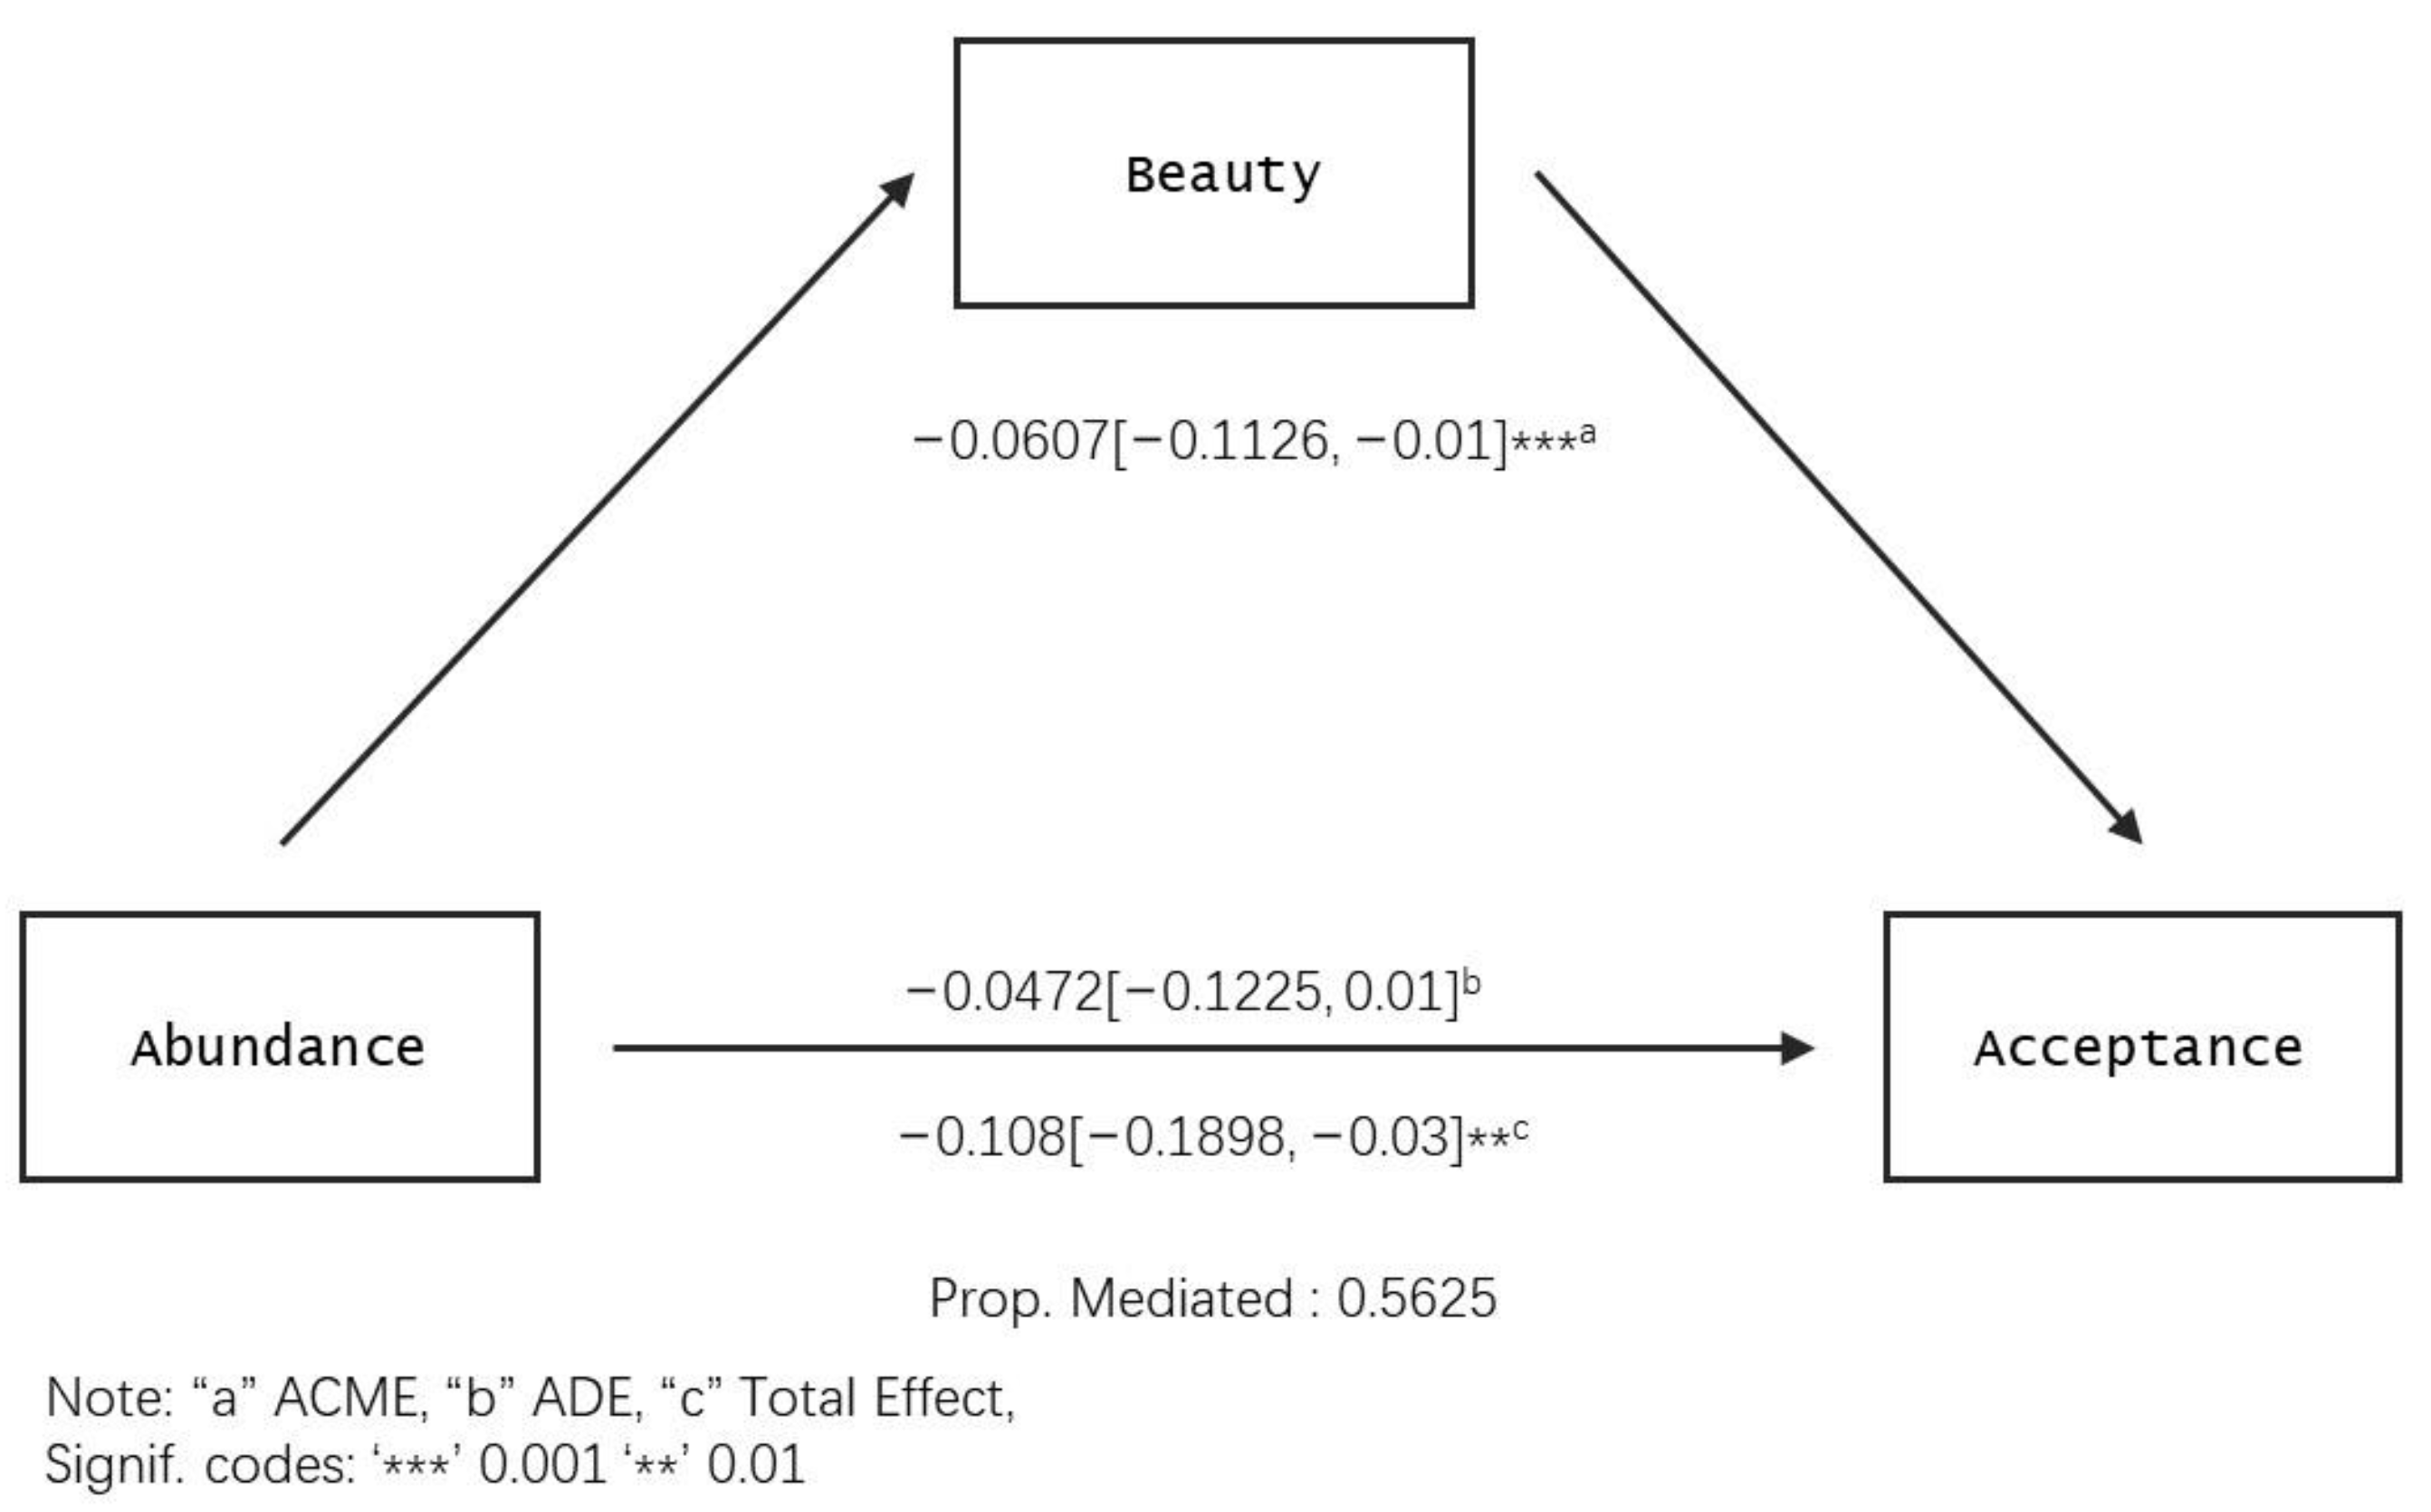
In the second step of the model, based on the independent variable “Abundance” (Table 4), the coefficient of the influence of Abundance_2 on the mediating variable “Beauty” is −0.085 ** compared to Abundance_1, with a p-value of <0.05; the coefficient of the influence of Abundance_3 on “Beauty” is −0.1 *** compared to Abundance_1, with a p-value of <0.05. In the third step of the test (model.3), the effect of Abundance_2 compared to Abundance_1 on “acceptance” is −0.047, with a p-value of >0.05; the coefficient of the influence of Abundance_3 on “acceptance” compared to Abundance_1 is −0.111 ***, with a p-value of <0.01. Figure 6 (bootstrapping test of abundance) shows the results of the bootstrapping test based on the independent variable “Abundance”. The lower 95% CI limit for ACME is −0.1126, the upper 95% CI limit is −0.01, the 95% CI does not include 0, and p < 0.001; the p-value for ADE is 0.12 > 0.05, and the p-value for the total effect is 0.004 **. Only the results for ADE are not statistically significant, and the mediation effect holds. In this model, the effect of “beauty” on “acceptance” is mediated and shows full mediation.
3.3.3. Results of the Analysis with the Mediating Variable “Relax”
The results of the mediation effect analysis based on the mediating variable “Relax” are summarized in Table 5, and the results of the Bootstrapping test are shown in Figure 7 and Figure S2.
Table 5.
Analysis of Mediating Effects models (Relax).
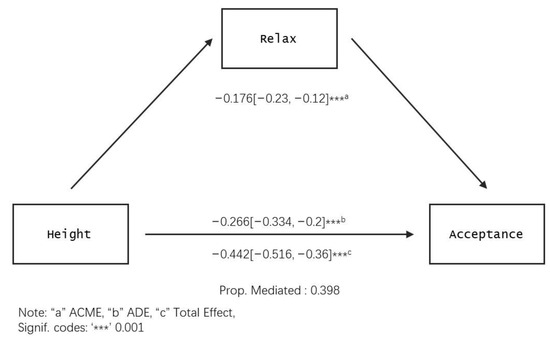
Figure 7.
Bootstrapping test of height (Relax).
The results of the mediation effect test based on “height” when the mediating variable is “Relax” are shown in Table 5. In the second step of the test (model.2), the coefficient of the influence of Height_2 on the mediating variable “Relax” is −0.254 *** compared with Height_1, with a p-value of <0.01; the coefficient of the influence of Height_3 on “Relax” compared to Height_1 is −0.508 ***, with a p-value of <0.01. Meanwhile, when controlling the mediating variable “Relax” in the third step of the test (model.3), the coefficient of the influence of Height_2 on “Acceptance” is −0.266 *** compared with Height_1, with a p-value of <0.01; the coefficient of the influence of Height_3 on “Acceptance” is −0.524 *** compared to Height_1, with a p-value of <0.01. Additionally, the coefficient of the influence of the mediating variable “Relax” on “acceptance” is 0.693 ***, with a p-value of <0.01.
Figure 7 shows the results of the Bootstrapping test based on the independent variable “height”. The 95% CI Lower for ACME is −0.23, the 95% CI Upper is −0.12, the 95% CI does not include 0, and the p-value is <0.001***; the p-value for ADE is <0.001 ***. The p-value for total effect is <0.001 ****, and the ratio of mediated effect to total effect is about 39.6% (Prop. Mediated = 0.396 ***). Therefore, the mediating role of “Relax” in the model in this study is valid and shows partial mediation.
In the second step of the test based on the independent variable “Abundance” (Table 5), the coefficient of the influence of Abundance_2 on the mediating variable “Relax” compared to Abundance_1 is −0.044, with a p-value of >0.05. The coefficient of the influence of Abundance_3 on the mediating variable “Relax” compared to Abundance_1 is −0.05, with a p-value of > 0.05. In the third step of the test (model.3), the effect of Abundance_2 on “Acceptance” is −0.077 ** compared to Abundance_1, with a p-value of <0.05; the coefficient of the influence of Abundance_3 on “acceptance” compared to Abundance_1 is −0.148 ***, with a p-value of <0.01. Figure S2 shows the results of the Bootstrapping test based on the independent variable “abundance”. The 95% CI Lower for ACME is −0.0823, the 95% CI Upper is 0.02, the 95% CI includes 0, and p > 0.05; the p-value for ADE is 0.12*, and the p-value for total effect is 0.004 **. The results for ACME are not statistically significant, so the mediating effect is not valid. The effect of “abundance” on “acceptance” in this model is direct.
3.3.4. Results of the Analysis with the Mediating Variable “Natural”
The results of the mediation effect analysis based on the mediating variable “Natural” are summarized in Table S1, and the results of the Bootstrapping test are shown in Figures S3 and S4.
Table S1 shows that when the mediating variable is “Natural”, the coefficient of the influence of Height_2 on the mediating variable is −0.057 compared to Height_1, with a p-value of >0.05. The coefficient of the influence of Abundance_3 is −0.094 compared to Height_1, with a p-value of >0.05; the coefficient of the influence of Height_3 compared to Height_1 is −0.094, with a p-value of >0.05. The coefficient of the influence of Abundance_2 on the mediating variable “Natural” compared to Abundance_1 is 0.059, with a p-value of > 0.05; the coefficient of the influence of Abundance_3 on the mediating variable “Natural” compared to Abundance_1 is 0.018, with a p-value of >0.05. The coefficient of the influence of the mediating variable “Natural” on “Acceptance” is 0.399 ***. The results of the Bootstrapping test based on the independent variable “Height” (Figure S3) show that the 95% CI Lower for ACME is −0.0613, the 95% CI Upper is 0.01, and the 95% CI includes 0, with a p-value of > 0.05; ADE has a p-value of <0.001 ***, and total effect has a p-value of <0.001 ***. The results for ACME are not statistically significant. The results of the Bootstrapping test based on the independent variable “abundance” in Figure S4 show that the 95% CI Lower for ACME is −0.0136, the 95% CI Upper is 0.06, and the 95% CI includes 0, with a p > 0.05; the p-value for ADE is <0.001 ***, and total effect has a p-value of 0.004 **. the ACME results are not statistically significant. Therefore, when “Natural” is the mediating variable, the mediation effect models for different “heights” and “abundances” are not valid.
3.3.5. Results of the Analysis with the Mediating Variable “Safe”
The results of the mediation effect analysis based on the mediating variable “Safe” are summarized in Table 6, and the results of the Bootstrapping test are shown in Figure 8 and Figure 9.
Table 6.
Analysis of Mediating Effects models (Safe).

Figure 8.
Bootstrapping test of height (Safe).

Figure 9.
Bootstrapping test of abundance (Safe).
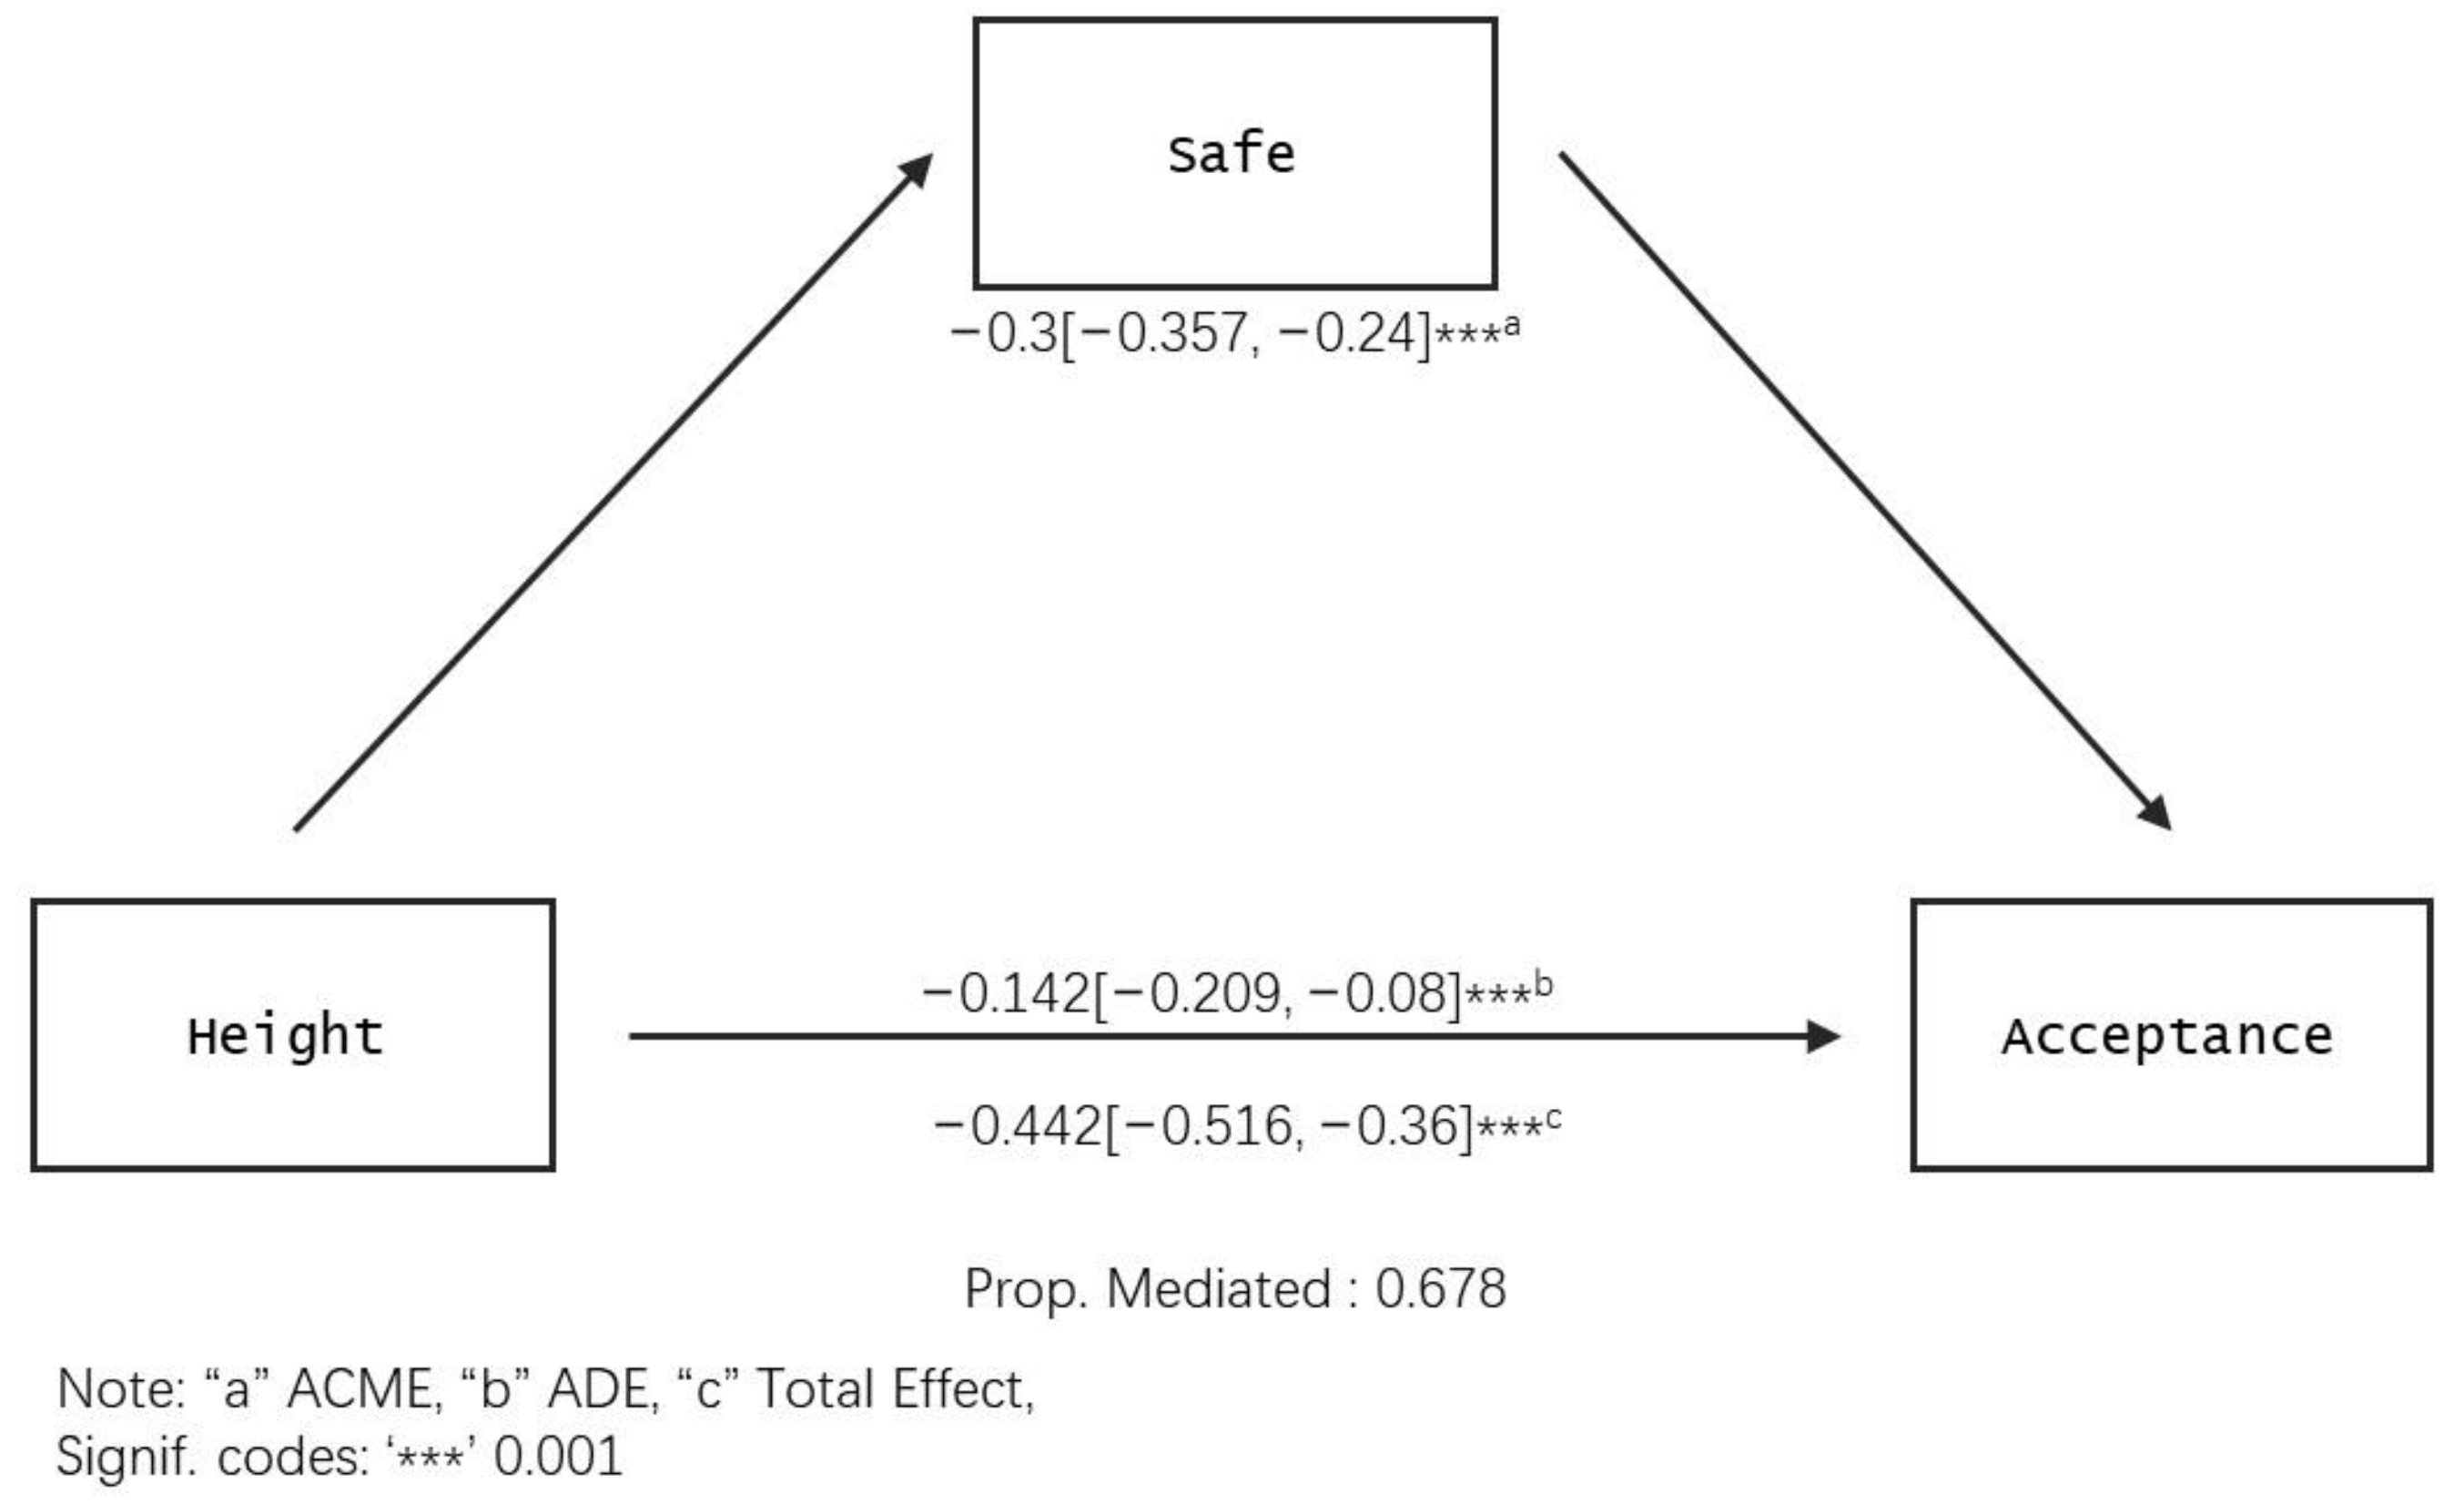
The results of the mediation effect analysis based on “Height” when the mediating variable is “Safe” are shown in Table 6. In the second step of the test (model.2), the coefficient of the influence of Height_2 on the mediating variable “Safe” is −0.378 *** compared with Height_1, with a p-value of <0.01; the coefficient of the influence of Height_3 on the mediating variable “Safe” compared with Height_1 is −0.75 ***, with a p-value of <0.01. Meanwhile, when controlling the mediating variable “Safe” in the third step of the test (model.3), the coefficient of the influence of Height_2 on “Acceptance” is −0.142 *** compared with Height_1, with a p-value of <0.01; the coefficient of the influence of Height_3 on “Acceptance” compared with Height_1 is −0.282 ***, with a p-value of <0.01. Additionally, the coefficient of the influence of the mediating variable “Safe” on “acceptance” is 0.792 ***, with a p-value of <0.01.
Figure 8 shows the results of the Bootstrapping test based on the independent variable “Height”. The 95% CI Lower for ACME is −0.357, the 95% CI Upper is −0.24, the 95% CI does not include 0, and the p-value is <0.001 ***; the p-value for ADE is <0.001 ***, and the p-value for total effect is <0.001 ****. This indicates that the mediation effect is established and the ratio of mediation to total effect is about 67.7% (Prop. Mediated = 0.677 ***), which shows partial mediation.
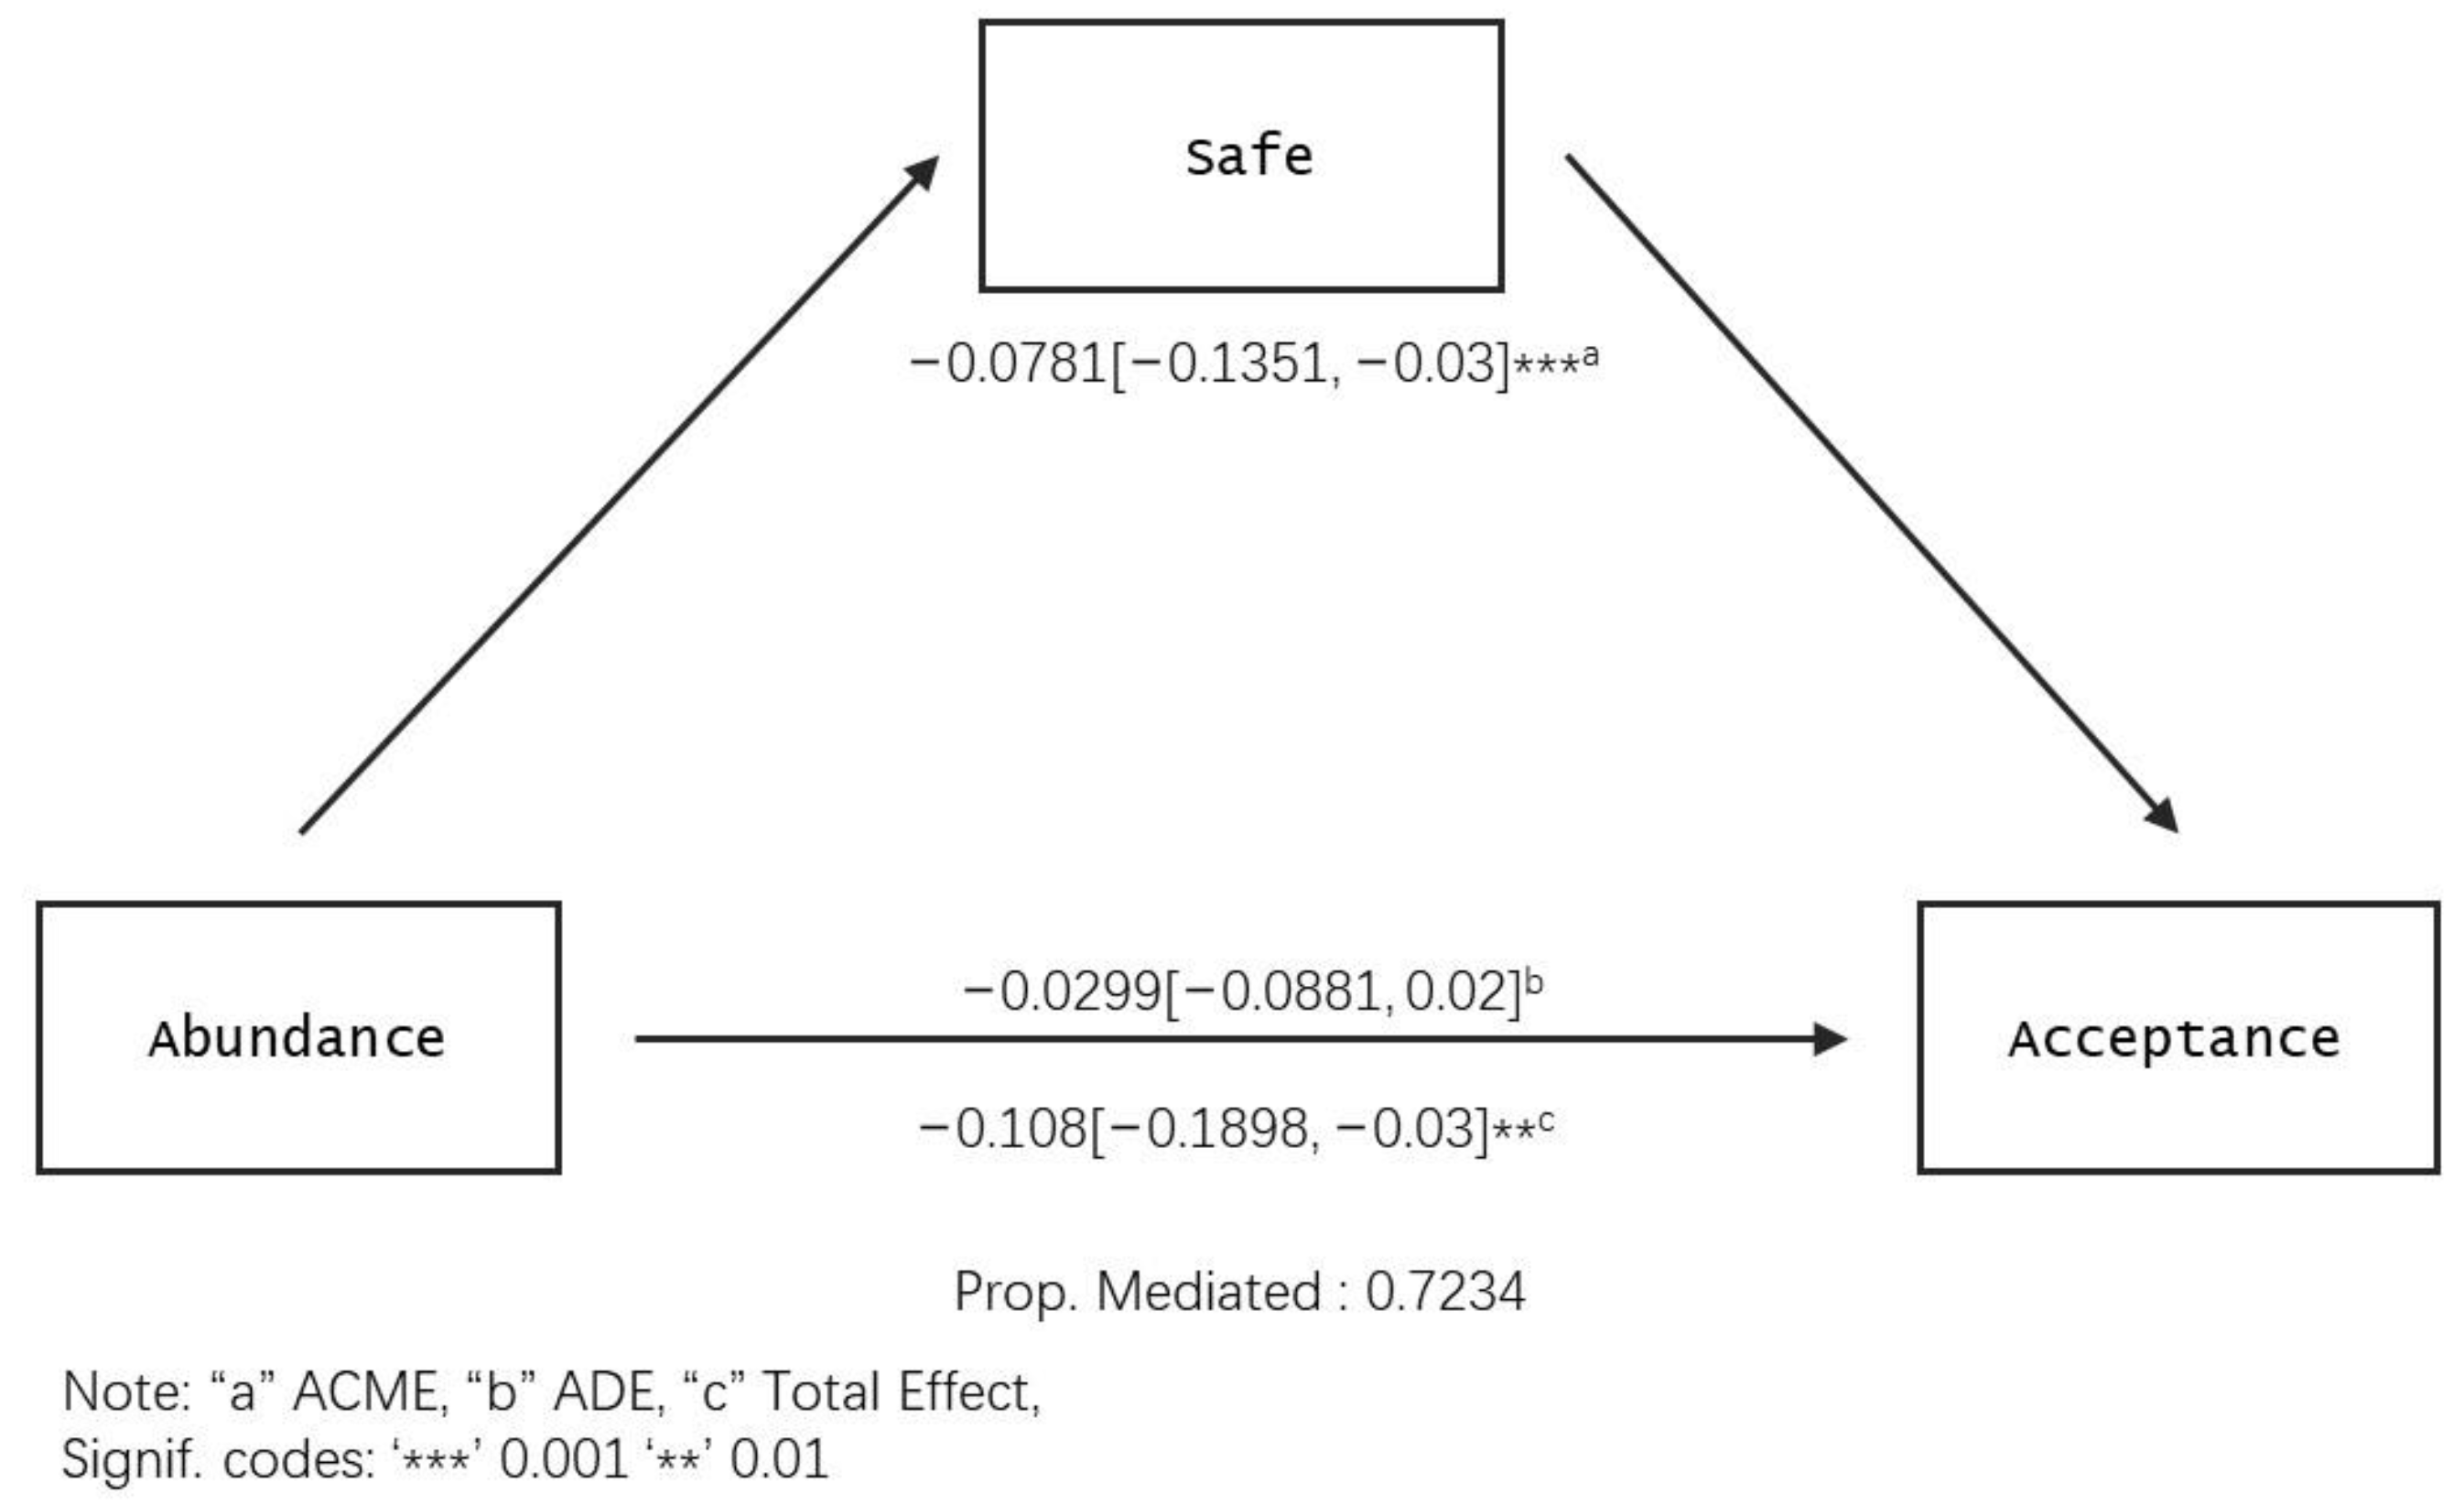
In the second step of the test based on the independent variable “Abundance” (Table 6), the coefficient of the influence of Abundance_2 compared to Abundance_1 on the mediating variable “Safe” is −0.099 **, with a p-value of <0.05. The coefficient of Abundance_3 on “Relax” is −0.115 *** compared to Abundance_1, with a p-value of <0.01. In the third step of the test (model.3), the effect of Abundance_2 on “Acceptance” is −0.03 compared to Abundance_1, with a p-value of >0.05; the coefficient of the influence of Abundance_3 on “acceptance” compared to Abundance_1 is −0.091 ***, with a p-value of <0.01. Figure 9 shows the results of the Bootstrapping test based on the independent variable “abundance”. The 95% CI Lower for ACME is −0.1351, the 95% CI Upper is −0.03, the 95% CI does not include 0, and the p-value is 0.004 **; ADE has a p-value of 0.328, which is not statistically significant, and total effect has a p-value of 0.008 **. Therefore, in this model, the mediation effect holds and shows full mediation.
4. Discussion
4.1. Acceptance of Urban Wildscapes in Japan
Several countries in Europe and the United States have already implemented regulations and related programs for UWSs, and some results have been achieved [30,31,32]. To investigate the feasibility of implementing UWSs in Japan, we determined the acceptance level of the population through a questionnaire survey. Table 2 shows that most people in Japan have a low level of acceptance of UWSs in vacant lots, and most gave a score of 3 or less in response to the question of whether they are acceptable or not. This suggests that people in the Japanese region are unable to accept the presence of unmaintained UWSs near their homes. These findings are different from those of Hwang et al. (2019) [42] and Brun et al. (2018) [40]. This may be because public acceptance of greenery is largely influenced by the environmental context [55,56], and utilitarian values are a stronger preference factor than eco-centric or aesthetic values [42].
The present study was conducted on vacant lots in residential areas in Japan. These vacant lots are often associated with empty homes, which are also caused by population decline. The latter often causes safety problems, such as “house collapses” and “causes crime”, as well as health problems such as “littering” and “attracting poisonous insects” [57]. It also leads to accompanying economic problems such as falling land prices in the surrounding areas.
It is also important to consider that the socio-cultural backgrounds of different groups have an impact on attitudes toward nature [58,59,60]. In Japan, people often view themselves and others as members of a collective unit or group. Members of a group are collectively responsible for the performance and behavior of individuals [61]. Therefore, the occurrence of a UWS quilt on vacant lots would also be regarded as a sign that the owner has failed to comply with the relevant laws [62], which causes resentment.
4.2. Attempts to Explain Wildness in Terms of Abundance and Height
In this study, we tried to discuss “wildness” in two dimensions: “Height” and “Abundance”. We categorized “Height” and “Abundance” into three levels and used them as independent variables. “Preferences”, “ beauty”, “ relax”, “ natural”, and “safe” were tested as the mediating variables and “acceptance” as the dependent variable for mediation effect analysis.
The results show that an increase in both “Height” and “Abundance” leads to a decrease in acceptance (Table 3). Moreover, the influence coefficient of “Height” (−0.442 ***, −0.876 ***) is significantly larger than that of “Abundance” (−0.108 ***, −0.182 ***). This indicates that the influence of “Height” is greater than that of “Abundance”. Moreover, people show significantly different sensitivities to “Height” and “Abundance” when mediated by different mediators: “Height” has no effect on “Natural”, while abundance only has an effect on “Beauty” and “Safe”. Both indications suggest that while increasing abundance also reduces acceptance, height is the main cause of aversion.
We believe this is because height is an obvious and directly observable attribute that anyone can visually observe. Additionally, an increase in height significantly reduces the legibility and safety of a site. According to Appleton’s prospect–refuge theory (1996) [63], it can be concluded that there is a negative correlation between perceived hazards and preferences in urban environments. People dislike them not because of the naturalness itself, but because of the side effects that come with it, such as reduced visibility and danger [64]. An increase in height makes it easier to obscure people’s field of view, providing hiding places for potential attackers. Additionally, by obscuring a person’s field of view, it makes it impossible for them to understand what is happening around them and to react quickly in an emergency [64]. Wide and clear views give a person a greater sense of security. Women, on the other hand, are generally perceived to have more concerns about safety. Especially at night, the feeling of safety in a reduced field of vision may become the only factor that dominates perception. Additionally, reduced visibility can also reduce the level of social control, which is an important component of feeling safe [65].
Perceptions of abundance, on the other hand, are different. Phillips has demonstrated that people are highly likely to underestimate the diversity of species in a landscape based solely on its visual appearance, and their perception is highly influenced by their underlying level of expertise [21]. Perceived changes in abundance require sites to have significant differences between plant species and also require respondents to have a certain level of plant-related knowledge. These factors may account for the much greater influence of height than abundance in the perception of UWSs. Additionally, other studies have demonstrated that an appropriate increase in abundance can even improve acceptance and preference [40,42,44].
In contrast to previous studies that used the “natural successional stage of plants” and “moderateness” to express wildness, the use of “height” and “abundance” to quantify the degree of wildness may explain why there is often a contradiction in past studies whereby “people’s attitudes toward UWS range from acceptance or antipathy” [40,42]. This is because, excluding the influence of cultural factors, even in the same stage of natural succession, there may be other reasons leading to completely different heights and abundances, and thus, completely different evaluations. Studies based in France, Singapore, and Germany have all concluded that “people can accept moderate levels of UWSs” [40,42,43]. However, the sites in these studies are not necessarily similar due to geographic location. Moreover, vague language makes it difficult to provide a clear basis for policymakers and managers. The methodology used in this paper can go some way toward spanning the different levels of acceptance due to geography, i.e., height and abundance are measurable, globally generalized, objective data. It can also provide a relatively clear basis.
4.3. Results of Mediating Effects of Height and Abundance
When “Height” is used as the independent variable, the models with “Preference”, “Beauty”, “Relax”, and “Safe” as the mediating variables are all valid and are all partial mediation models. The percentages of ACME are 49.6%, 63.4%, 39.8%, and 67.8%, respectively. This suggests that “Height” not only affects the acceptance level through the above four mediators but also has a direct negative impact on the acceptance level, especially in the case of “Preference”. In particular, for “Preference” and “Relax”, the proportion of mediating factors is less than 50%. This suggests that although we can influence mediators such as “Preference” to improve acceptance through other means, the direct negative effect of height on acceptance cannot be avoided, and the percentage of this direct effect (ADE) is relatively high. Therefore, it seems that the negative effect of height is an unavoidable barrier to “increasing the acceptance of UWS”.
The mediation effect test with “Abundance” as the dependent variable shows that the mediation effect only holds when “Beauty” and “Safe” are the mediating conditions, and both are full mediators. This shows that under these two intermediary conditions, the impact of “Abundance” on “Acceptance” is caused entirely by intermediary factors, and it will not have a direct negative impact on “Acceptance”. This may explain the conclusion in the previous study that “medium-abundance UWSs are well accepted” [40,44]. Because higher abundance represents a greater chance of the presence of flowering plants on non-artificially planted sites, Lindemann-Matthies et al. (2006) have demonstrated that more flowers are an important factor in improving acceptance [66]. Additionally, from Model.3 (Table 2 and Table 5), it is found that only “Abundance3” and “Abundance1” have significant differences, which indicates that people’s perception of “Abundance” is not sensitive, and it takes a large difference to affect “Acceptance”. In this case, if “Beauty” and “Safe” are increased by other means, then the negative impact of “Abundance” in these two dimensions can be reduced to some extent by manual intervention. In addition, model.2 shows that the effect of “Abundance” on factors such as “Preference”, “Relax”, and “Natural” is not significant. This indicates that an increase in “Abundance” does not affect people’s perception of these dimensions, but directly affects their “Acceptance”. In this case, the direct negative impact of an increase in abundance is unavoidable, but from another perspective, factors that are increased in other ways, such as “Preference”, “Relax”, and “Natural”, are not negatively impacted by abundance.
4.4. Proposal of Management Strategies That Increase UWSs in Response to Differences in Height and Abundance
In order to successfully implement UWSs and maximize their health benefits, we need to increase the “wildness” of green spaces in cities. From the above analysis, we can see that both “height” and “abundance” have a direct or indirect negative impact on “acceptance”. However, compared with “abundance”, “height” has a stronger impact and more mediating factors. This effect cannot be controlled by methods other than reducing plant height. On the other hand, the negative effect of abundance on acceptance is smaller than that of height. There are fewer mediators of this effect, and greater differences in abundance are needed for it to have an effect. Importantly, the negative impact of abundance can be reduced and controlled by methods other than “reducing abundance”.
From these results, we concluded that to increase UWSs in vacant lots in Japan, the first step should be to avoid the negative impacts caused by excessive plant height. Pioneer vegetation can be effectively controlled by sowing seeds of low-growing plants at the initial stage of vacant lot generation and utilizing limited survival resources to reduce the number of plants that are too tall. More flowers are favored in wild greenery [42], so incorporating more flowering species is also an effective method. Regarding artificial structures and other ways to improve site accessibility and safety, sites should be chosen in relatively public and densely populated areas to minimize utilitarianism and concerns about safety.
4.5. Limitations
However, there are some limitations to this study. First, all the photos were taken during the plants’ growing season, since most plants wither in winter, there would be a different visual effect, which may somewhat affect the results. In addition, the density of plant growth also affects people’s perception, but in Japan, the vacant lots in this study are private land and we could not measure the density of plants. In addition, only 400 people in Chiba Prefecture were sampled in this study, and a larger, more extensive sample is necessary if we want to understand the acceptance of UWSs among Japanese residents. Additionally, photos of different areas such as Hokkaido and Okinawa are needed as material.
5. Conclusions
This study explored the acceptance of urban wildscapes among Japanese residents through a questionnaire survey and a mediated effects analysis of the effects of height and abundance on acceptance. The results showed that Japanese residents were less receptive to UWSs in vacant lots, with most residents giving acceptance ratings of 3 or less in the questionnaire. This indicates that Japanese residents are less accepting of unmaintained UWSs in their neighborhoods, which is not in line with the findings of some prior studies. The reasons for this may be different socio-cultural backgrounds and the surroundings of the study site.
Increased height significantly affected mediating variables such as “Preference”, “Beauty”, “Relax”, and “Safe”, and the negative effect of height on acceptance could not be controlled for in any other way. An increase in abundance also reduced acceptance but with a smaller influence coefficient. Abundance had a significant effect on the mediating variables “Beauty” and “Safe”, but not on “Preference”, “Relax”, and “Natural”. The negative effect of abundance can be attenuated by manual intervention. The negative effect of height on acceptance was greater, with more factors influencing the mediating variable that could not be controlled for other than by reducing height. The negative effect of abundance on acceptance is smaller and can be attenuated by manual intervention.
UWSs have ecological, health, and social benefits at the same time. Based on our research, the government can provide landowners with clear, sustainable management practices and guidance. Currently, most of the private management of autochthonous plants in vacant lots is inefficient or can cause land pollution. The results of this study can be used as a guide to help landowners carry out management practices that are simpler and more economical and retain the health effects of green spaces. The focus should be on controlling height and improving the aesthetic value of the landscape. For example, the government could specify how much plant height is permitted. Additionally, specific plant seeds could be provided to landowners to control pioneer vegetation (e.g., shorter vegetation or more flowering plants) that takes over the limited living resources in vacant lots. This would not only reduce private land management pressures, but also help maintain optimal levels of UWSs to maximize public acceptance. Over time it may even hopefully improve resident attitudes and perceptions of UWSs. The same applies to other countries and regions with aging populations and slow economic development.
Supplementary Materials
The following supporting information can be downloaded at: https://www.mdpi.com/article/10.3390/land13071048/s1.
Author Contributions
Conceptualization, D.S., J.C., S.L. and T.K.; methodology, D.S., J.C. and H.L.; software, D.S., J.C., W.R. and J.X.; formal analysis, D.S., W.R. and H.W.; investigation, D.S. and F.S.; data curation, D.S.; writing—original draft preparation, D.S.; writing—review and editing, D.S., J.C., W.R. and T.K.; visualization, D.S.; supervision, T.K.; project administration, T.K.; funding acquisition, T.K. All authors have read and agreed to the published version of the manuscript.
Funding
This work was supported by the Japan Society for the Promotion of Science, funding number 24K08970.
Data Availability Statement
The original contributions presented in the study are included in the article and Supplementary Materials, further inquiries can be directed to the corresponding author.
Conflicts of Interest
The authors declare no conflicts of interest.
References
- Division, U.P. The World’s Cities in 2016: Data Booklet; United Nation: New York, NY, USA, 2016; ISBN 978-92-1-151549-7. [Google Scholar]
- Hu, X. Environmental Sustainability and the Residential Environment of the Elderly: A Literature Review. Build. Environ. 2021, 206, 108337. [Google Scholar] [CrossRef]
- Peen, J.; Schoevers, R.A.; Beekman, A.T.; Dekker, J. The Current Status of Urban-Rural Differences in Psychiatric Disorders. Acta Psychiatr. Scand. 2010, 121, 84–93. [Google Scholar] [CrossRef] [PubMed]
- Cerin, E. Building the Evidence for an Ecological Model of Cognitive Health. Health Place 2019, 60, 102206. [Google Scholar] [CrossRef] [PubMed]
- Nieuwenhuijsen, M.J. Influence of Urban and Transport Planning and the City Environment on Cardiovascular Disease. Nat. Rev. Cardiol. 2018, 15, 432–438. [Google Scholar] [CrossRef] [PubMed]
- Jorgensen, A.; Keenan, R. Urban Wildscapes; Routledge: London, UK, 2012; ISBN 978-1-136-66283-6. [Google Scholar]
- Matsuoka, R.H.; Kaplan, R. People Needs in the Urban Landscape: Analysis of Landscape And Urban Planning Contributions. Landsc. Urban Plan. 2008, 84, 7–19. [Google Scholar] [CrossRef]
- Coley, R.L.; Sullivan, W.C.; Kuo, F.E. Where Does Community Grow?: The Social Context Created by Nature in Urban Public Housing. Environ. Behav. 1997, 29, 468–494. [Google Scholar] [CrossRef]
- Europe, W.H.O. Urban Green Spaces: A Brief for Action. World Health Organization. Abgerufen von. 2017. Available online: https://apps.who.int/iris/handle/10665/344116 (accessed on 9 January 2024).
- Thompson, C.W. Places to Be Wild in Nature. In Urban Wildscapes; Routledge: London, UK, 2011; pp. 49–63. ISBN 978-0-203-80754-5. [Google Scholar]
- Rupprecht, C.D.D. Informal Urban Green Space: Residents’ Perception, Use, and Management Preferences across Four Major Japanese Shrinking Cities. Land 2017, 6, 59. [Google Scholar] [CrossRef]
- Ministry of Finance. Japanese Public Finance Fact Sheet; Ministry of Finance: Tokyo, Japan, 2023. [Google Scholar]
- Sikorska, D.; Ciężkowski, W.; Babańczyk, P.; Chormański, J.; Sikorski, P. Intended Wilderness as a Nature-Based Solution: Status, Identification and Management of Urban Spontaneous Vegetation in Cities. Urban For. Urban Green. 2021, 62, 127155. [Google Scholar] [CrossRef]
- Aram, F.; García, E.H.; Solgi, E.; Mansournia, S. Urban Green Space Cooling Effect in Cities. Heliyon 2019, 5, e01339. [Google Scholar] [CrossRef]
- Bolund, P.; Hunhammar, S. Ecosystem Services in Urban Areas. Ecol. Econ. 1999, 29, 293–301. [Google Scholar] [CrossRef]
- Kim, G.; Miller, P.A.; Nowak, D.J. Urban Vacant Land Typology: A Tool for Managing Urban Vacant Land. Sustain. Cities Soc. 2018, 36, 144–156. [Google Scholar] [CrossRef]
- Schilling, J.; Logan, J. Greening the Rust Belt: A Green Infrastructure Model for Right Sizing America’s Shrinking Cities. J. Am. Plan. Assoc. 2008, 74, 451–466. [Google Scholar] [CrossRef]
- Threlfall, C.G.; Kendal, D. The Distinct Ecological and Social Roles That Wild Spaces Play in Urban Ecosystems. Urban For. Urban Green. 2018, 29, 348–356. [Google Scholar] [CrossRef]
- Gandy, M. Natura Urbana: Ecological Constellations in Urban Space; The MIT Press: Cambridge, MA, USA; London, UK, 2022; ISBN 978-0-262-04628-2. [Google Scholar]
- Li, X.-P.; Fan, S.-X.; Hao, P.-Y.; Dong, L. Temporal Variations of Spontaneous Plants Colonizing in Different Type of Planted Vegetation-a Case of Beijing Olympic Forest Park. Urban For. Urban Green. 2019, 46, 126459. [Google Scholar] [CrossRef]
- Phillips, D.; Lindquist, M. Just Weeds? Comparing Assessed and Perceived Biodiversity of Urban Spontaneous Vegetation in Informal Greenspaces in the Context of Two American Legacy Cities. Urban For. Urban Green. 2021, 62, 127151. [Google Scholar] [CrossRef]
- Proske, A.; Lokatis, S.; Rolff, J. Impact of Mowing Frequency on Arthropod Abundance and Diversity in Urban Habitats: A Meta-Analysis. Urban For. Urban Green. 2022, 76, 127714. [Google Scholar] [CrossRef]
- Evolution and Future of Urban Ecological Science: Ecology in, of, and for the City | Ecosystem Health and Sustainability. Available online: https://spj.science.org/doi/full/10.1002/ehs2.1229 (accessed on 28 April 2023).
- Fuller, R.A.; Irvine, K.N.; Devine-Wright, P.; Warren, P.H.; Gaston, K.J. Psychological Benefits of Greenspace Increase with Biodiversity. Biol. Lett. 2007, 3, 390–394. [Google Scholar] [CrossRef] [PubMed]
- Samus, A.; Freeman, C.; van Heezik, Y.; Krumme, K.; Dickinson, K.J.M. How Do Urban Green Spaces Increase Well-Being? The Role of Perceived Wildness and Nature Connectedness. J. Environ. Psychol. 2022, 82, 101850. [Google Scholar] [CrossRef]
- Colley, K.; Craig, T. Natural Places: Perceptions of Wildness and Attachment to Local Greenspace. J. Environ. Psychol. 2019, 61, 71–78. [Google Scholar] [CrossRef]
- Rupprecht, C.D.D.; Byrne, J.A.; Ueda, H.; Lo, A.Y. ‘It’s Real, Not Fake like a Park’: Residents’ Perception and Use of Informal Urban Green-Space in Brisbane, Australia and Sapporo, Japan. Landsc. Urban Plan. 2015, 143, 205–218. [Google Scholar] [CrossRef]
- Burgen, S. Bat Boxes, “Greened” Streets and Bug Hotels: Barcelona Embraces Its Wild Side. The Guardian, 31 January 2021. Available online: https://www.theguardian.com/environment/2021/jan/31/bat-boxes-greened-streets-and-insect-hotels-barcelona-embraces-its-wild-side-aoe (accessed on 29 March 2023).
- Highline. Keep It Wild: Celebrating Native Plants; Highline: New York, NY, USA. Available online: https://www.thehighline.org/nativeplants/ (accessed on 29 March 2023).
- Weston, P.; Going Wild? A Radical Green Plan for Nottingham’s Unloved Shopping Centre. The Guardian, 4 December 2020. Available online: https://www.theguardian.com/environment/2020/dec/04/going-wild-the-radical-green-plans-for-nottingham-post-covid-regeneration-aoe (accessed on 29 March 2023).
- Comhairle Cathrach Bhaile Átha Cliath Dublin City Biodiversity Action Plan 2021-2025|Dublin City Council. Available online: https://www.dublincity.ie/residential/parks/strategies-and-policies/biodiversity-action-plan-2021-2025 (accessed on 19 April 2024).
- Programmbüro Bundesprogramm Biologische Vielfalt Städte Wagen Wildnis | BFN. Available online: https://www.bfn.de/projektsteckbriefe/staedte-wagen-wildnis (accessed on 19 April 2024).
- Okuro, T.; Yamada, S. Current Status and Potential of Greening with Native Herbaceous Plants. J. Jpn. Inst. Landsc. Archit. 2023, 86, 302–305. [Google Scholar] [CrossRef]
- Mishima, Y. Our Meadow, Our City. J. Jpn. Inst. Landsc. Archit. 2023, 86, 310–313. [Google Scholar] [CrossRef]
- Matsudo City Office, U.D.D. Nature Observation House. Available online: https://www.city.matsudo.chiba.jp/shisetsu-guide/kouen_ryokuka/top/shisetuannnai/sizenkansatusya.html (accessed on 23 June 2024).
- Lyytimäki, J.; Petersen, L.K.; Normander, B.; Bezák, P. Nature as a Nuisance? Ecosystem Services and Disservices to Urban Lifestyle. Environ. Sci. 2008, 5, 161–172. [Google Scholar] [CrossRef]
- Skår, M. Forest Dear and Forest Fear: Dwellers’ Relationships to Their Neighbourhood Forest. Landsc. Urban Plan. 2010, 98, 110–116. [Google Scholar] [CrossRef]
- Bixler, R.D.; Floyd, M.F. Nature Is Scary, Disgusting, and Uncomfortable. Environ. Behav. 1997, 29, 443–467. [Google Scholar] [CrossRef]
- Whatmore, S. Hybrid Geographies: Rethinking the ‘Human’ in Human Geography. In Environment; Routledge: London, UK, 2008; ISBN 978-1-315-25635-1. [Google Scholar]
- Brun, M.; Di Pietro, F.; Bonthoux, S. Residents’ Perceptions and Valuations of Urban Wastelands Are Influenced by Vegetation Structure. Urban For. Urban Green. 2018, 29, 393–403. [Google Scholar] [CrossRef]
- Simandan, D. The Wise Stance in Human Geography. Trans. Inst. Br. Geogr. 2011, 36, 188–192. [Google Scholar] [CrossRef]
- Hwang, Y.H.; Yue, Z.E.J.; Ling, S.K.; Tan, H.H.V. It’s Ok to Be Wilder: Preference for Natural Growth in Urban Green Spaces in a Tropical City. Urban For. Urban Green. 2019, 38, 165–176. [Google Scholar] [CrossRef]
- Weber, F.; Kowarik, I.; Säumel, I. A Walk on the Wild Side: Perceptions of Roadside Vegetation beyond Trees. Urban For. Urban Green. 2014, 13, 205–212. [Google Scholar] [CrossRef]
- de la Fuente de Val, G. The Effect of Spontaneous Wild Vegetation on Landscape Preferences in Urban Green Spaces. Urban For. Urban Green. 2023, 81, 127863. [Google Scholar] [CrossRef]
- Mathey, J.; Arndt, T.; Banse, J.; Rink, D. Public Perception of Spontaneous Vegetation on Brownfields in Urban Areas—Results from Surveys in Dresden and Leipzig (Germany). Urban For. Urban Green. 2018, 29, 384–392. [Google Scholar] [CrossRef]
- Zube, E.H.; Pitt, D.G. Cross-Cultural Perceptions of Scenic and Heritage Landscapes. Landsc. Plan. 1981, 8, 69–87. [Google Scholar] [CrossRef]
- Chiba Prefectural Government. Chiba Prefecture Monthly Resident Population Survey Report; Chiba Prefectural Government: Chiba, Japan, 2023. [Google Scholar]
- Chiba Prefecture Government Measures against Vacant Houses. Available online: http://www.pref.chiba.lg.jp/juutaku/seisaku/akiya/akiyataisaku.html (accessed on 3 May 2024).
- Kim, M.; Rupprecht, C.D.D.; Furuya, K. Residents’ Perception of Informal Green Space—A Case Study of Ichikawa City, Japan. Land. 2018, 7, 102. [Google Scholar] [CrossRef]
- Roth, M. Validating the Use of Internet Survey Techniques in Visual Landscape Assessment—An Empirical Study from Germany. Landscape and Urban Planning 2006, 78, 179–192. [Google Scholar] [CrossRef]
- Buijs, A.E.; Elands, B.H.M.; Langers, F. No Wilderness for Immigrants: Cultural Differences in Images of Nature and Landscape Preferences. Landsc. Urban Plan. 2009, 91, 113–123. [Google Scholar] [CrossRef]
- Karjalainen, E.; Tyrväinen, L. Visualization in Forest Landscape Preference Research: A Finnish Perspective. Landsc. Urban Plan. 2002, 59, 13–28. [Google Scholar] [CrossRef]
- Baron, R.M.; Kenny, D.A. The Moderator–Mediator Variable Distinction in Social Psychological Research: Conceptual, Strategic, and Statistical Considerations. J. Personal. Soc. Psychol. 1986, 51, 1173–1182. [Google Scholar] [CrossRef] [PubMed]
- Dustin, T.; Teppei, Y.; Kentaro, H.; Luke, K.; Kosuke, I. Mediation: R Package for Causal Mediation Analysis. J. Stat. Softw. 2014, 59, 1–38. [Google Scholar]
- Özgüner, H.; Kendle, A.D. Public Attitudes towards Naturalistic versus Designed Landscapes in the City of Sheffield (UK). Landsc. Urban Plan. 2006, 74, 139–157. [Google Scholar] [CrossRef]
- Poudyal, N.C.; Hodges, D.G.; Fenderson, J.; Tarkington, W. Realizing the Economic Value of a Forested Landscape in a Viewshed. South. J. Appl. For. 2010, 34, 72–78. [Google Scholar] [CrossRef]
- Matsudo City Office. Weed Control on Vacant Lots; Matsudo City Office: Chiba, Japan, 2024. [Google Scholar]
- Clayton, S.; Colléony, A.; Conversy, P.; Maclouf, E.; Martin, L.; Torres, A.-C.; Truong, M.-X.; Prévot, A.-C. Transformation of Experience: Toward a New Relationship with Nature. Conserv. Lett. 2017, 10, 645–651. [Google Scholar] [CrossRef]
- Fischer, L.K.; Honold, J.; Botzat, A.; Brinkmeyer, D.; Cvejić, R.; Delshammar, T.; Elands, B.; Haase, D.; Kabisch, N.; Karle, S.J. Recreational Ecosystem Services in European Cities: Sociocultural and Geographical Contexts Matter for Park Use. Ecosyst. Serv. 2018, 31, 455–467. [Google Scholar] [CrossRef]
- Fischer, L.K.; Honold, J.; Cvejić, R.; Delshammar, T.; Hilbert, S.; Lafortezza, R.; Nastran, M.; Nielsen, A.B.; Pintar, M.; van der Jagt, A.P.N.; et al. Beyond Green: Broad Support for Biodiversity in Multicultural European Cities. Glob. Environ. Change 2018, 49, 35–45. [Google Scholar] [CrossRef]
- Japanese—Core Concepts. Available online: https://culturalatlas.sbs.com.au/japanese-culture/japanese-culture-core-concepts (accessed on 23 April 2024).
- Ministry of Land, Infrastructure, Transport and Tourism Act on Special Measures Concerning Promotion of Measures against Vacant Houses, Etc. Available online: https://elaws.e-gov.go.jp/document?lawid=426AC1000000127_20231213_505AC0000000050 (accessed on 23 April 2024).
- Appleton, J. The Experience of Landscape; Wiley: Hoboken, NJ, USA, 1996. [Google Scholar]
- Lis, A.; Zalewska, K.; Pardela, Ł.; Adamczak, E.; Cenarska, A.; Bławicka, K.; Brzegowa, B.; Matiiuk, A. How the Amount of Greenery in City Parks Impacts Visitor Preferences in the Context of Naturalness, Legibility and Perceived Danger. Landsc. Urban Plan. 2022, 228, 104556. [Google Scholar] [CrossRef]
- Abdullah, A.; Marzbali, M.H.; Tilaki, M.J.M. Predicting the Influence of CPTED on Perceived Neighbourhood Cohesion: Considering Differences across Age. J. Environ. Psychol. 2013, 36, 54–64. [Google Scholar] [CrossRef]
- Lindemann-Matthies, P.; Bose, E. Species Richness, Structural Diversity and Species Composition in Meadows Created by Visitors of a Botanical Garden in Switzerland. Landsc. Urban Plan. 2007, 79, 298–307. [Google Scholar] [CrossRef]

Disclaimer/Publisher’s Note: The statements, opinions and data contained in all publications are solely those of the individual author(s) and contributor(s) and not of MDPI and/or the editor(s). MDPI and/or the editor(s) disclaim responsibility for any injury to people or property resulting from any ideas, methods, instructions or products referred to in the content. |
© 2024 by the authors. Licensee MDPI, Basel, Switzerland. This article is an open access article distributed under the terms and conditions of the Creative Commons Attribution (CC BY) license (https://creativecommons.org/licenses/by/4.0/).