Article

Assessment of Ecological Quality and Analysis of Influencing Factors in Coal-Bearing Hilly Areas of Northern China: An Exploration of Human Mining and Natural Topography

1
School of Land Science and Technology, China University of Geosciences, Beijing 100083, China
2
Key Laboratory of Natural Consolidation and Rehabilitation, Ministry of Land Resources, Beijing 100035, China
*
Author to whom correspondence should be addressed.
Land 2024, 13(7), 1067; https://doi.org/10.3390/land13071067
Submission received: 30 May 2024 / Revised: 4 July 2024 / Accepted: 11 July 2024 / Published: 16 July 2024

Abstract

:
The Changhe Basin is located in the earth–rock mountainous area in southeastern Shanxi, China, and represents a characteristic northern coal-bearing hilly area. The terrain is complex, and the area is rich in coal mines. It plays an indispensable role in maintaining ecological balance and sustainable development in North China. To investigate the changes in ecological quality in the Changhe Basin, as well as the impact of human mining activities and natural topography on ecological quality, this study constructs the Remote Sensing Ecological Index (RSEI) based on Landsat remote sensing images from 2001, 2008, 2015, and 2022, undertaking an analysis of the spatial–temporal distribution characteristics of the ecological quality and its changing trends over the past 20 years. Additionally, spatial autocorrelation distribution features are revealed using Moran’s I. The exploration extends to examining the relationship between mining activities and the surrounding ecological quality. Subsequently, we study the relationship between Topographic Wetness Index (TWI) and RSEI. The results indicate the following: (1) On the temporal scale, the average proportion of RSEIs categorized as excellent and good from 2001 to 2022 is 46.78%. Types showcasing stable ecological conditions average 52.49%. The level of overall ecological quality of the basin has remained consistently high. On the spatial scale, the western part of the Changhe River, particularly in mountainous areas, exhibits higher ecological quality. Poorer areas concentrate in Chuandi Town in the southwestern part, and are significantly impacted by mining activities. The eastern region manifests areas undergoing either rapid or gradual degradation. (2) The four-phase Moran index results reveal a robust positive correlation in the spatial distribution of ecological quality within the basin. High–High and Low–Low clusters dominate, while High–Low and Low–High distributions are scattered. (3) Mining activities exert a discernible impact on the surrounding ecological quality. As the distance from the buffer zone outside the mining area increases, RSEI gradually decreases. The impact level exhibits an initial increase and subsequent decrease from 2001 to 2022.

1. Introduction

Ecological quality (EQ) refers to the suitability, harmony, and sustainability of the entire system or subsystem composed of partial factors within specific temporal and regional conditions for human survival and holistic development [1]. Ecological quality assessment (EQA) is a fundamental tool for understanding and managing the natural environment. Its necessity has become more evident than ever in the face of unprecedented environmental challenges. In recent years, the ecology, safety, and sustainable development aspects of modern coal mines have emerged as focal points in the global coal mining industry [2,3]. China, being one of the world’s largest coal producers, derives over 90% of its coal resources from underground mines [4]. However, large-scale, long-term underground coal mining significantly impacts ecological quality. On one hand, surface subsidence and irreversible deformation caused by underground coal mining may instigate geological disasters such as ground fissures [5,6]. Simultaneously, the environmental threat posed by coal mining waste compounds the challenges. Therefore, resolving the inherent contradiction between coal development and the improvement of ecological quality is urgent. Understanding the alterations in the regional ecological quality stands out as an essential concern. In the arid and semi-arid regions of China, it is worth emphasizing that topographical features play a crucial role in shaping vegetation growth. The climate in the soil and rock mountainous areas in Northern China is characterized by hot, rainy summers and cold, dry winters. Significant changes in humidity also profoundly affect the ecological quality of these regions.
A scientific, reasonable, and efficient method for evaluating the ecological quality is the foundation for resolving this contradiction. Currently, the international community and governments worldwide are actively exploring various evaluation methods, broadly categorized into three types: (1) index evaluation method; (2) statistical analysis method; and (3) model evaluation method. In the index evaluation method, single indicators such as normalized difference vegetation index (NDVI) [7], enhanced vegetation index (EVI) [8], leaf area index (LAI) [9], and land surface temperature (LST) are widely used [10,11]. While these single indicators have confirmed significance in understanding the ecological environment, they encounter limitations in representing the entirety of the ecosystem’s characteristics. Comprehensive indicators combine two or more indicators and are more superior in monitoring and evaluating ecological conditions. The Ecological Environment Status Index (EI) [12], introduced by the Ministry of Environmental Protection of China in 2006, is widely utilized for ecological environment status evaluation. Nevertheless, it exhibits deficiencies in terms of indicator parameters, weight assignment, indicator acquisition, and quantitative effects [13]. Statistical analysis methods mainly encompass expert consultation, the analytic hierarchy process (AHP), fuzzy multi-level comprehensive evaluation, etc. [14,15]. However, these methods tend to lean more towards static analysis and numerical results, hampering their ability to precisely capture the dynamic spatial–temporal distribution and heterogeneity of ecosystems [16].
With the in-depth exploration and utilization of remote sensing technology and mathematical models, the methodologies for evaluating ecological quality have undergone substantial expansion and refinement. The primary model evaluation methods encompass the “pressure-state-response” (PSR) model and the Remote Sensing Ecological Index (RSEI). The PSR model stands out as one of the frequently employed conceptual frameworks in ecological environment studies [17,18,19]. Compared with RSEI, its model construction involves subjective indicator selection and weight determination, and a static evaluation system often struggles to effectively match the actual ecological conditions [20]. In 2013, Xu H.Q. proposed RSEI based on the PSR model [21]. This approach avoids errors in weight definition caused by individual characteristics, offering an objective and reliable technique for visually expressing the spatiotemporal changes in regional ecological quality with heightened precision [22]. In recent years, RSEI has been gradually applied to the evaluation of different ecosystems such as cities [23,24], watersheds [25], mining areas [26,27], forests [28], wetlands [29], and offshore islands [30]. The RSEI model provides a valuable tool for EQA across different regions. Mining activities can have a significant impact on the landscape, soil quality, and water resources. Applying the RSEI model in mining areas allows for the quantification of environmental impacts and the identification of regions that require focused management.
Remote sensing monitoring of mine ecology is a hot research topic both domestically and internationally. Since the introduction of the RSEI, numerous scholars have proven its applicability in monitoring ecological quality in mining areas. For example, Li et al. utilized RSEI to dynamically monitor the ecological quality in the Shendong mining area [31]. Wu et al. conducted a rapid and objective quantitative evaluation of ecological quality in the Yongding mining area based on RSEI, achieving significant research outcomes [32]. Unlike traditional research areas, ecosystems in different mining areas exhibit distinct characteristics. Due to various mining methods and management practices, resulting in diverse ecological challenges. Consequently, many scholars have adapted the RSEI to suit specific study area conditions. Yang et al. added Net Primary Productivity (NPP) to develop an improved index, K-RSEINPP, for evaluating the ecological quality of rare earth mines [33]. Meanwhile, Jia et al. used the Modified Remote Sensing Ecological Index (MRSEI) to assess ecological quality in the Qaidam Basin, China [34]. Subsequently, Xu et al. critically evaluated Jia’s research, highlighting concerns that the MRSEI may lead to an overestimation of ecological quality rather than enhancing the original RSEI in the study area [35]. Therefore, it is necessary to conduct targeted evaluations based on specific conditions and measured data of the study area.
The Changhe Basin is located in the coal-bearing hilly areas of southeastern Shanxi Province in China. The terrain is complex and the soil erosion is severe [36]. However, the region is rich in mineral resources, with a history of coal mining dating back to the Tang Dynasty (about 1400 years ago), and the distribution of mining areas is dense. With the continuous decrease in exploitable coal resources, the inevitable encroachment of villages and other construction activities on mining areas have transformed it into a typical village-pressing coal mountainous area of Northern China, where villages encroach upon coal deposits. This unique natural condition, accompanied by large-scale mining activities, has caused severe damage to regional water and soil resources. Conflicts between mining activities, agriculture, villages, and infrastructure development have become increasingly prominent, restricting high-quality development and sustainable development in the region [37,38]. Applying the RSEI in the Changhe Basin for evaluating ecological quality and analyzing the impact of mining activities is crucial for the protection and management of the coal-bearing hilly areas of Northern China.
However, there has been a limited exploration of RSEI application in unique geomorphological areas, particularly in the soil- and rock-rich northern mountainous regions. In the Changhe Basin, humidity is one of the important factors causing changes in EQ. The study area comprises mainly loess hilly and mountainous landforms, with considerable terrain fluctuations, making topography’s impact on humidity distribution particularly notable. The concept of the Topographic Wetness Index (TWI) was first proposed in 1979 by scholars K.J. Beven and M.J. Kirkby. TWI provides topography-based humidity information that can help explain humidity changes observed in RSEI. This enhances the spatial resolution and reliability of humidity distribution. Especially in mountainous or complex terrain areas, the introduction of TWI helps to facilitate a more accurate assessment of humidity’s impact on ecosystem health. In the Changhe Basin, TWI can serve as a crucial supplementary indicator for the humidity component in RSEI. Additionally, topography affects soil moisture content, influencing vegetation distribution, which is reflected in the Normalized Difference Vegetation Index (NDVI) component of RSEI. Furthermore, the weathering of bare land impacts the dryness index in RSEI. Theoretically, there is a close relationship between TWI and RSEI. The introduction of TWI would provide essential data support and analytical indicators for assessing ecological quality in the coal-bearing hilly areas of Northern China.
Based on the aforementioned research, this paper employs the Changhe Basin in southeastern Shanxi Province, China, as a case study. The research objectives are as follows: (1) Using remote sensing data from 2001, 2008, 2015, and 2022 for the computation of the RSEI. (2) Revealing the spatial–temporal differentiation characteristics of EQ from 2001 to 2022 based on the computed RSEI. (3) Investigating the relationship between mining activities and the surrounding ecological quality. (4) Introducing the TWI as an important supplementary validation metric for the RSEI.
Based on field surveys of the study area, this paper exploratively incorporates TWI as a supplementary validation indicator for RSEI in the context of unique natural topographical conditions. Considering geological disasters caused by underground mining, this study aims to explore changes in ecological quality in the Changhe Basin using the RSEI, and to assess the impact of mining activities and natural topography on the region’s ecological quality. The goal is to establish a scientific foundation for balancing ecological construction and green mine construction, thereby promoting regional sustainable development and high-quality development.

2. Materials and Methods
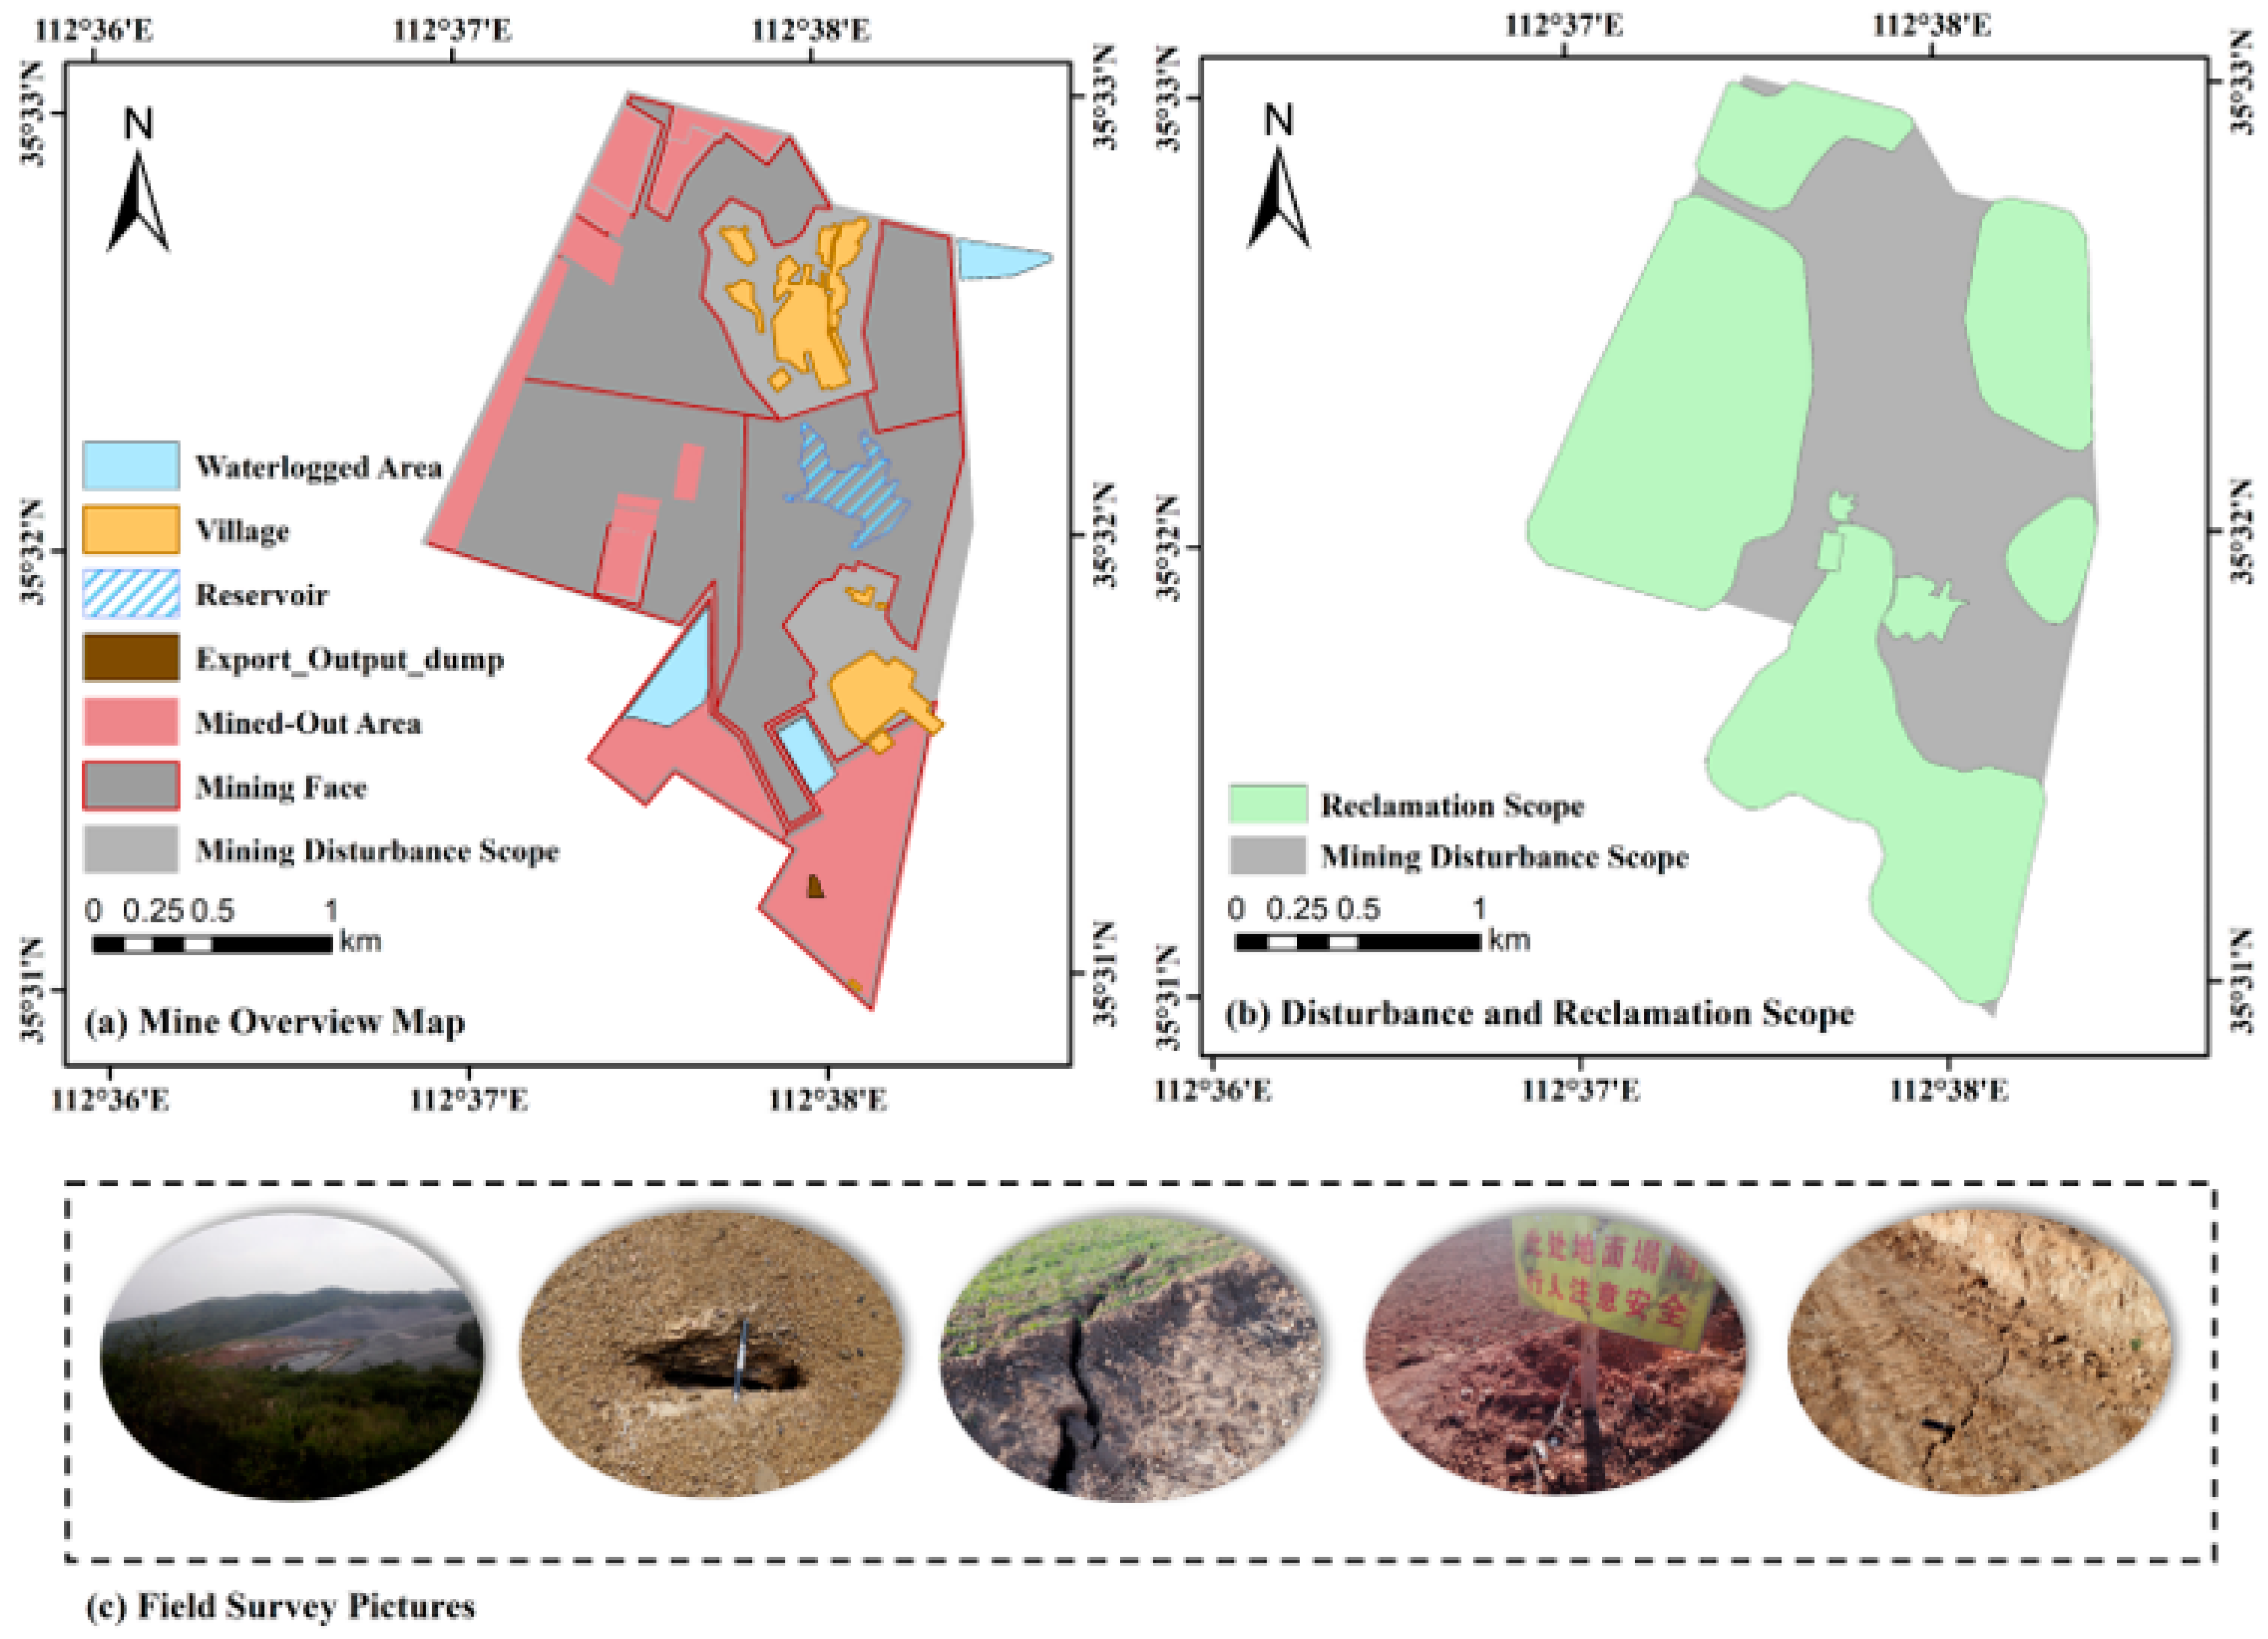
This study employed Landsat images to generate four RSEI level maps spanning the years 2001 to 2022, alongside corresponding difference change maps. Assessment of EEQ was conducted at both temporal and spatial scales. Spatial autocorrelation of RSEI was explored using Moran’s Index and Local Indicators of Spatial Association (LISA) cluster analysis on the GeoDa platform. Finally, buffer zone analysis and overlay analysis were carried out using ArcGIS 10.8 to depict the RSEI change curves for buffer zones with different distances outside the mining area for each year. The detailed workflow of this study is provided in Figure 1.

2.1. Study Area

The Changhe Basin (112°37′–112°46′ E, 35°30′–35°38′ N) is located in Zezhou County, Jincheng City, Shanxi Province, China, as depicted in Figure 2. Positioned on the eastern edge of the Loess Plateau in Shanxi Province, this area is characterized by its mountainous terrain featuring interlaced gullies, substantial soil erosion, and a relative elevation difference of 450 m. Comprising 47 administrative villages in three townships within Zezhou County, the study area spans 108 km2. The climate is temperate continental monsoon, with high temperatures and rainfall in summer and cold, dry conditions in winter. The average annual temperature stands at 10.9 °C, with an average annual rainfall of 628.3 mm. The Changhe River runs through the entire study area, flowing from the south to the north into the Qin River, covering a total length of approximately 20 km. There are also four small- and medium-sized reservoirs in the basin, with a total storage capacity of 9.11 million cubic meters.
Functioning as a crucial coal industry belt in Jincheng, the Changhe Basin has 18 coal mines, with a mining area of 343.43 km2, resulting in extensive geological environmental challenges. There are numerous abandoned mine sites left behind, and the problem of villages being buried by coal is serious. Taking Haitian Coal Mine as an example, we introduced its specific location, internal situation, disturbance and reclamation scopes, and on-site survey images. This is a typical underground shaft mining coal mine. As shown in Figure 3, villages are distributed within the working face of this coal mine, and significant ground fissures have appeared around the mining area.

2.2. Data and Preprocessing
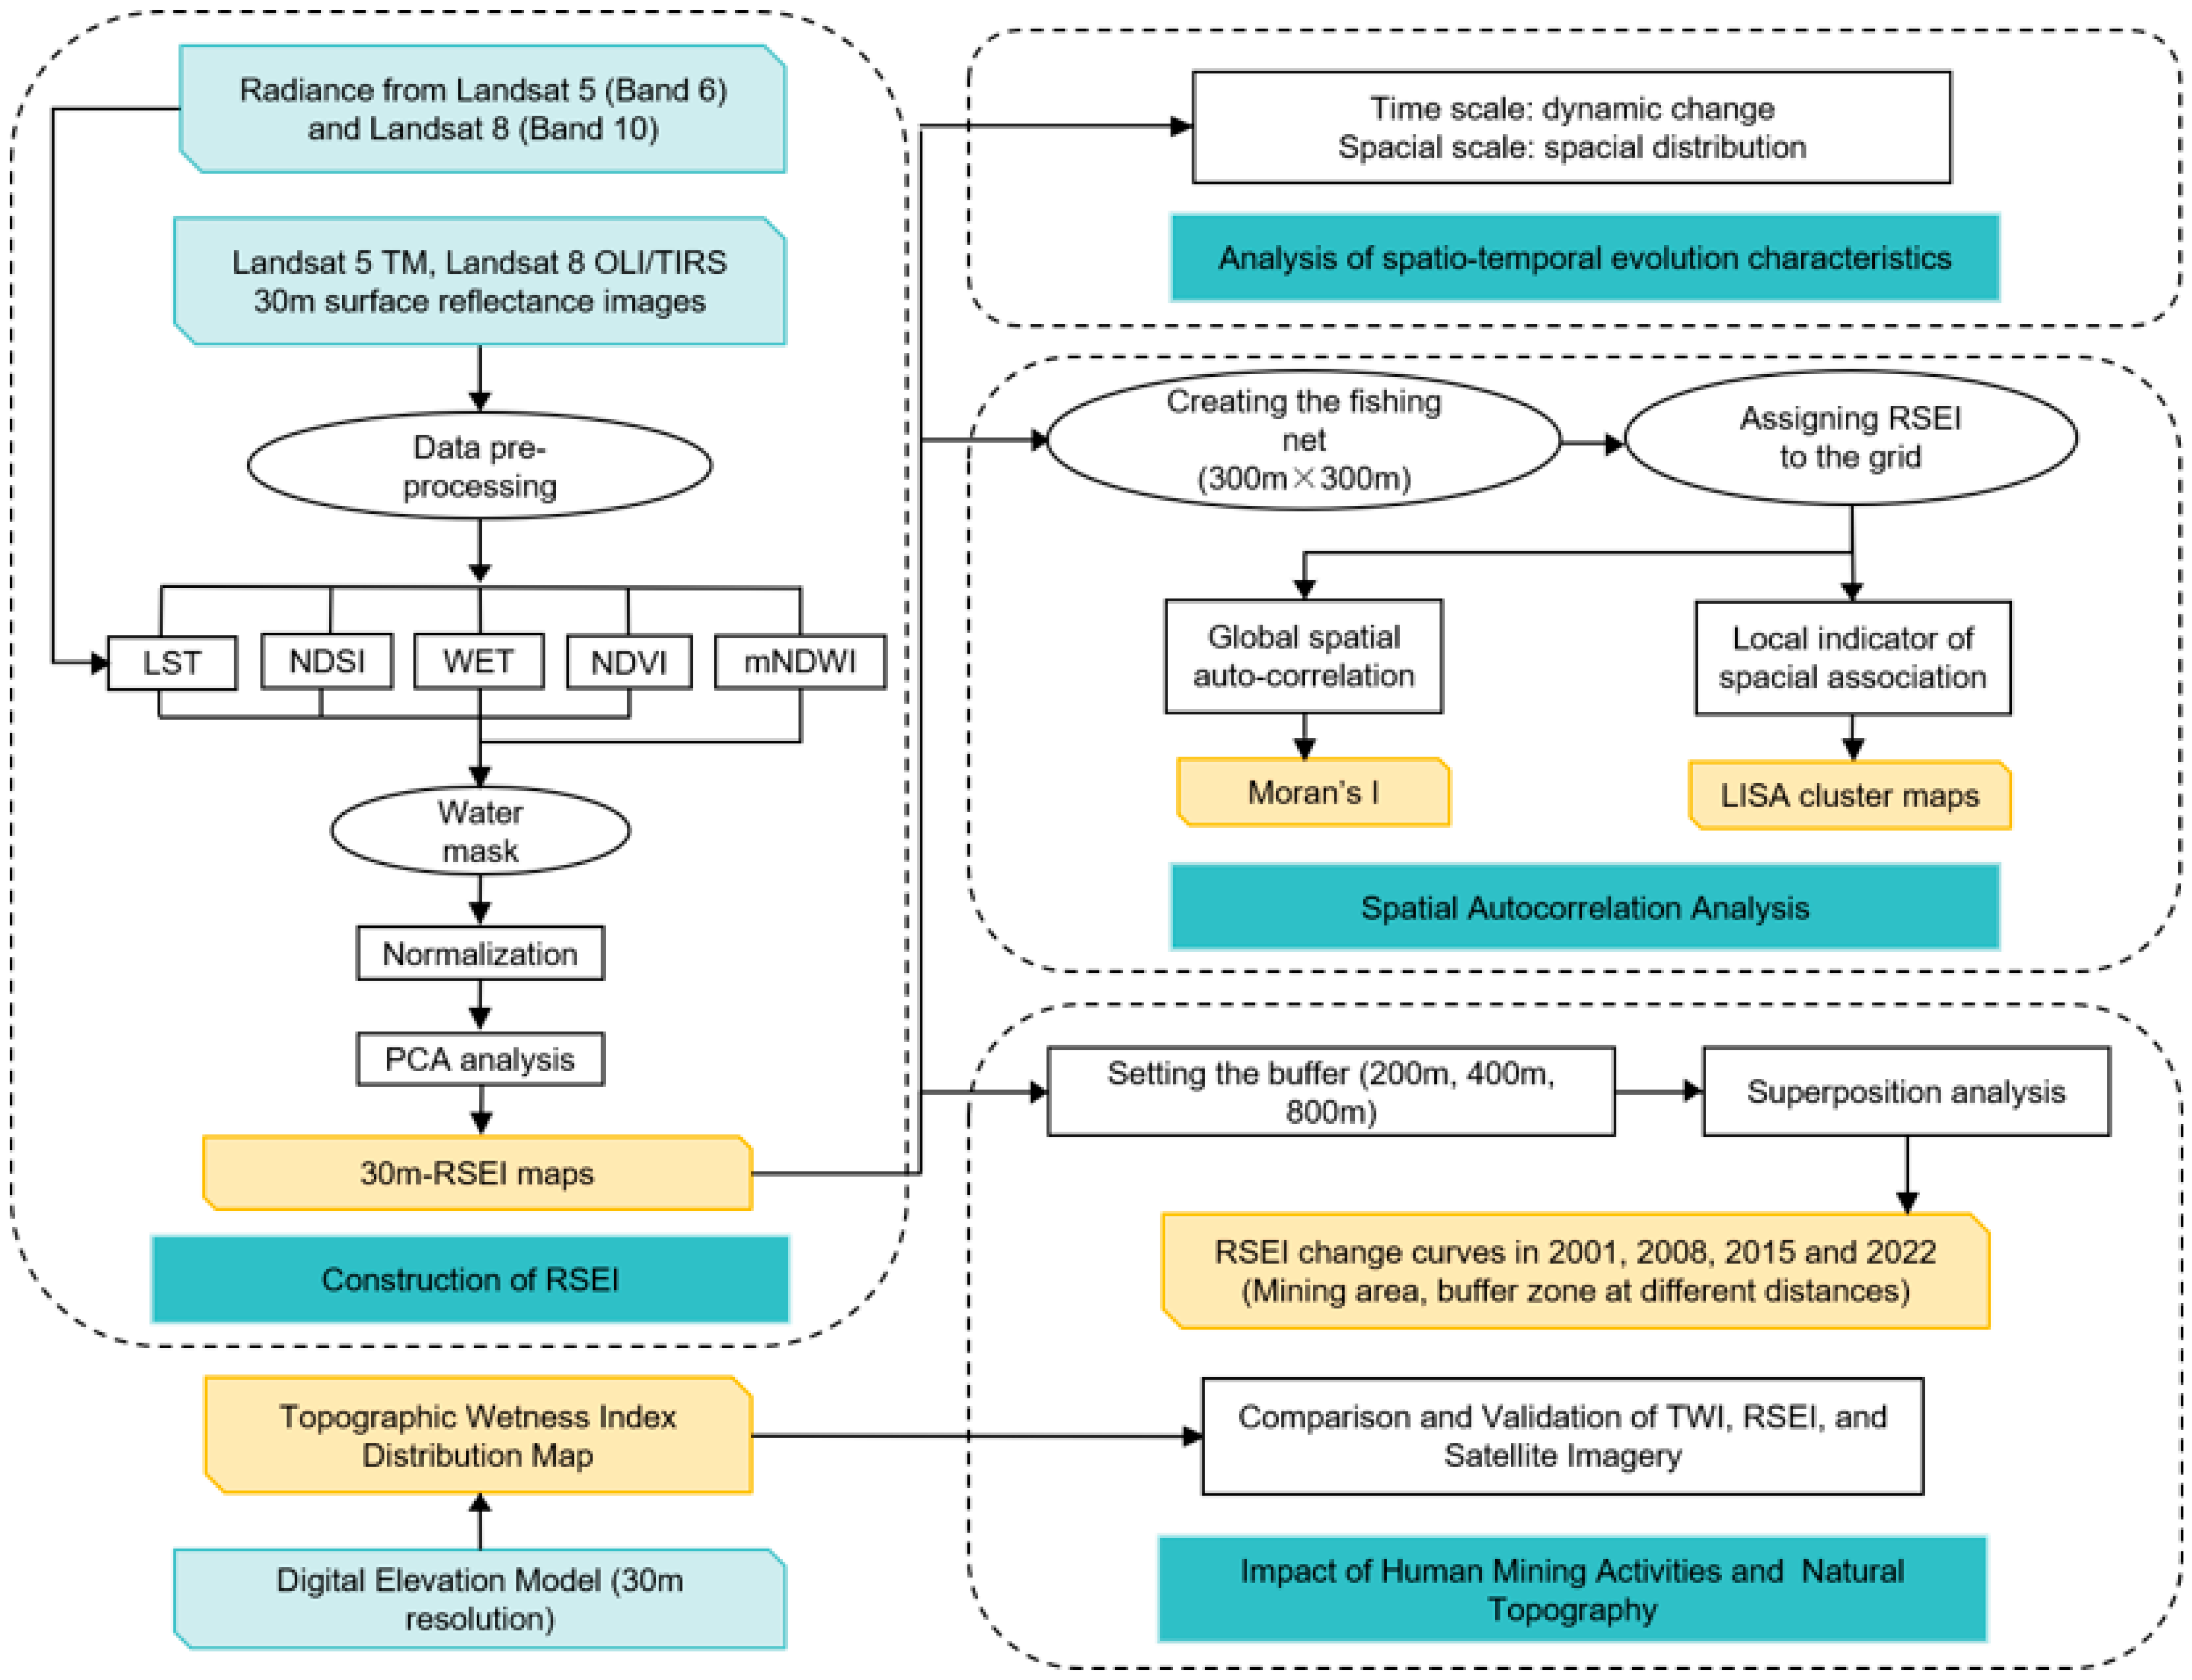
The remote sensing images used in this study were obtained from the United States Geological Survey (USGS) (https://earthexplorer.usgs.gov/ (accessed on 7 May 2024)). The dataset encompasses four periods of Landsat 5 TM and Landsat 8 OLI L1 level datasets, featuring a spatial resolution of 30 m and a temporal resolution of 16 d. To ensure comparability, we selected similar dates. The image acquisition times were 22 August 2001, 1 September 2008, 7 September 2015, and 20 August 2022. According to historical climate data, the four time points are all concentrated in the vegetation growth season of August and September. They are close to the end of the rainy season, with relatively stable climate patterns, making significant deviations unlikely. The selected images exhibited a cloud cover of less than 10% and underwent geometric, radiometric, and atmospheric correction preprocessing. All remote sensing images underwent data preprocessing, including geometric correction, radiometric calibration, and atmospheric correction, to control for potential errors introduced by the data. During the calculation process, bands 1 to 7 from Landsat 5 TM images and bands 2 to 7 and band 10 from Landsat 8 OLI images were selected. We used contour line data from the 1:10,000 topographic map of Jincheng City, China, and employed interpolation methods to generate a Digital Elevation Model (DEM). Mining area boundary data are sourced from the “Zezhou County Mineral Resources Reserve Verification Report” and field survey data. Table 1 lists the research data used in this paper.

2.3. Methodology

2.3.1. Construction of RSEI

This paper employs the RSEI model for the rapid monitoring and evaluation of the ecological quality in the Changhe Basin of northern coal-bearing hilly areas. Based on the PSR framework, the RSEI integrates three indicators: human pressure (P), ecological environment state (S), and climate response (R). Specifically, the Changhe Basin, situated in a region prone to soil erosion, employs the building index (IBI) and bare soil (SI) as dryness indicators [19,39]. These indicators collectively signify the pressure caused by human activities on the ecosystem. The normalized difference vegetation index (NDVI) serves as a representation of greenness indicators, measuring the ecological environment state before and after human activities cause changes to the surface. Ground moisture (WET) and land surface temperature (LST) are selected as humidity and heat indicators, respectively, revealing the response of climate change to alterations in the state of the ecosystem [28]. These four indicators are closely associated with ecological condition assessments and are easily perceived [40,41]. The detailed calculation formulas for each ecological indicator are shown in Table 2 [19,42,43,44,45].
The research area is traversed by the Changhe River, with several reservoirs. To avoid the impact of extensive water bodies on the actual ground humidity and the load of principal components, a modified normalized difference water index ( m N D W I ) was employed for the water body masking process [21].
m N D W I = ρ G r e e n ρ S W I R 1 ρ G r e e n + ρ S W I R 1
To avoid dimension imbalance, the indicators were normalized to ensure that the numerical range is [0, 1]. Subsequently, through principal component transformation, four indicators were integrated to derive R S E I 0 by the following calculation:
R S E I 0 = P C 1 f N D V I , W e t , N D S I , L S T
Finally, in order to facilitate the measurement of the index, normalization processing is performed to obtain the final R S E I . The normalization calculation formula is expressed as
R S E I = R S E I 0 R S E I m i n / R S E I m a x R S E I m i n
Here, R S E I m i n represents the minimum value of R S E I , and R S E I m a x represents the maximum value of R S E I . A numerical value closer to 1 indicates higher ecological quality in the study area.

2.3.2. Spatial Autocorrelation of RSEI

Spatial autocorrelation analysis of ecological quality enhances our understanding of its spatial homogeneity in the study area [47], encompassing both global and local spatial autocorrelation. GeoDa 1.16 is employed in this study for spatial autocorrelation analysis. The global Moran’s Index reveals the clustering pattern of overall ecological quality [48], calculated as follows:
G l o b a l   M o r a n s   I = n i = 1 n j = 1 n W i j x i x ¯ x j x ¯ i = 1 n j = 1 n W i j i = 1 n x i x ¯ 2
  • n represents the total number of regional pixels.
  • W i j is the spatial weight matrix element.
  • x i and x j represent the observed values of RSEI in spatial geographical units.
  • x ¯ is the average value of RSEI in the study area.
  • This paper uses an adjacent weight matrix; when i is adjacent to j , W i j = 1 , otherwise W i j = 0 . The range of Moran’s I index is [−1, 1].
To further understand the local spatial distribution characteristics of EQ in the Changhe Basin, the Local Moran’s I index was used for LISA clustering to measure the degree of unit autocorrelation [49]. This helps to reveal whether there are significant high–high spatial agglomeration areas and low–low spatial discrete areas within the Changhe Basin. The calculation formula for LISA clustering is
L o c a l   M o r a n s   I = n x i x ¯ j = 1 n W i j x j x ¯ i = 1 n x i x ¯ 2
where each parameter has the same meaning as explained above.

2.3.3. Impact of Mining Activities

In general, mining activities can adversely affect the ecological quality, and these effects typically diminish with greater distance from the mining area [50,51]. However, due to artificial ecological restoration and other natural factors, the impact of the Changhe Basin mining areas on the surrounding ecological quality still needs further study. To gain a deeper understanding of the extent and scale of the impact of mining activities on the surrounding ecological quality, we set up three buffer zones (200 m, 200–400 m, 400–800 m) outside the mining area. Subsequently, we overlaid the maps of RSEI from 2001, 2008, 2015, and 2022 with buffer zones, respectively, to assess the spatial impact range of mining activities on the surrounding ecological quality.

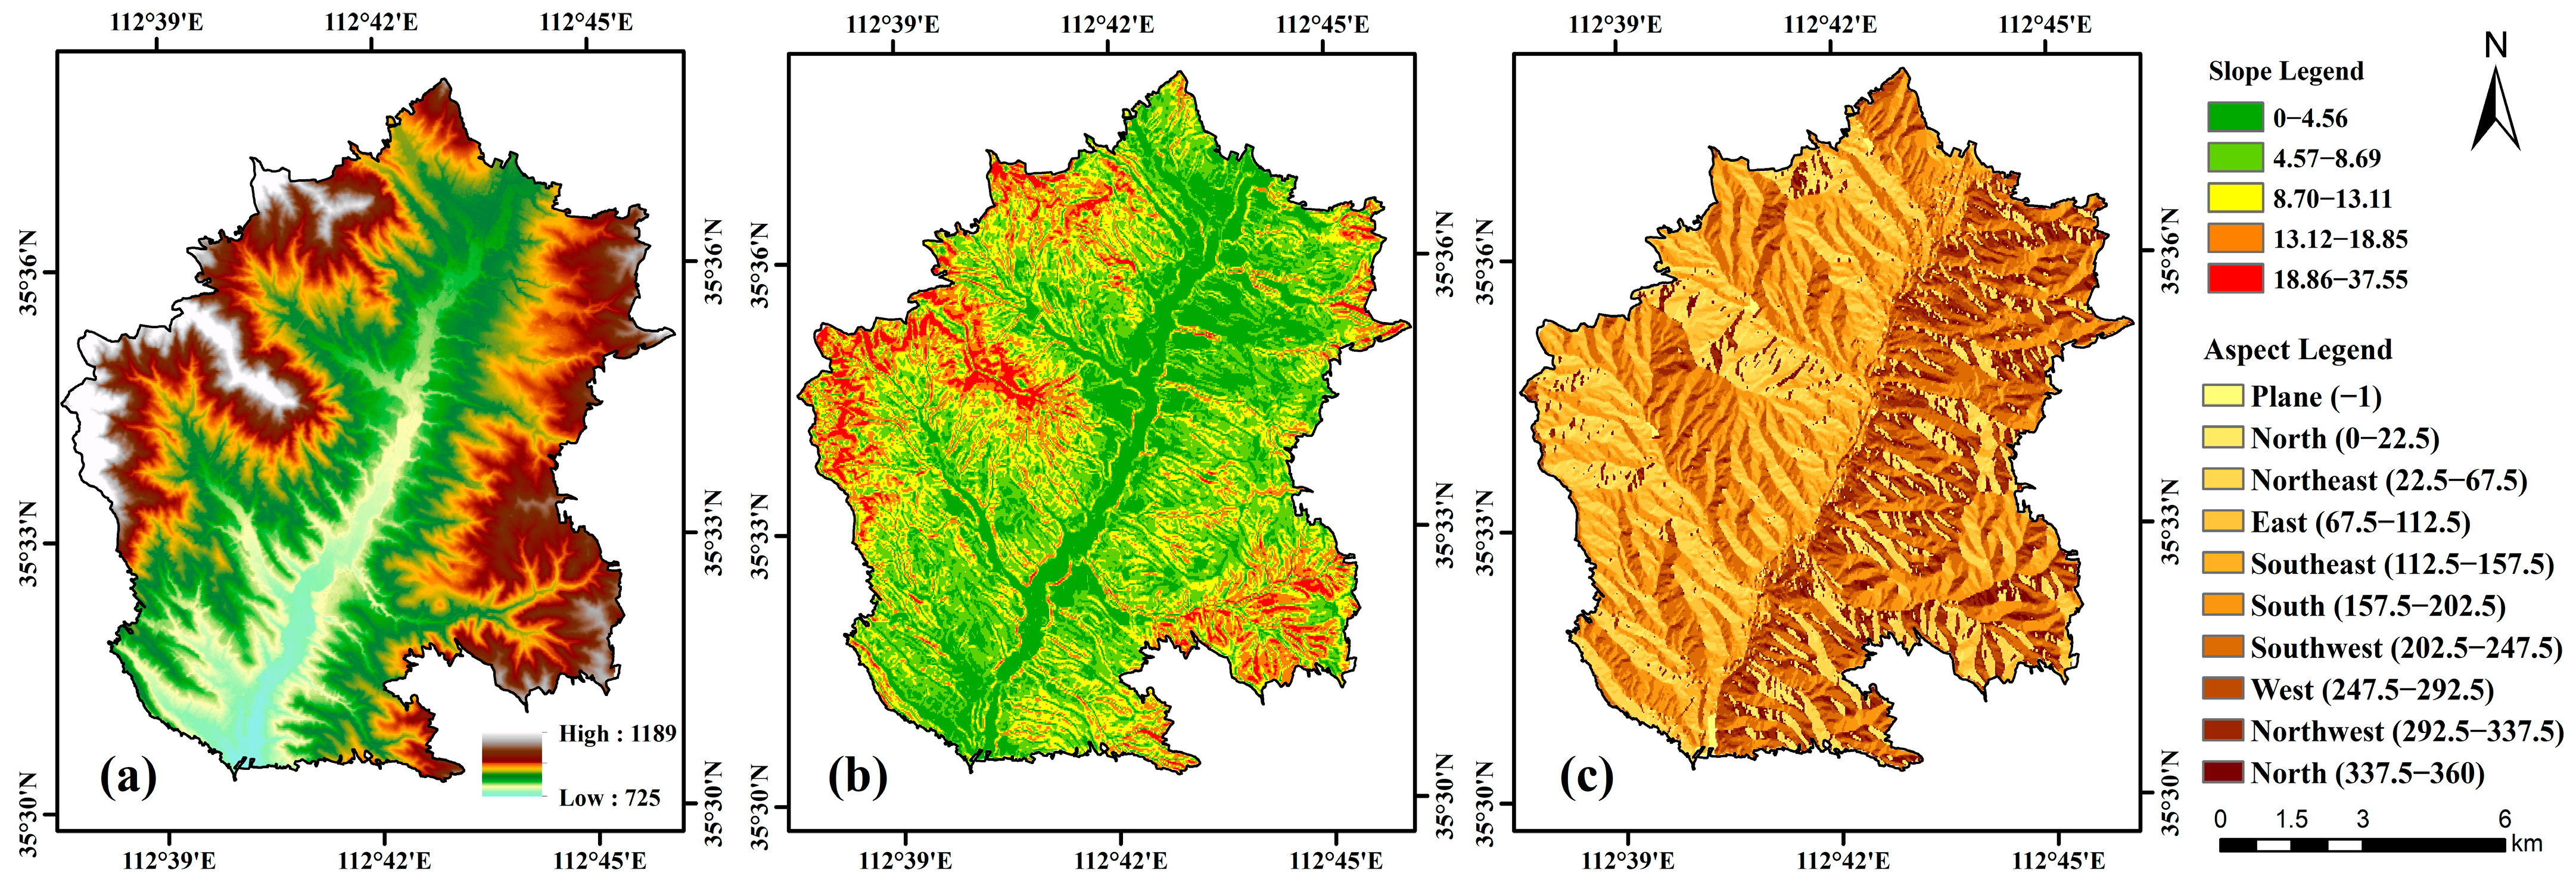
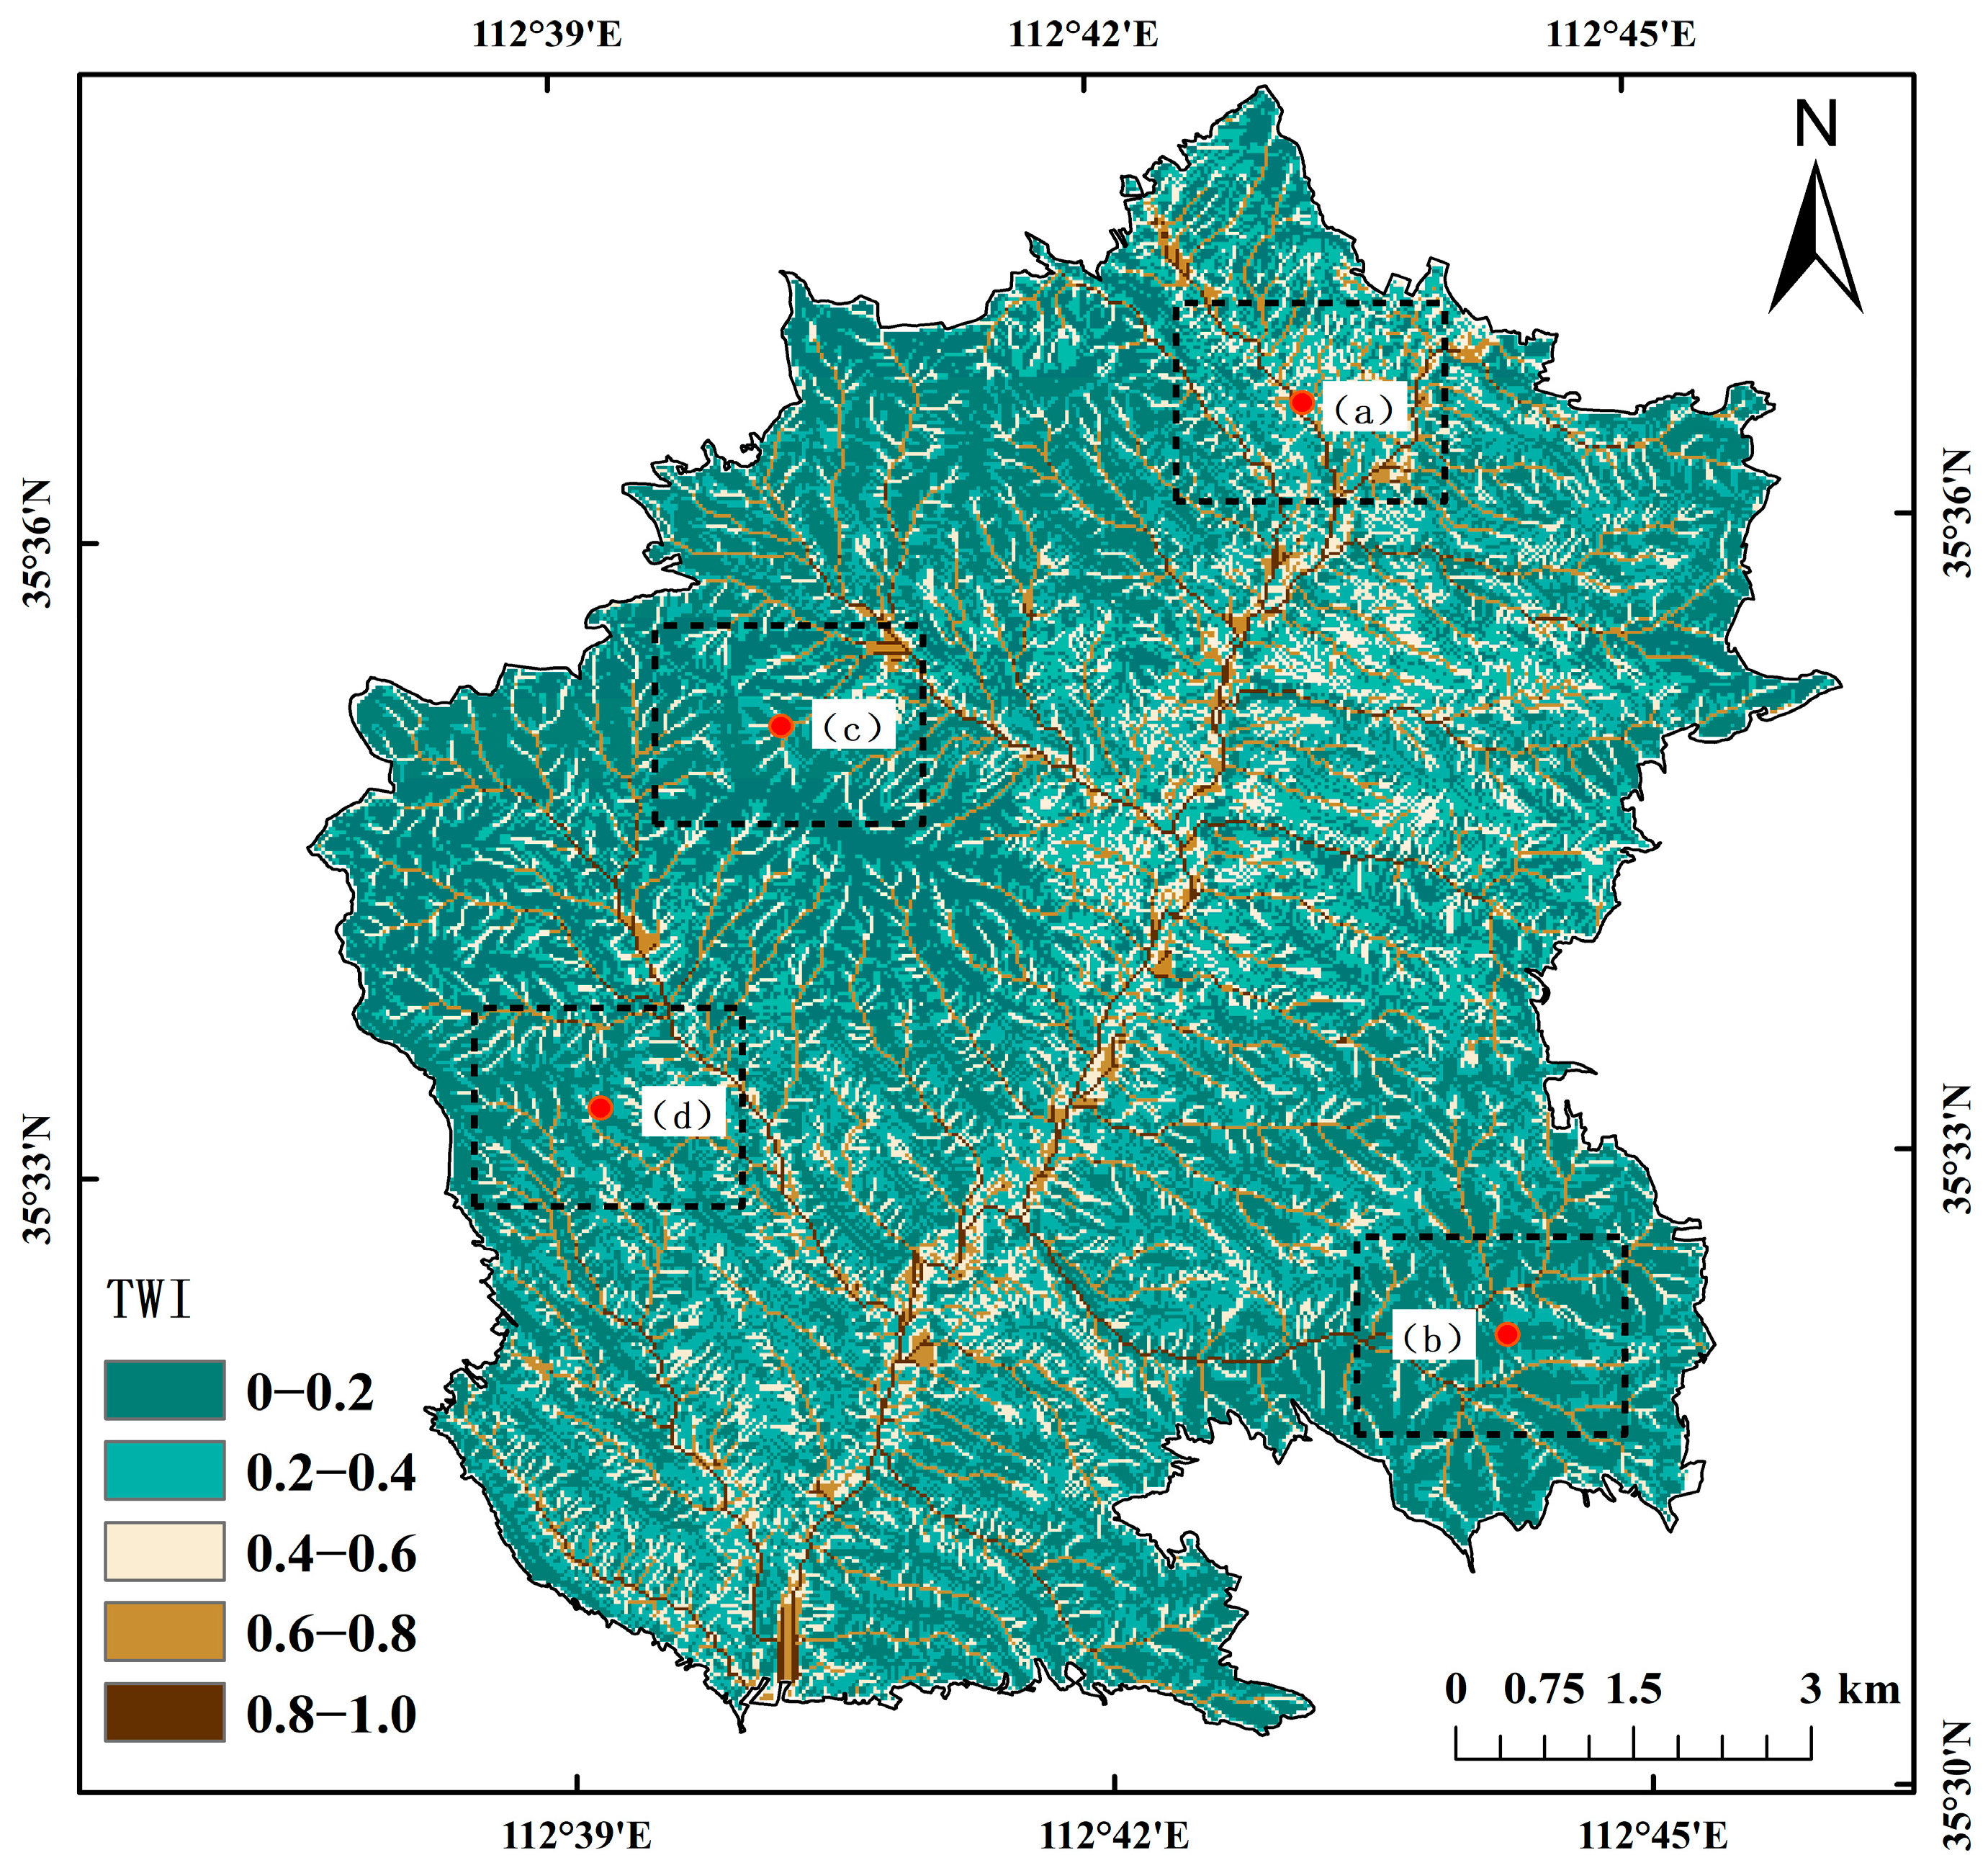
2.3.4. Topographic Wetness Index

TWI quantitatively models soil moisture conditions within the Changhe Basin, facilitating a comprehensive understanding of humidity patterns in the study area and providing crucial insights into the impact of terrain on moisture distribution. The TWI can be expressed as the natural logarithm of the ratio of the contributing area to local slope along a unit contour length. Its calculation formula is as follows:
ω = ln α / tan β
  • ω represents the Topographic Wetness Index.
  • α represents the water flow area accumulated in this grid cell through the unit contour length of the uphill area of the unit grid, reflecting the cumulative trend in runoff at a point in the basin.
  • β represents the slope of the unit grid, where tan β is its slope angle, reflecting the trend in runoff moving downhill along the direction of gravity.
The magnitude of TWI is related to the watershed area and slope, and the soil moisture content and topographic index increase with the enlargement of the watershed area and the reduction in slope. Therefore, in areas with gentle terrain, such as footslopes, riverbanks, and topographic depressions, soil moisture is relatively high and tends to reach saturation.

3. Results

3.1. Verify the Rationality of RSEI

The principal component analysis results of each ecological indicator in the RSEI of the Changhe Basin in 2003, 2009, 2015, and 2021 are shown in Table 3. The first principal component (PC1) exhibits the following characteristics: (1) The contribution rate of PC1 ranged from 72% to 87% between 2001 and 2022, indicating that PC1 integrates the majority of features from the four indicators. (2) Across the four periods, the ecological indicators exhibit consistent positive and negative distribution in PC1. Specifically, NDVI and WET, representing greenness and humidity, have positive loads, while LST and NDSI, representing heat and dryness, have negative loads. However, in PC2–PC4, the fluctuation between positive and negative values complicates the interpretation of ecological phenomena. The load mean (absolute value) ranking is NDVI (0.6284) > NDSI (−0.6081) > WET (0.3784) > LST (−0.2655), which is consistent with their actual contributions in the ecological quality. (3) Each ecological indicator has a certain contribution degree in PC1 across the four periods, while in PC2–PC4, the contributions vary, leading to the loss of some indicators. Overall, PC1 effectively integrates information from the four indicator components. Therefore, using the first principal component PC1 to extract the RSEI of the Changhe Basin provides a comprehensive reflection of the overall EQ in the study area.

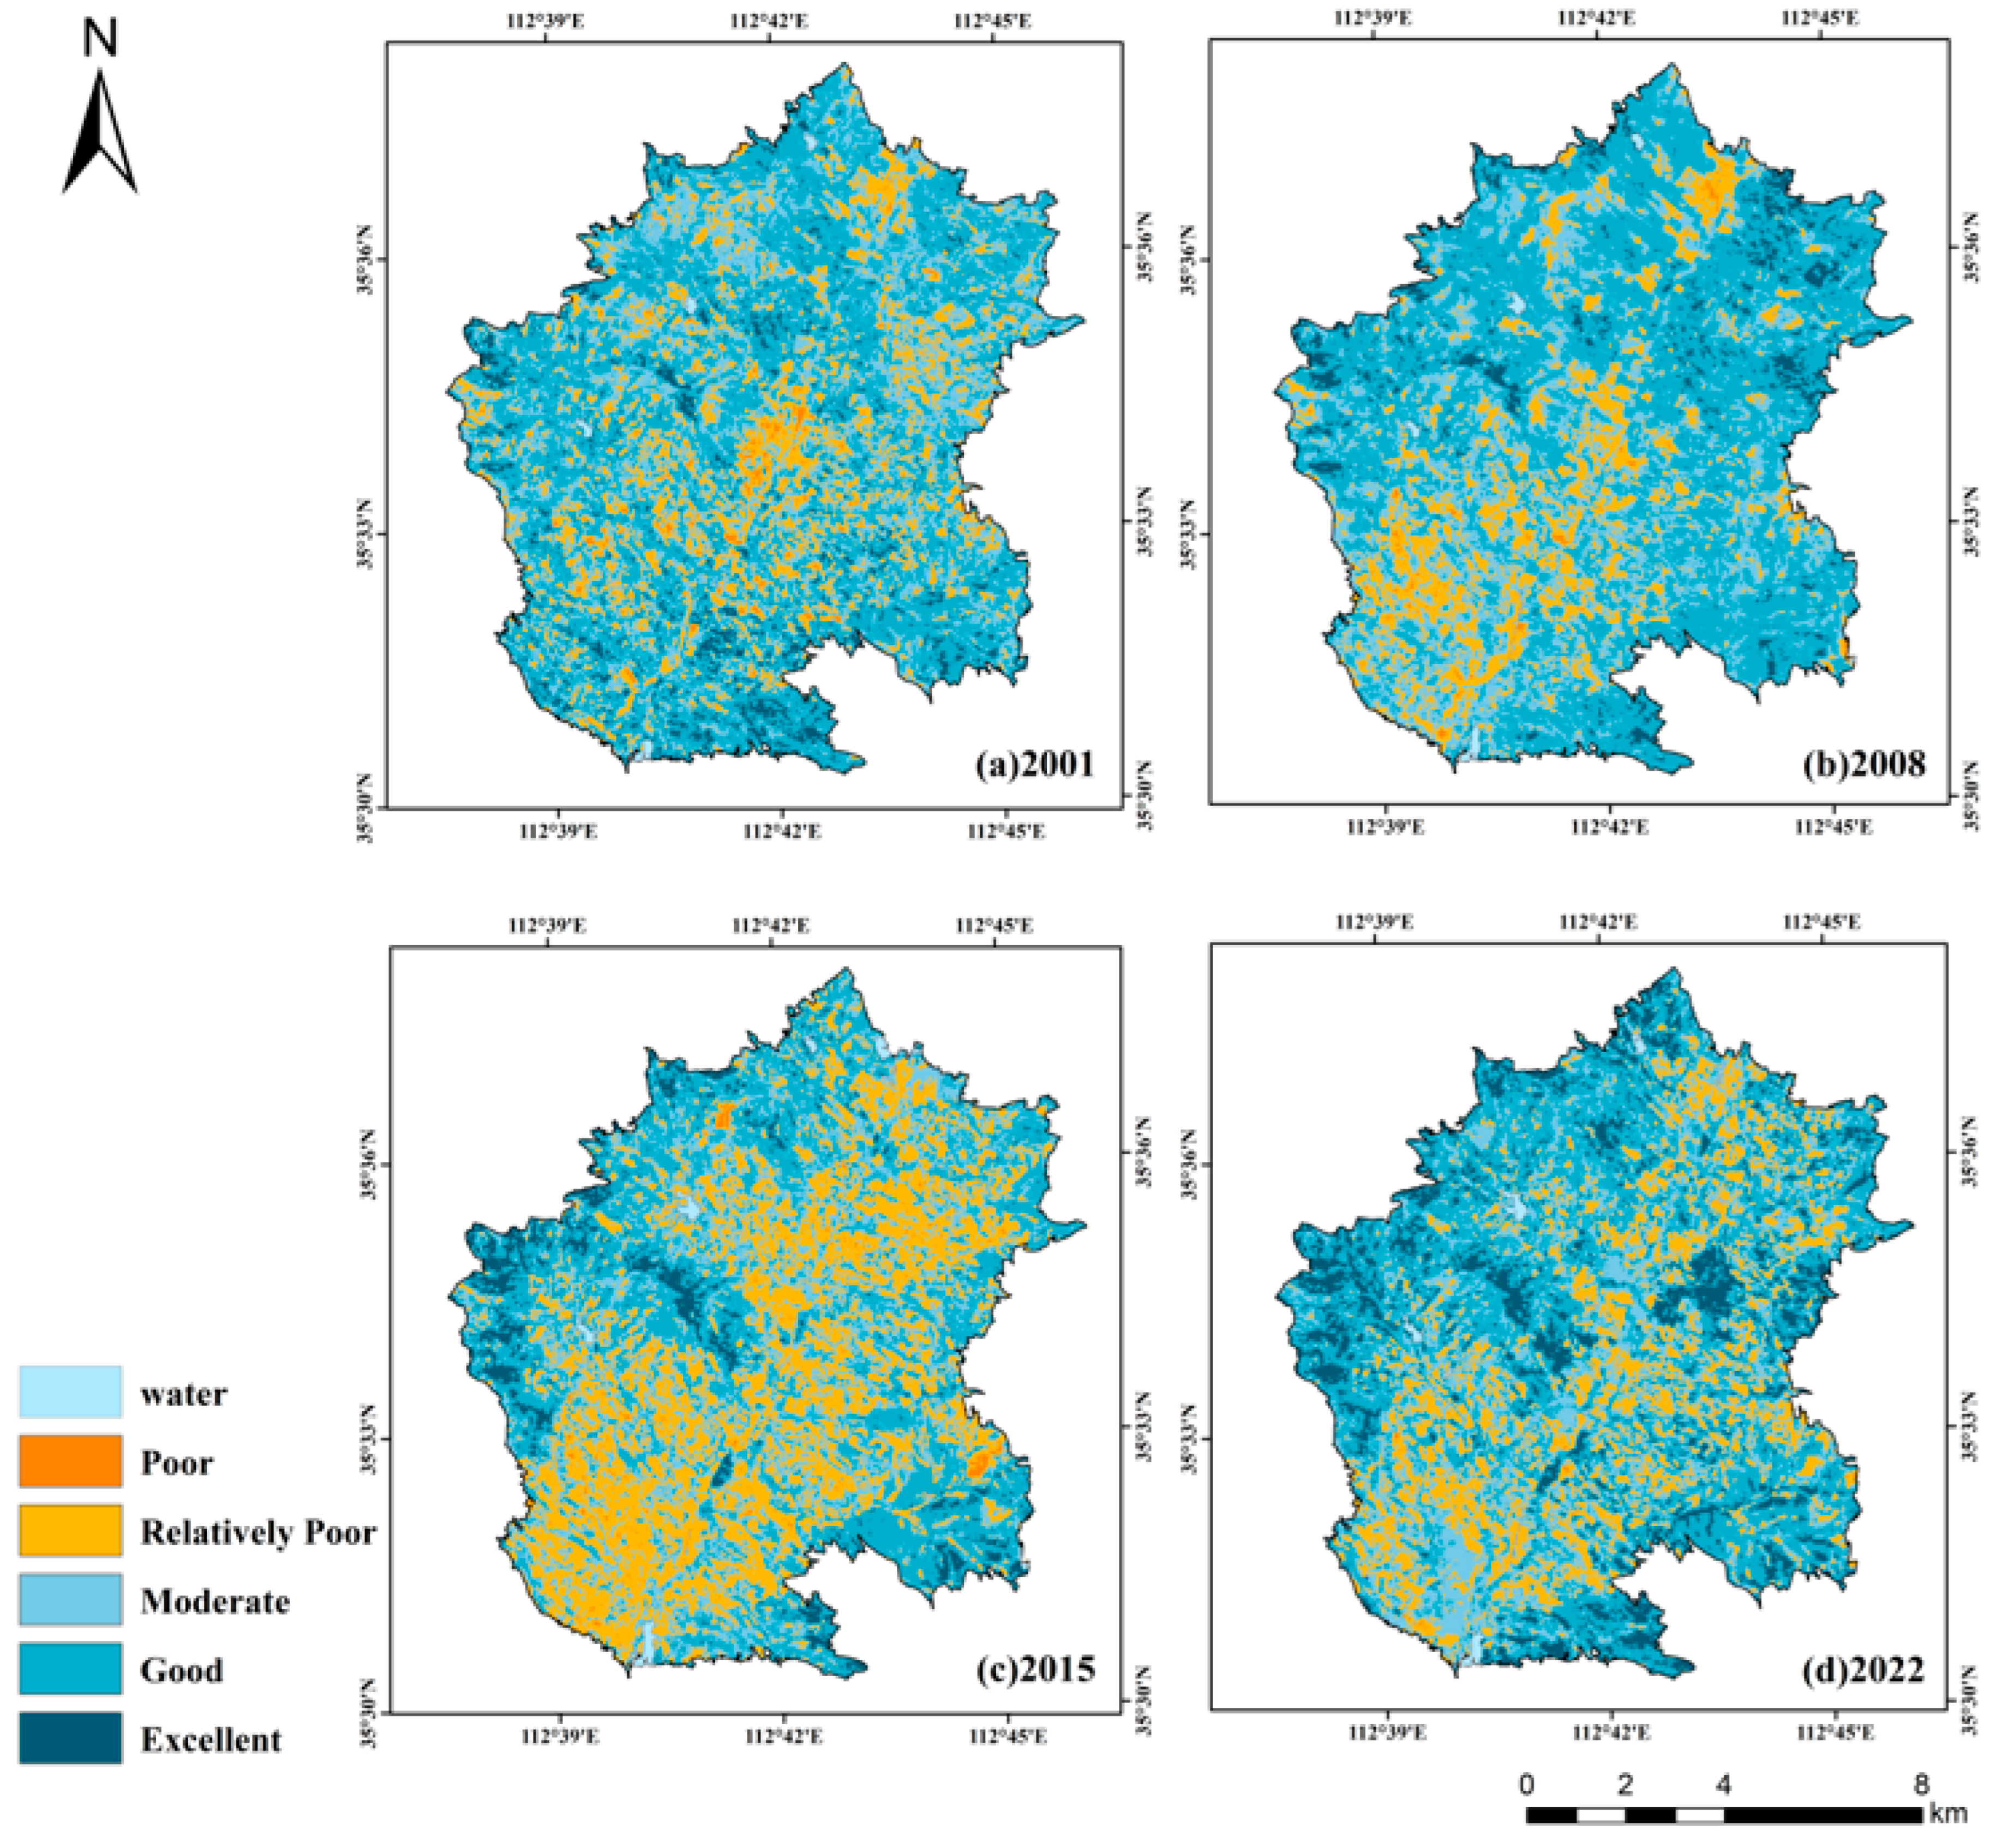
3.2. Spatial and Temporal Variation Patterns of RSEI

The mean RSEI values for each year in the Changhe Basin were calculated and categorized into five EQ levels at intervals of 0.2: poor (0–0.2), relatively poor (0.2–0.4), moderate (0.4–0.6), good (0.6–0.8), and excellent (0.8–1.0) [52,53]. Statistical analysis of cumulative proportions and means of EQ levels was performed for each year (Table 4). An RSEI-level distribution map was generated based on this classification (Figure 4).
On the temporal scale, the mean RSEI values for 2001, 2008, 2015, and 2022 were 0.576, 0.589, 0.521, and 0.595, respectively, indicating an overall upward trend in the ecological quality of the basin. Notably, between 2015 and 2022, the mean RSEI value increased by 14.20%, indicating significant improvement in EQ. The annual mean RSEI from 2001 to 2022 was 0.570, with a peak value of 0.595 in 2022, indicating the best ecological quality and positive outcomes from ecological civilization construction efforts. The lowest value of 0.521 occurred in 2015, surpassing the planned target outlined in the Zezhou County Mineral Resources Plan (2011–2015) by 1.1 million tons. This deviation was attributed to outdated mining technology and weak environmental protection awareness, leading to a sharp decline in EQ. In 2008, the total area with moderate and good levels reached 82.80%, possibly due to the active implementation of the policy of returning cultivated land to forestry in Zezhou County from 2002 to 2006, which significantly improved vegetation coverage. This is related to coal mining. By 2013, Chengzhuang Coal Mine had maintained a high level of 8 million tons for six consecutive years. However, in 2015, the total area with poor and relatively poor levels reached 29.33%, resulting in the worst EQ.
In terms of spatial scale, from 2001 to 2022, EQ within the Changhe Basin showed a heterogeneous spatial distribution.
(a)
August 2001: The overall ecological quality of the Changhe Basin was relatively good, with relatively poor EQ grades distributed in the central and downstream areas of the basin.
(b)
September 2008: The relatively poor EQ grades expanded to the southwest mining areas and along the entire coastline of the Changhe River. However, the distribution map shows a significant improvement in EQ in the western mountainous areas. The period (2001–2008) coincided with the continuous coal mining activities in Shanxi Province. The significant changes in RSEI in the mining areas indicate the impact of mining activities on EQ. The decline in EQ along the Changhe River correlates closely with the continuous human utilization of water resources. The substantial improvement in EQ grades in the western mountainous areas may be attributed to Shanxi Province’s proactive promotion of the “returning farmland to forest (grassland)” project, which has achieved positive outcomes.
(c)
September 2015: It is evident that the area with relatively poor EQ grades has increased, indicating a continuous decline in EQ in the northern and southwestern parts of the study area from 2008 to 2015. The continuous mining in Shanxi coal mines during this period may be one of the reasons. In 2015, the national environmental standards for coal mines were raised, prohibiting the operation of non-compliant coal mines, and a focus on watershed environmental management began.
(d)
August 2022: There has been a significant improvement in EQ in most areas, particularly in the western mountainous areas where ecological conditions remain excellent. This improvement can be attributed to the continuous implementation of ecological restoration projects in Shanxi’s mines, and the “returning farmland to forest (grassland)” project, alongside comprehensive watershed management efforts.
From an overall perspective, taking the Changhe River as the boundary, the western section exhibited superior EQ compared to the eastern counterpart. Especially in the western mountainous areas, the government severely cracked down on illegal forest-related activities, leading to the effective protection of forest resources and a continuous enhancement in ecological conditions. However, in certain areas in the southwestern regions, specifically west of Xiacun Town and east of Dadonggou Town, EQ was rated as poor or relatively poor RSEI grades, accounting for 18.12%. It is understood that Xiacun Town and Dadonggou Town are both located within the core mining area of Chengzhuang Coal Mine, a large-scale coal mine. The excellent areas are mainly distributed in the mountainous areas of the west and southeast, accounting for 6.73%. Among them, grasslands and woodlands play an important role in ecological regulation and are less disturbed by human activities.
Figure 5 shows the transfer paths of RSEI at different levels. It can be seen that from 2001 to 2022, the RSEI in the Changhe Basin mainly underwent three paths: “poor→medium”, “medium→good”, and “good→excellent”. Overall, EQ in the Changhe Basin has been optimized.

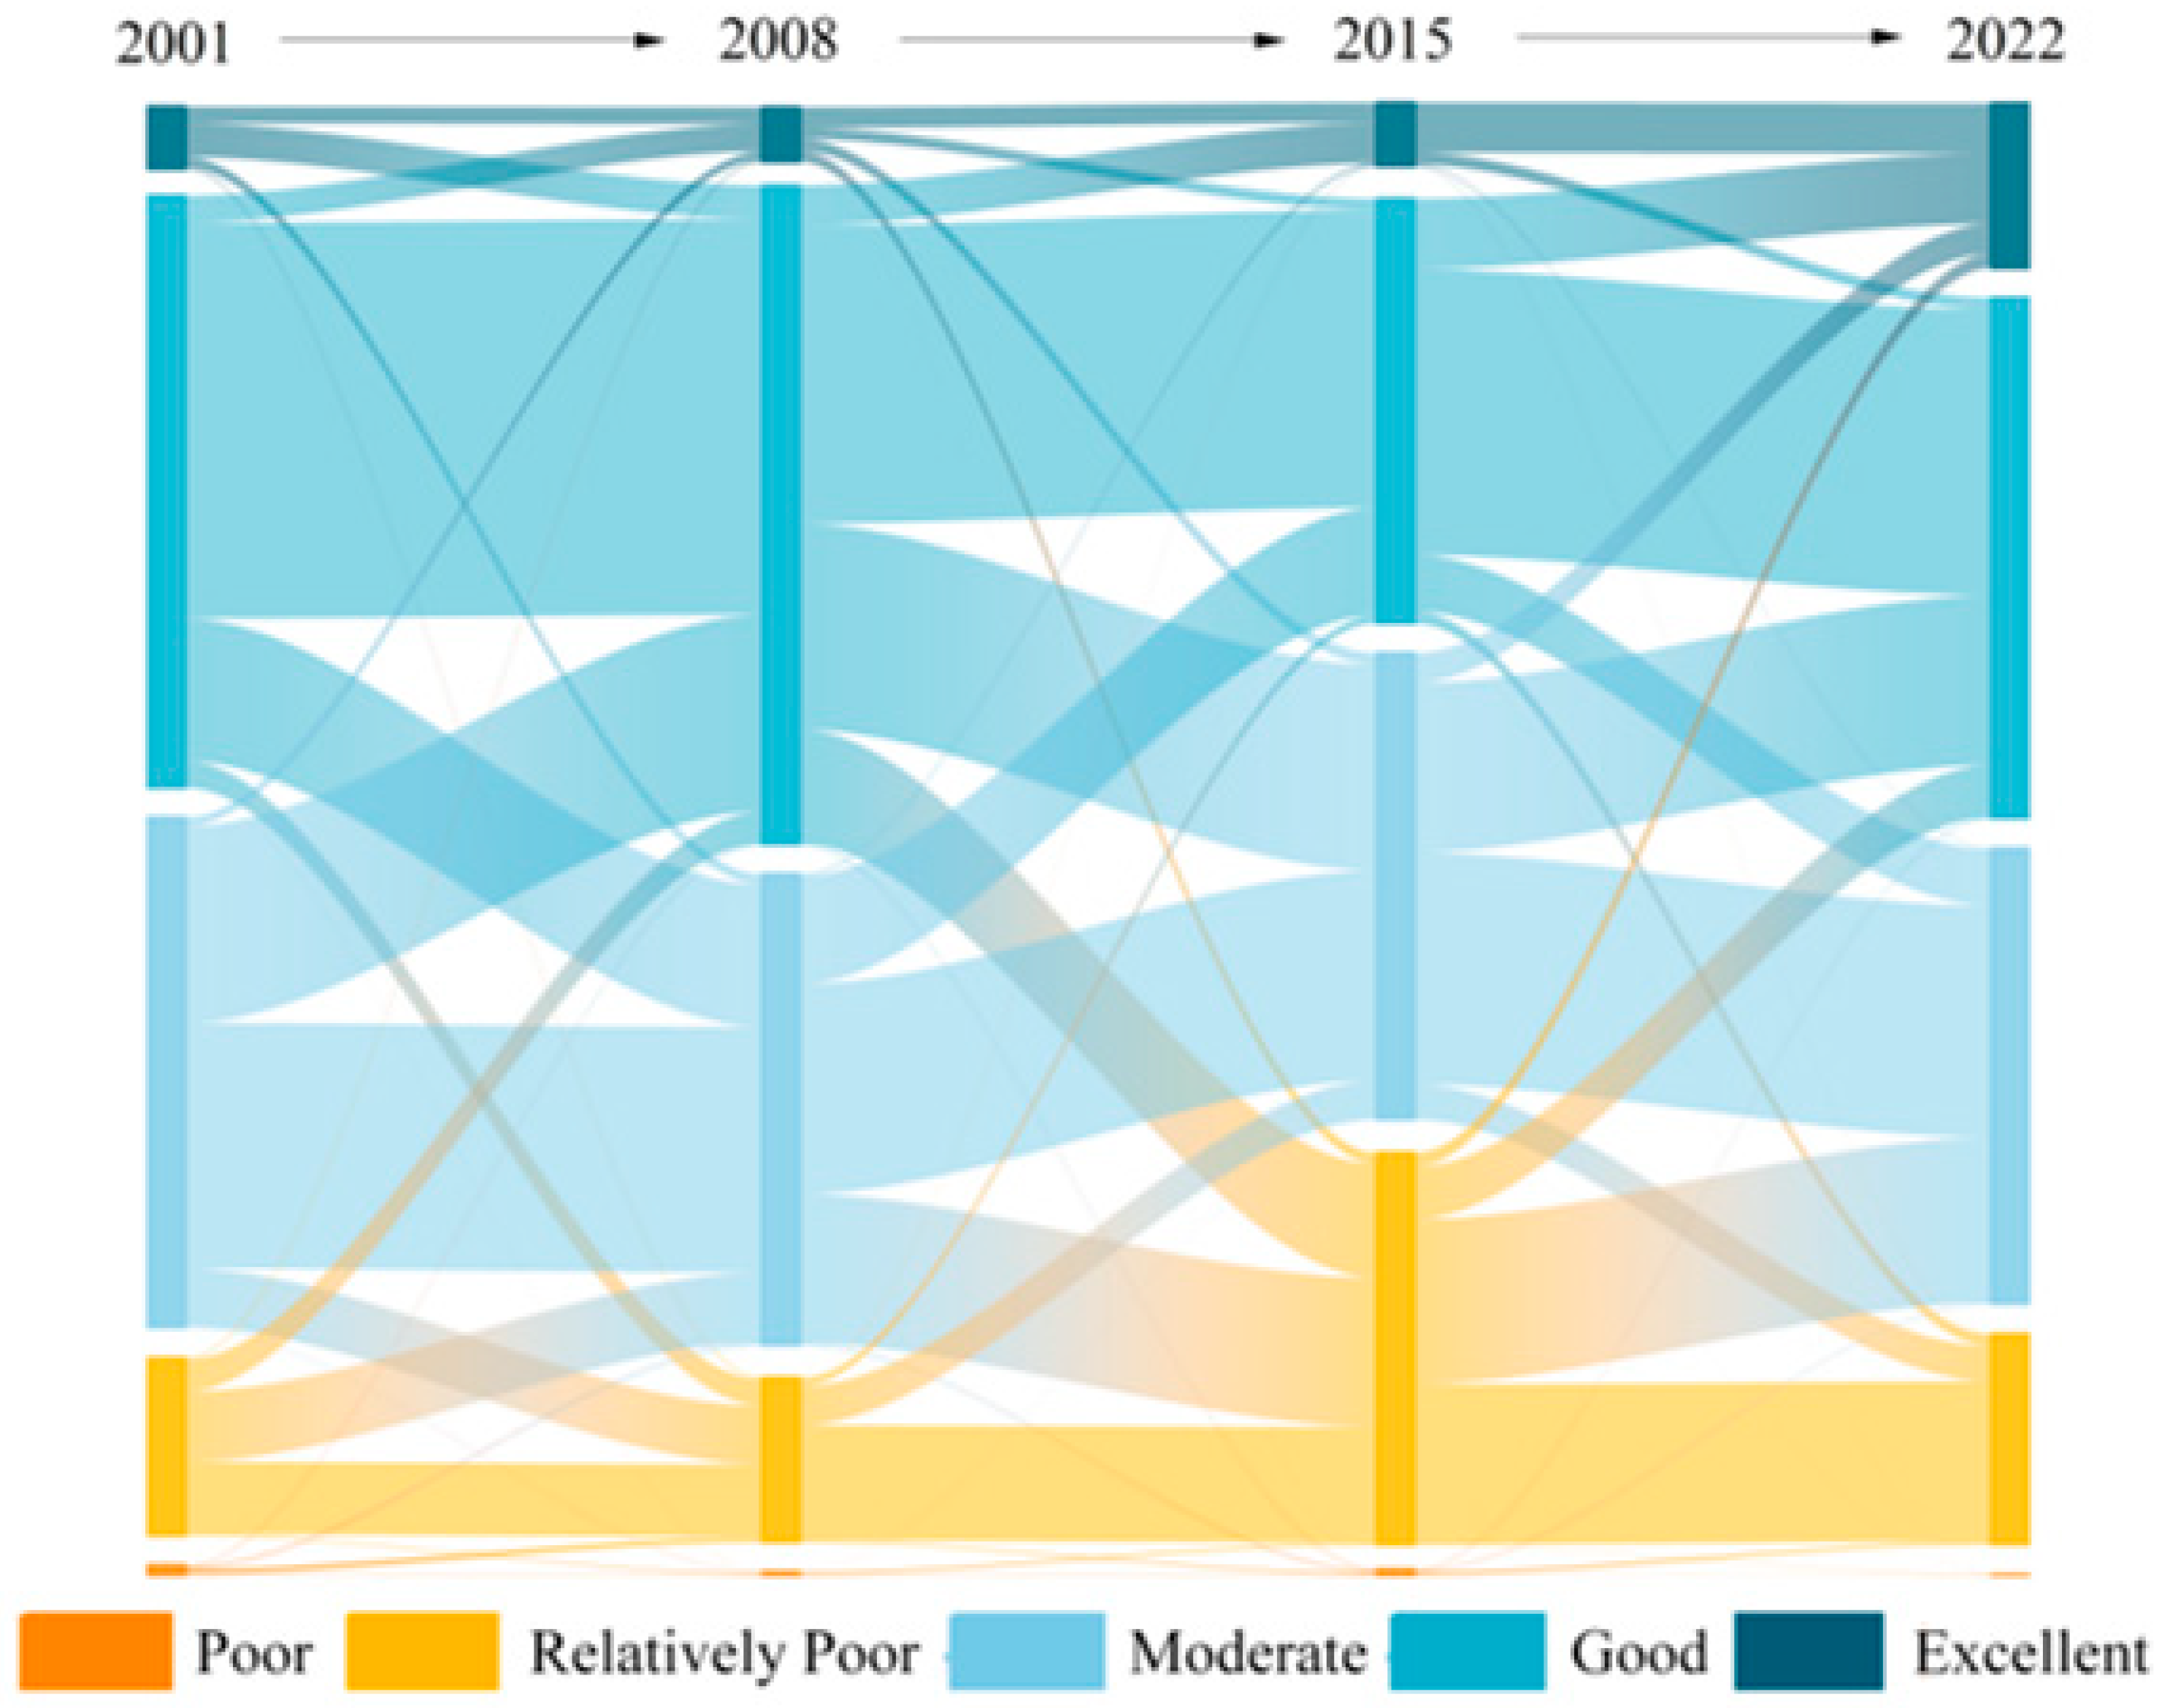
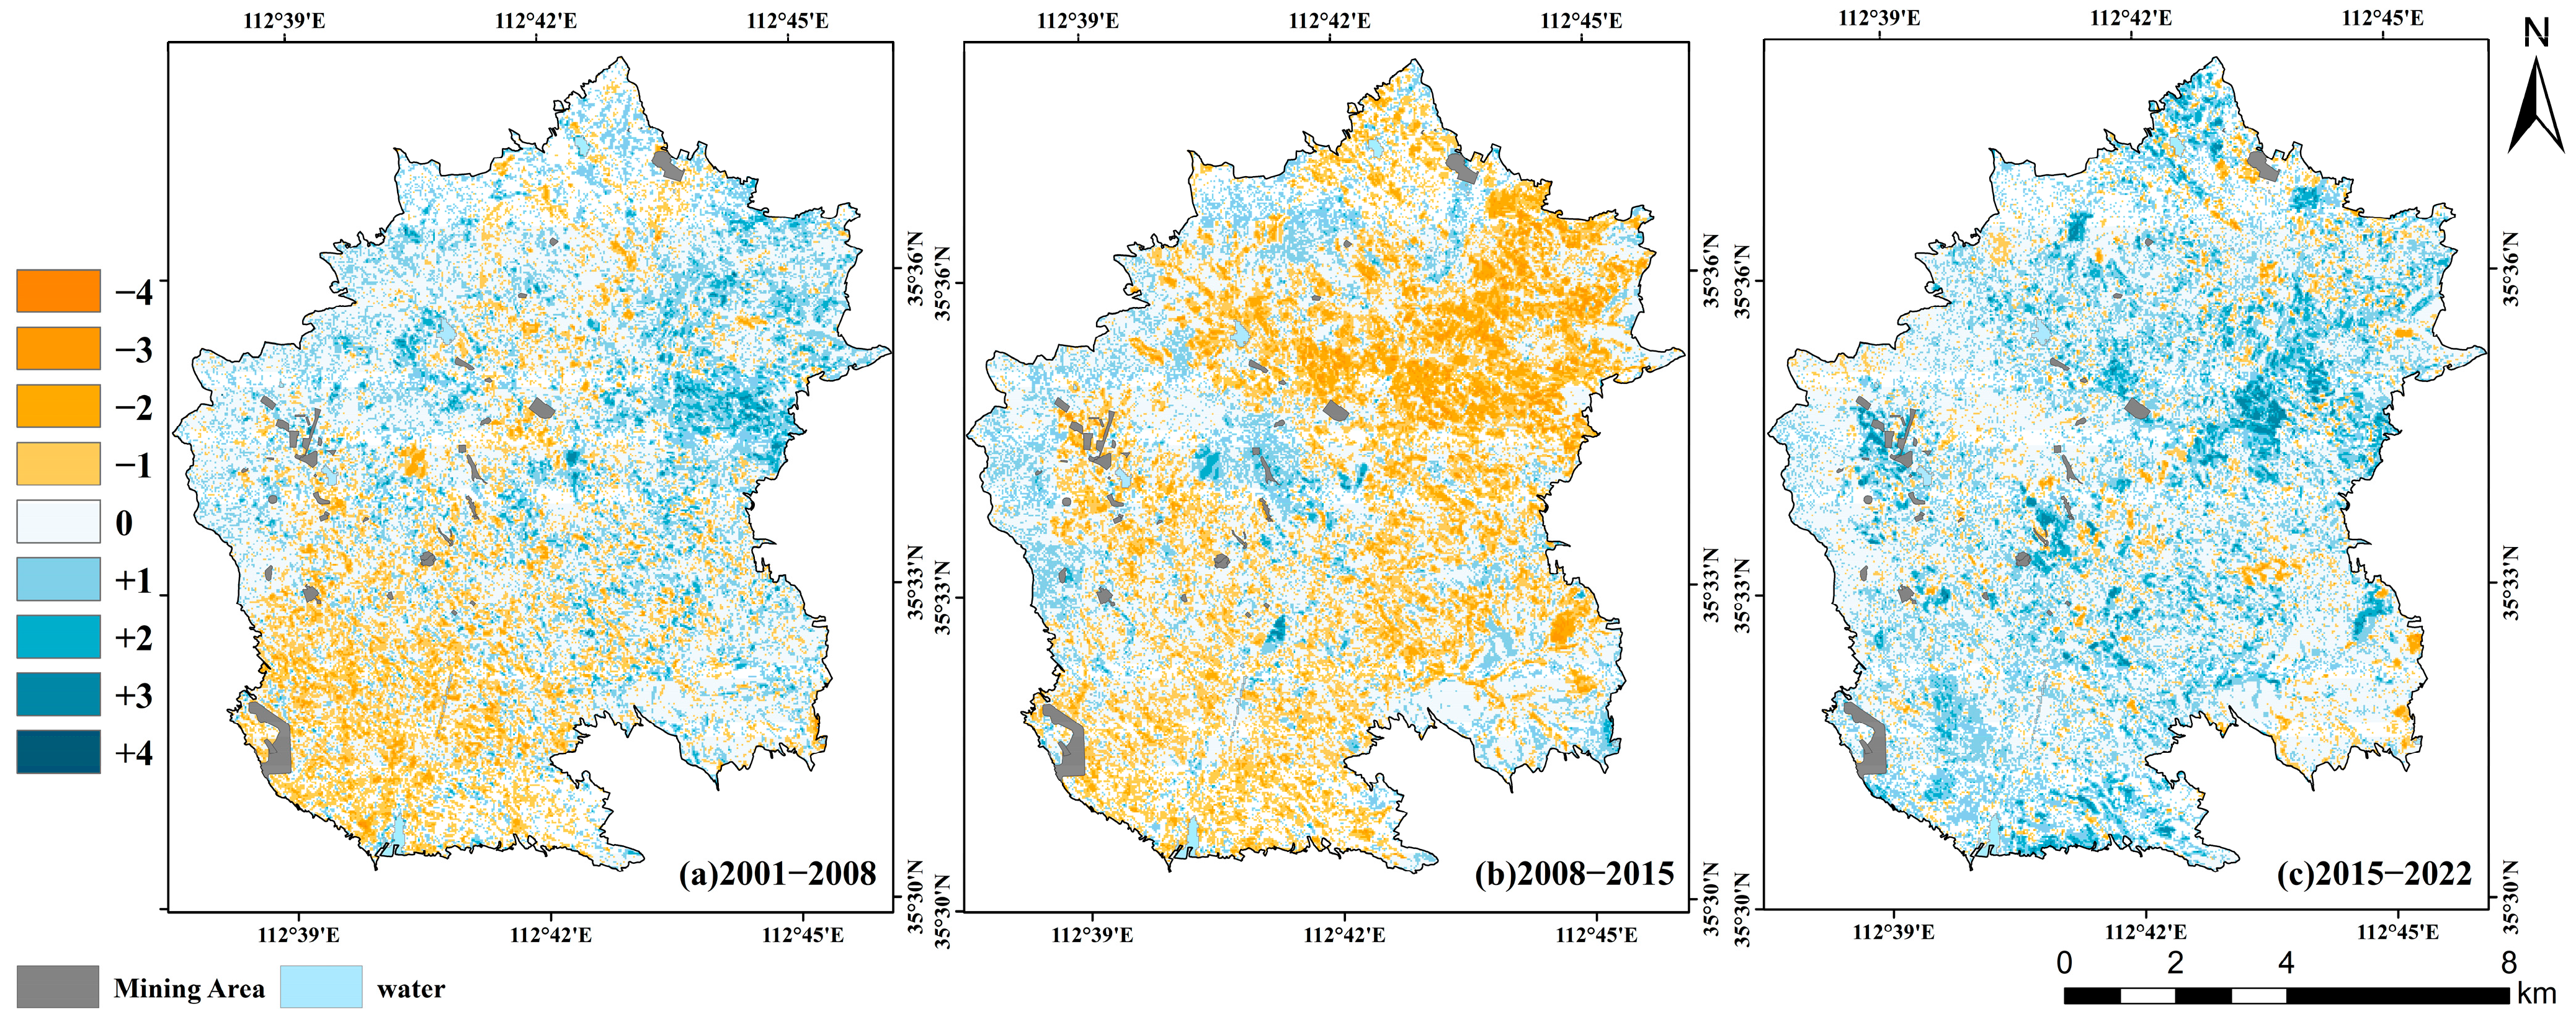
3.3. Spatial and Temporal Evolution Analysis of RSEI

In order to quantitatively study the spatiotemporal changes in the ecological conditions of the Changhe Basin at different periods, a difference change detection was conducted on the RSEI ecological grades for four time periods. The results of the difference detection were initially classified into levels ranging from +4 to −4 (+4, +3, +2, +1, 0, −1, −2, −3, −4), which clearly indicate the direction and magnitude of ecological quality changes. Subsequently, we further defined ecological change types based on the results of difference change detection, nine levels were further divided into five types: ecological degradation (−4, −3), ecological deterioration (−2, −1), ecological stability (0), ecological improvement (+1, +2), and ecological optimization (+3, +4). Statistical analysis was conducted to determine the area and proportion of each level, as presented in Table 5 and Table 6. Additionally, a difference image was generated for spatial comparison (Figure 6).
From the temporal scale, the proportions of ecological degradation and optimization types in the Changhe Basin from 2001 to 2022 were relatively low, at 0.45% and 0.50%, respectively. This indicates there is ample room to improve the EQ. Simultaneously, the EQ remained relatively stable, with a large and stable area of ecological stability type, accounting for an average of 52.49%. However, from 2008 to 2015, the proportion of deteriorated ecological areas surged to 35.68%. This rise may be attributed to natural or human disturbances, such as the exploitation and utilization of potential mineral resources in the study area during this period (based on local mineral resource planning).
From 2015 to 2022, the proportion of deteriorated ecological areas decreased to 8.17%, and the EQ gradually improved. This positive trend is closely related to the local government’s vigorous promotion of soil and water loss control and comprehensive mine remediation.
From the spatial scale (Figure 6), ecological degradation areas are mainly concentrated in Chuandi Town in the southwest and Xiacun Town and Dadonggou Town in the northeast. Chuandi Town has actively carried out restoration and governance of coal mining subsidence areas, such as relocation and resettlement projects in Wanghushan Village. From 2015 to 2022, Hepo Village and Donggou Village in Chuandi Town and Dadonggou Town have been transformed into ecological optimization types. Overall, EQ has greatly improved, with a large area transformed into ecological optimization types, showing a positive trend.

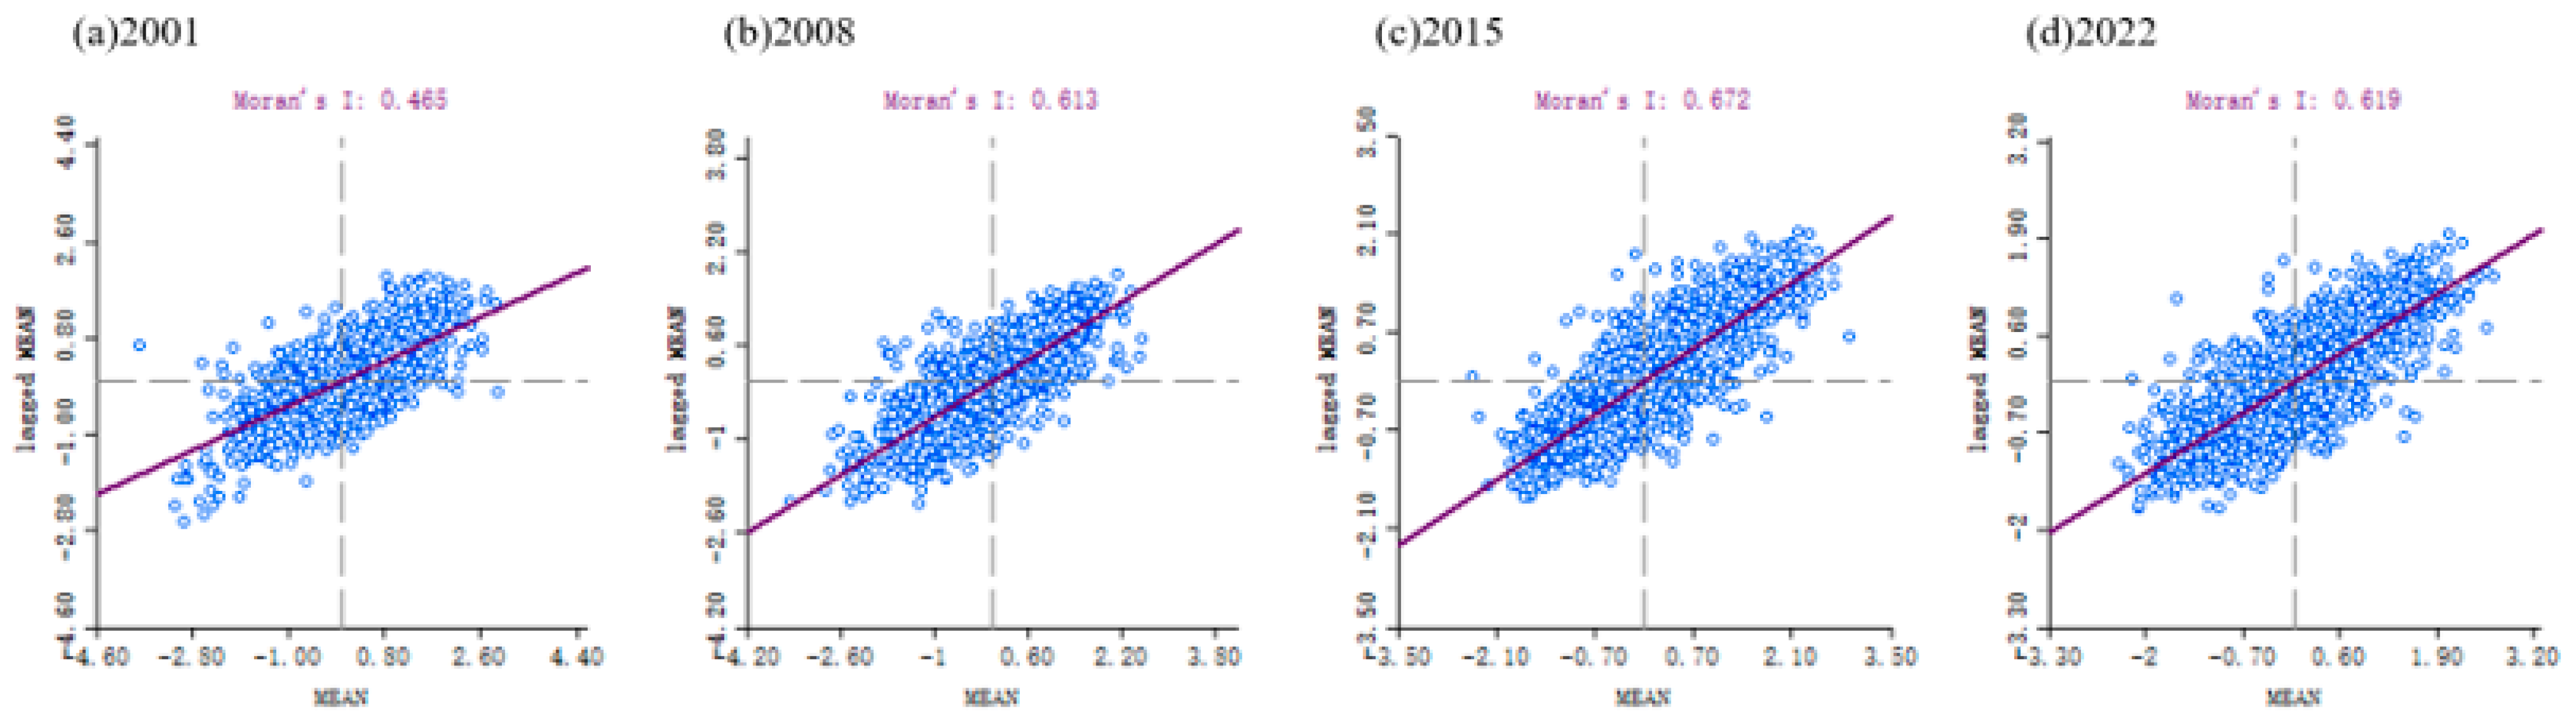
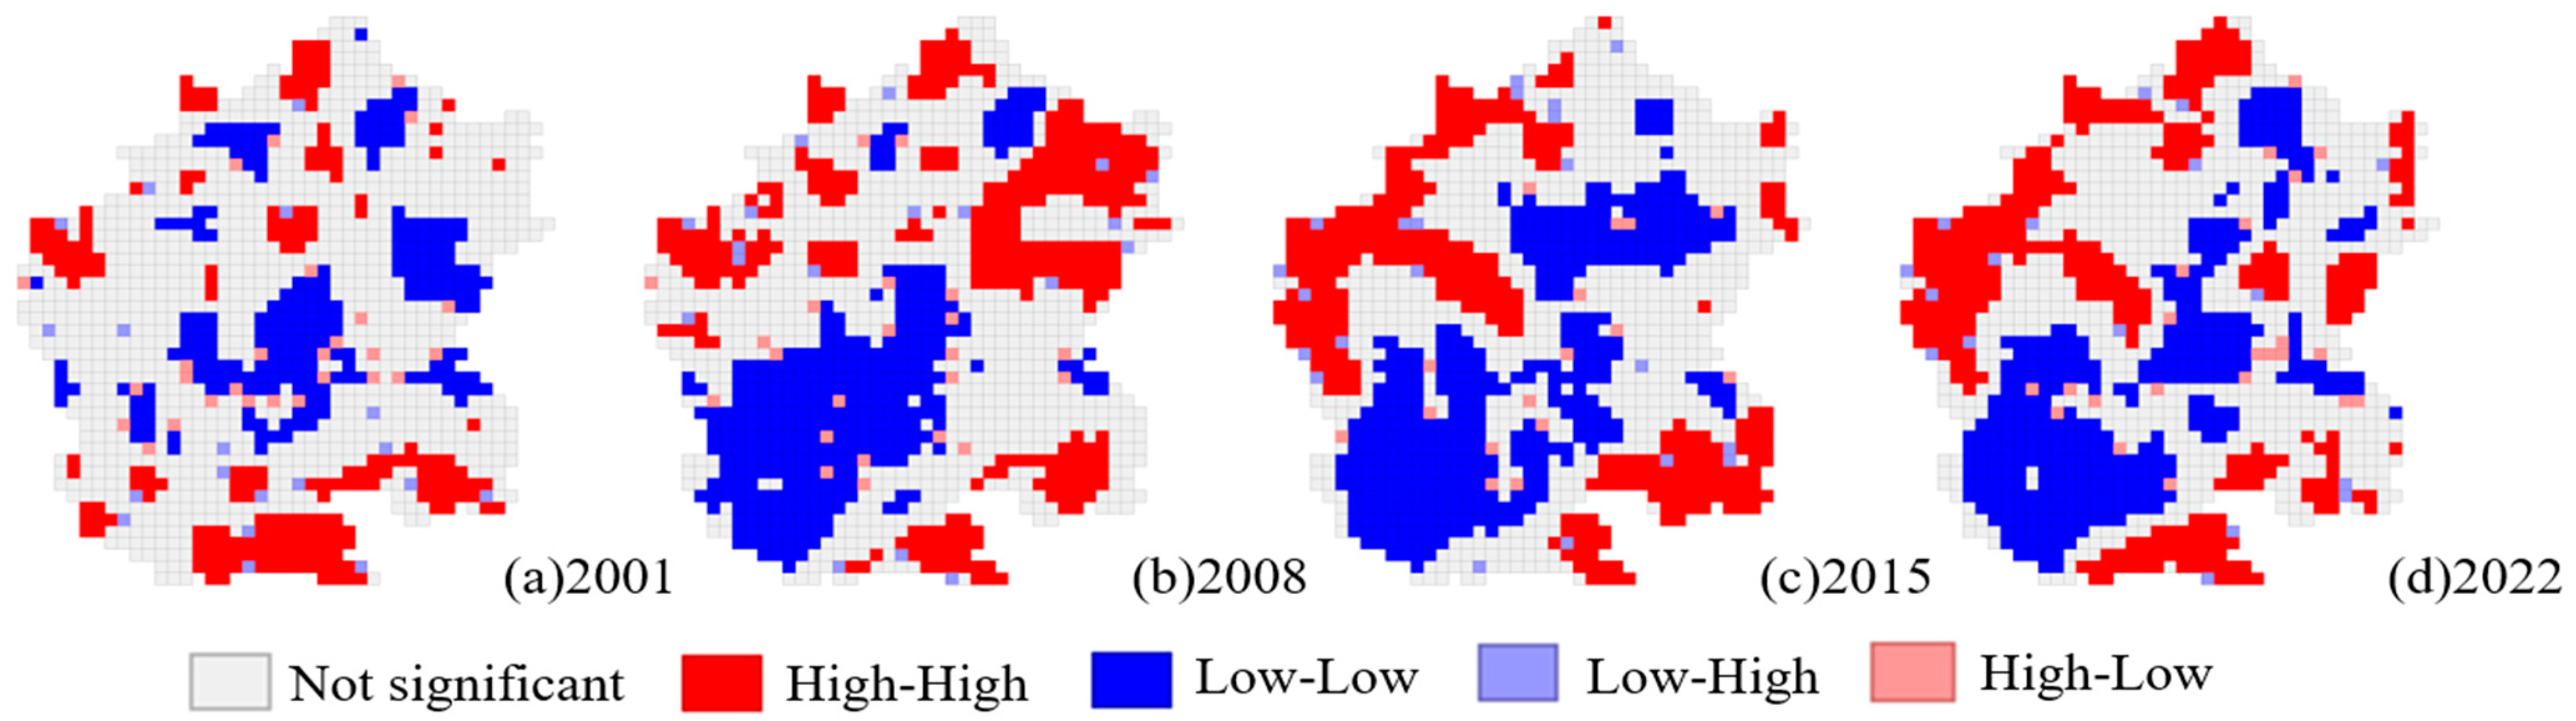
3.4. Spatial Autocorrelation Analysis of EQ

To ensure the accuracy of quantitative evaluation, the RSEI grid data for the four periods were assigned to the 300 m × 300 m fishing net. Subsequently, the mean RSEI value of each grid was computed. Spatial autocorrelation analysis was conducted using GeoDa software. Global Moran’s I was employed to calculate the scatter plot of the Moran index for the four periods (Figure 7). Figure 6 reveals that the points are mainly distributed in the first and third quadrants, indicating that the spatial distribution of EQ has strong spatial autocorrelation. The distribution appears clustered rather than random. The Moran index for the period of 2001–2022 first increased and then decreased, with the strongest positive correlation in 2015, with a value of 0.672, while the weakest was in 2001, with a value of 0.465.
Local Moran’s I was used to obtain the spatial agglomeration type of RSEI, including five types: not significant, high–high (HH) cluster, low–low (LL) cluster, high–low (HL) dispersion, and low–high (LH) dispersion (Figure 8). As shown in Figure 8, the HH cluster in the Changhe Basin is predominantly located in the western mountainous area, aligning with the high RSEI region. It was initially mainly distributed in Wanghushan Village, Chuandi Town, and later gradually expanded. The LL cluster is concentrated in the southwest of the study area, particularly in Chuandi Town, forming an LL cluster in 2008, 2015, and 2022. The area is densely distributed with mines, and it has been disturbed by mining for a long time, resulting in significant local spatial autocorrelation differences. Overall, the distribution of the HH and LL clusters in the Changhe Basin is concentrated and accounts for a large proportion of the area, while the HL and LH clusters are scattered and their areas are very small. This indicates that the spatial distribution of RSEI in the basin is closely interconnected.

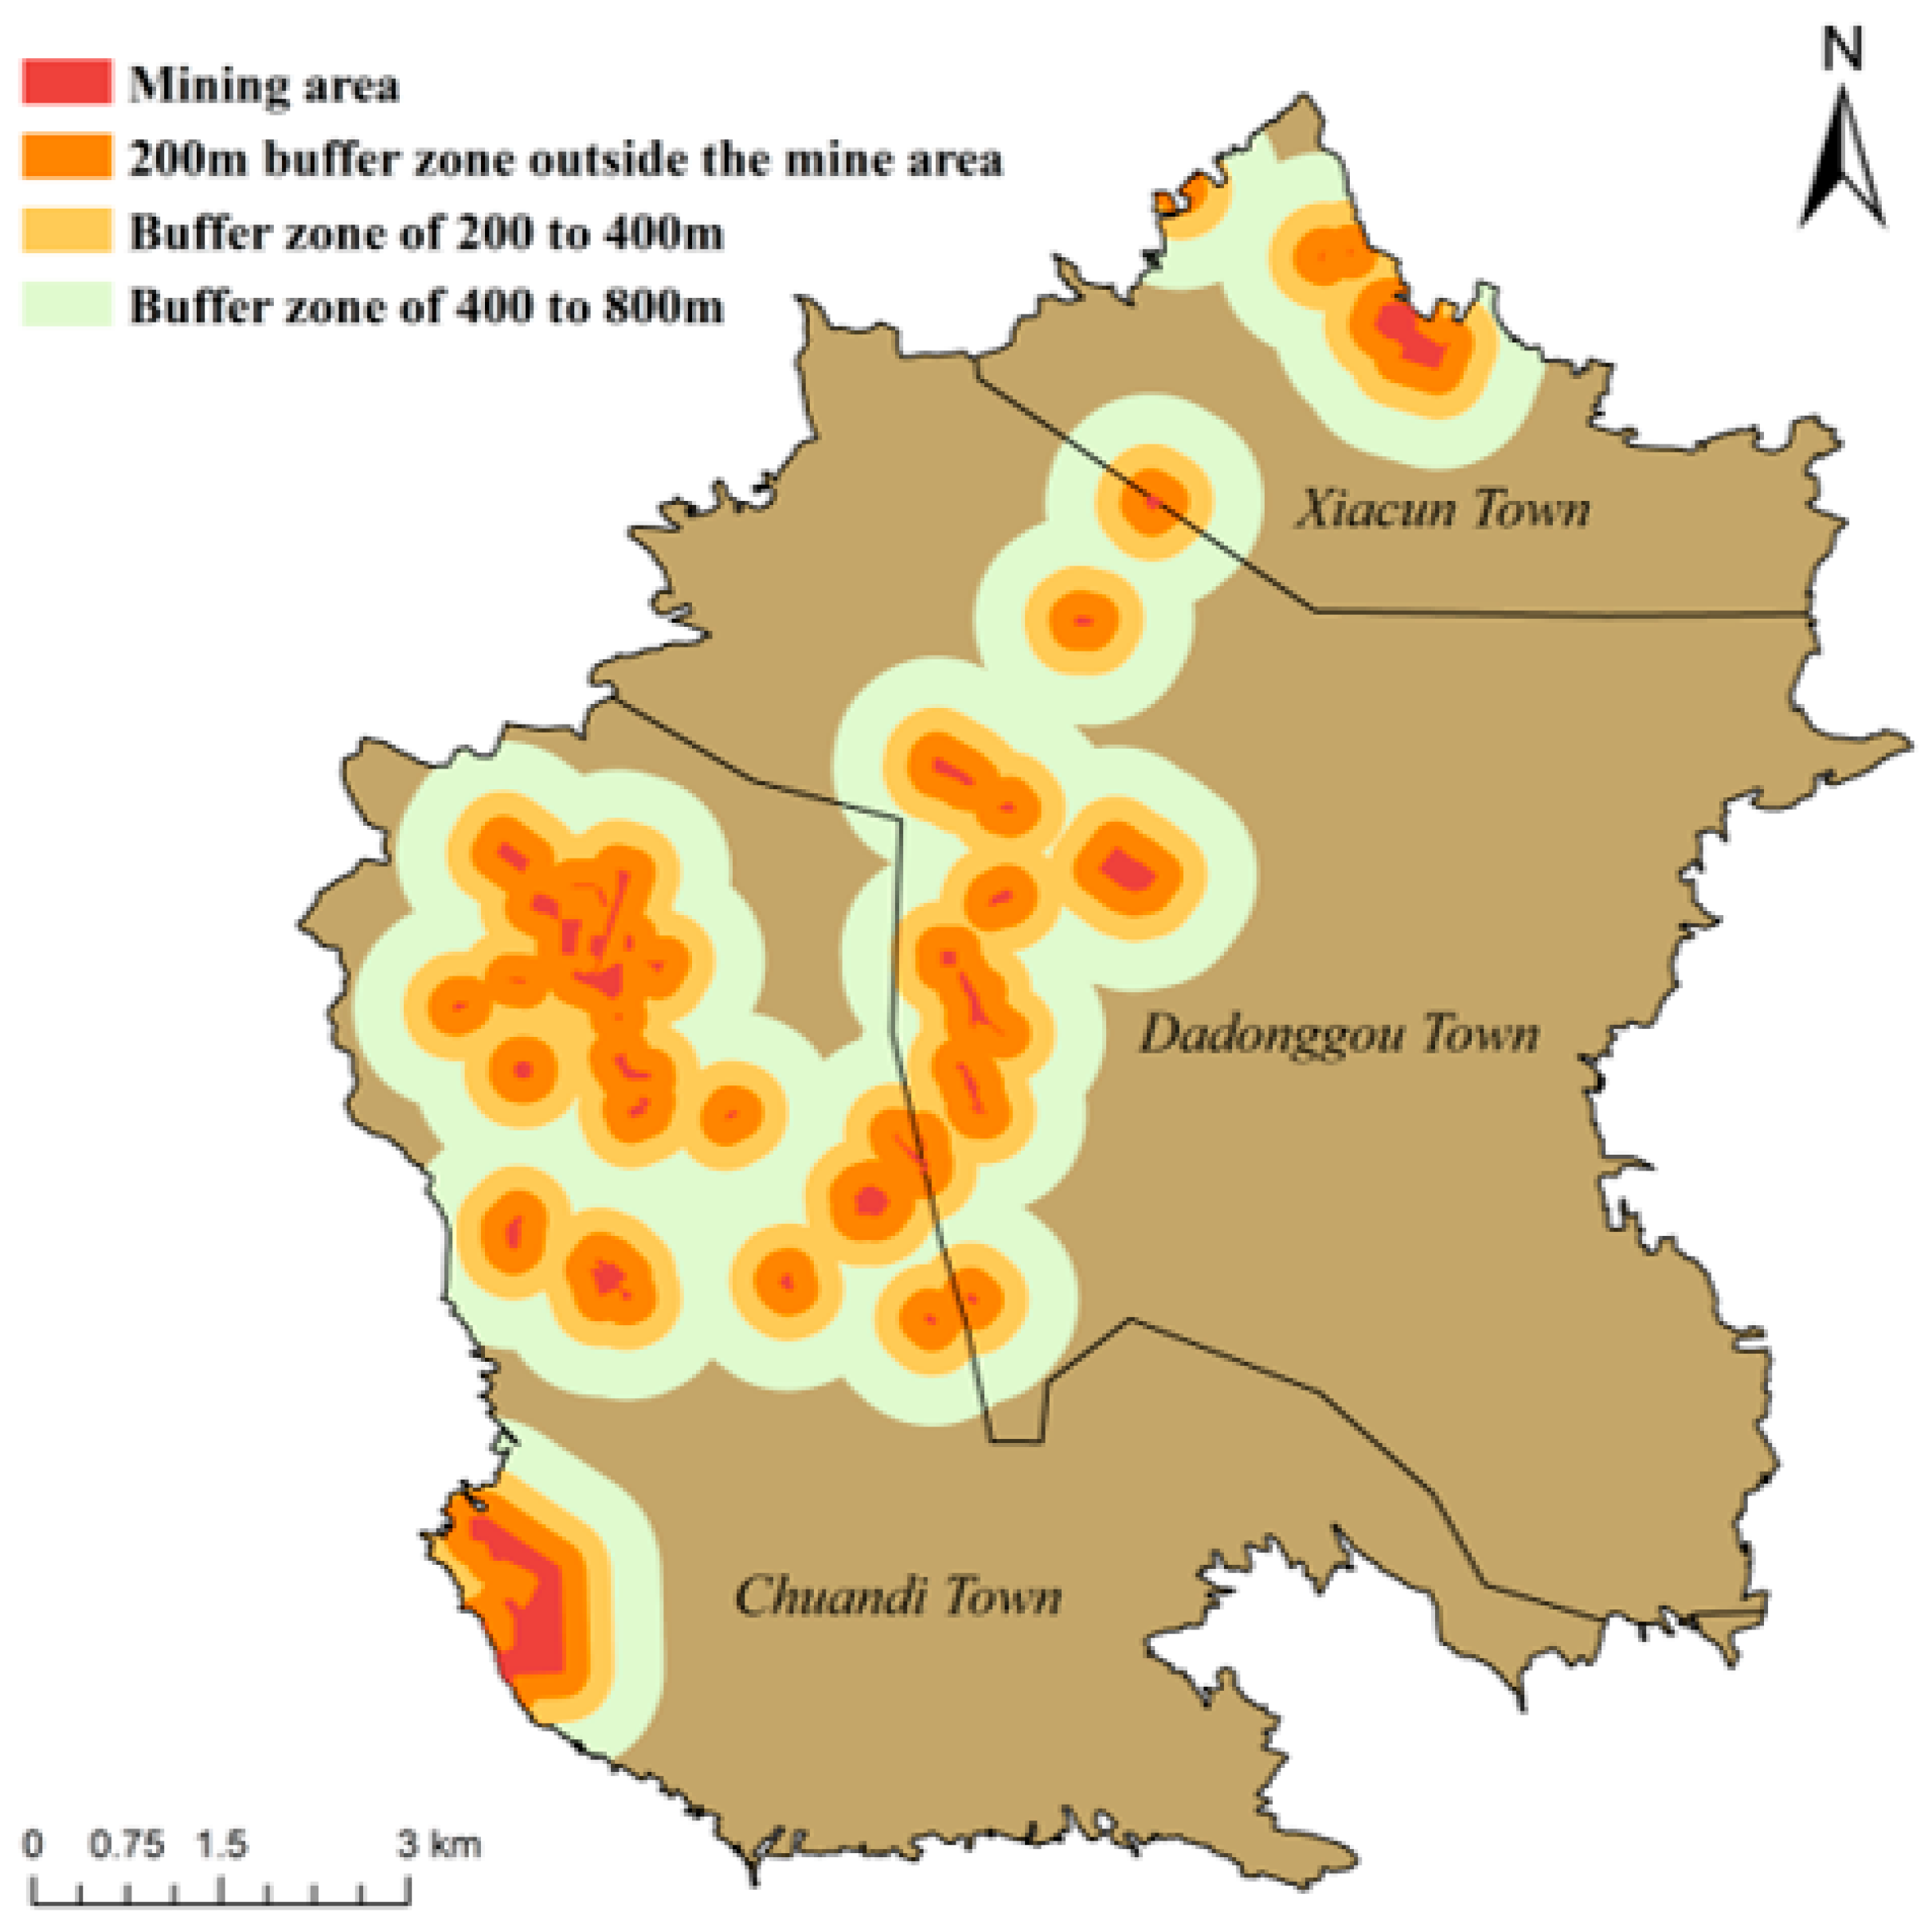
3.5. Mining Activities and EQ

Three buffer zones (200 m, 400 m, and 800 km) were established outside the mining areas in the Changhe Basin. The distribution of mining areas and buffer zones is shown in Figure 9. The subsequent analysis delved into the outcomes and distribution of ecological grades within these buffer zones. The RSEI values of the mining area, the area outside the mining area within 200 m, the buffer zone between 200 and 400 m, and the buffer zone between 400 and 800 m were statistically analyzed separately.
As can be seen from the four broken lines in Figure 10, the RSEI values within the mining area exhibit the lowest values, indicating the poorest ecological conditions. This underscores the negative impact of coal mining on the ecosystem. Within the 800 m buffer zone surrounding the mining area, EQ gradually decreases with increasing distance, indicating that mining activities have severely affected the surrounding ecological quality. Since 2001, the RSEI values of all buffer zones have gradually decreased, reaching a nadir in 2015, which is consistent with the mining activities in the Changhe Basin. However, by 2022, the RSEI values had risen to their peak. This can be attributed to the implementation of key ecological restoration projects in Shanxi Province, such as “Two Mountains, Seven Rivers, and One Basin” and the ecological restoration and governance efforts in historically abandoned mines. These measures have made progress in ecological restoration and land reclamation in mining areas to varying degrees, resulting in a comprehensive improvement in the ecological quality.

3.6. Terrain and EQ

In the coal-bearing hilly areas of Northern China, topographical factors are one of the main factors influencing the ecological quality. The Changhe Basin, situated in the earth–rock mountainous areas, exhibits significant terrain undulation and notable humidity variation. In the eastern, western, and northern regions of the basin, loess and stony mountain landforms prevail, characterized by elevations exceeding 950 m. Detailed distributions of elevation, slope, and aspect in the study area are depicted in Figure 11.
According to the regional statistical analysis in ArcGIS, the maximum value of TWI in the study area is 21.91, the minimum value is 3.72, and the mean value is 6.81. In order to observe whether there is a direct correlation between TWI and RSEI, four typical locations were selected for comparison in the study area (Figure 12). These locations are, respectively, located in the downstream of the main stream of the Changhe River (a), the southeastern mountainous area (b), the western mountainous area (c), and the southwestern mining area (d). The selected area includes regions with numerous river systems, densely vegetated mountainous areas, and densely mined areas, making it fairly representative. Figure 13 illustrates the conditions of different regions in the Changhe Basin. In region (a), located in the downstream area of the main stream of Changhe River, water is collected at the right tributary, causing rapid runoff from precipitation. This runoff affects land fertility and ecosystem stability. As a result, RSEI is significantly lower compared to the surrounding areas, indicating poor EQ. In regions (b) and (c), there is a noticeable correlation where higher TWI values correspond to lower RSEI values. Areas with elevated TWI values typically exhibit abundant vegetation and water bodies (regions c and d on site are forested areas). There exists a complex relationship between TWI and soil erosion. Areas with higher TWI values are more prone to soil erosion and land degradation, contributing to soil degradation and ecosystem destabilization. Region (d) shows moderate TWI levels, and RSEI exhibits a relatively poor level in the eastern part of this area. Through field investigations, it is found that this area is the location of a large coal mine in Chuandi Town. Combined with natural factors of the special terrain, as well as human mining activities, it leads to changes in soil quality. This triggers geological disasters such as surface cracks and varying degrees of coal mining subsidence, leading to land degradation and habitat destruction.
Overall, the impact of topographical factors on the ecological environment in rocky and mountainous areas is significant. The terrain in these areas is mostly steep mountains and hills, which are prone to soil erosion and loss. The diversity of vegetation distribution is caused by different elevations, slopes, and aspects of the terrain. Land use is also restricted, affecting agricultural, forestry, and livestock production activities. Moreover, the terrain in earth–rock mountainous areas is mostly steep mountains composed of rocks and soil. Extensive coal mining activities in these areas increase the risk of geological disasters, posing significant threats to human life, property, and the ecological environment. The complexity of the terrain makes land degradation and ecological restoration challenging, necessitating more comprehensive and scientific measures to achieve sustainable improvement of the ecological quality.

4. Discussion

4.1. Assessment Results and Research Significance of Ecological Quality in the Changhe Basin

The analysis results of this study indicate that from 2001 to 2015, the ecological quality of the Changhe River Basin showed a declining trend, with increasing disturbances in mining areas and a gradual decrease in vegetation coverage. However, from 2001 to 2022, the overall ecological quality improved, consistent with findings from related studies [37,54]. Notably, the ecological quality in the western part of the basin stabilized and improved, which can be attributed to reduced human interference and more robust natural ecosystems. Spatial autocorrelation analysis indicates that high–high (HH) clusters of ecological quality are located at the eastern edge of the basin, while low–low (LL) clusters are situated in Chuandi Town in the west. This spatial clustering pattern aligns with the findings of Yang J. et al. [55]. Furthermore, the observed initial increase and subsequent decrease in the impact of mining on ecological quality suggest the effectiveness of recent ecological restoration efforts. It is noteworthy that the relationship between TWI values and ecological quality was significant. Higher TWI values corresponded to lower RSEI values and poorer ecological quality. This finding is consistent with the research by He M.Z. et al., who reported that topographical factors are the primary determinants of ecological vulnerability in the earth–rock mountainous areas [56].
The findings of this study have several important implications for regional ecological management. Firstly, the identified spatial and temporal trends underscore the necessity for continuous monitoring and adaptive management strategies. Secondly, the clear impact of mining activities on ecological quality highlights the importance of stringent regulatory measures and effective restoration practices in mining areas. Lastly, the correlation between geological factors and ecological quality suggests that conservation efforts must consider the unique topographical characteristics of the region to be effective.

4.2. Application and Improvement Exploration of RSEI

We successfully applied the RSEI to evaluate the ecological quality of complex regions like the Changhe Basin. Since Xu, H.Q. introduced RSEI for ecological quality evaluation, related research has primarily focused on urban areas [57], and subsequently applied it to river basins, arid regions, and mining areas. Our study area, which combines features of river basins, mining areas, and arid and semi-arid regions, is characterized by complex topography and long-term underground coal mining activities.
Many scholars have proposed improvements to RSEI for regional suitability, such as enhancing the construction of indicators [58], and improving the methods of indicator integration [59]. However, although these improved indices have shown enhanced results compared to directly applying RSEI, we cannot fully confirm the rationality of these improvements. Do the new indicators add information to the original RSEI, or do they cause interference among components during principal component analysis? Current evidence in some articles is not comprehensive [60]. This study focuses on the suitability of RSEI in the Changhe Basin and the changes in ecological quality, verifying from the principles of RSEI construction, principal component analysis, and field investigations. Additionally, considering the unique topographical characteristics of the study area, we supplemented the evaluation with the Topographic Wetness Index (TWI) as an auxiliary verification indicator.
Furthermore, when exploring the driving factors of RSEI changes, many scholars tend to broadly consider natural conditions, socio-economic factors, and other aspects, using geographical detectors to analyze the dominant ecological factors in the region [61]. Our study specifically investigates the potential dominant factors affecting ecological quality changes, exploring the relationships between topographical factors, mining activities, and RSEI. This in-depth investigation reveals the reasons behind RSEI changes, emphasizing the dual roles of natural and anthropogenic factors in shaping ecological quality.

4.3. The Interaction between Mining Activities and Natural Topography

In areas with complex topography, the geological structure is fragile, and mining activities undoubtedly exacerbate the impact on the ecosystem. Mining activities and large-scale land excavation and topsoil removal have limited direct impact on topography; although they do not cause significant topographic changes, the changes at the micro level may be significant. The interactions between mining activities and topographic factors are complex and variable.
According to our field survey results, local underground mining has generated numerous ground fissures. These fissures not only disrupt the original soil and vegetation, altering the surface landscape. They also easily alter water flow patterns, increasing susceptibility to erosion. Once vegetation is destroyed, the exposed land is prone to weathering and erosion, further deteriorating the ecological environment. Therefore, in the RSEI, the greenness, humidity, and dryness indices theoretically will change. The changes in ecological quality are closely related to topographic factors and mining activities, which jointly influence the ecological quality of the study area. Of course, other factors such as climate change and vegetation types also play a role. We did not analyze mining activities and topographic factors as a single entity because we cannot exclude the influence of other factors, nor can we ignore the individual effects and significance of each on ecological quality. Additionally, comprehensive analysis requires considering multiple variables and interactions, and combining them might oversimplify this complex process. Therefore, analyzing these two factors separately helps to more accurately understand their respective contributions to ecological quality.

4.4. Limitations and Prospects

While our study provides valuable insights, it has some limitations. The use of RSEI as the sole indicator of ecological quality may not capture all aspects of ecosystem health.
Regarding the impact of mining activities on the surrounding ecological quality. The coal mines in the study area are predominantly underground mining operations. Compared to open-pit mining, underground mining reduces the damage to the surrounding environment caused by waste rock piles. Field surveys revealed that the local coal mines are mainly small- to medium-sized operations, with no significant surface expansion during mining activities. Therefore, we did not further explore the detailed impacts of mining activities. Furthermore, our current study only obtained the overall spatial impact range for the years 2001, 2008, 2015, and 2022. Due to data limitations, the current temporal data points are insufficient to fully capture the dynamic characteristics of ecological changes. In future research, we plan to incorporate more time points and apply the methods proposed in this paper to enhance the temporal analysis. Especially before and after mining activities, more detailed time series data will allow us to more accurately reveal the long-term impacts of mining on ecological quality.
Future research can attempt to incorporate more potential influencing factors in the analysis of the Changhe Basin, such as socio-economic factors. On one hand, population growth and economic development increase the demand for land resources, leading to the expansion of residential and industrial areas. This urban expansion reduces natural ecological spaces and may bring pollution and environmental pressure, affecting ecosystem health. On the other hand, economic development and population growth can promote the implementation of ecological landscape construction and environmental protection measures, such as the ecological landscape construction along the Changhe River. These measures can improve the regional ecological environment, positively impacting the RSEI. Therefore, including socio-economic factors in the analysis can help comprehensively understand the mechanisms affecting ecological quality, providing a scientific basis for ecological environment management and policy-making in the Changhe Basin.

5. Conclusions

This paper evaluates the spatial and temporal dynamic changes in the ecological quality of the Changhe Basin based on Landsat TM/OLI remote sensing data using RSEI. Simultaneously, it explores the impact of coal mining disturbance on the surrounding ecological quality. Finally, it discusses the relationship between the unique geological factors and the ecological quality in the coal-bearing hilly areas of Northern China. The main conclusions are as follows:
  • On the temporal scale, from 2001 to 2022, the overall ecological quality has significantly improved and enhanced on a stable basis. The average proportion of ecological stability type was 52.49%, while the average proportion of ecological optimization and improvement types was 25.75%. On the spatial scale, the ecological quality in the western part of the Changhe River, especially in the western mountainous areas, is higher. In contrast, the areas of poorer ecological quality are concentrated in Chuandi Town, where mining disturbance is severe.
  • The spatial correlation values for 2001, 2008, 2015, and 2022 were 0.465, 0.613, 0.672, and 0.619 respectively. There is a strong positive correlation between the spatial distribution of ecological and environmental quality in the Changhe Basin. Specifically, HH and LL distributions are dominant and concentrated, while HL and LH distributions are less frequent and more scattered.
  • The study reveals that as the distance from the buffer zone outside the mining area increases, RSEI gradually decreases. There is a certain impact of mining activities on the surrounding ecological quality. The impact shows an initially increasing and then decreasing trend from 2001 to 2022, indicating the effectiveness of regional mine ecological restoration efforts in recent years.
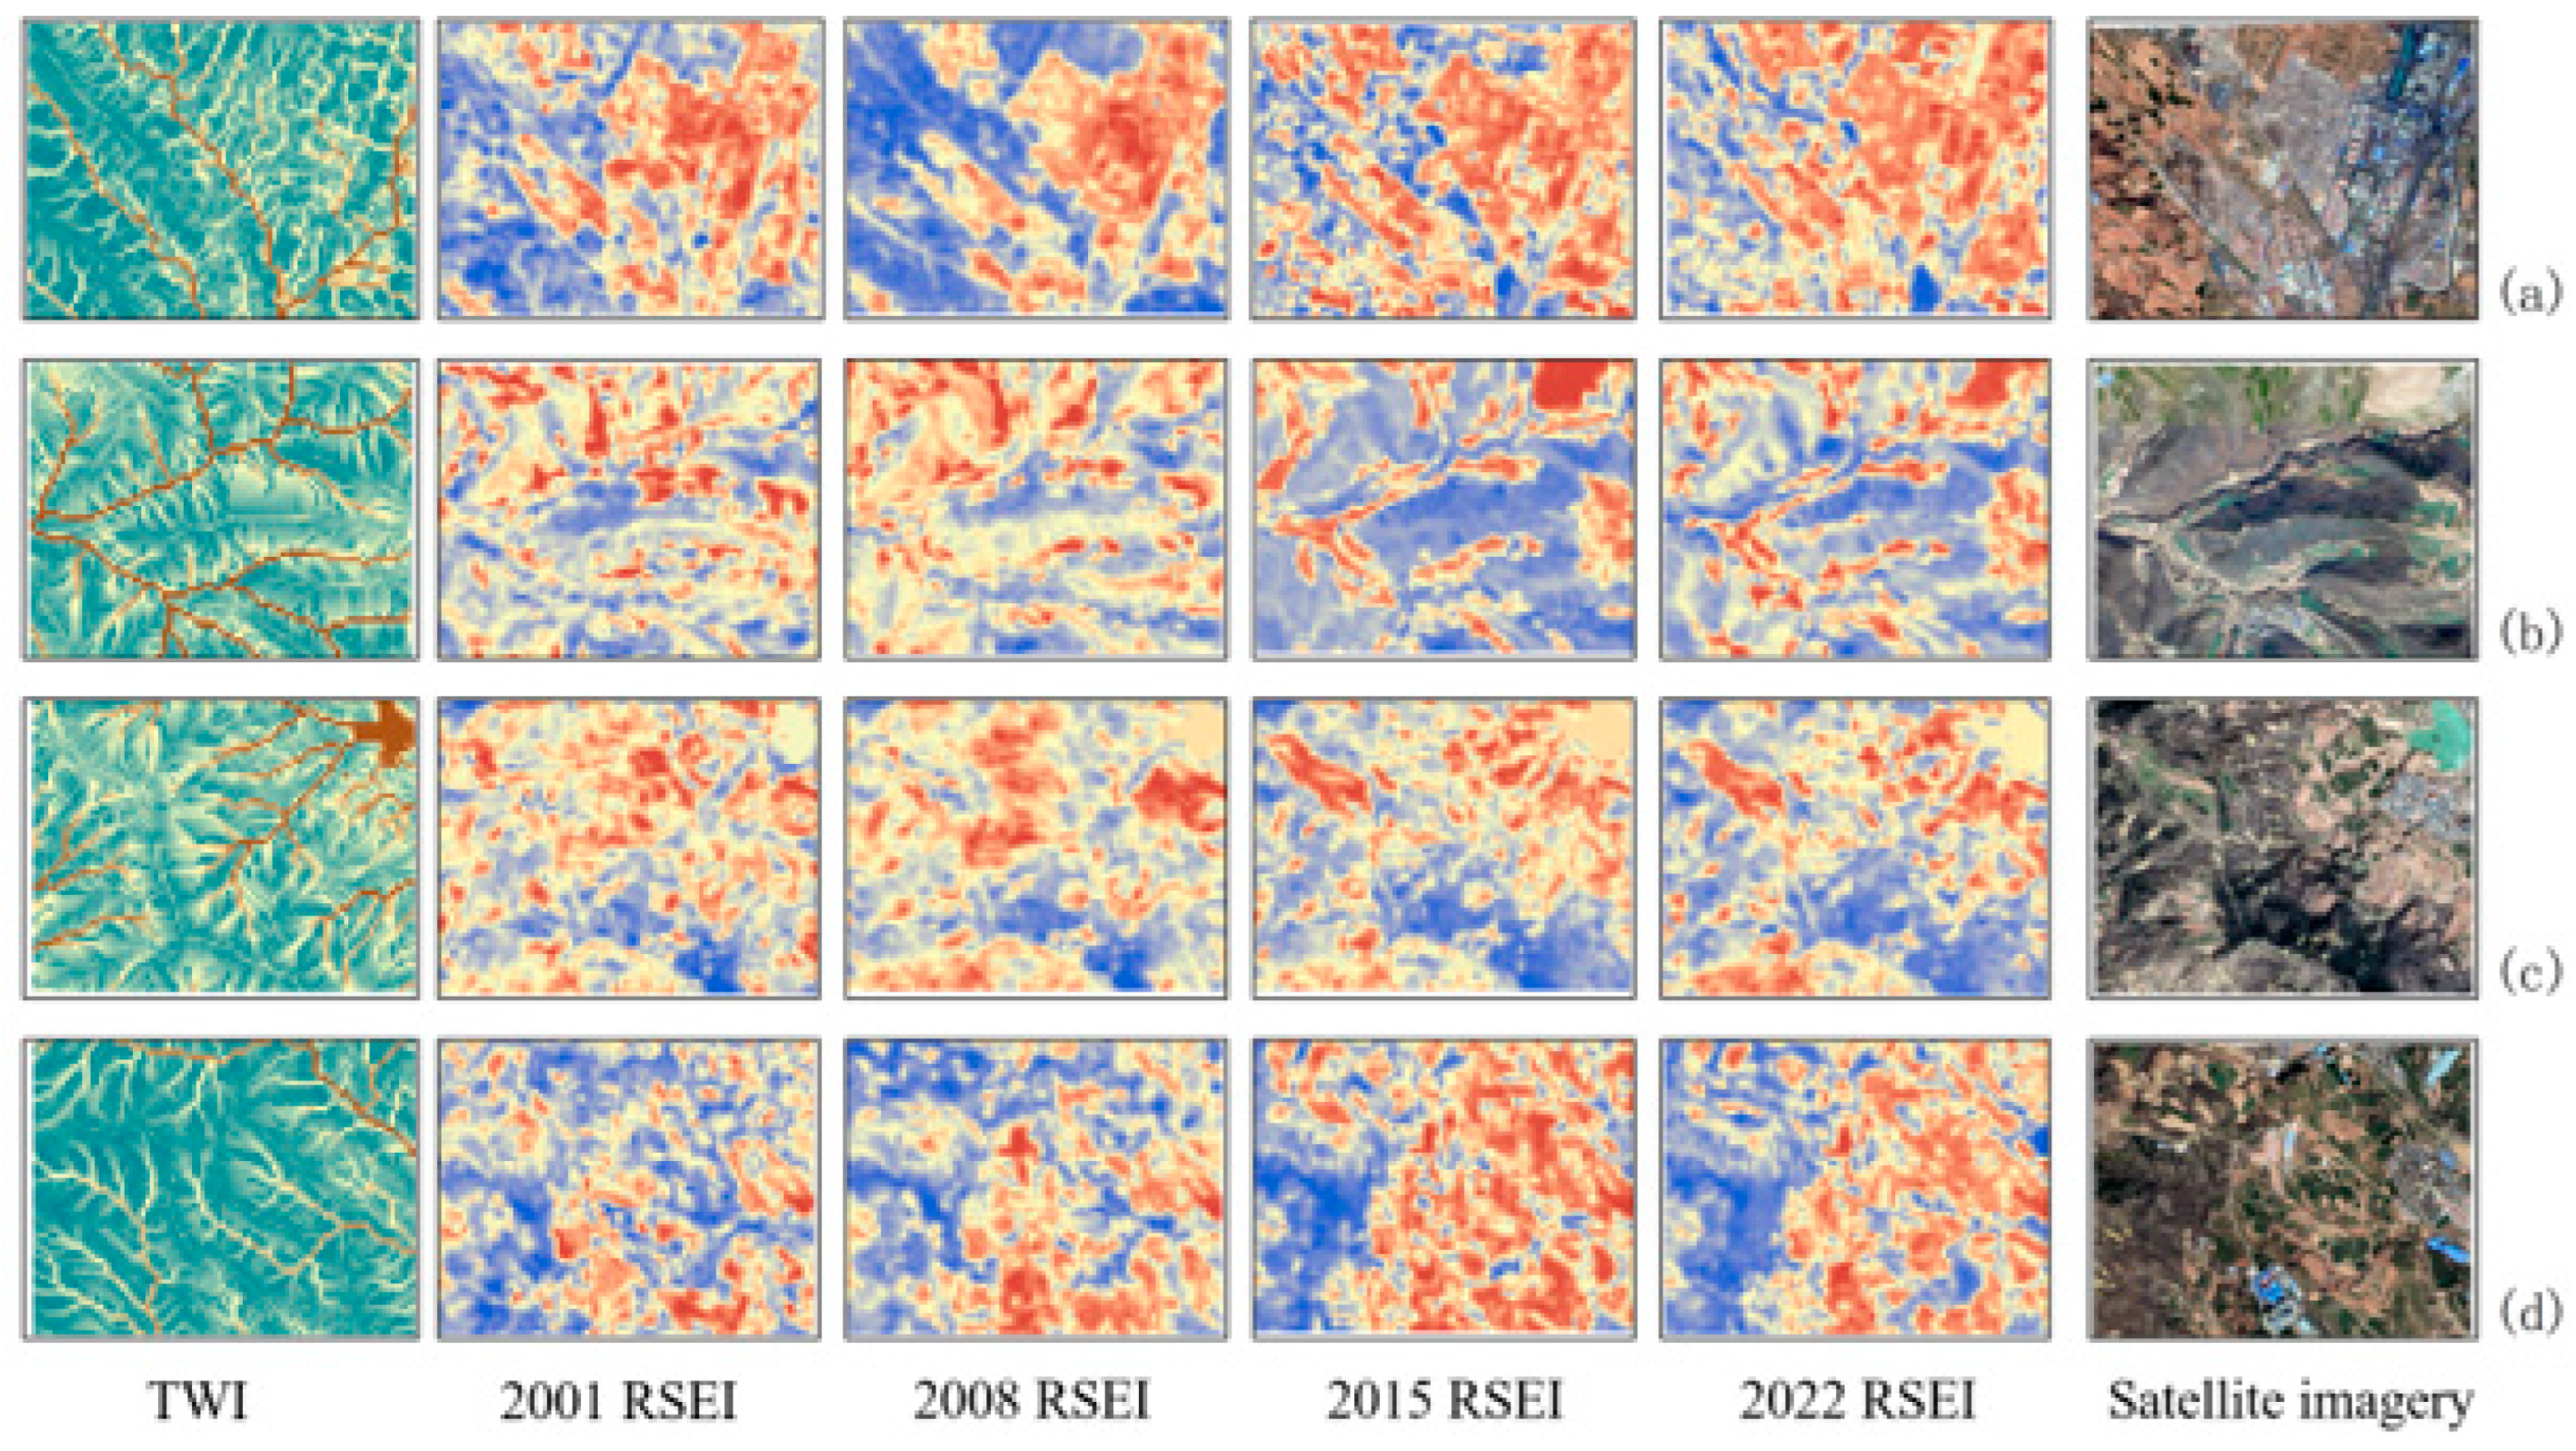
  • Combining satellite images with on-site inspection photos, it was found that higher TWI values correspond to lower RSEI values and poorer ecological quality. Meanwhile, some areas with no obvious high TWI values are associated with coal mining, also corresponding to lower RSEI values.
Overall, this study provides a comprehensive insight into the spatiotemporal changes in the ecological quality of the Changhe Basin in coal-bearing hilly areas of Northern China based on RSEI. Local governments must recognize the impact of mining activities and unique topographical factors on ecological quality. They should implement appropriate conservation and remediation measures to achieve sustainable ecological development in the coal-bearing hilly areas of Northern China.

Author Contributions

Methodology, J.L.; software, J.L.; formal analysis, J.L.; data curation, J.L.; writing—original draft preparation, J.L.; writing—review and editing, Y.T. and J.L.; visualization, J.L.; supervision, Y.T.; funding acquisition, Y.T. All authors have read and agreed to the published version of the manuscript.

Funding

This research was funded by the National Natural Science Foundation of China (Grant No. 41877532) and National Natural Science Foundation of China (Grant No. 42277474).

Data Availability Statement

The data are available from the corresponding author upon reasonable request.

Acknowledgments

We thank the anonymous reviewers for their constructive comments on the earlier version of the manuscript.

Conflicts of Interest

The authors declare no conflict of interest.

References

  1. Chai, Y.N.; Wei, D.J.; Hou, W.; Feng, Z.X.; Zhai, L. Multi-scale eco-environmental quality evaluation method from a spatial perspective. Chin. J. Ecol. 2018, 37, 9. [Google Scholar] [CrossRef]
  2. Zhang, J.S.; Chen, N.; Fu, G.; Yan, M.W.; Kim, Y.-C. The Safety Attitudes of Senior Managers in the Chinese Coal Industry. Int. J. Environ. Res. Public Health 2016, 13, 1147. [Google Scholar] [CrossRef] [PubMed]
  3. Kong, B.; Wang, E.Y.; Li, Z.H.; Niu, Y. Time-varying characteristics of electromagnetic radiation during the coal-heating process. Int. J. Heat 2017, 108, 434–442. [Google Scholar] [CrossRef]
  4. Liu, H.B.; Liu, Z.L. Recycling utilization patterns of coal mining waste in China. Resour. Conserv. Recycl. 2010, 54, 1331–1340. [Google Scholar] [CrossRef]
  5. Lin, C.W.; Luo, C.Y.; Pang, L.Y.; Huang, J.J.; Fu, D.W.; Tu, S.H.; Pu, B. Effects of different cultivation and mulching methods on soil erosion and nutrient losses from a purple soil of sloping land. Acta Ecol. Sin. 2010, 30, 6091–6101. [Google Scholar] [CrossRef]
  6. Zhang, X.Y.; Liu, Y.; Long, L.L.; Su, Y.D.; Chen, D.X.; Chen, X.Y. Review on analysis of soil moisture changes caused by coal mining subsidence in arid and semi-arid areas and their potential effects on plant physiology and ecology. J. Zhejiang Univ. Agric. Life Sci. 2022, 48, 415–425. [Google Scholar] [CrossRef]
  7. Vorovencii, I. Changes detected in the extent of surface mining and reclamation using multitemporal Landsat imagery: A case study of Jiu Valley, Romania. Environ. Monit. Assess. 2021, 193, 30. [Google Scholar] [CrossRef]
  8. Wang, H.L.; He, L.P.; Yin, J.; Yu, Z.L.; Liu, S.M.; Yan, D.H. Effects of Effective Precipitation and Accumulated Temperature on the Terrestrial EVI (Enhanced Vegetation Index) in the Yellow River Basin, China. Atmosphere 2022, 13, 1555. [Google Scholar] [CrossRef]
  9. Prieto-Blanco, A.; Disney, M.; Lewis, P.; Gomez-Dans, J.; Ganguly, S. Satellite monitoring of disturbances in arctic ecosystems. In Proceedings of the IEEE International Geoscience and Remote Sensing Symposium, Cape Town, South Africa, 12–17 July 2009; pp. 585–588. [Google Scholar]
  10. Imhoff, M.L.; Zhang, P.; Wolfe, R.E.; Bounoua, L. Remote sensing of the urban heat island effect across biomes in the continental USA. Remote Sens. Environ. 2010, 114, 504–513. [Google Scholar] [CrossRef]
  11. Nichol, J. Remote sensing of urban heat islands by day and night. Photogramm. Eng. Remote Sens. 2005, 71, 613–621. [Google Scholar] [CrossRef]
  12. HJ/T192-2006; Industry Standards for Environmental Protection in the People’s Republic of China (Trial Im-Plementation). State Environmental Protection Administration: Beijing, China, 2006.
  13. Ye, Y.H.; Liang, Y.X.; Shen, Y.Q.; Xie, L.S. Some Issues Related to “Technical Criterion for Eco-environmental Status Evaluation (Trial Implementation)”. Trop. Geogr. 2009, 29, 404–406. [Google Scholar] [CrossRef]
  14. Dong, L.J.; Shu, W.W.; Li, X.B.; Zhang, J.M. Quantitative evaluation and case studies of cleaner mining with multiple indexes considering uncertainty factors for phosphorus mines. J. Clean. Prod. 2018, 183, 319–334. [Google Scholar] [CrossRef]
  15. Wang, G.; Qin, Y.; Xie, Y.W.; Shen, J.; Zhao, L.; Huang, B.; Zhao, W.Q. Coalbed methane system potential evaluation and favourable area prediction of Gujiao blocks, Xishan coalfield, based on multi-level fuzzy mathematical analysis. J. Pet. Sci. Eng. 2018, 160, 136–151. [Google Scholar] [CrossRef]
  16. Xiao, W.; Guo, J.W.; He, T.T.; Lei, K.G.; Deng, X.Y. Assessing the ecological impacts of opencast coal mining in Qinghai-Tibet Plateau-a case study in Muli coal field, China. Ecol. Indic. 2023, 153, 110454. [Google Scholar] [CrossRef]
  17. Adriaanse, A. Environmental Policy Performance Indicators; Ministerie van Volkshuisvesting, Ruimtelijke Ordening en Milieubeheer: The Hague, The Netherlands, 1993.
  18. Niemeijer, D.; de Groot, R.S. A conceptual framework for selecting environmental indicator sets. Ecol. Indic. 2008, 8, 14–25. [Google Scholar] [CrossRef]
  19. Xu, H.Q. A new index for delineating built-up land features in satellite imagery. Int. J. Remote Sens. 2008, 29, 4269–4276. [Google Scholar] [CrossRef]
  20. Zhang, K.; Lin, N.F.; Xu, D.L.; Yu, D.D.; Zou, C.X. Research Advance on Ecological Security in China: Assessment Models and Management Measures. J. Ecol. Rural Environ. 2018, 34, 7. [Google Scholar] [CrossRef]
  21. Xu, H.Q. A remote sensing index for assessment of regional ecological changes. China Environ. Sci. 2013, 33, 889–897. [Google Scholar] [CrossRef]
  22. Ning, L.; Wang, J.Y.; Fen, Q. The improvement of ecological environment index model RSEI. Arab. J. Geosci. 2020, 13, 403. [Google Scholar] [CrossRef]
  23. Firozjaei, M.K.; Kiavarz, M.; Homaee, M.; Arsanjani, J.J.; Alavipanah, S.K. A novel method to quantify urban surface ecological poorness zone: A case study of several European cities. Sci. Total Environ. 2021, 757, 143755. [Google Scholar] [CrossRef]
  24. Zhu, D.Y.; Chen, T.; Wang, Z.W.; Niu, R.Q. Detecting ecological spatial-temporal changes by Remote Sensing Ecological Index with local adaptability. J. Environ. Manag. 2021, 299, 113655. [Google Scholar] [CrossRef]
  25. Zhang, K.L.; Feng, R.R.; Zhang, Z.C.; Deng, C.; Zhang, H.J.; Liu, K. Exploring the Driving Factors of Remote Sensing Ecological Index Changes from the Perspective of Geospatial Differentiation: A Case Study of the Weihe River Basin, China. Int. J. Environ. Res. Public Health 2022, 19, 10930. [Google Scholar] [CrossRef] [PubMed]
  26. Liu, H.; Jiang, Y.; Misa, R.; Gao, J.H.; Xia, M.Y.; Preusse, A.; Sroka, A.; Jiang, Y. Ecological environment changes of mining areas around Nansi lake with remote sensing monitoring. Environ. Sci. Pollut. Res. 2021, 28, 44152–44164. [Google Scholar] [CrossRef] [PubMed]
  27. Zhu, D.Y.; Chen, T.; Zhen, N.; Niu, R.Q. Monitoring the effects of open-pit mining on the eco-environment using a moving window-based remote sensing ecological index. Environ. Sci. Pollut. Res. 2020, 27, 15716–15728. [Google Scholar] [CrossRef] [PubMed]
  28. Xu, H.Q.; Wang, Y.F.; Guan, H.D.; Shi, T.T.; Hu, X.S. Detecting Ecological Changes with a Remote Sensing Based Ecological Index (RSEI) Produced Time Series and Change Vector Analysis. Remote Sens. 2019, 11, 2345. [Google Scholar] [CrossRef]
  29. Qureshi, S.; Alavipanah, S.K.; Konyushkova, M.; Mijani, N.; Fathololomi, S.; Firozjaei, M.K.; Homaee, M.; Hamzeh, S.; Kakroodi, A.A. A Remotely Sensed Assessment of Surface Ecological Change over the Gomishan Wetland, Iran. Remote Sens. 2020, 12, 2989. [Google Scholar] [CrossRef]
  30. Wen, X.L.; Ming, Y.L.; Gao, Y.G.; Hu, X.Y. Dynamic Monitoring and Analysis of Ecological Quality of Pingtan Comprehensive Experimental Zone, a New Type of Sea Island City, Based on RSEI. Sustainability 2020, 12, 21. [Google Scholar] [CrossRef]
  31. Li, R.; Chen, G.Q.; Li, W.X.; Meng, R.; Wang, M.J.; Guo, Y.N. Spatiotemporal Analysis of Eco-environmental Benefits in Shenfu-Dongsheng Mining Area during 1995–2020 Based on RSEI. Bull. Soil Water Conserv. 2021, 41, 143–151. [Google Scholar] [CrossRef]
  32. Wu, Z.J.; Wang, M.M.; Chen, S.J.; Zou, D. Monitoring and evaluation of ecological environments spatio-temporal variation in mine based on RSEI a case of Yongding mine. Ecol. Sci. 2016, 35, 200–207. [Google Scholar] [CrossRef]
  33. Yang, W.L.; Zhou, Y.; Li, C.Z. Assessment of Ecological Environment Quality in Rare Earth Mining Areas Based on Improved RSEI. Sustainability 2023, 15, 2964. [Google Scholar] [CrossRef]
  34. Jia, H.W.; Yan, C.Z.; Xing, X.G. Evaluation of Eco-Environmental Quality in Qaidam Basin Based on the Ecological Index (MRSEI) and GEE. Remote Sens. 2021, 13, 4543. [Google Scholar] [CrossRef]
  35. Xu, H.Q.; Duan, W.F.; Deng, W.H.; Lin, M.J. RSEI or MRSEI? Comment on Jia et al. Evaluation of Eco-Environmental Quality in Qaidam Basin Based on the Ecological Index (MRSEI) and GEE. Remote Sens. 2022, 14, 5307. [Google Scholar] [CrossRef]
  36. Li, Z.J.; Liu, J.Y.; Wang, H.J. Study on the Characteristics of Soil and Water Loss on the Slopes in Northern Rocky Mountain Area. Res. Soil Water Conserv. 2024, 31, 1–9. [Google Scholar] [CrossRef]
  37. Qu, L.L.; Shi, X.Y.; Wang, B.Y. Ecological evolution and impact tracking assessment of the coal-buried villages in the hilly region based on improved SPA-Markov—Case study of Changhe watershed. Ecol. Environ. Sci. 2019, 28, 291–298. [Google Scholar] [CrossRef]
  38. Wang, X.C.; Liu, W.K.; Zhang, H.B.; Lu, F.L. Spatiotemporal Differentiation Characteristics of Land Ecological Quality and Its Obstacle Factors in the Typical Compound Area of Mine Agriculture Urban. Sustainability 2022, 14, 10427. [Google Scholar] [CrossRef]
  39. Roy, P.S.; Rikimaru, A.; Miyatake, S. Tropical forest cover density mapping. Trop. Ecol. 2002, 43, 39–47. [Google Scholar]
  40. Coutts, A.M.; Harris, R.J.; Thu, P.; Livesley, S.J.; Williams, N.S.G.; Tapper, N.J. Thermal infrared remote sensing of urban heat: Hotspots, vegetation, and an assessment of techniques for use in urban planning. Remote Sens. Environ. 2016, 186, 637–651. [Google Scholar] [CrossRef]
  41. Mishra, N.B.; Crews, K.A.; Neeti, N.; Meyer, T.; Young, K.R. MODIS derived vegetation greenness trends in African Savanna: Deconstructing and localizing the role of changing moisture availability, fire regime and anthropogenic impact. Remote Sens. Environ. 2015, 169, 192–204. [Google Scholar] [CrossRef]
  42. Baig, M.H.A.; Zhang, L.F.; Shuai, T.; Tong, Q.X. Derivation of a tasselled cap transformation based on Landsat 8 at-satellite reflectance. Remote Sens. Lett. 2014, 5, 423–431. [Google Scholar] [CrossRef]
  43. Firozjaei, M.K.; Fathololoumi, S.; Kiavarz, M.; Biswas, A.; Homaee, M.; Alavipanah, S.K. Land Surface Ecological Status Composition Index (LSESCI): A novel remote sensing-based technique for modeling land surface ecological status. Ecol. Indic. 2021, 123, 107375. [Google Scholar] [CrossRef]
  44. Landsat, N.J.A.o.h.l.g.n.g.i.c.p.s.h., 7AD. Science Data Users Handbook. NASA. Landsat 7 Science Data Users Handbook [EB/OL]. Available online: https://landsat.gsfc.nasa.gov/article/landsat-7-science-data-users-handbook/ (accessed on 5 September 2012).
  45. Yan, L.B.; He, R.X.; Kasanin-Grubin, M.; Luo, G.S.; Peng, H.; Qiu, J.X. The Dynamic Change of Vegetation Cover and Associated Driving Forces in Nanxiong Basin, China. Sustainability 2017, 9, 443. [Google Scholar] [CrossRef]
  46. Sun, D.L.; Kafatos, M. Note on the NDVI-LST relationship and the use of temperature-related drought indices over North America. Geophys. Res. Lett. 2007, 34, L24406. [Google Scholar] [CrossRef]
  47. Jing, Y.Q.; Zhang, F.; He, Y.F.; Kung, H.-t.; Johnson, V.C.; Arikena, M. Assessment of spatial and temporal variation of ecological environment quality in Ebinur Lake Wetland National Nature Reserve, Xinjiang, China. Ecol. Indic. 2020, 110, 105874. [Google Scholar] [CrossRef]
  48. Anselin, L.; Getis, A. Spatial statistical analysis and geographic information systems. Ann. Reg. Sci. 1992, 26, 19–33. [Google Scholar] [CrossRef]
  49. Anselin, L.; Rey, S.J. Modern Spatial Econometrics in Practice: A Guide to Geoda, Geodaspace and Pysal; GeoDa Press LLC: Tempe, AZ, USA, 2014. [Google Scholar]
  50. Rathore, C.S.; Wright, R. Monitoring environmental impacts of surface coal-mining. Int. J. Remote Sens. 1993, 14, 1021–1042. [Google Scholar] [CrossRef]
  51. Saedpanah, S.; Amanollahi, J. Environmental pollution and geo-ecological risk assessment of the Qhorveh mining area in western Iran. Environ. Pollut. 2019, 253, 811–820. [Google Scholar] [CrossRef] [PubMed]
  52. Xu, H.Q.; Wang, M.Y.; Shi, T.T.; Guan, H.D.; Fang, C.Y.; Lin, Z.L. Prediction of ecological effects of potential population and impervious surface increases using a remote sensing based ecological index (RSEI). Ecol. Indic. 2018, 93, 730–740. [Google Scholar] [CrossRef]
  53. Yue, H.; Liu, Y.; Li, Y.; Lu, Y. Eco-Environmental Quality Assessment in China’s 35 Major Cities Based On Remote Sensing Ecological Index. IEEE Access 2019, 7, 51295–51311. [Google Scholar] [CrossRef]
  54. Liu, L.; Zhang, W.P.; Bi, R.T.; Wang, G.F.; Liu, Y.J. Ecological Vulnerability Assessment of Loess Hilly Mining Area—A Case Study on Changhe River Basin in Jincheng City. J. Shanxi Agric. Sci. 2018, 46, 810–814+846. [Google Scholar] [CrossRef]
  55. Yang, J.; Bi, R.T.; Jing, Y.D.; Xu, Z.; Gao, Y. Impact of mining on ecosystem health in Loess Plateau—A case study on Changhe basin in Jincheng City. J. Shanxi Agric. Univ. 2017, 34, 268–275. [Google Scholar] [CrossRef]
  56. He, M.Z.; Zhang, L.T.; Wei, Y.Y.; Zheng, Z.H.; Wang, Q.Y. Landscape Pattern Vulnerability and Its Driving Forces in Different Geomorphological Divisions in the Middle Yellow River. Environ. Sci. 2024, 45, 3363–3374. [Google Scholar] [CrossRef]
  57. Song, H.M.; Xue, L. Dynamic monitoring and analysis of ecological environment in Weinan City, Northwest China based on RSEI model. J. Appl. Ecol. 2016, 27, 3913–3919. [Google Scholar] [CrossRef]
  58. Chen, Z.Y.; Chen, R.R.; Guo, Q.; Hu, Y.L. Spatiotemporal Change of Urban Ecologic Environment Quality Based on RSEI—Taking Meizhou City, China as an Example. Sustainability 2022, 14, 13424. [Google Scholar] [CrossRef]
  59. Song, M.J.; Luo, Y.Y.; Duan, L.M. Evaluation of Ecological Environment in the Xilin Gol Steppe Based on Modified Remote Sensing Ecological Index Mode. Arid. Zone Res. 2019, 36, 1521–1527. [Google Scholar] [CrossRef]
  60. Xu, H.Q.; Deng, W.H. Rationality Analysis of MRSEI and Its Difference with RSEI. Remote Sens. Technol. Appl. 2022, 37, 1–7. [Google Scholar] [CrossRef]
  61. Cui, R.H.; Han, J.Z.; Hu, Z.Q. Assessment of spatial temporal changes of ecological environment quality: A case study in Huaibei City, China. Land 2022, 11, 944. [Google Scholar] [CrossRef]
Figure 1. Workflow.
Figure 1. Workflow.
Land 13 01067 g001
Figure 2. Location of the study area.
Land 13 01067 g002
Figure 3. Overview map of Haitian Coal Mine and on-site investigation pictures. (a) Haitian Coal Mine overview map; (b) disturbance and reclamation scope of Haitian Coal Mine; and (c) field survey pictures in Haitian Coal Mine. In (c), the fourth image contains Chinese text indicating “Ground subsidence here, pedestrians please pay attention to safety”.
Land 13 01067 g003
Figure 4. Distribution of RSEI classes in the Changhe Basin from 2001 to 2022. (a) RSEI distribution map of 2001; (b) RSEI distribution map of 2008; (c) RSEI distribution map of 2015; and (d) RSEI distribution map of 2022.
Land 13 01067 g004
Figure 5. RSEI class transfer paths in the Changhe Basin from 2001 to 2022.
Land 13 01067 g005
Figure 6. Spatial variation in ecological quality of the Long River Basin from 2001 to 2022. (a) Spatial variation from 2001 to 2008; (b) spatial variation from 2008 to 2015; and (c) spatial variation from 2015 to 2022.
Land 13 01067 g006
Figure 7. Moran scatter plots of the RSEI in the Changhe Basin from 2001 to 2022.
Land 13 01067 g007
Figure 8. LISA cluster map of the RSEI in the Changhe Basin from 2001 to 2022.
Land 13 01067 g008
Figure 9. Distribution of mining areas and buffer zones in the Changhe Basin.
Land 13 01067 g009
Figure 10. Variation in RSEI in mining areas and buffer zones at different distances.
Land 13 01067 g010
Figure 11. Topographic distribution map of the Digital Elevation Model (DEM), slope, and aspect. (a) DEM map; (b) Slope map; and (c) Aspect map.
Land 13 01067 g011
Figure 12. TWI distribution map of the Changhe Basin. (a) Lower reaches of the Changhe River main stream; (b) southeastern mountainous region; (c) western mountainous region; and (d) southwestern mining area.
Land 13 01067 g012
Figure 13. Comparison of TWI distribution, RSEI distribution, and satellite imagery in the Long River Basin for the Years 2001, 2008, 2015, and 2022. (a) TWI distribution, 2001 RSEI distribution, 2008 RSEI distribution, 2015 RSEI distribution, 2022 RSEI distribution, and satellite imagery for region (a); (b) TWI distribution, 2001 RSEI distribution, 2008 RSEI distribution, 2015 RSEI distribution, 2022 RSEI distribution, and satellite imagery for region (b); (c) TWI distribution, 2001 RSEI distribution, 2008 RSEI distribution, 2015 RSEI distribution, 2022 RSEI distribution, and satellite imagery for region (c); (d) TWI distribution, 2001 RSEI distribution, 2008 RSEI distribution, 2015 RSEI distribution, 2022 RSEI distribution, and satellite imagery for region (d).
Land 13 01067 g013
Table 1. Data types, temporal and spatial resolutions, acquisition methods, and selected bands of different remote sensing images used for an ecological quality assessment of the Changhe Basin.
Selected DataSpatial ResolutionTemporal ResolutionData TypeSelected BandsAcquisition Method
Landsat 5 TM30 m16 dRasterBand 1 to 7United States Geological Survey (USGS)
https://earthexplorer.usgs.gov/ (accessed on 7 May 2024)
Landsat 5 TM30 m16 dRasterBand 1 to 7
Landsat 8 OLI30 m16 dRasterBands 2 to 7 and Band 10
Digital Elevation Model (DEM)30 m-Raster-the 1:10,000 topographic map of Jincheng City, China
Mining Area Boundary--Vector-the Mineral Resource Reserves Verification Report of Zezhou County, China
Table 2. Methodology for calculating indicators.
IndicatorCalculation Method
NDVI N D V I = ρ N I R ρ R e d / ρ N I R + ρ R e d
WET W E T T M = 0.0315 ρ B l u e + 0.2021 ρ G r e e n + 0.3102 ρ R e d + 0.1594 ρ N I R 0.6806 ρ S W I R 1 0.6109 ρ S W I R 2
W E T O L I = 0.1511 ρ B l u e + 0.1973 ρ G r e e n + 0.3283 ρ R e d + 0.3407 ρ N I R 0.7117 ρ S W I R 1 0.4559 ρ S W I R 2
NDSI S I = ρ S W I R 1   +   ρ R e d     ρ B l u e   +   ρ N I R ρ S W I R 1   +   ρ R e d   +   ρ B l u e   +   ρ N I R
I B I = 2 ρ S W I R 1 ρ S W I R 1   +   ρ N I R     ρ N I R ρ N I R   +   ρ R e d   +   ρ G r e e n ρ G r e e n   +   ρ S W I R 1 2 ρ S W I R 1 ρ S W I R 1   +   ρ N I R   +   ρ N I R ρ N I R   +   ρ R e d   +   ρ G r e e n ρ G r e e n   +   ρ S W I R 1
N D S I = S I   +   I B I 2
LST L S T = T b / 1 + λ T b ρ ε 237.15
T b = K 2 / ln K 1 L 6 + 1
L 6 = g a i n × D N + b i a s
ρ B l u e is the reflectivity of the blue wavelength; ρ G r e e n is the reflectivity of the green wavelength;
ρ R e d is the reflectivity of the red wavelength;
ρ N I R is the reflectivity of the near-infrared wavelength;
ρ S W I R 1 is the reflectivity of the short-wave infrared 1 wavelength;
ρ S W I R 2 is the reflectivity of the short-wave infrared 2 wavelength;
S I is the soil index; I B I is the building index;
λ is the central wavelength of the thermal infrared band; ρ = 1.438 × 10 2 m·K;
ε is the surface emissivity ratio; K 1 and K 2 are constant parameters [46];
L 6 is the thermal infrared band’s radiation value;
g a i n and b i a s are the band’s gain and bias; and D N is the gray value of the pixel [11].
Table 3. Principal component analysis results of indicators in 2001, 2008, 2015, and 2022, respectively.
Year PC1PC2PC3PC4
2001NDVI0.6995−0.3087−0.35570.5374
WET0.34120.83570.34130.2620
NDSI−0.5911−0.04480.08610.8007
LST−0.21170.4519−0.8658−0.0379
Feature value0.05500.01210.00720.0014
Feature contribution rate/%72.7288.6798.15100.00
2008NDVI0.59370.13060.59270.5283
WET0.31540.3198−0.77800.4393
NDSI−0.5977−0.34060.02730.7253
LST−0.43680.87450.20660.0429
Feature value0.04250.00860.00390.0007
Feature contribution rate/%76.2191.6698.76100.00
2015NDVI0.70560.59960.08400.3683
WET0.3773−0.76890.09410.5075
NDSI−0.56900.2144−0.16010.7776
LST−0.18990.05750.97900.0468
Feature value0.07440.00540.00330.0005
Feature contribution rate/%89.1095.5499.43100.00
2022NDVI0.5148−0.50700.41220.5549
WET0.47950.6812−0.34410.4332
NDSI−0.6746−0.0759−0.20130.7061
LST−0.22350.52260.81920.0763
Feature value0.05630.00410.00370.0005
Feature contribution rate/%87.2793.5499.25100.00
Table 4. Statistics on the area and proportion of RSEI in the Changhe Basin from 2001 to 2022.
Year Poor
[0, 0.2)
Relatively Poor
[0.2, 0.4)
Moderate
[0.4, 0.6)
Good
[0.6, 0.8)
Excellent
[0.8–1.0]
Mean
Value
2001Area/km20.9415.3742.5848.745.770.576
Proportion/%0.8213.5637.5542.985.08
2008Area/km20.3314.2039.4154.484.970.589
Proportion/%0.2912.5334.7548.054.38
2015Area/km20.5732.6939.2235.335.590.521
Proportion/%0.5028.8334.5931.164.93
2022Area/km20.1117.9638.0643.0414.220.595
Proportion/%0.1015.8433.5637.9612.54
Table 5. Results of RSEI difference change detection in the Changhe Basin from 2001 to 2022 (km2).
Evaluated Period−4−3−2−10+1+2+3+4
2001–20080.0050.2103.30319.50761.37424.9993.7130.2790.005
2008–20150.0131.21210.47129.98454.95815.8380.8560.0620.001
2015–20220.0090.0771.1498.11462.22133.7766.6931.3590.005
Table 6. Results of ecological change types in the Changhe Basin from 2001 to 2022 (%).
Evaluated PeriodEcological DegradationEcological DeteriorationUnchangedEcological ImprovementEcological Optimization
2001–20080.1920.1254.1225.320.25
2008–20151.0835.6848.4714.720.06
2015–20220.088.1754.8735.691.20
Disclaimer/Publisher’s Note: The statements, opinions and data contained in all publications are solely those of the individual author(s) and contributor(s) and not of MDPI and/or the editor(s). MDPI and/or the editor(s) disclaim responsibility for any injury to people or property resulting from any ideas, methods, instructions or products referred to in the content.

