Article

Spatiotemporal Changes and Simulation Prediction of Ecological Security Pattern on the Qinghai–Tibet Plateau Based on Deep Learning

1
College of Life and Environmental Sciences, Minzu University of China, Beijing 100081, China
2
School of Ethnology and Sociology, Minzu University of China, Beijing 100081, China
*
Author to whom correspondence should be addressed.
Land 2024, 13(7), 1073; https://doi.org/10.3390/land13071073
Submission received: 26 June 2024 / Revised: 12 July 2024 / Accepted: 15 July 2024 / Published: 17 July 2024
(This article belongs to the Special Issue Land Resource Assessment)

Abstract

:
Over the past two decades, due to the combined effects of natural and human factors, the ecological environment and resources of the Qinghai–Tibet Plateau (QTP) have faced serious threats, profoundly impacting its ecosystem and the lives of its residents. Therefore, the establishment of the ecological security pattern (ESP) is crucial to cope with climate change, maintain ecosystem function, and sustainable development. Based on the Pressure–State–Response (PSR) model, this study constructed an evaluation index system for the ecological security (ES) of the QTP, evaluated the ES of the QTP during 2000–2020, and predicted the ES of the QTP during 2025–2035 based on the deep learning model. Combined with the residents’ perception of ES, the ES of the QTP was evaluated comprehensively. The results showed that: (1) From 2000 to 2020, the ES value of the QTP continued to rise, the number of dangerous and sensitive counties decreased, and the number of other counties increased. The overall spatial distribution features higher values in the southeast and lower values in the northwest and central regions. (2) From 2000 to 2020, both hot spots and cold spots on the QTP decreased, with the hot spots mainly concentrated in the southeast of the QTP, represented by Yunnan Province, and the cold spots shifting from west to east, mainly concentrated in the central QTP, represented by Qinghai Province. (3) The Long Short-Term Memory (LSTM) model demonstrates high prediction accuracy. Based on the prediction of LSTM, the ES value of the QTP will continue to rise from 2025 to 2035, and the number of safe counties will reach the highest level in history. The spatial distribution is still higher in the southeast and lower in the northwest and central regions. (4) By analyzing residents’ perception of 25 potential factors that may affect the ES of the QTP, the results show that residents generally believe that these factors have an important impact on ES, and their evaluation is between “important” and “very important”. In addition, there is a significant correlation between these factors and the predicted values of ES. The results of the study will help to improve our understanding of the overall ecological environment of the QTP, provide accurate positioning and reasonable help for the government to formulate relevant protection strategies, and lay a methodological and practical foundation for the sustainable development of the QTP.

1. Introduction

Ecological security (ES) is essential for human survival and the sustainable development of both social and economic environments. Harmonizing the contradiction between regional economic development and ecological protection is vital for promoting regional sustainable development [1]. Due to the rapid development of human society and the thirst for resources and environment, a series of ecological issues such as water resource shortage, ecological land reduction, and weak emergency protection systems have been caused. Consequently, ES has become a significant challenge for social survival and developmental activities. ES is defined as a state in which the structure, function, and ecological processes of ecosystems are not threatened, thereby providing adequate ecosystem services to support the sustainable development of the socio-economic system and human well-being. It ensures the maintenance of a harmonious relationship between humans and ecosystems, embodying resilience to environmental change and the capacity to withstand ecological damage [2]. Research on ES enables the assessment and identification of regional ecosystems’ integrity, ensuring their health and sustainability amidst various risks. This knowledge supports regional governance, urban planning, ecological restoration, and management efforts [3].
ES has become a focal point of regional sustainable development research. Currently, in the field of ES, some scholars focus on the varying significance and spatial variability of factors driving changes in ES [4]. Other scholars emphasize resource protection, combining ES with natural resource conservation and the human–land relationship to promote sustainable ecological environment development [5,6]. Additionally, there are studies focusing on areas significantly impacting ES, identifying ecological sources and corridors, and analyzing and constructing ecological security patterns (ESPs) [7,8]. ES evaluation is the core content of ES research, encompassing both quantitative and qualitative analyses of pollutant concentration and distribution characteristics, the evaluation of regional ecosystem changes, and the exploration of the application of the evaluation itself [9], such as the construction of index systems and evaluation methods [10]. In the exploration of evaluation methods, key processes involve the development of index systems and evaluation models such as the ecological footprint model [11], the PSR model [12], and the DPSIR model [13]. The PSR framework has been extensively utilized in the evaluation of ecosystem services, land resource security, watershed health, urban environmental capacity, and other environmental issues. The PSR framework is employed to assess the causal relationships between human activity-related factors and those impacting natural resources and the environment. It directly reveals existing pressures and issues threatening the ES of land in the region. Compared to single-factor evaluations, this method offers numerous advantages, providing systematic guidance for constructing comprehensive ES evaluation index systems [14]. Moreover, the PSR model stands out as the most extensively applied framework in ES research [15].
In the past, scholars’ research on ES primarily focused on retrospective evaluation and model construction, most of which assessed the current or past conditions of specific regions [6]. Through these evaluations, the health status of ecosystems and the threats and challenges they face could be understood, and potential risks and problems could be identified [16]. However, to better provide policymakers and the public with warnings about possible future ES challenges and risks, guide the formulation of reasonable protection and management measures, and promote sustainable ecosystem development, it is essential to predict future ES [17]. Some scholars have also begun to direct their attention towards advancing methodologies for simulating and predicting future trends in ES. Zhang et al. simulated the spatial distribution of land use landscape types in Henan Jiaozuo Coal Mine in 2019 using the CA–Markov model and then evaluated and analyzed the landscape ES for 2029 [18]. Wang et al. simulated the future trend of the economy–energy–environment system in North China by creating a multivariate discrete grey model [19]. These studies all use relatively simple calculation methods to simulate and predict future conditions, which are more suitable for simple time series changes and small sample data processing, and it is difficult to make a more accurate prediction. However, Machine Learning (ML), a subset of Artificial Intelligence (AI), has surfaced as a revolutionary tool. The rapid development of machine learning techniques has significantly influenced various scientific domains, including ecology. Machine learning has catalyzed a wealth of groundbreaking research that surpasses traditional practices, exploring innovative approaches to ecological challenges [20]; the accuracy of its predictions has also been demonstrated in environmental studies [21]. As a new data analysis and processing method, machine learning has been widely used in many fields owing to its high precision, flexible customization, and convenient extensibility [22]. Deep learning, a subset of machine learning, can determine outcomes from different permutations of raw data and is considered an advancement in machine learning. It utilizes programmable neural networks that empower machines to make decisions autonomously, without human intervention [23].
The Qinghai–Tibet Plateau (QTP) is a region with distinct natural and social cultural characteristics [24]. As the world’s highest plateau and one of the largest alpine grassland areas globally, the QTP is rich in natural resources and ecosystems. It serves as a critical ES barrier with vital functions such as soil and water conservation, wind and sand control, climate regulation, carbon sequestration, and biodiversity protection [25]. However, the ecological environment of the QTP is extremely fragile. With the acceleration of modernization, increased large-scale human exploitation, and changing traditional human concepts, the QTP’s ecological environment faces significant challenges. The QTP is a crucial ES barrier. In the past, many studies have explored the ecological vulnerability of and the value of ecosystem services to the QTP [26], and many studies have evaluated the security status of water [27], land [28], and climate [29] for the QTP. However, few studies have comprehensively considered the impact of various ecological factors in the region. At the county scale, the ES evaluation of the QTP still lacks a comprehensive spatial understanding of its overall ES. To address this gap, an ES evaluation index system for the QTP was constructed based on the county scale, allowing for a systematic evaluation of the ecological and environmental security status of the QTP.
This paper focuses on the QTP as the research area, constructing an index system for the ES evaluation of the QTP using the PSR model, and evaluates the ES of the QTP from 2000 to 2020. Considering various factors, a prediction model of ES based on deep learning is proposed. The prediction results were compared with the actual data to verify the validity of the model and accurately predict future ES changes on the QTP. This paper aims to systematically analyze and study the ES of the QTP, comprehensively addressing the influence of natural factors and human activities on the ecosystem. It incorporates residents’ perceptions of the QTP’s ES to thoroughly examine the current state and future evolution trends of its ES. The objective is to establish a robust scientific foundation and provide comprehensive decision-making support for the protection of the ecological environment and promotion of sustainable development across the QTP.

2. Materials and Methods

2.1. Study Area

The QTP, the highest plateau in the world and known as the “Third Pole” (Figure 1), boasts an average elevation of over 4000 m, with terrain that ascends in the west and descends in the east. This topography influences its climate, which transitions from warm and humid in the southeast to cold and dry in the northwest. As Asia’s “river source” and “ecological source”, the plateau is also recognized as the “regulator” of climate change in the Northern Hemisphere. It is the origin of the Yangtze, Yellow, and Lancang rivers. The QTP serves as a crucial ecological security barrier for China. Its environmental changes directly impact the construction of this barrier, highlighting its significant ecological status. However, the unique, original, and fragile nature of its environment and ecosystem renders it highly sensitive to external changes, with limited self-regulation and restoration capabilities. Consequently, the QTP has become an early warning zone for global environmental change, playing a pivotal role in China’s ecosystem and the global carbon cycle [30].

2.2. Data Sources

The data used in this study include land use, gross domestic product (GDP), population density, average annual precipitation, normalized difference vegetation index (NDVI), digital elevation model (DEM), soil, permafrost rate, and socio-economic data, as shown in detail in Table 1. The land use data from 2000 to 2020 were reclassified into 6 types: forestland, grassland, cultivated land, water-body, build-up land, and unused land according to the classification system (https://www.resdc.cn/ (accessed on 12 September 2023)) of China’s Multi-Period Remote Sensing Monitoring Data Set by ArcGIS10.8. And the overall accuracy is above 85% after field investigation. The slope tool of ArcGIS10.8 was used to extract the slope from DEM data. To ensure consistency, all spatial data in this study were converted into a consistent spatial reference frame (Asia_North_Albers_WGS84_LCR), and the spatial resolution was uniformly resampled to 1 km. The collected data were classified and summarized, and Stata17.0 was used to calculate the weight of the ES evaluation indicators of the QTP. Based on the Pytorch framework, a deep learning algorithm was used to predict the ES value of QTP.

2.3. ES Evaluation Model

2.3.1. PSR Framework Construction

This research primarily utilized the pressure–state–response (PSR) model, incorporating existing ecological environment evaluations and ES assessment methods. By integrating both natural and human activity factors, it provided a quantitative analysis of the ES of the QTP [31]. The comprehensive framework of this study is depicted in Figure 2, outlining the methodological approach and analytical processes undertaken.
The PSR model, developed by the Organization for Economic Cooperation and Development (OECD), provides a comprehensive framework for evaluating environmental issues [17]. The PSR model comprises three layers: target, criterion, and index layers. The target layer is the ES index representing the overall ES status. The criterion layer is subdivided into three dimensions: pressure, state, and response. Pressure layer (P): key indicators that quantify the external disturbances impacting the ES of the study area; state layer (S): key indicators reflecting the current ecological conditions of the study area; response layer (R): key indicators depicting human activities and natural restoration efforts in response to ecosystem changes in the study area [32]. The PSR model provides an effective framework for elucidating the causal relationships between human activities and changes in the ecological environment. It comprehensively illustrates how various factors influence the degradation, feedback mechanisms, and conservation efforts of the ecological environment in the study area. The indicators chosen should be scientifically reasonable, widely accepted, and capable of reflecting the actual situation. Therefore, considering the local characteristics of the QTP and referring to the previous literature, we selected 10 indicators to construct the PSR framework (Table 2).
The pressure layer is used to describe the external pressures, impacts, and threats exerted on the ecosystem. Permafrost is a primary influencing factor of surface processes and a highly sensitive indicator of climate change. Therefore, we chose the permafrost rate to reflect external pressures on the ecosystem from climate change and human activities [33]. The primary industry is generally considered the foundation of the national economy, so we selected the proportion of the primary industry to reflect the pressure on the ecosystem from natural resource development and utilization [34]. The population was selected to exemplify the ecosystem’s pressure resulting from high demand for products such as food, water, and fiber [35].
The state layer pertains to the current environmental and resource conditions, as well as the ecosystem’s resilience to changes induced by external pressures [35]. Slope is a critical indicator of surface topography, influencing the land’s suitability for cultivation and crop production, thus chosen to characterize the current terrain conditions [36]. Annual precipitation is chosen to represent the climate status. The selection of animal husbandry output represents the activity of animal husbandry, reflecting land resource utilization and its impact on biodiversity. Soil erosion represents a dynamic process and stands as a significant driver of land degradation [37]. Therefore, we employ a soil erosion model to evaluate the magnitude of soil erosion. The procedural step for calculating soil erosion is as follows [38]:
A = R × K × L S × C × P
where A represents the soil erosion modulus (t hm−2·a−1); K denotes the soil erodibility factor (t hm2·h·MJ−1·mm−1·hm−2); R signifies the rainfall erosivity factor (MJ·mm·hm−2·h−1·a−1); C represents the vegetation cover and management factor; P denotes the soil and water conservation measure factor; and L and S denote the slope length and slope factors.
The response layer is typically used to describe society’s response to environmental issues and the measures taken to address them [35]. GDP, as an indicator of overall economic development for a country or region, reflects the government’s investment in environmental protection [39]. The tertiary industry serves as an indicator of the social health of the industrial structure, with lower resource demands and less environmental pressure compared to other industries, thus reflecting improvements in the quality of regional economic development [36]. The evaluation of Ecosystem Service Value (ESV) can reflect the degree of rational land use, thereby indicating the protective and remedial measures taken by the government and society in response to changes in the ecological environment. Therefore, we calculated the E S V of the QTP using the following formula [40,41]:
E = 1 7 × P g r a i n × Q g r a i n
E S V s , k , t N a i v e = a k , t × V C s , k
where E denotes the per-unit value of ecosystem services in the QTP; P g r a i n represents the average grain price; Q g r a i n is the average grain output; a k , t is the area of land use type k at time t ; and V C s , k signifies the per-unit value (US$/hm2) for land use type k with ecosystem service function types s .

2.3.2. ES Comprehensive Index Calculation

(1)
Standardization of indicator values
Certain indicators within the system positively contribute to ES, while others pose risks to it. Therefore, following the acquisition of original data, positive and negative trend indicators were calculated accordingly [12,42,43]:
Standardization of positive indicators:
X i j = X i j X j m i n / X j m a x X j m i n
Standardization of negative indicators:
X i j = X j m a x X i j / ( X j m a x X j m i n )
where X i j represents the original value of index j in year i , X j m i n denotes the minimum value of index j across all years, and X j m a x refers to the maximum value of index j across all years, and X i j is the standardized value of X i j .
(2)
Entropy weight method
In this study, stata17.0 is used to calculate the weights of the ES evaluation indicators which were determined using the entropy weight method. This method objectively calculates and adjusts the entropy weights of indicators based on data dispersion. The detailed calculation process of entropy weight method in this study is described in Supplementary Materials, and the specific calculation principle is as follows [44]:
Z = i = 1 k X i j × W j
W j = 1 E j j 1 E j ( j   =   0 ,   1 ,   2 ,   3 ,   ,   n )
E j = 1 ln n × i = 1 n P i j ln P i j
P i j = Y i j i = 1 n Y i j
where Z is the final comprehensive score; W j is the weight of the index; E j indicates the information entropy of the index; n denotes the total number of selected indicators; P i j represents the proportion of index j in year i ; and X i j is the standardized value of the indicator.
(3)
Comprehensive index calculation
The formula for calculating the comprehensive evaluation value of ES is as follows [44]:
f ( x ) = i = 1 n X i j × W j
where f ( x ) is the ES index; X i j is the normalized value of the index; and W j is the weight of the indicator.

2.4. Cold Hot Spot Analysis

In this study, to capture the spatial variation characteristics of ES, we employed the Getis–Ord G i * index to analyze the degree of spatial aggregation of ES changes, specifically focusing on the spatial distribution of cold spots or hot spots. The Getis–Ord G i * index is calculated using the formula below [45]:
G i * = j 1 n   w i j x j X ¯ j 1 n   w i j s n j = 1 n   w i j 2 j = 1 n   w i j 2 / ( n 1 )
X ¯ = 1 n j = 1 n   x j
S = 1 n j = 1 n   x j 2 X 2
where, G i * represents the resulting statistical Z-score; x j denotes the change in ES for the spatial unit j ; and w i j signifies the spatial weight between adjacent spatial units i and j .

2.5. ES Prediction

This study selects the four most representative classical methods from a large number of prediction models, namely, traditional statistical methods—linear Regression (LR); machine learning (ML)—random forest (RF); deep learning (DL)—convolutional neural networks (CNN); and deep learning (DL)—long short-term memory (LSTM). The reasons for choosing these four models are: linear regression (LR) is a statistical method used to predict and explain the linear relationship between independent and dependent variables, and it has a wide range of applications in ecology to study various ecological and environmental problems in ecosystems [46]. The RF model can deal with complex nonlinear relationships, and is suitable for various data types and problems, and has strong robustness. RF is very robust and can accurately predict variables, which is especially suitable for working with small data. In an ecological context, RF can deal with complex interactions between different ecological factors. The versatility of this method enables its application across a spectrum of research inquiries in landscape ecology, ranging from modeling species distributions to elucidating the repercussions of land use alterations on ecological processes. LSTM, a specialized type of recurrent neural network (RNN), serves as a time series forecasting tool that effectively addresses certain limitations inherent in traditional RNNs. LSTM is able to predict the relevant data for the next time period from the existing data for a period of time, and the key advantage of LSTM is that it can avoid the gradient disappearance problem that traditional RNNs encounter in long sequences. In ecosystem monitoring, LSTM can be used to analyze environmental data that change over time, such as climate change data, species migration patterns, and seasonal ecological changes. This capability makes LSTM a powerful tool for predicting future changes in ecosystems and identifying long-term trends. The forecast framework for LSTM in this study is detailed in the Supplementary Materials. A convolutional neural network (CNN) has significant advantages in the field of image processing. Through convolutional operation, parameters can be shared and model complexity can be reduced. In this study, these four representative statistical models are used to analyze and predict the ES situation of the QTP from 2025 to 2035 based on time series data.

2.6. Design of Human Perception Questionnaire for ES on QTP

The questionnaire used in this study was designed based on a five-point Likert scale to quantify the awareness of ES of residents of the QTP [47]. The questionnaire mainly consists of closed questions, supplemented by some open questions. A total of 267 questionnaires were sent out in this survey, and 208 valid questionnaires were recovered after invalid sample data were excluded. The survey objects are mainly residents of the QTP. The questionnaire includes the basic information of the respondents in four aspects: gender, age, education level, and occupation. At the same time, based on expert consultation, we set 5 potential variables of social governance, government regulation, socio-economic development, ecological protection, and traditional cultural influence for the questionnaire as the driving factors of ES on the QTP, and set the corresponding 25 observational variables, using the five-point Likert method (1, not at all important; 2, slightly important; 3, important; 4, fairly important; 5, very important). Each observed variable was measured, and the scale design is shown in Table 3. SPSS 26.0 software was used for descriptive statistical analysis, and AMOS 23.0 software was used for confirmatory factor analysis.

2.7. Grey Correlation Analysis

Grey correlation analysis is one of the methods of grey system theory, which can measure the relative strength of an indicator affected by other factors in a system with some clear information and some unclear information, carry out a similarity analysis of a comparison sequence and reference sequence, and determine the correlation between factors or indicators [48]. In this paper, since the data of residents’ perception of ES often have grey characteristics such as uncertainty and complexity, grey correlation analysis is mainly used to effectively reflect the sensitivity relationship between residents’ perception of 25 potential variables affecting future ES and future ES. The calculation process is as follows [49]:
S q = ( s q ( 1 ) , s q ( 2 ) , s q ( 3 ) , , s q ( n ) ) . q = 1 , 2 , 3 , , a
S g = ( s g ( 1 ) , s g ( 2 ) , s g ( 3 ) , , s g ( n ) ) . g = 1 , 2 , 3 , , b
ζ g q ( t ) = m i n m i n | s g ( t ) s q ( t ) | + ρ m a x m a x | s g ( t ) s q ( t ) | | s g ( t ) s q ( t ) | + ρ m a x m a x | s g ( t ) s q ( t ) |
where the 2025–2035 ES value of QTP is taken as the reference sequence S g , residents’ perception of 25 potential variables is taken as the comparison sequence s q . ζ g q ( t ) which is the degree of correlation between the two sequences, and ρ is defined as 0.5 based on previous studies [50].

3. Results

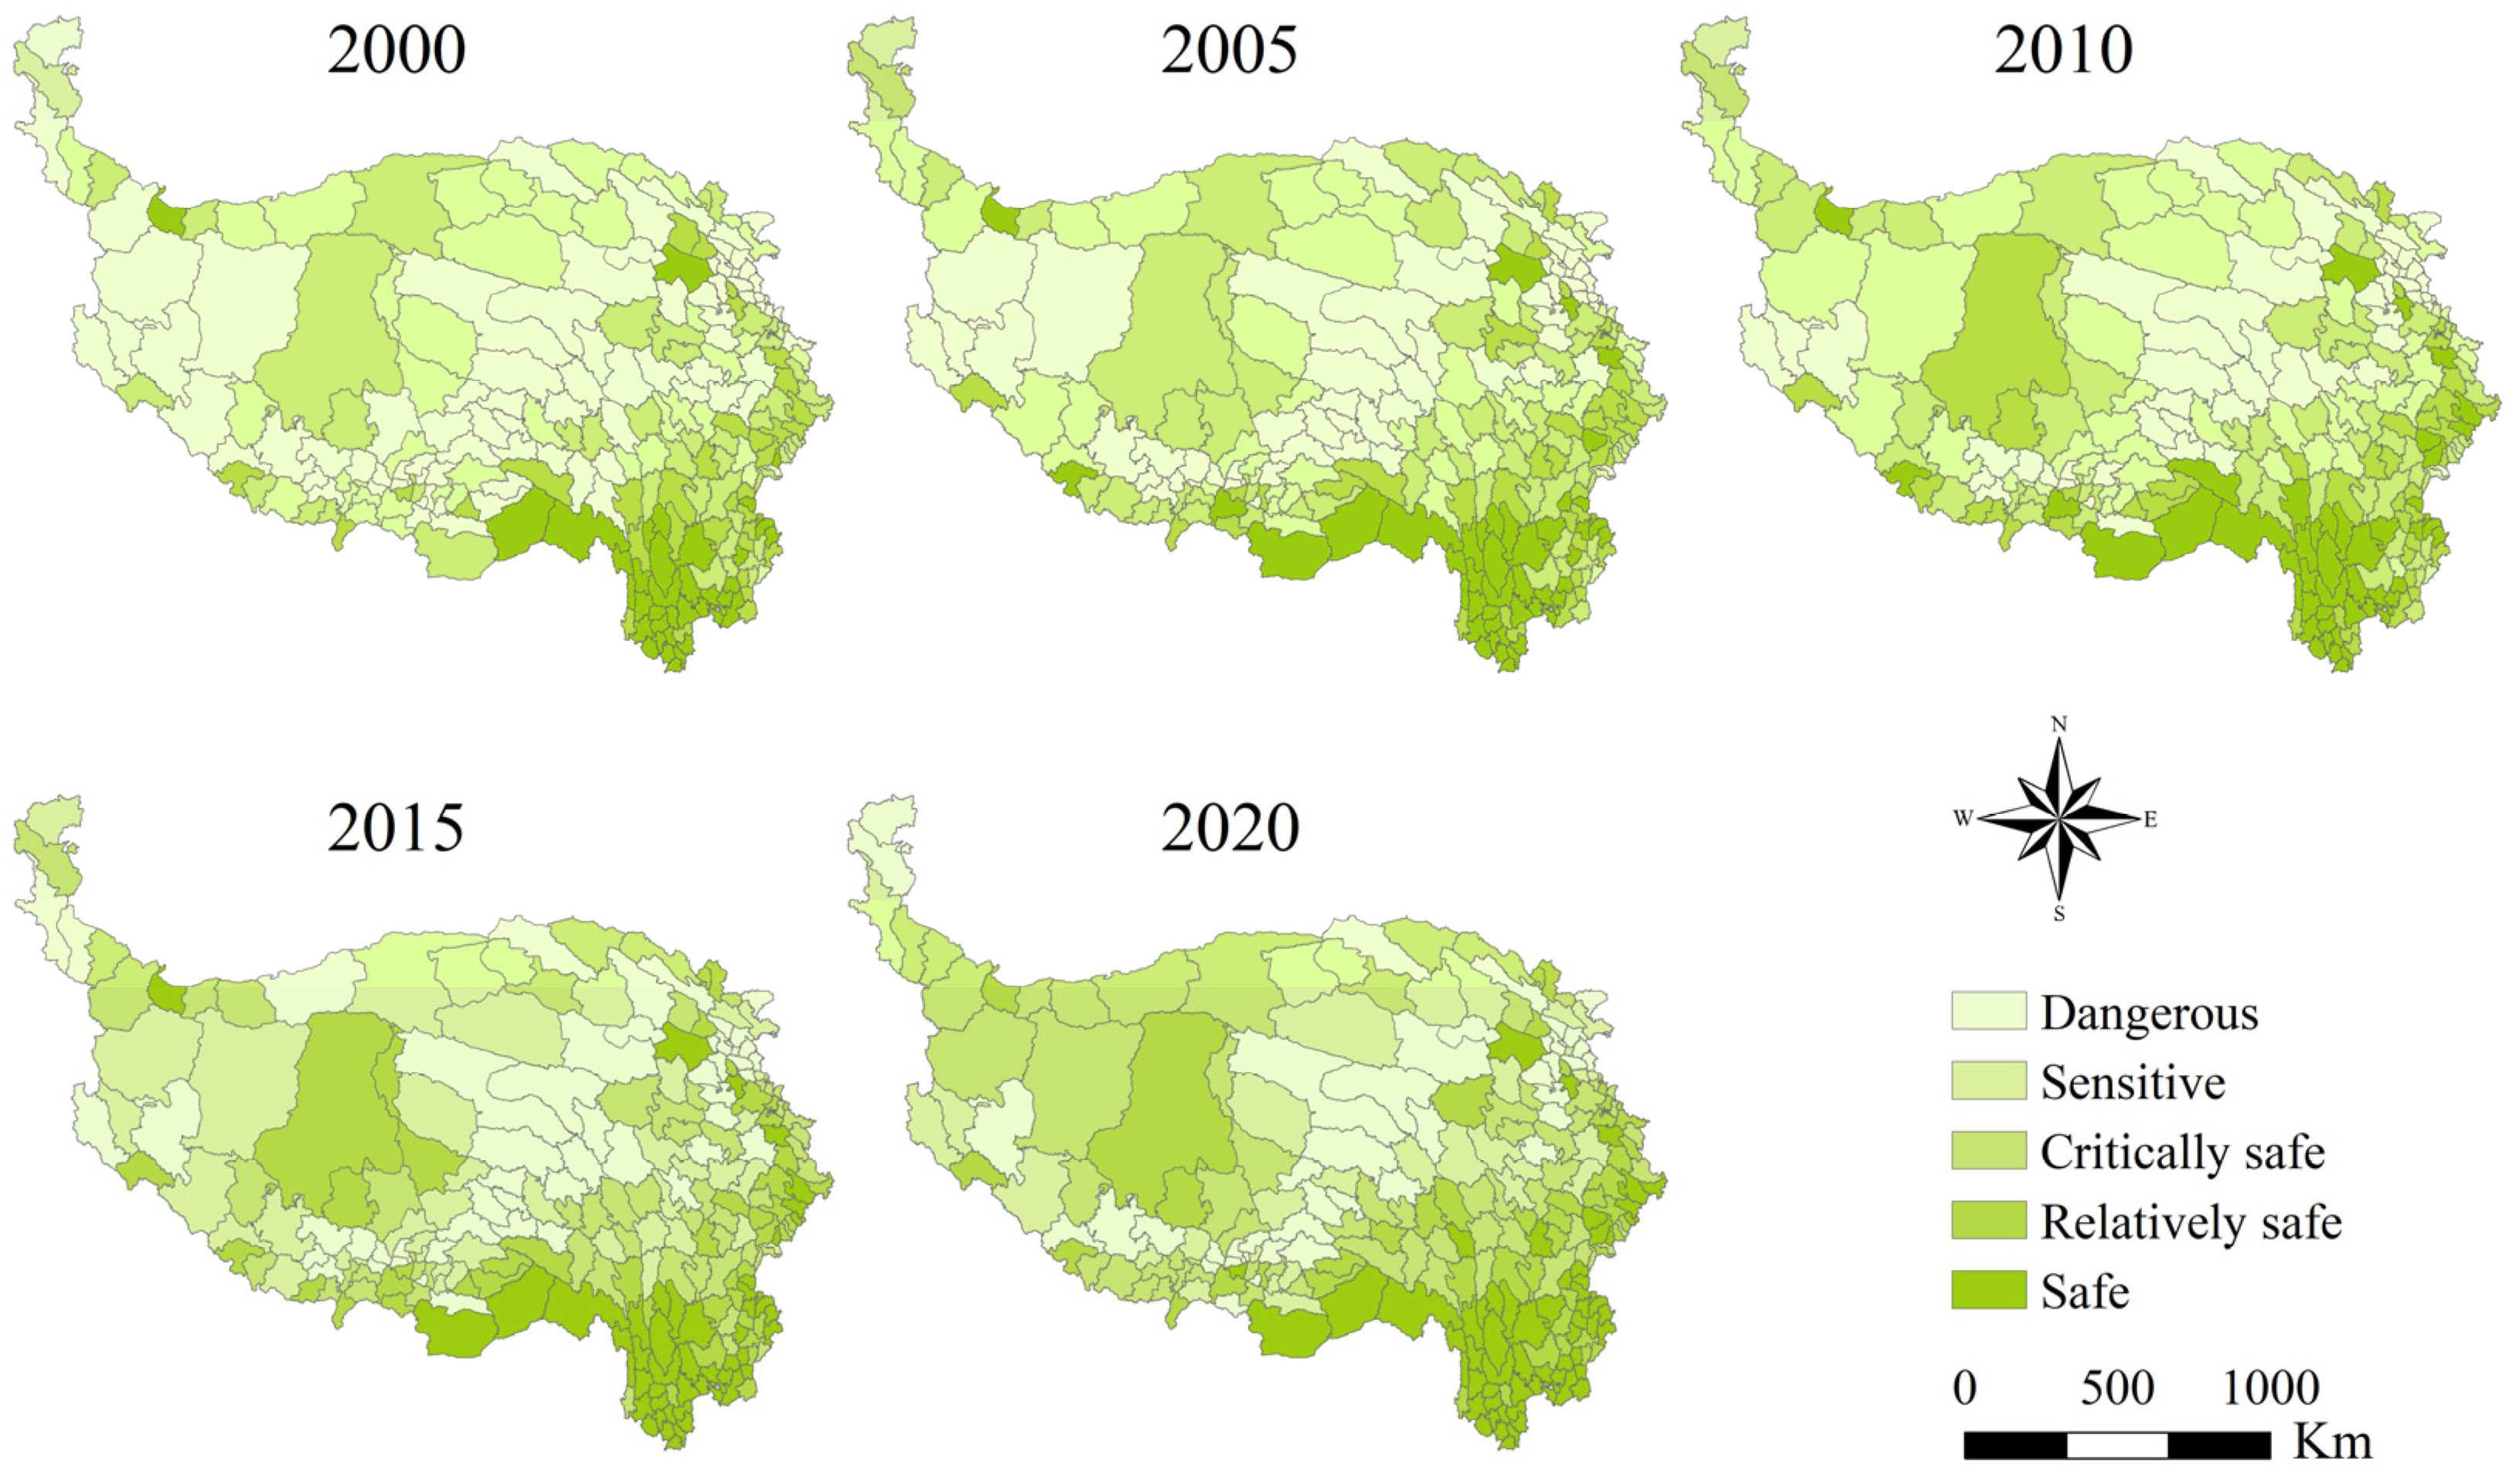
3.1. Temporal and Spatial Changes in ES on the QTP

Based on the natural breakpoint method classification standard, the ES of counties on the QTP is categorized into five levels: the dangerous level, sensitive level, critically safe level, relatively safe level, and safe level, as shown in Figure 3. From the perspective of time, the average values of ES on the QTP during 2000–2020 are 0.038, 0.047, 0.050, 0.052, and 0.062, respectively, showing an upward trend. Overall, from 2000 to 2020, the number of dangerous, sensitive, and critically safe counties has fluctuated, but in general, the number of dangerous and sensitive counties has decreased, the number of critically safe counties has increased, and the number of relatively safe and safe counties has continued to increase, indicating that the overall ES situation on the QTP has improved.
From the perspective of space, the ES status of the QTP is higher in the southeast, and lower in the northwest and central regions. Over time, the counties in the northern region of the QTP have changed from sensitive to relatively safe. In the eastern and southern regions, the ES value of the counties is higher, which ranges from the critically safe to safe. The ES values of the counties in the western region are low, and they range from dangerous to relatively safe. Some counties in the central region remain dangerous.

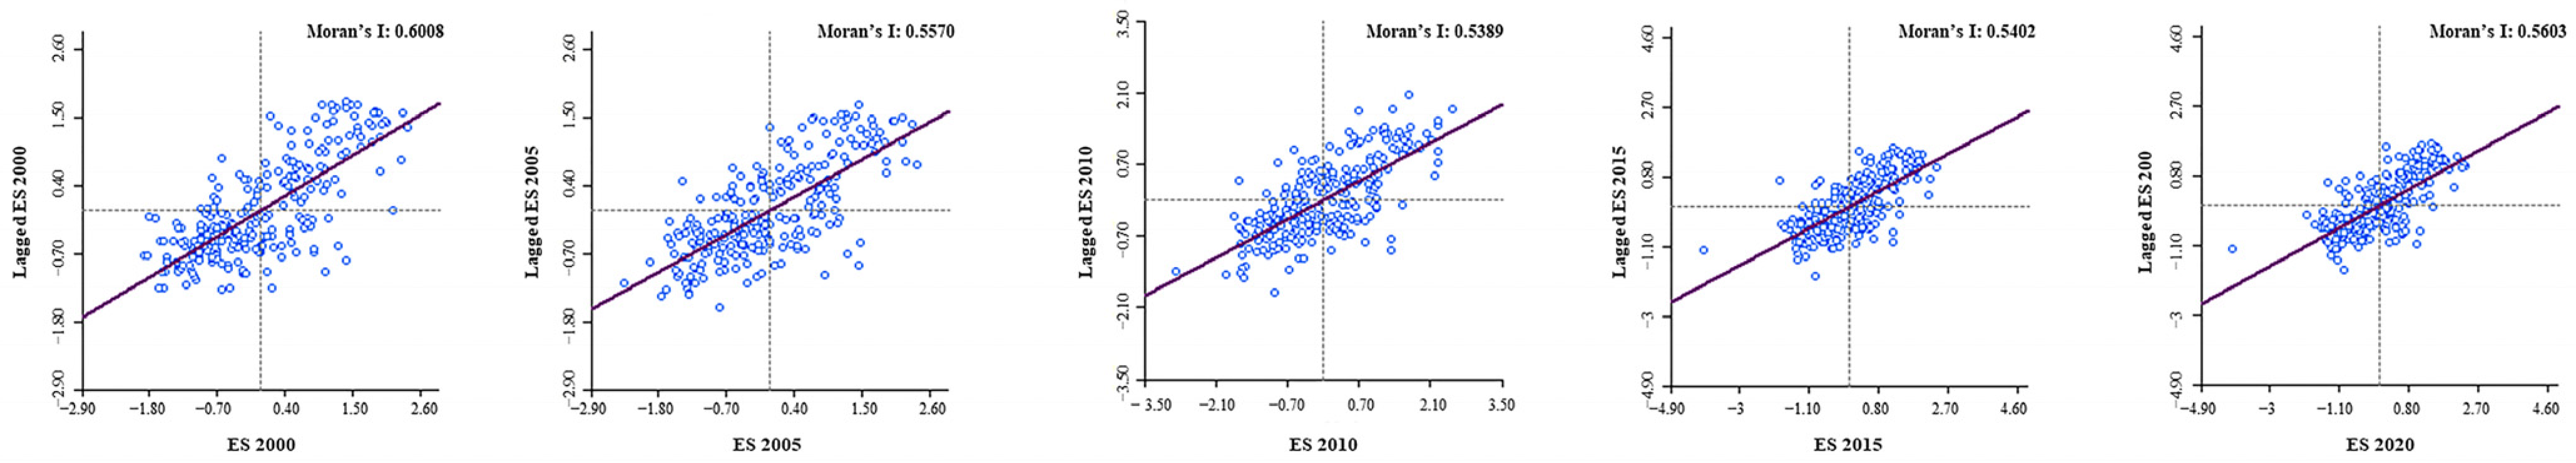
3.2. Spatial Heterogeneity of ES on the QTP

From 2000 to 2020, the Moran’s I index values were 0.6008, 0.5570, 0.5389, 0.5402, and 0.5603 (Figure 4). In all five instances, the z-score exceeded 2.58, and the p-value was 0, indicating that the ES of the QTP during this period exhibited significant spatial distribution characteristics. The ES of the QTP exhibits a clear positive spatial correlation. Furthermore, the Getis–Ord Gi* reveals the spatial heterogeneity of the ESP (Figure 5). From 2000 to 2020, both hot spots and cold spots of ES on the QTP decreased. From 2000 to 2005, the total proportion of hot spots and cold spots on the QTP decreased by 1.65% and 3.3%, respectively. From 2005 to 2010, the total proportion of hot spots and cold spots on the QTP decreased by 2.06% and 1.23%, respectively. From 2010 to 2015, the total proportion of hot spots and cold spots on the QTP increased by 2.47% and 0.82%, respectively. From 2015 to 2020, the total proportion of hot spots and cold spots on the QTP increased by 0.83% and 1.24%, respectively.
Spatially, the southeastern part of the QTP is dominated by Yunnan Province, which is rich in ecological resources. The complex terrain and diverse climate provide a good foundation for biodiversity [12]. The ecological concept embodied in the traditional culture of the local ethnic minorities promotes respect for and protection of nature. With the continuous implementation of ecological protection policies, the condition of the local ecosystem’s health is better, the ecosystem service value continues to rise, and the ES value is higher, so it is a concentrated area of hot spots [51]. The cold spot area of the QTP is transferred from west to east, and mainly concentrated in the abdominal region of the QTP, which is dominated by Qinghai Province. Qinghai Province is sensitive to climate change, has a fragile ecological environment, and damage is difficult to restore [32]. Despite policies such as returning farmland to forests and grasslands and limiting overgrazing, the damage caused by economic development and urban expansion is difficult to offset. Therefore, its ES value is lower for a long time, and it is an area with a concentration of cold spots.

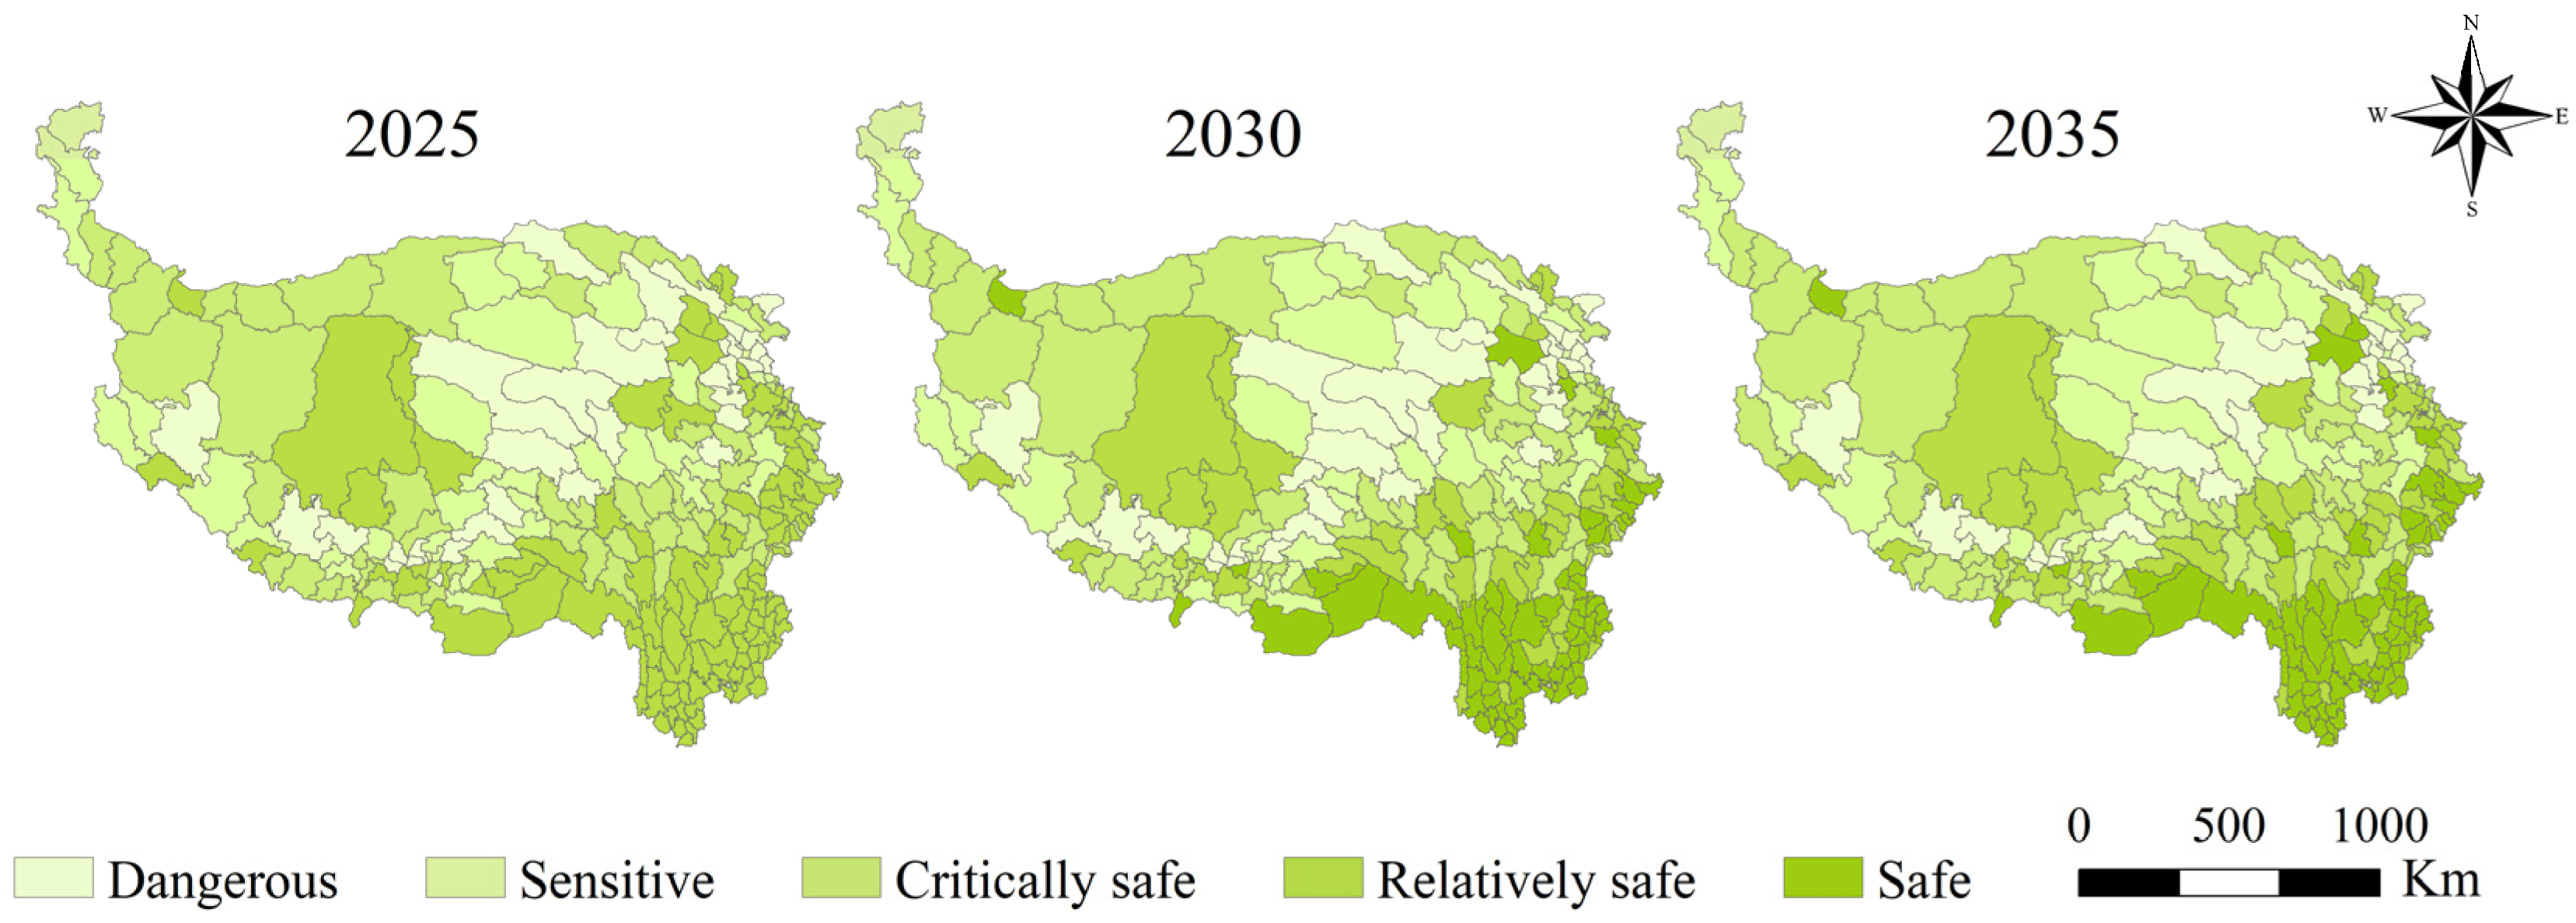
3.3. ES Prediction of QTP

3.3.1. The Comparison of the Predictive Abilities of Different Prediction Models for the ES of the QTP

In this study, we used two deep learning models (LSTM and CNN), a machine learning model (RF), and a traditional linear regression model (LR) to predict the ES value of the QTP for 2025–2035 based on the ES value of 2000–2020. In order to select the most suitable prediction model from a variety of prediction methods and determine the accuracy of the model, we first predict the ES value in 2020. We then compare the predicted value with the actual value, and evaluate the ability of different models to predict QTP ES by using the Root Mean Square Error (RMSE) and the coefficient of determination (R2) of the four models. The prediction accuracy of the four models is shown in Table 4. LSTM has the best prediction effect (RMSE = 0.02036, R2 = 0.86149), and LR has the worst prediction effect (RMSE = 0.02383, R2 = 0.81015). Although CNN (RMSE = 0.02243, R2 = 0.83183) is also a deep learning model, its prediction effect is still different from LSTM’s; RF’s prediction effect is second only to LSTM’s, and it also has a high fit (RMSE = 0.02110, R2 = 0.85124).

3.3.2. Prediction of the ES on the QTP by Different Prediction Models

In this study, the LSTM model with the best prediction effect was selected to forecast the ES of the QTP from 2025 to 2035, and the prediction results are shown in Figure 6.
From a temporal perspective, it is expected that, from 2025 to 2035, the ES value of the QTP will exhibit an upward trend. The number of dangerous, sensitive, and relatively safe counties will decrease, while the number of critically safe and safe counties will continue to increase. The number of safe counties is projected to reach the highest level in history.
From a spatial perspective, the overall ES situation of the QTP is expected to continue improving in the future. The ES conditions are projected to be better in the southeast region and relatively worse in the northwest and central regions. Most of the counties in the north are critically safe, most of the counties in the east are relatively safe, most of the counties in the south are safe, the counties in the west are between sensitive and critically safe, some of the central regions have changed from dangerous to sensitive, and the safety levels of other counties are scattered.

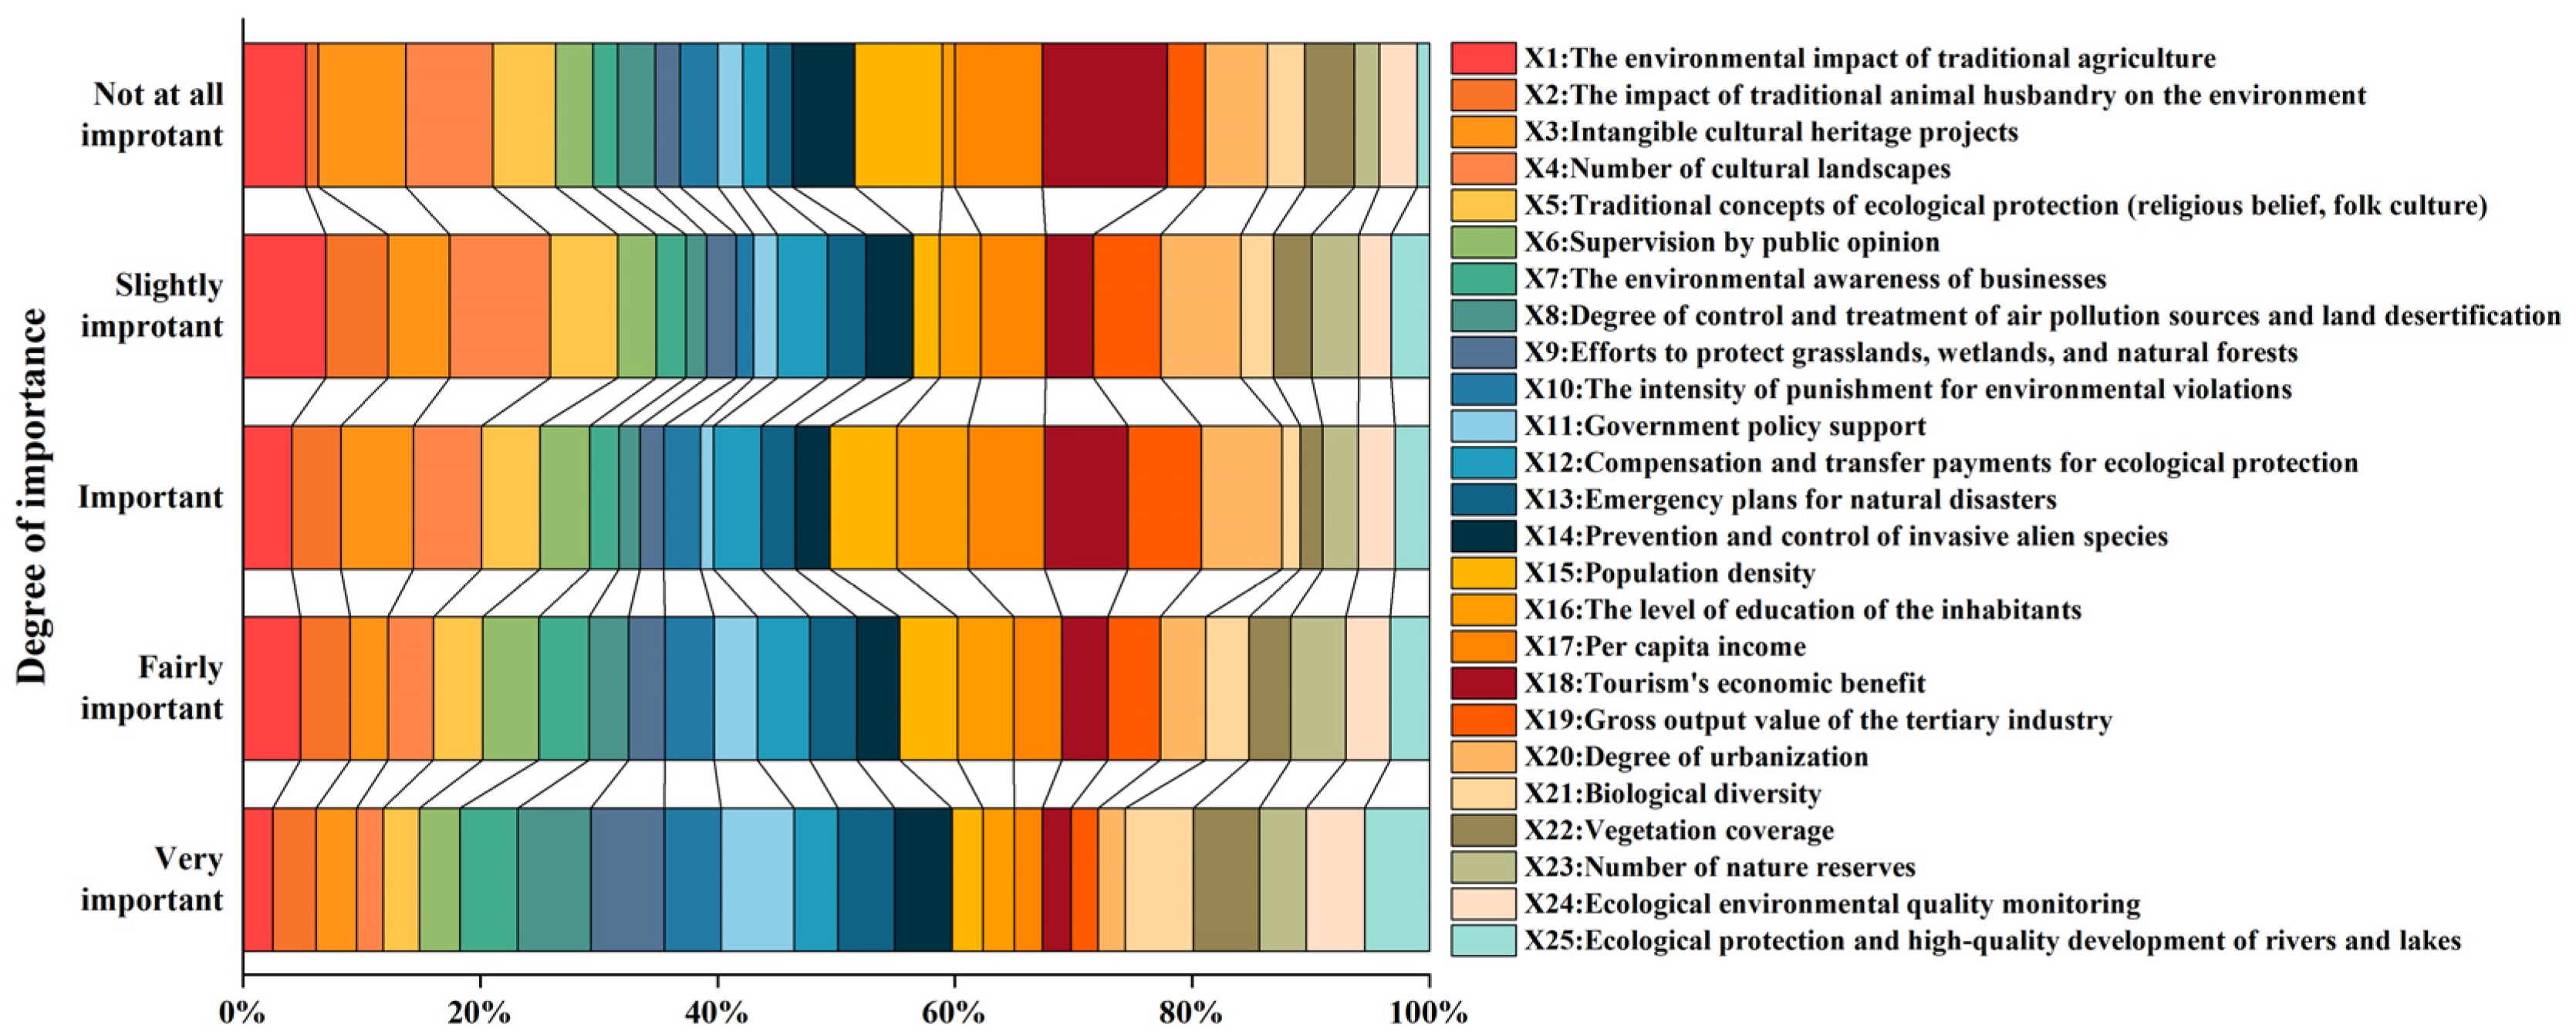
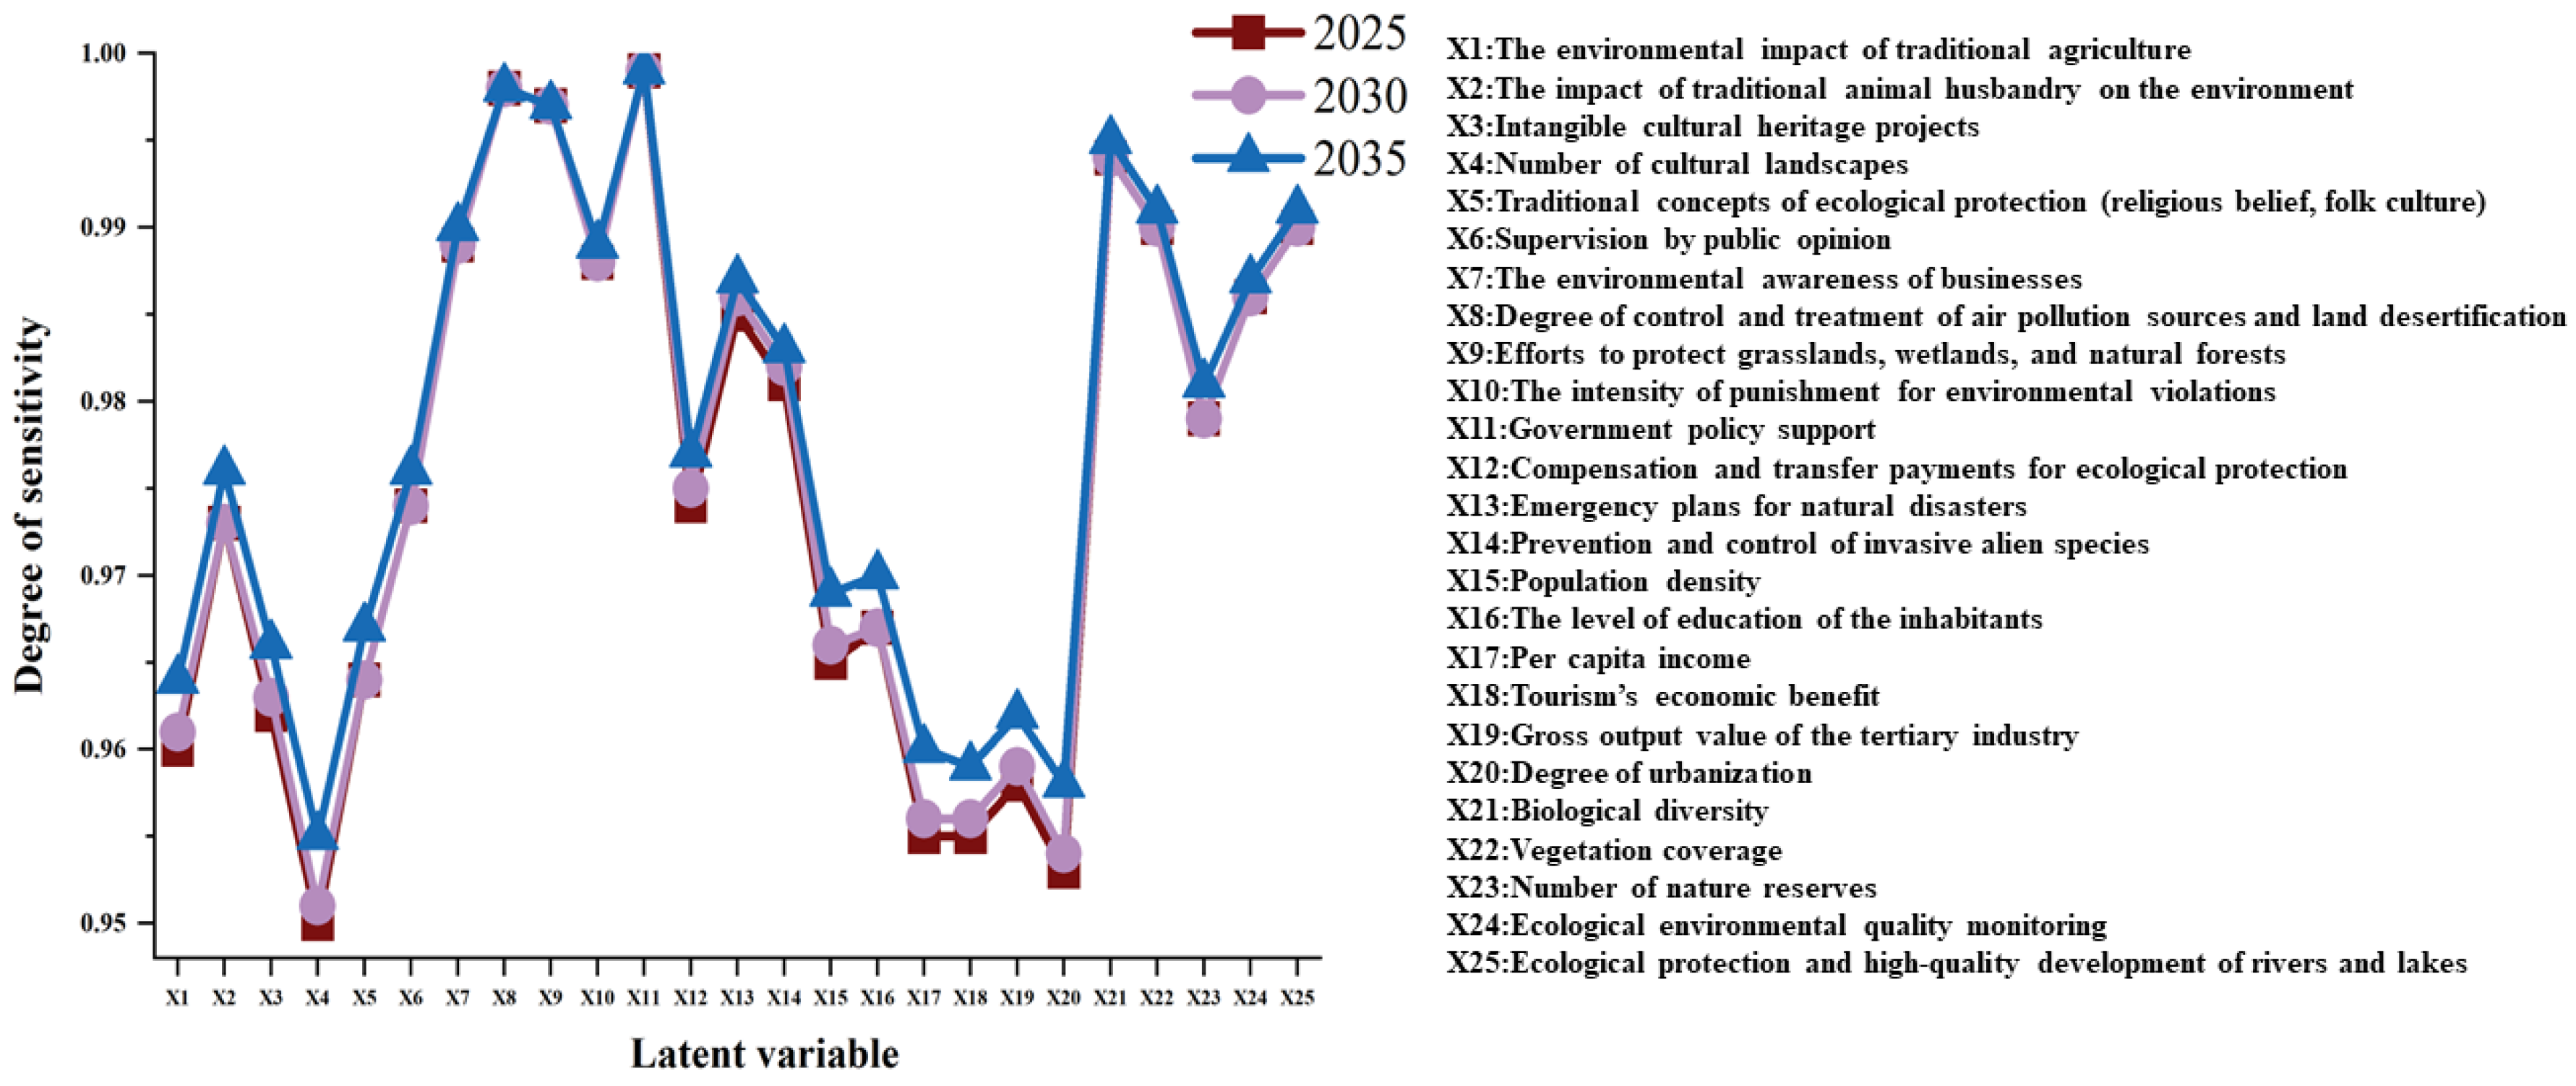
3.4. Analysis of Residents’ Perception of ES of QTP

The perception of residents is an important factor in the ES of the QTP. This study measured residents’ perceptions of the impact of government supervision, social governance, ecological protection, social and economic development, and the influence of traditional culture on ES on the QTP. The values of 5, 4, 3, 2, and 1 for residents’ perception represent, respectively, very important, fairly important, important, slightly important, and not at all important. The larger the score, the higher the respondents’ perception of the impact of this factor on ES. The degree of perception of various influencing factors is shown in Figure 7.
According to a comprehensive analysis and an average calculation for 25 potential factors including government supervision, social governance, ecological protection, social and economic development, and traditional culture, the respondents ranked the impact of different government regulation methods on ES as follows: government policy support (4.43) > emergency plans for natural disasters (4.17) > the prevention and control of invasive alien species (4.11) > compensation and transfer payments for ecological protection (3.98). Respondents ranked the impact of different social governance methods on ES as follows: the degree of control and treatment of air pollution sources and land desertification (4.39) > efforts to protect grasslands, wetlands, and natural forests (4.38) > the environmental awareness of businesses (4.23) > the intensity of punishment for environmental violations (4.22) > supervision by public opinion (3.97). Respondents ranked the impact of different social and economic development modes on ES as follows: the level of education of the inhabitants (3.84) > population density (3.81) > the gross output value of the tertiary industry (3.68) > per capita income (3.63) = tourism’s economic benefit (3.63) > the degree of urbanization (3.59). Respondents ranked the impact of different ecological protection methods on ES as follows: biological diversity (4.33) > vegetation coverage (4.26) > ecological protection and the high-quality development of rivers and lakes (4.25) > ecological environmental quality monitoring (4.18) > the number of nature reserves (4.06). Respondents ranked the impact of different traditional cultural influences on ES as follows: the impact of traditional animal husbandry on the environment (3.95) > traditional concepts of ecological protection (religious belief, folk culture) (3.78) > intangible cultural heritage projects (3.75) > the environmental impact of traditional agriculture (3.72) > the number of cultural landscapes (3.53). The results show that residents believe that the above potential factors will have an impact on ES, and their impact is between “important” and “very important”, and they have a positive attitude toward the impact of 25 potential factors on ES.
In the process of getting along with nature, residents’ perceptions of various potential factors affecting the environment directly determines their protection of the ecological environment [52]. Therefore, we hope to use the grey correlation model to quantitatively and deeply explore the sensitivity relationship between QTP residents’ perception of these factors and the predicted value of ES. By analyzing the sensitivity between them, we can provide a scientific basis for the government to formulate and implement more effective environmental protection policies, and strengthen education and publicity. At the same time, it also can provide clear guidance for the public’s environmental protection behavior, promote the virtuous circle of the ESP, and ultimately promote the harmonious coexistence of humans and nature. The relationship between the sensitivity of residents to the 25 latent variables and future ES from 2025 to 2035 is illustrated in Figure 8. In general, the relationship between various variables and ES from 2025 to 2035 remains consistent, exhibiting a significant correlation. Government policy support, the degree of control and treatment of air pollution sources, land desertification, and efforts to protect grasslands, wetlands, and natural forests are highly sensitive to the future ESP and are the main factors influencing environmental change. Conversely, the number of cultural landscapes, the degree of urbanization, and the economic benefits of tourism, as perceived by residents, are less sensitive to future ES and have a lesser impact on environmental change.

4. Discussion

4.1. Spatial Heterogeneity of ES on the QTP

The ecological environment, as a crucial natural resource and habitat for humans, forms the foundation for societal development and progress. ES plays a pivotal role in fostering regional economic growth, social advancement, and environmental conservation efforts [53]. Previous studies on ES on the QTP mostly focused on a grid scale, which has a wide range and little reference significance for government decision-making. Therefore, leveraging the PSR model, this study established an ES evaluation index system to assess ES across the QTP from 2000 to 2020 at the county level. The analysis focused on unraveling the spatiotemporal variations in ES across the QTP. The findings indicate that, from 2000 to 2020, ES on the QTP has exhibited a consistent improvement, with higher levels observed in the southeast and lower levels in the central and northern regions. This finding is consistent with the ecological vulnerability of the QTP previously studied by Yu et al. [30]. This change may be attributed to increased governmental attention to the ecological environment over the past two decades. Implemented policies and measures in the QTP, such as land reforestation, grassland restoration, and ecological compensation, likely contributed to this positive trend [54]. The implementation of these policies has reduced the number of dangerous and sensitive counties to a certain extent, and promoted the improvement of ES. However, due to underdeveloped infrastructure, challenging terrain and geographical conditions, and a fragile ecological environment, its ecological security may face greater challenges. The QTP is one of the regions sensitive to global climate change, which may lead to change in the ecosystem and the fluctuation of ES. As a prime example of an ecological ecotone, the QTP is characterized by its capacity to support only minimal human activities, largely due to the confluence of climate change and human interventions. The plateau’s delicate ecological balance necessitates careful management to mitigate the adverse effects of human presence and ensure its sustainability as a critical ecological and environmental asset. However, human activities such as overgrazing and reclaiming grasslands can significantly impact the ecological environment, thus affecting the change in ES. The difference in topography and landform may also be an important factor causing the change in ES level in different regions. The spatial distribution of ES on the QTP is consistent with its elevation change. The eastern region features typical mountainous topography, benefiting from warm and moist water vapor transported from the Indian Ocean along the longitudinal distribution of mountain ranges. This creates favorable hydrothermal conditions characterized by flat terrain, fertile soil, and abundant river water supply, making the region suitable for agricultural activities. Therefore, its ES value is relatively high.
The hotspots of ES on the QTP are mainly concentrated in the southeast region, which has always been in a state of high value from 2000 to 2020. The high value of the southeast region is mainly due to its location in the border area of Yunnan and Tibet. In terms of the spatial distribution of ES indicators, the southeast region has rich precipitation and high slope, and the population, GDP and ESV are all the highest on the QTP. The Yunnan provincial government has continuously strengthened the protection of local ES, investing substantial funds in the construction of biodiversity corridors, improving biosafety management, and building strong ES barriers. Consequently, the ES value of this region has consistently remained high. The cold spots of ES on the QTP are primarily concentrated in its central and western regions. The overall state scores were lower in the plateau’s central and western areas, largely due to the region’s poor natural conditions. The average altitude of the Ngari region is over 4500 m. Affected by terrain and climate conditions, the vegetation coverage rate is relatively low, the desertification prevention and control situation is relatively severe, and the protection and management pressure of wetland ecosystem is relatively large. Therefore, its ecosystem is relatively fragile and the ES value was low in the early years. Since 2005, the cold spot area in the Ngari region has diminished. The establishment of the Qiangtang National Nature Reserve in 2000 and the implementation of ecological migration policies have facilitated the relocation of many Tibetans from extremely high-altitude areas. This initiative has not only enhanced the living standards of Tibetans but also contributed to the improvement of the ecological environment. Therefore, the ecosystem in the Ngari region shows a positive recovery trend. Its ES has changed from a dangerous state to a relatively safe state. The Yushu Tibetan Autonomous Prefecture, located in the central region of the QTP, has been a concentrated distribution area in the cold spot area of ES on the Plateau since 2005. It features high and complex terrain, variable climate patterns, frequent natural disasters, a fragile ecological environment, and significant risks of soil erosion and land degradation. Relative to the rest of the QTP, it has always been in a dangerous state. Therefore, to further strengthen the protection of the ecological environment in the Yushu Tibetan Autonomous Prefecture, the government needs to strengthen the construction of artificial shelterbelts, ensure the integrity and stability of the ecological system in the nature reserve through afforestation, grassland restoration and other ecological restoration projects, establish a sound ecological environment monitoring and evaluation system, and grasp the changes to the ecological environment over time. It is crucial for ecological environment protection in the Yushu Tibetan Autonomous Prefecture to establish a foundation for implementing scientifically informed ecological conservation measures.

4.2. ES Prediction of QTP

4.2.1. Comparison of Predictive Models

In this study, four prediction models were chosen to forecast the ES of the QTP from 2025 to 2035. The advantages and disadvantages of different prediction models and their working principles indicate that machine learning and deep learning models exhibit higher prediction accuracy than traditional linear regression models [55]. The RF, CNN, LSTM, and LR models each demonstrate distinct characteristics and limitations in the process of ES prediction. LR is simple to implement and calculate [46], but it cannot fit nonlinear data, is sensitive to outliers, and its prediction accuracy is inferior to machine learning models and deep learning models. Building upon decision tree-based classifiers, RF incorporates random attribute selection during the training process, enhancing its predictive capabilities. In the construction process of base classifiers, it is necessary to ensure that the trained base classifiers have relatively large differences as much as possible, which requires sampling the training sample set, and that different base classifiers train different sample sets [56]. However, too few samples will lead to the poor performance of base classifiers. Although RF is simple and easy to implement and has low computational overhead, it can overfit some noisy classification or regression problems. CNN and LSTM are predictive models based on deep learning. In this study, our goal is to minimize the prediction error of the model, and the deep learning model can be well converged and generalized to new data without overfitting. When CNN processes time series data, it mainly extracts local features through convolution operations, which makes the model more inclined to find local patterns, and may not grasp the global long-term trend [57]. This is particularly obvious in the case of a small number of time series phases, resulting in the limited performance of CNN in the prediction of ES in this study. LSTM stands out for its ability to process time series data. LSTM, with its distinctive gating mechanism, excels in learning long-term dependencies within time series data, enabling the capture of intricate patterns and structures [58]. In conclusion, while each model has its own strengths and weaknesses, deep learning models, particularly LSTM, are found to be highly effective in predicting ES due to their ability to capture complex patterns in time-dependent data.

4.2.2. Application of Deep Learning Model in This Research

Considering both R2 and RMSE, LSTM performs better than RF, CNN and LR in this study. This could be attributed to LSTM’s utilization of a self-connected storage unit and three multiplicative units—namely, input, output, and forgetting gates—which enhance its ability to capture and maintain long-term dependencies in sequential data. This capability enables LSTM to effectively model complex temporal dynamics, thereby enhancing its prediction accuracy. Therefore, in this study, we emphasize the great significance of deep learning model for the protection of QTP ecological environment, and provide a way to predict the future ES value of QTP. Utilizing the LSTM model, we have gained deeper insights into the temporal and spatial distribution of ES on the QTP from 2025 to 2035. This analysis reveals a consistent trend in ES and provides clear guidance for future ecological environment protection and management. However, these prediction models have their own advantages and limitations, and their performance in practical applications depends on the scale, quality and characteristics of the data series. Nevertheless, advancements in artificial intelligence algorithms progress rapidly, with high turnover rates. Therefore, researchers studying ES in the QTP should stay abreast of developments in artificial intelligence. This includes exploring recent enhancements and optimizations of the four algorithms employed in this study, as well as emerging forecasting methodologies demonstrating efficacy in other domains.

4.3. Policies and Recommendations

From 2025 to 2035, the average value of ES on the QTP is projected to be 0.064, 0.065, and 0.069, indicating that the ES index of the QTP will show an upward trend in the future. This suggests that the ES of the QTP will continue to grow and develop positively. In recent years, the state has promulgated the “QTP Ecological Protection Law of the People’s Republic of China” to strengthen the protection of the QTP ecosystem by establishing functional ecological zones, national parks, and protected natural areas, thereby maintaining the authenticity and integrity of important natural ecosystems. Furthermore, the state adheres to systematic governance prioritizing natural restoration, combining it with artificial restoration when necessary. This includes establishing a robust ecological risk prevention and control system on the QTP, increasing financial investment in ecological protection and restoration, and improving laws and regulations to ensure ES on the plateau. These measures collectively aim to enhance the ES of the QTP, ensuring the region’s natural environment remains preserved and sustainable for future generations.
In the future, the QTP should continue to improve its management system and strengthen government policy support for natural resource supervision and environmental protection. Specific actions include controlling domestic sewage discharge and the excessive use of pesticides and fertilizers. Additionally, the formulation of sound emergency plans for natural disasters, controlling the invasion of alien species, and increasing compensation and transfer payments for ecological protection are crucial steps. Leveraging the species resources and ecological environment of the QTP to develop a green tourism industry will also be beneficial. A systematic and comprehensive training program should be established to cultivate talents in environmental protection, management, and research. Tailored environmental protection management laws and regulations should be formulated for different regions, including the establishment of nature reserves to strengthen the management and protection of biodiversity. Key measures should include banning grazing, promoting grassland restoration, and establishing closed protection areas for desertified lands that do not meet conditions for temporary control. These initiatives will ensure the sustainable development and ES of the QTP.

4.4. Deficiency and Prospect

In this study, we developed an ES evaluation index system based on GIS, analyzed the spatial heterogeneity of ES on the QTP, and forecasted future ES conditions. Our findings provide critical insights for guiding ecological environment protection efforts in the QTP. Nevertheless, the protection of the ecosystem is a complex process, and ES is influenced by natural conditions, social and economic development, and government policies. There are still some shortcomings in this study that need further improvement. Firstly, when calculating the overall ES of the QTP at the county scale, there is an issue of low accuracy and insufficient detail. Secondly, due to the availability and quantification of data, only 10 evaluation indicators were selected for the evaluation of the ES of the QTP, which may not be comprehensive. In future studies, incorporating additional evaluation indicators can enhance the accuracy and comprehensiveness of evaluation outcomes. Further analysis of key factors influencing ES on the QTP—including human activities, geological disasters, soil erosion, and landscape patterns—will be essential. Finally, for future predictions of ES, subsequent research will adopt deep learning methods to predict ES based on the changes in specific driving factors. This approach aims to provide more accurate positioning and more reasonable assistance for the government in formulating relevant protection strategies.

5. Conclusions

Based on the county scale of the QTP, this study constructed an index system of ES evaluation on the QTP based on the PSR model, and discussed the changes and spatial heterogeneity of ES on the QTP during 2000–2020 from the perspective of time and space. Additionally, the deep learning model was used to simulate and forecast the ES situation of the QTP from 2025 to 2035, and ecological protection suggestions were put forward based on the prediction results and residents’ perception.
With the government’s emphasis on ecological environmental protection, more and more related protection policies and ecological restoration projects have promoted the change in the local ecological environment. From 2000 to 2020, the ES value of the QTP has shown a continuous increase. The number of counties classified as dangerous has significantly decreased, while the count of safe counties has continued to rise. This trend exhibits a spatial distribution with a higher value in the southeast, and a lower value in the northwest and central regions. Over the past two decades, the cold spots and hot spots of ES on the QTP have steadily diminished. Hot spots have predominantly clustered in the southeast region, while cold spots have transitioned from west to east. These trends signify an overarching enhancement in the ecological environment of the QTP.
By employing the deep learning model to predict future ES, investigating residents’ perceptions of QTP ES, and analyzing the relationship between these factors, it is anticipated that the overall the ES of the QTP will significantly improve over the next 10 years. The government should continue to enhance infrastructure construction, ensure the living conditions of residents, enforce various ecological protection policies, and strengthen the protection of natural resources and the control of environmental pollution while fostering economic development. These measures will provide the necessary conditions for improving the ES value of the QTP in the future.

Supplementary Materials

The following supporting information can be downloaded at: https://www.mdpi.com/article/10.3390/land13071073/s1. (1) Entropy weight method calculation process. (2) Deep learning prediction model code.

Author Contributions

Conceptualization, L.L. and L.G.; methodology, L.L. and W.L.; software, L.L. and S.Z.; validation, L.L.; formal analysis, L.L. and H.Q.; investigation, L.L. and L.G.; resources, L.G.; data curation, L.L.; writing—original draft preparation, L.L.; writing—review and editing, L.L. and L.G.; visualization, L.L.; supervision, L.G.; project administration, L.G.; funding acquisition, L.G. All authors have read and agreed to the published version of the manuscript.

Funding

This research was funded by the Second Tibetan Plateau Scientific Expedition and Research (STEP) program, grant number 2019QZKK0308, and the National Natural Science Foundation of China, grant number No. 32271666.

Data Availability Statement

The data that support the findings of this study are available from the corresponding author upon reasonable request. The data are not publicly available due to privacy and anonymity.

Conflicts of Interest

The authors declare no conflicts of interest.

References

  1. Nie, W.B.; Bin, X.; Yang, F.; Shi, Y.; Liu, B.T.; Wu, R.W.; Lin, W.; Pei, H.; Bao, Z.Y. Simulating future land use by coupling ecological security patterns and multiple scenarios. Sci. Total Environ. 2023, 859, 14. [Google Scholar] [CrossRef]
  2. Bi, M.L.; Xie, G.D.; Yao, C.Y. Ecological security assessment based on the renewable ecological footprint in the Guangdong-Hong Kong-Macao Greater Bay Area, China. Ecol. Indic. 2020, 116, 10. [Google Scholar] [CrossRef]
  3. Zhang, X.B.; Wang, Z.Y.; Liu, Y.; Shi, J.; Du, H.C. Ecological Security Assessment and Territory Spatial Restoration and Management of Inland River Basin-Based on the Perspective of Production-Living-Ecological Space. Land 2023, 12, 1612. [Google Scholar] [CrossRef]
  4. Feng, Y.J.; Yang, Q.Q.; Tong, X.H.; Chen, L.J. Evaluating land ecological security and examining its relationships with driving factors using GIS and generalized additive model. Sci. Total Environ. 2018, 633, 1469–1479. [Google Scholar] [CrossRef]
  5. Li, Z.X.; Chang, J.; Li, C.; Gu, S.H. Ecological Restoration and Protection of National Land Space in Coal Resource-Based Cities from the Perspective of Ecological Security Pattern: A Case Study in Huaibei City, China. Land 2023, 12, 442. [Google Scholar] [CrossRef]
  6. Ji, C.; Yang, H.; Pei, X.; Zhang, X.; Chen, L.; Liang, D.; Cao, Y.; Pan, J.; Chen, M. Dynamic Integrated Ecological Assessment along the Corridor of the Sichuan–Tibet Railway. Land 2024, 13, 857. [Google Scholar] [CrossRef]
  7. Cui, X.F.; Deng, W.; Yang, J.X.; Huang, W.; de Vries, W.T. Construction and optimization of ecological security patterns based on social equity perspective: A case study in Wuhan, China. Ecol. Indic. 2022, 136, 10. [Google Scholar] [CrossRef]
  8. Li, J.Y.; Chen, X.; De Maeyer, P.; van de Voorde, T.; Li, Y.M. Ecological security warning in Central Asia: Integrating ecosystem services protection under SSPs-RCPs scenarios. Sci. Total Environ. 2024, 912, 17. [Google Scholar] [CrossRef]
  9. Li, L.M.; Wu, J.; Lu, J.; Li, K.X.; Zhang, X.Y.; Min, X.Y.; Gao, C.L.; Xu, J. Water quality evaluation and ecological-health risk assessment on trace elements in surface water of the northeastern Qinghai-Tibet Plateau. Ecotox. Environ. Saf. 2022, 241, 10. [Google Scholar] [CrossRef]
  10. Wen, J.F.; Hou, K. Research on the progress of regional ecological security evaluation and optimization of its common limitations. Ecol. Indic. 2021, 127, 10. [Google Scholar] [CrossRef]
  11. Zhang, J.J.; Hao, X.M.; Li, X.W.; Fan, X.; Zhang, S. Evaluation and regulation strategy for ecological security in the Tarim River Basin based on the ecological footprint. J. Clean. Prod. 2024, 435, 15. [Google Scholar] [CrossRef]
  12. Xie, B.; Jones, P.; Dwivedi, R.; Bao, L.L.; Liang, R.B. Evaluation, comparison, and unique features of ecological security in southwest China: A case study of Yunnan Province. Ecol. Indic. 2023, 153, 11. [Google Scholar] [CrossRef]
  13. Lin, Y.Y.; Zhang, F.Z.; Cai, G.; Jin, Y.D.; Zhang, L.; Ge, Y. Spatio-temporal pattern and driving factors of tourism ecological security in Fujian Province. Ecol. Indic. 2023, 157, 14. [Google Scholar] [CrossRef]
  14. Hazbavi, Z.; Sadeghi, S.H.; Gholamalifard, M.; Davudirad, A.A. Watershed health assessment using the pressure-state-response (PSR) framework. Land Degrad. Dev. 2020, 31, 3–19. [Google Scholar] [CrossRef]
  15. Tian, S.; Zhang, Y.J.; Xu, Y.; Wang, Q.S.; Yuan, X.L.; Ma, Q.; Chen, L.P.; Ma, H.C.; Xu, Y.; Yang, S.; et al. Urban ecological security assessment and path regulation for ecological protection—A case study of Shenzhen, China. Ecol. Indic. 2022, 145, 12. [Google Scholar] [CrossRef]
  16. Li, W.L.; Liu, C.L.; Su, W.L.; Ma, X.L.; Zhou, H.K.; Wang, W.Y.; Zhu, G.F. Spatiotemporal evaluation of alpine pastoral ecosystem health by using the Basic-Pressure-State-Response Framework: A case study of the Gannan region, northwest China. Ecol. Indic. 2021, 129, 12. [Google Scholar] [CrossRef]
  17. Gao, Y.; Zhang, C.R.; He, Q.S.; Liu, Y.L. Urban Ecological Security Simulation and Prediction Using an Improved Cellular Automata (CA) Approach-A Case Study for the City of Wuhan in China. Int. J. Environ. Res. Public Health 2017, 14, 643. [Google Scholar] [CrossRef]
  18. Zhang, H.B.; Yan, Q.Q.; Xie, F.F.; Ma, S.C. Evaluation and Prediction of Landscape Ecological Security Based on a CA-Markov Model in Overlapped Area of Crop and Coal Production. Land 2023, 12, 207. [Google Scholar] [CrossRef]
  19. Wang, H.P.; Zhang, Z. A spatial lagged multivariate discrete grey model for forecasting an economy-energy-environment system. J. Clean. Prod. 2023, 404, 16. [Google Scholar] [CrossRef]
  20. Dutta, M.K.; Arhonditsis, G. Empowering novel scholarship at the intersection of machine learning/deep learning and ecology. Ecol. Inform. 2023, 77, 2. [Google Scholar] [CrossRef]
  21. Wu, Q.L.; Lin, H.X. A novel optimal-hybrid model for daily air quality index prediction considering air pollutant factors. Sci. Total Environ. 2019, 683, 808–821. [Google Scholar] [CrossRef]
  22. Tuia, D.; Kellenberger, B.; Beery, S.; Costelloe, B.R.; Zuffi, S.; Risse, B.; Mathis, A.; Mathis, M.W.; van Langevelde, F.; Burghardt, T.; et al. Perspectives in machine learning for wildlife conservation. Nat. Commun. 2022, 13, 15. [Google Scholar] [CrossRef]
  23. Dehghani, A.; Moazam, H.; Mortazavizadeh, F.; Ranjbar, V.; Mirzaei, M.; Mortezavi, S.; Ng, J.L.; Dehghani, A. Comparative evaluation of LSTM, CNN, and ConvLSTM for hourly short-term streamflow forecasting using deep learning approaches. Ecol. Inform. 2023, 75, 12. [Google Scholar] [CrossRef]
  24. Zhang, H.P.; Chen, W.; Liu, W.D.; Liu, Z.G.; Liu, H.C. The evolution of settlement system and the paths of rural revitalization in alpine pastoral areas of the Qinghai-Tibet Plateau: A case study of Nagqu County. Ecol. Indic. 2023, 150, 13. [Google Scholar] [CrossRef]
  25. Sang, Y.M.; Xin, L.J. Factors Determining Concurrent Reclamation and Abandonment of Cultivated Land on the Qinghai-Tibet Plateau. Land 2023, 12, 1081. [Google Scholar] [CrossRef]
  26. Xue, J.; Li, Z.X.; Du, F.; Ruan, J.L.; Gui, J. Dynamics changes and prediction of ecosystem services in the Qinghai-Tibet Plateau, western China. Glob. Ecol. Conserv. 2023, 47, 14. [Google Scholar] [CrossRef]
  27. Liu, J.Y.; Qin, K.Y.; Xie, G.D.; Xiao, Y.; Huang, M.D.; Gan, S. Is the ‘water tower’ reassuring? Viewing water security of Qinghai-Tibet Plateau from the perspective of ecosystem services ‘supply-flow-demand’. Environ. Res. Lett. 2022, 17, 11. [Google Scholar] [CrossRef]
  28. Xie, H.L.; He, Y.F.; Choi, Y.; Chen, Q.R.; Cheng, H. Warning of negative effects of land-use changes on ecological security based on GIS. Sci. Total Environ. 2020, 704, 9. [Google Scholar] [CrossRef]
  29. Wang, Z.Q.; Cui, G.L.; Liu, X.; Zheng, K.; Lu, Z.Y.; Li, H.L.; Wang, G.N.; An, Z.F. Greening of the Qinghai-Tibet Plateau and Its Response to Climate Variations along Elevation Gradients. Remote Sens. 2021, 13, 3712. [Google Scholar] [CrossRef]
  30. Yu, L.; Liu, S.L.; Wang, F.F.; Liu, Y.X.; Li, M.Q.; Wang, Q.B.; Dong, S.K.; Zhao, W.W.; Tran, L.S.P.; Sun, Y.X.; et al. Effects of agricultural activities on energy-carbon-water nexus of the Qinghai-Tibet Plateau. J. Clean. Prod. 2022, 331, 13. [Google Scholar] [CrossRef]
  31. Zhang, L.D.; Peng, W.F.; Zhang, J. Assessment of Land Ecological Security from 2000 to 2020 in the Chengdu Plain Region of China. Land 2023, 12, 1448. [Google Scholar] [CrossRef]
  32. Fan, Y.P.; Fang, C.L. Evolution process and obstacle factors of ecological security in western China, a case study of Qinghai province. Ecol. Indic. 2020, 117, 8. [Google Scholar] [CrossRef]
  33. Fu, C.W.; Hu, Z.Y.; Yang, Y.X.; Deng, M.S.; Yu, H.P.; Lu, S.; Wu, D.; Fan, W.W. Responses of Soil Freeze-Thaw Processes to Climate on the Tibetan Plateau from 1980 to 2016. Remote Sens. 2022, 14, 5907. [Google Scholar] [CrossRef]
  34. Chen, T.S.; Huang, L.B.; Zhang, X.; Gao, R.; Li, H.; Fan, K.; Ma, D.; Ma, Z.K.; Xue, L.K.; Wang, W.X. Effects of coal chemical industry on atmospheric volatile organic compounds emission and ozone formation in a northwestern Chinese city. Sci. Total Environ. 2022, 839, 9. [Google Scholar] [CrossRef]
  35. Cheng, H.R.; Zhu, L.K.; Meng, J.J. Fuzzy evaluation of the ecological security of land resources in mainland China based on the Pressure-State-Response framework. Sci. Total Environ. 2022, 804, 14. [Google Scholar] [CrossRef]
  36. Lu, T.; Li, C.J.; Zhou, W.X.; Liu, Y.X. Fuzzy Assessment of Ecological Security on the Qinghai-Tibet Plateau Based on Pressure-State-Response Framework. Remote Sens. 2023, 15, 1293. [Google Scholar] [CrossRef]
  37. Wen, X.; Deng, X.Z. Current soil erosion assessment in the Loess Plateau of China: A mini-review. J. Clean. Prod. 2020, 276, 10. [Google Scholar] [CrossRef]
  38. Guo, Z.; Yan, Z.; He, R.; Yang, H.; Ci, H.; Wang, R. Impacts of Land Use Conversion on Soil Erosion in the Urban Agglomeration on the Northern Slopes of the Tianshan Mountains. Land 2024, 13, 550. [Google Scholar] [CrossRef]
  39. Sikder, M.; Wang, C.; Yao, X.X.; Huai, X.; Wu, L.M.; KwameYeboah, F.; Wood, J.; Zhao, Y.L.; Dou, X.C. The integrated impact of GDP growth, industrialization, energy use, and urbanization on CO2 emissions in developing countries: Evidence from the panel ARDL approach. Sci. Total Environ. 2022, 837, 16. [Google Scholar] [CrossRef] [PubMed]
  40. Zhang, S.D.; Wu, T.; Guo, L.; Zou, H.T.; Shi, Y. Integrating ecosystem services supply and demand on the Qinghai-Tibetan Plateau using scarcity value assessment. Ecol. Indic. 2023, 147, 14. [Google Scholar] [CrossRef]
  41. Guo, J.; Qi, Y.; Zhang, L.; Zheng, J.; Sun, J.; Tang, Y.; Yang, X. Identifying and Mapping the Spatial Factors That Control Soil Erosion Changes in the Yellow River Basin of China. Land 2024, 13, 344. [Google Scholar] [CrossRef]
  42. Zhang, R.; Wang, C.L.; Xiong, Y.C. Ecological security assessment of China based on the Pressure-State-Response framework. Ecol. Indic. 2023, 154, 10. [Google Scholar] [CrossRef]
  43. Ren, E.; Lin, W.; Li, B.; Jiang, Y.; Zhang, Y.; Yu, Y. Regional Ecological Security Assessment Based on the Pressure–State–Response Framework: The Demonstration Zone of Yangtze River Delta as an Example. Land 2024, 13, 96. [Google Scholar] [CrossRef]
  44. Xi, H.Y.; Chen, Y.Q.; Zhao, X.Y.; Sindikubwabo, C.; Cheng, W.J. Safety assessment of fragile environment in Badain Jaran Desert and its surrounding areas based on the DPSIR model. Ecol. Indic. 2023, 146, 9. [Google Scholar] [CrossRef]
  45. Li, R.; Shi, Y.; Feng, C.C.; Guo, L. The spatial relationship between ecosystem service scarcity value and urbanization from the perspective of heterogeneity in typical arid and semiarid regions of China. Ecol. Indic. 2021, 132, 13. [Google Scholar] [CrossRef]
  46. Sahani, N.; Ghosh, T. GIS-based spatial prediction of recreational trail susceptibility in protected area of Sikkim Himalaya using logistic regression, decision tree and random forest model. Ecol. Inform. 2021, 64, 17. [Google Scholar] [CrossRef]
  47. Yuan, J.; Gao, H.; Shen, Y.L.; Ma, G.Q. Spatial Differentiation of Ecotourist Perceptions Based on the Random Forest Model: The Case of the Gansu Section of the Yellow River Basin. Land 2024, 13, 560. [Google Scholar] [CrossRef]
  48. Jiang, Q.; Liu, W.; Wu, S.P. Analysis on factors affecting moisture stability of steel slag asphalt concrete using grey correlation method. J. Clean. Prod. 2023, 397, 15. [Google Scholar] [CrossRef]
  49. Geng, Y.Q.; Chen, L.Y.; Li, J.Y.; Iqbal, K. Higher education and digital Economy: Analysis of their coupling coordination with the Yangtze River economic Belt in China as the example. Ecol. Indic. 2023, 154, 16. [Google Scholar] [CrossRef]
  50. Long, X.; Wu, S.G.; Wang, J.Y.; Wu, P.Z.; Wang, Z. Urban water environment carrying capacity based on VPOSR-coefficient of variation-grey correlation model: A case of Beijing, China. Ecol. Indic. 2022, 138, 10. [Google Scholar] [CrossRef]
  51. Wang, F.L.; Fu, W.; Chen, J.C. Spatial-Temporal Evolution of Ecosystem Service Value in Yunnan Based on Land Use. Land 2022, 11, 2217. [Google Scholar] [CrossRef]
  52. Zhu, D.; Niu, Q.; Wang, Y.H.; Peng, S.G.; Lu, X.L.; Zhou, H.C.; Zhang, F.L. The influence of psychological cognition and policy environment on the basin residents? behavior of ecological compensation under the background of carbon neutrality: A case study in upper Yellow River basin, China. Ecol. Indic. 2023, 148, 12. [Google Scholar] [CrossRef]
  53. Airiken, M.; Li, S.C. The Dynamic Monitoring and Driving Forces Analysis of Ecological Environment Quality in the Tibetan Plateau Based on the Google Earth Engine. Remote Sens. 2024, 16, 682. [Google Scholar] [CrossRef]
  54. Liu, X.X.; Zhao, W.W.; Liu, Y.X.; Hua, T.; Hu, X.P.; Cherubini, F. Contributions of ecological programs to sustainable development goals in Linzhi, over the Tibetan Plateau: A mental map perspective. Ecol. Eng. 2022, 176, 9. [Google Scholar] [CrossRef]
  55. Garcia-Rodriguez, D.; Ruber, P.C.; Iglesias Fuente, D.J.; Durá, J.J.M.; Baeza, E.L.; Celda, A.G. Predicting the fundamental fluxes of an eddy-covariance station using machine learning methods. Ecol. Inform. 2024, 81, 102638. [Google Scholar] [CrossRef]
  56. Kaveh, N.; Ebrahimi, A.; Asadi, E. Comparative analysis of random forest, exploratory regression, and structural equation modeling for screening key environmental variables in evaluating rangeland above-ground biomass. Ecol. Inform. 2023, 77, 15. [Google Scholar] [CrossRef]
  57. Yin, L.R.; Wang, L.; Li, T.Q.; Lu, S.Y.; Tian, J.W.; Yin, Z.T.; Li, X.L.; Zheng, W.F. U-Net-LSTM: Time Series-Enhanced Lake Boundary Prediction Model. Land 2023, 12, 1859. [Google Scholar] [CrossRef]
  58. Shim, J.; Hong, S.; Lee, J.; Lee, S.Y.; Kim, Y.M.; Chon, K.; Park, S.; Cho, K.H. Deep learning with data preprocessing methods for water quality prediction in ultrafiltration. J. Clean. Prod. 2023, 428, 13. [Google Scholar] [CrossRef]
Figure 1. Map of the study area in 2020. (a) Elevation of the QTP, (b) Study area location, (c) The QTP land use in 2020.
Land 13 01073 g001
Figure 2. Framework of this study.
Land 13 01073 g002
Figure 3. Temporal and spatial changes in ES on the QTP from 2000 to 2020.
Land 13 01073 g003
Figure 4. Moran’s I statistics of ES on the QTP from 2000 to 2020.
Land 13 01073 g004
Figure 5. Spatial heterogeneity of ES on the QTP from 2000 to 2020.
Land 13 01073 g005
Figure 6. Prediction of ES on the QTP in 2025–2035.
Land 13 01073 g006
Figure 7. The proportion of residents’ degree of perception of the influencing factors of ES on the QTP.
Land 13 01073 g007
Figure 8. Sensitivity of residents’ perceptions to future ES on the QTP in 2025–2035.
Land 13 01073 g008
Table 1. Main data used in the study.
NameResolutionSource
Land use1000 mResource and Environmental Science Data Platform (https://www.resdc.cn (accessed on 12 September 2023))
GDP1000 m
Population density1000 m
Average annual precipitation1000 m
NDVI1000 m
DEM30 mGeospatial Data Cloud (https://www.gscloud.cn/ (accessed on 12 September 2023))
Soil data1000 mChinese Soil Dataset (v1.1) of the World Soil Database (HWSD)
Permafrost rate1000 mNational QTP Scientific Data Center (https://data.tpdc.ac.cn/ (accessed on 12 September 2023))
Socio-economic data-County statistical yearbooks of Tibet, Qinghai, Xinjiang, Gansu, Sichuan, and Yunnan
Table 2. The ES evaluation index system of the QTP.
Target LayerCriterion LayerIndex LayerStatsWeight
ES in QTP (A)PressurePermafrost ratio/%-0.101266
Proportion of primary industry/%-0.063291
Population/a-0.075949
StateSlope/°-0.088608
Annual precipitation/mm+0.075949
Degree of soil erosion-0.063291
Output of animal husbandry/%-0.088608
ResponseGDP/2020 US$-0.088608
Proportion of tertiary industry/%+0.088608
Ecosystem service value/2020 US$+0.265822
Note: + Indicates a positive indicator, indicating that the indicator is positively correlated with the ES value. - Indicates a negative indicator, indicating that the indicator is negatively correlated with the ES value.
Table 3. Design of the scale of driving factors for ES on the QTP.
Latent VariableObserved Variable
Social governanceSupervision by public opinion
Degree of control and treatment of air pollution sources and land desertification
Efforts to protect grasslands, wetlands, and natural forests
Environmental awareness of businesses
The intensity of punishment for environmental violations
Government supervisionEmergency plans for natural disasters
Prevention and control of invasive alien species
Government policy support
Compensation and transfer payments for ecological protection
Social and economic developmentPopulation density
Level of education of inhabitants
Per capita income
Tourism’s economic benefit
Gross output value of tertiary industry
Degree of urbanization
Ecological protectionBiological diversity
Vegetation coverage
Number of nature reserves
Ecological environmental quality monitoring
Ecological protection and high-quality development of rivers and lakes
Influence of traditional cultureNumber of cultural landscapes
Intangible cultural heritage projects
Impact of traditional animal husbandry on the environment
Environmental impact of traditional agriculture
Traditional concepts of ecological protection (religious belief, folk culture)
Table 4. Verification of ES prediction in 2020 based on four prediction models.
RMSER2
LRRFCNNLSTMLRRFCNNLSTM
0.023830.021100.022430.020360.810150.851240.831830.86149
Disclaimer/Publisher’s Note: The statements, opinions and data contained in all publications are solely those of the individual author(s) and contributor(s) and not of MDPI and/or the editor(s). MDPI and/or the editor(s) disclaim responsibility for any injury to people or property resulting from any ideas, methods, instructions or products referred to in the content.

