Article

Better Safe Than Sorry: A Model to Assess Anthropic Impacts on a River System in Order to Take Care of the Landscape

1
Department of Humanities Studies, University of Naples Federico II, 80133 Naples, Italy
2
Department of Biology, University of Naples Federico II, 80126 Naples, Italy
3
Istituto Di Gestione Della Fauna (IGF), Via Michelangelo da Caravaggio 143, 80126 Naples, Italy
4
Department of Water Resource Protection, ACEA ATO2 S.p.A., 00154 Rome, Italy
*
Author to whom correspondence should be addressed.
Land 2024, 13(7), 1076; https://doi.org/10.3390/land13071076
Submission received: 24 June 2024 / Revised: 11 July 2024 / Accepted: 14 July 2024 / Published: 17 July 2024
(This article belongs to the Section Land, Biodiversity, and Human Wellbeing)

Abstract

:
The need to find a trade-off between protecting water-related ecosystems and increasing safe water-use for human society is recognized in the 2030 Agenda of the European Union. We assess the ecological status of a riverine system in order to mitigate human impacts, considering its importance for supplying drinking water to more than 4 million users in Rome. We used an integrated approach, analyzing animal and plant communities at riverbanks and the riverbed. A macrobenthos analysis revealed a well-structured community with a good ecology for all sampling stations. The highest value was found immediately upstream and downstream of the springs collection system, while the lowest richness value was where the river collects urban wastewater. A floristic inventory showed Hemicryptophytes composing almost 45% of all species, and prevalence of Euroasiatic (35%) and Orophilous (34%) chorotypes. A positive correlation between riverbed vegetation and the quality of the benthic community was revealed, while tree height seems to have a negative trend. Our data suggest a river stretch affected by resurgence and water abstraction did not highlight irreversible alterations to the landscape. Indeed, the composition of vegetation and correlated animal communities mirrored a clinal gradient expected for an Apennine river system. Our study has the potential to improve the approach used to monitor the impacts of humans on freshwater ecosystems, aiming at preserving the integrity of the water-related landscape.

1. Introduction

Freshwater is a critical necessity for human society and the environment, providing trophic resources and space for biodiversity as well as various benefits for global productions in economic, sanitary, cultural, aesthetic, and scientific terms [1,2,3,4].
The world is experiencing an ever-increasing decrease of water quality with a massive decline in the biodiversity of freshwater habitats; far greater than those in the most impacted terrestrial and marine ecosystems [5,6]. Mainly, human activities and global climate change are impacting on the structure and function of the aquatic landscape by, e.g., pollution agents, microbial and physical–chemical contaminants, drought, and floods, inducing changes in freshwater quantity and quality, and sometimes compromising animal and plant communities, human health, and landscape assets [7,8,9].
Despite European Union efforts to reverse freshwater degradation, in 2019, only 41% of surface water bodies in Europe showed a good ecological status [10]. Cumulative effects of multiple stressors, across spatial and temporal levels, are identified as one of the major factors undermining biodiversity and ecosystem functioning for riparian and aquatic ecosystems worldwide [11,12].
The importance of finding a trade-off between “the need to protect and restore water-related ecosystems, including […] rivers, aquifers, and lakes” and “substantially increase water efficiency for use in all sectors and ensure fresh water withdrawals and supplies to address water scarcity and substantially reduce the number of people suffering from water scarcity” is also recognized by international governments, so much so as to be the number six goal of the European Union Sustainable Development Goals included in the 2030 Agenda of the Member States of the United Nations, and approved by the United Nations General Assembly, to promote prosperity while protecting the planet (https://www.un.org/sustainabledevelopment/ Accessed on 4 May 2023). Thus, understanding how anthropic activities might impact the aquatic landscape is a key goal to ensure continued sustainable use of this essential resource. Hence, any information about a river system that is influenced by human activities can be a necessary piece in understanding the functioning and resilience of aquatic ecosystems.
Aquatic invertebrate assemblages (macrobenthos) are crucial elements in the benthic ecosystem involved in bioturbation, remineralization, filtration, and provision of food sources for fish, larger invertebrates, and birds [13,14,15]. Macrobenthos assemblage patterns and distribution are highly sensitive to pollution and hydromorphological and structural landscape alterations [16,17,18,19,20,21,22], and given their low mobility, bottom feeder habits, and representativeness at all levels of the trophic scale (i.e., detrivorous, phytophagous, predators, parasites, and preferential food for fish), this makes them powerful indicators of freshwater landscape health [16,23,24,25]. Thus, monitoring the composition and abundance of aquatic bioindicator taxa is crucial to assess the ecological status of aquatic ecosystems and ensure resource sustainability [26], potentially preventing deterioration of the landscape [27].
Similarly, riparian vegetation, as an interface between water and land, is included as a quality element of hydromorphological conditions; thus, it needs to be evaluated in the assessment of the ecological status of water bodies [28,29]. Indeed, it provides critical habitats, nutrients, and organic matter for aquatic species, while supporting terrestrial wildlife [30], and the study of riparian zones gives a valuable indication of the overall health status of the river ecosystem [31]. Furthermore, macrophyte species composition is influenced by the chemical properties of water, flow speed, solar irradiance, and water management [32]. Therefore, aquatic plants influence water quality and, at the same time, serve as indicators of the ecological condition of the river landscape.
Current methodologies tend to focus on individual aspects of the ecosystem in relation to pressure factors [33,34,35] but rarely integrate more elements (communities) into a single, cohesive analysis. At present, studies exploring the relationship between benthic macroinvertebrate communities and riparian vegetation of small Italian streams are limited [36,37]. This deficiency constitutes a significant gap in the scientific literature, as an integrated assessment could provide a more comprehensive and enhanced understanding of the ecological health of stream ecosystems.
With this in mind, our goal is to provide a methodological approach to evaluate landscape integrity and risk for biodiversity in an Apennine river system affected by humans, and to combine the sustainable exploitation of water resources and their supply for different public uses. Through integrated analysis of the composition and abundance of macrobenthos and riparian vegetation, we assess the ecological status of a river managed for supplying water to more than 4 million users in Rome, and subjected to different types of impacts (such as exploitation for fish production, wastewater receptor use, and water abstraction). This sort of watchfulness is crucial to preserving the ecological integrity of freshwater-related landscapes.

2. Materials and Methods
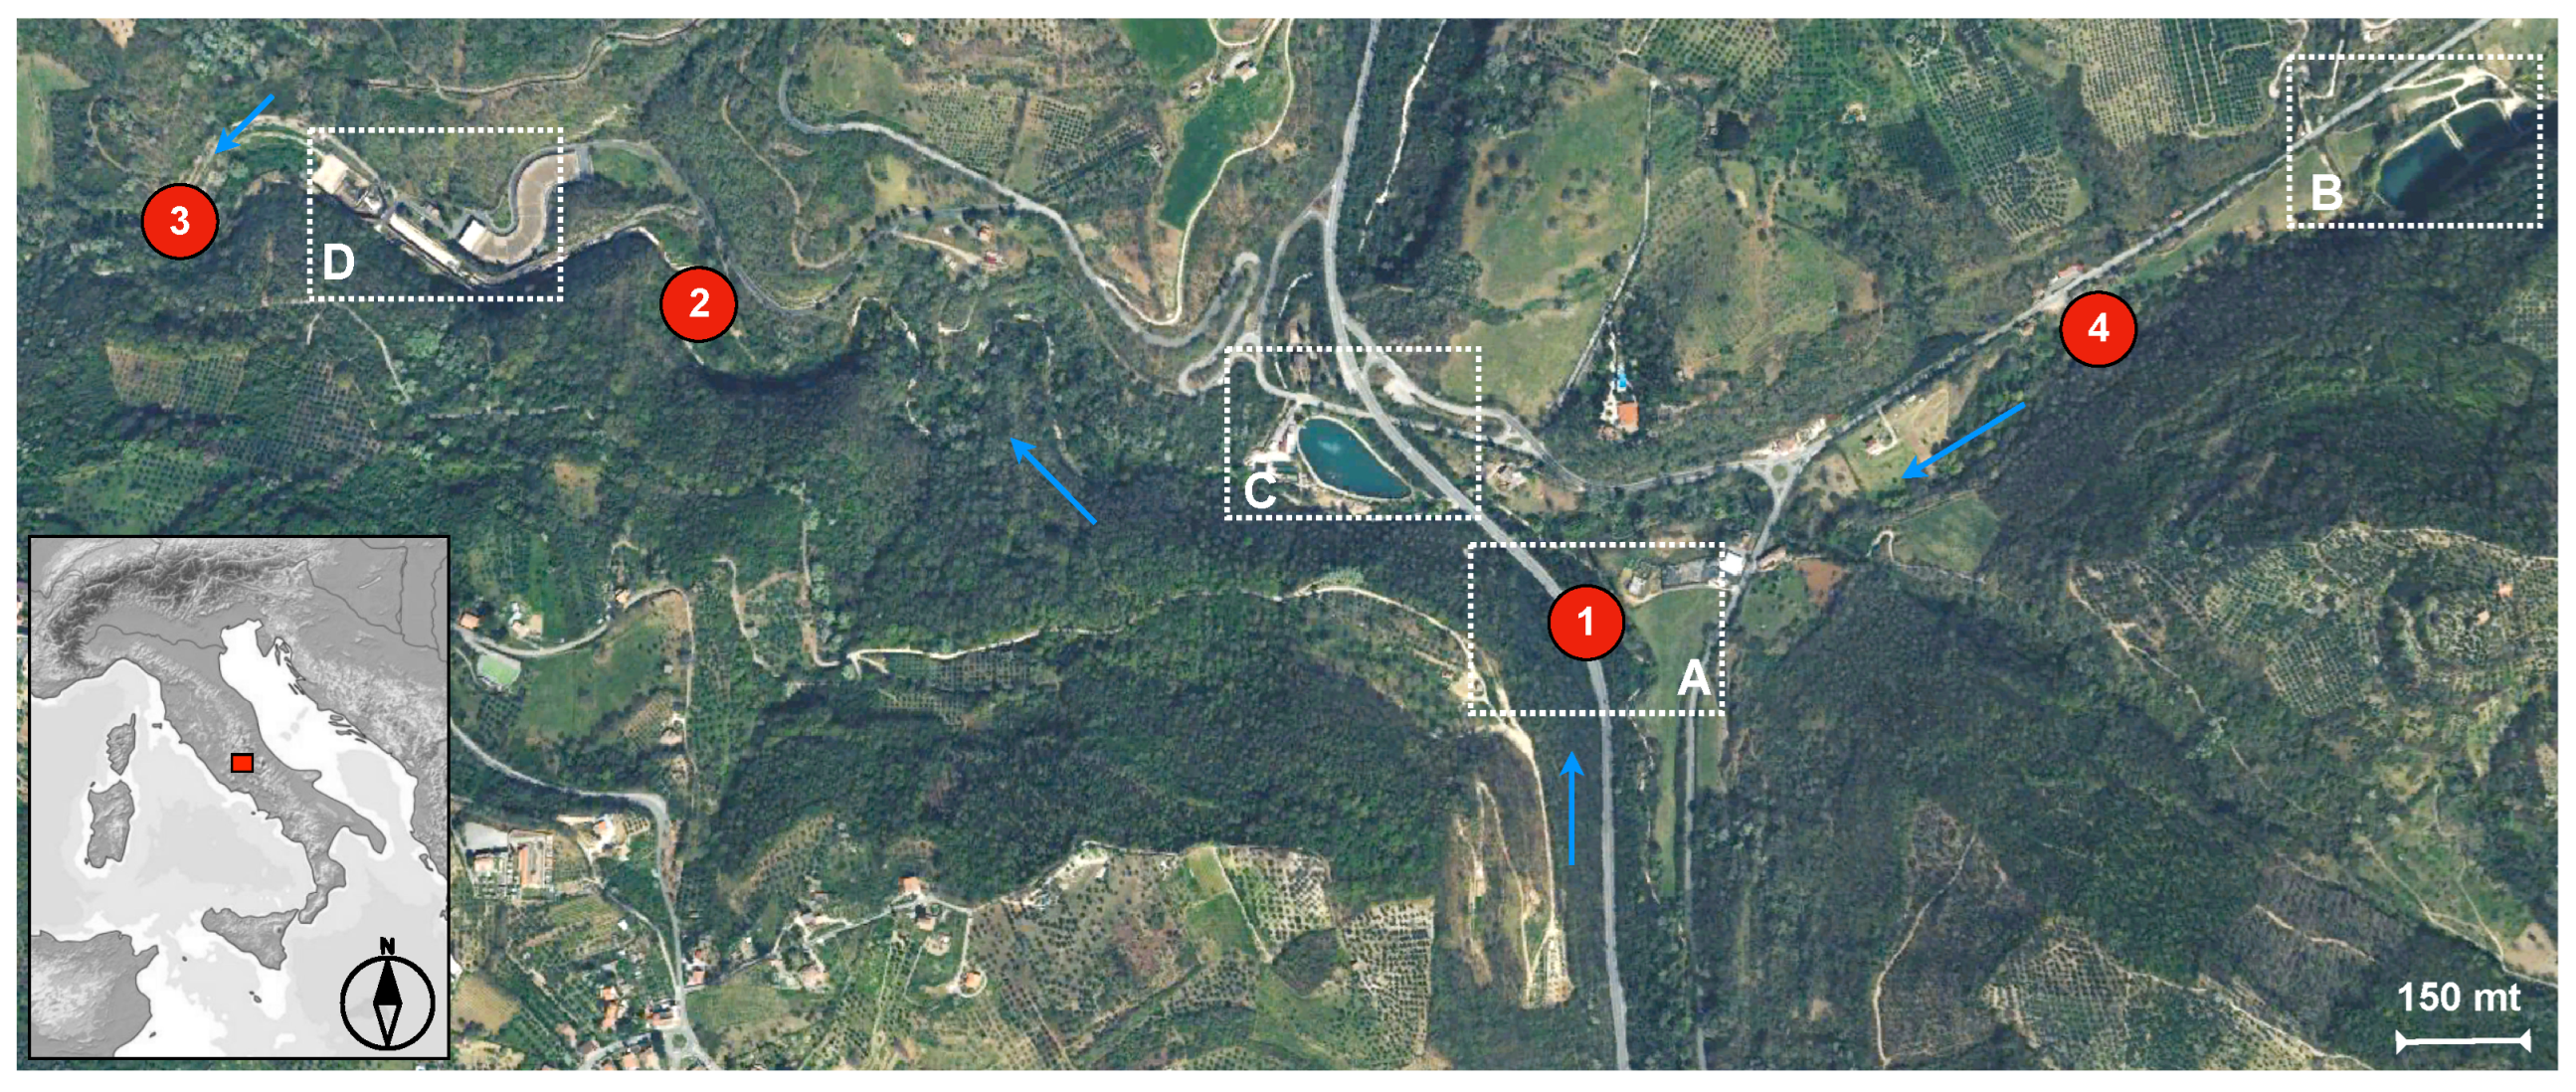
2.1. Study Area

The study was performed along the Farfa River (central Italy), belonging to the Tevere-Farfa Regional Nature Reserve and located in the Special Conservation Area “Farfa River—medium-high course” (code IT6020018), which is included in the Natura 2000 network (Figure 1).
The Farfa river (altitude 250–300 m above sea level) is 37 km long, with a basin of 257 km2, and a torrential regime [38], flowing through an area characterized by hilly landscape with agriculture as the main land use.
Before sampling, we defined some of the main characteristics of the investigated areas, such as the hydromorphology (type of substrate, type of flow, and depth), the type of riparian vegetation, altitude, exposure, slope, lithological type, rockiness, stoniness, the presence of any structures of anthropic origin or point sources of pollution (Supplementary Table S1), and the distance between sampling stations (Supplementary Table S2). According to the Water Framework Directive, this river belongs to Hydroecoregions HER13-Apennines Centre River typology, and it has also been classified as river macrotype M4 for diatoms and aquatic invertebrate communities (Italy, Ministerial Decree 8 November 2010, n. 260).
Different types and levels of anthropogenic pressures, including urban and industrial wastewater discharges (Figure 1A), ichthyogenic spots for breeding (Figure 1B), an artificial lake for sport fishing (Figure 1C), and water supply (Figure 1D), affect the river system; thus, we selected four sampling stations representative of these landscape conditions (Figure 1):
-
Station 1: the Fosso della Mola (UTM WGS84 33T: E 320673.760–N 4677220.717) that is at the point where the river collects urban wastewater from the municipality of Monteleone; a center of 1.159 inhabitants (ISTAT, EU Statistical Institutes). Here, the river is 1.5 m long, a few tens of millimeters in depth, and has dense bank vegetation surrounded by an agricultural and arable environment.
-
Station 2: the Fosso della Mola that is upstream of the “Le Capore” springs (Frasso Sabino, central Italy) (UTM WGS84 33T: E 319624.434–N 4677876.461); this station is representative of the ecological conditions of the watercourse after the water supplied by Fosso delle Mole.
-
Station 3: Fiume Farfa that is downstream of the “Le Capore” springs (UTM WGS84 33T: E 319192.977–N 4678085.328); this station is representative of the ecological conditions of the watercourse after the release of the springs. It also corresponds to the ARPA Lazio surveillance station named “Farfa 1”. The Le Capore springs are characterized by an artesian aquifer system with an annual mean discharge of about 5 m3/s. These springs are managed by ACEA ATO2 SpA, which is a water utility that operates mainly in central Italy, supplying drinking water to more than 4 million users in the city of Rome and its hinterland. The springs of “Le Capore” and Peschiera fed the homonymous aqueduct of Peschiera-Capore, which is a strategic aqueduct system that supplied over 80% of the water needs of the Roman water distribution network.
-
Station 4: the Fosso delle Mole ditch that is downstream of a fish farming factory (UTM WGS84 33T: E 321398.253–N 4677945.623). This station is representative of one of the main waterways that supplies the Farfa river. It originates between Tommasella and Capannaccia and is also fed by the Fosso Venella in a north-east direction with respect to the “Le Capore” springs.

2.2. Sampling

We used an integrated approach to analyze the ecological quality of the river system (Figure 2).
The sampling surveys were performed in early Autumn 2022 in the period following the establishment of summer stratification due to the high temperatures reached on the surface [39]. We avoided sampling during the flood period, considering that, in the sections surveyed, the river became non-fordable, showing a flow rate incompatible for estimating ecological quality according to the STAR Intercalibration Common Metric index (STAR_ICMi, see later). Thus, invertebrate drift phenomena occur, altering the composition of a site’s macroinvertebrate community [40].
Aquatic macroinvertebrates were collected using a multihabitat approach and, for each station, 10 subsamples distributed in an area of 0.1 m2 were collected and then pooled into a single sample representative of the corresponding site (according to National Unification Body of European Normalization, UNI EN 16150:2013).
The collection of organisms was carried out with a Surber net according to the manufacturer’s standard parameters (UNI EN 28265:1995 and UNI EN 27828:1996, Water Framework Directive 2000/60/EC for the quantitative collection of benthic invertebrates). It has a square-shaped stainless-steel frame (0.32 × 0.32 m), defining an overall sampling area of 0.1 m2. The nylon net is 0.6 m long, and has a standard mesh size of 500 μm, anti-wear protection, and a 500 mL unscrewable opaque polyethylene collection bottle.
Sampling was performed from the most downstream point of the selected area toward the upstream areas in order to avoid altering the subsequently sampled microhabitats. During the operational steps, the Surber net was positioned with the metal sampling frame against the current, well-anchored to the bottom, in a site at a depth < 0.5 m, with medium and/or low current.
Each time, the collected material was placed in a 500 mL polyethylene collection bottle, and then screened in-field to remove any residues, plants, and/or non-interest coarse material, using 50 × 40 × 12 cm white plastic trays with ribbed bottoms and strainers with different meshes. Finally, the material was placed in uniquely labeled 50 mL sterile Falcon tubes, with 96% ethyl alcohol, and transported to the laboratory in dedicated cooler bags.

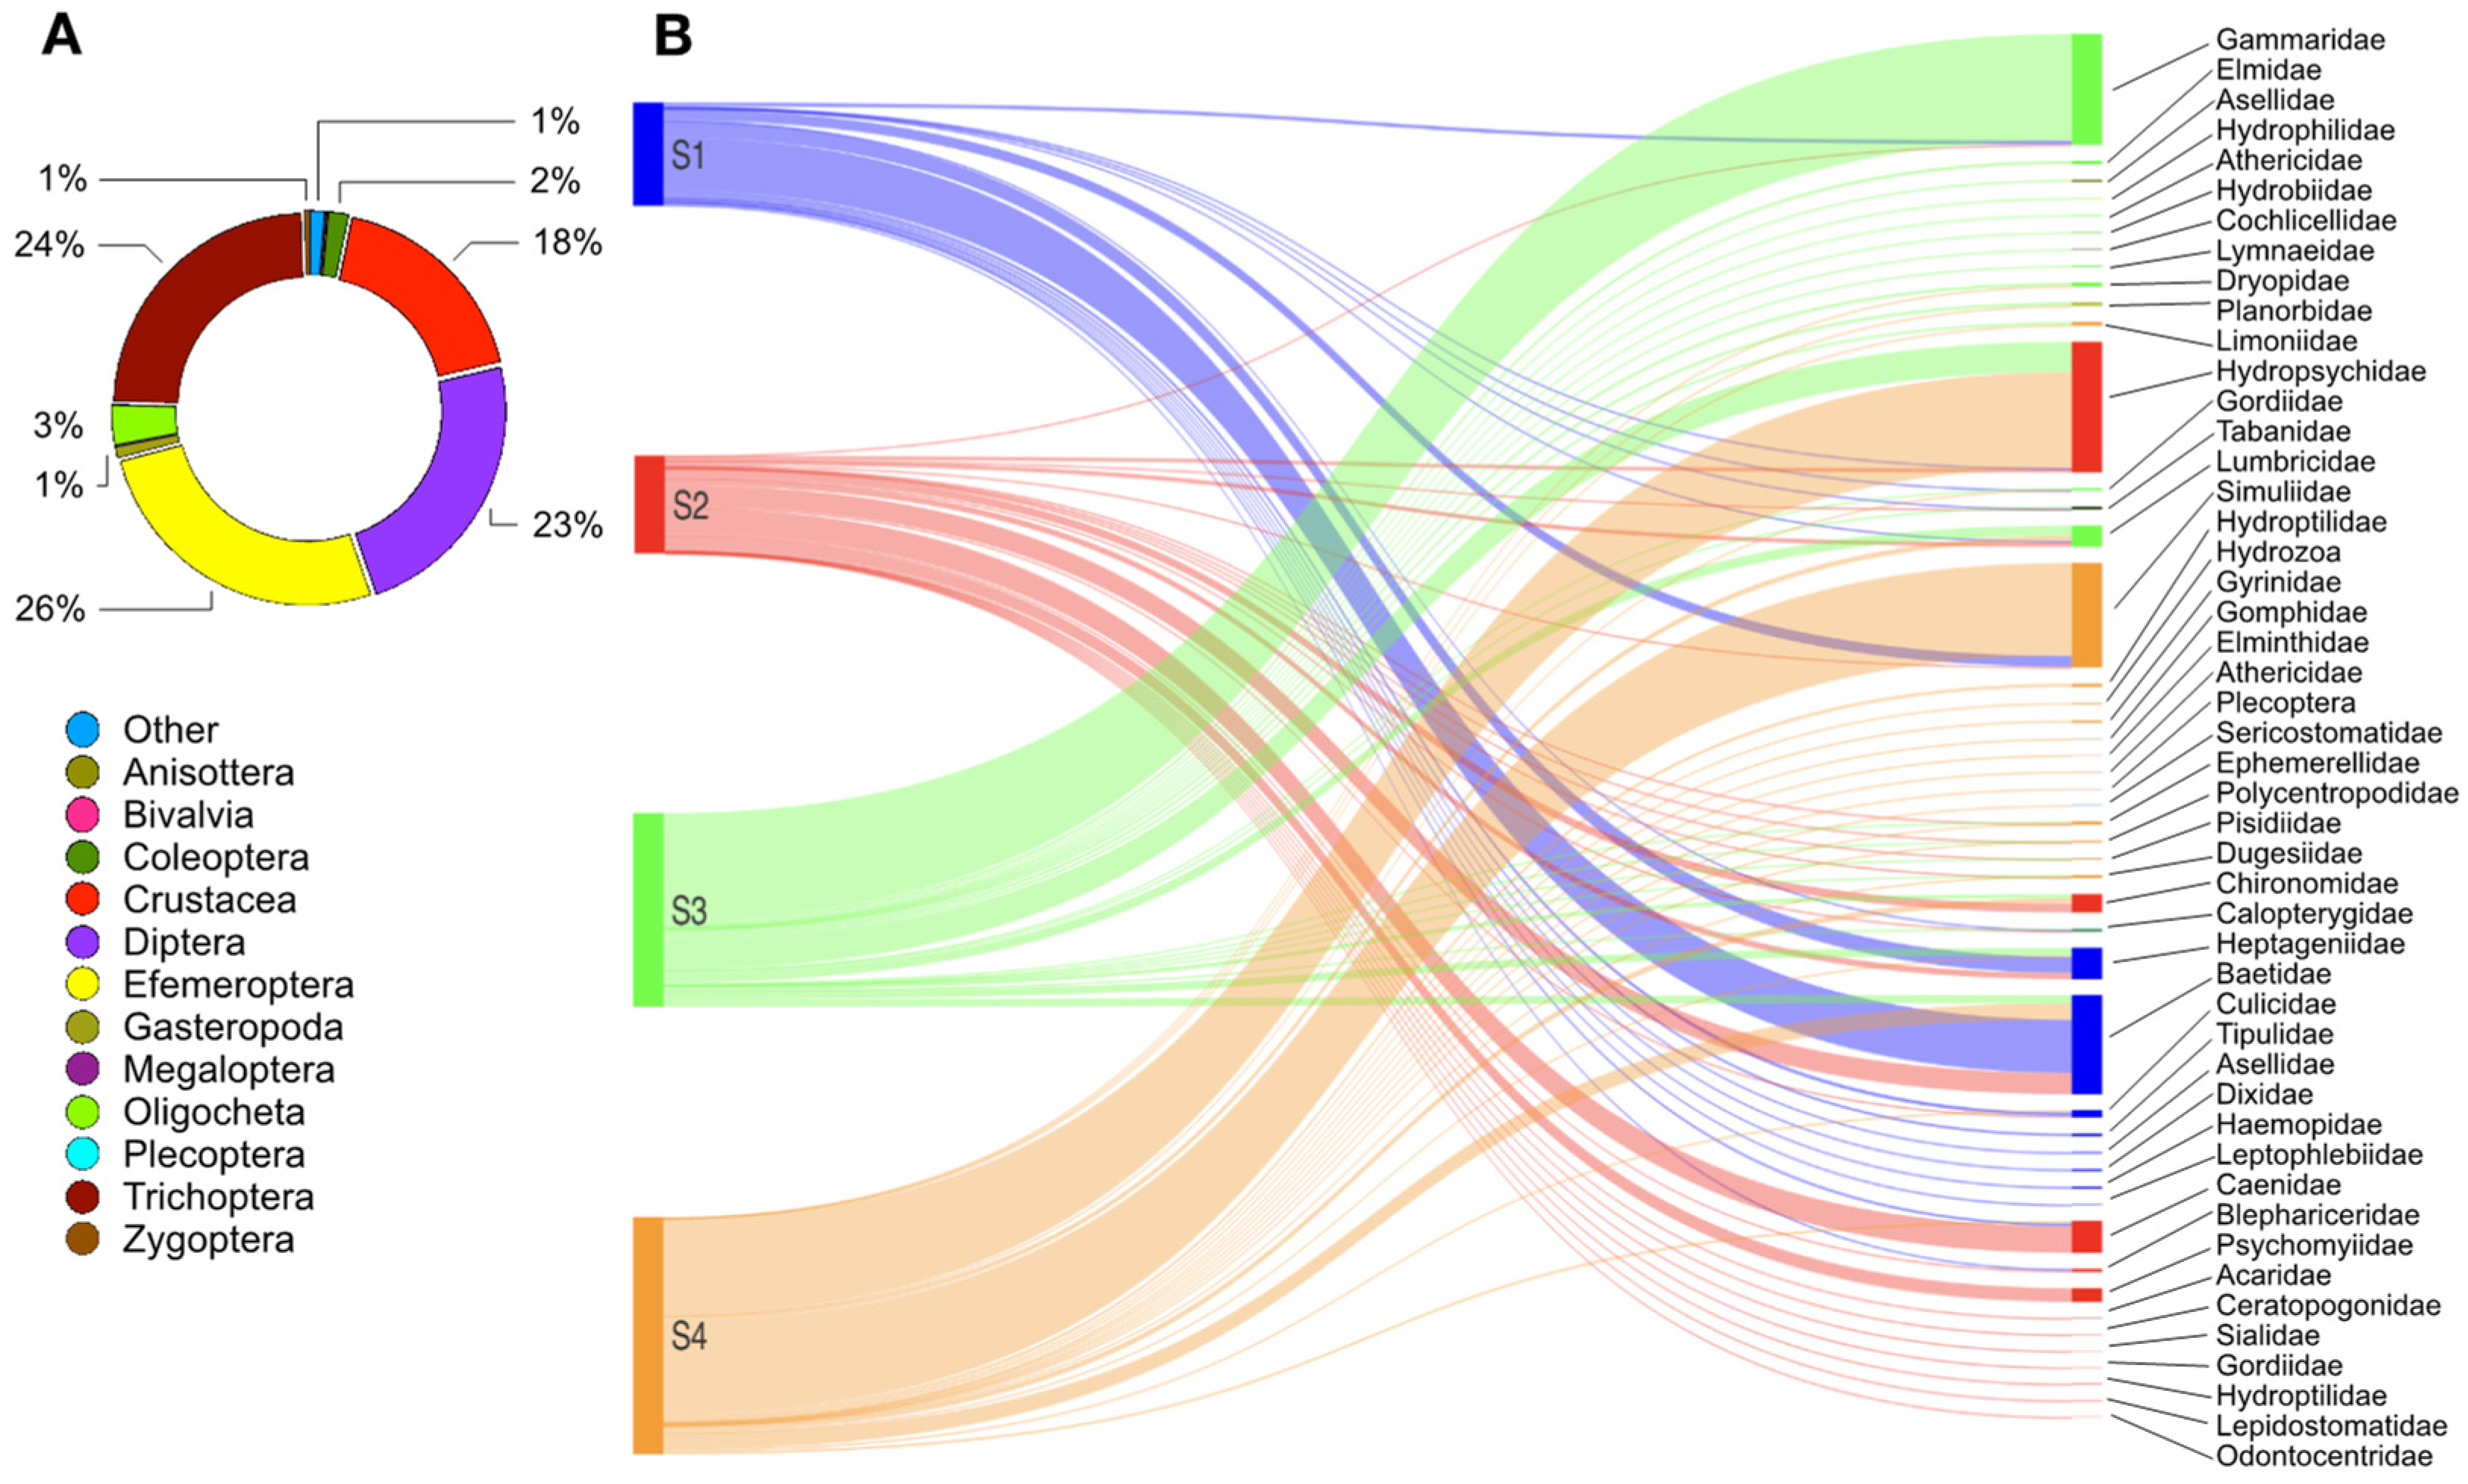
2.3. Taxonomic Identification of the Macrobenthos

Count and morphological identifications of the aquatic invertebrates at the family and/or genus level were based on the observation of distinctive characteristics of the taxon under a Leica EZ4 stereomicroscope and using reference manuals [41,42,43,44,45].

2.4. Ecological Quality Status Assessment

River quality assessment was performed according to the requirements of the Water Framework Directive (CEC 2000). The STAR Intercalibration Common Metric index (STAR_ICMi) [46,47] was used to assess the Ecological Quality Status (EQS) of the river course. This six-metric index includes different parameters of benthic communities, such as taxa sensitivity, abundance, and richness/diversity. Each metric has a specific weight, and they are normalized by comparison to previously established reference conditions (according to the DM 260/2010, Italy, Ministerial Decree 8 November 2010, n. 260) to obtain the Ecological Quality Ratio (EQR), ranging from zero to one, where zero represents the worst quality. Each EQR score contributes to the final characterized STAR_ICM index score. The EQS is defined by Ministerial Decree 260/2010 according to reference limits for high/good/sufficient/poor/bad classes.

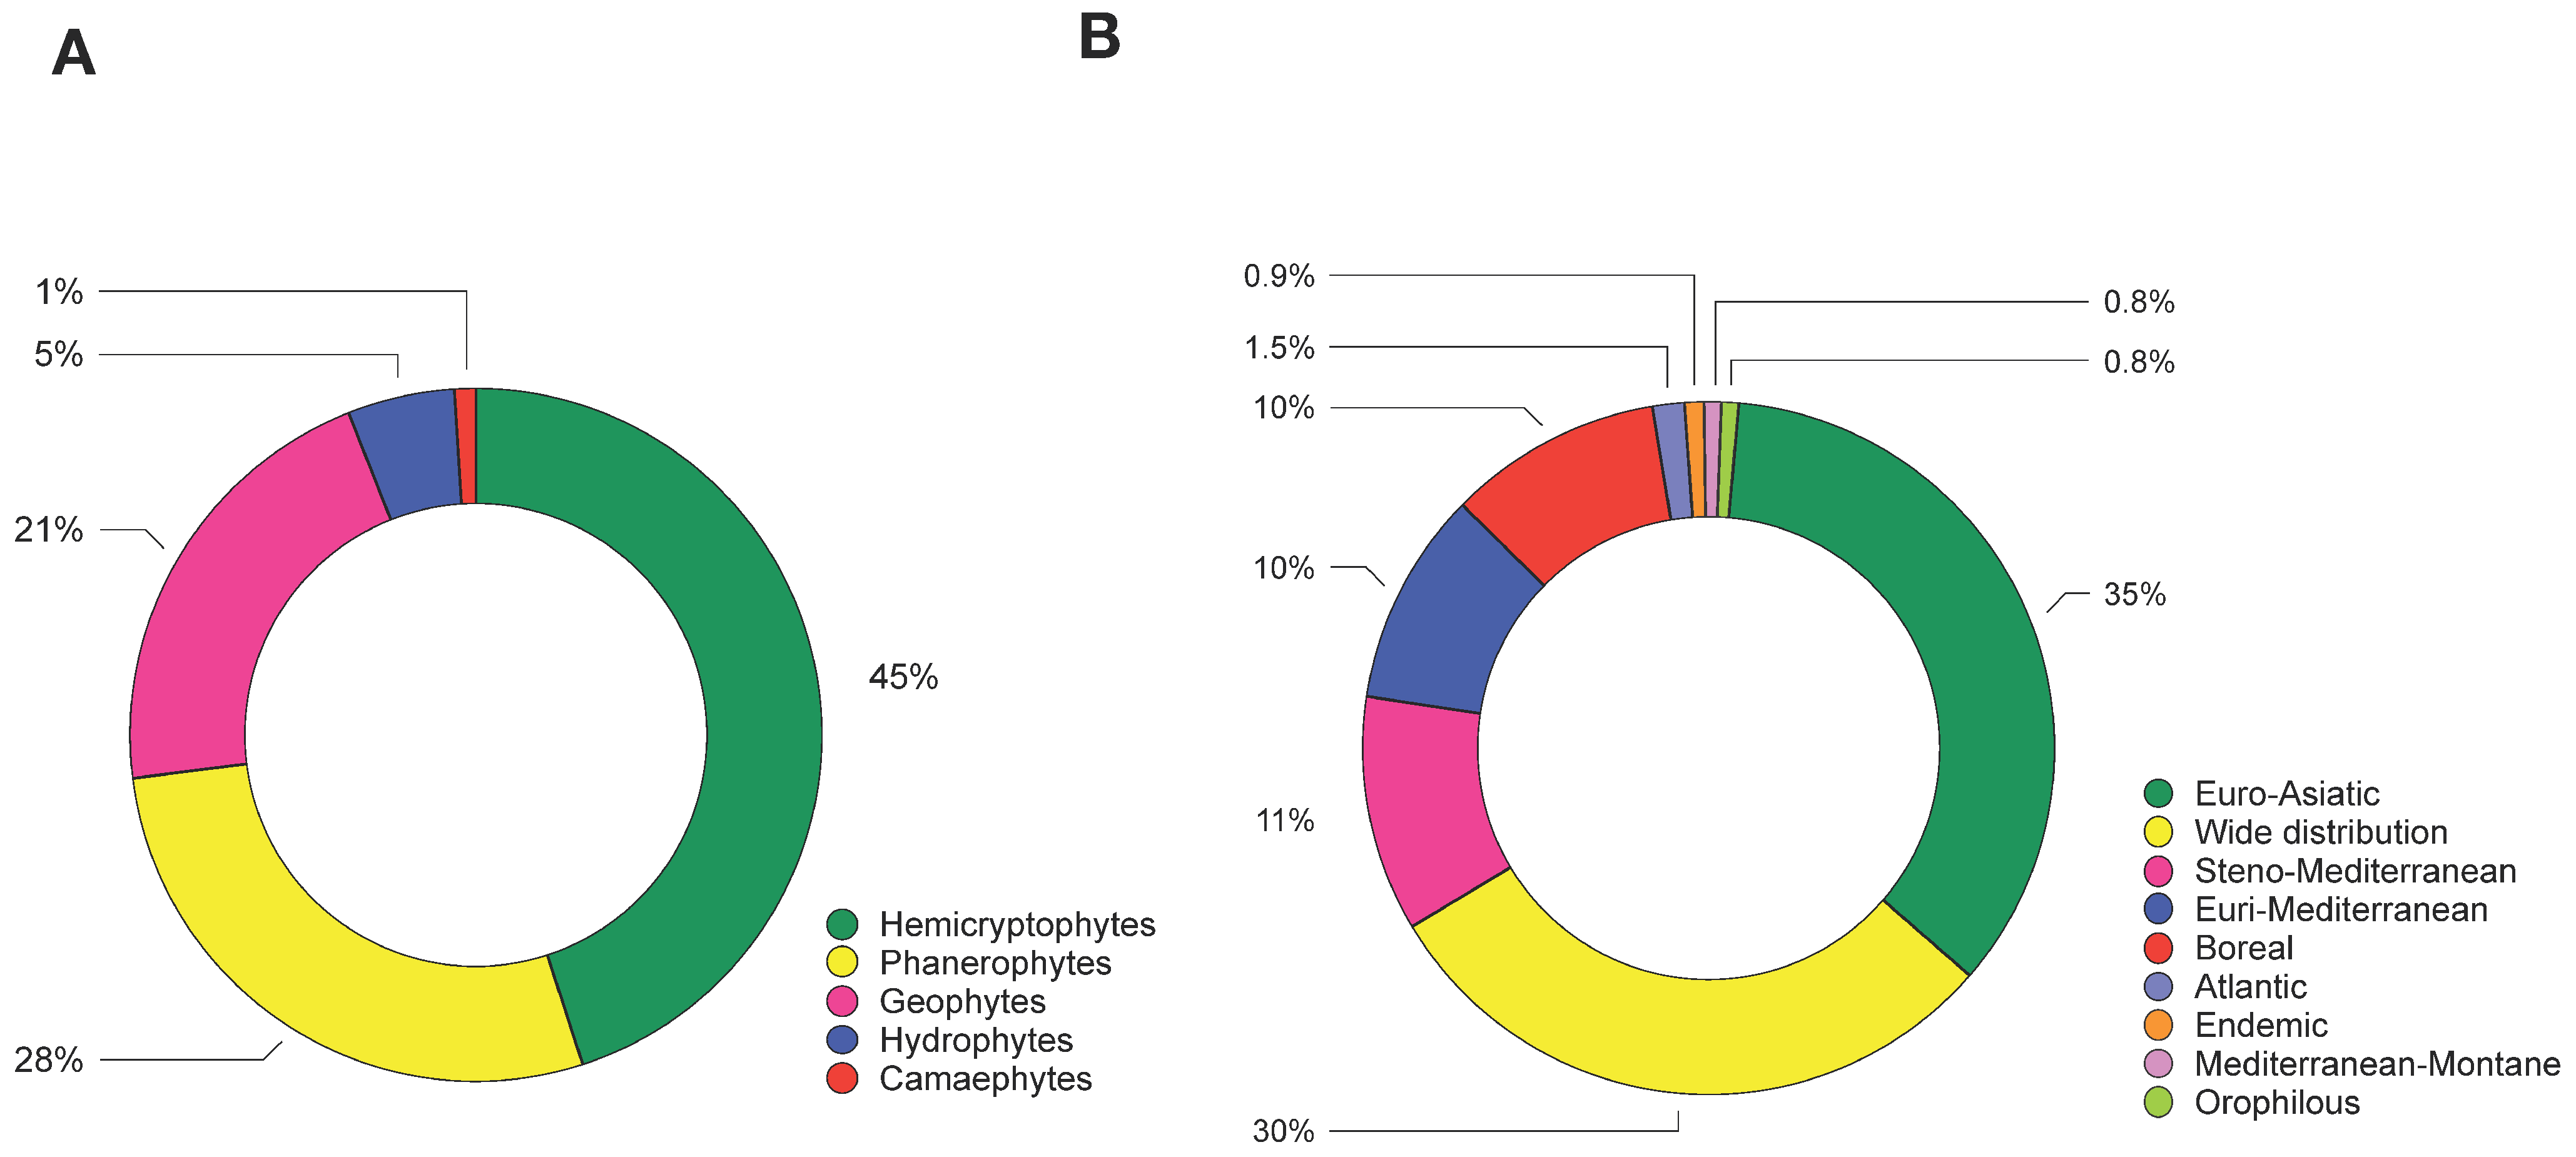
2.5. Flora and Vegetation Characterization

Botanical surveys to examine the patterning of flora and vegetation identified homogeneous units suitable for the development of plant communities, which were classifiable into physiognomic categories to capture variations in the ecosystem in different stretches of the watercourse. Since the river quality and its macrobenthic communities depend on characteristics of the watercourse and surroundings, our survey involved both riverbanks and the riverbed. Overall, 19 sampling plots were performed on the riverbanks (n = 10) as well as in the riverbed (n = 9) at four sample sites selected along the entire accessible stretch of the watercourse (Figure 1). The specimens were identified according to [48] and were then classified based on their growth habit using Raunkiaer’s life-forms system [49], as well as according to their chorotype [48].
The set of 19 surveys has been reorganized into two sub-matrices: riverbanks and riverbeds. All species with a frequency lower than four were eliminated from these matrices to avoid a “noise” effect. The resulting matrix was subjected to multivariate analysis (classification) using Jaccard dissimilarity for PCoA (Principal Coordinates Analysis), and hierarchical cluster analysis and complete linkage for UPGMA (unweighted pair group method with arithmetic mean) dendrograms. Data analysis and visualization were performed in the R environment for statistical computing [50], using the tidyverse package family [51] and vegan [52].

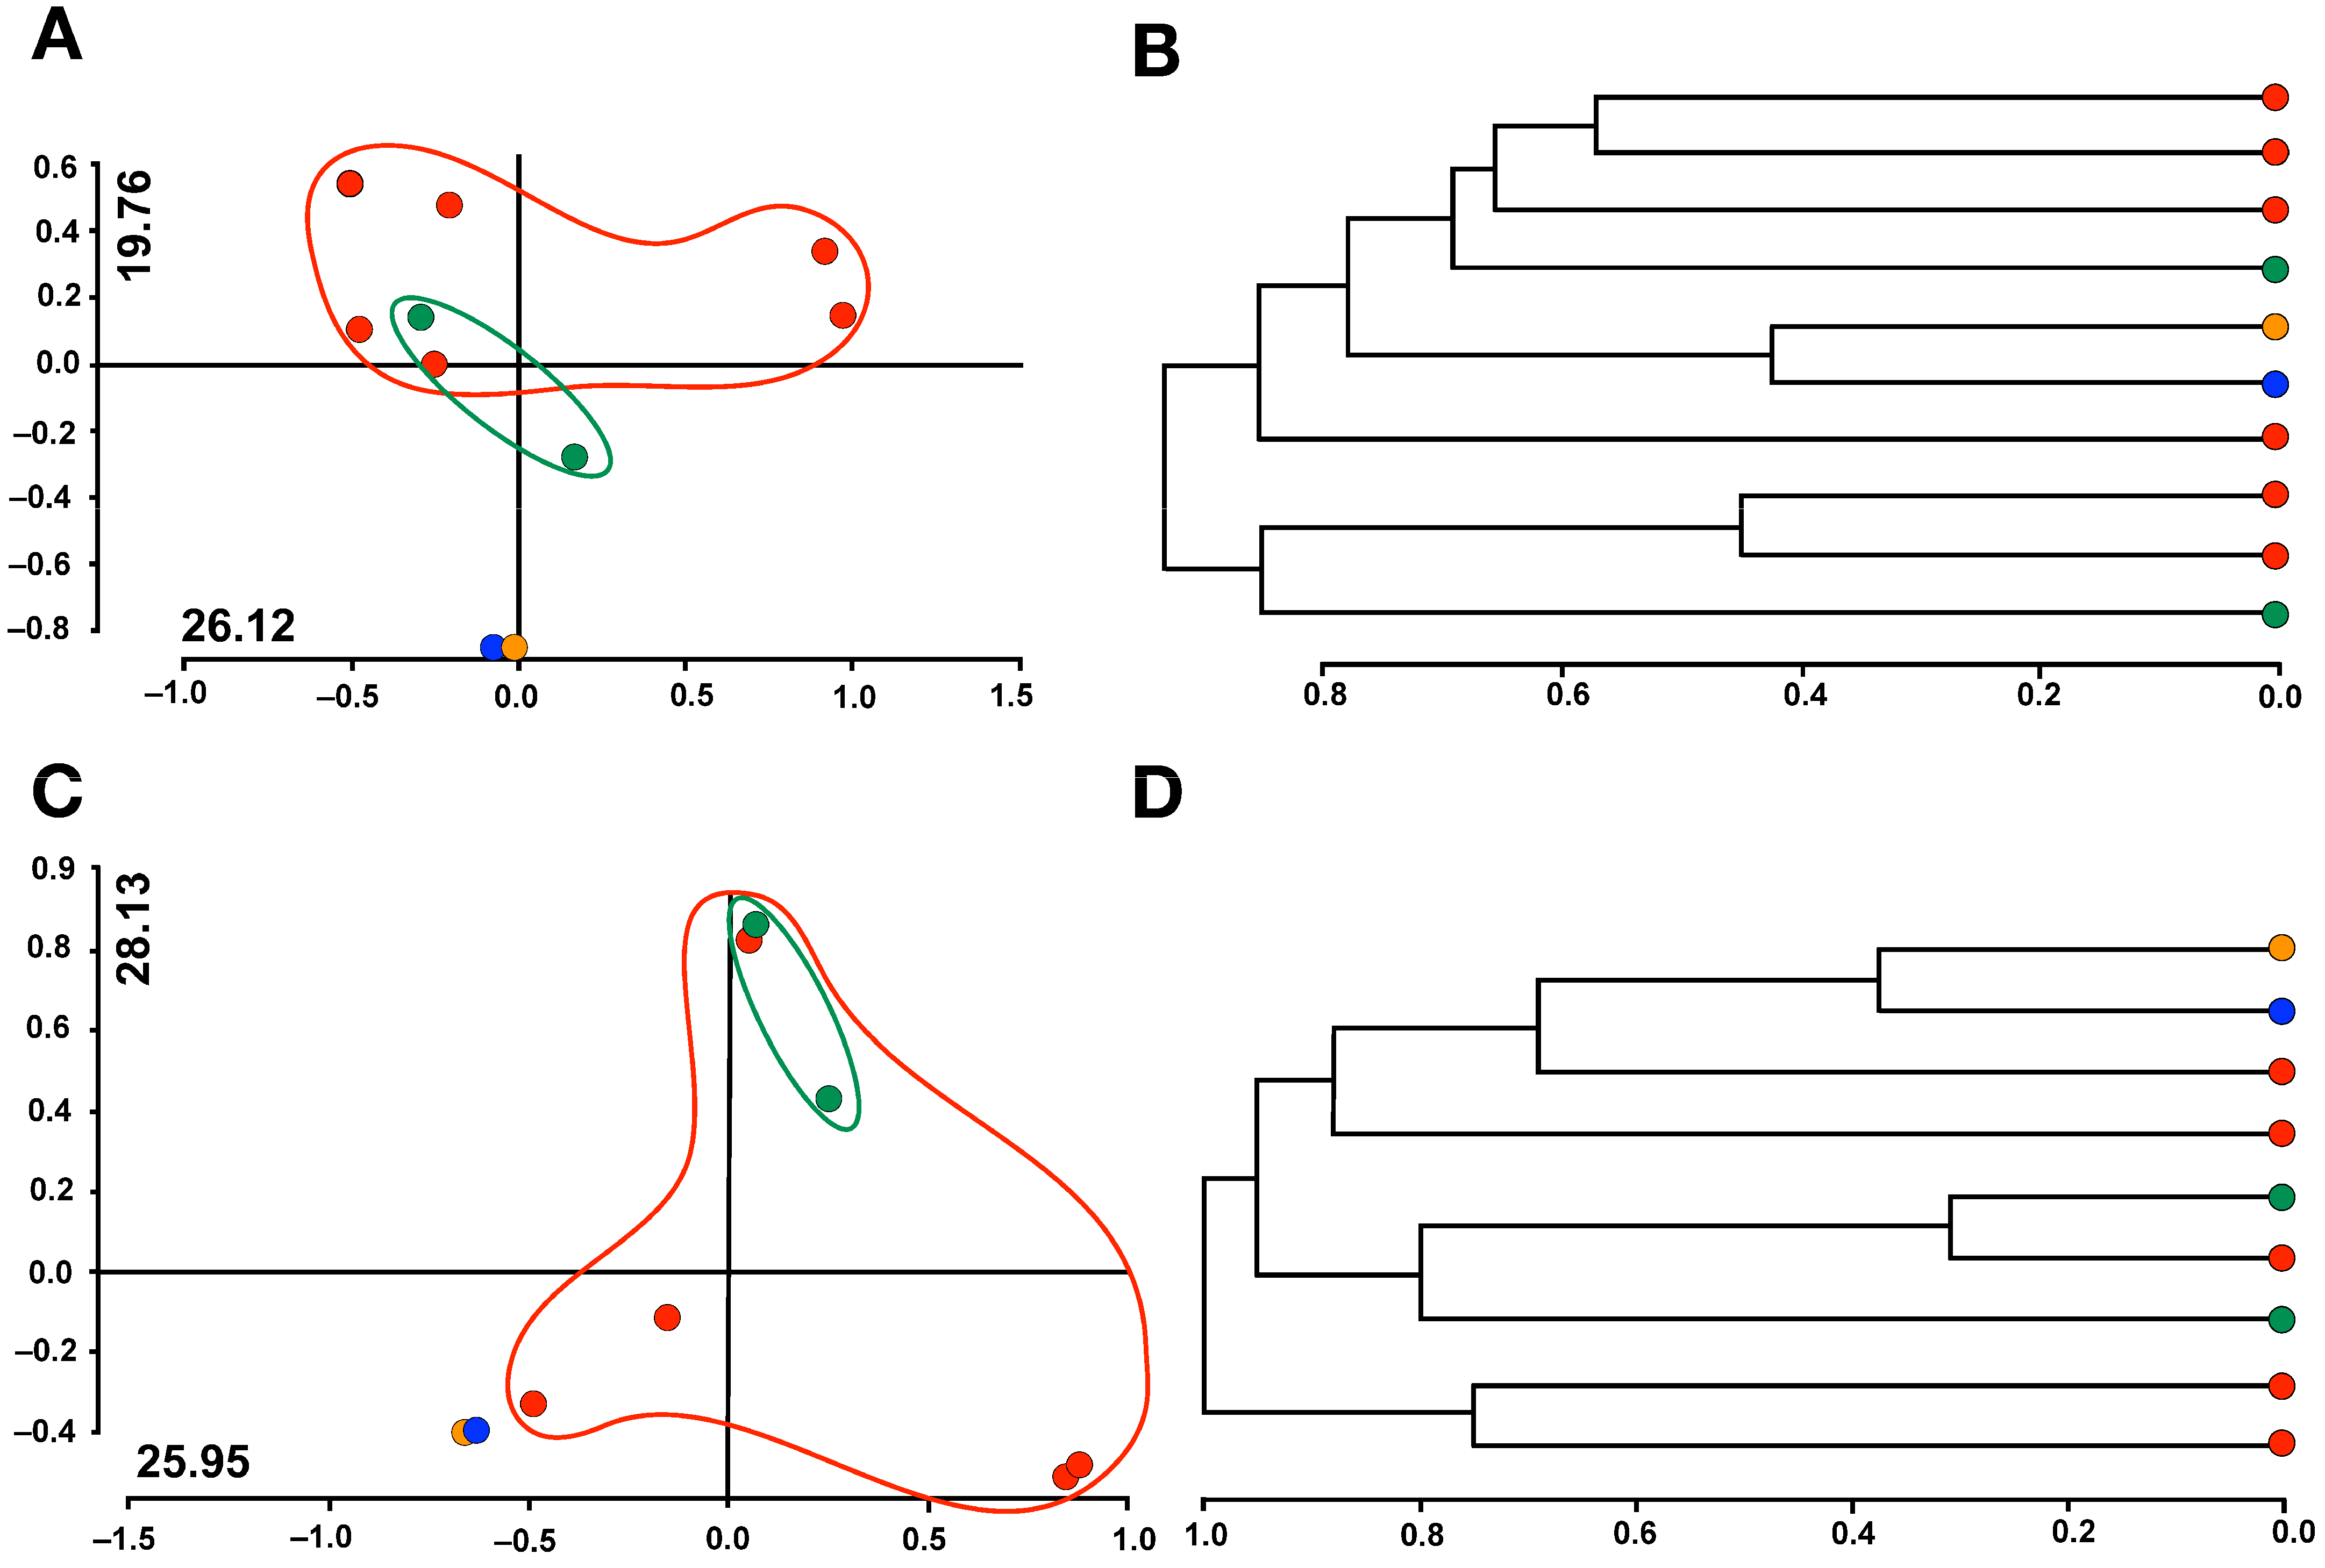
2.6. Correlation between Vegetation and Benthonic Macroinvertebrates

To evaluate the effect vegetation on macrobenthic assemblages, we performed a regression analysis using STAR_ICM index values as the descriptors of macrobenthic assemblages, and the average emerged portion of herbs, shrub coverage, herbaceous coverage, and average tree height as descriptors for riparian vegetation. The results were considered statistically significant with p < 0.05.

3. Results

3.1. Ecological Quality by Macrobenthos

Taxonomic identification of macrobenthos revealed 45 families. In all sampling stations, we identified macrobenthic families ascribable to predators, herbivores, and omnivores, such as Plecoptera (i.e., Perlidae and Perlodidae), Trichoptera (i.e., Odontoceridae, Hydropsychidae, and Goeridae), Ephemeroptera (i.e., Heptageniidae and Baetidae), Diptera (i.e., Limoniidae, Simuliidae, Tabanidae, and Chironomidi), Lumbricidae, Hirudinea, Coleoptera (i.e., Elmidae), crustaceans (i.e., Asellidae and Gammaridae), and Gastropoda (i.e., Lymnaeidae and Planorbidae). In general, the largest groups of the macrobenthic community were Ephemeroptera, Trichoptera, and Diptera, followed by Crustacea. However, the orders Bivalvia, Zygoptera, and Plecoptera were poorly represented (Figure 3A). The most ubiquitous taxa were Baetidae (Ephemeroptera) and Hydropsychidae (Trichoptera), which were present in all four stations with different percentages (Figure 3B). These families, together with Gammaridae, constitute the largest groups; in particular, Gammaridae reached the highest values at station S3 (Figure 3B). We also detected tolerant families such as Lumbricidae and Chironomidae, and polysaprobic invertebrates such as Simuliidae, particularly at station S4 (Figure 3B).
The Sankey diagram provides a direct indication of biological diversity, richness, and taxa sharing for each sampled station. The greatest richness value was recorded for S4, which was immediately downstream of an ichthyological breeding site, while the lowest value was for S1 at an urban wastewater discharge site. These two river branches, characterized by different benthic communities, flow into the stretch monitored by the S2 sampling site, which was downstream of a sport fishing lake and upstream of S3. Here, richness of the benthic community was low, although it was very diversified. Immediately downstream of S3, both richness and diversity increase (Figure 3B).
The ecological quality estimated by the STAR_ICM index was classified as “good” for all sampling stations (Table 1). In particular, stations S2 and S3, which were immediately upstream and downstream of the Le Capore springs collection system, have the highest STAR_ICM index values (0.81 and 0.77, respectively).

3.2. Characterization of Vegetation Pattern

The floristic inventory comprises 126 entities distributed across 55 families. The plant physiognomies are primarily associated with the presence of water, characterized by linear riparian communities tracing watercourses (Supplementary Table S3).
Riparian vegetation is predominantly represented by black and white poplar (Populus nigra and P. alba), white willow (Salix alba), black alder (Alnus glutinosa), and elderberry (Sambucus nigra). Additionally, less developed formations such as black locust (Robinia pseudoacacia) woods and areas dominated by herbaceous and shrubby plants were also observed. The structure of these communities appears stable and complex.
The PCoA of the ridgeback sites (Figure 4A) reveals that almost all of them are concentrated in the upper quadrants, except for sites 1 and 2, which exhibit compromised naturalness, as the riverbed is nearly dry except for a large wastewater discharge pipe on one side. Here, the vegetation consists of a mix of shrubs, such as bramble, elderberry, and wild rose, with remnants of an ancient forest of black poplar. Only at site number 4 were consortia of common reed (Arundo donax) and Arundo plinii detected.
Hemicryptophytes represent 45% of all species, followed by phanerophytes (28%), and geophytes (21%), with hydrophytes and chamaephytes showing lower values of 5% and 1%, respectively. Analysis of the chorological spectra shows the prevalence of Euroasiatic (35%) and Orophilous (34%) chorotypes, followed by steno-Mediterranean (10%), euri-Mediterranen (9%), and boreal (8%) chorotypes. All other species represent less than 5% all together (Figure 5).

3.3. Correlation between Riparian Vegetation and Macrobenthic Community

The relationship between the community of benthonic macroinvertebrates (STAR_ICM index) and the characteristics of riparian vegetation highlights a positive correlation with the emerged portion of herbs from the riverbed (p < 0.05, F = 50.855, df = 3) (Figure 6A). The STAR_ICM is instead negatively correlated with the height of the trees in the riparian forest (p < 0.001; F = 1275.57, df = 3) (Figure 6B). The percentages of herbaceous coverage (Figure 6C) and shrub coverage (Figure 6D) do not appear to be correlated with the macrobenthic community (p > 0.05).

4. Discussion

The Apennine river systems represent an extraordinary reservoir of biodiversity [53], and correct management for species and habitat conservation involves constant monitoring of quality conditions to prevent and mitigate the effects inevitably occurring on the landscape and its natural systems [54].
On the river stretch surveyed, we detected at least four anthropic impacts that affect, to different extents and ways, the Farfa river system and the surrounding environment. Although these activities have effects on animal and plant components, favoring or penalizing some taxa, the riverine system showed self-regenerative capacity in a few hundred meters, cushioning the impact and reshaping new and different levels of diversity, while keeping the quality of the water in a good status as indicated by the STAR_ICM index values. This was in accordance with the ISPRA Lazio classification for Farfa1 station (corresponding to S3 station in this study) of the regional network of monitoring (https://www.arpalazio.it/web/guest/ambiente/acqua/dati-acqua, accessed on 5 April 2022).
The resilience of the Farfa river system could be ascribable firstly to river flowing typology, facilitating river self-purification potential [55], the introduction of oxygen, and continuous organic material mixing [56]. However, the restoration and/or maintenance of the integrity of the aquatic animal community, mainly made up of the larval phases of epigean insects, also depends on the environment close to the riverbed, the strips of riparian forest, the reed thicket, and bank vegetation [33]. As a matter of fact, many authors highlight the importance of riparian vegetation in the restoration of Mediterranean streams, and how it is an important feature for the river benthic community. In our study system, it is interesting to note how vegetation in the riverbed is linked to high STAR_ICM values, probably as an effect of increased water turbulence, which in turn induces greater oxygenation and self-purification. In contrast, when the riparian forest contains tall trees, a negative correlation emerges with macrobenthic communities. This data could be interpreted in relation to the reduction of illumination and consequently of photosynthetic microalgae [57,58,59,60,61,62,63,64].
Furthermore, our results align with the findings of [61], stressing the key role of riparian vegetation in maintaining the physical and chemical stability of the water landscape, and how, for aquatic macroinvertebrates, riparian vegetation acts as an important source of allochthonous material, thereby impacting the food web of aquatic systems. Indeed, taxonomic identification of macrobenthos revealed a well-structured community characterized by taxa ascribable to all major trophic levels: predator, herbivore, and detritivore groups.
The plant communities represent linear forest formations with both obligate riparian guilds (i.e., willow, poplar, alder, etc.), and water-stress tolerant (i.e., Rubus, black locust, etc.) and deciduous competitive (ash, elderberry) plants following the watercourse. In addition to these, less developed consortia such as black locust woods and stations dominated by herbaceous and shrubby plants have been also observed.
The structure and successional development of riparian communities are highly influenced by fluvial factors and processes; indeed, several studies have reported clear relationships between riparian trait composition and water availability [65].
Numerous impacts of flow regulation and water level management on riparian communities have been documented globally [66,67,68], including vegetation encroachment, and changes in the composition and diversity of riparian vegetation [69,70,71]. Our vegetation survey highlighted an overall situation with little compromise in terms of floristic richness and diverse vegetation physiognomies, with few stations showing very good naturalistic conditions. Even near the underground disappearance of the Farfa river, along the banks, a mature woodland condition persists due to its ability to draw water deeply by its roots. The lack of open areas along almost the entire watercourse implies the scarcity of the giant read (A. donax).
Plants growing in the riverbed represent the characteristic herbaceous macrophyte formations of aquatic environments, entirely or partially submerged, such as hydrophytes (i.e., Berula erecta), rooted hydrophytes (i.e., Potamogeton pectinatus), and floating hydrophytes (i.e., Lemna minor). All these play a crucial role in the functioning of running waters, regulating water speed, nutrient concentrations, and ecological characteristics suitable for the presence of fishes and invertebrates [72].
Beyond a snapshot of the current state of the river landscape, we can speculate about its recent evolution by integrating present and past data. Indeed, considering the STAR-ICM index, Marcheggiani [8] and co-workers evaluated the overall ecological status of the Farfa river as “good”, analyzing a stretch downstream of the Le Capore plant; interestingly, at the Farfa01 sampling site (corresponding to our S3 station). After almost four years, our analyses agree with a good ecological status for the river areas investigated.
In summary, the integration of information from the past [8] and the current status of the Farfa river seems to suggest that the resurgence site and water abstraction are integrated into the river ecosystem and not affecting landscape integrity. Indeed, the successional and vegetation variations and the correlated animal communities mirrored a clinal gradient expected for an Apennine river system. However, long-term monitoring could provide a clearer picture of the changing ecological status of the river system and the factors underlying its potential resilience. These investigations could provide information to prevent any negative impacts with irreversible outcomes on biotic communities and the landscape.

5. Conclusions

Apennine freshwater systems are a biodiversity reservoir whose conservation requires management landscape efforts for species and habitats, which also aim at preventing and mitigating the impacts inevitably occurring by humans. In this respect, the characterization of biological communities (composition and abundance) is a standardized method to evaluate river system quality status and the impact on landscape integrity. However, current analysis rarely integrates characterization of benthic macroinvertebrate communities and riparian vegetation to explore ecological environmental conditions [36,37]. In our study, we showed how these biological indicators function in tandem. We also provided empirical data as a base for new methodologies that could be more broadly applicable across different types of water bodies. Consequently, our study has the potential to improve the approach used to monitor and preserve the ecological integrity of freshwater-related landscapes. Our analysis is placed in a time line of continuity for monitoring of the river system, representing an important database for future investigations. Indeed, long-term monitoring is necessary to check for potentially dangerous situations and to prevent negative impacts with irreversible outcomes on biotic communities and the environment.

Supplementary Materials

The following supporting information can be downloaded at https://www.mdpi.com/article/10.3390/land13071076/s1: Figure S1: Species count in each plant family; Table S1: Main characteristics of the sampled stations; Table S2: Distance (meters above sea level) between sampling stations; Table S3: Vegetation surveys [73].

Author Contributions

Conceptualization, D.F. and M.B.; data curation, E.R., D.F., G.d.F. and M.B.; formal analysis, E.R., G.d.F., A.D.N., V.P. and M.B.; funding acquisition, A.V.; investigation, E.R., D.F. and M.B.; methodology, D.F., G.d.F., A.D.N. and M.B.; resources, D.F.; supervision, D.F. and M.B.; writing—original draft, E.R., D.F., G.d.F. and M.B.; writing—review and editing, E.R., D.F., G.d.F., A.D.N., V.P., C.M., S.P. and M.B. All authors have read and agreed to the published version of the manuscript.

Funding

The research was funded through the agreement between ACEA ATO2 SpA and the Department of Biology, University of Naples Federico II.

Data Availability Statement

The original data presented in the study are included in the article and Supplementary Material. Further inquiries can be directed to the corresponding author.

Acknowledgments

The authors are grateful to ACEA ATO2 SpA for providing information about the managed water supply system.

Conflicts of Interest

The authors declare no conflicts of interest.

References

  1. Naiman, R.J.; Magnuson, J.J.; McKnight, D.M.; Stanford, J.A.; Karr, J.R. Freshwater Ecosystems and Their Management: A National Initiative. Science 1995, 270, 584–585. [Google Scholar] [CrossRef]
  2. Naiman, R.J.; Dudgeon, D. Global Alteration of Freshwaters: Influences on Human and Environmental Well-Being. Ecol. Res. 2011, 26, 865–873. [Google Scholar] [CrossRef]
  3. Department for Environment Food & Rural Affair. Managing Abstraction and the Water Environment; Welsh Government: London, UK, 2013; pp. 1–16. [Google Scholar]
  4. Lynch, A.J.; Cooke, S.J.; Arthington, A.H.; Baigun, C.; Bossenbroek, L.; Dickens, C.; Harrison, I.; Kimirei, I.; Langhans, S.D.; Murchie, K.J.; et al. People Need Freshwater Biodiversity. WIREs Water 2023, 10, e1633. [Google Scholar] [CrossRef]
  5. Loh, J.; Green, R.E.; Ricketts, T.; Lamoreux, J.; Jenkins, M.; Kapos, V.; Randers, J. The Living Planet Index: Using Species Population Time Series to Track Trends in Biodiversity. Phil. Trans. R. Soc. B 2005, 360, 289–295. [Google Scholar] [CrossRef] [PubMed]
  6. Butchart, S.; Dieme-Amting, E.; Gitay, H.; Raaijmakers, S.; Douglas, T. Ecosystems and Human Well-Being: Wetlands and Water Synthesis: A Report of the Millennium Ecosystem Assessment; Millennium Ecosystem Assessment (Program), Ed.; World Resources Institute: Washington, DC, USA, 2005; ISBN 978-1-56973-597-8. [Google Scholar]
  7. Arroita, M.; Flores, L.; Larrañaga, A.; Martínez, A.; Martínez-Santos, M.; Pereda, O.; Ruiz-Romera, E.; Solagaistua, L.; Elosegi, A. Water Abstraction Impacts Stream Ecosystem Functioning via Wetted-Channel Contraction. Freshw. Biol. 2017, 62, 243–257. [Google Scholar] [CrossRef]
  8. Mancini, L.; Marcheggiani, S.; Puccinelli, C.; Lacchetti, I.; Carere, M.; Bouley, T. Global Environmental Changes and the Impact on Ecosystems and Human Health. Energ. Ambiente Innov. 2017, 3, 98–105. [Google Scholar] [CrossRef]
  9. Buglione, M.; Petrelli, S.; Troiano, C.; Notomista, T.; Rivieccio, E.; Fulgione, D. The Diet of Otters (Lutra lutra) on the Agri River System, One of the Most Important Presence Sites in Italy: A Molecular Approach. PeerJ 2020, 8, e9606. [Google Scholar] [CrossRef] [PubMed]
  10. Filipe, A.F.; Feio, M.J.; Garcia-Raventós, A.; Ramião, J.P.; Pace, G.; Martins, F.M.; Magalhães, M.F. The European Water Framework Directive Facing Current Challenges: Recommendations for a More Efficient Biological Assessment of Inland Surface Waters. Inland Waters 2019, 9, 95–103. [Google Scholar] [CrossRef]
  11. Bruno, D.; Gutiérrez-Cánovas, C.; Sánchez-Fernández, D.; Velasco, J.; Nilsson, C. Impacts of Environmental Filters on Functional Redundancy in Riparian Vegetation. J. Appl. Ecol. 2016, 53, 846–855. [Google Scholar] [CrossRef]
  12. Capon, S.J.; Stewart-Koster, B.; Bunn, S.E. Future of Freshwater Ecosystems in a 1.5 °C Warmer World. Front. Environ. Sci. 2021, 9, 784642. [Google Scholar] [CrossRef]
  13. Rosenberg, R. Benthic Faunal Dynamics during Succession Following Pollution Abatement in a Swedish Estuary. Oikos 1976, 27, 414. [Google Scholar] [CrossRef]
  14. Snelgrove, P.V. The Importance of Marine Sediment Biodiversity in Ecosystem Processes. Ambio 1997, 28, 578–583. [Google Scholar]
  15. Ysebaert, T.; Herman, P. Spatial and Temporal Variation in Benthic Macrofauna and Relationships with Environmental Variables in an Estuarine, Intertidal Soft-Sediment Environment. Mar. Ecol. Prog. Ser. 2002, 244, 105–124. [Google Scholar] [CrossRef]
  16. Hawkins, C.P.; Murphy, M.L.; Anderson, N.H. Effects of Canopy, Substrate Composition, and Gradient on the Structure of Macroinvertebrate Communities in Cascade Range Streams of Oregon. Ecology 1982, 63, 1840. [Google Scholar] [CrossRef]
  17. Ormerod, S.J.; Donald, A.P.; Brown, S.J. The Influence of Plantation Forestry on the pH and Aluminium Concentration of Upland Welsh Streams: A Re-Examination. Environ. Pollut. 1989, 62, 47–62. [Google Scholar] [CrossRef] [PubMed]
  18. Rutt, G.P.; Weatherley, N.S.; Ormerod, S.J. Microhabitat Availability in Welsh Moorland and Forest Streams as a Determinant of Macroinvertebrate Distribution. Freshw. Biol. 1989, 22, 247–261. [Google Scholar] [CrossRef]
  19. Rundle, S.D.; Clare Lloyd, E.; Ormerod, S.J. The Effects of Riparian Management and Physicochemistry on Macroinvertebrate Feeding Guilds and Community Structure in Upland British Streams. Aquat. Conserv. 1992, 2, 309–324. [Google Scholar] [CrossRef]
  20. Ormerod, S.J.; Rundle, S.D.; Lloyd, E.C.; Douglas, A.A. The Influence of Riparian Management on the Habitat Structure and Macroinvertebrate Communities of Upland Streams Draining Plantation Forests. J. Appl. Ecol. 1993, 30, 13. [Google Scholar] [CrossRef]
  21. Borja, Á.; Dauer, D.M.; Grémare, A. The Importance of Setting Targets and Reference Conditions in Assessing Marine Ecosystem Quality. Ecol. Indic. 2012, 12, 1–7. [Google Scholar] [CrossRef]
  22. Cabral-Oliveira, J.; Mendes, S.; Maranhão, P.; Pardal, M.A. Effects of Sewage Pollution on the Structure of Rocky Shore Macroinvertebrate Assemblages. Hydrobiologia 2014, 726, 271–283. [Google Scholar] [CrossRef]
  23. Hynes, H.B.N. Symposium on water pollution: The use of invertebrates as indicators of river pollution. Proc. Linn. Soc. Lond. 1959, 170, 165–169. [Google Scholar] [CrossRef]
  24. Khatri, N.; Tyagi, S. Influences of Natural and Anthropogenic Factors on Surface and Groundwater Quality in Rural and Urban Areas. Front. Life Sci. 2015, 8, 23–39. [Google Scholar] [CrossRef]
  25. Tampo, L.; Kaboré, I.; Alhassan, E.H.; Ouéda, A.; Bawa, L.M.; Djaneye-Boundjou, G. Benthic Macroinvertebrates as Ecological Indicators: Their Sensitivity to the Water Quality and Human Disturbances in a Tropical River. Front. Water 2021, 3, 662765. [Google Scholar] [CrossRef]
  26. Dubois, G.; Girard, C.; Lapointe, F.-J.; Shapiro, B.J. The Inuit Gut Microbiome Is Dynamic over Time and Shaped by Traditional Foods. Microbiome 2017, 5, 151. [Google Scholar] [CrossRef] [PubMed]
  27. Howarth, W. Going with the Flow: Integrated Water Resources Management, the EU Water Framework Directive and Ecological Flows. Legal Stud. 2018, 38, 298–319. [Google Scholar] [CrossRef]
  28. González del Tánago, M.; García de Jalón, D. Attributes for Assessing the Environmental Quality of Riparian Zones. Limnética 2006, 25, 389–402. [Google Scholar] [CrossRef]
  29. Fogliata, P.; Cislaghi, A.; Sala, P.; Giupponi, L. An Ecological Analysis of the Riparian Vegetation for Improving the Riverine Ecosystem Management: The Case of Lombardy Region (North Italy). Landsc. Ecol. Eng. 2021, 17, 375–386. [Google Scholar] [CrossRef]
  30. Riis, T.; Kelly-Quinn, M.; Aguiar, F.C.; Manolaki, P.; Bruno, D.; Bejarano, M.D.; Clerici, N.; Fernandes, M.R.; Franco, J.C.; Pettit, N.; et al. Global Overview of Ecosystem Services Provided by Riparian Vegetation. BioScience 2020, 70, 501–514. [Google Scholar] [CrossRef]
  31. Macfarlane, W.W.; Gilbert, J.T.; Jensen, M.L.; Gilbert, J.D.; Hough-Snee, N.; McHugh, P.A.; Wheaton, J.M.; Bennett, S.N. Riparian Vegetation as an Indicator of Riparian Condition: Detecting Departures from Historic Condition across the North American West. J. Environ. Manag. 2017, 202, 447–460. [Google Scholar] [CrossRef]
  32. Królak, E.; Strzałek, M.; Korycińska, M. The Usefulness of Various Indices in the Assessment of Water Quality of a Lowland River. Ecohydrol. Hydrobiol. 2009, 9, 271–280. [Google Scholar] [CrossRef]
  33. Erba, S.; Cazzola, M.; Belfiore, C.; Buffagni, A. Macroinvertebrate Metrics Responses to Morphological Alteration in Italian Rivers. Hydrobiologia 2020, 847, 2169–2191. [Google Scholar] [CrossRef]
  34. Apollonio, C.; Petroselli, A.; Cornelini, P.; Manzari, V.; Preti, F.; Grimaldi, S. Riparian Vegetation as a Marker for Bankfull and Management Discharge Evaluation: The Case Study of Rio Torbido River Basin (Central Italy). J. Agric. Eng. 2021, 52, 1140. [Google Scholar] [CrossRef]
  35. García-Barreras, E.; Martínez-Fernández, V.; García De Jalón, D. Long-Term Macrobentos Responses to Environmental Flows and Water Quality Improvement along River Jarama. Ecohydrol. Hydrobiol. 2023, 23, 304–315. [Google Scholar] [CrossRef]
  36. Calabrese, S.; Mezzanotte, V.; Marazzi, F.; Canobbio, S.; Fornaroli, R. The Influence of Multiple Stressors on Macroinvertebrate Communities and Ecosystem Attributes in Northern Italy Pre-Alpine Rivers and Streams. Ecol. Indic. 2020, 115, 106408. [Google Scholar] [CrossRef]
  37. Aschonitis, V.G.; Feld, C.K.; Castaldelli, G.; Turin, P.; Visonà, E.; Fano, E.A. Environmental Stressor Gradients Hierarchically Regulate Macrozoobenthic Community Turnover in Lotic Systems of Northern Italy. Hydrobiologia 2016, 765, 131–147. [Google Scholar] [CrossRef]
  38. Ferranti, C.; Paolella, A. La Pianificazione del Bacino del Fiume Tevere 1992–2000; Autorità di bacino del Tevere, A., Ed.; Gangemi: Roma, Italy, 2001; ISBN 978-88-492-0166-6. [Google Scholar]
  39. Balzamo, S.; Martone, C. Metodi Biologici Per le Acque Superficiali Interne 2014; Manuali e Linee Guida 111/2014; Parte I.; ISPRA: Roma, Italy, 2014; ISBN 978-88-448-0651. [Google Scholar]
  40. Naman, S.M.; Rosenfeld, J.S.; Richardson, J.S. Causes and Consequences of Invertebrate Drift in Running Waters: From Individuals to Populations and Trophic Fluxes. Can. J. Fish. Aquat. Sci. 2016, 73, 1292–1305. [Google Scholar] [CrossRef]
  41. Ruffo, S. Guide per il Riconoscimento delle Specie Animali delle Acque Interne Italiane; CNR: Rome, Italy, 1977; ISBN 88-8080-061-2. [Google Scholar]
  42. Belfiore, C. Efemerotteri (Ephemeroptera). In Guide: Specie Animali delle Acque Interne Italiane; CNR: Verona, Italy, 1983; Volume 24. [Google Scholar]
  43. Campaioli, S.; Ghetti, P.F.; Minelli, A.; Ruffo, S. Manuale per il Riconoscimento dei Macroinvertebrati delle Acque Dolci Italiane; Museo di Storia Naturale di Trento: Trento, Italy, 1994; Volume 1, ISBN 0299600000002. [Google Scholar]
  44. Campaioli, S.; Ghetti, P.F.; Minelli, A.; Ruffo, S. Manuale per il Riconoscimento dei Macroinvertebrati delle Acque Dolci Italiane; Museo di Storia Naturale di Trento: Trento, Italy, 1999; Volume 2, ISBN 978-88-7702-089-5. [Google Scholar]
  45. Sansoni, G.; Ghetti, P.F. Atlante per il Riconoscimento dei Macroinvertebrati dei Corsi D’acqua Italiani, 5th ed.; APR&B, Provincia Autonoma di trento: Trento, Italy, 2005; ISBN 88-86602-29-4. [Google Scholar]
  46. Buffagni, A.; Erba, E.; Birk, S.; Cazzola, M.; Feld, C.; Ofenboeck, T.; Murray-Bligh, J.; Furse, M.; Clarke, R.; Hering, D.; et al. Towards European Inter-Calibration for the Water Framework Directive Procedures and Examples for Different River Types from the BC Project STAR; Istituto di Ricerca sulle Acque-CNR: Rome, Italy, 2005. [Google Scholar]
  47. Buffagni, A.; Belfiore, C. ICMeasy 1.2: A Software for the Intercalibration Common Metrics and Index Easy Calculation. User Guide. IRSA-CNR Not. Metod. Anal. 2007, 1, 101–114. [Google Scholar]
  48. Pignatti, S. Flora d’Italia. Volume 1, 2nd ed.; Edagricole: Milano, Italy, 2017; Volume 4, ISBN 978-88-506-5242-6. [Google Scholar]
  49. Raunkiær, C. Life Forms of Plants and Statistical Plant Geography; Facsimile Publisher: New Delhi, India, 2019; ISBN 978-93-333-9336-2. [Google Scholar]
  50. R CORE Team. A Language and Environment for Statistical Computing R Foundation for Statistical Computing. In Foundation for Statistical Computing; R CORE Team: Vienna, Austria, 2021. [Google Scholar]
  51. Wickham, H.; Averick, M.; Bryan, J.; Chang, W.; McGowan, L.; François, R.; Grolemund, G.; Hayes, A.; Henry, L.; Hester, J.; et al. Welcome to the Tidyverse. J. Open Source Softw. 2019, 4, 1686. [Google Scholar] [CrossRef]
  52. Oksanen, J.; Simpson, G.L.; Blanchet, F.G.; Kindt, R.; Legendre, P.; Minchin, P.R.; O’Hara, R.B.; Solymos, P.; Stevens, M.H.H.; Szoecs, E.; et al. Vegan: Community Ecology Package 2021, 2.6-6.1. Available online: https://cran.r-project.org/web/packages/vegan/vegan.pdf (accessed on 4 May 2023).
  53. Gumiero, B.; Maiolini, B.; Comiti, F.; Moroni, F. The Italian Rivers. In Rivers of Europe; Elsevier: Amsterdam, The Netherlands, 2022; pp. 657–685. ISBN 978-0-08-102612-0. [Google Scholar]
  54. Stephenson, P.J.; Londoño-Murcia, M.C.; Borges, P.A.V.; Claassens, L.; Frisch-Nwakanma, H.; Ling, N.; McMullan-Fisher, S.; Meeuwig, J.J.; Unter, K.M.M.; Walls, J.L.; et al. Measuring the Impact of Conservation: The Growing Importance of Monitoring Fauna, Flora and Funga. Diversity 2022, 14, 824. [Google Scholar] [CrossRef]
  55. Ifabiyi, I.P. Self Purification of a Freshwater Stream in Ile-Ife: Lessons for Water Management. J. Hum. Ecol. 2008, 24, 131–137. [Google Scholar] [CrossRef]
  56. Nugraha, W.D.; Sarminingsih, A.; Alfisya, B. The Study of Self Purification Capacity Based on Biological Oxygen Demand (BOD) and Dissolved Oxygen (DO) Parameters. IOP Conf. Ser. Earth Environ. Sci. 2020, 448, 012105. [Google Scholar] [CrossRef]
  57. Buffagni, A.; Tenchini, R.; Cazzola, M.; Erba, S.; Balestrini, R.; Belfiore, C.; Pagnotta, R. Detecting the Impact of Bank and Channel Modification on Invertebrate Communities in Mediterranean Temporary Streams (Sardinia, SW Italy). Sci. Total Environ. 2016, 565, 1138–1150. [Google Scholar] [CrossRef] [PubMed]
  58. Hasselquist, E.; Polvi, L.; Kahlert, M.; Nilsson, C.; Sandberg, L.; McKie, B. Contrasting Responses among Aquatic Organism Groups to Changes in Geomorphic Complexity Along a Gradient of Stream Habitat Restoration: Implications for Restoration Planning and Assessment. Water 2018, 10, 1465. [Google Scholar] [CrossRef]
  59. Rios, S.L.; Bailey, R.C. Relationship between Riparian Vegetation and Stream Benthic Communities at Three Spatial Scales. Hydrobiologia 2006, 553, 153–160. [Google Scholar] [CrossRef]
  60. Fierro, P.; Bertrán, C.; Tapia, J.; Hauenstein, E.; Peña-Cortés, F.; Vergara, C.; Cerna, C.; Vargas-Chacoff, L. Effects of Local Land-Use on Riparian Vegetation, Water Quality, and the Functional Organization of Macroinvertebrate Assemblages. Science of The Total Environment 2017, 609, 724–734. [Google Scholar] [CrossRef]
  61. Ono, E.R.; Manoel, P.S.; Melo, A.L.U.; Uieda, V.S. Effects of Riparian Vegetation Removal on the Functional Feeding Group Structure of Benthic Macroinvertebrate Assemblages. Community Ecol. 2020, 21, 145–157. [Google Scholar] [CrossRef]
  62. Palt, M.; Hering, D.; Kail, J. Context-specific Positive Effects of Woody Riparian Vegetation on Aquatic Invertebrates in Rural and Urban Landscapes. J. Appl. Ecol. 2023, 60, 1010–1021. [Google Scholar] [CrossRef]
  63. Alcaraz-Hernández, J.D.; Sánchez-Hernández, J.; Muñoz-Mas, R.; Martínez-Capel, F. Drivers of Macroinvertebrate Communities in Mediterranean Rivers: A Mesohabitat Approach. Sustainability 2024, 16, 3075. [Google Scholar] [CrossRef]
  64. Dos Santos, C.; Simeone, D.; Beasley, C.R. Lower Diversity in Benthic Macrofaunal Assemblages Associated with Increasing Riparian Deforestation in First-Order Lowland Tropical Streams. Stud. Neotrop. Fauna Environ. 2024, 1–15. [Google Scholar] [CrossRef]
  65. Aguiar, F.C.; Segurado, P.; Martins, M.J.; Bejarano, M.D.; Nilsson, C.; Portela, M.M.; Merritt, D.M. The Abundance and Distribution of Guilds of Riparian Woody Plants Change in Response to Land Use and Flow Regulation. J. Appl. Ecol. 2018, 55, 2227–2240. [Google Scholar] [CrossRef]
  66. Nilsson, C.; Berggren, K. Alterations of Riparian Ecosystems Caused by River Regulation. BioScience 2000, 50, 783. [Google Scholar] [CrossRef]
  67. Greet, J.; Cousens, R.D.; Webb, J.A. Flow Regulation Affects Temporal Patterns of Riverine Plant Seed Dispersal: Potential Implications for Plant Recruitment. Freshw. Biol. 2012, 57, 2568–2579. [Google Scholar] [CrossRef]
  68. Johnson, S.E.; Waller, D.M. Influence of Dam Regulation on 55-Year Canopy Shifts in Riparian Forests. Can. J. For. Res. 2013, 43, 159–170. [Google Scholar] [CrossRef]
  69. Rood, S.B.; Braatne, J.H.; Goater, L.A. Favorable Fragmentation: River Reservoirs Can Impede Downstream Expansion of Riparian Weeds. Ecol. Appl. 2010, 20, 1664–1677. [Google Scholar] [CrossRef] [PubMed]
  70. Bejarano, M.D.; Sordo-Ward, Á. Riparian Woodland Encroachment Following Flow Regulation: A Comparative Study of Mediterranean and Boreal Streams. Knowl. Manag. Aquat. Ecosyst. 2011, 402, 20. [Google Scholar] [CrossRef]
  71. Webb, J.A.; Padgham, M. How Does Network Structure and Complexity in River Systems Affect Population Abundance and Persistence? Limnologica 2013, 43, 399–403. [Google Scholar] [CrossRef]
  72. Sand-Jensen, K.; Jeppesen, E.; Nielsen, K.; Van Der Bijl, L.; Hjermind, L.; Nielsen, L.W.; Ivlrsln, T.M. Growth of Macrophytes and Ecosystem Consequences in a Lowland Danish Stream. Freshw. Biol. 1989, 22, 15–32. [Google Scholar] [CrossRef]
  73. Westhoff, V.; Van Der Maarel, E. The Braun-Blanquet Approach. In Classification of Plant Communities; Whittaker, R.H., Ed.; Springer: Dordrecht, The Netherlands, 1978; pp. 287–399. ISBN 978-90-6193-566-7. [Google Scholar]
Figure 1. Study area. Red square: location of the Farfa River (central Italy). Sampling stations are indicated by red spots (1–4). Areas representative of anthropogenic pressures are highlighted by white-dotted squares (AD). The blue arrow indicates the flowing river direction.
Land 13 01076 g001
Figure 2. Diagram of the methodology used to analyze the ecological quality of the river system at sampling stations (S1–S4).
Land 13 01076 g002
Figure 3. Quantitative and qualitative analysis of the macrobenthic community. (A) Relative percentage of macroinvertebrate orders for the investigated river stretch. Other includes Acaridae (Acarina), Hydrozoa (Cnidaria), Goriidae (Nematoda), Dugesiadae (Platyhelminthes), and Haemopidae (Hirudinea). (B) Sankey diagram representing macroinvertebrate taxa per sampling station (S1–S4). The size of the bands (right) is proportional to the abundance of a given taxon in the site (left).
Land 13 01076 g003
Figure 4. Two-dimensional PCoA plot showing the separation of the vegetation at surveyed sites, and a UPGMA tree for a riverbank (A,B), respectively) and for the riverbed (C,D), respectively. Colored spots represent surveyed sites: S1, blue; S2, red; S3, green; S4, orange.
Land 13 01076 g004
Figure 5. Quantitative and qualitative analysis of the plant community. (A) Percentages of life forms and (B) chorological types in the study area.
Land 13 01076 g005
Figure 6. Relationship between macrobenthic communities (STAR_ICM) and riparian vegetation at the four sampling stations (black spots): (A) average emerged portion of herbs (cm); R2 = 0.9621, p = 0.0191, F = 50.855, df = 3; (B) average tree height (m); R2 = 0.998, p = 0.0007, F = 1275.57, df = 3; (C) herbaceous coverage (%); R2 = 0.5025, p = 0.2910, F = 2.0205, df = 3; and (D) shrub coverage (%), R2 = 0.3101, p = 0.443, F = 0.8992, df = 3; scatterplots indicated by regression line.
Land 13 01076 g006
Table 1. EQR (Ecological Quality Report) values for each station. Ecological quality scale: high = EQR ≥ 0.95; good = 0.71 ≤ EQR < 0.95; moderate = 0.48 ≤ EQR < 0.71; scarce = 0.24 ≤ EQR < 0.48; bad = EQR < 0.24.
Station
1234
ASTP (EQR)0.780.880.830.83
N_EPT (EQR)0.410.830.500.75
Log (SelEPTD + 1) (EQR)0.810.650.630.50
1-GOLD (EQR)0.971.000.920.66
Shannon–Weiner (EQR)0.760.961.020.66
STAR_ICM normalised0.740.810.770.69
Ecological qualitygoodgoodgoodgood
Disclaimer/Publisher’s Note: The statements, opinions and data contained in all publications are solely those of the individual author(s) and contributor(s) and not of MDPI and/or the editor(s). MDPI and/or the editor(s) disclaim responsibility for any injury to people or property resulting from any ideas, methods, instructions or products referred to in the content.

