Article

Evaluation of the Coupling Coordination and Sustainable Development of Water–Energy–Land–Food System on a 40-Year Scale: A Case Study of Hebei, China

by
Huanyu Chang
1,2,
Bing Zhang
3,*,
Jingyan Han
2,4,
Yong Zhao
2,
Yongqiang Cao
1,
Jiaqi Yao
1 and
Linrui Shi
2
1
Academy of Eco-Civilization Development for Jing-Jin-Ji Megalopolis, Tianjin Normal University, Tianjin 300387, China
2
State Key Laboratory of Simulation and Regulation of Water Cycle in River Basin, China Institute of Water Resources and Hydropower Research (IWHR), Beijing 100038, China
3
Tianjin Key Laboratory of Water Resources and Environment, Tianjin Normal University, Tianjin 300387, China
4
College of Water Conservancy Engineering, Tianjin Agricultural University, Tianjin 300384, China
*
Author to whom correspondence should be addressed.
Land 2024, 13(7), 1089; https://doi.org/10.3390/land13071089 (registering DOI)
Submission received: 9 June 2024 / Revised: 10 July 2024 / Accepted: 16 July 2024 / Published: 19 July 2024
(This article belongs to the Section Water, Energy, Land and Food (WELF) Nexus)

Abstract

:
Driven by economic expansion, urbanization, and population growth, the world is witnessing an escalating demand for water, energy, land, and food, posing substantial threats to the sustainable development of societies and economies. Given the intricate interdependencies inherent within the water–energy–land–food (WELF) system, it is imperative to conduct comprehensive assessments of the coupling coordination and sustainable development of the WELF system over long time scales and diverse characteristic dimensions. This study selects Hebei province, China, as the research region, constructing a comprehensive indicator system spanning from 1980 to 2020 using three dimensions: reliability (Rel), robustness (Rob), and equilibrium (Equ). The degree of coupling coordination (DCC) and sustainable development index (SDI) were developed using the comprehensive evaluation index and coupling coordination degree model. Additionally, the obstacle degree model and gray relational degree model were employed to assess the indicators that hinder or promote the SDI. The results indicate that: (1) The DCC (range of 0–1, bigger the better) of the WELF system increased from 0.65 to 0.75 between 1980 and 1998, then fluctuated between 0.75 and 0.69, stabilizing at a moderate level of coordinated development after 2015. (2) For the WELF system in Hebei, as Rel increased, Rob decreased, and Equ increased; similarly, as Rob increased, Equ also increased. (3) The SDI (range of 0–1, bigger the better) rose from 0.45 in 1980, initially increased, then decreased, and eventually stabilized. After 2014, it experienced rapid growth, reaching 0.54 by 2020, indicating an improvement in sustainable development capability. (4) Indicators related to the Equ dimension and the land subsystem were more critical limiting factors for SDI development, while indicators related to the Rel dimension and the food subsystem were more significant contributors to SDI development. These findings offer a scientific foundation and practical insights for Hebei and comparable regions, aiding in the resolution of resource conflicts, optimization of resource allocation, and enhancement of regional sustainable development.

1. Introduction

Water, energy, land, and food are fundamental material requirements for sustaining human life and supporting economic and social development. With the continuous growth of the global population, accelerated urbanization, rapid economic and social development, and the impacts of climate change, the future demand for water, energy, land, and food will increase significantly [1,2]. Based on the SSP2 (“middle-of-the-road” Shared Socio-Economic Pathway) scenario, global water demand is projected to increase by approximately 50%, energy demand by around 92%, agricultural land demand by about 5%, and food demand by 74% [3,4,5,6]. This surge in demand will place immense pressure on natural resources, therefore threatening global water security, energy security, and food security. Simultaneously, the United Nations’ 2030 Agenda for Sustainable Development outlines 17 Sustainable Development Goals (SDGs) [7], including No Poverty (SDG 1), Zero Hunger (SDG 2), Clean Water and Sanitation (SDG 6), Affordable and Clean Energy (SDG 7), and Sustainable Cities and Communities (SDG 11). These goals are closely interconnected with the water–energy–land–food (WELF) system. Therefore, understanding and optimizing the WELF system is not only an effective approach to addressing the risks to food, energy, and water security arising from resource competition but also crucial for exploring synergistic management mechanisms within the WELF system, and this is key to achieving the United Nations’ SDGs and fostering sustainable regional economic and social development.
Water, energy, land, and food systems are interdependent and interact with each other, forming a complex coupled system, often referred to as the WELF nexus. Each system cannot be considered in isolation, as changes in one will invariably impact at least one of the other sectors [8,9,10]. Specifically, land serves as the foundation for the water, energy, and food subsystems, and changes in land use directly affect natural runoff processes. Simultaneously, the water cycle can lead to effects such as soil erosion and sediment deposition [11]. Diverse land-use covers and elevations will influence the construction and efficiency of clean energy such as solar and wind power. Meanwhile, the development of fossil fuels like coal will have detrimental effects on land [12,13,14]. Land degradation and restoration will directly impact food production, while the expansion of food cultivation leads to the conversion of non-agricultural land into arable land. In addition, there are also interactions between water and food, water and energy, as well as food and energy subsystems. For instance, water and energy are required for food production and irrigation, hydropower generates energy, and water extraction consumes energy. Moreover, food can serve as biomass energy to supplement energy resources. The specific relationships within the WELF system are illustrated in Figure 1.
The nexus of water, energy, land, and food has become a research hotspot in the field of sustainable development. This interest surged, particularly regarding the water–energy–food nexus, after it was introduced at the Bonn Conference in 2011 [15]. Since then, related research has rapidly advanced and has been widely applied across various countries and regions worldwide [16,17,18,19,20,21]. As research on the water–energy–food nexus deepened, land as a critical subsystem has garnered increasing attention. In 2012, the European Commission released the report “Confronting Scarcity: Managing Water, Energy and Land for Inclusive and Sustainable Growth” [22]. In 2012, the Chinese government proposed the construction of an ecological civilization, advocating for the intensive use and conservation of resources such as water, land, and energy, therefore promoting green development [23,24]. In the 2014 United Nations Secretary-General’s High-level Panel on Global Sustainability, a dedicated section discussed the “climate–land–energy–water–development nexus [25]”. In the same year, the World Business Council for Sustainable Development conducted various activities addressing the water–energy–land–food nexus [8]. Additionally, the European Union’s Horizon 2020 project, “Sustainable integrated management for the nexus of water–land–food–energy–climate for a resource-efficient Europe”, incorporated land use and climate sectors into its framework [26].
Many scholars worldwide have conducted research on various issues related to the WELF system, employing different methodologies to address these complex interdependencies. Li et al. [27] used models such as the coupling coordination degree to study the coupling coordination level of China’s water–energy–land–food system from 2006 to 2019. This research examined the spatiotemporal distribution characteristics and regional differences and proposed policy recommendations to achieve coordinated WELF development and balance regional resource disparities. From the perspective of the water–energy–food nexus, Simpson et al. [28] found that coal mining in Mpumalanga Province, South Africa, poses risks to water security, energy security, and food security. Li et al. [29] developed a cooperative optimization model for managing the water–land–food–energy nexus within the agroforestry system in Heilongjiang Province, China. Fan et al. [30] conducted research on the interactions among land, water, and energy in agricultural activities in the Sanjiang Plain region of China, and proposed a land–water–energy nexus framework based on agricultural greenhouse gas emissions. Das et al. [31] proposed an evaluation model and a WELF nexus–sustainability index from three dimensions: environmental, social, and economic, and application results showed that this model can minimize the use of water, energy, and labor in agricultural food production while maximizing net economic returns. In addition, Sušnik et al. [32] developed a national-level water–energy–food–land–climate (WEFLC) system dynamics model for Latvia, which comprehensively assessed the multidimensional impacts of policy objectives on the WEFLC system. Lee et al. [33], focusing on the water–energy–food–land nexus, examined the comprehensive impacts of changes in Japan’s rice production self-sufficiency on food security, water and energy consumption, land use, and carbon emissions.
It is evident that to study the nexus relationships within the WELF complex system, some scholars have constructed coupling models or system dynamics models to simulate the interactions between different subsystems [34,35,36,37]. However, these methods are often complex in terms of model construction and reliability validation and tend to focus on specific issues. As a result, it is challenging to intuitively assess the overall coordination and sustainability of the WELF system. Some scholars select key indicators of the WELF system and use methods such as coupling coordination degree [38,39], Moran’s index [40], and copula functions [41] to conduct comprehensive evaluations of system sustainability. However, most of these studies are conducted over relatively short time scales, typically 10–20 years, making it difficult to reflect the long-term dynamics of the WELF system. Additionally, these evaluations often focus on the subsystems and the overall system, with less consideration given to dimensions such as reliability, robustness, resilience, and security.
Therefore, this study selects Hebei province, China, as the study area, as it represents a typical region for water–energy–land–food conflicts. First, we developed an indicator system for the WELF system that includes the subsystems of water, energy, land, and food, considering the interrelationships between indicators and encompassing reliability, robustness, and equilibrium dimensions. Second, we established a comprehensive long-term indicator dataset spanning from 1980 to 2020, covering the critical period of China’s rapid economic and social development since the reform and opening-up to better reveal the temporal evolution of the WELF system. Third, we applied a combination of the AHP (Analytic Hierarchy Process) and CRITIC (Criteria Importance Through Intercriteria Correlation) methods to determine indicator weights and used the comprehensive evaluation index and coupling coordination degree model to construct the sustainable development index (SDI) for quantifying the sustainability of the coupled system. Finally, we employed the obstacle degree model and gray relational degree model to assess the indicators that hinder or promote the development of the Hebei WELF system’s SDI, identifying the main factors influencing SDI development. Through the construction of a comprehensive indicator system and the application of multiple assessment models, this study not only delves into the sustainability of the WELF system in Hebei province but also identifies the main obstacles and promoting factors impacting sustainable development. The findings provide a scientific basis and practical guidance for Hebei and similar regions in resolving resource conflicts, optimizing resource allocation, and promoting regional sustainable development.

2. Materials and Methods

2.1. Study Area

Hebei province, located between 36°05′ to 42°40′ N latitude and 113°27′ to 119°50′ E longitude, is situated in the North China Plain, as shown in Figure 2. It surrounds the capital city, Beijing, and together with Tianjin, forms the Beijing–Tianjin–Hebei coordinated development region. As the core area for economic development in northern China, Hebei plays an irreplaceable role in maintaining national political security and promoting regional balanced development. In recent years, with the acceleration of industrialization, urbanization, and population growth, Hebei has faced severe conflicts and risks among water, energy, land, and food.
On the one hand, resource scarcity has severely constrained the high-quality and reliable development of the WELF system in the region. Hebei suffers from a severe shortage of water resources, with a long-term average water self-sufficiency rate of only 79% [42,43,44,45,46]. Over the past 20 years, the over-extraction of groundwater has supported economic and social development and agricultural water use, but this has led to severe ecological issues such as river drying and land subsidence [47,48]. Similarly, the energy self-sufficiency rate has shown a significant decline, dropping from complete self-sufficiency in 1980 to only 21% in 2020, forcing the region to rely heavily on external energy imports [45,49]. As one of China’s main food-producing regions, Hebei has maintained a stable food supply, with an average food self-sufficiency rate of 103% [45,50], ensuring regional food security. In addition, with the rapid pace of urbanization, the area of impermeable land has expanded significantly, doubling by 2020 compared to 1980 [51]. On the other hand, the interdependence and competition among the subsystems have also contributed to the instability of the entire WELF system. For instance, both energy and food production consume significant amounts of water resources [52,53], and the expansion of urban areas encroaches on arable land [54,55]. Therefore, in the context of resource scarcity, achieving coordination within the WELF system has become one of the core challenges for Hebei in attaining its sustainable development goals.

2.2. Evaluation Indicators System and Data Sources

To scientifically and reasonably reflect and evaluate the sustainable development characteristics of the Hebei WELF system, this study follows the principles of purposefulness, comprehensiveness, systematicness, feasibility, and representativeness [56,57], refers to the representative indicators selected by existing relevant studies [58,59,60], focuses on the four subsystems of WELF and evaluating them from three dimensions of reliability, robustness, and equilibrium. A total of 38 indicators that can comprehensively reflect the characteristics of the sustainable development of the WELF system in Hebei were selected and the evaluation indicators system was constructed as shown in Figure 3 and Table 1. The blue border represents the positive indicator, indicating that larger values are more conducive to sustainable development. The red border represents a negative indicator, indicating that smaller values are more conducive to sustainable development.
The reliability dimension is used to characterize the reliability of individual subsystems. These indicators primarily include quantitative and qualitative resources within each subsystem, reflecting the abundance of resources within the subsystem. The richer the resources, the higher the corresponding reliability, providing adequate resource assurance for the sustainable development of the WELF system. The robustness dimension is used to characterize the efficiency of each subsystem. These indicators mainly consist of the ratios between resource indicators and socio-economic indicators within each subsystem, reflecting the efficiency of resource distribution and output in each subsystem. The higher the efficiency, the greater the corresponding robustness, making the sustainable development of the WELF system less susceptible to external disturbances. The equilibrium dimension is used to characterize the degree of coordination between pairs of subsystems. These indicators primarily involve calculating the ratios between different indicators of two subsystems, reflecting the conversion efficiency and impact between the subsystems. The higher the coordination, the more balanced the subsystems are, making the sustainable development of the WELF system less susceptible to internal competition and conflicts.
The study period spans from 1980 to 2020. Economic and social data, energy data, water resource data, and agricultural data are primarily sourced from the China Statistical Yearbook, Hebei Statistical Yearbook, Hebei Water Resources Bulletin, China Water Resources Statistical Yearbook, Haihe River Basin Water Resources Bulletin, China Energy Statistical Yearbook, and Rural Statistical Yearbook. Land-use data are obtained from the Resources and Environmental Science Data Platform and the 30 m Annual Land Cover Dataset in China. Missing data for some years are filled using interpolation methods.

2.3. Methodology

2.3.1. Standardization of Indicators

Due to the different units of measurement among various evaluation indicators, the raw evaluation data are standardized using the range normalization method. For positive indicators, the calculation equation is:
X i j = x i x m i n x m a x x m i n
For negative indicators, the calculation equation is:
X i j = x m a x x i x m a x x m i n
where X i j is the standardized result of the i-th data for the j-th indicator, x m a x is the maximum value of the j-th indicator, x m i n is the minimum value of the j-th indicator.

2.3.2. Weight Determination

This study employs a comprehensive weighting method that integrates the AHP and the CRITIC method. This method combines subjective judgment with objective data analysis, allowing for a more thorough and accurate assessment of the relative importance of each evaluation indicator. The AHP method involves constructing a hierarchical structure, performing pairwise comparisons, and conducting a consistency check to ultimately calculate the relative importance weights of each evaluation indicator. The detailed calculation process can be referred to in the relevant literature [61]. The CRITIC method calculates the variability of indicators and the conflict between them [62,63]. By combining these aspects, it determines the final weight for each indicator. The calculation equation is as follows:
Variability of indicators:
x j ¯ = 1 m i = 1 m x i j
S j = 1 m 1 i = 1 m ( x i j x j ¯ ) 2
where: x i j is the i-th data of the j-th indicator after standardization; x j ¯ is the average value of the j-th indicator; S j is the standard deviation of the j-th indicator.
Conflict between indicators:
r j y , j z = i = 1 m ( x i , j y x j y ¯ ) ( x i , j z x j z ¯ ) i = 1 m ( x i , j y x j y ¯ ) 2 ( x i , j z x j z ¯ ) 2
R j = J = 1 n ( 1 r j , J )
where x i , j y and x i , j z are the i-th data of the jy-th and jz-th indicators, x j y ¯ and x j z ¯ are the average values of the jy-th and jz-th indicators, and r j y , j z are the correlation coefficients of the jy-th and jz-th indicators. R j is the conflict of the jz-th indicators.
Weight of CRITIC method:
w j c = S j R j j = 1 n S j R j
The equation for determining the combined weight of AHP and CRITIC is as follows:
w j = w j A × w j c j = 1 n w j A × w j c
where: w j A is the weight of the j-th indicator obtained by the AHP method, w j C is the weight of the j-th indicator obtained by the CRITIC method, and w j is the combined weight of AHP and CRITIC.
By combining the weights derived from both the AHP and CRITIC methods, the comprehensive weight for each indicator is determined, providing a balanced approach that incorporates both subjective expertise and objective data.

2.3.3. Comprehensive Evaluation Methodology

For calculating the evaluation index of water, energy, land, and food subsystems, the calculation equation is as follows:
W x = j = 1 n w W , j X W , j E x = j = 1 n w E , j X E , j L x = j = 1 n w L , j X L , j F x = j = 1 n w F , j X F , j
where W x , E x , L x and F x are the evaluation indexes of water, energy, land and food subsystems, respectively, and the larger the index is, the better the development level of the subsystems is. w W , j , w E , j , w L , j , and w F , j are the weights of the j-th indicator of water, energy, land, and food subsystems, respectively. X W , j , X E , j , X L , j , and X F , j are the values of the j-th indicator of water resources, energy, land, and food subsystem, respectively.
A comprehensive evaluation index (CEI) was used to characterize the comprehensive development level of the WELF system. The calculation equation was as follows:
C E I = α W x + β E x + γ L x + δ F x
where α , β , γ , and δ are the coefficients. Considering that each subsystem is equally important to economic and social development, α   = β   = γ = δ = 0.25.
The calculation of the WELF system coupling degree is as follows:
C D = 4 × W x E x L x F x 4 W x + E x + L x + F x
where CD is the coupling degree. A larger value indicates a stronger correlation between subsystems.
The calculation of the WELF system degree of coupling coordination is as follows:
D C C = C E I × C D
where DCC is the degree of coupling coordination, and the larger the value, the higher the coupling coordination degree of the multidimensional system. The classification of DCC is shown in the following Table 2.
For calculating the evaluation index of reliability, robustness, and equilibrium, the calculation equation is as follows:
R e l x = j = 1 n w R e l , j X R e l , j R o b x = j = 1 n w R o b , j X R o b , j E q u x = j = 1 n w E q u , j X E q u , j
where R e l x , R o b x , E q u x are reliability, robustness, and equilibrium evaluation indexes, respectively, w R e l , j , w R o b , j , w E q u , j are the weights of the j-th indicator of reliability, robustness, and equilibrium, respectively. X R e l , j , X R o b , j , X E q u , j are the values of the j-th indicator of reliability, robustness, and equilibrium, respectively.
Based on Rel, Rob, and Equ, the sustainable development index (SDI) is constructed by calculating geometric mean values, as shown below. It can be used to identify changes in the reliability, robustness, and equilibrium of the WELF system, and the higher the SDI, the better the sustainable development capability.
S D I = R e l × R o b × E q u 3

2.3.4. Obstacle Degree Model

In evaluating the sustainable development capacity of the WELF system, it is crucial to identify the obstructive factors that impact sustainability. This understanding plays a vital role in making informed policy adjustments. This study introduces three metrics for analysis and diagnosis: factor contribution, indicator deviation, and obstacle degree.
The factor contribution F j represents the weight of a single factor in relation to the overall goal. The indicator deviation I j is the difference between 100% and the standardized value of a single indicator, calculated as I j = 1 x i j . The obstacle degree O j reflects the extent to which a single indicator affects the sustainable development of the WELF system, calculated as:
O j = F j I j j = 1 n F j I j

2.3.5. Gray Relational Degree Model

This study calculates the correlation degree of each evaluation indicator by constructing a gray correlation degree model. The greater the correlation degree, the higher the contribution degree of the indicator to the sustainable development of the WELF system. The calculations are as follows:
ϵ j i = m i n i m i n j y i x j ( i ) + ρ m a x i m a x j y i x j ( i ) y i x j ( i ) + ρ m a x i m a x j y i x j ( i )
where: ϵ j i is the correlation coefficient of the j-th indicator; y i is the reference series, representing the SDI of the WELF system; x j ( i ) is a comparative series and represents the j-th indicator value that affects the SDI of the WELF system. ρ is the resolution coefficient, 0.5 in this study.
θ j = 1 n j = 1 n ϵ j i
where θ j is the correlation degree of the j-th indicator.

3. Results

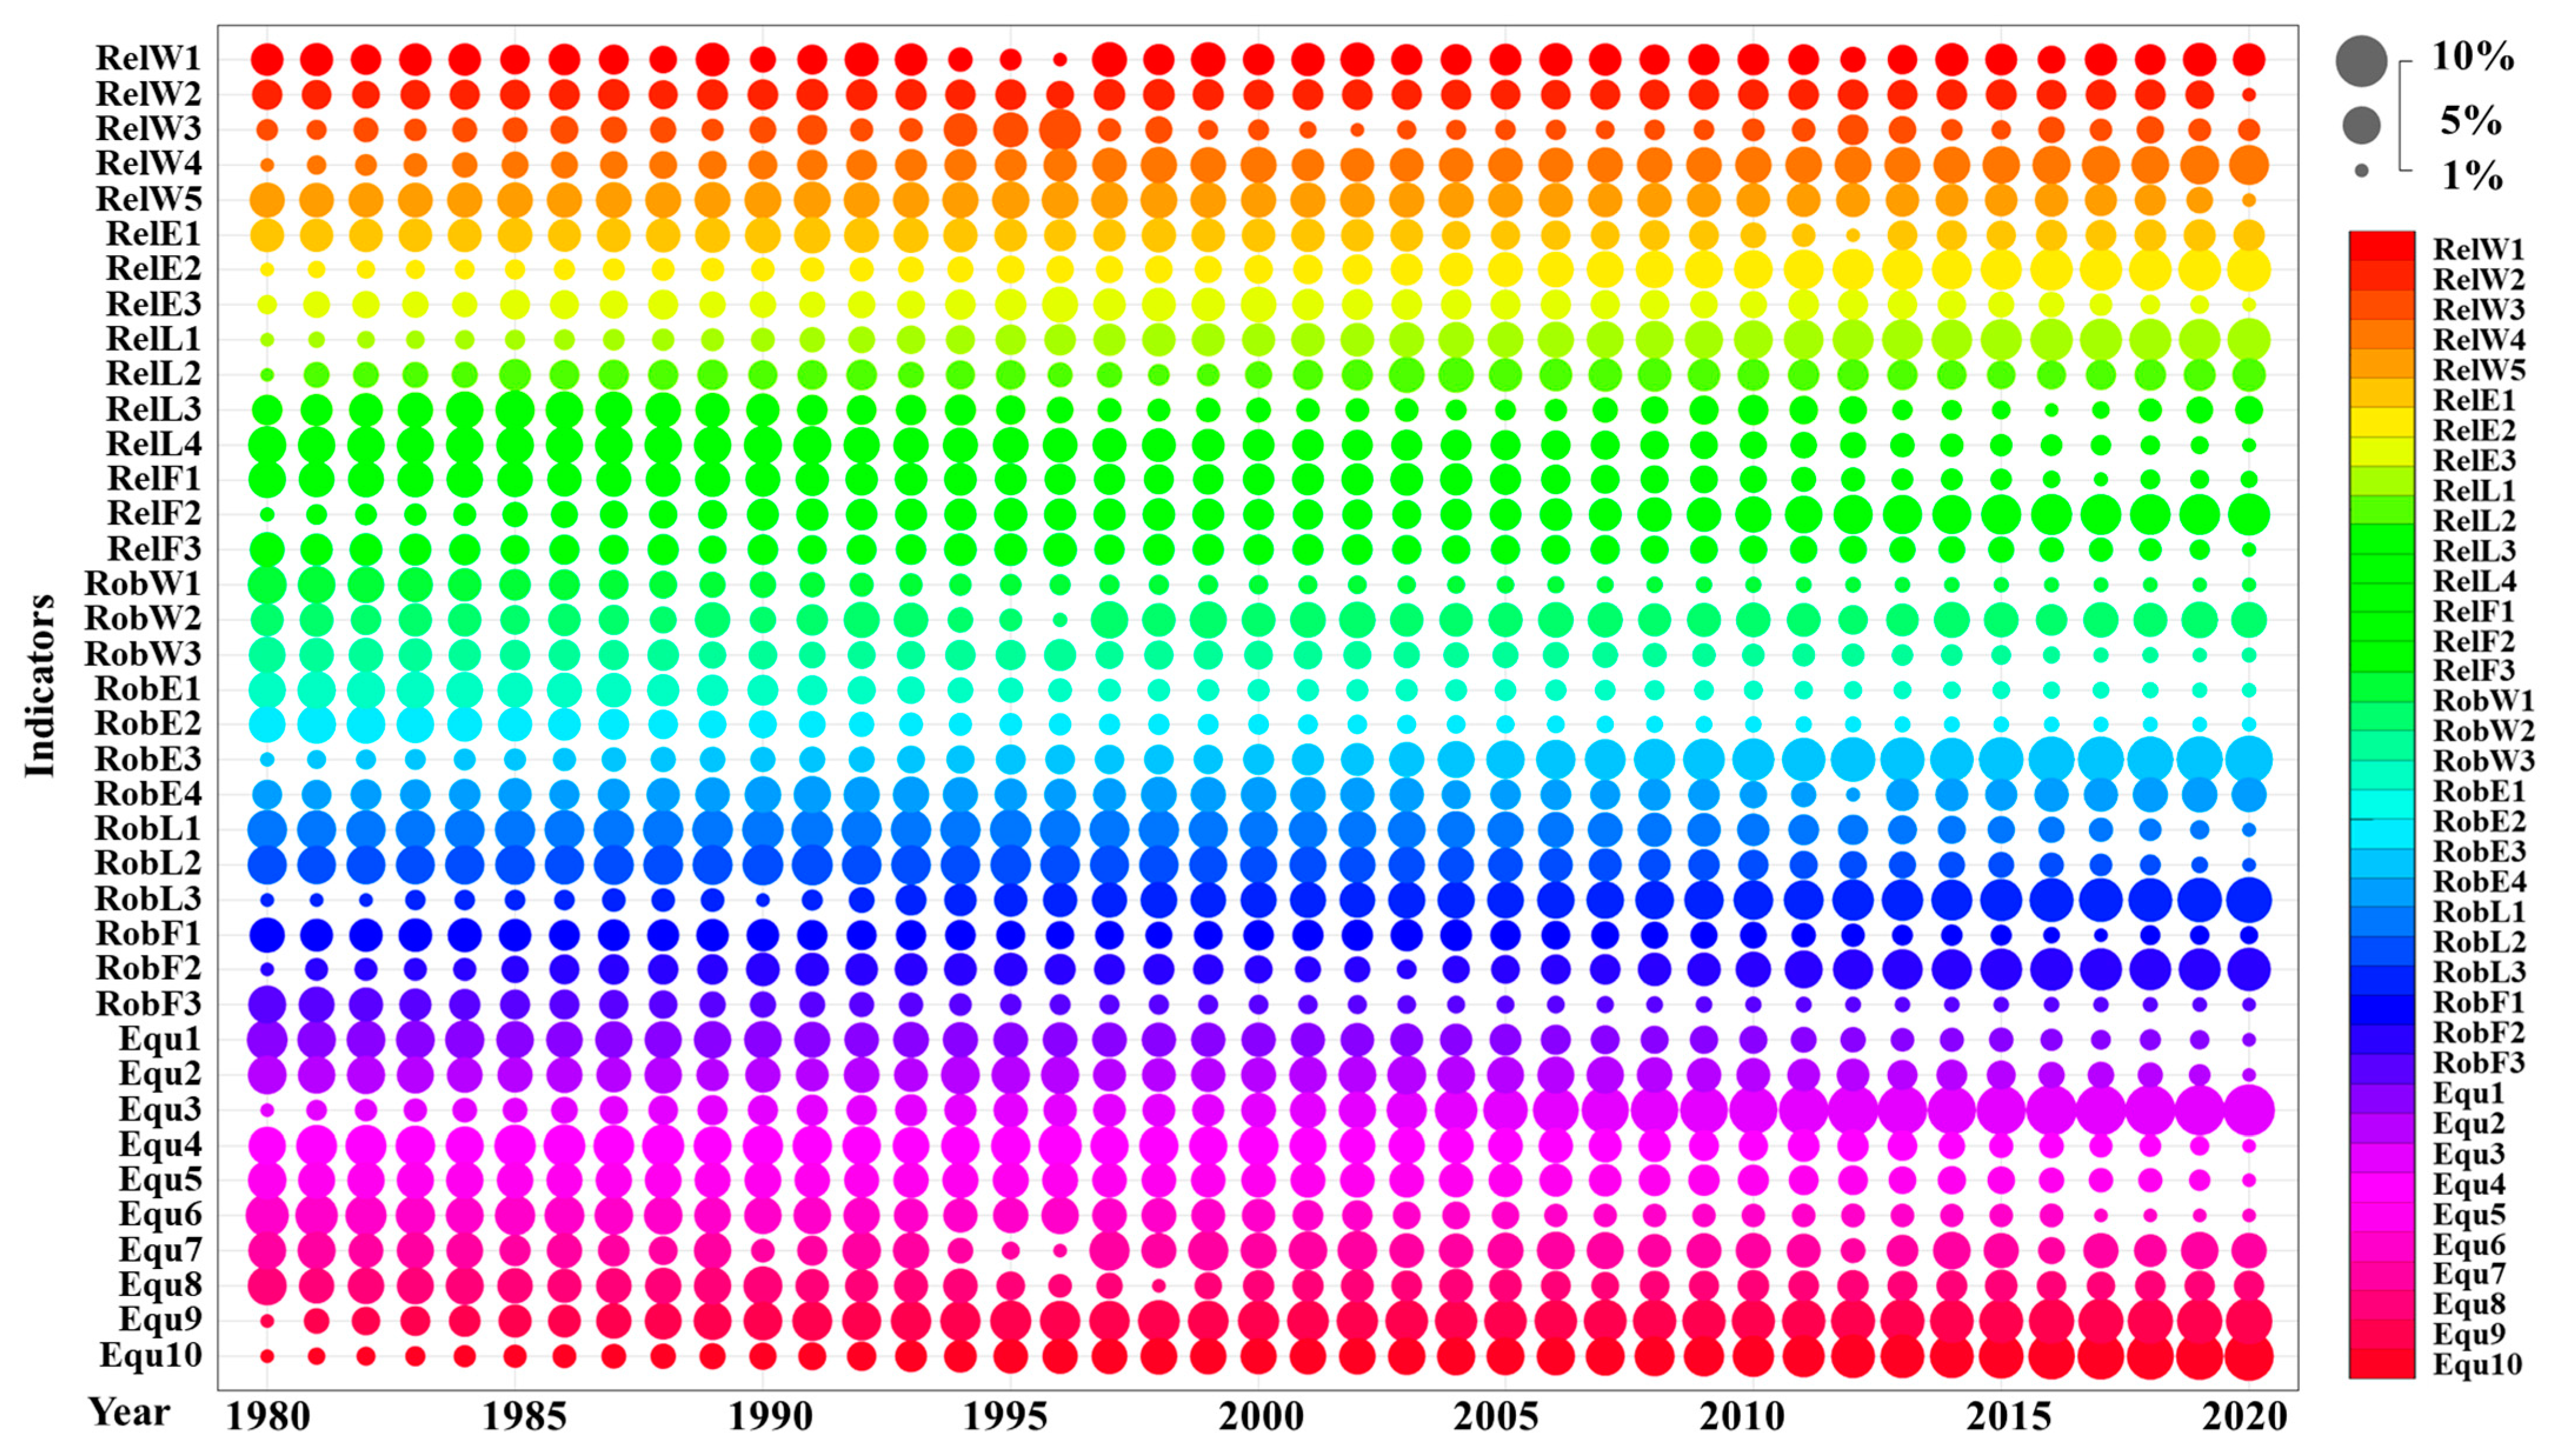
3.1. Temporal Variation Analysis of WELF System

The characteristics of the changes in the evaluation index for the water, energy, land, and food subsystems in Hebei from 1980 to 2020 are illustrated in Figure 4. The evaluation index for the water subsystem exhibited rapid growth from 1980 to 1990, increasing from 0.30 to 0.58. However, between 1990 and 2002, the index experienced a fluctuating decline, with values ranging from 0.42 to 0.58. After 2002, the index resumed its upward trajectory, reaching 0.72 in 2020. The evaluation index for the energy subsystem demonstrated an initial increase followed by a decline, with 1995 marking the turning point. From 1980 to 1995, the index rose from approximately 0.50 to a peak of 0.65. After 1995, it steadily declined, stabilizing around 0.47 after hitting this value in 2013. The evaluation index for the land subsystem showed an initial decline followed by growth, with 2009 marking the turning point. Between 1980 and 2009, the index experienced a fluctuating decline, including two brief periods of recovery, ultimately falling from 0.58 to 0.37. From 2009 to 2020, the index rebounded quickly, reaching 0.48 in 2020, although it did not return to its historical peak. The evaluation index for the food subsystem exhibited fluctuating growth from 1980 to 2003, rising from 0.42 to 0.60. This was followed by a sharp decline from 2003 to 2015, dropping to 0.54. However, from 2015 to 2020, the index rapidly increased again, reaching 0.56 in 2020.
Over the past four decades, the water, energy, land, and food subsystems in Hebei have experienced significant fluctuations. As illustrated in Figure 4a, the water subsystem exhibits the greatest variability, with a standard deviation of 0.09 and a range between the lowest and highest values of 0.43. In contrast, the food subsystem is relatively more stable, with a standard deviation of 0.04 and a range of 0.21. The mean evaluation index for the water, energy, land, and food subsystems are 0.50, 0.55, 0.47, and 0.52, respectively. This indicates that the comprehensive evaluation of the energy subsystem is the most favorable, followed by the food subsystem, with the land subsystem showing the lowest average performance.
Considering the influence of different times, 1980, 2000, and 2020 are selected as the three specific years to compare the four subsystems, as shown in Figure 4b. In 1980, the land subsystem had the highest development level among the four, while the water subsystem was the least developed. In 2000, the energy subsystem had remained relatively stable, but the land subsystem had significantly declined. Meanwhile, both the water and food subsystems had improved. In 2020, the energy, land, and food subsystems showed minimal changes, whereas the water subsystem had significantly improved, becoming the most developed among the four subsystems.
Based on the evaluation index of the WELF system, the CEI, CD, and DCC were calculated for the period from 1980 to 2020, as illustrated in Figure 5. The CEI can be divided into two distinct phases: from 1980 to 1998, it increased from 0.45 to 0.56, while after 1998, it fluctuated between 0.49 and 0.56. The CD shows an upward trend before 1985, after which it remained relatively stable, fluctuating within the range of 0.98 to 1.00. This indicates a strong interconnection among the WELF system.
The DCC exhibits a similar pattern to the CEI, with 1998 serving as a turning point. From 1980 to 1998, the DCC increased from 0.66 to 0.75, transitioning from a low to a moderate level of coordinated development. From 1998 to 2020, the DCC demonstrated a U-shaped trajectory: a sharp decline from 0.75 to 0.70 between 1998 and 2002, followed by fluctuations around 0.70 from 2002 to 2015, indicating a coordination level between low and moderate. After 2015, the DCC experienced a rapid increase from 0.70 to 0.75, stabilizing at a moderate level of coordinated development.

3.2. Temporal Variation Analysis of SDI of WELF System

The evaluation index for reliability (Rel), robustness (Rob), and equilibrium (Equ) of Hebei from 1980 to 2020 were calculated, and their pairwise relationships were analyzed, as shown in Figure 6. From Figure 6a, it is evident that as Rel increases, Rob exhibits a decreasing trend. When Rel is between 0.40 and 0.50, Rob stabilizes between 0.50 and 0.60. However, when Rel increases to 0.50–0.60, Rob decreases to 0.30–0.50, indicating that an increase in Rel does not necessarily enhance Rob. Figure 6b shows that as Rel increases, Equ also shows an increasing trend, suggesting that improving Rel contributes positively to Equ and overall SDI. From Figure 6c, it can be observed that as Rob increases, Equ also increases. When Rob is between 0.40 and 0.50, Equ changes slowly with Rob and remains within the 0.40–0.50 range. However, when Rob is between 0.50 and 0.70, Equ increases rapidly, though the Equ range remains between 0.30 and 0.60. This indicates that while an increase in Rob generally enhances Equ, the Equ corresponding to Rob in the 0.50–0.60 range may be lower than that in other ranges.
The variation characteristics of the evaluation indices for Rel, Rob, Equ, and SDI in Hebei from 1980 to 2020 are illustrated in Figure 7. Rel exhibited a fluctuating downward trend overall, with a significant decline from 0.59 to 0.41 between 1980 and 2009. However, from 2009 to 2020, it remained relatively stable and showed a slight upward trend. This indicates a deterioration in the resource endowment of Hebei, but the introduction of new water sources through the South-to-North Water Diversion Project in 2014 slightly improved reliability. Rob’s trend can be divided at 1996: from 1980 to 1990, Rob increased significantly from 0.39 to 0.65. However, from 1990 to 2020, it fluctuated between 0.55 and 0.60. This suggests that the efficiency of each subsystem improved considerably from the initial stages, providing the WELF system with strong resilience to disturbances, but further improvement to support WELF development remains challenging. Equ demonstrated three distinct phases: from 1980 to 1998, it showed a fluctuating increase from 0.45 to 0.55. A significant decline occurred from 1998 to 2002, dropping from 0.55 to 0.45, followed by a steady increase from 2002 to 2020, reaching 0.54. The rapid decline in Equ from 1998 to 2002 is linked to consecutive droughts in Hebei, that is because when there is a drought, water resources, water self-sufficiency rate, water consumption per food production, and other relevant indicators are affected by reduced rainfall during droughts, which in turn brings negative effects to the corresponding subsystems, which exacerbated water shortages, reduced the efficiency and impact of inter-system transformations, and significantly decreased coordination and equilibrium. With subsequent policy adjustments and efficient resource utilization, the coordination within the WELF system improved, leading to enhanced equilibrium.
Over the past 40 years, Rob exhibited the greatest variability, with a standard deviation of 0.06, yet it also had the highest average evaluation value of 0.56. Equ displayed moderate variability, with a standard deviation of 0.05, and had the lowest average evaluation value of 0.45. Rel had the lowest variability, with a standard deviation of 0.04 and a moderate average evaluation value of 0.48. At the specific time points of 1980, 2000, and 2020, Rel was highest in 1980, followed by 2020, and lowest in 2000. Rob remained nearly constant between 2000 and 2020, with its lowest value in 1980. Equ was relatively low in both 1980 and 2000 but highest in 2020. In 1980, Rel was the highest at 0.58, followed by Equ at 0.44 and Rob at 0.39. In 2020, Rob was the highest at 0.58, while Rel and Equ were similar at 0.51 and 0.52, respectively.
By analyzing the SDI of the WELF system of Hebei from 1980 to 2020, It can be found that the overall change trend shows an increase from 0.45–0.57 from 1980 to 1995, a decrease to 0.45 from 1995 to 2002, a stable fluctuation of 0.46 from 2002 to 2014, and a rapid increase to 0.54 from 2014 to 2020, shows that the sustainable development capability is better during this period. The decline in SDI from 1995 to 2002 is directly related to consecutive droughts in Hebei, while the rapid increase from 2014 to 2020 is positively influenced by the South-to-North Water Diversion Project, that is because after the operation of the middle route of the South-to-North Water Diversion Project, due to the increase in the available water resources, the development and utilization of local water resources will be reduced, thus contributing to the recovery of indicators such as Outbound water, Groundwater table, and water self-sufficiency rate.

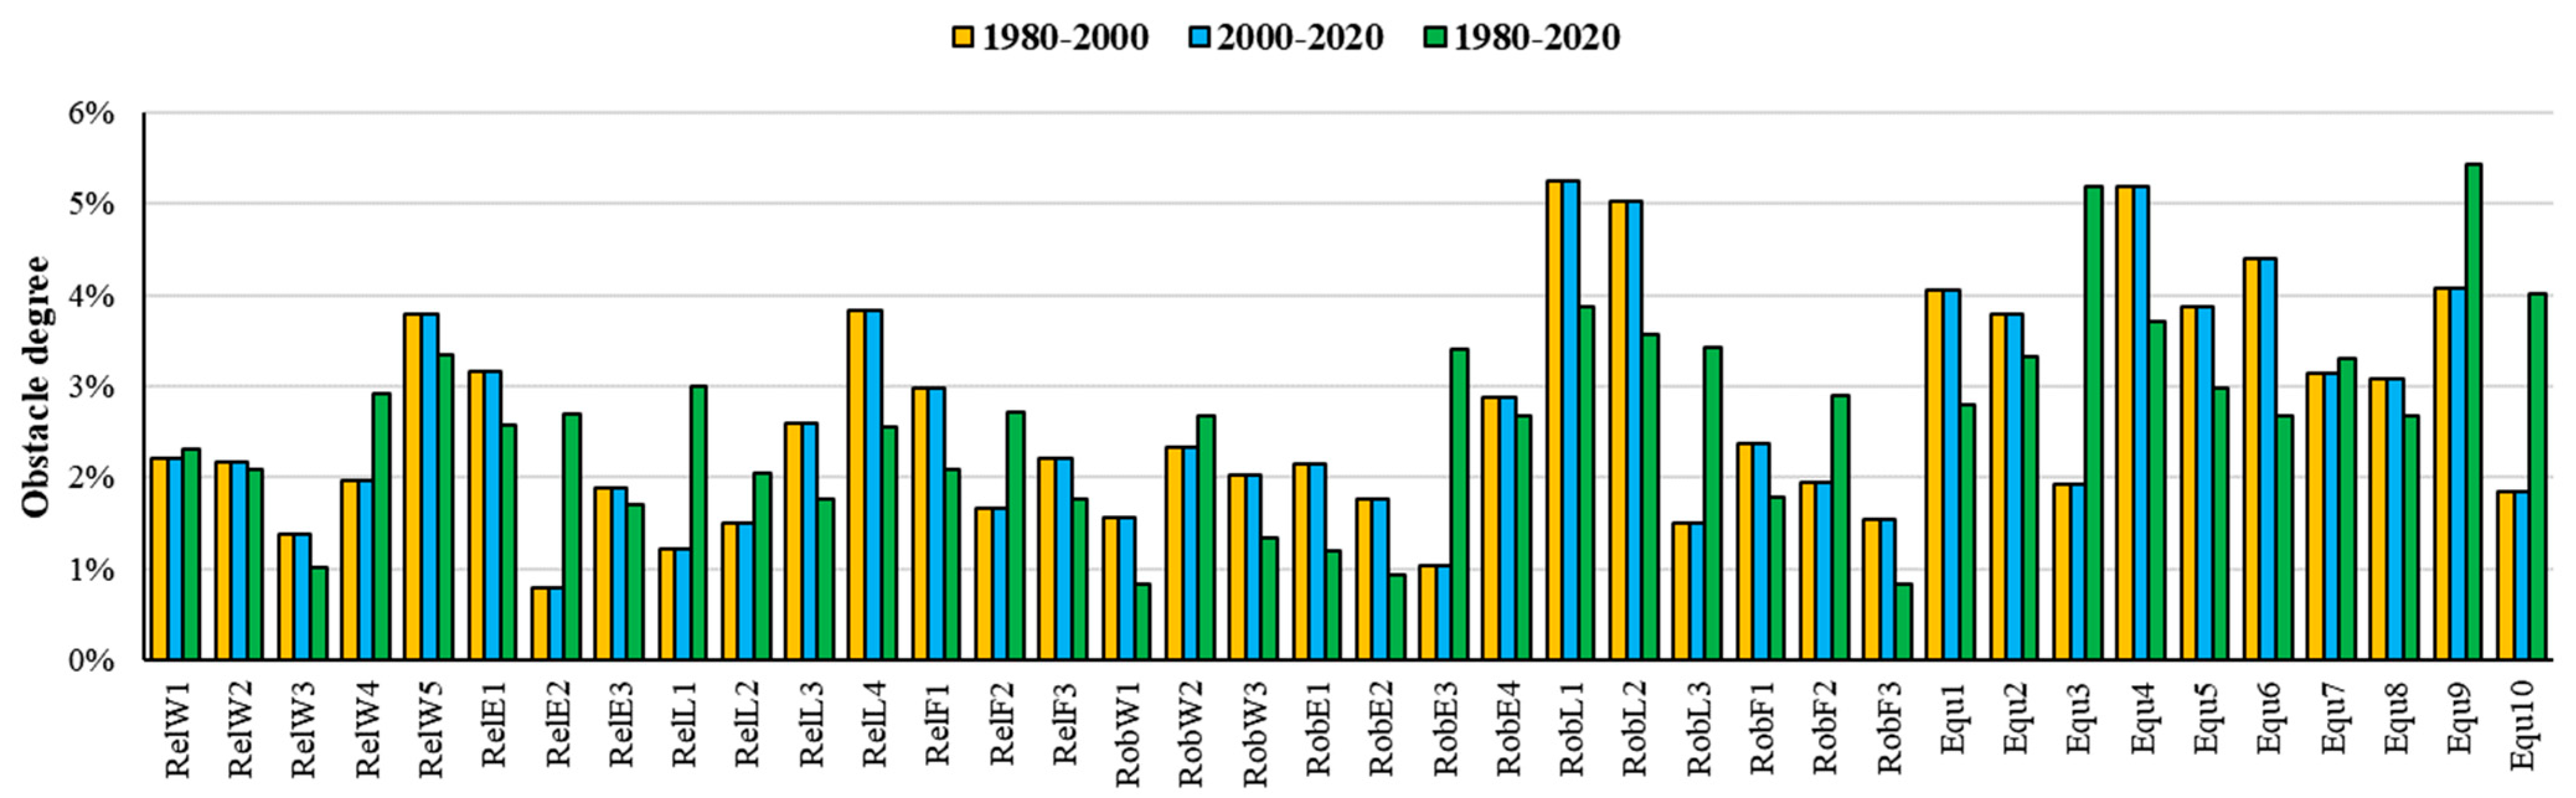
3.3. Obstacle Degree Analysis

According to the obstacle degree calculation results (shown in Figure 8 and Figure 9), the cumulative obstacle factors for Equ and Rel are relatively high, accounting for 36% and 35%, respectively. The cumulative obstacle factors for Rob account for 29%, indicating that there are numerous indicators affecting the SDI of Hebei’s WELF system within the scope of Rel and Equ. Over the period from 1980 to 2020, the most significant obstacle factors for SDI were energy self-sufficiency rate (Equ9), energy consumption per impervious area (Equ3), Impervious land rate (Equ10), Primary industry GDP per cropland area (RobL1), and water consumption per impervious area (Equ4), contributing 5.4%, 5.2%, 4.0%, 3.9%, and 3.7% respectively, totaling over 22%. Notably, four of these are Equ indicators, and four are related to the land subsystem, indicating that the conversion efficiency between the WELF system related to land is a critical limiting factor for SDI.
Between 1980 and 2000, the significant obstacle factors for SDI were primary industry GDP per cropland area (RobL1), water consumption per impervious area (Equ4), secondary and tertiary industries GDP per impervious area (RobL2), water consumption per energy consumption (Equ6), and energy self-sufficiency rate (Equ9), contributing 5.2%, 5.2%, 5.0%, 4.4%, and 4.1%, respectively, cumulatively exceeding 23%. Three of these are Equ indicators, and four are related to the land subsystem. From 2000 to 2020, the prominent obstacle factors were energy consumption per impervious area (Equ3), energy self-sufficiency rate (Equ9), impervious land rate (Equ10), energy consumption per capita (RobE3), and population per impervious area (RobL3), contributing 8.4%, 6.8%, 6.2%, 5.7%, and 5.4%, respectively, cumulatively exceeding 32%. Three of these are Equ indicators, with three indicators related to both the energy and land subsystems. It is evident that compared to the 1980–2000 period, the 2000–2020 period showed an increased impact of the energy subsystem on the constraints of the SDI of the WELF system, alongside the continuing influence of the land subsystem.

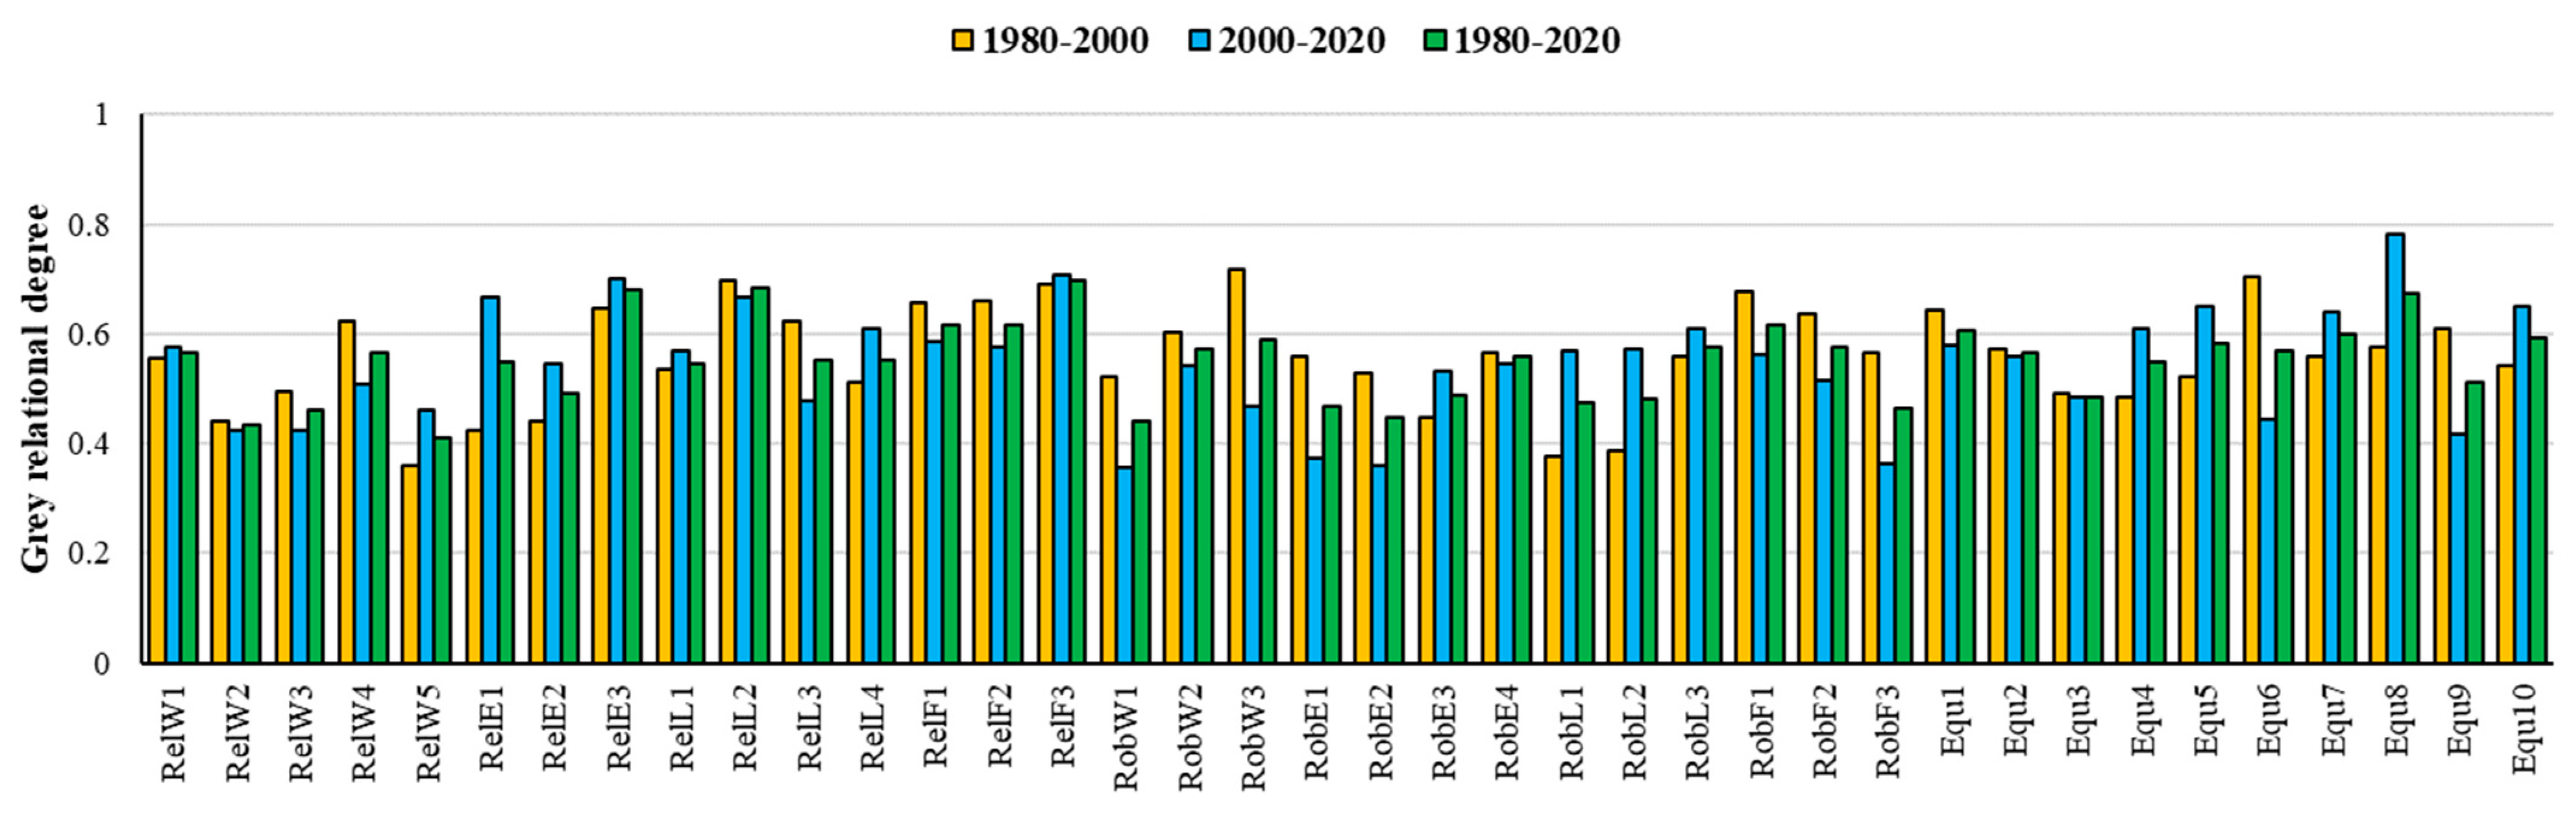
3.4. Gray Correlation Degree Analysis

Based on the results of the gray relational degree analysis, the gray relational degrees of various indicators with SDI for the periods 1980–2000, 2000–2020, and 1980–2020 are shown in Figure 10. From 1980 to 2020, the indicators with the highest gray relational degrees to SDI were Agricultural water consumption (RelF3), Sown area (RelL2), Industrial water consumption (RelE3), food self-sufficiency rate (Equ8), and impervious land rate (Equ10), with values of 0.70, 0.68, 0.68, 0.67, and 0.62, respectively. Among these, three are Rel indicators, and four are related to the food and land subsystems.
In the 1980–2000 period, the indicators with the highest gray relational degrees to SDI were water consumption per capita (RobW3), water consumption per energy consumption (Equ6), sown area (RelL2), agricultural water consumption (RelF3), and food production per capita (RobF1), with values of 0.72, 0.70, 0.70, 0.69, and 0.68, respectively. Notably, three of these indicators are related to the food subsystem. From 2000 to 2020, the indicators with the highest gray relational degrees to SDI were food self-sufficiency rate (Equ8), agricultural water consumption (RelF3), industrial water consumption (RelE3), sown area (RelL2), and primary energy production (RelE1), with values of 0.78, 0.71, 0.70, 0.67, and 0.67, respectively. Among these, four are Rel indicators, and three are related to the food subsystem. Overall, indicators of Rel and those related to the food subsystem show a stronger correlation with SDI, highlighting the significant role of food security in ensuring the sustainable development of the WELF system in Hebei over the past 40 years.

4. Discussion

4.1. Policy Recommendations

As a crucial province in northern China, Hebei faces interconnected and complex systemic issues regarding the security and sustainable development of its water, energy, land, and food subsystems. Based on the findings of this study, the following policy recommendations are proposed:
(1) Water subsystem: On the demand side, implement stringent water management regulations to enhance water use efficiency, such as promoting water-saving irrigation technologies to increase the robustness of the WELF system and reduce unnecessary agricultural and industrial water demand. On the supply side, increase the proportion of unconventional water sources to alleviate the pressure on groundwater extraction. Additionally, advance inter-basin water transfer projects, such as the efficient use of the South-to-North Water Diversion Project, to mitigate the uneven spatial distribution of water resources and enhance the reliability of the WELF system.
(2) Energy subsystem: In response to the decline in energy self-sufficiency, accelerate the transition of the energy structure by increasing the share of renewable energies such as wind and solar power, therefore reducing dependence on external energy sources. Optimize the energy consumption structure by promoting energy-saving technologies and equipment, particularly in industrial and residential electricity usage, to improve energy efficiency.
(3) Land subsystem: Strictly control the conversion of agricultural land to non-agricultural uses and implement a balance system for the occupation and compensation of arable land to ensure food security. Promote urban intensification strategies to enhance land-use efficiency, limit the rapid expansion of impervious surfaces, and protect soil quality and ecosystems. Implement arable land quality improvement projects to enhance land productivity through soil improvement and crop rotation practices.
(4) Food subsystem: Increase investment in agricultural technology to boost per-unit area yield and reduce per-unit area water consumption while emphasizing eco-friendly agriculture to ensure food quality and environmental sustainability. Promote the adjustment of agricultural structures by developing specialty and branded agriculture to increase the added value of agricultural products, raise farmers’ incomes, and foster sustainable agricultural development.

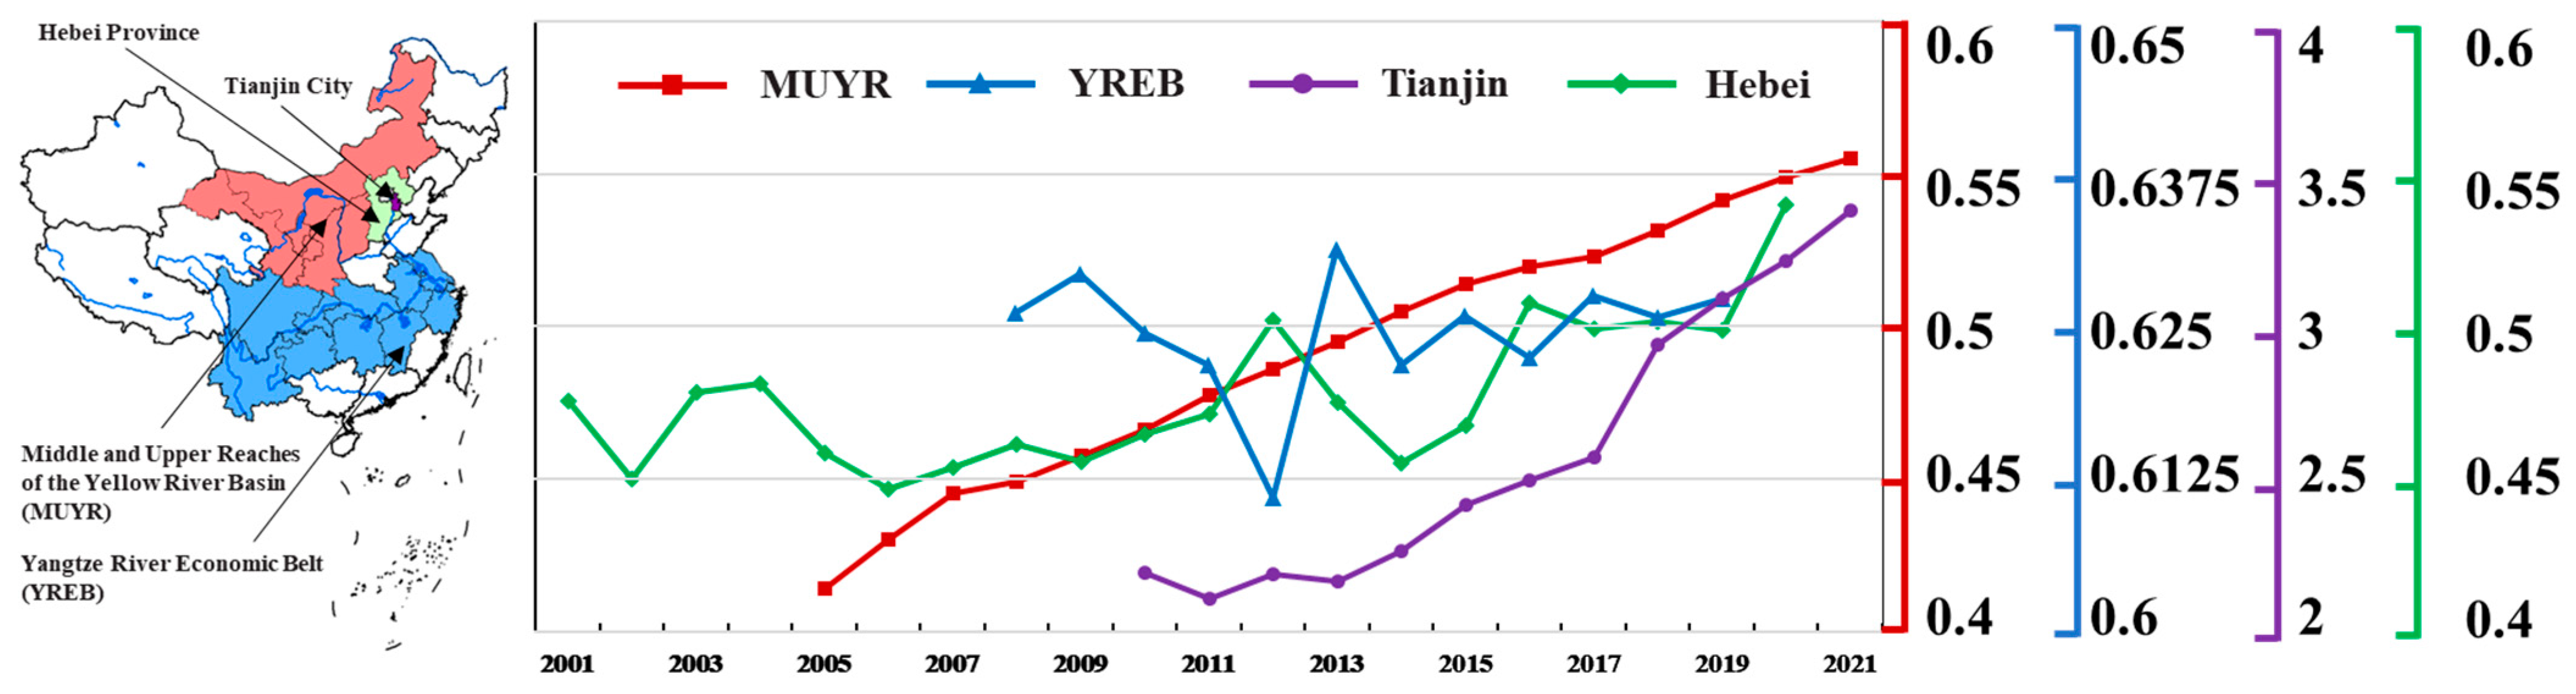
4.2. Development Trend and Policy Impact of Water–Energy–Food System in Different Regions of China

Due to the uneven distribution of water, energy, land, and food resources in China, there are significant disparities in the research characteristics and sustainable development trajectories related to these resources across different regions of the country. Consequently, we also compared pertinent research findings on the water–energy–food system in the Middle and Upper Reaches of the Yellow River Basin (MUYR, a typical northern region) [64], the Yangtze River Economic Belt (YREB, a typical southern region) [65], and Tianjin (an adjacent area) [66], as illustrated in Figure 11.
Considering the variations in methodologies and indicators employed across different studies, the primary focus is on comparing the evolution trends of the water–energy–food system. It is evident that since 2005, the water–energy–food system in the MUYR has exhibited steady development. This aligns with the objectives of China’s national strategy for ecological conservation and high-quality development in the Yellow River Basin [67], which was introduced by the Chinese government in 2019. The development of the water–energy–food system in the YREB from 2008 to 2019 displayed fluctuating changes, suggesting that the region’s resource-carrying capacity had been stretched beyond its limits. The introduction of the Great Yangtze River Protection Program in 2016 [68] effectively ensured the green and sustainable development of the region. It is noteworthy that the water–energy–food system started to exhibit positive development trends following 2016. Both Tianjin and Hebei are part of the Beijing–Tianjin–Hebei region. The announcement of the Coordinated Development Strategy for the Beijing–Tianjin–Hebei region in 2014 [69], along with the commencement of the middle route of the South-to-North Water Diversion Project, has significantly bolstered the sustainable development of the water–energy–food system in Tianjin and Hebei. Tianjin’s water–energy–food system has demonstrated a pronounced upward trajectory post-2014, mirroring the developmental trend observed for Hebei in this study.

4.3. Limitations and Suggestions

(1) While this study attempted to address the limitation of previous research focusing only on a 10–20-year time scale by selecting a longer research period spanning 40 years (1980–2020), it may still be insufficient for a comprehensive assessment of the impacts of slow-changing or underlying trends on truly long-term sustainable development. Future research could consider incorporating data from even longer time spans and conducting scenario-based simulations to predict development trends over the coming decades.
(2) Despite establishing a framework comprising 38 indicators, including reliability, robustness, and equilibrium, constraints related to the availability of long-term data may have led to some limitations in indicator selection, such as a reliance on limited data sources and insufficient consideration of interrelations among indicators. Future research could refine the indicator framework by introducing more diverse and multidimensional indicators while strengthening the logical connections and interactive analyses among indicators to ensure a comprehensive reflection of system complexity.
(3) This study employed a combination of AHP and CRITIC methods to determine indicator weights. However, these methods inherently possess subjectivity and potential biases. Future research could explore the integration of additional analytical methods or expert consultations to enhance objectivity. Furthermore, sensitivity analyses could be conducted to assess the impact of different weight selections on the results.

5. Conclusions

(1) The evaluation index of water, energy, land, and food subsystems in Hebei fluctuated significantly from 1980 to 2020. Among them, the water subsystem showed the most significant fluctuations but maintained a continuous upward trend. The energy subsystem experienced an initial increase followed by a decline, while the land subsystem initially declined before increasing, albeit not reaching its peak. The food subsystem witnessed an initial increase followed by a decline and then a rebound, showing relatively stable patterns. The DCC of the WELF system also exhibited phased changes, transitioning gradually from low coordination to moderate coordination. After 2015, it stabilized between 0.7 and 0.75, indicating a moderate coordination status.
(2) For the WELF system in Hebei, with the increase of Rel, the Rob presented a decreasing change, the Equ presented an increasing change, and with the increase of Rob, the Equ presented an increasing change. Over the past 40 years, Rob showed the highest variability and the highest evaluation index, at 0.56, whereas Equ exhibited moderate variability and the lowest evaluation index, at 0.45. Rel remained the most stable, with a moderate evaluation index of 0.48. The SDI increased from 0.45 in 1980, showed a trend of initial increase followed by a decrease, and then stabilized. After 2014, it experienced rapid growth, reaching 0.54 by 2020, showing that the sustainable development capability is better.
(3) Energy self-sufficiency rate (Equ9), energy consumption per impervious area (Equ3), impervious land rate (Equ10), primary industry GDP per cropland area (RobL1), and water consumption per impervious area (Equ4) exhibited the highest obstacles to SDI, with all four being Equ indicators. Agricultural water consumption (RelF3), sown area (RelL2), industrial water consumption (RelE3), food self-sufficiency rate (Equ8), and impervious land rate (Equ10) showed relatively high correlations with SDI, with three of them being Rel indicators.

Author Contributions

Conceptualization, H.C. and B.Z.; Data curation, J.Y.; Funding acquisition, J.H., Y.Z., and Y.C.; Methodology, B.Z. and J.H.; Project administration, B.Z.; Software, H.C.; Supervision, H.C.; Validation, Y.Z. and Y.C.; Visualization, H.C. and B.Z.; Writing—original draft, H.C.; Writing—review and editing, H.C., B.Z., J.H. and L.S. All authors have read and agreed to the published version of the manuscript.

Funding

This research is supported by the National Natural Science Foundation for Distinguished Young Scholars (Grant No. 52025093), the National Natural Science Foundation of China (Grant No. 52379021), the Open Research Fund of State Key Laboratory of Simulation and Regulation of Water Cycle in River Basin (China Institute of Water Resources and Hydropower Research), Grant NO: IWHR-SKL-202209.

Data Availability Statement

Data will be made available on request.

Acknowledgments

We are so grateful to the anonymous reviewers and editors for their suggestions.

Conflicts of Interest

The authors declare no conflicts of interest.

References

  1. Silalertruksa, T.; Gheewala, S.H. Land-water-energy nexus of sugarcane production in Thailand. J. Clean. Prod. 2018, 182, 521–528. [Google Scholar] [CrossRef]
  2. Roxani, A.; Zisos, A.; Sakki, G.-K.; Efstratiadis, A. Multidimensional role of Agrovoltaics in era of EU green Deal: Current status and analysis of water–energy–food–land dependencies. Land 2023, 12, 1069. [Google Scholar] [CrossRef]
  3. Hanasaki, N.; Fujimori, S.; Yamamoto, T.; Yoshikawa, S.; Masaki, Y.; Hijioka, Y.; Kainuma, M.; Kanamori, Y.; Masui, T.; Takahashi, K.; et al. A global water scarcity assessment under Shared Socio-economic Pathways—Part 1: Water use. Hydrol. Earth Syst. Sci. 2013, 17, 2375–2391. [Google Scholar] [CrossRef]
  4. Bauer, N.; Calvin, K.; Emmerling, J.; Fricko, O.; Vuuren, D.P.V. Shared Socio-Economic Pathways of the Energy Sector—Quantifying the Narratives. Glob. Environ. Change 2017, 42, 316–330. [Google Scholar] [CrossRef]
  5. Popp, A.; Calvin, K.; Fujimori, S.; Havlik, P.; Vuuren, D.P.V. Land-use futures in the shared socio-economic pathways. Glob. Environ. Change 2017, 42, 331–345. [Google Scholar] [CrossRef]
  6. Valin, H.; Sands, R.D.; Mensbrugghe, D.V.D.; Nelson, G.C.; Ahammad, H.; Blanc, E.; Bodirsky, B.; Fujimori, S.; Hasegawa, T.; Havlik, P. The future of food demand: Understanding differences in global economic models. Agric. Econ. 2014, 45, 51–67. [Google Scholar] [CrossRef]
  7. United Nations (UN). Transforming Our World: The 2030 Agenda for Sustainable Development. 2015. Available online: https://sdgs.un.org/2030agenda (accessed on 20 May 2024).
  8. Sušnik, J.; Chew, C.; Domingo, X.; Mereu, S.; Trabucco, A.; Evans, B.; Vamvakeridou-Lyroudia, L.; Savić, D.A.; Laspidou, C.; Brouwer, F. Multi-stakeholder development of a serious game to explore the water-energy-food-land-climate nexus: The SIM4NEXUS approach. Water 2018, 10, 139. [Google Scholar] [CrossRef]
  9. Ringler, C.; Bhaduri, A.; Lawford, R. The nexus across water, energy, land and food (WELF): Potential for improved resource use efficiency? Curr. Opin. Environ. Sustain. 2013, 5, 617–624. [Google Scholar] [CrossRef]
  10. Yao, X.; Chen, W.; Song, C.; Gao, S. Sustainability and efficiency of water-land-energy-food nexus based on energy-ecological footprint and data envelopment analysis: Case of an important agriculture and ecological region in Northeast China. J. Clean. Prod. 2022, 379, 134854. [Google Scholar] [CrossRef]
  11. Turner, B.L.; Fuhrer, J.; Wuellner, M.; Menendez, H.M.; Gates, R. Scientific case studies in land-use driven soil erosion in the central United States: Why soil potential and risk concepts should be included in the principles of soil health. Int. Soil Water Conserv. Res. 2018, 6, 63–78. [Google Scholar] [CrossRef]
  12. Sargentis, G.F.; Siamparina, P.; Sakki, G.K.; Efstratiadis, A.; Koutsoyiannis, D. Agricultural land or photovoltaic parks? The water–energy–food nexus and land development perspectives in the thessaly plain, Greece. Sustainability 2021, 13, 8935. [Google Scholar] [CrossRef]
  13. Dhar, A.; Naeth, M.A.; Jennings, P.D.; El-Din, M.G. Perspectives on environmental impacts and a land reclamation strategy for solar and wind energy systems. Sci. Total Environ. 2020, 718, 134602. [Google Scholar] [CrossRef]
  14. Dale, V.H.; Efroymson, R.A.; Kline, K.L. The land use–climate change–energy nexus. Landsc. Ecol. 2011, 26, 755–773. [Google Scholar] [CrossRef]
  15. Hoff, H. Understanding the Nexus. In Background Paper for the Bonn2011 Conference: The Water, Energy and Food Security Nexus; Stockholm Environment Institute: Stockholm, Sweden, 2011; p. 52. Available online: https://www.sei-international.org/publications?pid=1977 (accessed on 20 May 2024).
  16. Sušnik, J. Data-driven quantification of the global water-energy-food system. Resour. Conserv. Recycl. 2018, 133, 179–190. [Google Scholar] [CrossRef]
  17. Franz, M.; Schlitz, N.; Schumacher, K.P. Globalization and the Water-Energy-Food Nexus–Using the global production networks approach to analyze society-environment relations. Environ. Sci. Policy 2018, 90, 201–212. [Google Scholar] [CrossRef]
  18. Melo, F.P.L.; Parry, L.; Brancalion, P.H.S.; Pinto, S.R.R.; Chazdon, R.L. Adding forests to the Water–Energy–Food Nexus. Nat. Sustain. 2021, 4, 85–92. [Google Scholar] [CrossRef]
  19. White, D.J.; Hubacek, K.; Feng, K.; Sun, L.; Meng, B. The water-energy-food Nexus in East Asia: A tele-connected value chain analysis using inter-regional input-output analysis. Appl. Energy 2018, 210, 550–567. [Google Scholar] [CrossRef]
  20. Chang, H.; Cao, Y.; Zhao, Y.; He, G.; Wang, Q.; Yao, J.; Ren, H.; Yang, H.; Hong, Z. Competitive and synergic evolution of the water-food-ecology system: A case study of the Beijing-Tianjin-Hebei region, China. Sci. Total Environ. 2024, 923, 171509. [Google Scholar] [CrossRef]
  21. Zeng, Y.; Liu, D.; Guo, S.; Xiong, L.; Liu, P.; Yin, J.; Wu, Z. A system dynamic model to quantify the impacts of water resources allocation on water–energy–food–society (WEFS) nexus. Hydrol. Earth Syst. Sci. 2022, 26, 3965–3988. [Google Scholar] [CrossRef]
  22. ODI; ECDPM; GDI/DIE. Confronting Scarcity: Managing Water, Energy and Land for Inclusive and Sustainable Growth; Overseas Development Institute (ODI): London, UK; European Centre for Development Policy Management (ECDPM): Maastricht, The Netherlands; German Development Institute/Deutsches Institut für Entwicklungspolitik (GDI/DIE): Brussels, Belgium, 2012. [Google Scholar]
  23. Zhang, X.; Wang, Y. Essentials of the Construction of an Ecological Civilization. Soc. Sci. China 2013, 34, 180–192. [Google Scholar]
  24. Sun, X.; Gao, L.; Ren, H.; Ye, Y.; Li, A.; Mark, S.S.; Connor, J.D.; Wu, J.; Bryan, B.A. China’s progress towards sustainable land development and ecological civilization. Landsc. Ecol. 2018, 33, 1647–1653. [Google Scholar] [CrossRef]
  25. United Nations Secretary-General’s High-Level Panel on Global Sustainability. Resilient People, Resilient Planet: A Future Worth Choosing; United Nations: New York, NY, USA, 2012. [Google Scholar]
  26. Venghaus, S.; Märker, C.; Dieken, S.; Siekmann, F. Linking environmental policy integration and the water-energy-land-(food-) nexus: A review of the European Union’s energy, water, and agricultural policies. Energies 2019, 12, 4446. [Google Scholar] [CrossRef]
  27. Li, Q.; Yang, L.; Jiang, F.; Liu, Y.; Guo, C.; Han, S. Distribution characteristics, regional differences and spatial convergence of the water-energy-land-food nexus: A case study of China. Land 2022, 11, 1543. [Google Scholar] [CrossRef]
  28. Simpson, G.B.; Badenhorst, J.; Jewitt, G.P.W.; Berchner, M.; Davies, E. Competition for land: The water-energy-food nexus and coal mining in Mpumalanga Province, South Africa. Front. Environ. Sci. 2019, 7, 86. [Google Scholar] [CrossRef]
  29. Li, M.; Li, H.; Fu, Q.; Liu, D.; Yu, L.; Li, T. Approach for optimizing the water-land-food-energy nexus in agroforestry systems under climate change. Agric. Syst. 2021, 192, 103201. [Google Scholar] [CrossRef]
  30. Fan, X.; Zhang, W.; Chen, W.; Chen, B. Land–water–energy nexus in agricultural management for greenhouse gas mitigation. Appl. Energy 2020, 265, 114796. [Google Scholar] [CrossRef]
  31. Das, A.; Sahoo, B.; Panda, S.N. Evaluation of nexus-sustainability and conventional approaches for optimal water-energy-land-crop planning in an irrigated canal command. Water Resour. Manag. 2020, 34, 2329–2351. [Google Scholar] [CrossRef]
  32. Sušnik, J.; Masia, S.; Indriksone, D.; Brēmere, I.; Vamvakeridou-Lydroudia, L. System dynamics modelling to explore the impacts of policies on the water-energy-food-land-climate nexus in Latvia. Sci. Total Environ. 2021, 775, 145827. [Google Scholar]
  33. Lee, S.H.; Taniguchi, M.; Mohtar, R.H.; Choi, J.Y.; Yoo, S.H. An analysis of the water-energy-food-land requirements and CO2 emissions for food security of rice in Japan. Sustainability 2018, 10, 3354. [Google Scholar] [CrossRef]
  34. Wen, C.; Dong, W.; Zhang, Q.; He, N.; Li, T. A system dynamics model to simulate the water-energy-food nexus of resource-based regions: A case study in Daqing City, China. Sci. Total Environ. 2022, 806, 150497. [Google Scholar] [CrossRef]
  35. Su, Y.; Liu, Y.; Huo, L.; Yang, G. Research on optimal allocation of soil and water resources based on water–energy–food–carbon nexus. J. Clean. Prod. 2024, 450, 141869. [Google Scholar] [CrossRef]
  36. Wang, X.; Dong, Z.; Sušnik, J. System dynamics modelling to simulate regional water-energy-food nexus combined with the society-economy-environment system in Hunan Province, China. Sci. Total Environ. 2023, 863, 160993. [Google Scholar] [CrossRef] [PubMed]
  37. Barati, A.A.; Pour, M.D.; Sardooei, M.A. Water crisis in Iran: A system dynamics approach on water, energy, food, land and climate (WEFLC) nexus. Sci. Total Environ. 2023, 882, 163549. [Google Scholar] [CrossRef] [PubMed]
  38. Wang, Y.; Sun, R. Impact of land use change on coupling coordination degree of regional water-energy-food system: A case study of Beijing-Tianjin-Hebei Urban Agglomeration. J. Nat. Resour. 2022, 37, 582–599. [Google Scholar] [CrossRef]
  39. Jing, P.; Hu, T.; Sheng, J.; Mahmoud, A.; Liu, Y.; Yang, D.; Guo, L.; Li, M.; Wu, Y. Coupling coordination and spatiotemporal dynamic evolution of the water-energy-food-land (WEFL) nexus in the Yangtze River Economic Belt, China. Environ. Sci. Pollut. Res. 2023, 30, 34978–34995. [Google Scholar] [CrossRef] [PubMed]
  40. Wang, S.; Yang, J.; Wang, A.; Liu, T.; Du, S.; Liang, S. Coordinated analysis and evaluation of water–energy–food coupling: A case study of the Yellow River basin in Shandong Province, China. Ecol. Indic. 2023, 148, 110138. [Google Scholar] [CrossRef]
  41. Zhang, T.; Tan, Q.; Cai, Y.; Hu, K. A copula-based inexact model for managing agricultural water-energy-food nexus under differentiated composite risks and dual uncertainties. J. Clean. Prod. 2024, 434, 139707. [Google Scholar] [CrossRef]
  42. Hebei Provincial Department of Water Resources. Hebei Water Resources Bulletin; Hebei Provincial Department of Water Resources: Shijiazhuang, China, 1980–2020. (In Chinese) [Google Scholar]
  43. China Ministry of Water Resources. China Water Resources Bulletin; China Water and Power Press: Beijing, China, 1980–2020. (In Chinese) [Google Scholar]
  44. Haihe River Water Conservancy Commission. Haihe River Basin Water Resources Bulletin; Haihe River Water Conservancy Commission: Tianjin, China, 1980–2020. (In Chinese) [Google Scholar]
  45. Hebei Municipal Bureau of Statistics Survey. Hebei Statistical Yearbook; China Statistics Press: Beijing, China, 1980–2020. (In Chinese) [Google Scholar]
  46. China’s Bureau of Statistics. China Statistical Yearbook; China Statistics Press: Beijing, China, 1980–2020. (In Chinese) [Google Scholar]
  47. Liu, R.; Zhao, Y.; Cao, G.; Wang, Q.; Ma, M.; Li, E.; Deng, H. Threat of land subsidence to the groundwater supply capacity of a multi-layer aquifer system. J. Hydrol.-Reg. Stud. 2022, 44, 101240. [Google Scholar] [CrossRef]
  48. Yang, H.F.; Meng, R.F.; Bao, X.L.; Cao, W.; Li, Z.; Xu, B. Assessment of water level threshold for groundwater restoration and over-exploitation remediation the Beijing-Tianjin-Hebei Plain. J. Groundw. Sci. Eng. 2022, 10, 113–127. [Google Scholar]
  49. China’s Bureau of Statistics. China Energy Statistical Yearbook; China Statistics Press: Beijing, China, 1980–2020. (In Chinese) [Google Scholar]
  50. China’s Bureau of Statistics. China Rural Statistical Yearbook; China Statistics Press: Beijing, China, 1980–2020. (In Chinese) [Google Scholar]
  51. Yang, J.; Huang, X. 30 m annual land cover and its dynamics in China from 1990 to 2019. Earth Syst. Sci. Data. 2021, 3907–3925. [Google Scholar] [CrossRef]
  52. Hua, E.; Wang, X.; Engel, B.A.; Sun, S.; Wang, Y. The competitive relationship between food and energy production for water in China. J. Clean. Prod. 2020, 247, 119103. [Google Scholar] [CrossRef]
  53. Wang, Y.; Xie, Y.; Qi, L.; He, Y.; Bo, H. Synergies evaluation and influencing factors analysis of the water–energy–food nexus from symbiosis perspective: A case study in the Beijing–Tianjin–Hebei region. Sci. Total Environ. 2022, 818, 151731. [Google Scholar] [CrossRef] [PubMed]
  54. Yang, K.; Han, Q.; de Vries, B. Urbanization effects on the food-water-energy nexus within ecosystem services: A case study of the Beijing-Tianjin-Hebei urban agglomeration in China. Ecol. Indic. 2024, 160, 111845. [Google Scholar] [CrossRef]
  55. Luo, W.; Jiang, Y.; Chen, Y.; Yu, Z. Coupling Coordination and Spatial-Temporal Evolution of Water-Land-Food Nexus: A Case Study of Hebei Province at a County-Level. Land 2023, 12, 595. [Google Scholar] [CrossRef]
  56. Sun, C.; Hao, S. Research on the competitive and synergistic evolution of the water-energy-food system in China. J. Clean. Prod. 2022, 365, 132743. [Google Scholar] [CrossRef]
  57. Zarei, S.; Bozorg-Haddad, O.; Kheirinejad, S.; Loáiciga, H.A. Environmental sustainability: A review of the water–energy–food nexus. AQUA—Water Infrastructure. Ecosyst. Soc. 2021, 70, 138–154. [Google Scholar]
  58. Zhao, R.; Liu, Y.; Tian, M.; Ding, M.; Cao, L.; Zhang, Z.; Chuai, X.; Xiao, L.; Yao, L. Impacts of water and land resources exploitation on agricultural carbon emissions: The water-land-energy-carbon nexus. Land Use Policy 2018, 72, 480–492. [Google Scholar] [CrossRef]
  59. Zhou, Y.; Zhang, X.; Chen, Y.; Xu, X.; Li, M. A water-land-energy-carbon nexus evaluation of agricultural sustainability under multiple uncertainties: The application of a multi-attribute group decision method determined by an interval-valued intuitionistic fuzzy set. Expert Syst. Appl. 2024, 242, 122833. [Google Scholar] [CrossRef]
  60. Chen, J.; Yu, X.; Qiu, L.; Deng, M.; Dong, R. Study on vulnerability and coordination of water-energy-food system in Northwest China. Sustainability 2018, 10, 3712. [Google Scholar] [CrossRef]
  61. Zarei, S.; Bozorg-Haddad, O.; Singh, V.P.; Loáiciga, H.A. Developing water, energy, and food sustainability performance indicators for agricultural systems. Sci. Rep. 2021, 11, 22831. [Google Scholar] [CrossRef]
  62. Diakoulaki, D.; Mavrotas, G.; Papayannakis, L. Determining objective weights in multiple criteria problems: The critic method. Comput. Oper. Res. 1995, 22, 763–770. [Google Scholar] [CrossRef]
  63. Ni, Y.; Chen, Y. Does the implementation sequence of adaptive management countermeasures affect the collaborative security of the water-energy-food nexus? A case study in the Yangtze River Economic Belt. Ecol. Indic. 2024, 163, 112090. [Google Scholar] [CrossRef]
  64. Li, W.; Jiang, S.; Zhao, Y.; Li, H.; Zhu, Y.; He, G.; Xu, Y.; Shang, Y. A copula-based security risk evaluation and probability calculation for water-energy-food nexus. Sci. Total Environ. 2023, 856, 159236. [Google Scholar] [CrossRef] [PubMed]
  65. Ding, T.; Chen, J. Evaluation and obstacle factors of coordination development of regional water-energy-food-ecology system under green development: A case study of Yangtze River Economic Belt, China. Stoch. Environ. Res. Risk Assess. 2022, 36, 2477–2493. [Google Scholar]
  66. Lv, C.; Hu, Y.; Ling, M.; Luo, A.; Yan, D. Comprehensive evaluation and obstacle factors of coordinated development of regional water–ecology–energy–food nexus. Environ. Dev. Sustain. 2023, 1–25. [Google Scholar] [CrossRef]
  67. Xu, Y.; Wang, C. Ecological Protection and High-quality Development in the Yellow River Basin: Framework, Path, and Countermeasure. Bull. Chin. Acad. Sci. 2020, 35, 875–883. [Google Scholar]
  68. Sheng, J.; Rui, D.; Han, X. Governmentality and sociotechnical imaginary within the conservation-development nexus: China’s Great Yangtze River Protection Programme. Environ. Sci. Policy 2022, 136, 56–66. [Google Scholar] [CrossRef]
  69. Hu, C.; Hu, B.; Shi, X.; Wu, Y. The roles of Beijing-Tianjin-Hebei coordinated development strategy in industrial energy and related pollutant emission intensities. Sustainability 2020, 12, 7973. [Google Scholar] [CrossRef]
Figure 1. Specific relationships within the WELF system.
Land 13 01089 g001
Figure 2. (a) Study area, (b) Water self-sufficiency rate, (c) Food self-sufficiency rate, (d) Energy self-sufficiency rate, (e) Impervious land rate.
Land 13 01089 g002
Figure 3. Evaluation indicators of the WELF system.
Land 13 01089 g003
Figure 4. Change characteristics of evaluation indexes of the WELF system in Hebei from 1980 to 2020, displayed in (a) box chart, (b) radar chart, and (c) line chart.
Land 13 01089 g004
Figure 5. Change characteristics of coupling coordination degree in Hebei from 1980 to 2020.
Land 13 01089 g005
Figure 6. Index correlation. (a) Rel between Rob, (b) Rel between Equ, (c) Rob between Equ.
Land 13 01089 g006
Figure 7. Change characteristics of Rel, Rob, and Equ of the WELF system in Hebei from 1980 to 2020 displayed in a (a) box chart, (b) radar chart, (c) line chart, and (d) change characteristics of SDI of WELF system in Hebei from 1980 to 2020.
Land 13 01089 g007
Figure 8. Annual obstacles factors during 1980–2020.
Land 13 01089 g008
Figure 9. Obstacles factors during 1980–2020.
Land 13 01089 g009
Figure 10. Gray correlation degree during 1980–2020.
Land 13 01089 g010
Figure 11. Development trend of the water–energy–food system in different regions of China (Data were modified based on literature [64,65,66]).
Land 13 01089 g011
Table 1. Data sources of the WELF system evaluation indicators.
CodeIndicatorDimensionsUnitData
Sources
RelW1Water resourcesRel/Waterbillion m31,2,3
RelW2Inbound waterRel/Waterbillion m31,2,3
RelW3Outbound waterRel/Waterbillion m31,2,3
RelW4Groundwater tableRel/Waterm1,2,3
RelW5Ecology water consumptionRel/Waterbillion m31,2,3
RelE1Primary energy productionRel/Energymillion-ton standard coal6
RelE2Energy consumptionRel/Energymillion-ton standard coal6
RelE3Industrial water consumptionRel/Energybillion m31,2,3
RelL1Cropland areaRel/Landkm28,9
RelL2Sown areaRel/Landkm28,9
RelL3Water areaRel/Landkm28,9
RelL4Impervious areaRel/Landkm28,9
RelF1Food productionRel/Foodmillion-ton4,5,7
RelF2Food consumptionRel/Foodmillion-ton4,5,7
RelF3Agricultural water consumptionRel/Foodbillion m31,2,3
RobW1Total water consumption per 10,000 CNY GDPRob/Waterm3/10,000 CNY GDP1,2,3,4,5
RobW2Water resources per capitaRob/Waterm3/person1,2,3,4,5
RobW3Water consumption per capitaRob/Waterm3/person1,2,3,4,5
RobE1Energy consumption per 10,000 CNY GDPRob/Energymillion-ton standard coal/10,000 CNY GDP4,5,6
RobE2Secondary industry water consumption per 10,000 CNY GDPRob/Energym3/10,000 CNY GDP1,2,3,4,5
RobE3Energy consumption per capitaRob/Energymillion-ton standard coal/person4,5,6
RobE4Primary energy production per capitaRob/Energymillion-ton standard coal/person4,5,6
RobL1Primary industry GDP per cropland areaRob/Landmillion CNY/km24,5,8,9
RobL2Secondary and tertiary industries’ GDP per impervious areaRob/Landmillion CNY/km24,5,8,9
RobL3Population per impervious areaRob/Landperson/km24,5,8,9
RobF1Food production per capitaRob/Foodmillion-ton/person4,5,7
RobF2Food consumption per capitaRob/Foodmillion-ton/person4,5,7
RobF3Primary agricultural water consumption per 10,000 CNY GDPRob/Foodm3/10,000 CNY GDP1,2,3,4,5
Equ1Food production per croplandEqu/Land–Foodmillion-ton/km24,5,7,8,9
Equ2Water consumption per croplandEqu/Land–Waterm3/km21,2,3,8,9
Equ3Energy consumption per imperviousEqu/Land–Energymillion-ton standard coal/km26,8,9
Equ4Water consumption per imperviousEqu/Land–Waterm3/km21,2,3,8,9
Equ5Water consumption per food productionEqu/Food–Waterm3/kg1,2,3,4,5,7
Equ6Water consumption per energy consumptionEqu/Energy–Waterm3/kg standard coal1,2,3,6
Equ7Water self-sufficiency rateEqu/Water–Water%1,2,3
Equ8Food self-sufficiency rateEqu/Food–Food%4,5,7
Equ9Energy self-sufficiency rateEqu/Energy–Energy%4,5,6
Equ10Impervious land rateEqu/Land–Land%8,9
1 Hebei Water Resources Bulletin [42]. 2 China Water Resources Statistical Yearbook [43]. 3 Haihe River Basin Water Resources Bulletin [44]. 4 Hebei Statistical Yearbook [45]. 5 China Statistical Yearbook [46]. 6 China Energy Statistical Yearbook [49]. 7 China Rural Statistical Yearbook [50]. 8 Resources and Environmental Science Data Platform (http://www.resdc.cn, accessed on 20 May 2024). 9 30 m Annual Land Cover Dataset in China (https://zenodo.org/records/5210928, accessed on 20 May 2024).
Table 2. Classification of DCC.
DCC[0, 0.4)[0.4, 0.5)[0.5, 0.6)[0.6, 0.7)[0.7, 0.8)[0.8, 0.9)[0.9, 1]
LevelDysfunctional DeclineNear Dysfunctional DeclineBarely Coordinated DevelopmentLow-Level Coordinated DevelopmentModerate-Level Coordinated DevelopmentGood Coordinated DevelopmentHigh-Quality Coordinated Development
Disclaimer/Publisher’s Note: The statements, opinions and data contained in all publications are solely those of the individual author(s) and contributor(s) and not of MDPI and/or the editor(s). MDPI and/or the editor(s) disclaim responsibility for any injury to people or property resulting from any ideas, methods, instructions or products referred to in the content.

