Abstract
Protected areas (PAs) in the Brazilian Amazon have proven to be critical in preserving the rainforest but face increasing threats. Since 2019, illegal activities and land conflicts involving PAs have escalated due to the weakening of environmental institutions. Therefore, up-to-date research is needed to evaluate agricultural pressures on PAs—including Sustainable Use Areas, Indigenous Territories, and Strictly Protected Areas—given its importance in driving deforestation in the Amazon, and to identify hotspots of concern. We analyzed property registration, deforestation, pasture expansion, and cattle transaction records within 158 PAs in the Brazilian state of Pará, which holds most of the remaining forest and the highest rates of deforestation. Our findings show that nearly a quarter of Pará’s 2019–2022 deforestation occurred within PAs, undermining their effectiveness as conservation tools. Despite prohibitions, we found illegally registered private properties in most PA categories including indigenous territories and over a 100% increase in deforestation within PAs from 2015–2018. Over 90% of PAs contained pasturelands in 2022, but only half of them had registered cattle transactions within their borders, which suggests the presence of clandestine cattle activities in these areas as well. Indirect sales to slaughterhouses coming from PAs increased during the study period, potentially due to efforts by ranchers to obscure such cattle origins from companies that are increasingly monitoring their direct suppliers. Finally, we identified 17 high-risk PAs concentrating most threats. Focusing monitoring efforts on property registries and cattle transactions in these areas could significantly reduce illegal deforestation and illegal cattle ranching. While PAs are considered to be cornerstones of forest conservation efforts, our findings show that current policies fail to prevent cycles of land grabbing, illegal ranching, and deforestation that can eventually lead to the downgrading, downsizing, and degazetting of PAs. Given this context, validating property claims, tracing cattle sales, and penalizing deforestation are urgently needed to halt these cycles that threaten PAs.
1. Introduction
The establishment of protected areas (PAs) is widely recognized as an important strategy for reducing deforestation rates and safeguarding the remaining forest areas in Brazil and globally [1,2]. PAs are so effective they can even have a shielding effect against spillover, wherein deforestation or land use change is displaced from regions with regulatory protection to other areas lacking such regulations [3]. However, PAs persistently face the risk of downgrading, downsizing, or degazetting (PADDD), a process often linked to inadequate regulation enforcement or policy alterations that has escalated in Brazil since 2008, impacting over 7 million hectares (Mha) of PAs [4,5]. This tendency worsened during Bolsonaro’s administration (2019–2022), which not only prioritized extractivism over environmental protection but incentivized the exploitation of resources within PAs—specifically Indigenous Territories (ITs)—defunded the Indigenous protection agency, and halted the delimitation of new PAs [5,6]. Other threats to PAs stemming from encroachment and poor enforcement of regulations also escalated. Land conflicts and specifically land invasions more than doubled during Bolsonaro’s term, with almost three-quarters of all encroachments occurring in ITs [7]. Altogether, these initiatives have weakened environmental protection by a combination of deregulation that undermines indigenous sovereignty and the dismantlement and defunding of environmental institutions [8]. Consequently, PAs are left susceptible to illegal land use and cattle ranching [9,10]. Indeed, private property registration of land within ITs as well as previous studies linking cattle heads to suppliers located in PAs [11] reveal that illegal land grabbing and commercial grazing activities persist in these areas and can even end in the “legal” ownership of PA properties by encroachers [8].
PAs are typically categorized based on their objectives, with each category imposing distinct land-use restrictions that determine the permissible economic or extractive activities within their boundaries. In Brazil, two main types of PAs are defined: Indigenous Territories (ITs) and conservation units. ITs are primarily regulated by the Brazilian Constitution of 1988 (articles 231 and 232) and the “Indigenous Statute” (Law 6001/1973). These regulations aim to protect the indigenous people’s original rights over the lands they traditionally occupy, and they prevent evictions and regulate extractive activities, which cannot legally occur without an authorization from the federal government. Conservation units are regulated by the National System of Conservation Units (SNUC), established by Federal Law 9985 of 2000. SNUC governs the creation, management, and sustainable use of two subtypes of conservation units: Strictly Protected Areas (SPAs) and Sustainable Use Areas (SUPAs). SPAs prohibit any use of their natural resources, while SUPAs allow sustainable use subject to approval through technical studies [12] (Table 1). The effectiveness of the Brazilian PAs in preserving natural resources is intrinsically linked to several key factors, such as the political context, accessibility, and the effectiveness of regulatory bodies [8]. Additionally, PAs should have mandatory management plans to guide the use of resources and conservation objectives of each area. However, less than 20% of all PAs have such a plan, with most being out of date and not easily accessible [13]. Given the characteristics of its protection status, SUPAs tend to be more susceptible to cattle ranching, and therefore less effective in preventing deforestation, when compared to SPAs and ITs [11,14]. ITs have had a higher success rate in preventing deforestation, especially when isolated [15]. ITs have been found to have reduced deforestation at all stages of formal recognition [2]. However, only through presidential ratification can indigenous groups obtain full rights over their territory as well as formal protection from the national government against encroachment and external exploitation of their resources [16].

Table 1.
Categories and characteristics of all protected areas in the state of Pará.
Over a third of the deforestation in the Legal Amazon throughout the last 30 years amounting to 166,000 km2, 80% of which was caused by cattle grazing, took place in the state of Pará [17]. Indeed, Pará has consistently been the state with the highest amount of deforestation in the Amazon, since surpassing Mato Grosso in 2006 [17,18]. Furthermore, while holding 32% of all protected areas in the legal Amazon, the state of Pará concentrates most deforestation occurring within PAs, making it a focal point for the implementation of policies aimed at reducing forest clearing. In response to these trends, starting with the first Federal Plan of Action for the Prevention and Control of Deforestation in the Legal Amazon (PPCDAm), 35 Mha of new conservation units and ITs were created in this state, which covers approximately a quarter of the Brazilian Amazon [19]. Another initiative focused on Pará targeted the regularization of rural properties, which eventually developed into the national Rural Environmental Registry (CAR). A self-declaratory registry for cleared areas, CAR was intended to enhance environmental law enforcement. Additionally, since the zero-deforestation cattle agreements (CAs) were launched in 2009 with the intention of excluding producers with deforestation and those producing illegally in ITs and conservation units from the cattle supply chain, the number of slaughterhouses in Pará that have signed these agreements has been expanding, and federal prosecutors have implemented audits to ensure abidance by the rules. These initiatives did help shift the deforestation trend in Pará, and forest clearing within registered properties initially declined [20], before it began to rise again in 2013. The increasing trend was further aggravated under Bolsonaro’s administration, reaching in 2019–2022, the highest deforestation rate in the Legal Amazon in over a decade [18].
The enforcement and validation of initiatives such as the CAR and CAs remain challenging. Moreover, previous research in the Amazon has found that over 1 million heads were sold directly to slaughterhouses from properties in PAs and over 2 million heads were sold by properties in PAs to other properties that eventually sold to slaughterhouses, including some that were subject to the CAs [11]. The complexity of the cattle supply chain and the limited monitoring—with slaughterhouses monitoring only the suppliers they buy from directly—means that even slaughterhouses that signed CAs can potentially buy from non-compliant suppliers such as those located in PAs, due to the ease of cattle laundering through indirect suppliers in these regions [11]. Additionally, the CAR has been used to register illegally occupied areas in the state, facilitating private land claims in ITs and other PAs [8]. Overall, in spite of the advancements that the CAR offers for monitoring compliance with Brazil’s Forest Code, the lack of validation of the registrations has allowed its misuse, enabling illegal land grabbing, deforestation, and cattle ranching within PAs.
Given Brazil’s history of deforestation and the recent political trajectory favoring extractivism and the dismantling of environmental institutions [5], we find that there is a need for updated research to assess the agricultural pressure on PAs in Brazil. We aimed to fill this gap and provide new insights on the threats PAs currently face by quantifying the upsurge in deforestation and encroachment into PAs across the last two federal governments, as well as the prevalence of cattle production jeopardizing the effectiveness of these areas at protecting forests. Additionally, we sought to understand where these threats concentrate, in order to identify the most vulnerable PAs and those where mitigation measurements will be most effective. We focused on PAs in the state of Pará, where recent cattle transaction data is available, and where there is a high aggregation of protected areas and deforestation. To answer these questions, we expanded upon previous work by West et al., 2022 [11] by incorporating deforestation and cattle transaction data for the 2019–2022 period and by developing new methods for measuring property expansion into PAs. Specifically, we compared multiple snapshots over time of the CAR registry to assess the increase in declared properties in PAs. Additionally, we analyzed the change in location of properties and deforestation within PAs over time to evaluate whether properties and deforestation are moving further into the interior of PAs, to assess whether encroachment has become more aggressive in recent years.
2. Materials and Methods
2.1. The Study Area
The state of Pará is located entirely within the Legal Amazon, and almost entirely within the Amazon Biome (Figure 1). Pará has consistently had more deforestation than any other Brazilian Amazon state. In 2022 alone, Pará had over 400,000 ha of deforestation [18]. Additionally, as of 2021, the Legal Amazon contained over 96 M heads of cattle, with Pará accounting for 25% of these (second only to Mato Grosso among the 9 states that make up the Legal Amazon) [21]. In 2022, more than 11 M cattle heads were slaughtered within the Legal Amazon, of which Pará accounted for 21% [21].
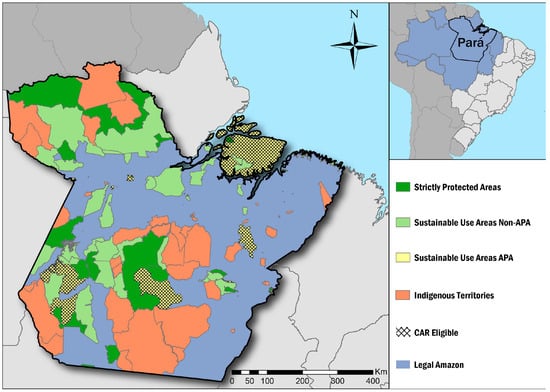
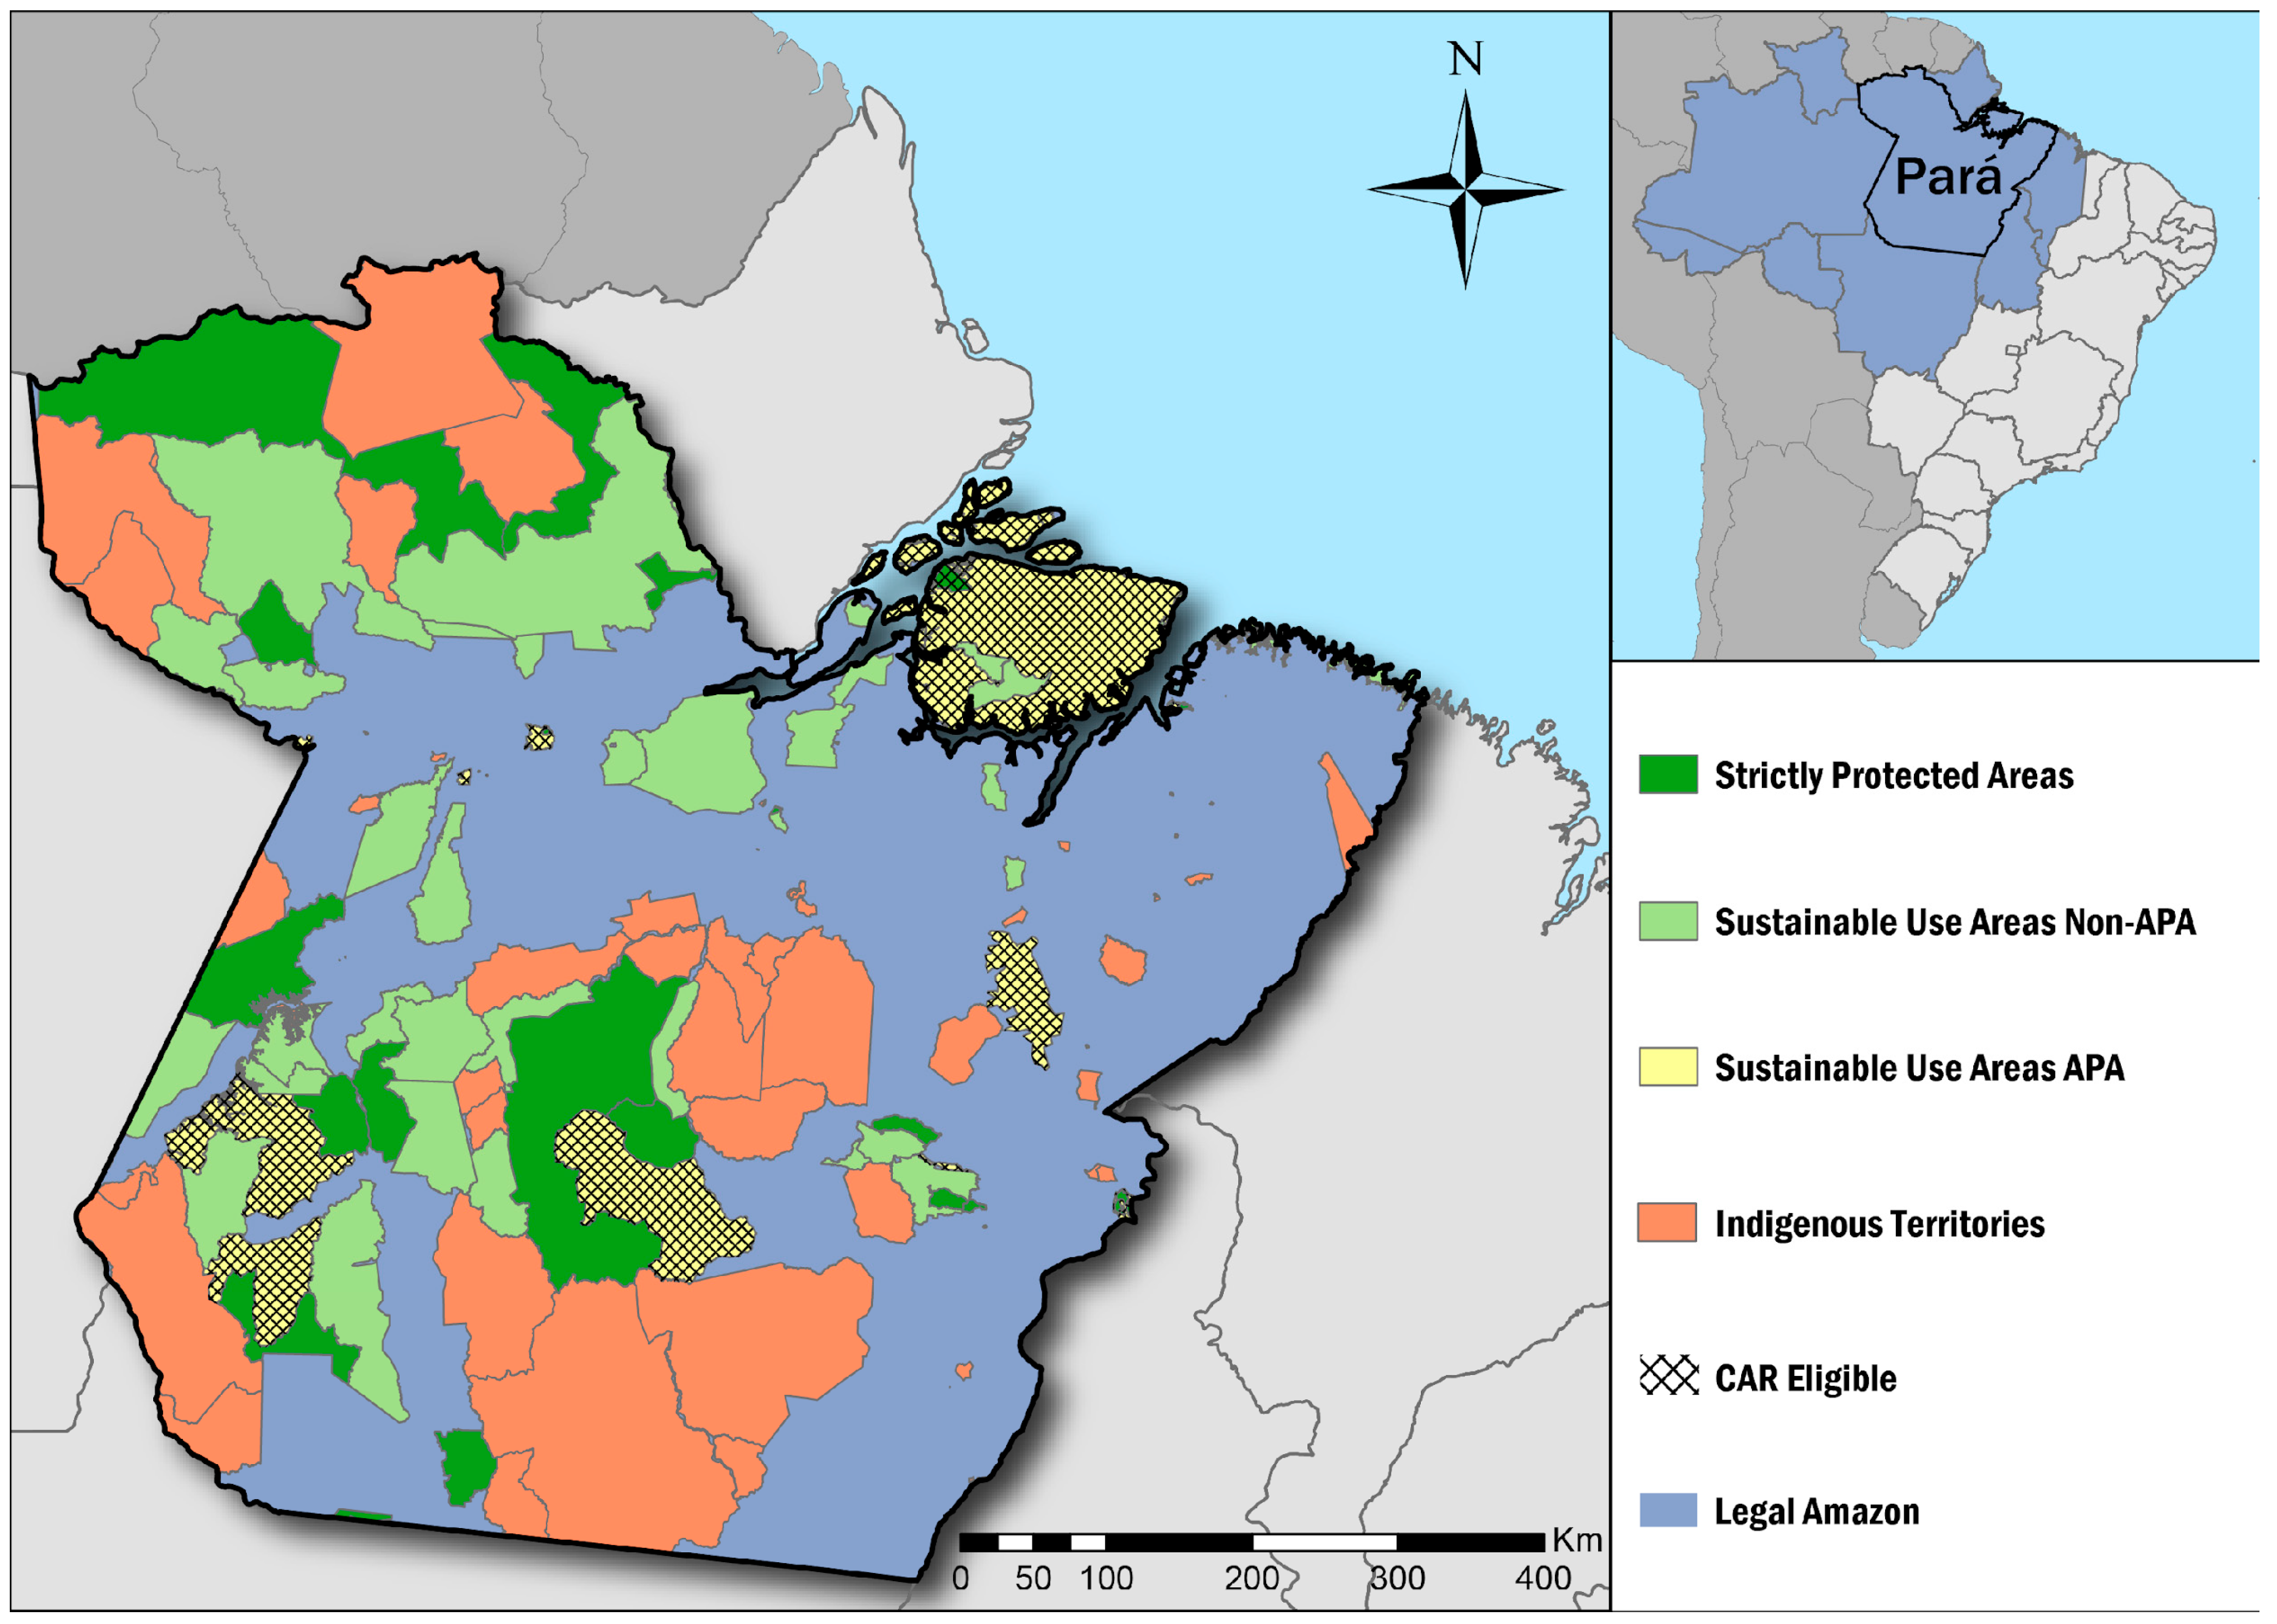
Figure 1.
Protected areas within the state of Pará stratified by category—Indigenous Territories, Strictly Protected Areas, Sustainable Use Areas classified as Área de Proteção Ambiental (APAs), and all other Sustainable Use Areas—and eligibility to declare properties in the Rural Environmental Register (CAR). Inset showing the Legal Amazon and the state of Pará.
2.2. Datasets (See Table S1 in the Supplement for Complete Documentation of Data Sources)
2.2.1. Protected Areas
All conservation units and ITs with any spatial overlap with the state of Pará were included in the study (Table 1). For PAs (conservation units and ITs) partially located within Pará, only the portion within the state of interest was analyzed. Boundaries for PAs were downloaded in 2022. Two older versions of the protected area maps, downloaded in 2014 and 2018, were used to assess whether any protected areas were added or removed, whether boundaries had changed, and whether the status of ITs had changed over time. A total of 59 ITs, spanning over 30 Mha and inhabited by over 41,000 indigenous peoples from 358 different ethnicities [22,23], and 99 conservation units, spanning over 40 Mha, were identified with at least partial overlap with Pará as of 2022 (Figure 1). Throughout the paper, we report results separated into three groups of PAs: ITs, SPA conservation units, and SUPA conservation units. In some cases, we also report results for a specific type of SUPA called Áreas de Proteção Ambiental (APAs). We separate APAs from other SUPAs due to the fact that APAs have weaker protections and allow more types of activities than other PAs (Table 1).
To identify the most vulnerable areas, we selected the top 3 PAs within each category (ITs, SPAs, and SUPAs) that concentrated most of the indicators of human pressure analyzed here, which include the number and percent coverage of CAR properties, total deforestation, total pasture, and number of GTA transactions. We then calculated their distance to roads, cities, and other PAs as described in the “Spatial processing” section below.
2.2.2. Property Maps
To identify properties located within PAs, we primarily used three snapshots of the Pará CAR. The CAR is a self-declaratory property registry for environmental monitoring; most property boundaries have not been validated by the state environmental agencies tasked with this effort. As a result, the dataset contains overlaps between properties along with other spatial inaccuracies. For our analysis, we assume that registries made in PAs represent real claims and that the influence of any spatial inaccuracies and any overlaps between registries have a minimal impact on the results presented here, since registries within PAs are often not directly adjacent to other registries.
We downloaded property boundaries by municipality in January 2017, December 2020, and January 2023 from the CAR database hosted by the Ministry of the Environment (Sicar). By comparing versions of the CAR over a six-year period, we were able to observe how property registration within PAs changed over time. To identify properties located within PAs, we applied the minimum overlap requirements documented in the “Protocolo de Monitoramento de Fornecedores de Gado da Amazônia” (Table S2) [24].
2.2.3. Cattle Transactions
The Guia de Trânsito Animal (GTA) is a national registry that tracks movements of cattle and other animals between farms and to slaughterhouses, primarily for the purposes of monitoring animal health. GTA documents are required to be submitted in order to transport cattle. We downloaded GTA transactions for Pará for the years 2013–2022, imported them into a PostgreSQL database, and integrated them with several different property maps, in order to map the locations of as many GTA properties as possible (see Table S1 for list of property datasets used to map GTA transactions). More details of the process of integrating GTA transactions with property maps are described in West et al., 2022 [11].
Each GTA lists several pieces of information, such as the date it was issued, the species and number of animals being transported, the farm name and person/company name for both the selling and buying of property, and the transaction “finalidade” or purpose. Slaughter and fattening were the most common purposes listed in the Pará GTA during the 2013–2022 study period, accounting for 92% of the transactions and 91% of all cattle heads. Other less common purposes included export, reproduction, quarantine, and auction. We considered transactions with a purpose of slaughter or export to be “direct” transactions, meaning that cattle were sold by a farm directly to a company for a “final” purpose—the animal will be either slaughtered or sold alive out of the country. All other transaction purposes, such as fattening or reproduction, were considered indirect, meaning intermediate transactions between farms preceding a final direct sale for slaughter or export. An example of an indirect transaction could be a GTA that states that an X number of cattle heads were sold between farm A and farm B for the purpose of “Engorda” (fattening). These cattle will eventually be sold directly to a slaughterhouse or exporting company in a future transaction.
Within the category of indirect transactions, we also identified “tier-1 indirect transactions”, which we defined as indirect transactions where the buyer sold for slaughter or export, 365–730 days (1–2 years) later. We used this time lag between the indirect and direct transactions to account for the time that cattle typically spend on a fattening farm before being sold for slaughter. We consider tier-1 direct suppliers to be part of a slaughterhouse’s supply chain given that they supply cattle to a farm that will sell directly to said slaughterhouse.
2.2.4. Other Datasets
Brazil’s Instituto Nacional de Pesquisas Espaciais (INPE) runs a program called PRODES that monitors the annual deforestation of primary forest across all biomes of Brazil. Once an area has been identified as cleared in a given year, it is masked out and labeled as “deforestation in X year” for all future years. While most of the study region is located in the Amazon Biome, portions of it are located within the Cerrado. In order to capture annual deforestation in both biomes up to 2022, we used INPE’s PRODES Brasil 2022 product, which converts a biome-level deforestation map into a raster covering the entire country. We used this map to identify deforestation within PAs and estimate the amount of remaining primary vegetation on properties within PAs.
Additionally, we used MapBiomas collection 8.0 to identify annual pasture area and crop cover within PAs. The MapBiomas 8.0 collection contains annual landcover maps for the entire country of Brazil for 1985–2022 with over 30 land use classes, including pasture and several different crops.
A map of federal highways (“Rodovias Federais”) produced by Brazil’s National Department of Transport Infrastructure (DNIT) was downloaded from the LAPIG lab at the Federal University of Goiás in order to obtain the distance of PAs from roads. We filtered out non-major roads by excluding those described as still being planned (i.e., not yet built), natural paths, and crossings. Finally, a map of urban locations (cities, villages, and capitals) was downloaded from IBGE in order to estimate the distance of PAs from cities, and it was filtered to only include cities (“Cidade”).
We downloaded two different maps of embargo areas, one from the Instituto Brasileiro do Meio Ambiente e dos Recursos Naturais Renováveis (IBAMA) and one from the Instituto Chico Mendes de Conservação da Biodiversidade (ICMBio). These maps were used to identify embargo areas within PAs and compare them to people listed in the GTA.
2.3. Spatial Processing
All spatial datasets were reprojected to SRID 102033, South America Albers Equal Area Conic. All datasets in vector/shapefile format—CAR boundaries, PA boundaries, IBAMA embargo boundaries—were imported to a PostgreSQL database. PostGIS version 2.4 functions were used to perform area calculations on the vector datasets within the PostreSQL version 9.5 database. Specifically, the PostGIS functions “st_area” and “st_intersection” were used to calculate areas of intersection between CAR property boundaries and the other vector spatial datasets, such as the PA map. Area calculations involving raster datasets—MapBiomas 8.0 annual land cover and Prodes-Brasil 2022 deforestation map—were performed in ArcGIS Pro version 3.2. The ArcGIS Pro function “Tabulate Area” was used to calculate the area of each land cover class within each CAR and each PA boundary. The PostGIS function “st_distance” was used to calculate straight-line distances, such as the distance from the edge of each study PA to the nearest federal highway.
To evaluate whether CAR properties, deforestation, or pasture were moving further into the interior of the PAs over time, we measured the straight-line distance from each dataset to the nearest edge of the PA they were located within. To do this, first, the ArcGIS Pro function “Polygon to Line” was used to convert PA polygons to outlines of their boundaries. These boundary outlines were then imported to PostgreSQL. The ArcGIS Pro functions “Extract by Attributes”, “Extract by Mask”, and “Raster to Point” were then used, first, in the case of pasture for example, to extract the pixels classified as pasture (class 15) from MapBiomas 8.0, 2010–2022; second, only the pasture pixels located within the study PAs were extracted; third, the pixels located within PAs were converted to points (located at the centroid of each pixel). These points were then imported to PostgreSQL and the PostGIS function “st_distance” was used to calculate the distance from each pasture point to the edge of the PA. This same process was repeated using the Prodes raster to calculate the annual distance of deforestation pixels to the edge of the PAs that they are located within.
3. Results
3.1. Main Results
Most PAs, over 70%, had CAR-registered properties within their boundaries, with a 25% increase in the number of properties within PAs since 2017. While properties only covered 1.3% (~400,000 ha) of the area encompassed by ITs, SPAs combined had ~2 Mha or 16% of their area covered by CAR properties, and SUPAs combined had over 8 Mha or ~30% of their surface covered by CAR properties. Deforestation within PAs in the state of Pará more than doubled in the last 4 years of data (2019–2022) compared to the previous 4, increasing from 217,196 ha to 463,858 ha. This trend was especially pronounced in ITs, where deforestation increased by nearly 400% during that period, reaching 102,472 ha in 2022. Overall, deforestation in PAs for the 2019–2022 period represents nearly a quarter of all deforestation in Pará. Most deforestation in APAs happened within CAR-registered properties, compared to non-APA SUPAs and SPAs, where most deforestation occurred in non-registered areas, highlighting the clandestine nature of land-use activities in PAs where CAR registration is not allowed. While most (86%) of the deforestation occurred within CAR properties in ITs that had not yet obtained full recognition, this trend was reversed for ratified ITs which only had 2% of their deforestation in registered areas.
Over 90% of all PAs had pasture, most of it found within CAR-registered areas. However, only half of the PAs had registered cattle transactions. While the purpose of cattle transactions registered within PAs shifted during our study period, with a decrease in direct sales to slaughterhouses and an increase in indirect transactions, there were still nearly 13,500 transactions that could be directly linked to slaughterhouses in the last 4 years, 60% of which involved CA slaughterhouses that have agreed to monitor their suppliers and block purchases from properties within PAs. Additionally, we found indications that illegal activities, including deforestation and property registrations, are slowly encroaching and moving towards the interior of different types of PAs. Finally, our results show that agricultural pressure is highly concentrated, with 17 high-risk PAs containing almost 80% of all CAR properties, 84% of all deforestation, 92% of all pasture, and 86% of all GTA transactions.
3.2. Property Registration within PAs
According to Brazilian legislation, only 22 out of 158 total PAs in Pará (2 SPAs and 20 SUPAs), covering just 9 Mha out of the 71.5 Mha of protected land (12.5%) in the state, are eligible for private property registration in the CAR (Figure 1). However, as of January 2023, we found a total of 16,026 properties registered in 115 out of the 158 PAs in Pará. Out of these registrations, 77% were within a specific type of SUPA called Áreas de Proteção Ambiental (APAs), 15% within all other types of SUPAs, 3% within SPAs, and 4% in ITs. Properties in PAs amount to ~11 M ha, overlapping with 15% of the total protected extent. While most individual CAR property registrations were made in eligible PAs (71% in 2017, 73.5% in 2020, and 77% in 2023), these registrations accounted for only 46% of the total declared area. The remaining 54% of areas registered in the CAR within PAs, totaling 5.8 Mha, were located in 116 PAs that do not permit private ownership.
Property registrations inside Pará’s PAs outpaced those in the state overall between 2017 and 2023. Within the PAs, there was a 31% increase for the 2017–2020 period, and an additional 22% increase in 2020–2023 (from 10,032 properties in 2017 to 13,135 in 2020 and 16,026 in 2023), compared to 22% and 17% for the state overall. When looking at the different PA categories, we see that APAs are mainly driving this trend. Properties in APAs increased by 35% and 28% during our study periods (from 7129 properties to 9656 and then 12,360), accounting for 81% of the newly declared properties in 2017–2020 and 94% of the 2020–2023 ones. The number of private properties in both, other SUPAs and SPAs, has also grown steadily though more slowly, with a 21% and 16% increase from 2017 to 2020 respectively (from 1607 properties to 1937 for other SUPAs and from 377 to 438 for SPAs), and a 26% and 24% increase from 2020 to 2023 (to 2450 properties in 2023 for other SUPAs and to 542 for SPAs) (Figure 2).
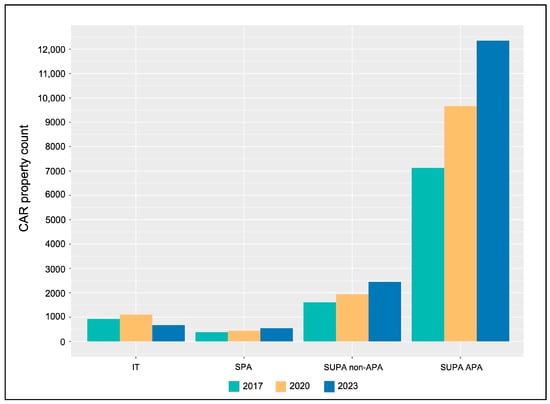
Figure 2.
CAR-registered property count in 2017, 2020, and 2023 for each protected area category, Indigenous Territories (ITs), Strictly Protected Areas (SPAs), Sustainable Use Areas (SUPAs) classified as Área de Proteção Ambiental (APAs), and all other SUPAs in the state of Pará.
ITs have had a less consistent trend, with a 20% increase in the 2017–2020 period (from 919 to 1104 properties) for all IT statuses, followed by a 39% decrease in 2023 (to 674 properties). Properties were also registered within ITs with full ratification, where such registrations are expressly prohibited, which indicates that the achievement of formal governmental recognition does not actually prevent people from claiming indigenous land. This was particularly true under Bolsonaro’s administration (2019–2022), when indigenous claims to their territories were widely recognized as not being enforced [5]. Indeed, we found an increase in the number of properties registered within ratified ITs for the 2017–2020 period, with 80 new properties distributed across 13 of the 43 ITs with this final, full recognition status. Interestingly, this trend was also mostly reversed during the 2020–2023 period, where only 8 new properties were registered in 6 ratified ITs, while 477 properties from 17 ITs were removed from the register; 378 of those (79%) came from 1 IT, Cachoeira Seca, which was targeted by Pará state authorities due to its high level of deforestation and land grabbing [25] (OCCRP, 2022).
Out of the three types of PAs, ITs had the fewest registered properties: altogether, only 401,000 ha or 1.3% of IT area was covered by CAR properties in January 2023. Most properties were concentrated in a few ITs, with the top 4 ITs with most declared properties encompassing ~79% of the area registered for this type of PA (Figure 3); 3 of them were ratified with full recognition status. All SPAs combined had ~2 Mha or 16% of their area covered by declared properties. Here again, most registered properties were concentrated in a few SPAs, with the top five encompassing over 89% of the declared area in this category (Figure 3). In contrast, SUPAs had over 8 Mha or ~30% of their area covered by CAR properties. While APAs represent a quarter of all SUPAs, they held 83% of all registered properties and ~60% of all registered areas in this category, amounting to over half of the APA total area, which is congruent with their CAR eligibility status. CAR properties were more evenly distributed among individual SUPAs than among the ITs and SPAs; however, the top four SUPAs with the most properties, all of them APAs, still concentrated 59% of the total declared area for this category (Figure 3).

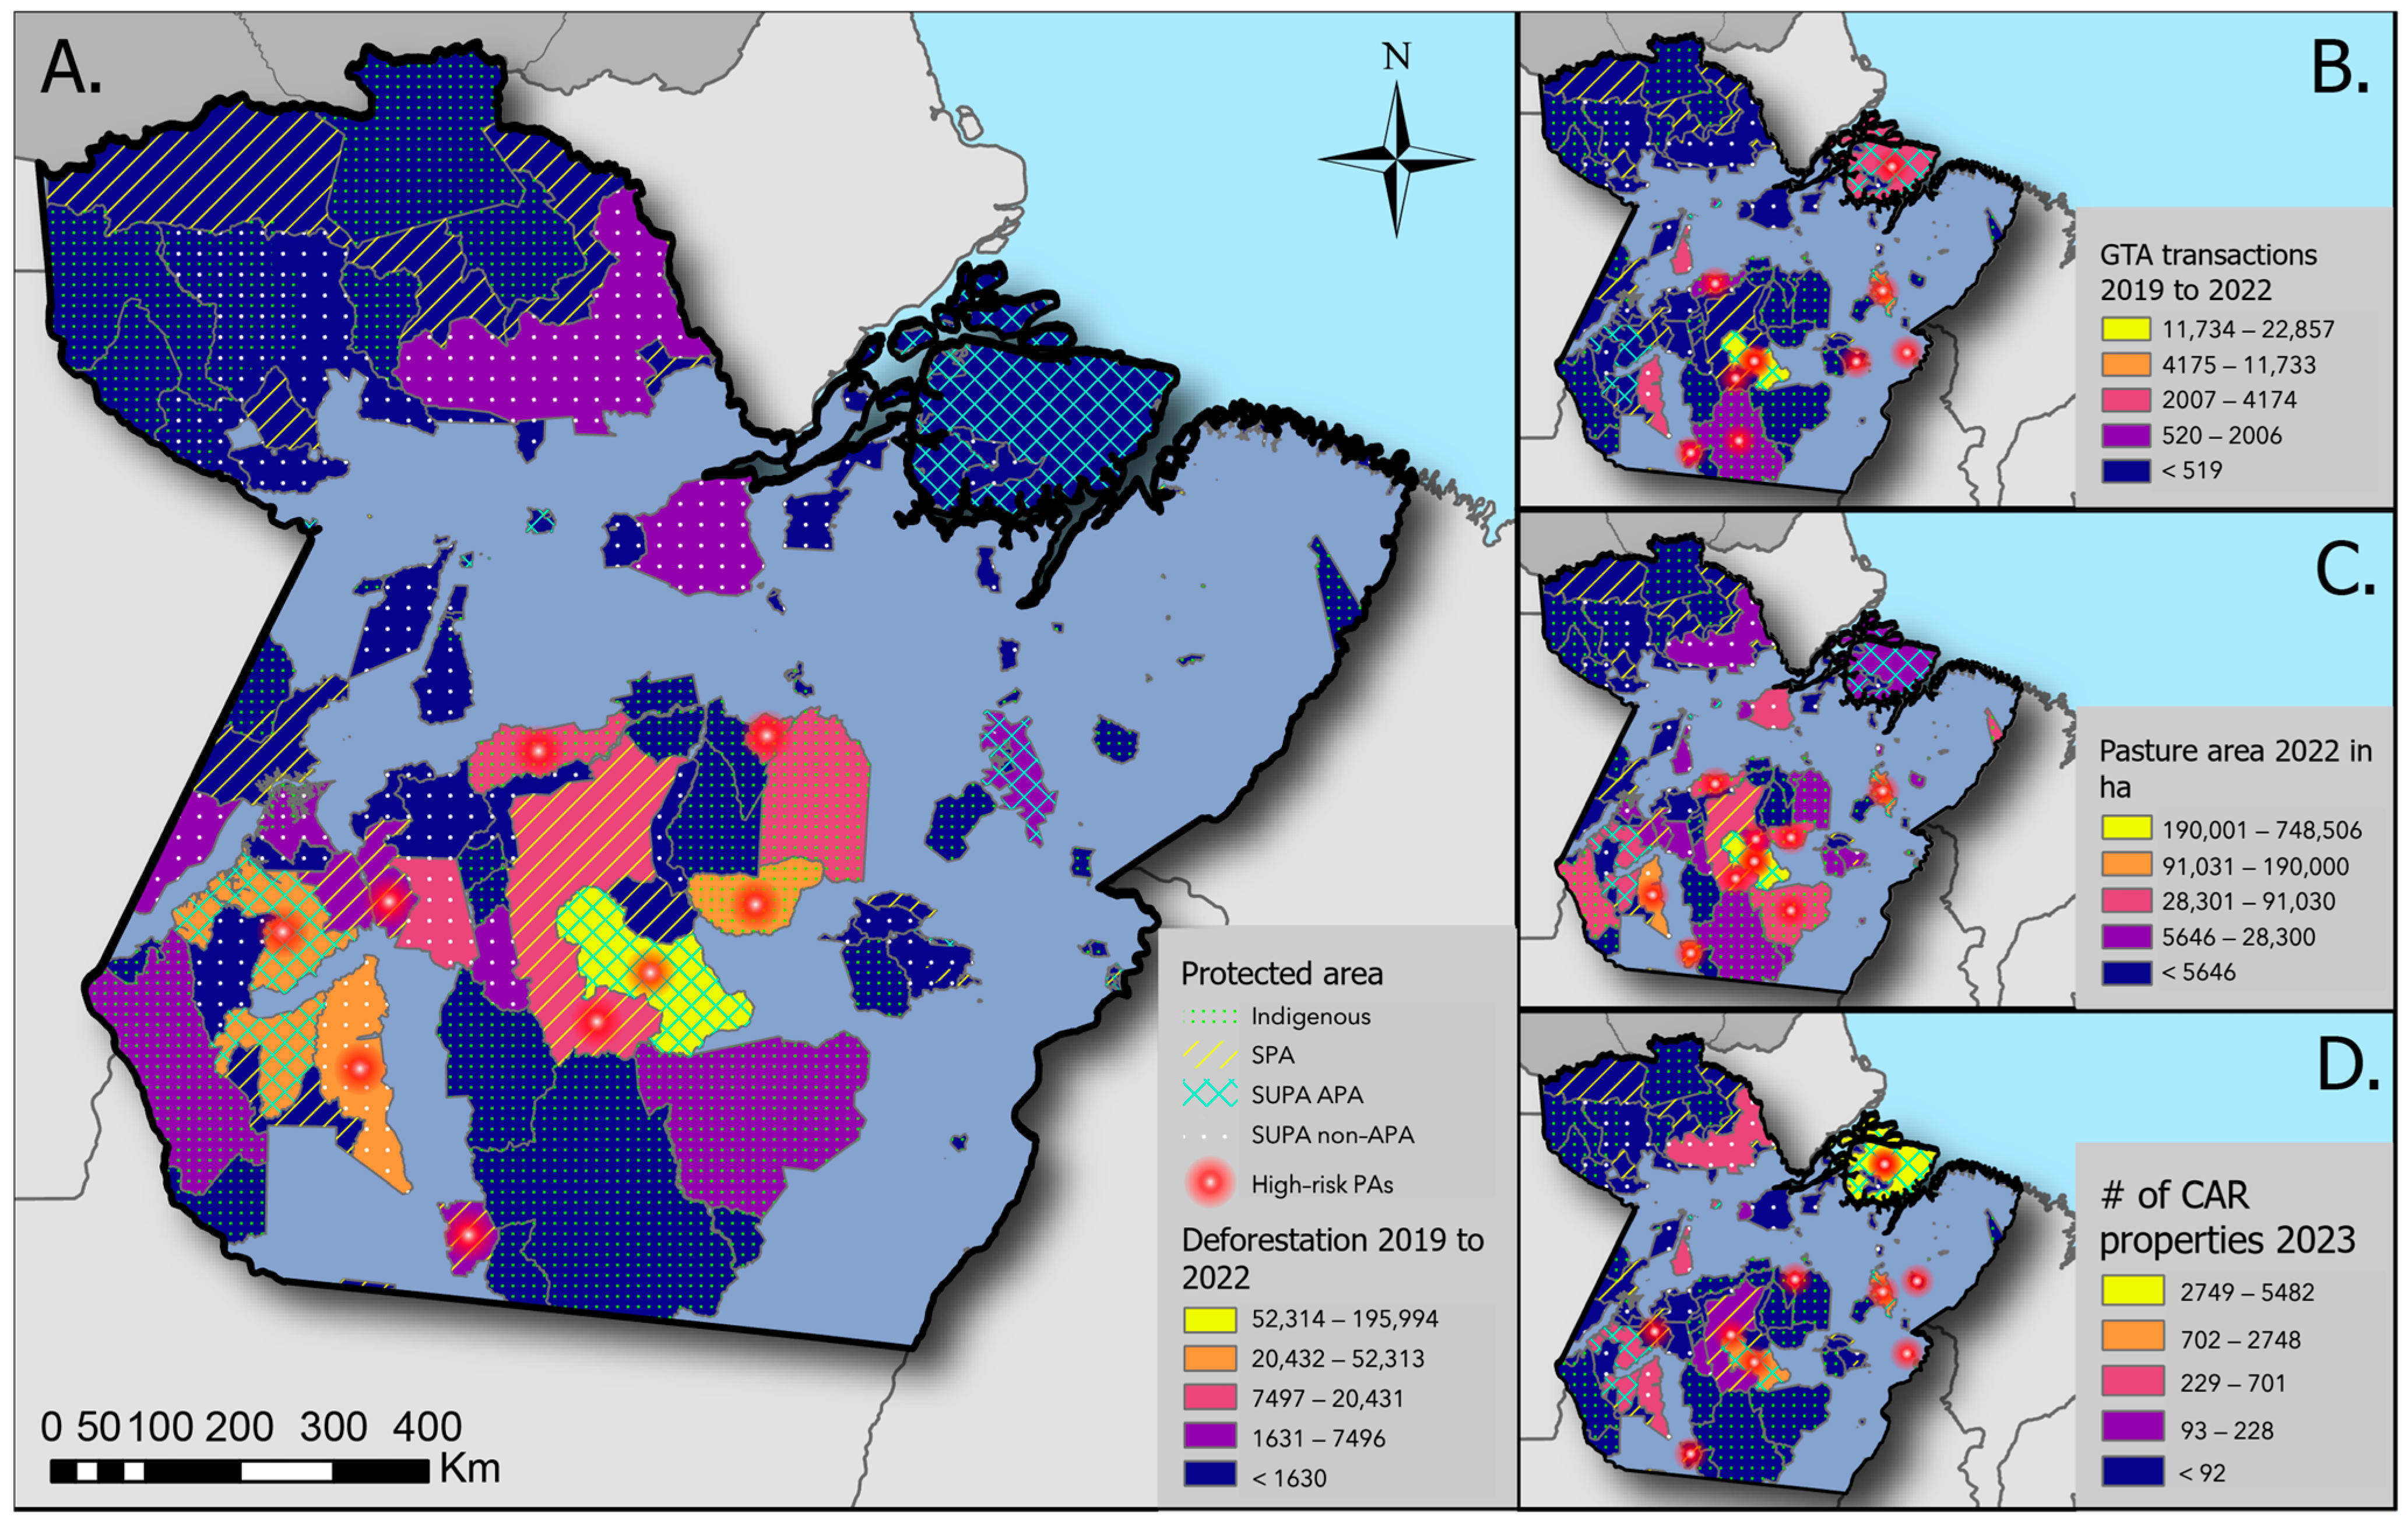
Figure 3.
(A) Protected areas (PAs) in the state of Pará classified according to the amount of deforestation (ha) during 2019–2022; (B) number of registered cattle transactions during 2019–2022; (C) amount of area covered by pasture (ha) in 2022; and (D) number of overlapping properties declared in the Rural Environmental Register (CAR) in January 2023. High-risk PAs of each category (top 3 PAs concentrating the most deforestation/GTA/pasture/CAR) are marked in red.
3.3. Deforestation
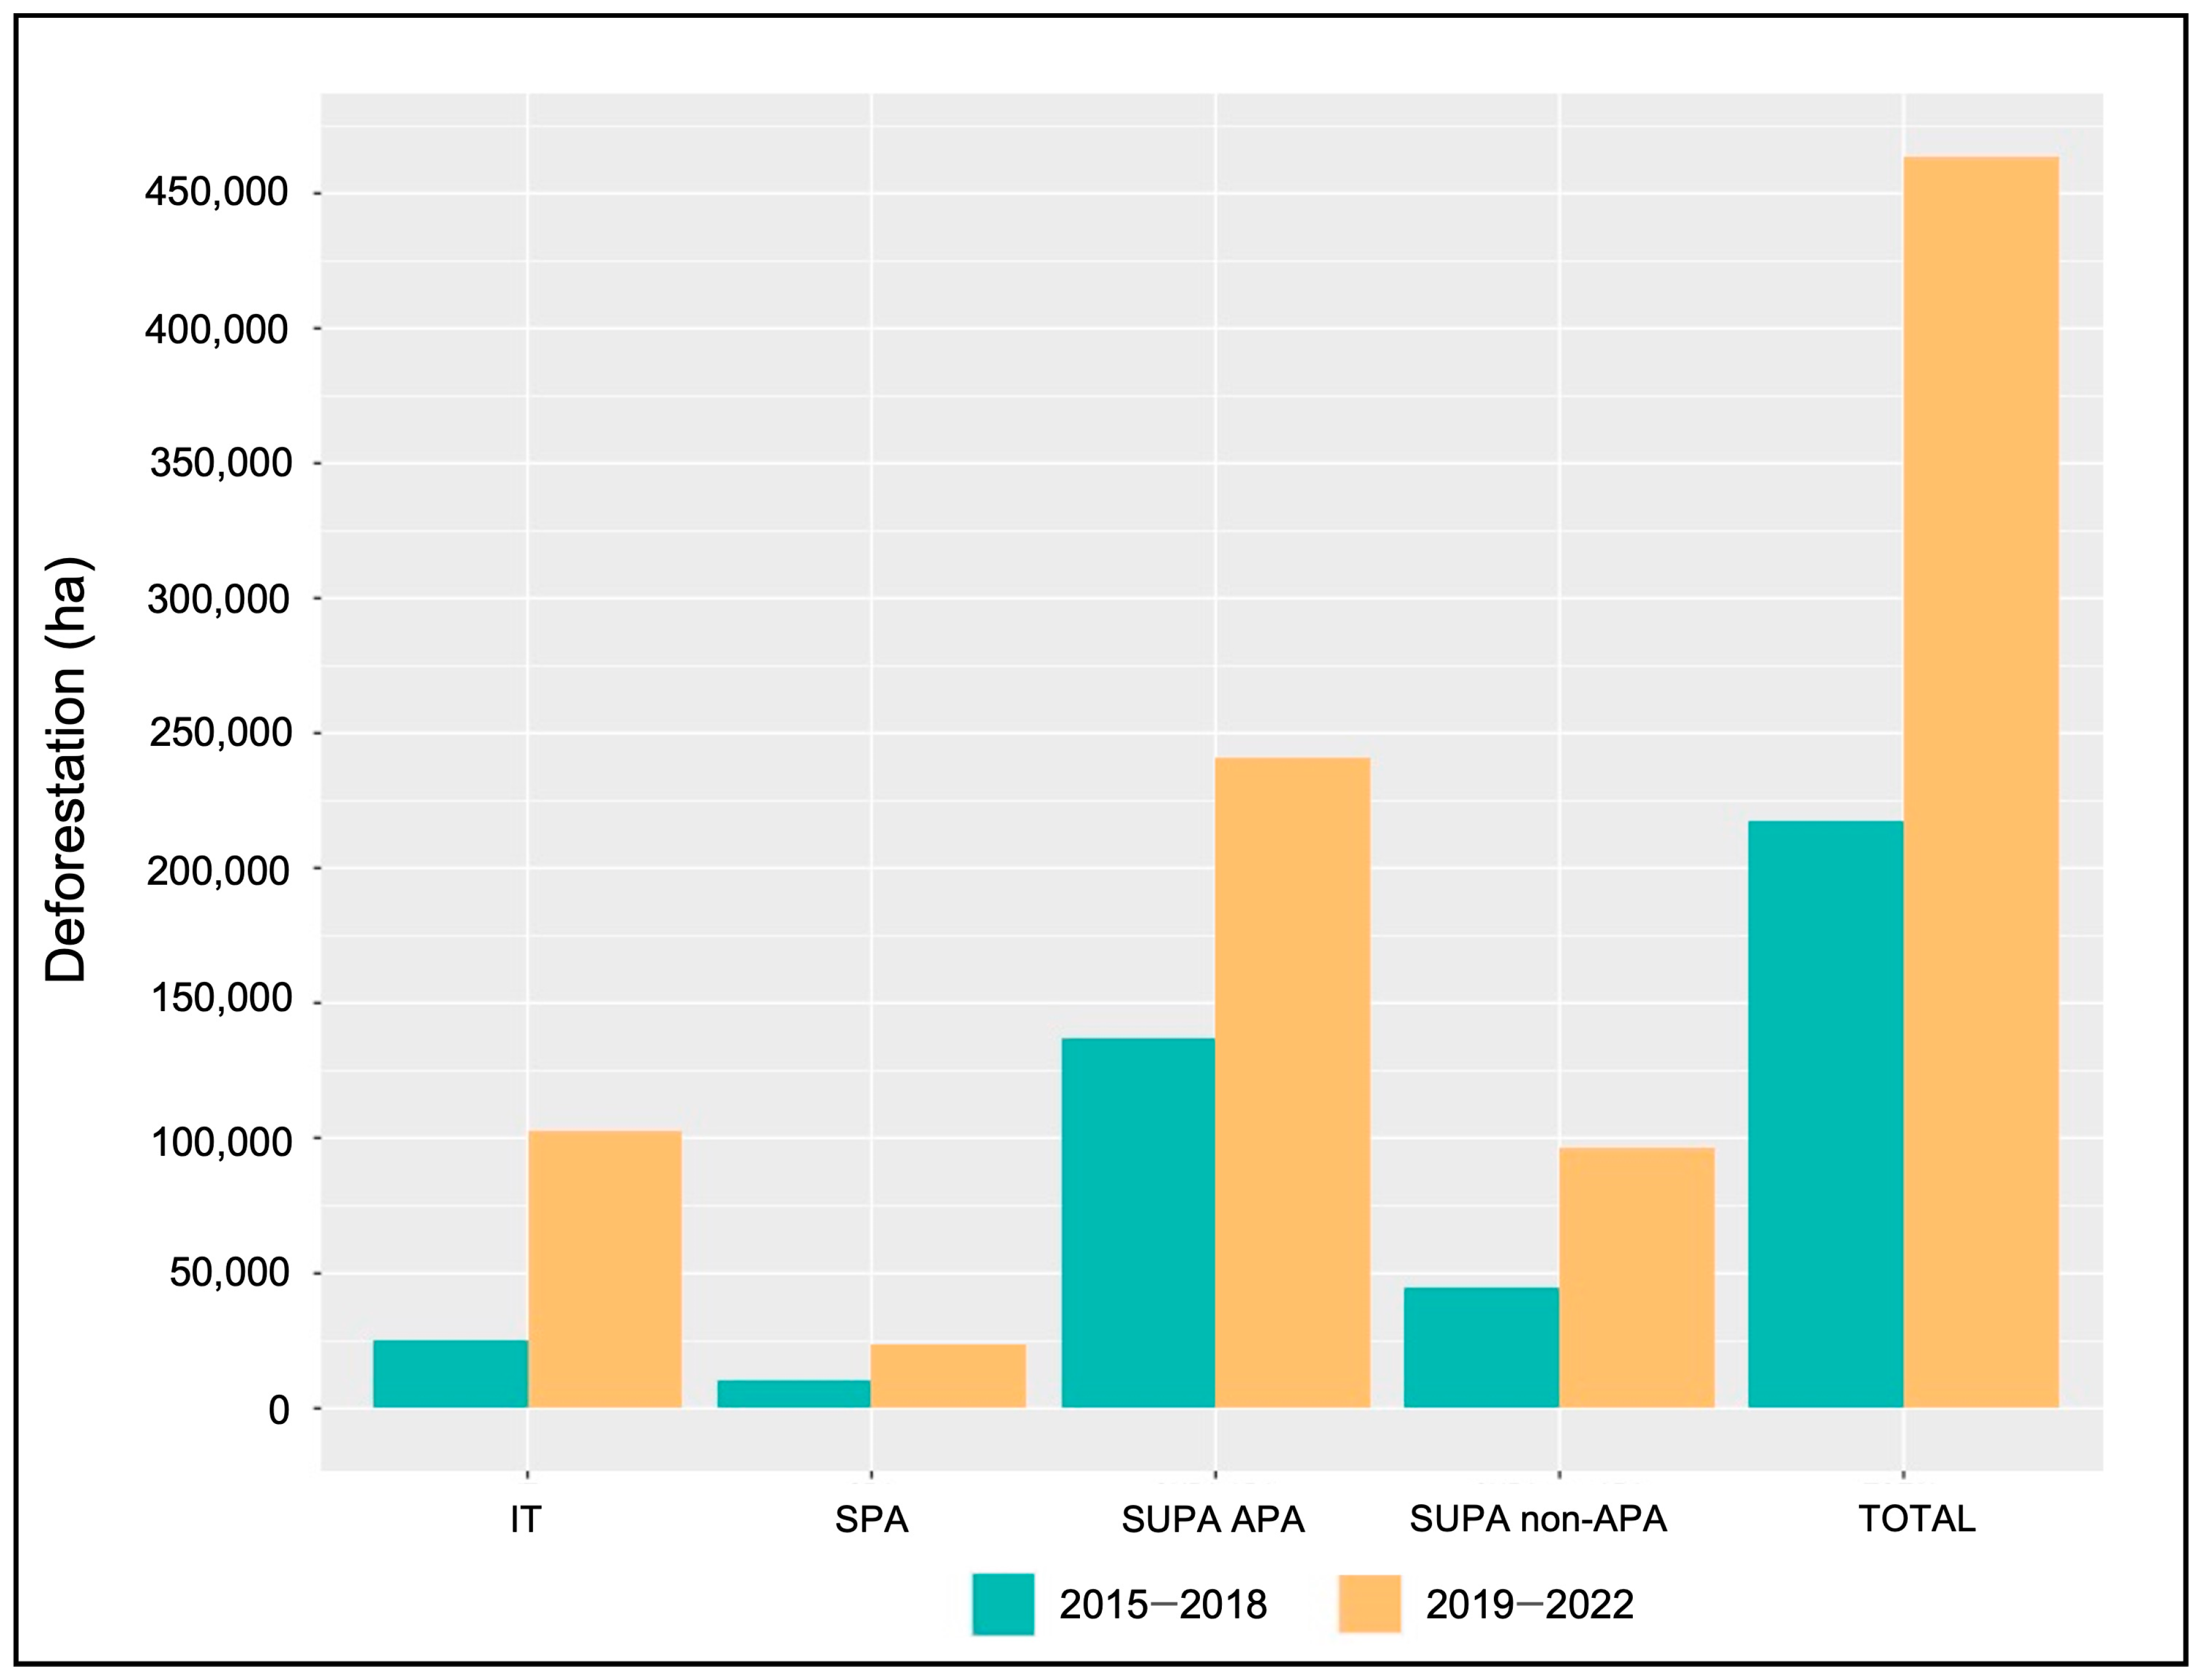
We found that the amount of cleared area within PAs more than doubled in the most recent 4 years of data when compared to the previous 4, going from a total of 217,196 ha of deforestation in 2015–2018 to 463,858 ha for the 2019–2022 period (Figure 4). This increase was most drastic in ITs, which had a deforestation area 4× larger for the 2019–2022 period, while SPAs, APAs, and other SUPAs had a 2.6×, 1.8× and 2.4× increase respectively. Altogether, the percentage of total deforested area in the state of Pará occurring within PAs has consistently increased throughout the last decade, going from 13% (2011–2014) to 20% (2015–2018) to 24% during the 2019–2022 time period.

Figure 4.
Area that was cleared within protected areas in the state of Pará during 2015–2018 and 2019–2022 stratified by protection category: Sustainable Use Areas classified as Areas de Proteção Ambiental (SUPA-APA); other Sustainable Use Areas (SUPA non-APA); Strictly Protected Areas (SPA); and Indigenous Territories (ITs).
Most deforestation within PAs has historically been concentrated in a small number of these areas, with over half of PAs having from 0 to 100 ha of cumulative deforested area since 2015. The number of PAs with more than 3000 ha of deforestation, however, has nearly doubled during our study period (n = 10 in 2015–2018, n = 19 in 2019–2022). Figure 3 shows the deforestation in each PA during 2019–2022, highlighting the contribution of the most deforested PAs in each category. In ITs, six PAs, five of which have full legal recognition, were responsible for 93% of the total deforestation in this category, with a combined cleared area of 95,366 ha during that period. While they clearly remain vulnerable to deforestation, we found ratified ITs had a lower percentage of their total area cleared (0.28% of the 28.3 Mha) when compared to ITs that have not been granted full recognition yet (0.82% of the 2.6 Mha). Among SPAs, three PAs were responsible for 95% of the total deforestation since 2019 in this category, with a combined area of 22,476 ha. In SUPAs, three APAs were responsible for 99% of the total deforestation in this category, and three non-APAs held 74% of the cleared area in other SUPAs; together, just these six units contained 92% of all deforestation in SUPAs with a combined cleared area of 310,070 ha.
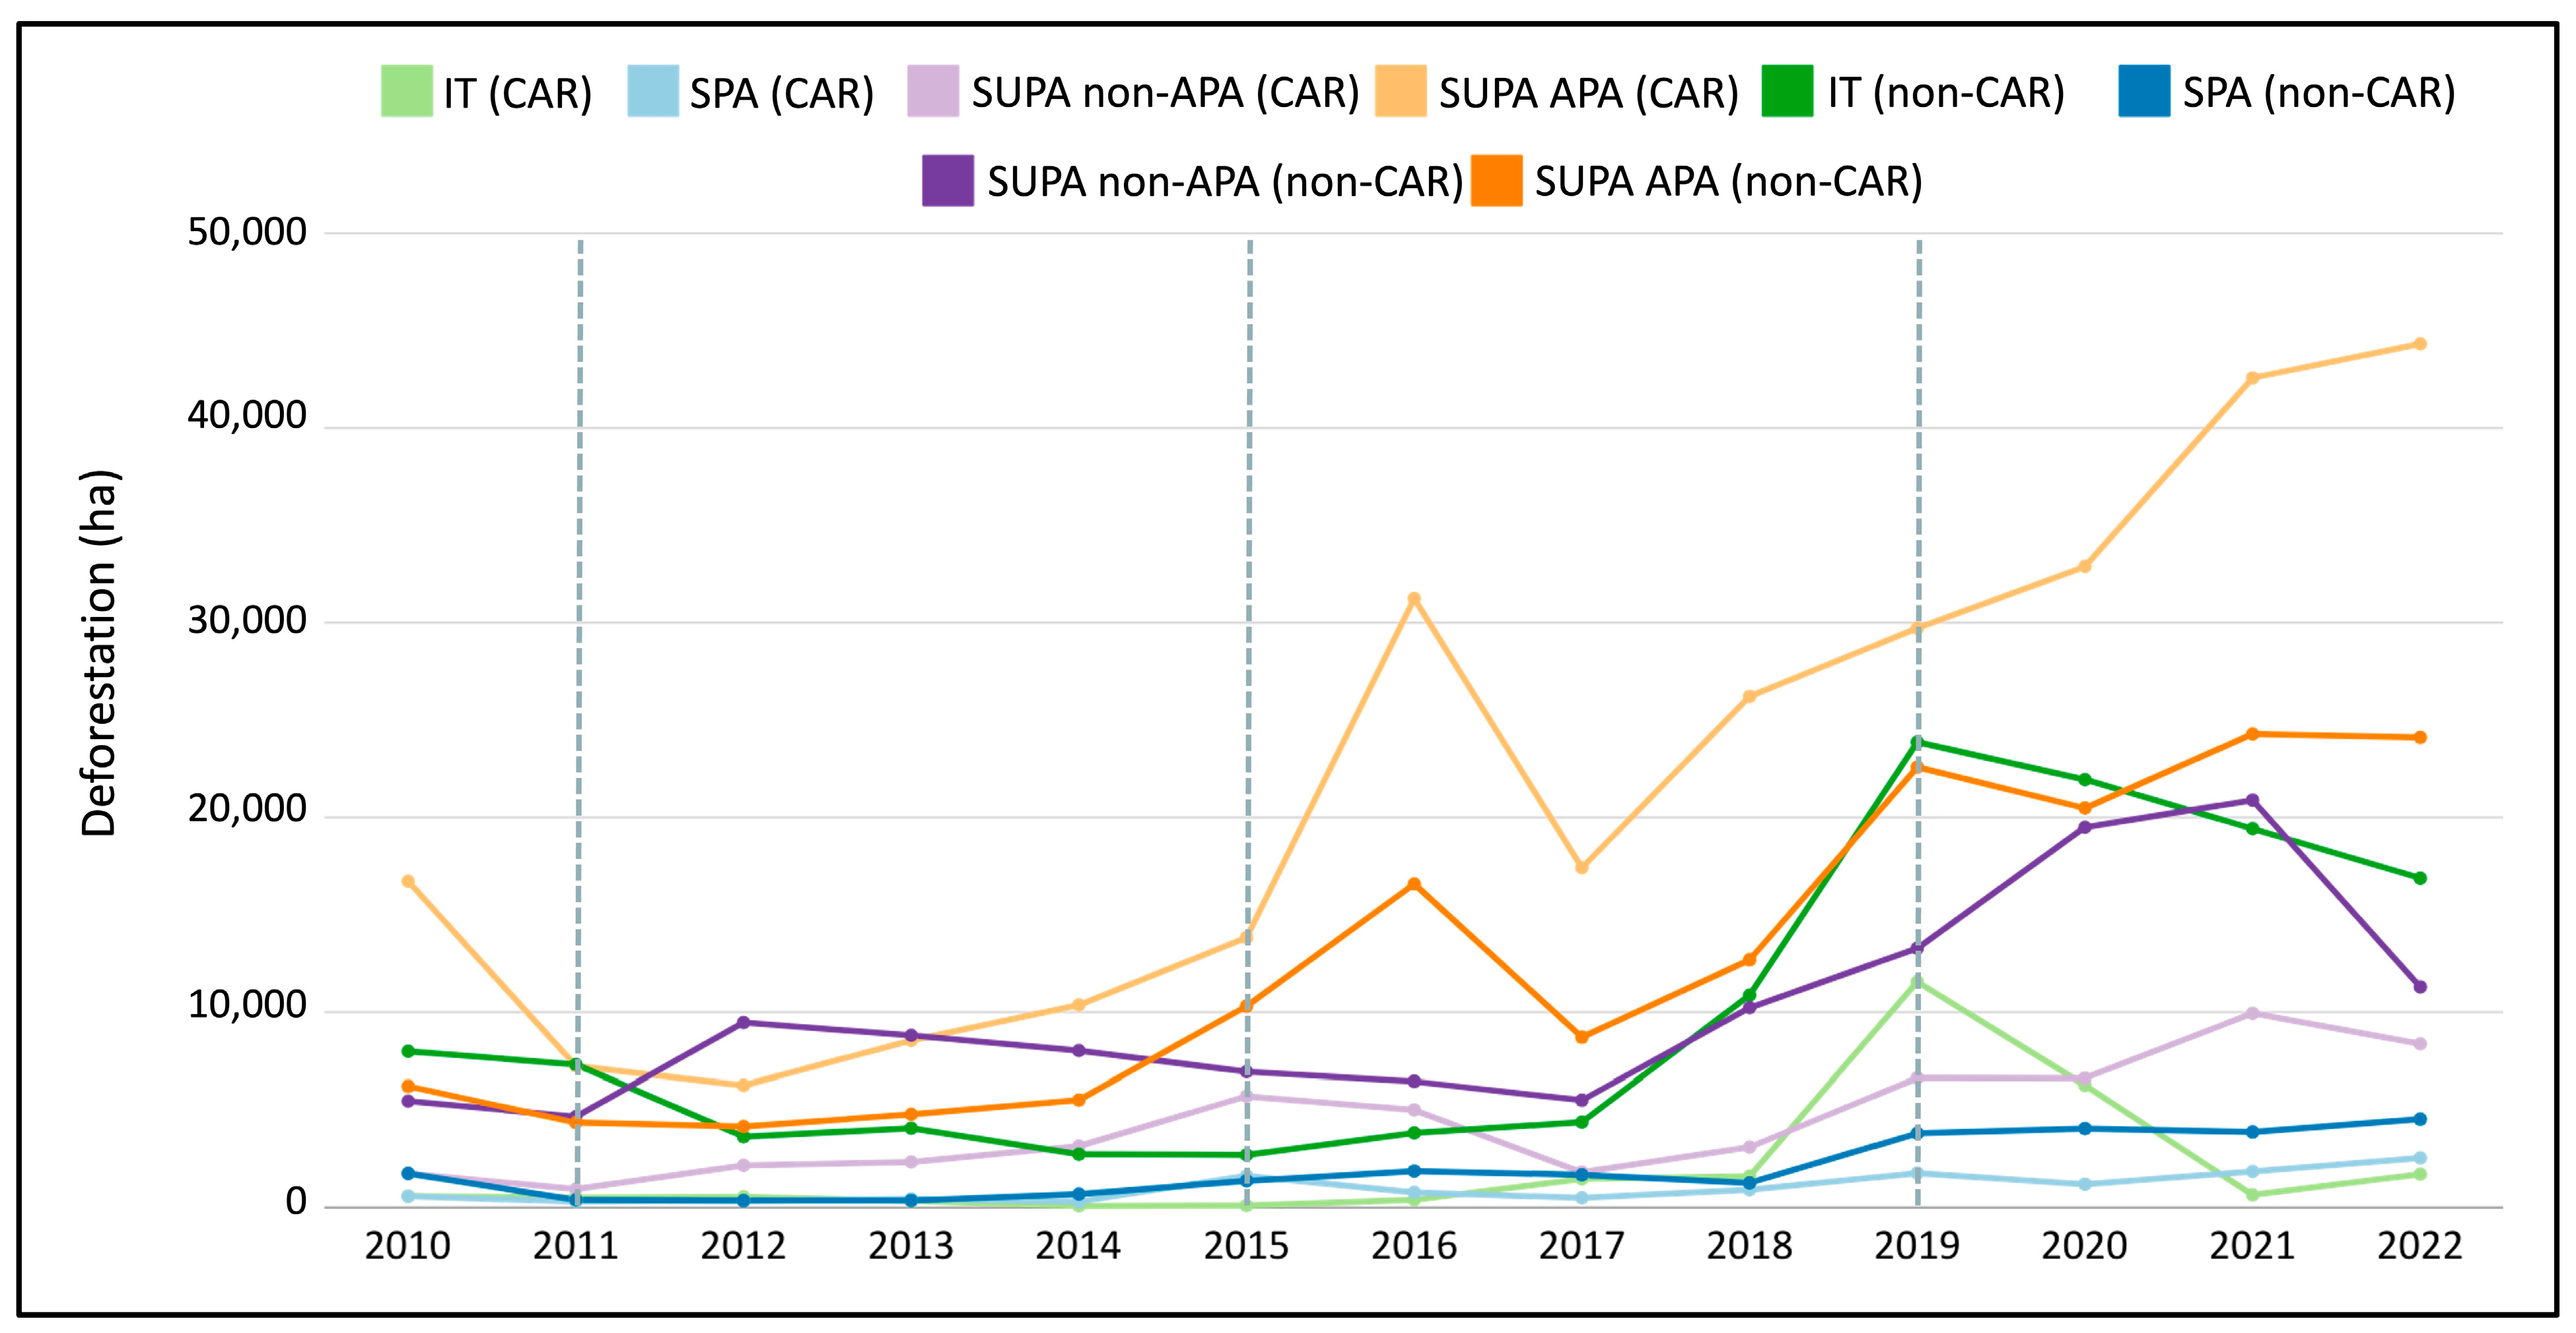
Nearly half (46% on average) of the deforested area contained within PAs each year from 2010 through 2022 overlapped with CAR-registered properties. As expected, the fraction of deforestation encompassed in registered properties was higher in SUPAs, given that most CAR-eligible PAs fall under this category. This trend was driven by the APAs, where average deforestation during that period was 26% higher within CAR properties compared to deforestation in areas within APAs that have not been registered (with values up to 47% higher in 2010) (Figure 5). This trend is mostly inverted when looking at other SUPAs, ITs, and SPAs. Deforestation has historically been higher in non-registered areas in these protected categories. SPAs and ITs, which are both CAR non-eligible, and where logging is not permitted, had 69% and 82%, respectively, of their deforestation in non-registered areas (Figure 5). When looking at the different stages of recognition of ITs, we found that there was a much larger percentage of the total deforestation contained in CAR properties for ITs that had not reached the final state of recognition. CAR properties accounted for 86% of the deforestation in non-ratified ITs, in contrast to ratified ones that had 2% of their deforestation occurring within declared properties.
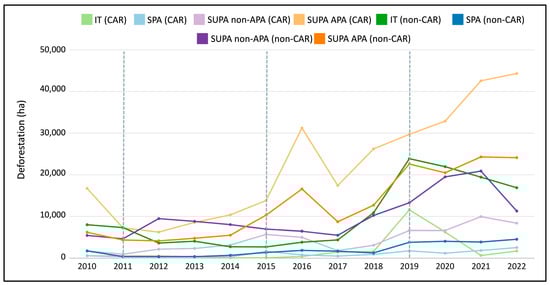
Figure 5.
Cleared area (ha) in four different protected area categories—Indigenous Territories (ITs), Strictly Protected Areas (SPAs), Sustainable Use Areas (SUPAs) classified as Área de Proteção Ambiental (APA), and other SUPAs—within CAR-declared properties (2023) and in non-registered areas in the state of Pará during 2010–2022. The dotted lines show the changes in administration.
3.4. Land Cover
While 63% of all Pará PAs had some kind of crop cover as of 2022 (areas classified in MapBiomas as soy and other temporary or perennial crops), crop areas only amounted to approximately 9180 ha of all protected areas. Conversely, 92% of all PAs (n = 146) had pasture, which summed to over 2 Mha in 2022. Over our study period, pasture area increased by 39%, going from an annual average of 1.2 Mha in 2015–2018 to 1.7 Mha in 2019–2022. The percentage of total pasture in the state of Pará within PAs also increased during this period, going from 6% (2015–2018) to 8% (2019–2022).
CAR properties in protected areas were associated with lower forest cover and higher pasture area than non-CAR areas. As expected, we also found that in both registered and non-registered areas, ITs, SPAs, and non-APA SUPAs tend to have more forest and less pasture than APAs (Table 2).
Table 2.
Percentage of land covered by primary forest and pasture within CAR-declared properties and in non-registered areas, for all categories of protected areas in the state of Pará in 2015–2022.
Overall, pasture in PAs has been historically concentrated within CAR-registered properties (57% on average for the 2010–2022 period). However, our findings show an increase in the amount of pasture in non-registered areas during our study period (42% 2016–2018, 46% 2019–2022). Looking at our most recent data (2022), we found that APAs had 77% of the pasture in CAR areas. On the contrary, ITs, SPAs, and non-APA SUPAs all had more pasture in non-registered areas (88%, 63%, and 52%, respectively) (Table 3).
Table 3.
Percentage of pasture outside CAR-declared properties, within properties that have registered GTA transactions, and within those that have not declared GTA transactions, for all categories of protected areas in the state of Pará in 2015–2022.
Similar to what we found regarding CAR properties and deforestation, most pasture was concentrated in just a few units for all PA categories. Indeed, six ITs had 73% of all IT pasture, four SPAs had 89% of all pasture encompassed in SPAs, four non-APA SUPAs had 73% of all the pasture in that category, and only three APAs concentrated 95% of all APA pasture (Figure 3).
When looking at the landcover within CAR-declared properties, we found that less than half of the private properties registered within PAs meet the standard Legal Reserve requirements for this region. Requirements state that 80% of forested land in the Amazon Biome and 35% of Cerrado land within the Legal Amazon must be preserved. Specifically, 64% of properties in PAs had deforested beyond the Forest Code Legal Reserve requirement. For CAR-eligible PAs, only 34% of properties met the Forest Code requirement, compared to 43% in PAs that do not allow CAR registration. Outside of PAs across the state of Pará, only 8% of all CAR properties met the Forest Code requirements.
This non-compliance trend has been the case for all three PA categories since 2017, when only a quarter of all properties had more than 80% of remaining forest. While the majority of the properties do not meet the Legal Reserve requirements stated in the Forest Code, the percentage of properties with sufficient Legal Reserve has increased over the last 6 years, by 11% in ITs and SUPAs and by 13% in SPAs. This trend may be the result of new properties being registered that have not yet been cleared. During the same period, the percentage of properties with less than 20% of forest remaining has decreased in SPAs and SUPAs, by 7.6% and 3.8% respectively, while it increased in ITs by 8.2%.
3.5. Registered Cattle Transactions
Despite how widespread pasture is within PAs, only half of them (n = 75) had associated cattle transactions registered in the GTA during 2013–2022. Less than 25% of all properties located in PAs (including those without pasture) were identified as having GTA activity. Additionally, only 33% of pasture within protected areas was located on properties identified in the GTA. Of all the PA properties found in the GTA, 75% were located in APAs, 15% in non-APA SUPAs, 8% in ITs, and 3% in SPAs. Cattle activity was associated with even lower rates of having sufficient Legal Reserve than the average PA property. Among properties within PAs that transacted cattle in the GTA, only 6% had the required Legal Reserves.
When looking into property ownership to better understand links between CAR registration, illegal deforestation, pasture with no GTA, and cattle sales, we found that out of all the CAR-registered properties that were located in the study PAs as of January 2023, 4531 (29%) had an owner that owned at least one additional property, located either inside or outside of PAs; 1913 (12%) had an owner that owned at least one additional property that was located outside of the study PAs; and 1174 (7%) had an owner that owned a property located outside of the study PAs that appeared in the GTA during the 2013–2022 study period.
Overall, more than 6 M heads of cattle were linked to properties in PAs during this time. The vast majority (85%) of the cattle transactions linked to PAs in the last decade are registered in SUPAs, with very little variation between years. In total, 69% of GTA transactions from properties within PAs came from APAs, 16% came from properties in non-APA SUPAs, 8% came from ITs, and 7% from SPAs. Here again, most transactions in the last 4 years were concentrated in a few PAs for all categories. The top three ITs account for ~80% of the total transactions in this category, the top four SPAs concentrate over 92% of all SPAs transactions, three non-APA SUPAs hold 79% of all transactions in this category, and the top four APAs account for 94% of the total cattle transactions in all APAs (Figure 3).
Between 2013 and 2022, 34% of the GTA transactions involving properties within PAs were sales either directly for slaughter or directly for export. An additional 25% of transactions were tier-1 indirect sales to slaughterhouses, where the purchasing property in turn sold directly for slaughter or for export 365–730 days after purchasing from the PA property, a standard timeline for considering a transaction as relevant for slaughterhouses seeking to monitor their first tier of indirect suppliers [11]. The remaining 41% of transactions were either purchases by PA properties (22%) or sales not classified as direct or tier-1 indirect (19%), likely representing movements of cattle in the lower tiers of supply chains, such as sales from tier-2 to tier-1 indirects. Overall, 54% of properties within PAs that were active in the GTA sold directly for slaughter or export at some point during 2013–2022. An additional 29% sold indirectly for slaughter or export at some point during that period, meaning they acted as tier-1 indirect suppliers. The remaining 17% either exclusively purchased cattle (but did not register any cattle sales) (7%) or sold cattle that were not connected directly or indirectly to slaughter or export (9%).
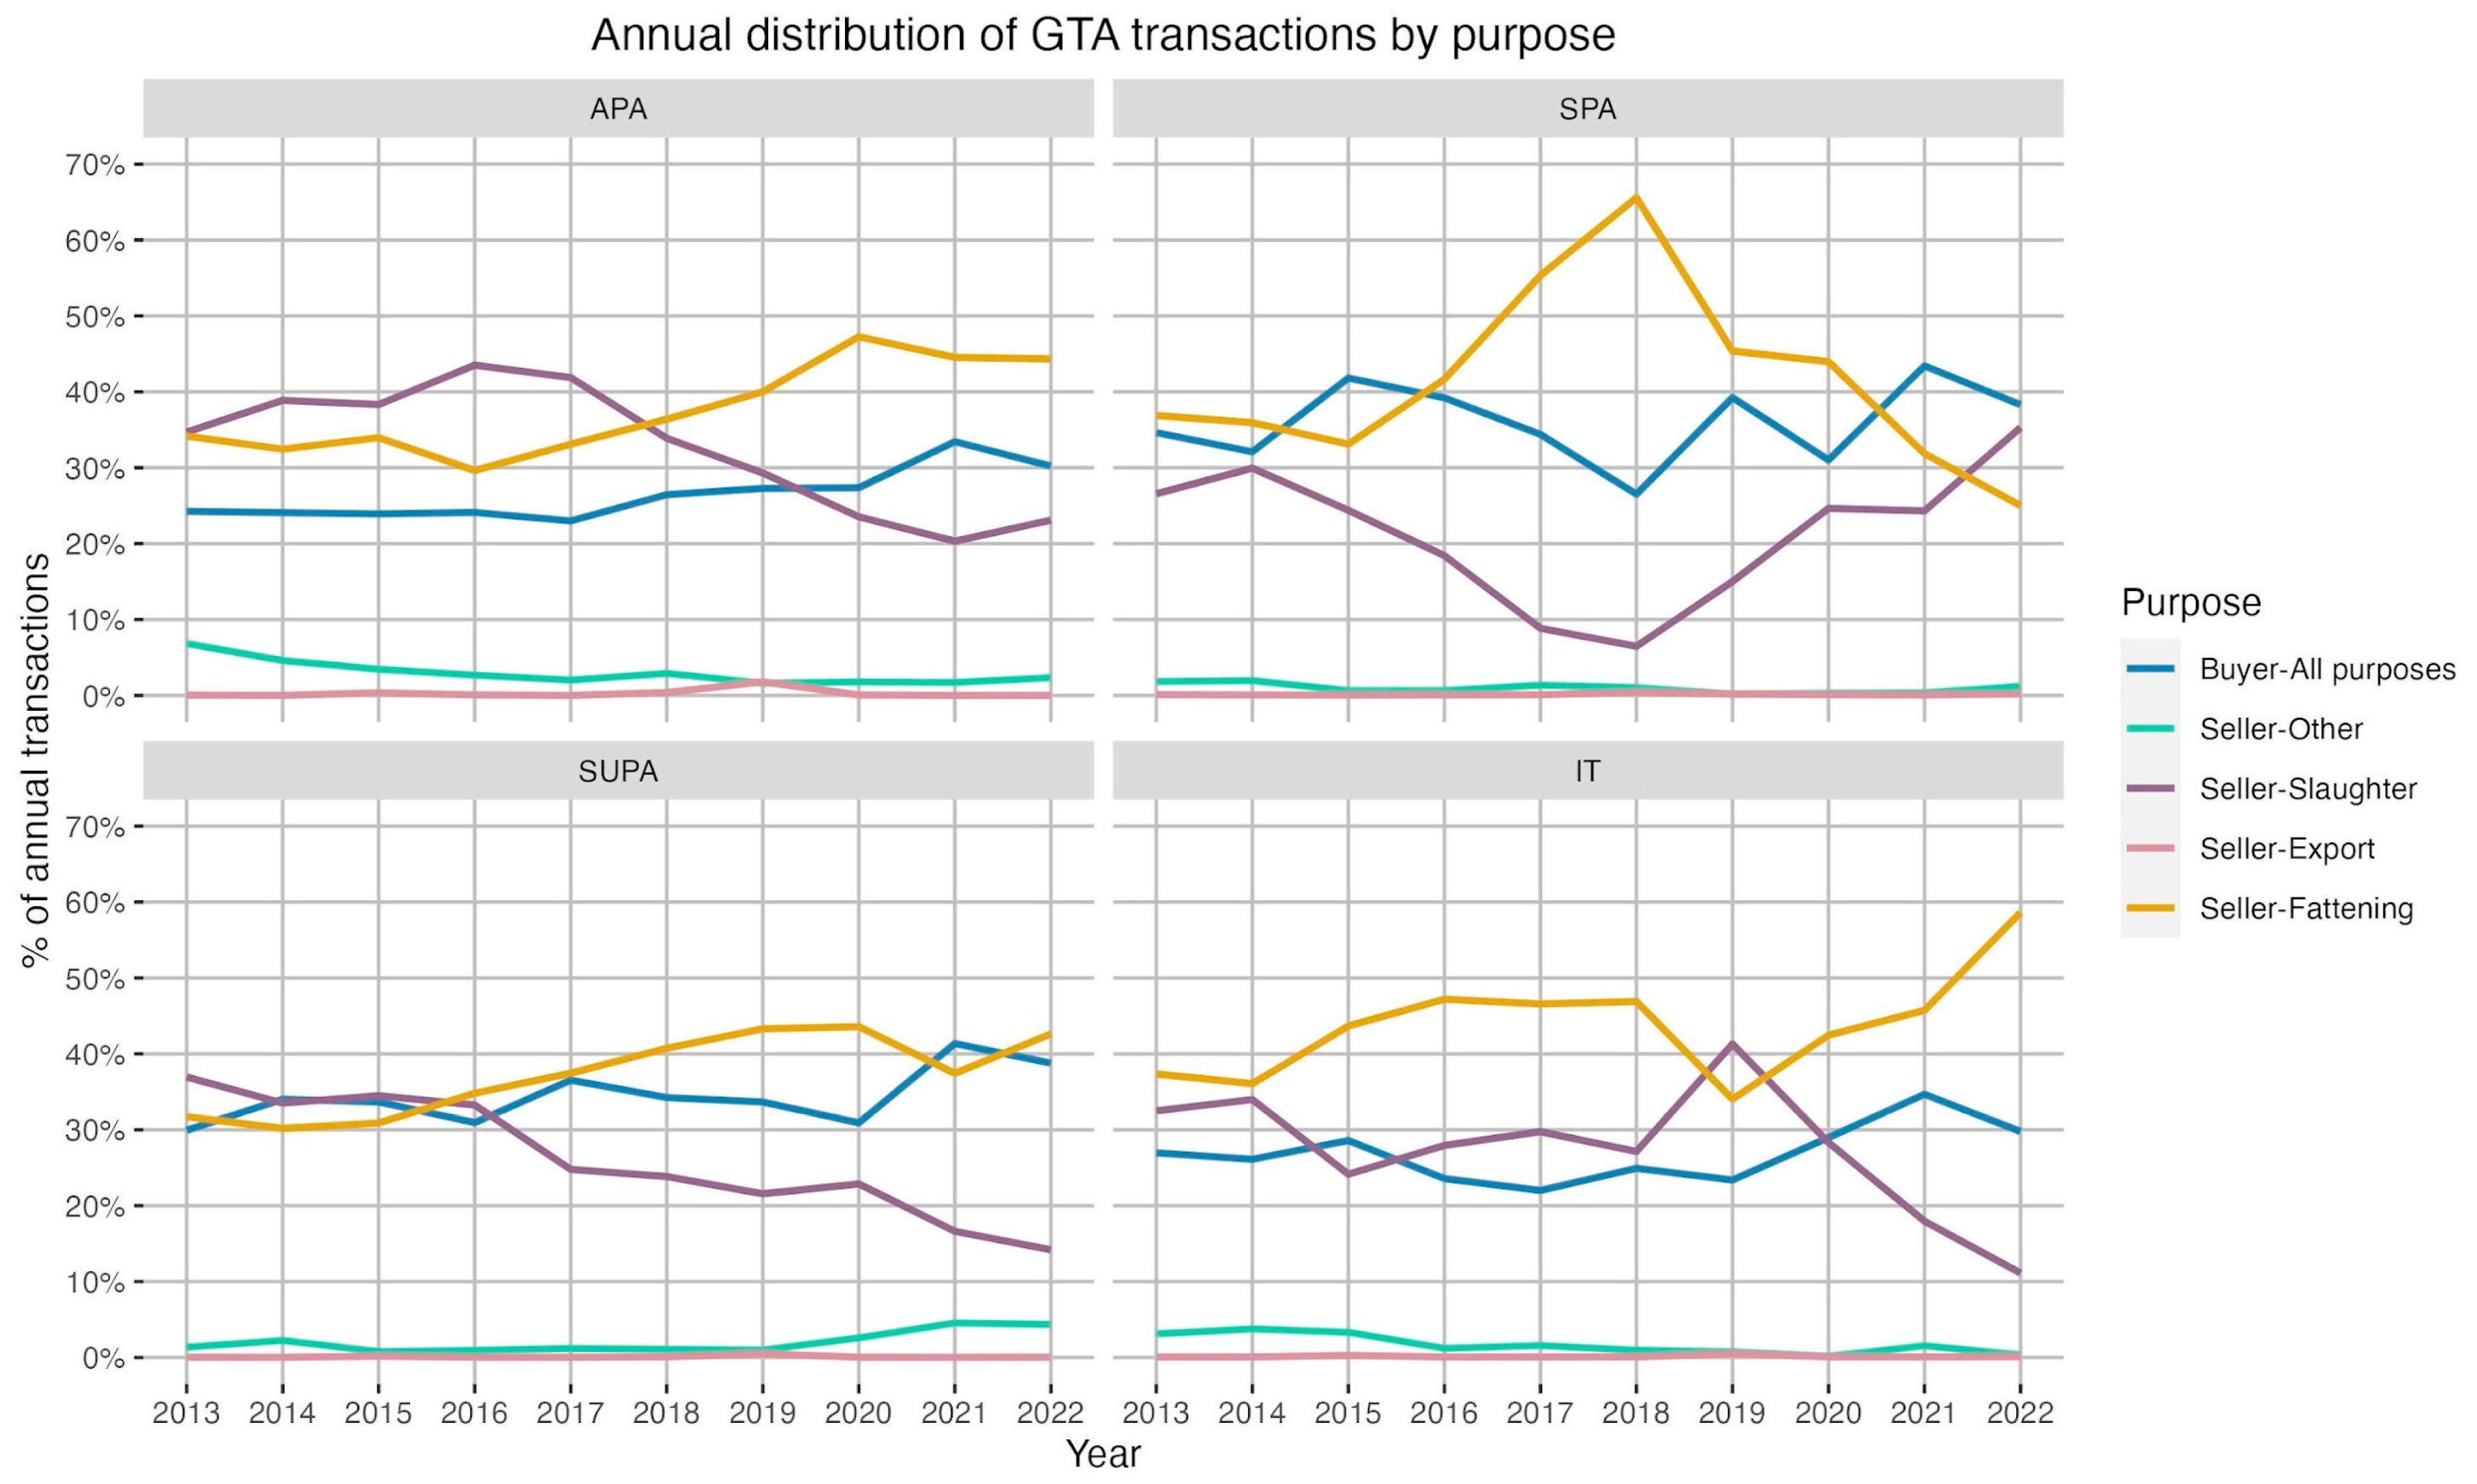
The purpose of the GTA transactions linked to Pará PAs varied during our study period (Figure 6). Despite the overall decreasing trend in direct sales for slaughter, which could be a result of increasing pressure on slaughterhouses by NGOs and public prosecutors, slaughterhouses in Pará engaged in over 13,500 direct transactions (buying with a slaughtering purpose) involving PAs in the last 4 years, with over 60% of those transactions ending at CA slaughterhouses that are obliged to monitor their suppliers for non-compliance including overlap with a PA. We considered all transactions registered in the GTA with a purpose other than slaughter or export to be an indirect transaction, and we found that most cattle linked to properties within PAs in Pará are sold indirectly, ranging from 57% to 78% of all transactions in the last decade (Figure 6). This represents an increase in the percentage of indirect transactions when compared to the state-wide trends outside of PAs, where direct and indirect transactions are more balanced, averaging 47% and 53% of all transactions, respectively. Indirect transactions within PAs in Pará reached values up to 18% higher than those outside of the PAs. Overall, we identified a total of 48,483 indirect (non-slaughter, non-export) transactions linked to PA properties in the last 4 years of data (2019–2022); in turn, slaughter/export transactions from the purchasing properties, that could potentially include cattle illicitly raised in PAs, added up to 221,403, out of which ~80% ended up in CA slaughterhouses.
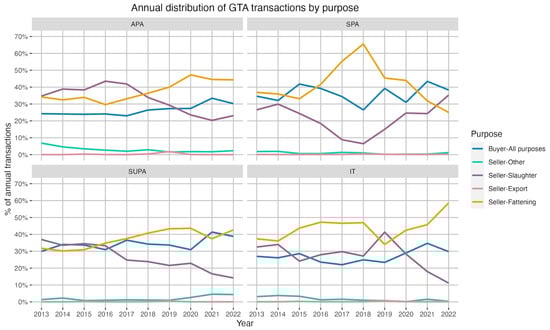
Figure 6.
Cattle transactions registered in the GTA by purpose stratified by protected area (PA) category, Indigenous Territories (ITs), Strictly Protected Areas (SPAs), Sustainable Use Areas classified as Área de Proteção Ambiental (APAs), and all other Sustainable Use Areas (SUPAs), for all declared properties in PAs in the state of Pará during 2013–2022.
Specifically, the percentage of indirect transactions has increased overall in SUPAs since 2015, going from 62% of all GTA transactions originating in SUPAs to 79% in 2022. Indirect transactions have also increased in ITs, going from 66% in 2015 to 89% in 2022, but this trend was not a linear one, having a drop that started in 2016 and hit its lowest point in 2019, when direct transactions reached an all-time high at ~41%. Interestingly, this was mostly driven by one IT, Menkragnoti, which nearly tripled the number of direct transactions that year, compared to the previous one. SPAs, on the other hand, had the opposite trend, with an overall increase in indirect transactions from ~73% in 2015 to ~94% in 2018, which then dropped through 2022. At this point, direct transactions were 5.6× higher than they were in 2018 (~6% to ~24%) driven mainly by one SPA, PN dos Campos Ferruginosos.
3.6. Encroachment on PAs
Deforestation, property registrations, and illegal cattle ranching are increasingly penetrating deeper within Pará PAs. From 2017 to 2020, properties registered in the CAR shifted from the periphery of the PAs to the interior, increasing their median distance from the edge by 11%, from 2.8 km to 3.1 km (Figure S1). While most (~60%) CAR properties remained within 5 km of the border, the maximum distance of a property to the edge increased from 57 km to 62 km during this period. This trend continued during the 2020–2023 period with the maximum distance to the edge gaining an extra 4 km, although the increase in overall distance was not as pronounced during this period (only 2.5% increase in the median). Out of the three categories, ITs were the ones with the most drastic change, with the distance of CAR properties to the edge of the PA increasing from a 2.9 km average in 2017 to 3.8 km in 2020 (31% increase), although this trend was reversed during the 2020–2023 period when the average distance decreased to 2.2 km (42% decrease). The maximum distance of a property to the border continued to increase during the entire study period though, going from 27 km to 62 km during 2017–2020 and to 65 km in 2023. Conversely, SUPAs saw a slight decrease in the average distance of CAR properties to the borders of the PAs. In APAs, the average distance decreased slightly from 8.1 km to 7.9 km during 2017–2020 and remained stable through 2023, while in other SUPAs, the average distance decreased from 3.6 km in 2017 to 3.2 km in 2020, increasing to 3.8 km in 2023. SPAs were the only class in which properties continued moving toward the interior of the unit for the whole 6-year period, with distance increasing from 1.8 km to 2.3 km (28%) during 2017–2020 and subsequently to 2.7 km during 2020–2023 (17%). The maximum distance of a property to the border in SPAs went from 20.6 km to 38.8 km during these six years.
Deforestation polygons in APAs shifted closer to the edge of the PAs, moving from an average 12.6 km during 2015–2018 to 11.9 km in 2019–2022. However, they continuously had the largest distances of deforested areas to the border throughout our study period (Figure S2). Other SUPAs had shorter overall distances to the edge, and the location of deforested polygons to the edge also decreased, although the trend was not linear (7.2 km in 2017, to 8.7 km in 2019, to 7.9 in 2022). While SPAs also saw a decrease in the distance of cleared polygons to the border when comparing the last 4 years to the previous 4 (7.6 km 2015–2018, 5.6 km 2019–2022), we found that polygons have been moving inwards since 2019, going from an average distance of 4.3 km to 6.8 km. In contrast, deforestation in ITs has been steadily moving inwards, increasing the average distance to the edge by nearly 40% for the 2019–2022 period (4.9 km in 2017, to 7.8 in 2019, to 9.7 km in 2022).
Between 2010 and 2021, the location of pasture also moved gradually towards the interior of PAs. In 2010, pasture pixels averaged 9.5 km from the edge of PAs, with a median distance of 6.3 km. By 2022, the average pasture pixel was located 10.4 km from the edge of PAs, with a median distance of 7.4 km. Within SUPAs, which accounted for the majority of pasture area in PAs, pasture moved steadily inwards, from an average of 10.5 km in 2010 to 11.2 km in 2022 for APAs, and from 7.7 km to 7.9 for other SUPAs. The trend was not linear for SPAs, which saw an increase from 8.9 km in 2010 to 9.2 km in 2016, only to decrease again to 8.4 in 2022. In contrast, the distance of pasture from the edge of PAs in IT areas also decreased for several years (9.3 km in 2010 to 8.6 km in 2018) before increasing again to a maximum of 11.7 km in 2022.
3.7. High-Risk PAs
Considering all of the risk factors analyzed here—count of CAR-registered properties, deforestation, pasture, and count of GTA cattle transactions—we identified the top three PAs holding the most threats for each criterion (Figure 3). This resulted in our identification of a total of 17 high-risk PAs: 7 ITs, 4 of which are fully ratified, 5 SPAs, and 5 SUPAs, 4 of which are APAs (Table 4). Most of them, 11 out of the 17, were identified as high-risk for more than one risk factor. Interestingly, these vulnerable PAs include some of the largest protected areas within the state of Pará. They also represent the top PAs with the most remaining forest for all categories. While we did not identify any significant patterns in terms of distance to roads or cities for these 17 PAs, we did find that distances among the high-risk PAs were shorter than those to other PAs, showing that PAs that are more exposed to human pressure tend to be clustered together (Figure S3).
Table 4.
Most vulnerable protected areas (PAs) in the state of Pará within each category, Indigenous Territory (IT), Strictly Protected Areas (SPAs), and Sustainable Use Areas (SUPAs), given that they rank in the top 3 according to their percentage of deforestation, and/or CAR-declared properties, GTA-registered transactions, and pasture area. Grey ground color highlights top 3 PAs in each category concentrating most threats for each type of threat.
Additionally, the 17 PAs identified here accounted for most of the environmental embargos that were issued within protected areas. As of August 2023, IBAMA had mapped 4153 embargoed areas within Pará PAs, of which 3239 were located within the 17 high-risk PAs. Similarly, ICMBio had mapped 2521 embargoed areas within Pará SUPA and SPA conservation units, of which 1537 were located within the 17 high-risk PAs.
4. Discussion
4.1. CAR Registration Has Potential to Harm Pará PAs
While policies designed to encourage rural property registration have been successful [20], the lack of CAR validation has resulted in the persistence of a substantial number of illegal property registrations, with properties being declared in the vast majority of Pará PAs, including most non-eligible ones. Initially intended as a conservation tool to enforce the Forest Code and prevent deforestation [26], CAR registration has indeed led to some reductions in deforestation when coupled with other policies such as zero-deforestation agreements in major supply chains [27]. However, other studies have shown that the registration of properties is often linked to a loss of natural vegetation [26,28,29]. Additionally, most Amazon deforestation has occurred on private properties [30]. Similarly, we found that most deforestation occurring in SUPAs was concentrated in CAR properties. Although our results show that this was not the case in other PA categories, we believe this could be the result of a time lag between land appropriation and forest clearing, meaning we may see more forest clearing within recently registered CAR areas in the future. Furthermore, claiming lands for private use is not legal in most PA categories, and while CAR registration does not equal land titling, it allows access to agriculture credit lines and can therefore facilitate deforestation [30]. Once land has been registered and cleared, claimants tend to create pressure for PADDD, to secure land titling and rural credits and to access commodity markets. Indeed, our results show that the weakening of Brazil’s PA system incentivized by the rural sector during Bolsonaro’s administration [28] encouraged a wave of private property registration and subsequent forest clearing. In this way, the cycle of land-grabbing, deforestation, and PADDD has so far resulted in private registration of 15% of the area encompassed by PAs in the state of Pará and the clearing of over 330,000 ha of its forest in the last 10 years.
4.2. Illegal Cattle Production and Laundering in Pará PAs
Illegal cattle ranching continues to take place in Pará PAs, driving forest conversion to pasture. Our results show that this can occur in one of two equally problematic ways. First, properties are being declared in most PAs even when production there is illegal and are then used to register cattle transactions in the GTA [26]. Not only is this a direct transgression of PA regulations, it also violates the CAs by allowing cattle linked to PAs, and possibly also deforestation, to enter the market [11]. Second, PA policies, CAs, and zero-deforestation policies can have the unintended consequence of pushing ranchers further into hiding, as indicated by the amount of pasture and deforestation we found outside of registered properties, the pervasiveness of pasture in CAR properties that are not linked to GTA transactions, and the increase in the percentage of indirect transactions. Furthermore, our indirect transaction estimate would likely increase if properties with pasture and no GTA records were to be searched for clandestine cattle ranching, given the likelihood of these properties being involved in the cattle sector while lacking proper documentation. Distinguishing between deforestation caused by the expansion of cattle pasture and deforestation caused by land speculation can be challenging, however [31], particularly under the second scenario. Additionally, we found that nearly a third of the properties overlapping with PAs had an owner that owned at least one additional property, located either inside or outside of PAs. Over a quarter of those auxiliary properties were registered in the GTA, hinting at a potential pathway to launder PA-raised cattle. An operation led by the MPF in Pará in 2023 to remove all non-native inhabitants from ITs, for example, found that 47,000 heads of cattle of the nearly 49,000 originating within the IT Apyterewa were being sold indirectly to properties outside of the PA [32]. As of now, however, monitoring indirect transactions is not implemented under the CA, facilitating cattle laundering and generally allowing cattle raised on illegal farms to reach CA slaughterhouses [11].
4.3. PA Efficacy
Despite the implementation of environmental policies and the growing international interest in ensuring sustainable supply chains [33,34,35], deforestation in the state of Pará considerably increased in the last 4 years of our study period. This highlights the importance of creating and maintaining PAs as forest conservation tools, given their effectiveness in curbing deforestation and their important role in carbon sequestration [2,36]. Our results are in line with these findings, showing that regardless of irregularities, deforestation continues to be lower in PAs compared to other types of land ownership, as seen in the higher percentage of PA properties compliant with the Forest Code legal reserve requirements. However, PAs are only as effective as the enforcement of their policies allows them to be. Our findings also show that deforestation saw over a 100% increase during 2019–2022, compared to 2015–2018, which could be the result of lenient policies during Bolsonaro’s administration [5].
The different governance regimes among conservation units and ITs seem to have a significant impact on the effectiveness of their conservation outcomes. Similar to previous studies [37,38], we found that SUPAs concentrate most of the declared properties, deforestation, pasture, and cattle transactions. This is probably related to the shortage of personnel and the vast network of illegal roads that continues to expand within SUPAs in Pará [39]. While there are valid arguments both in favor of and against enforcing more strict protection in these areas [38], our results show that the current management of SUPAs leaves them vulnerable to illicit activities, indicating that a more restrictive regime could be beneficial for achieving Brazil’s conservation commitments.
Similarly, our results build upon those by Baragwanath and Bayi [16], Conceição et al. [8], and Benzeev et al. [40] in showing that obtaining full recognition can strengthen ITs’ protection against encroachment and land conversion. However, we also found that these threats were not only present but increasing in fully recognized ITs. Additionally, our findings show that both registered properties and deforestation have been moving further into the interior of ITs. Indeed, reports indicate that the occupation of these PAs has become more aggressive [7], which could jeopardize uncontacted tribes. This is most likely the result of encroachers feeling emboldened by Bolsonaro’s public discourse undermining Indigenous Peoples’ rights to their territories [41]. As such, these trends could be reversed by the current administration, which has not only created a ministry of Indigenous Peoples for the first time in the history of Brazil but has resumed the demarcation of ITs, granting full recognition to eight Indigenous Territories so far [42].
4.4. High-Risk PAs
Illegal activities are highly concentrated in just a few PAs. We found that ~10% of all Pará PAs concentrate most of the pressure according to our metrics of interest. This corresponds to 17 high-risk PAs that we identified to be the hot spots of human pressure, containing almost 80% of all CAR properties, 84% of all deforestation, 92% of all pasture, and 86% of all GTA transactions. These vulnerable PAs are mainly located in the southwestern mesoregion of Pará, which coincides with the new frontier of deforestation according to PRODES data. These hot spots have increasing pressure from the west in the form of illegal mining, and due to the proximity to highway BR-163. In 2020, Pará produced ~33 tons or 27% of Brazil’s gold, mostly in garimpos or illegal mines, second only to Minas Gerais [43], and over 450,000 ha of the PA in Pará has been targeted by mining requests since 2019. Additionally, 3 of the 7 high-risk ITs that we identified (Kayapó, Aptyrewa, and Cachoeria Seca) are within the 10 most targeted ITs by mining interests in the state, adding up to over 300 mining requests [44].
Furthermore, the high-risk PAs we identified are subjected to additional pressure from the east in the form of cattle ranching, a main driver of the deforestation arc and the construction of numerous illegal roads. Proximity to roads has been widely documented as a risk factor leading to deforestation and encroachment [2,8,45]. Our results support the notion that increased access allows for the expansion of the mining and deforestation frontier into Pará PAs and explain that despite the slow shift in the location of properties and deforestation towards the interior of some PAs, the first 10 km from the border remain the most vulnerable ones. Previously remote areas are now more accessible. Once infrastructure such as roads is built, it facilitates the establishment of more ranchers, thus explaining both the proximity among high-risk PAs and the fact that most properties, deforestation, and pasture are concentrated in only a few of them.
5. Conclusions and Recommendations
The registration of rural properties holds the potential to match the non-compliance of environmental regulations to a specific perpetrator. While this should allow for monitoring and penalization of illegal deforestation [26], these consequences have yet to materialize in Pará. To date, less than 5% of all CAR properties overlapping PAs in this state have been inspected and validated. To stop human pressure on Pará PAs, resources must be funneled towards ensuring the verification of all registered properties within PAs and the automatic nullification and sanctioning of non-compliant ones. Additionally, in order to prevent further misuse of the CAR and following the MPF’s recommendation [46], banks should ensure that rural credit is denied to landowners with properties overlapping non-CAR PAs, as well as those with properties linked to deforestation. Prioritizing field CAR validations and the nullification of all non-compliant properties in the hot spots identified here would not only account for the majority of all private properties within PAs but holds the potential to cascade down and end the land-grabbing–deforestation–PADDD cycle.
Holding slaughterhouses accountable to their zero-deforestation agreements and expanding traceability systems to include indirect suppliers is equally crucial to halt deforestation in Pará PAs and prevent cattle laundering. Recent approval of the European Union Deforestation Regulation is creating pressure in this direction, by requiring individual traceability of cattle heads from birth to slaughter. To continue exporting commodities to the European market, the Brazilian government and meatpacking companies should scale up the implementation of existing individual traceability tools [11] that would help improve data transparency in the cattle industry. However, most cattle produced in Brazil are intended for domestic consumption, which could limit the scale of individual traceability implementation. Regardless, if traceability were to be enforced in direct and indirect transactions linked to properties in the top nine PAs that we identified as the ones holding the majority of the GTA transactions, ~86% of all cattle transactions linked to PAs would be monitored and almost 70% of all deforestation could be accounted for.
The high-pressure hot spots we identified offer the opportunity to obtain meaningful results by focusing efforts on a small number of PAs. These PAs should be prioritized for the enforcement and development of management plans. They should also be a priority for field enforcement. A lack of funding and the subsequent shortcomings in terms of inspection mean that these infractions have historically remained unpenalized. However, the political willingness to address these deficiencies seems to be shifting. Lula’s administration has pledged to return to an environmentally focused approach, and Brazil has reiterated their “Zero-deforestation by 2030” commitment. Indeed, 6 months into his administration, deforestation in the Amazon has already seen a 40% decrease (DETER, INPE) [47], an updated version of the PPCDAm has been put in place [12], and successful initiatives such as the MPF-led Apyterewa operation to cancel private properties are being implemented [32]. If these policies are adequately executed and sufficient funding and resources are allocated to respond to the human threats we highlighted here, PAs will be better positioned to fulfill their roles as conservation cornerstones and Brazil will be one step closer to meeting the ambitious goals of its environmental commitments.
Supplementary Materials
The following supporting information can be downloaded at: https://www.mdpi.com/article/10.3390/land13070901/s1, Figure S1: Property location throughout time; Figure S2: Distance of deforestation polygons to the edge of the Protected Areas; Figure S3: High-risk Protected Areas; Table S1: Data Sources; Table S2: Overlap rules.
Author Contributions
Conceptualization, M.C. and A.B.J.; methodology, J.M. and A.B.J.; formal analysis, J.M.; writing—original draft preparation, M.C.; writing—review and editing, M.C., A.B.J., J.M., H.K.G. and L.R.; visualization, M.C.; supervision, H.K.G.; funding acquisition, H.K.G. and L.R. All authors have read and agreed to the published version of the manuscript.
Funding
This study was made possible by the support of the United States Agency for International Development (USAID) as part of the Amazonia Connect activity 001 (72052722CA00002). The contents of this study are the sole responsibility of University of Wisconsin-Madison and do not necessarily reflect the views of USAID or the United States Government. Additional support was provided by the Gordon and Betty Moore Foundation 2106-036, Norway’s International Climate and Forest Initiative 2110-118, and the Bezos Earth Fund 112440059.
Data Availability Statement
The data presented in this study are available on request from the corresponding author. Some data are not publicly available due to data privacy restrictions.
Acknowledgments
We would like to thank Ian Schelly for his expertise and assistance in making maps and figures for this paper and Leonie Hodel for providing helpful feedback.
Conflicts of Interest
J.M., L.R., and H.K.G. have an ongoing consulting relationship with the nonprofit National Wildlife Federation. The National Wildlife Federation did not provide editorial oversight over the contents of the manuscript.
References
- Pfaff, A.; Robalino, J.; Herrera, D.; Sandoval, C. Protected areas’ impacts on Brazilian Amazon deforestation: Examining conservation–development interactions to inform planning. PLoS ONE 2015, 10, e0129460. [Google Scholar] [CrossRef] [PubMed]
- Duarte, D.P.; Peres, C.A.; Perdomo, E.F.C.; Guizar-Coutiño, A.; Nelson, B.W. Reducing natural vegetation loss in Amazonia critically depends on the formal recognition of indigenous lands. Biol. Conserv. 2023, 279, 109936. [Google Scholar] [CrossRef]
- Boillat, S.; Ceddia, M.G.; Bottazzi, P. The role of protected areas and land tenure regimes on forest loss in Bolivia: Accounting for spatial spillovers. Glob. Environ. Chang. 2022, 76, 102571. [Google Scholar] [CrossRef]
- Bernard, E.; Penna, L.A.; Araújo, E. Downgrading, downsizing, degazettement, and reclassification of protected areas in Brazil. Conserv. Biol. 2014, 28, 939–950. [Google Scholar] [CrossRef] [PubMed]
- Pelicice, F.M.; Castello, L. A political tsunami hits Amazon conservation. Aquat. Conserv. Mar. Freshw. Ecosyst. 2021, 31, 1221–1229. [Google Scholar] [CrossRef]
- Abessa, D.; Famá, A.; Buruaem, L. The systematic dismantling of Brazilian environmental laws risks losses on all fronts. Nat. Ecol. Evol. 2019, 3, 510–511. [Google Scholar] [CrossRef]
- Ennes, J. Land Conflicts in Brazil Break Record under Bolsonaro. Mongabay, 2 June 2021. Available online: https://news.mongabay.com/2021/06/land-conflicts-in-brazil-break-record-in-2020-under-bolsonaro/ (accessed on 10 September 2023).
- Conceição, K.V.; Chaves, M.E.; Picoli, M.C.; Sánchez, A.H.; Soares, A.R.; Mataveli, G.A.; Silva, D.E.; Costa, J.S.; Camara, G. Government policies endanger the indigenous peoples of the Brazilian Amazon. Land Use Policy 2021, 108, 105663. [Google Scholar] [CrossRef]
- Klingler, M.; Richards, P.D.; Ossner, R. Cattle vaccination records question the impact of recent zero-deforestation agreements in the Amazon. Reg. Environ. Chang. 2018, 18, 33–46. [Google Scholar] [CrossRef]
- Kröger, M. Deforestation, cattle capitalism and neodevelopmentalism in the Chico Mendes Extractive Reserve, Brazil. J. Peasant Stud. 2020, 47, 464–482. [Google Scholar] [CrossRef]
- West, T.A.; Rausch, L.; Munger, J.; Gibbs, H.K. Protected areas still used to produce Brazil’s cattle. Conserv. Lett. 2022, 15, e12916. [Google Scholar] [CrossRef]
- Ministério do Meio Ambiente (MMA, 2020). Available online: https://www.gov.br/mma/pt-br (accessed on 11 September 2023).
- Oliveira Cicero Diogo, L.; Café Keyla Juliana, S.B.; Batista Vandick, S. Management plans for protected areas in Brazil reveal similarity between specific objectives and mammals as the main focus of conservation. Nat. Conserv. Res. 2022, 7, 64–74. [Google Scholar]
- Amin, A.; Choumert-Nkolo, J.; Combes, J.-L.; Motel, P.C.; Kéré, E.; Ongono-Olinga, J.-G.; Schwartz, S. Neighborhood effects in the Brazilian Amazônia: Protected areas and deforestation. J. Environ. Econ. Manag. 2019, 93, 272–288. [Google Scholar] [CrossRef]
- Bonilla-Mejía, L.; Higuera-Mendieta, I. Protected areas under weak institutions: Evidence from Colombia. World Dev. 2019, 122, 585–596. [Google Scholar] [CrossRef]
- Baragwanath, K.; Bayi, E. Collective property rights reduce deforestation in the Brazilian Amazon. Proc. Natl. Acad. Sci. USA 2020, 117, 20495–20502. [Google Scholar] [CrossRef]
- West, T.A.; Fearnside, P.M. Brazil’s conservation reform and the reduction of deforestation in Amazonia. Land Use Policy 2021, 100, 105072. [Google Scholar] [CrossRef]
- INPE. Satellite Monitoring of Brazil’s Amazon Forest (PRODES); Brazilian National Institute for Space Research: São José dos Campos, Brazil, 2023. Available online: http://www.obt.inpe.br/OBT/assuntos/programas/amazonia/prodes (accessed on 1 October 2023).
- Benatti, J.H.; da Cunha Fischer, L.R. New trends in land tenure and environmental regularisation laws in the Brazilian Amazon. Reg. Environ. Chang. 2018, 18, 11–19. [Google Scholar] [CrossRef]
- Azevedo, A.A.; Rajão, R.; Costa, M.A.; Stabile, M.C.C.; Macedo, M.N.; dos Reis, T.N.P.; Alencar, A.; Soares-Filho, B.S.; Pacheco, R. Limits of Brazil’s Forest Code as a means to end illegal deforestation. Proc. Natl. Acad. Sci. USA 2017, 114, 7653–7658. [Google Scholar] [CrossRef]
- SIDRA-Banco de Tabelas Estadísticas. Available online: https://sidra.ibge.gov.br/tabela/3939 (accessed on 7 September 2023).
- Instituto Brasileiro de Geografia e Estatística (IBGE) 2022 Census. Available online: https://www.ibge.gov.br/en/statistics/social/labor/22836-2022-census-3.html (accessed on 1 April 2024).
- Fundação Nacional dos Povos Indígenas (FUNAI). Available online: https://www.gov.br/funai/pt-br (accessed on 15 April 2024).
- Protocolo de Monitoramento de Fornecedores de Gado da Amazônia. 2020. Available online: https://www.mpf.mp.br/atuacao-tematica/ccr4/dados-da-atuacao/grupos-de-trabalho/amazonia-legal/Protocolodemonitoramentodegadov.12.05.2020.pdf/view (accessed on 6 September 2023).
- de Abreu, A. How Illegal Land Grabs in Brazil’s Amazon Feed the Global Beef Industry. OCCRP, 8 July 2022. Available online: https://www.occrp.org/en/investigations/how-illegal-land-grabs-in-brazils-amazon-feed-the-global-beef-industry (accessed on 20 November 2023).
- Jung, S.; Dyngeland, C.; Rausch, L.; Rasmussen, L.V. Brazilian land registry impacts on land use conversion. Am. J. Agric. Econ. 2022, 104, 340–363. [Google Scholar] [CrossRef]
- Gibbs, H.K.; Munger, J.; L’Roe, J.; Barreto, P.; Pereira, R.; Christie, M.; Amaral, T.; Walker, N.F. Did Ranchers and Slaughterhouses Respond to Zero-Deforestation Agreements in the Brazilian Amazon? Conserv. Lett. 2016, 9, 32–42. [Google Scholar] [CrossRef]
- Klingler, M.; Mack, P. Post-frontier governance up in smoke? Free-for-all frontier imaginations encourage illegal deforestation and appropriation of public lands in the Brazilian Amazon. J. Land Use Sci. 2020, 15, 424–438. [Google Scholar] [CrossRef]
- Carvalho, R.L.; Resende, A.F.; Barlow, J.; França, F.M.; Moura, M.R.; Maciel, R.; Alves-Martins, F.; Shutt, J.; Nunes, C.A.; Elias, F.; et al. Pervasive gaps in Amazonian ecological research. Curr. Biol. 2023, 33, 3495–3504. [Google Scholar] [CrossRef] [PubMed]
- Reydon, B.P.; Fernandes, V.B.; Telles, T.S. Land governance as a precondition for decreasing deforestation in the Brazilian Amazon. Land Use Policy 2020, 94, 104313. [Google Scholar] [CrossRef]
- Pendrill, F.; Gardner, T.A.; Meyfroidt, P.; Persson, U.M.; Adams, J.; Azevedo, T.; Lima, M.G.B.; Baumann, M.; Curtis, P.G.; De Sy, V.; et al. Disentangling the numbers behind agriculture-driven tropical deforestation. Science 2022, 377, eabm9267. [Google Scholar] [CrossRef] [PubMed]
- MPF Pede Que Não-Indígenas Que Criavam Gado Na TI Apyterewa Paguem R$ 40 Milhões Por Danos Ao Povo Parakanã, No Pará. g1, 19 December 2023. Available online: https://g1.globo.com/pa/para/noticia/2023/12/19/mpf-pede-que-nao-indigenas-que-criavam-gado-na-ti-apyterewa-paguem-quase-r40-milhoes-por-danos-causados-ao-povo-parakana-no-para.ghtml (accessed on 10 January 2024).
- Zhunusova, E.; Ahimbisibwe, V.; Sen, L.T.H.; Sadeghi, A.; Toledo-Aceves, T.; Kabwe, G.; Günter, S. Potential impacts of the proposed EU regulation on deforestation-free supply chains on smallholders, indigenous peoples, and local communities in producer countries outside the EU. For. Policy Econ. 2022, 143, 102817. [Google Scholar] [CrossRef]
- Nassar, A.M.; Custódio, T.M. Tracing and Monitoring to Achieve Deforestation-Free Supply Chains in Brazil. In Sustainability Challenges of Brazilian Agriculture: Governance, Inclusion, and Innovation; Springer: Cham, Switzerland, 2023; pp. 397–425. [Google Scholar]
- Lambin, E.F.; Furumo, P.R. Deforestation-Free Commodity Supply Chains: Myth or Reality? Annu. Rev. Environ. Resour. 2023, 48, 237–261. [Google Scholar] [CrossRef]
- Duncanson, L.; Liang, M.; Leitold, V.; Armston, J.; Moorthy, S.M.K.; Dubayah, R.; Costedoat, S.; Enquist, B.J.; Fatoyinbo, L.; Goetz, S.J.; et al. The effectiveness of global protected areas for climate change mitigation. Nat. Commun. 2023, 14, 2908. [Google Scholar] [CrossRef] [PubMed]
- Carranza, T.; Balmford, A.; Kapos, V.; Manica, A. Protected area effectiveness in reducing conversion in a rapidly vanishing ecosystem: The Brazilian Cerrado. Conserv. Lett. 2014, 7, 216–223. [Google Scholar] [CrossRef]
- Nolte, C.; Agrawal, A.; Silvius, K.M.; Soares-Filho, B.S. Governance regime and location influence avoided deforestation success of protected areas in the Brazilian Amazon. Proc. Natl. Acad. Sci. USA 2013, 110, 4956–4961. [Google Scholar] [CrossRef] [PubMed]
- Imazon/Isa. Areas Protegidas na Amazônia Brasileira; Avanços e Desafios; Imazon/Isa: São Paulo, Brazil, 2011. [Google Scholar]
- Benzeev, R.; Zhang, S.; Rauber, M.A.; Vance, E.A.; Newton, P. Formalizing tenure of Indigenous lands improved forest outcomes in the Atlantic Forest of Brazil. PNAS Nexus 2023, 2, pgac287. [Google Scholar] [CrossRef]
- Bispo, F. Activists Slam Bolsonaro Rule Change Seen as Ending Demarcation of Indigenous Lands. Mongabay, 18 October 2022. Available online: https://news.mongabay.com/2022/10/activists-slam-bolsonaro-rule-change-seen-as-ending-demarcation-of-indigenous-lands/ (accessed on 10 September 2023).
- Balanço: Funai Volta a Tratar Demarcação de Territórios Indígenas Como Prioridade. Ministério dos Povos Indígenas (FUNAI), 2023. Available online: https://www.gov.br/funai/pt-br/assuntos/noticias/2023/balanco-funai-volta-tratar-demarcacao-de-territorios-indigenas-como-prioridade (accessed on 12 January 2024).
- Manzolli, B.; Rajão, R.; Bragança, A.C.H.; Oliveira, P.D.T.M.; de Alcântara, G.K.; Nunes, F.; Soares Filho, B. The Prevalence of Illegal Gold Production in Brazil; UFMG: Belo Horizonte, Brazil, 2021. [Google Scholar]
- Mined Amazon (InfoAmazonia, 2023). Available online: https://infoamazonia.org/en/project/mined-amazon/ (accessed on 12 January 2024).
- Soares-Filho, B.; Moutinho, P.; Nepstad, D.; Anderson, A.; Rodrigues, H.; Garcia, R.; Dietzsch, L.; Merry, F.; Bowman, M.; Hissa, L.; et al. Role of Brazilian Amazon protected areas in climate change mitigation. Proc. Natl. Acad. Sci. USA 2010, 107, 10821–10826. [Google Scholar] [CrossRef]
- Ministério Público Federal (MPF). Recomendação no 1/2024. 2024. Available online: https://www.mpf.mp.br/am/sala-de-imprensa/noticias-am/mpf-recomenda-que-bancos-cancelem-credito-rural-para-propriedades-em-areas-de-conservacao-na-amazonia (accessed on 6 June 2024).
- Assis, L.F.F.G.; Ferreira, K.R.; Vinhas, L.; Maurano, L.; Almeida, C.; Carvalho, A.; Rodrigues, J.; Maciel, A.; Camargo, C. TerraBrasilis: A Spatial Data Analytics Infrastructure for Large-Scale Thematic Mapping. ISPRS Int. J. Geo-Inf. 2019, 8, 513. [Google Scholar] [CrossRef]

Disclaimer/Publisher’s Note: The statements, opinions and data contained in all publications are solely those of the individual author(s) and contributor(s) and not of MDPI and/or the editor(s). MDPI and/or the editor(s) disclaim responsibility for any injury to people or property resulting from any ideas, methods, instructions or products referred to in the content. |
© 2024 by the authors. Licensee MDPI, Basel, Switzerland. This article is an open access article distributed under the terms and conditions of the Creative Commons Attribution (CC BY) license (https://creativecommons.org/licenses/by/4.0/).