Abstract
Cities all over the world have developed on different geological-geomorphological substrates. Different kinds of human activities have operated for millennia as geomorphic agents, generating numerous and various erosion landforms and huge anthropogenic deposits. Considering the increasing demand for land and the expansion of the built-up areas involving and disturbing any kind of natural system inside and surrounding the actual urban areas, it is not negligible how important the dynamics of the urban environment and its physical evolution are. In this context, this manuscript addresses insights into eight case studies of urban geomorphological analyses of cities in Italy, Greece, and Brazil. The studies are based on surveying and mapping geomorphological processes and landforms in urban areas, supporting both geo-hazard assessment, historical evolution, and paleomorphologies, as well as disseminating knowledge of urban geoheritage and educating about the anthropogenic impact on urban sustainability. We hypothesize that urban geomorphological analysis of several case studies addresses the physical environment of modern cities in a multi-temporal, multidisciplinary, and critical way concerning global changes. Thus, this study aims to illustrate and propose a novel approach to urban geomorphological investigation as a model for the understanding and planning of the physical urban environment on a European and global scale.
1. Introduction
“The urban geomorphology is the study of man as a physical process of change, whereby he metamorphoses a more natural terrain to an anthropogene cityscape” [1]. In the framework of anthropogenic geomorphology [2], urban geomorphology focuses on the changes to nature’s physical systems caused by human activities in cities (urban residential, economic, and traffic functions) [3,4]. Considering the contemporary world challenge of coping with the high rate of change of the urban population (i.e., population density), the consequent urbanization growth rate [5,6,7], and their management, the discipline is of increasing interest. Growing urbanization represents a threat to the natural environment due to land consumption and to the urban environment itself, which is very sensitive from an ecological point of view and to the natural risks deriving from global changes.
An urban environment is defined as an ecosystem of an urban area in which the urban residents interact with biotic and abiotic factors [8,9]. The residents’ interaction with the abiotic factors of the urban environment implies their knowledge and, in this context, this paper deals with urban physical environment analysis aimed at knowledge of physical processes, and geomorphological ones in particular, acting in cities. Cities all over the world have different geological-geomorphological substrates, and urban soils, and several kinds of human activities have operated since different times. Humans, as a geomorphic agent, have always generated anthropogenic erosion and accumulation, moving “tremendous amounts of soil and rock” since the Paleolithic period [10]. The urbanization of historical European cities is characterized by the century-old stratification of urban expansion phases [11], from their ancient foundation, to the Middle Ages and major development during the Industrial Revolution, until the intense and progressive growth that started after the Second World War and is still in action [12].
In the event that by 2050, 70% of the world’s population will live in cities, the increasing demand for land will favor uncontrolled expansion of built-up areas, involving and disturbing any kind of natural system surrounding the actual urban areas. This condition favors the increase of natural risk in present-day densely populated urban areas and will affect cities globally in the future [13,14]. The current trend towards urbanization affects Africa and Asia in particular, where there is a city model greatly different from what was conceived in Europe. The African and Asian megalopolises and megacities arising are a little-known but very interesting field for understanding the differences in terms of hazards and resources for such large areas [15,16,17,18,19]. At the same time, the European cities are growing too, with evident problems which are challenging the idea of sustainable development. In this changing world, urban geomorphology can aid better understanding of the landscape’s natural, historical, and anthropogenic evolution, the settlement’s choices in relation to natural morphologies, and the effects of city development on natural geomorphological processes.
Urban geomorphological studies in European and Italian cities have strongly contributed to the building of a methodological approach. The world’s scientific literature is enriched by those studies, as shown by the number of Italian papers in the scientific literature collected for this article’s background (see Supplemental Material), which is summarized in Table 1.

Table 1.
Number of papers per country per topic, collected from the core collections of Scopus and Google Scholar. The full collected literature is available as Supplementary Material. The following four topic codes summarize the main topics in the papers: a—surveying and mapping urban geomorphology; b—geomorphology and urban hazards; c—historical evolution and paleomorphologies; d—disseminating urban geoheritage and educating.
In this context, the Working Group on Urban Geomorphology of the Italian Association of Physical Geography and Geomorphology (AIGeo) strongly contributed to the discipline with its activity, considering the importance of urban geomorphological analysis in Europe and in Italy especially, where the cities were founded in historical times, expanded in the Middle Ages and progressively entered a period of uncontrolled urban sprawl in the 20th century. Several examples of urban geomorphological analysis are available for Italian cities all along the Italian peninsula. Moreover, the AIGeo WG, collaborates with international colleagues to share and improve methodologies applied to foreign cities. The eight case studies presented in this paper (Figure 1) address the following:
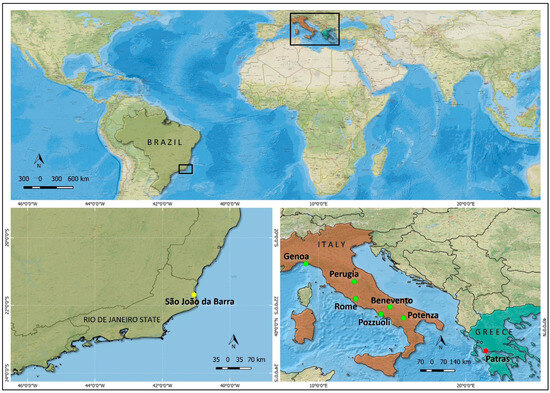
Figure 1.
Location map of the selected case studies. (On the top), a global view of the countries involved; (below left), the 6 Italian cities selected all along the Italian peninsula: Genoa, Perugia, Rome, Pozzuoli, Benevento, and Potenza, and the Greek city—Patras; (below right), the city located in southern Brazil—São João da Barra.
- surveying and mapping geomorphological processes and landforms in urban areas
- geomorphological analysis supporting geo-hazard assessment
- analyzing landscape historical evolution and paleomorphologies
- disseminating knowledge of urban geoheritage and educating about anthropogenic impacts on urban sustainability.
The hypothesis at the core of this paper is that European and Italian cities’ urban geomorphological analyses address the physical environment of modern cities in a multi-temporal, multidisciplinary and critical manner with respect to global changes. Thus, the objective of this study is to illustrate the Italian approach to urban geomorphological investigation and propose it and its results as a model and example for physical urban environment knowledge and planning on the European and global scales.
2. Materials and Methods
2.1. Description of the Study Areas
The selected case studies shown in the location map (Figure 1) are six Italian cities selected all along the Italian peninsula, three along the western coast or a few km from it (from north to south: Genoa, Rome, and Pozzuoli) and three along the central–southern Apennine axis (Perugia, Benevento, and Potenza); furthermore, two other non-Italian cases were considered: a city in the Greek mediterranean area—Patras—and a city located in southern Brazil—São João da Barra.
Table 2 summarizes the main features of the cities: the city typology, in terms of size [20] and degree of urbanization [21,22,23,24]; the geographical context, in terms of landscape; the main geomorphological processes acting; the study topic; and the methodological approach used.
Table 2.
Main features of the 8 case studies. In the column typology, each city’s size [20] and degree of urbanization [21,22,23,24] are described. The column headed ‘geographical context’ describes the landscape character. The column headed ’main morphogenetic processes’ is compiled considering the cities geomorphological analysis. The study topics are introduced and the methodological approaches summarized in the last two columns.
A brief overview of the cities, including their geological and geomorphological frameworks, precedes the discussion of each case study in the specific paragraph. The description will facilitate understanding of the structure of each city to compare it with other cities of interest and evaluate the investigation method applicability.
2.2. Methods and Materials for Urban Geomorphology Analysis and Applications
Geomorphological surveying is the basis of other kinds of analysis and relative applications for each case study; it consists of the following: a. scientific literature and technical materials collection; b. a multitemporal and multidisciplinary approach; c. field surveying. The multitemporal and multidisciplinary approach is based on aerial photograph interpretation, historical cartographic documents analysis and comparison to actual topography, nature of bedrock and deposits analysis through geognostic surveys, qualitative and quantitative assessment, reference to historical documents and archaeological reports, and ancient iconographic materials such as maps, paintings, or photographs [25,26,27]. Field surveys are fundamental for observations and direct data checking. The analysis method exploits the principles of data overlay and spatial analysis in the GIS environment.
In the urban environment, what emerges is the importance of the multidisciplinary approach, consisting of cultural (stricto sensu), archaeological, geoarchaeological, and geohistorical information about the areas. In fact, in the urban context, landscape evolution is strongly influenced by anthropogenic action, which buries, transforms, deletes, or hides the geological and geomorphological features. Multidisciplinary data integration allows the recognition and reconstruction of geological and geomorphological characteristics; in particular, anthropogenic erosion and accumulation.
The above-described approach required the availability of the multitemporal and multidisciplinary materials listed below:
- Base maps: Recent Regional Technical Maps (C.T.R.), at detailed scales, from the 1990s to the present (several Italian case studies). See references therein [26].
- Historical maps:
- “Carta Topografica d’Italia” scale 1:10,000 to 1:25,000. Topographical maps product, produced by the Italian Military Geographical Institute (IGM) since the 19th century and updated approximately once every 20 years (i.e., IGM, 1873; IGM, 1894; IGM, 1936; IGM, 1949; see references therein [26]). Used for several Italian case studies.
- Local historical topographical materials at detailed scales: i.e., the “Piano Topografico di Roma e suburbio” (IGM, 1924, see references therein [26]), at scale 1:5000, used in the Rome case study; maps from the Archive of the Authority of the Port System of the Central Tyrrhenian Sea, used in the Pozzuoli case study; the “Memories of Maps” by [28] for Patras case study.
- Aerial photographs and satellite images: captured since the 1930s for the Italian territories and specific areas, at different scales of observations. Available in local and national archives and online databases.
- Thematic maps, i.e., geological maps, basin plans for the reduction of geo-hydrological risk, municipal urban plans, cavity and sinkhole maps, and archaeological maps
- Digital elevation models, current and historical ones, built from historical topographical data.
The different case studies widen the urban environmental analysis, focusing on the topics listed in the introduction and in Table 2. They employed the methods summarized in the last column in Table 2 and described in detail in the case studies paragraph.
To discuss the proposed methodological approaches and applications as a guideline for knowledge of the physical urban environment, a brief review is implemented in Table 1 aimed at exploring how the scientific literature has addressed the following topics:
- a—surveying and mapping urban geomorphology
- b—geomorphology and urban hazards
- c—historical evolution and paleomorphologies
- d—disseminating education and knowledge of urban geoheritage.
The core collections of Scopus and Google Scholar are used as the search databases for papers, based on the following keywords: Anthropogenic Landforms; Urban Geomorphology Method; Urban Environment; Urban Geomorphology; Anthropogenic Geomorphology; and Anthropocene Geomorphology.
3. Case Studies
3.1. Surveying and Mapping Urban Geomorphological Processes and Landforms
Geomorphological maps are widely used in land planning and territorial management, environmental impact assessment, visualization, and communication of scientific information [27,29]. They are the starting point for many applications and for realizing thematic, derived, and applied maps (e.g., hazard maps). Despite researchers from several countries’ efforts to set up a standardized mapping procedure and legend, currently, a great variety of geomorphological legends are still in use, which differ in their contents and symbols.
In Italy, the Italian National Institute for Environmental Protection and Research (ISPRA) proposed national common and standard geomorphological mapping criteria at 1:50,000 in scale [30]. Following these criteria, landforms and associated deposits are depicted by using symbols of different colors, and grouped according to genetic criteria, whereas their state of activity is marked by means of color shades. The lithological characteristics of bedrock are emphasized using solid colors by grouping lithotypes according to their similar mechanical behavior. Recently the AIGeo, in collaboration with ISPRA, reviewed the official Italian geomorphological legend, revising and updating graphical symbols due to the great progress made in geomorphology regarding new knowledge on geomorphological processes and landforms, anthropogenic landforms in particular [31].
Using this framework, thanks to the case studies described in this section, the mapping and understanding of anthropogenic landforms was achieved by proposing innovative strategies for the recognition of urban environments, erased natural morphology, and the evolution of the landscape under the influence of human activities.
3.1.1. Rome
The Rome urban area analysis has been one of the first case studies of urban geomorphological surveying and mapping at the Italian and European levels. The study area is 600 km2 wide in the municipality of Rome, partially covering the territory of the Italian capital city. It is in the central part of the Italian peninsula, on the western side of the Lazio region. Rome is a large metropolis, with about three million inhabitants living in the municipal area. The city arose just south of the confluence where the Aniene River meets the Tiber about 3000 years ago; thus, the area has been densely urbanized for millennia. Until the 19th century, the urbanized area was limited to the historical city walls (Aurelian and Leonine) which delimit the historical center. Between 1924 and 1936, the city’s expansion reached an area that is now enclosed in a railway ring surrounding the city. After 1949, and during the 1960s in particular, the city’s expansion followed a south–southeast direction and in recent years it has also involved the northeastern area and the western part. The relief is divided between the minimum altitude of 10–20 m in the floodplains of the Tiber and Aniene and the maximum altitude of 100–200 m on the top of the volcanic plateau. A Plio-Pleistocene marine sedimentary basement characterizes the area [32]. On this basement, volcanic, tectonic, and glacio-eustatic processes have interplayed since Middle Pleistocene. The volcanic plateau was generated by the Sabatini and Alban Volcanos [33], and is made of effusive rocks which alternate with continental sediments. Late Pleistocene fluvial erosion shaped the volcanic plateau, resulting in the historically hilly, fluvial landscape of Rome, which has been deeply modified by 3 millennia of urbanization.
An urban geomorphological survey method was proposed in 2016 and improved in 2020 [26,34] based on multitemporal analysis, multidisciplinary investigations, and innovative strategies for anthropogenic landform mapping. The method’s strength is the multidisciplinary approach: it integrates historical, archaeological, iconographical, and artistic data with multitemporal topographical, geological, geomorphological, and geognostic data. The GIS environment allows for the management of data overlay and the morphometric processing of historical data. In particular, the anthropogenic erosion and accumulation survey is supported by the processing of the DEM of Differences (DoD), a map algebra raster difference between the present Digital Elevation Model (DEM) and historical ones obtained from early maps [35,36].
Due to 3 millennia of human activities modifying the city landscape, the case study deeply contributed to anthropogenic landform classification and new cartographic solutions for their representation. Historically, European cities like Rome have experienced drainage network modifications to obtain wide surfaces for building activities and in order to manage hydrogeological risks. The valleys in Rome have been partially or completely filled by anthropogenic deposits. So, natural modified landforms are present, such as valleys, whose shapes are still recognizable, but anthropogenic deposits modified the section (Figure 2a). There are also anthropogenic landforms, such as valleys which are no longer readable in the landscape because they are completely filled (Figure 2b). Artificial reliefs are also present because of anthropogenic accumulation, such as man-made hills and tabular reliefs due to retaining walls (Figure 2c,d). An example of anthropogenic erosion is excavation associated with mining or obtaining space for construction activities (Figure 2e). Lastly, terraced slopes are mixed examples of both anthropogenic erosion and accumulation (Figure 2f). As shown in the map legend (Figure 2), natural landforms modified by man, but still recognizable, were grouped into the original morphogenetic process category (in the example, fluvial landforms are depicted in green), adding a special column named ‘modified’, whereas anthropogenic landforms were included in a specific category, depicted with black symbols, when they completely erased the natural morphology.
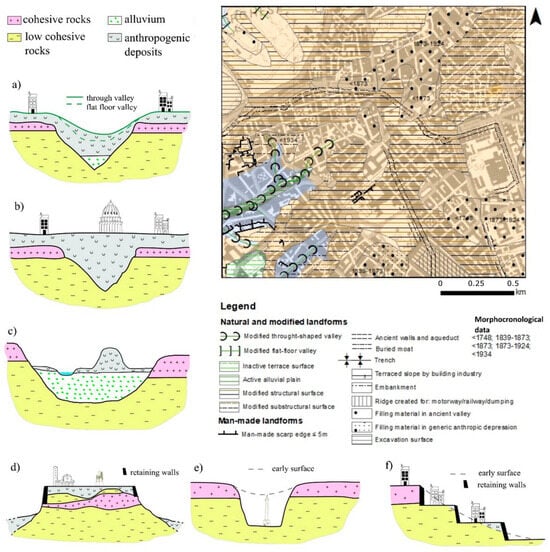
Figure 2.
Schematic drawings of the landform diversity in Rome, focusing on still recognizable natural landforms modified by human activities (a) and anthropogenic landforms of accumulation (b–d), erosion (e), and mixed examples of both (f). In the top right corner, a geomorphological map excerpt and related legend are depicted showing the mapping of the above-mentioned landforms.
3.1.2. Genoa
Genoa is a metropolis of 583,000 inhabitants spread over an area of 240 km2. The urban area is developed along a narrow coastal strip of the Liguria region for almost 30 km, mainly on the terminal section of the floodplains that cross the shoreline. The main drainage axes include those of the Leira, Cerusa, Varenna, Polcevera, Bisagno, Sturla, and Nervi streams. The current municipal area, however, is recent and dates back to 1926 following the unification of 19 municipalities that were added to the six incorporated in 1874. The historic Genoese part, known since the Middle Ages as the Maritime Republic and remaining virtually unchanged until the first half of the 19th century, lies in the morphological amphitheater between the Lanterna promontory to the west and the Carignano hill to the east and culminates with the summit of Fort Sperone at 500 m a.s.l. [37]. This area of about 8.5 km2 is characterized by seven small catchments, largely modified by anthropogenic activities through culverts and urbanization, ranging in size from 0.5 to 2.5 km2, with slopes of up to 50 percent and drainage density between 2.5 and 4 km−1 [38].
The geological profile is rather simple because it is almost entirely characterized by a flysch of marly limestones with shales, siltstones and marl interlayers [39]. Only at the historic center, in the areas featuring low steepness, are Pliocene clays mostly inserted in graben-type tectonic structures.
To recognize the geomorphology in the urban landscape of the morphological amphitheater on which the historic center of Genoa lies, a thematic map and bibliography were first studied. Then, by adopting a GIS platform, the stratigraphic data derived from the information layers of drill surveys were inserted, which allowed for an assessment of the anthropogenic filling thickness. Multi-temporal cartographic comparison aimed at identifying landforms, especially before the 19th century urbanization, has been crucial in identifying both excavations and fillings, changes to the hydrographic network, and sea embankments [40]. Field work and observations confirmed and improved the survey of urban landforms previously identified by remote surveying (Figure 3). Nearly 70 percent of Genoa’s historic area is characterized by anthropogenic landforms, of which the most visible involve the slopes and coastline, as well as changes in the hydrographic network. Approximately 17 km of the riverbed, out of a total length of about 24 km, is culverted, with changes in both the planimetric and longitudinal profile. The end section of the watercourses has been culverted since the Middle Ages, and the modifications include artificial diverting of the watercourse, as in the case of the San Gerolamo in the Carbonara stream. Many buildings of great cultural value are built over the culverts, such as the Palazzo San Giorgio and the Commenda di Pre complex. Anthropogenic landforms on slopes include fills, especially at valley bottoms and for road construction; many historic buildings, such as the Albergo dei Poveri, are built on top of filling materials. They also include dams for water reservoirs, later filled in for development purposes. Among the slope cuts, related to road opening and quarrying, is described the case of the Lanterna Promontory, once the subject of stone extraction activity and dismantled in the 1930s for city roads. The remains of this promontory, represented by an isolated rock outcrop, are still observable within the port area, where the “Lanterna of Genova” stands. The construction of coastal embankments for land reclamation represents one of the major morphological modifications which interested this area following the development of the Genoa harbor. The sea embankments started in the Middle Ages with the growing power of the Republic of Genoa. The extension of the coastline became significant in the 19th century; meanwhile, the port reached its current dimensions after the building of basins between the end of the same century and the beginning of the 20th.

Figure 3.
On the left, drainage network modifications and flood prone areas of the morphological amphitheater on which the historic center of Genoa lies. Legend: (1) poorly modified and/or natural riverbed; (2) culverted stream; (3) concrete channel; (4) eaves channel; (5) abandoned channel; (6) exposed buildings; (7) flooding area with returned period > 200 years; and (8) historical flooded area. On the right, the figures show the upper sector of the Lagaccio stream valley affected by relevant man-made morphological modifications: (a) the present-day situation, with the sports facilities on the fills along the stream; (b) the Lagaccio dam lake in the 1960s; and (c) geomorphological section (BH = boreholes).
3.2. Geomorphological Analysis Supporting Geo-Hazards Assessment
Geomorphological analysis through mapping and field monitoring can be an important tool for diagnosing and supporting the management of hazards and risk events. In this sense, using different geotechnologies in the field and the office allows us to obtain significant results to guide public policies in the context of anthropogenic and natural relations in urban areas. Therefore, this section includes case studies in four cities in three different countries, whose urbanization processes are completely different, but who have similar environmental problems and challenges. The cities of Pozzuoli, Patras, São João da Barra, and Potenza present problems that can be supported through analysis, monitoring, and geomorphological support with different methodological approaches. In these cases, procedures such as bathymetric surveying, sediment collection and analysis, multi-scale mapping with orbital and non-orbital images to understand coastline displacements due to coastal erosion, systemic analysis of the processes that resulted in the current stand out natural and anthropogenic forms of the landscape, geological models of subsidence, and geostatistics should be employed.
3.2.1. Pozzuoli
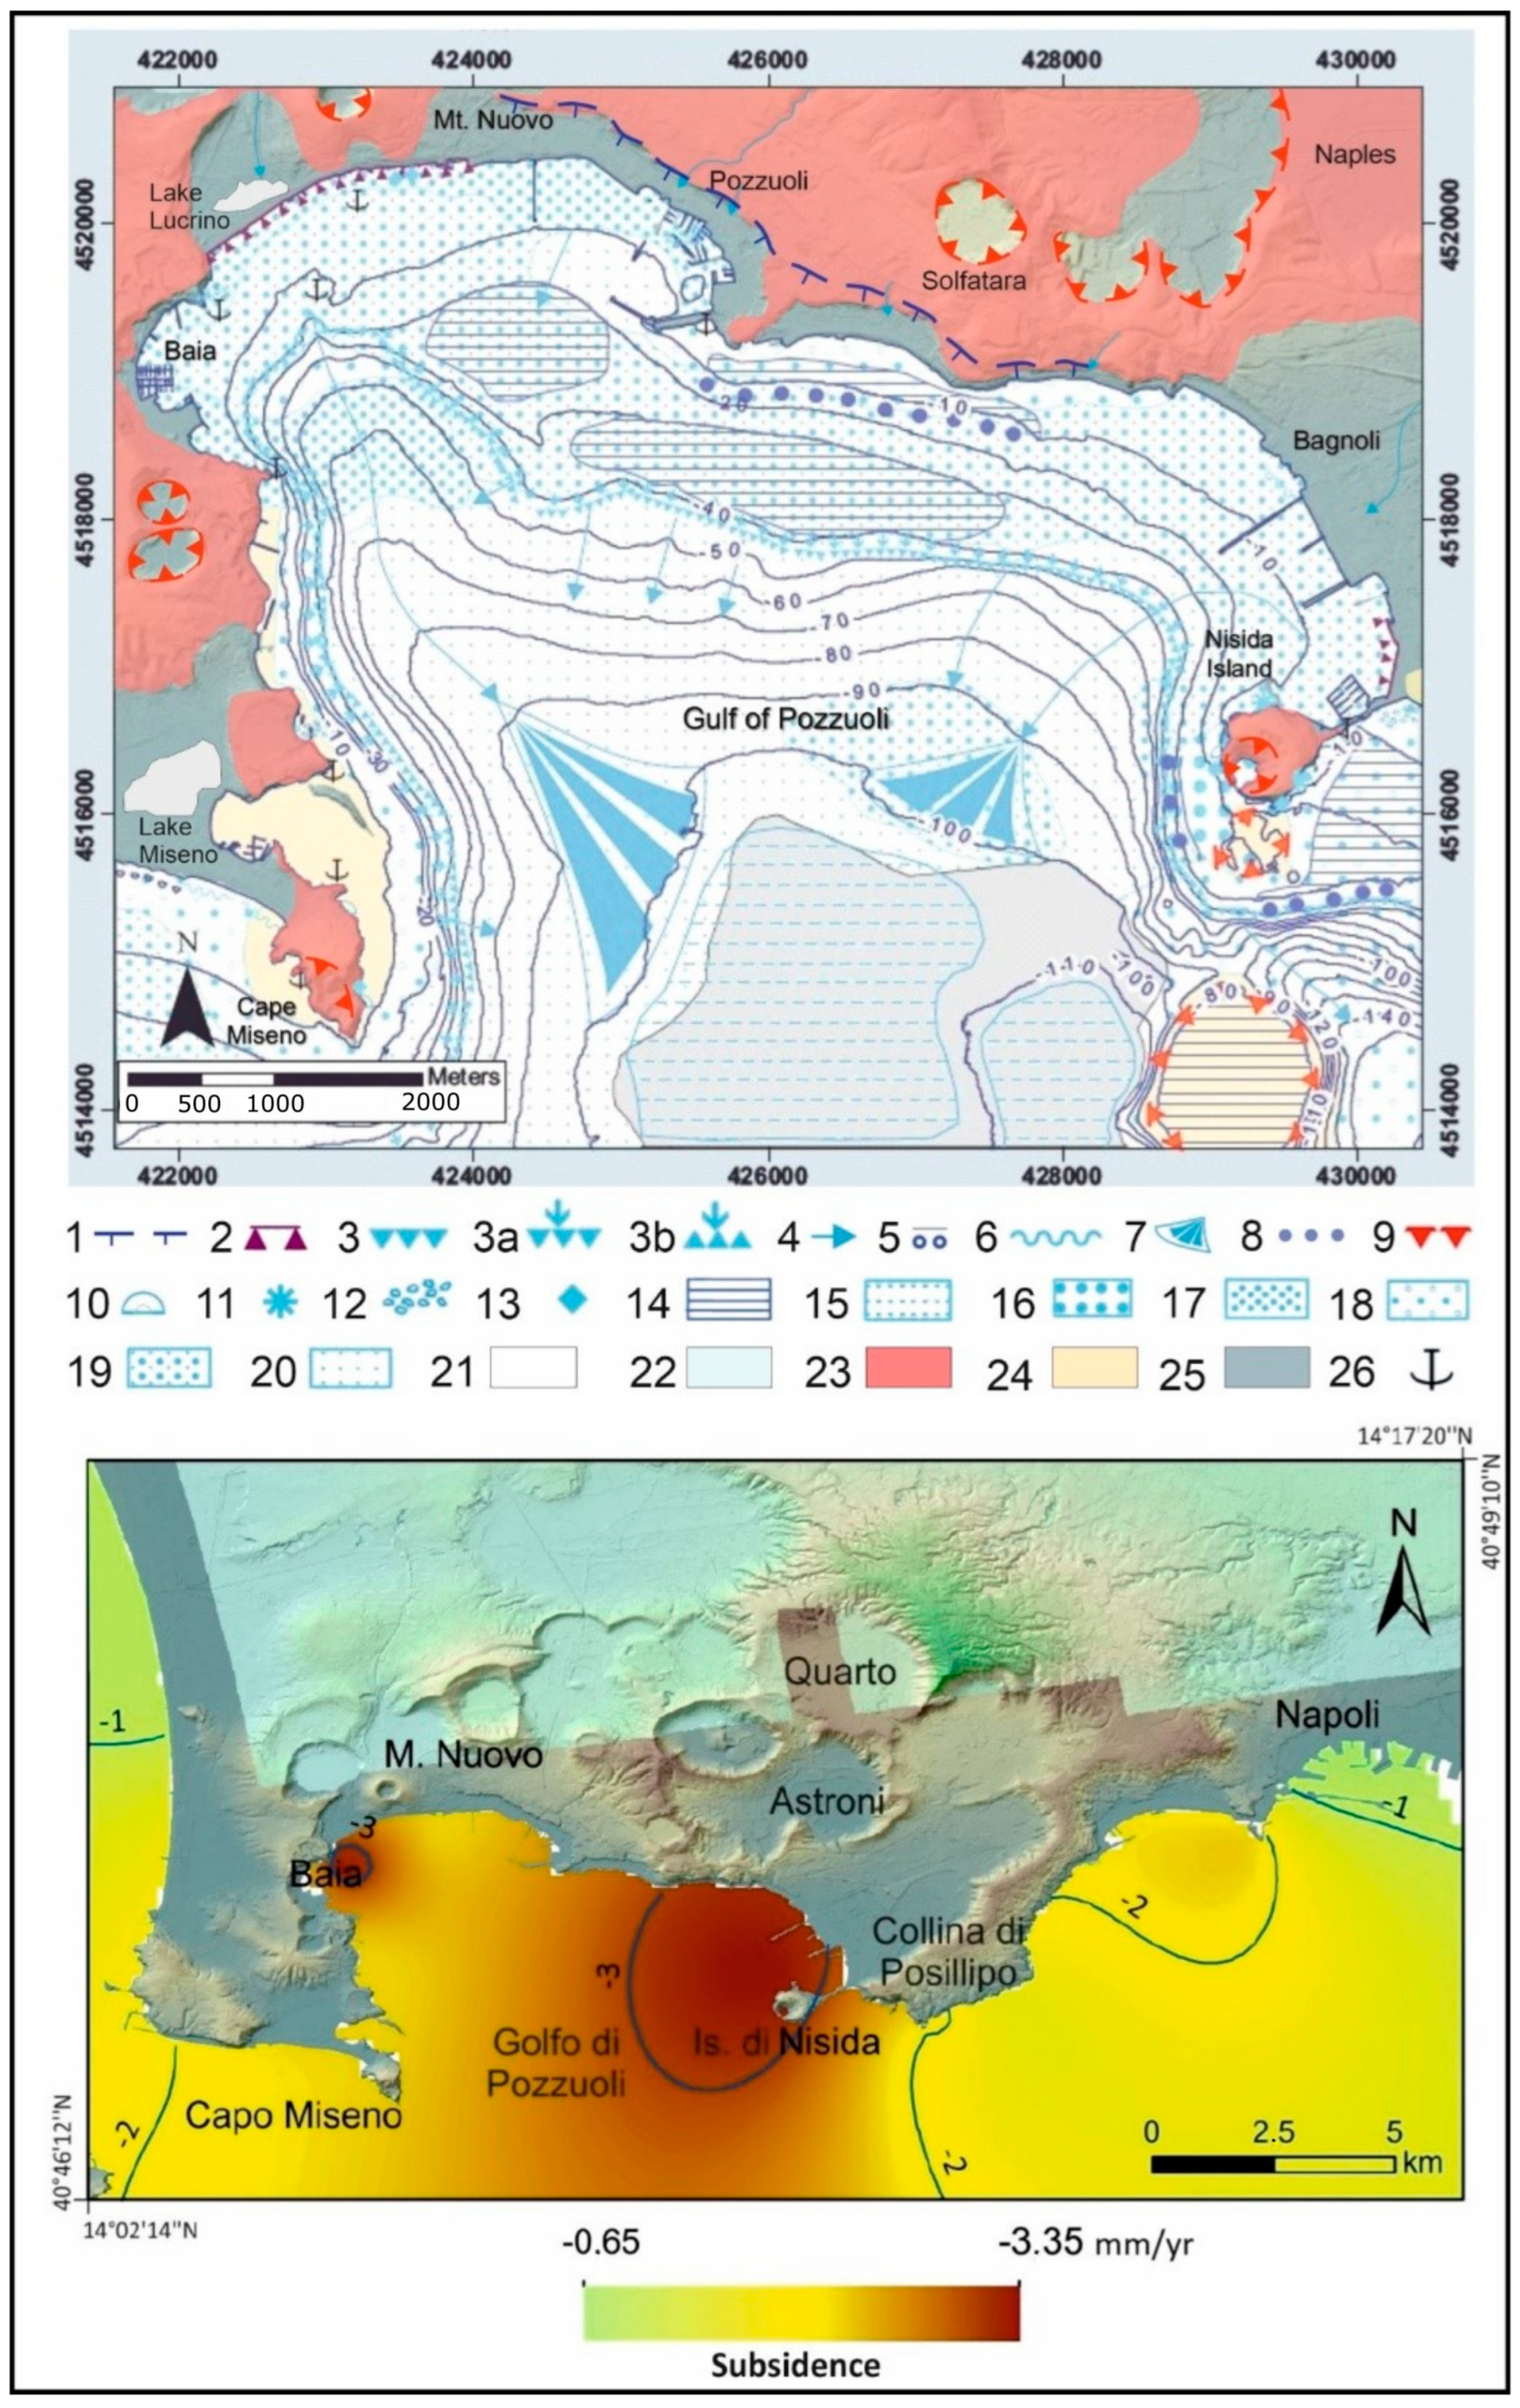
The city of Pozzuoli faces the homonymous large bay, with a mean depth of about −60 m and a maximum depth of −110 m [41], and into the wider Gulf of Naples (Figure 4, upper). Situated on the Margin of the Tyrrhenian Sea in the Campania region, it originated during a Pliocene extensional tectonic phase [42]. Some fifty craters have been recognized both inland and offshore. Two main active volcanic districts, the Phlegraean Fields to the northwest and Mt. Somma-Vesuvius to the southeast, developed along the coastland. Pozzuoli represents the emerged–submerged sector of the Phlegraean Fields as characterized by the marine terrace of La Starza between 30 and 80 m a.s.l. [43], bordered by the pyroclastic monogenic volcanoes of Monte Nuovo (1538 CE), Solfatara (4 ka), and Averno (5.2–4.2 ka), and a seabed central plain, with epiclastic sedimentation, delimited to the south by several submerged volcanic banks. The tectonics of the Phlegraean Fields are very dynamic [44]: historical records of bradyseismic vertical movements date back to Greek colonization over 2000 years BP, and the area mainly features a general downlift of the bay and its urban structures that today are partially submerged down to 4–6 m in depth (Figure 4, lower). In 1538, a new mountain, Monte Nuovo, beside the town of Pozzuoli, was formed by a pyroclastic eruption within eight days of an uplift phase of 4.5 m. In 1970–1972 and 1982–1984, the ground uplifted at a rate of 3 mm per day due to positive bradyseismic movement, with a maximum uplift of about 3.8 m followed by a gradual downlift [45,46]. From 2005 until today, the uplift started again with a total rise of over 1.15 m, an acceleration since January 2023, and many seismic shocks with 1 < Md < 4.2. Gas emissions (fumaroles), both on land (Solfatara Volcano) and underwater (Pozzuoli Bay), are also associated with volcanic activity. The presence of submarine hydrothermal springs located along the northwest–southeast axis in the eastern sector of the gulf [47] are related to the secondary volcanic activity of the Phlegraean Fields.
Since 2015 [48,49], morphological and stratigraphic surveys along the emerged and submerged urbanized area, based on the interpretation of 45 boreholes carried out since the 80s, bathymetric and underwater surveys, and sediment sample analyses, highlighted the main geomorphic elements of Pozzuoli (Figure 4, upper). The volcanic and marine sediment distributions in the town are strictly correlated with climatic and tectonic events. The urban geomorphology of Pozzuoli is characterized by vertical soil motions due to bradyseismic phenomena and volcano-tectonics [50], is rich in displaced Roman-age archaeological ruins [51,52], and hit by littoral erosion and flash floods. The underwater area facing the city shows terraced surfaces down to −40 m of depth, a receding edge of the narrow continental shelf, and the two relic-submerged valleys of Epitaffio (west) and Bagnoli (east) [53], starting from shallow water and with alluvial-detritic fans at their end in the gulf depocenter at −90 m of depth.
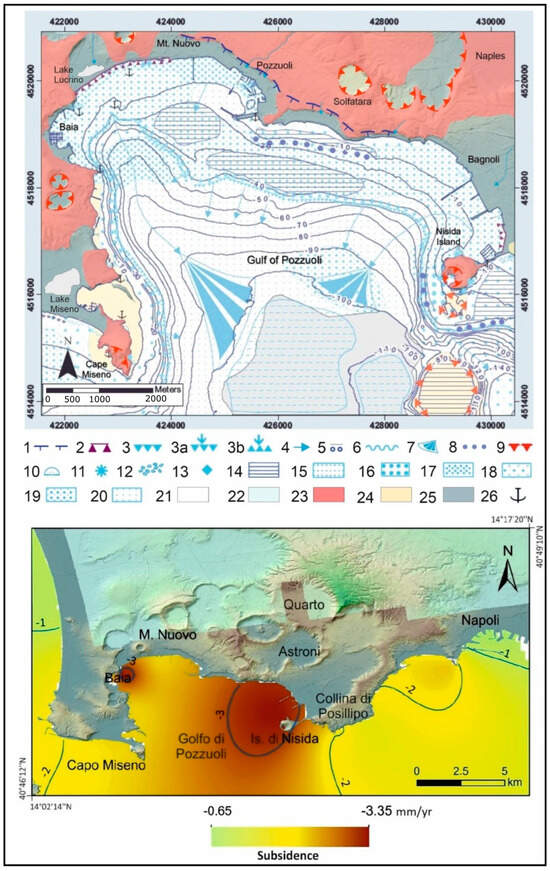
Figure 4.
(Upper): Geomorphological map of the emerged and submerged coastland of Pozzuoli: 1, La Starza marine terrace rim; 2, retreating shoreline; 3, edge of continental platform: 3a, retreating; 3b, prograding; 4, valley; 5, edge of marine terrace; 6, underwater bar; 7, submerged paleo fan; 8; submerged paleo sea cliff; 9, volcanic rim; 10, underwater cave; 11, sea stack; 12, undersea gas emission; 13 landslide pile; 14, marine terrace; 15, morphostructural depression; 16, gravel; 17, coarse sand; 18, medium sand; 19, fine sand; 20, very fine sand; 21, silt; 22, silt and clay; 23, pyroclastics (Pleistocene-Holocene); 24, submerged tuff (Late Pleistocene-Holocene); 25, reworked pyroclastics, and alluvial and marine deposits (Holocene); 26, submerged archaeological ruins (Roman age). Depth is in meters a.s.l. and the geographic coordinate system is WGS84. (Lower): Geothematic map of the lowering curves of the Phlegraean Fields coastland related to vertical movements between the Greco-Roman period and the present (after [51]). Subsidence is in mm/year and the geographic coordinate system is WGS84; DTM Lidar from MATTM—Environmental Remote Sensing Plan (PT-A).
3.2.2. Patras
The city of Patras is the third-largest urban area in Greece, home to about 171,000 people [54] in the northwest Peloponnese. It lies in a belt of low land between the Panahaikon mountains and the Patraikos Gulf. The wider area of the city of Patras is founded on Quaternary deposits, Plio-Pleistocene sediment, and unconsolidated soils [55], such as swamp, coastal and fluvial sands and gravels, Holocene deposits, and the weathering mantle of Plio-Pleistocene sediments, as well as alluvial deposits. The Patras area falls within the Corinth-Patras rift zone, which is about 100 km long and trends west northwest–east southeast across the Hellenic Mountain range. The rift zone is considered one of the most rapidly developed inter-continental rifts in the Mediterranean region, with normal faults trending west northwest–east southeast and with a maximum surface trace exceeding 25 km [56,57,58,59,60]. The various catastrophic geological events, earthquakes, and landslides, that have affected the area are closely related to fault tectonics and to the geodynamically active grabens. The city’s drainage network mainly consists of three rivers, all flowing in the Gulf of Patras, the Diakoniaris, Glafkos, and Milichos. Patras city is classified as a region with a Mediterranean climate. It has an average annual rainfall of around 830 mm, with seasonal peaks concentrated in autumn and spring and minimum values in summer. City development typically occurs without preventive measures for natural hazards, despite the scientific knowledge of areas where geological or geomorphological hazards are present. However, there is scientific knowledge of the areas where geological or geomorphological hazards are visible. So, urban centers are often founded on steep slopes, or in poor soil conditions, even in areas with high seismicity.
The Patras case study explores the interconnection between the geomorphology and urbanization of a coastal area, locating and analyzing the behavior and interactions of the landforms of the city. Generally, the city underwent fast and continuous expansion in the mid-1800s, which was further accelerated in 1960s. The city’s expansion resulted in the diversion of the river channels (Figure 5, left). Additionally, it led to the rivers and coastal areas being filled to create the city’s infrastructure. Since 1960, the erosional status of our coastal study area resulted in coastal retreat of up to 7.5 m (Figure 5, right). The coastal belt is an area in which the interaction between the marine and land areas is caused by biotic and abiotic components. Moreover, climate change alters the basic conditions under which shores evolve. In both cases, estimates of long-term or short-term displacement of the coastline are crucial to mitigate the negative impacts and protect the coastal structures from corrosion and other processes that alter the coastal stability. In our case, the coastal belt was exposed to storms from strongly bimodal winds from the northern to western directions.

Figure 5.
Patras (urban area), damage recovery on road in coastal zone affected by powerful sea erosion in November 2021.
3.2.3. São João da Barra
The city of São João da Barra (Rio de Janeiro, Brazil) has a historical context and space-time dynamics that are different from the other case studies in this work. During the medieval period, for example, all the other cities mentioned here already had complex spatial organizations and considerable urban infrastructure, while São João da Barra was just a town characterized by the presence of indigenous peoples. In 1676 [61] the place came to be categorized as a Village or “Vila” (in Portuguese terminology), with more established socio-spatial relations and economic activity based on fishing, cattle raising, and the rise of sugar cane cultivation. During this period, and until the 18th century, several access roads were created following the village expansion; moreover, a river port arose due to increased sugar cane production and the need for its transport. It is noteworthy that São João da Barra is located south of the mouth of the Paraíba do Sul River, an important watershed of approximately 55.5 km2 [62]; nowadays, it is a rapidly growing small urban area hosting about 33,000 inhabitants. The city’s geological-geomorphological framework is characterized by Quaternary sediments related to coastal plains, lagoons, mangrove deposits and sandy sediments, originated by different evolutionary phases of the deltaic system during periods of transgressions and regressions of the coastline, with a fundamental role of fluvial sedimentation due to the tropical climate [63]. Morphologically, beach ridges, dunes and sandbanks are found, in addition to river and fluvio-marine plains with a predominance of old beach deposits [64,65,66].
In the current context, paleoenvironmental studies have been carried out to understand the genesis and evolution of this deltaic complex; however, the approaches are diverse and still far from reaching a scientific consensus [65,67,68]. In this sense, we highlight the efforts made by [65] through a geochronological approach; even without presenting the complexities associated with the deltaic evolutionary environment, they made it possible to carry out more detailed studies, such as that of [67]. In recent decades, the city of São João da Barra has stood out in the Brazilian and international scene because of the intense process of coastal erosion that has been progressively consuming the coast, mainly in the south of the delta. Regarding this aspect, [69,70] carried out a multi-scale analysis to understand, using a systemic approach, the possible causes of the coastal erosion that has been plaguing the local community. In this sense, the main causes are inherent to anthropogenic pressures in the hydrographic basin (dams, water capture, and other types of use), and to a lesser extent due to local factors such as the construction of the Açú port complex 7 km south of the delta, whose construction greatly altered the sedimentary dynamics in the region. As a result, an area of intense coastal erosion is delimited (Figure 6), consisting of 458,124.65 m2, in the northern portion (first north–south transect in Figure 6). In this sense, it is possible to infer that in the period of 37 years from 1985 to 2022, the sea advanced an average of 12,381.74 m2 over the continent in the locality, which is a significant loss when compared to other areas of the Brazilian coast. In the aerial photograph in Figure 6 (lower image), it is possible to visualize one of the coastal sectors devastated by erosion.
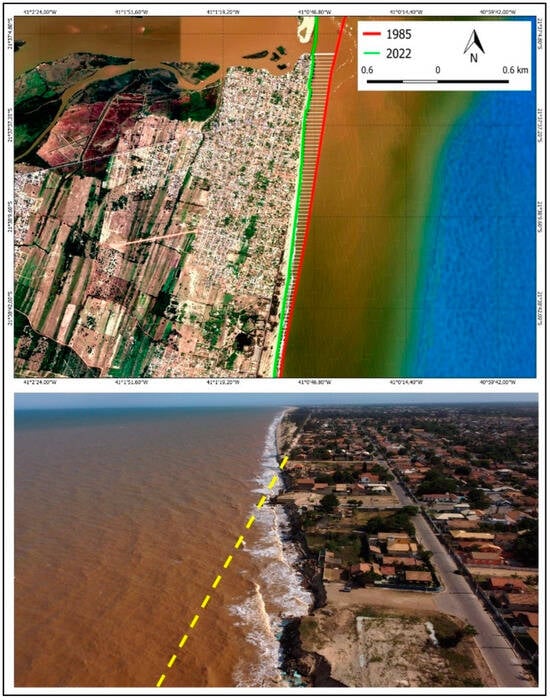
Figure 6.
Satellite image of 1985 coastline overlapped with the current one, showing the areal gap due to erosion (modified from [69]). Below: coastal sector of the municipality of São João da Barra (Rio de Janeiro) consumed by coastal erosion. The yellow dotted line represents the past position of an avenue (N-S view) (Photo: Laboratory of Geomorphology UNICAMP collection, 2023).
São João da Barra has great touristic potential thanks to the diversity of biotic and abiotic elements present in the landscape. However, what actually draws the most attention is the erosion and the related destruction evident due to the sea ingression. The intense coastal erosion has a negative local socio-environmental impact: the city is visited by groups interested in observing the devastating scenario induced by man.
3.2.4. Potenza
Potenza municipality is the capitol of the Basilicata region (southern Italy), classified as a small urban area of some 67,000 inhabitants. It is in the axial, active seismic belt (30 to 50 km wide) of the southern Apennines, characterized by high seismic activity and where strong earthquakes have occurred. From a geomorphological point of view, the study area is located on a long and narrow asymmetrical ridge southwest–northeast oriented, delimited along the northern sector by steep escarpments. This ridge hosted the city’s historic center, partly still delimited by the medieval walls, until the post-war period. Subsequently, urban expansion forcefully invaded the rural and peri-urban territories, obliterating much of the original forms, fundamentally due to river terracing, landslides, and erosive incisions on the sides of the hill ridge. Geologically, it is characterized by a sedimentary sequence of Pliocene deposits included in the Potenza Basin [71], characterized by two sedimentary cycles known as the Altavilla and Ariano units (Figure 7 left). The older Altavilla Unit (Early–Middle Pliocene) consists of conglomerates and sands and occurs predominantly in the northern part of the basin. The younger Ariano Unit, of Middle to Late Pliocene origin, occurs in the southern part of the basin. This unit mainly comprises clinostratified conglomerates, marine sandstones, and calcarenites with an over-consolidated clayey substratum. The urban area of Potenza town is characterized by a clayey substratum and sandy conglomerate deposit layers, which varies in thickness along both west–east and north–south directions (Figure 7). The geodatabase implemented for this study case consists of a remarkable search of unpublished data, such as a topographic map (1:4000), a geological and geomorphological map, borehole logs, geotechnical parameters, geophysical data, historical photographs, and historical macroseismic data at the building scale. The stratigraphic data, deriving from the recovery of dozens of continuous core drillings, made it possible to reconstruct a general geological model of the site, including the trend of the clayey and overconsolidated Pliocene substrate, as well as the thickness of the sandy conglomerate cover. These data have made it possible to exhume a geomorphology buried and modified by urbanization (valleys filled with fills, areas with stagnant water and peat in probable counterslope landslide areas, river terraces located at multiple levels, and ancient landslides). The stratigraphic and geomorphological structure of the sub-flat hill on which the town stands, were also responsible for the historical local seismic response, the effects of which were highlighted by the reconstruction of macroseismic damage scenarios analyzed with geostatistical techniques [72,73].
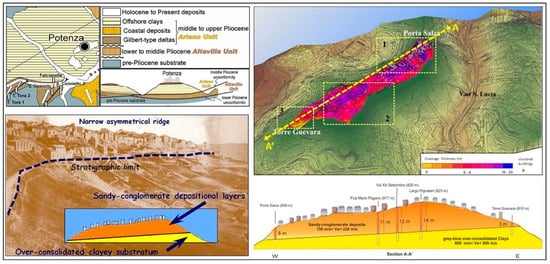
Figure 7.
On the left: Geological-stratigraphic structure of the historic center of Potenza (modified from [71]). Below left is an old photo from 1857 (with evidence of the earthquake damage), which shows the asymmetric ridge on which Potenza stands and the entire non-urbanized southern side of which the original morphology can be observed. On the right: Geological schematic section and model along the main axis of the Potenza hilltop town (section A-A’, west–east direction), with evidence of the 3 main areas analyzed and the digital model of the top of the clay substrate.
Applying autocorrelation techniques [74] it was possible to evaluate several relationships, comparing between them the data relating to the damage to the buildings, the degree of clustering and the DEM of the clay substrate, reconstructed using the historical borehole data (Figure 7, left). In particular, it was possible to observe the level of autocorrelation between the level of seismic damage (from the 1857 earthquake) and the geomorphological and geological-stratigraphic conditions of the urbanized hill (understood as the variation in the depth of the overconsolidated clayey substrate, from −3 to −18 m, and the presence, above it, of a saturated sandy-conglomerate layer).
Three different areas were thus distinguished (Figure 7, right), characterized as follows:
- The simultaneous presence of autocorrelation (and therefore damage, shown by white points) and high values in the thickness of the conglomerate cover (14–18 m); in this area the most important structural damage is recorded linked to the amplification of the horizontal seismic acceleration due to morphological (ridge effect) and stratigraphic causes.
- The high thickness of the conglomerate cover and poor presence of positive autocorrelation; this is probably due to the limited influence of the geomorphological factor (top of the relief wide compared to the base), which reduces the possibility of seismic amplification (Pagano square and Largo Pignatari).
- The presence of high localized damage and low values of the thickness of the covering (Porta Salza and Torre Guevara). Here the geomorphological factor (elongated and narrow ridge with steep slopes) seems to play an important role in the amplification of horizontal seismic acceleration, determining high levels of damage although concentrated.
3.3. Analysis of Landscape Historical Evolution and Paleomorphology
Anthropogenic geomorphological processes create landforms that are completely artificial or natural features modified by human activities, so it is fundamental to build up strategies for geomorphological surveys of landscapes that are completely transformed. Reconstructing the natural morphology is a fundamental step. The methodological approach in [26] promotes multitemporal topographic data processing and the multidisciplinary analysis of anthropogenic erosion and accumulation landforms. This qualitative approach represents a strength of natural morphology reconstruction. The case studies described in this section show examples of a quantitative approach to natural morphology reconstruction, using the creation of multitemporal digital terrain models and DEM of Differences to estimate anthropogenic excavation/accumulation volumes, together with multitemporal and multidisciplinary qualitative analysis of the urban expansion.
3.3.1. Perugia
Perugia, with a population of 167,000, is the capital city of the Umbria region. The historic city center is situated atop a hill with a maximum altitude of 493 m a.s.l. From its peak, five ridges branch out towards the south, overlooking the Tiber River valley, which is around 170 m a.s.l. Therefore, Perugia’s two main morphological elements are the ridgelines at the top and the fluvial valleys at the bottom. The hill’s eastern and southeastern area is characterized by three well-shaped ridges directed towards the north, northeast, and southeast. In contrast, the last two ridges, which point towards the southwest and west, are shorter and less defined. In general, the eastern side of the hill is steeper than the western side, where the morphology is gentler. The rivers that flow down also exhibit different behaviors. The rivers on the eastern and southeastern sectors are shorter, steeper, and far from the equilibrium condition. The headwaters are affected by gravitational and fluvial erosion, resulting in landslides and significant linear erosion along the thalwegs. The rivers that originally flowed along the western sector have been culverted over the centuries due to better morphological attitudes and are no longer visible. After the Second World War, this city area experienced the greatest expansion of its building fabric and infrastructure. Although the fluvial valleys are no longer present, the morphology of the areas close to the historic city center resembles that of a drainage basin. During the most important past civilizations that modified the urbanization of the downtown area (Etruscan: 6th–3rd century BC and in the Middle Ages) the headwaters of the main rivers and the thalwegs have been the sites where the morphology has been deeply changed [75,76]. The two primary changes made by humans were filling in the depressions where erosion occurred and leveling the tops of the reliefs. Some of the most iconic places in the historic center of Perugia are therefore forms of “morphological false”. Geomorphological surveying can recreate the initial topographic assessment and reconstruct the most significant phases of the morphological evolution of the hill.
To understand the volumes and the perimeters of the areas filled with anthropogenic deposits or levelled to a lower altitude, it is fundamental to have a DEM of the paleomorphology for comparison with the present layout. To do this, old paintings and maps were put together. Where it is possible, georeferencing in a GIS environment, the ancient documents and contour lines have been derived. Moreover, the geognostic surveys have been added as vector points where, in the attribute table, the depth and the thickness of the anthropogenic deposits are collected. Polylines (contour lines) and points (the geognostic surveys) are the mandatory input data for the geostatistical analysis that allow us to obtain a final DEM where the paleomorphology is defined [36]. The horizontal resolution and vertical accuracy may vary, depending on the spatial distribution of input data and the interpolation method. The next step is to obtain a DEM for the present topographic surface with a similar horizontal resolution. By subtracting the two models (current minus ancient one) with the algebraic function “minus” in map algebra, it is possible to obtain a DEM of Differences raster [35,77] with three possible scenarios: pixels with values close to zero (unmodified surface), pixels with positive values corresponding to infilling areas, and pixels with negative values for the leveled zones. The absolute value for each pixel measures the thickness of the anthropogenic deposits or the volume of removed soil.
At least eight areas have been identified in Perugia where the paleomorphology differs significantly from the current arrangement (Figure 8). One meaningful example is the Fortebraccio Square, located in the northern part of Perugia close to the headwater of two rivers (Lat 43.11483, Long. 12.38990, point 6 in the map on the left in Figure 8); the first one is the Bulagaio river, flowing from the square toward northeast and the second one is the Conca River, moving towards the west and nowadays ducted and covered by a street. Since the Etruscan period, strong headwater erosion has affected the saddle between the two rivers. However, it has remained a crucial point for the urban network. The most important Etruscan arch rises in this area, which was also the only access point to the city for those entering from the north. In 1536, the cardinal Marino Grimani ordered the deep depression to be filled, creating the current Piazza Grimana and connecting the Etruscan walled city with the ancient northern district. In addition, the point where the Etruscan arch was built has been lowered over time to reduce erosion and landslide movements. The result is a paleomorphology very different from the current topography. The applied methodology allows for the creation of a detailed final map (Figure 8, on the right) derived from the map algebra operations applied on two DEMs with a 10 × 10 m horizontal resolution, where the modified areas and the range of the volumes have been mapped.
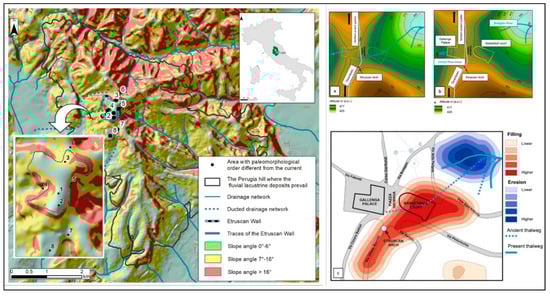
Figure 8.
The slope angle map of Perugia city is on the right of the figure. The map clearly shows the areas with the highest slope angle values (in red), which are all located in the eastern sector of the city or on the eastern facing slope of the fluvial valleys. Additionally, the map indicates areas with a paleomorphological order (black numbered dots) that differs from the current one. All the areas are located close to the downtown area, where the highest and oldest settlement is limited from the ancient Etruscan Wall. On the left side of the image is Grimana square (point 6 in left figure); (a) the initial topographic layout pre-urbanization; (b) the actual topographic layout; (c) volumes of filled material (in red) and eroded areas (in blue).
3.3.2. Benevento
The post-war urbanization of Benevento, an inner city of the Apennines in the Campania region, followed territorial development guidelines aimed at replacing the primordial rural economy and its georesources with modern residential and infrastructural conditions. The geomorphological result of the change has enhanced ancient risk conditions and generated new criticality and hydrological instability. The urban territory of Benevento occupies about a third of the municipal area, mostly consisting of small rural centers connected to each other by a modest extra-urban road network. From a geological and geomorphological point of view (Figure 9, upper box) it developed on the bottom and on the heights of a large tectonic depression deeply incised by the Calore and Sabato rivers and their tributaries. The bedrock, like the surrounding hills, is made up of arenaceous-marly-clayey Miocene deep-sea sediments deformed by the compressive tectonics also responsible for the fold-thrust structuring of the Campanian Apennine Orogen. The depression fill is mostly made up of Pliocene clastic, sandy-clayey, and conglomerate marine-coastal sediments, also deformed by tectonics, on which lie discordant Pleistocene and Holocene alluvial (gravels) and fluvial-lacustrine (sands and clays) terraced sediments.
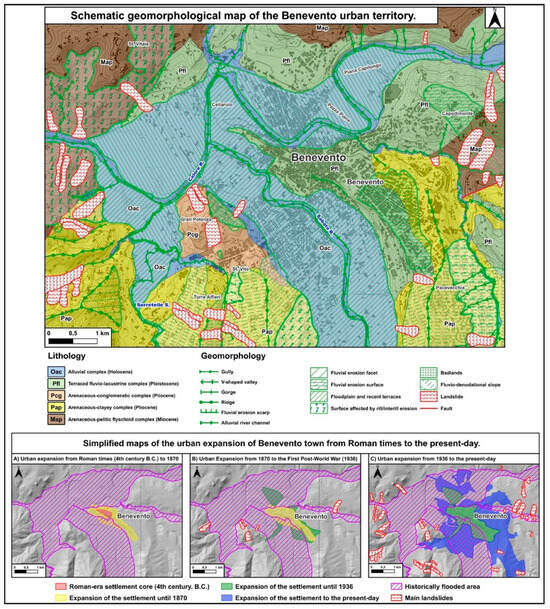
Figure 9.
(Upper box)—Schematic geomorphological map of the Benevento urban territory. (Lower box)—Simplified maps of the urban expansion of Benevento town from Roman times to the present-day.
Geological-geomorphological surveying, historiographic research, and archaeological reports analysis [78] allowed us to find evidence of human occupation of the Benevento area dating back at least to the Neolithic period. However, it was in the Samnite Period (VII-IV century BC) that Benevento established itself as a rural village scattered along the valley floors of the Sabato and Calore rivers. From the fourth century BC, with Roman predominance, a proto-urban settlement developed in an elevated position with infrastructures that was more easily defensible and safe from recurring river floods (Figure 9, lower box, panel A). In the late Middle Ages, the Lombards and later the Vatican domain further encouraged the development of urbanization towards the high hills and towards the east, starting the progressive abandonment of the insecure alluvial plains. This intramoenia urban development paradigm lasted until the post-unification period (1870). From this moment and until 1936, the depopulation of the countryside, the advent of industrialization, the new administrative structure and demographic growth imposed a decisive exit from the city walls, with re-occupation of the valley floors following new development guidelines northward and southward (Figure 9, lower box, panel B). The systematic occupation of the valley floors produced a profound alteration in the river system, whose regimentation allowed the affirmation of factories for the milling industry. The construction of new road axes made it possible to connect the nascent urban districts to the historic center, distorting the oro-hydrographic structure of the hill–valley system, with consequent widespread instability of the slopes which was not slow in manifesting itself in calamitous events. Since 1945, the urban center has undergone a progressive and disorderly radial expansion, with the occupation of all the available space from the alluvial valley floor to the sandy-clayey hill (Figure 9, lower box, panel C). This senseless development has been carried out to the detriment of an already lithologically vulnerable territory—which has aggravated the erosion (stream erosion, mass movements, etc.) of the steep sandy-clayey slopes of the Benevento hill—and has favored fatal floods due to the stiffening of the river system [79,80,81]. The study area is subject to high seismicity, with earthquakes that have repeatedly damaged urban settlements; therefore, the increase in geomorphological hazards induced by anthropization has further increased existing risk conditions.
3.4. Dissemination of Urban Geoheritage and Education about Anthropogenic Impact on Urban Sustainability
Knowledge of urban geomorphology can contribute to education about anthropogenic impact on urban sustainability. Urban geoheritage consisting of sites testifying to the anthropogenic geomorphological evolution of the Earth is a quite new field of research and a promising resource for touristic and didactic issues aimed at the comprehension of anthropogenic impacts on natural landscapes. Several of the case studies above also worked on the urban geomorphoheritage inventory, assessment, and valorization, based on the geomorphological investigation’s results.
The case studies contributed to the urban geomorphoheritage definitions and methods. The Rome and Perugia inventories contributed to the “urban geomorphosite” definition and distinction in lato sensu, sites of any geological-geomorphological interest within the city, and stricto sensu sites specifically testifying to the anthropogenic morpho-evolution of cities [82]. The Rome case study highlighted the importance of cultural and geo-historical values in urban geomorphoheritage assessment methods, proposing criteria [83] that are based on the urban environment’s peculiarities and the geo-scientific value of anthropogenic geomorphosites as testimonies to the local Earth’s history, especially related to the Anthropocene.
The implementation of geotourist products is a tool for geoheritage valorization, Some examples are the Rome GeoGuide app [84], a digital geotourist itinerary across the city historical center, and the Perugia Upside-Down exhibition [75], a tool for the popularization of the city geological context.
The AIGeo Working Group on Urban Geomorphology has also proposed a series of educational books on the urban geomorphology of the main Italian cities: Rome [85], Palermo [86], and Naples [87].
4. Discussion
At the beginning of this manuscript, we underlined the significance of the urban environment as an ecosystem in which the urban residents interact with biotic and abiotic factors [8,9]. Considering the ongoing, increasing demand for land and the expansion of the built-up areas involving and disturbing any kind of natural system inside and surrounding the actual urban areas, it is not negligible how important are the urban environment dynamics and knowledge of its physical evolution. In this context the authors presented their methodological and applicative contribution to the urban environment investigation aimed at the knowledge of the physical processes; geomorphological, historical, and anthropogenic ones in particular.
The eight case studies presented in this paper contributed to the urban geomorphological knowledge of four topics. The hypothesis is that the AIGeo WG on Urban geomorphology methodological approaches and applications can result in a guideline for physical urban environment knowledge and planning on a European and global scale. With this aim, a discussion is open about the usefulness and applicability of the approaches in other cities in the world.
The surveying and mapping of geomorphological processes and landforms in urban areas highlights some differences with respect to the analog in the natural environment. The anthropogenic processes in particular act over very short timescales and with invasive transformation of the landscape and its natural dynamics due to anthropogenic erosion and accumulation. This is important as a base for knowledge of the landscape evolution of an area and its implications. In Europe, population growth and human activities have gradually transformed natural geomorphological processes over the centuries; meanwhile, the actual population growth is more rapid and intense, especially in world regions different to Europe, where the rapidity of construction activities may have dramatically different impacts on natural topography. The strength of the multitemporal and multidisciplinary approach shown by the case studies in Section 3.1 lies in recognizing a very large variety of human activities and related anthropogenic processes and landforms in historical cities. The same human activities have had the same impact on the geomorphological evolution of urban areas since time immemorial, and it happens the same way everywhere. The wide anthropogenic landform variety is similar worldwide, and all the cities around the world can be classified and mapped thanks to the proposed multitemporal and multidisciplinary analysis. The scientific literature in Table 1 supports our opinion (see also Supplemental Material—column topic code, topic code a). It is evident in [88,89], describing and mapping anthropogenic landforms in the municipality of João Pessoa (Brazil), similar to the Italian ones, and in [90] (Vienna, VA, USA), using multitemporal topographic data (stereo aerial and ortho-imagery) for anthropogenic erosion and accumulation detection. Numerous other examples are available from Poland [91,92,93,94,95,96]. The proposal again, and in almost all cities around the world of the same landforms, offers the possibility of applying the Italian approach to cities of recent evolution or sprawling ones.
The geomorphological analysis supporting hazard assessment is important considering that human activities hardly transform natural dynamics in urban areas, inducing natural hazards and considering the high risk related to the huge amount of population, infrastructure and heritage exposed. The strength of the examples of urban geomorphology in support of hazard assessment presented in Section 3.2 consists in the natural landscape geomorphological evolution reconstruction, which is transversal to the different hazard analysis methodologies based on geotechnologies. The reconstructions often offer the key for correct geological interpretations, for urban and emergency planning in particular. The proposed methods can be replicated in multiple contexts and allow the creation of urban zoning in terms of measurable risks and consequently also have an impact on the properties’ value due to their position and typological construction quality. Furthermore, the multi-temporal investigation and the integration with stratigraphic data allow us to better define the past impact of morpho-evolutionary processes, also as a function of different climatic conditions. The international scientific literature in Table 1 offers a few examples (see also Supplemental Material—topic code b) using the multidisciplinary and multitemporal approach: only in [19] (Khartoum-Omdurman, Sudan) did the archaeological value of the study area require this kind of analysis. Considering what we stated above about human activities and natural dynamics, in our opinion the interaction between anthropogenic processes and natural ones over time should be considered in natural hazard assessment.
The analysis of landscape historical evolution and paleomorphologies in urban areas provides useful knowledge for a better comprehension of the interactions between natural and human-driven geomorphological processes, and for a more refined understanding of Holocene landscape evolution. The multitemporal and multidisciplinary analysis of topographical data and the DoD methodology may be successfully applied in further historical urban centers, where historical topographic maps with unfailing planoaltimetric data have been surveyed worldwide during the 19th and 20th centuries. The DoD, in particular, provides useful elevation information for more refined geological mapping, since trends in natural stratigraphic unit boundaries are required to be drawn consistently with the paleotopography, which in an urban setting is very often nullified by anthropogenic erosion or buried by anthropogenic deposits. In addition, the thickness evaluation seems to be valuable for urban planners and archaeologists. Compared to the previous studies in Table 1 (see also Supplemental Material—topic code c), the strengths mentioned above have not been fully applied to the analysis of interactions between natural and human-driven geomorphological processes. Several studies have used historical relief models and historical topographic maps for cultural heritage documentation [97,98,99,100]; meanwhile, many more studies have used this kind of data for the cities’ landscape historical evolution but not aimed at analyzing the natural and anthropogenic morphogenesis interactions [101,102,103,104,105,106].
The case studies regarding the dissemination of urban geoheritage value presented in Section 3.4 deal with urban geotourism and geoeducation. The strength of this kind of dissemination consists in storytelling about the anthropogenic impact on urban sustainability, which is incisive thanks to the attractiveness of historical cities’ heritage and mix of natural and cultural values. In Table 1 (see also Supplemental Material—topic code d) mainly European examples are available on the topic [107,108,109,110,111,112,113,114,115,116,117], even though every city in the world has this opportunity. The relationship between nature and culture is certainly very strong in the European cities and it is important for successful geotourism. Thus, from the geoheritage and geo-education point of view, the Italian and European case studies should form a guideline on the topic to be replicable everywhere.
5. Conclusions
The main aim of this paper was to illustrate an effective approach to urban geomorphological investigation and propose it and the results as a model and example for physical urban environment knowledge and planning on a European and global scale. The geomorphological research into the urban environment has potential for enhancing basic knowledge of natural and anthropogenic morphoevolution (surveying and mapping urban geomorphology) and for making cities and human settlements safe, resilient, and sustainable, as planned in Sustainable Development Goal 11 (geo-hazards assessment, historical evolution and paleomorphologies analysis, disseminating human activities’ impact on the landscape through geoeducation). The six Italian case studies and the two international ones (Greece and Brazil) describe the same approach and several applications in similar but different urban contexts, addressing the physical environment of modern cities in a multi-temporal, multidisciplinary and critical manner with respect to global changes. In the discussion, the following strengths of the approach are highlighted: the multi temporal analysis of multidisciplinary data allows the analysis of anthropogenic erosion and accumulation of types and rates and their impact on natural morphodynamics, and to plan and manage the urban sprawl adequately: historical topographic information was integrated with recent findings, and comparison by overlay highlights the variety of human activities and the resulting landscape transformations; integration with historical and archaeological data allows us to recognize the geomorphological constraints to settlements, the solutions adopted, and to hypothesize regarding the suitable directions of the urban sprawl in the past and currently; the investigation of these factors enhances the knowledge of hardly transformed natural dynamics and the interaction between anthropogenic processes and natural ones in triggering natural hazards; the above mentioned analysis and related results are useful for inventorying urban geomorphosites, testifying to the anthropogenic geomorphological evolution of the Earth, and it allows the planning of geoducation and geotourism activities.
In conclusion, the actualism principle applies for anthropogenic processes too. In fact, the human activities acting nowadays have acted since the beginning of human settlements and will act similarly also in the future. It requires analysis of historical city expansion over the centuries and learning from best practices and, moreover, from bad ones. For this reason, the multidisciplinary and multitemporal approach should be a basic guideline for urban environment geomorphological analysis, useful for several applications such as the ones presented in this work.
Furthermore, urban geomorphology is directly related to the historical context of the land use and occupation of these cities, which occurred with different dynamics in time and space. This fact allows the knowledge and material produced in works like this to be used as one of the foundations for urban planning and the prevention of negative environmental impacts. However, it is important to highlight that this must be a continuous effort, as the complexity inherent to the theme, given the breadth of urban contexts and associated global changes, demands special attention to improve the quality of life and environmental challenges arising from anthropogenic pressures.
Supplementary Materials
The following supporting information can be downloaded at https://www.mdpi.com/article/10.3390/land13070907/s1.
Author Contributions
Conceptualization, A.P., L.M., and P.B.; methodology, all authors; validation, all authors; formal analysis, A.P., M.D.M., F.F., A.M., C.D., C.S., L.S., L.M., A.P.F., M.L., M.B., L.M. and F.R.; investigation, all authors; data curation, all authors; writing—original draft preparation, A.P. and L.L.; writing—review and editing, all authors; visualization, all authors; supervision, L.M. and P.B. All authors have read and agreed to the published version of the manuscript.
Funding
L.L., A.P.F., and C.D. thank the São Paulo Research Foundation (FAPESP) through the grant’s nº 2021/09333-9 and 2023/05346-4.
Data Availability Statement
The data presented in this study are available on the article and Supplementary Materials, further inquiries can be directed to the corresponding author.
Conflicts of Interest
The authors declare no conflicts of interest.
References
- Bathrellos, G.D. An overview in urban geology and urban geomorphology. Bull. Geol. Soc. Greece 2007, 40, 1354–1364. [Google Scholar] [CrossRef]
- Szabó, J. Anthropogenic Geomorphology: Subject and System. In Anthropogenic Geomorphology; Szabó, J., Dávid, L., Lóczy, D., Eds.; Springer: Dordrecht, The Netherlands, 2010. [Google Scholar] [CrossRef]
- Cooke, R.U. Urban geomorphology. Geogr. J. 1976, 142, 59–65. [Google Scholar] [CrossRef]
- Cooke, R.U.; Brunsden, D.; Doornkamp, J.C.; Jones, D.K.C. Urban Geomorphology in Drylands; Oxford University Press: Oxford, UK, 1982. [Google Scholar]
- Gibbs, J.P. Measures of Urbanization. Soc. Forces 1966, 45, 170–177. [Google Scholar] [CrossRef]
- United Nations, Department of Economic and Social Affairs, Population Division. Revision of the World Urbanization Prospects. 2018. Available online: https://population.un.org/wup/publications/Files/WUP2018-Report.pdf (accessed on 10 February 2024).
- Taubenböck, H.; Droin, A.; Standfuß, I.; Dosch, F.; Sander, N.; Milbert, A.; Eichfuss, S.; Wurm, M. To be, or not to be ‘urban’? A multi-modal method for the differentiated measurement of the degree of urbanization. Comput. Environ. Urban Syst. 2022, 95, 101830. [Google Scholar] [CrossRef]
- Rebele, F. Urban ecology and special features of urban ecosystems. Glob. Ecol. Biogeogr. Lett. 1994, 4, 173–187. [Google Scholar] [CrossRef]
- Bai, X. Eight energy and material flow characteristics of urban ecosystems. Ambio 2016, 45, 819–830. [Google Scholar] [CrossRef]
- Hooke, R.L. On the history of humans as geomorphic agents. Geology 2000, 28, 843–846. [Google Scholar] [CrossRef]
- Zwoliński, Z.; Hildebrandt-Radke, I.; Mazurek, M.; Makohonienko, M. Anthropogeomorphological metamorphosis of an urban area in the postglacial landscape: A case study of Poznan’ city. In Urban Geomorphology, Landforms and Processes in Cities; Thornbush, M.J., Allen, C.D., Eds.; Elsevier: Amsterdam, The Netherlands, 2018; pp. 55–77. [Google Scholar]
- Gisotti, G. La Fondazione Delle Città; Carocci Editore: Rome, Italy, 2016; ISBN 9788843080762. [Google Scholar]
- Hollis, G. The effect of urbanization on floods of different recurrence interval. Water Resourources Res. 1975, 11, 431–435. [Google Scholar] [CrossRef]
- McGranahan, G.; Balk, D.; Anderson, B. The rising tide: Assessing the risks of climate change and human settlements in low elevation coastal zones. Environ. Urban. 2007, 19, 17–37. [Google Scholar] [CrossRef]
- Fox, S. Urbanization as a global historical process: Theory and evidence from sub-Saharan Africa. Popul. Dev. Rev. 2012, 38, 285–310. [Google Scholar] [CrossRef]
- Salem, A. The anthropogenic geomorphology of the new suburbs, East of Greater Cairo, Egypt. Bull. De La Société De Géographie D’egypte 2018, 91, 1–28. [Google Scholar] [CrossRef]
- Wu, Z.; Milliman, J.D.; Zhao, D.; Cao, Z.; Zhou, J.; Zhou, C. Geomorphologic changes in the lower Pearl River Delta, 1850–2015, largely due to human activity. Geomorphology 2018, 314, 42–54. [Google Scholar] [CrossRef]
- Daoudi, M.; Niang, A.J. Effects of geomorphological characteristics on urban expansion of Jeddah city-Western Saudi Arabia: A GIS and Remote Sensing Data-Based Study (1965–2020). J. Taibah Univ. Sci. 2021, 15, 1217–1231. [Google Scholar] [CrossRef]
- Zerboni, A.; Brandolini, F.; Mariani, G.S.; Perego, A.; Salvatori, S.; Usai, D. The Khartoum-Omdurman conurbation: A growing megacity at the confluence of the Blue and White Nile Rivers. J. Maps 2021, 17, 227–240. [Google Scholar] [CrossRef]
- OECD Organisation for Economic Co-Operation and Development. Urban Population by City Size (Indicator). 2023. Available online: https://www.oecd-ilibrary.org/urban-rural-and-regional-development/urban-population-by-city-size/indicator/english_b4332f92-en (accessed on 12 December 2023). [CrossRef]
- Eurostat. European Statistics on Cities. 2019. Available online: https://ec.europa.eu/eurostat/documents/4031688/7672011/KS-04-16-588-EN-N.pdf (accessed on 20 January 2024).
- Degurba Refined Degree of Urbanisation in Europe. 2018. Available online: https://www.eea.europa.eu/en/datahub/datahubitem-view/a5857b35-9d27-4d42-94b7-4d141ee5b550 (accessed on 20 January 2024).
- Urban Atlas Land Cover/Land Use. 2018. Available online: https://land.copernicus.eu/en/products/urban-atlas (accessed on 20 January 2024).
- Istat. Classificazioni Statistiche e Dimensione dei Comuni. 2024. Available online: https://www.istat.it/it/archivio/156224 (accessed on 20 January 2024).
- Lazzari, M. Utilizzo delle fonti storiche per lo studio della pericolosità e del rischio geomorfologico. Mem. Descr. Della Carta Geol. D’italia 2014, XCVI, 251–260. [Google Scholar]
- Del Monte, M.; D’Orefice, M.; Luberti, G.M.; Marini, R.; Pica, A.; Vergari, F. Geomorphological classification of urban landscapes: The case study of Rome (Italy). J. Maps 2016, 12, 178–189. [Google Scholar] [CrossRef]
- Coratza, P.; Bollati, I.M.; Panizza, V.; Brandolini, P.; Castaldini, D.; Cucchi, F.; Deiana, G.; Del Monte, M.; Faccini, F.; Finocchiaro, F.; et al. Advances in Geoheritage Mapping: Application to Iconic Geomorphological Examples from the Italian Landscape. Sustainability 2021, 13, 11538. [Google Scholar] [CrossRef]
- Alexopoulou, E.; Stamatiou, S. Memories of Maps, Patras. 1831–1943; Patras, Greece, 2014; ISBN 978-960-87448-5-1. [Google Scholar]
- Griffiths, J.S.; Abraham, J.K. Factors affecting the use of applied geomorphology maps to communicate with different end-users. J. Maps 2008, 4, 201–210. [Google Scholar] [CrossRef]
- ISPRA. Carta Geomorfologica D’italia 1:50.000. Guida Alla Rappresentazione Cartografica. In Quaderni Serie III; Volume 10. 2007. Available online: https://www.isprambiente.gov.it/it/pubblicazioni/periodici-tecnici/i-quaderni-serie-iii-del-sgi/carta-geomorfologica-ditalia-1-50-000-guida-alla (accessed on 9 February 2024).
- Campobasso, C.; Carton, A.; Chelli, A.; D’Orefice, M.; Dramis, F.; Graciotti, R.; Guida, D.; Pambianchi, G.; Peduto, F.; Pellegrini, F. Aggiornamento ed Integrazioni delle Linee Guida della Carta Geomorfologica d’Italia alla Scala 1:50,000; ISPRA: Rome, Italy, 2018. Available online: https://www.isprambiente.gov.it/it/pubblicazioni/periodici-tecnici/i-quaderni-serie-iii-del-sgi/cartageomorfologica-ditalia-alla-scala-1-50.000-aggiornamento-ed-integrazioni-delle-linee-guida-della-carta-geomorfologicaditalia-alla-scala-1-50.000-fascicolo-i (accessed on 14 October 2021).
- Funiciello, R.; Giordano, G. La nuova carta geologica di Roma: Litostratigrafia e organizzazione stratigrafica. In La Geologia di Roma dal Centro Storico alla Periferia; Funiciello, R., Praturlon, A., Giordano, G., Eds.; Memorie Descrittive della Carta Geologica d’Italia; S.E.L.C.A., 2008; Volume 80, pp. 39–85. [Google Scholar]
- Karner, D.B.; Marra, F.; Renne, P.R. The history of the Monti Sabatini and Alban hills volcanoes: Groundwork for assessing volcanic-tectonic hazards for Rome. J. Volcanol. Geotherm. Res. 2001, 107, 185–215. [Google Scholar] [CrossRef]
- Vergari, F.; Luberti, G.M.; Pica, A.; Del Monte, M. Geomorphology of the historic centre of the Urbs (Rome, Italy). J. Maps 2021, 17, 6–17. [Google Scholar] [CrossRef]
- Etzelmuller, B. On the Quantification of surface changes using Grid-based digital elevation models (DEMs). Trans. GIS 2000, 4, 129–143. [Google Scholar] [CrossRef]
- Luberti, G.M.; Vergari, F.; Pica, A.; Del Monte, M. Estimation of the thickness of anthropogenic deposits in historical urban centres: An interdisciplinary methodology applied to Rome (Italy). Holocene 2019, 29, 158–172. [Google Scholar] [CrossRef]
- Brandolini, P.; Faccini, F.; Paliaga, G.; Piana, P. Man-Made landforms survey and mapping of an urban historical centre in a coastal Mediterranean environment. Geogr. Fis. E Din. Quat. 2018, 41, 97–102. [Google Scholar]
- Faccini, F.; Giardino, M.; Paliaga, G.; Perotti, L.; Brandolini, P. Urban geomorphology of Genoa Old City (Italy). J. Maps 2021, 17, 51–64. [Google Scholar] [CrossRef]
- Sacchini, A.; Imbrogio Ponaro, M.; Paliaga, G.; Piana, P.; Faccini, F.; Coratza, P. Geological Landscape and Stone Heritage of the Genoa Walls Urban Park and surrounding area (Italy). J. Maps 2018, 14, 528–541. [Google Scholar] [CrossRef]
- Terrone, M.; Piana, P.; Paliaga, G.; D’Orazi, M.; Faccini, F. Coupling Historical Maps and LiDAR Data to Identify Man-Made Landforms in Urban Areas. ISPRS Int. J. Geo-Inf. 2021, 10, 349. [Google Scholar] [CrossRef]
- Somma, R.; Iuliano, S.; Matano, F.; Molisso, F.; Passaro, S.; Sacchi, M.; Troise, C.; De Natale, G. High-resolution morpho-bathymetry of Pozzuoli Bay, southern Italy. J. Maps 2016, 12, 222–230. [Google Scholar] [CrossRef]
- Patacca, E.; Sartori, R.; Scandone, P. Tyrrhenian basin and Apenninic arcs: Kinematic relations since Late Tortonian times. Mem. Descr. Della Carta Geol. D’italia 1990, 45, 425–451. [Google Scholar]
- Isaia, R.; Vitale, S.; Marturano, A.; Aiello, G.; Barra, D.; Ciarcia, S.; Iannuzzi, E.; Tramparulo, F.D. High-resolution geological investigations to reconstruct the long-term ground movements in the last 15 kyr at Campi Flegrei caldera (southern Italy). J. Volcanol. Geotherm. Res. 2019, 385, 143–158. [Google Scholar] [CrossRef]
- Lima, A.; Bodnar, R.J.; De Vivo, B.; Spera, F.J.; Belkin, H.E. Interpretation of recent unrest events (bradyseism) at Campi Flegrei, Napoli (Italy): Comparison of models based on cyclical hydrothermal events versus shallow magmatic intrusive events. Geofluids 2021, 2021, 2000255. [Google Scholar] [CrossRef]
- Del Gaudio, C.; Aquino, I.; Ricciardi, G.P.; Ricco, C.; Scandoni, R. Unrest episodes at Campi Flegrei: A reconstruction of vertical ground movements during 1905–2009. J. Volcanol. Geotherm. Res. 2010, 195, 48–56. [Google Scholar] [CrossRef]
- Guidoboni, E.; Ciuccarelli, C. The Campi Flegrei caldera: Historical revision and new data on seismic crises, bradyseism, the Monte Nuovo eruption and ensuing earthquakes (twelfth century 1538 AD). Bull. Volcanol. 2010, 73, 655–677. [Google Scholar] [CrossRef]
- Sharp, W.E.; Nardi, G. A study of the heavy metal pollution in the bottom sediments at Porto di Bagnoli (Naples), Italy. J. Geochem. Explor. 1987, 29, 49–73. [Google Scholar] [CrossRef]
- Trifuoggi, M.; Donadio, C.; Ferrara, L.; Stanislao, C.; Toscanesi, M.; Arienzo, M. Levels of pollution of rare earth elements in the surface sediments from the Gulf of Pozzuoli (Campania, Italy). Mar. Pollut. Bull. 2018, 136, 374–384. [Google Scholar] [CrossRef] [PubMed]
- Trifuoggi, M.; Donadio, C.; Mangoni, O.; Ferrara, L.; Bolinesi, F.; Nastro, R.A.; Stanislao, C.; Toscanesi, M.; Di Natale, G.; Arienzo, M. Distribution and enrichment of trace metals in surface marine sediments in the Gulf of Pozzuoli and off the coast of the brownfield metallurgical site of Ilva of Bagnoli (Campania, Italy). Mar. Pollut. Bull. 2017, 124, 502–511. [Google Scholar] [CrossRef] [PubMed]
- Vitale, S.; Natali, J. Combined volcano-tectonic processes for the drowning of the Roman western coastal settlements at Campi Flegrei (southern Italy). Earth Planet Space 2023, 75, 15. [Google Scholar] [CrossRef]
- Stanislao, C. Geomorphological and Geoarchaeological Indicators of Vertical Ground Motions to Reconstruct Landscape Morphoevolution of Campania. Ph.D. Thesis, XXX Cycle, Department of Earth Sciences, Environment and Resources, University of Naples Federico II, Naples, Italy, 2018; 268p. [Google Scholar]
- Mattei, G.; Amato, L.; Caporizzo, C.; Cinque, A.; Pappone, G.; Sorrentino, A.; Troisi, S.; Aucelli, P.P.C. Reconstructing anthropic coastal landscape of Campi Flegrei volcanic area (Southern Italy) during the Roman period from multi-technique surveys. J. Maps 2023, 19, 2187320. [Google Scholar] [CrossRef]
- Sacchi, M.; Pepe, F.; Corradino, M.; Insinga, D.; Molisso, F.; Lubritto, C. The Neapolitan Yellow Tuff caldera offshore the Campi Flegrei: Stratal architecture and kinematic reconstruction during the last 15 ky. Mar. Geol. 2014, 354, 15–33. [Google Scholar] [CrossRef]
- ELSTAT—Hellenic Statistical Authority. Available online: https://www.statistics.gr (accessed on 20 January 2024).
- Stamatopoulos, L.; Alevizos, G. Morphological evolution of the urban landscape of the city of Patras and possible natural hazards. In Proceedings of the Abstract Book of the SGI-SIMP Congress, Geosciences for the Environment, Natural Hazard and Cultural Heritage, Catania, Italy, 12–14 September 2018; Società Geologica Italiana: Roma, Italy, 2018; p. 753. [Google Scholar]
- Ferentinos, G.; Brooks, M.; Doutsos, T. Quaternary tectonics in the Gulf of Patras, western Greece. J. Struct. Geol. 1985, 7, 713–717. [Google Scholar] [CrossRef]
- Kontopoulos, N.; Doutsos, T. Sedimentology and tectonics of the Antirion area (western Greece). Boll. Della Soc. Geol. Ital. 1985, 104, 479–489. [Google Scholar]
- Koukouvelas, I.; Doutsos, T. Implications of structural segmentation during earthquakes: The 1995 Egion earthquake, Gulf of Corinth, Greece. J. Struct. Geol. 1996, 18, 1381–1388. [Google Scholar] [CrossRef]
- Doutsos, T.; Kokkalas, S. Stress and deformation patterns in the Aegean region. J. Struct. Geol. 2001, 23, 455–472. [Google Scholar] [CrossRef]
- Stefatos, A.; Papatheodorou, G.; Ferentinos, G.; Leeder, M.; Collier, R. Seismic reflection imaging of active offshore faults in the Gulf of Corinth: Their seismotectonic significance. Basin Res. 2002, 14, 487–502. [Google Scholar] [CrossRef]
- SJB—São João da Barra (2023). Prefeitura. 2014. Available online: http://www.sjb.rj.gov.br/historico (accessed on 14 July 2023).
- ANA—Agência Nacional de Águas (HidroWeb. Sistema de Informações Hidrológicas). 2023. Available online: http://www.snirh.gov.br/hidroweb/ (accessed on 14 July 2023).
- CPRM—Serviço Geológico do Brasil. Geologia do Estado do Rio de Janeiro; Programa Levantamentos Geológicos Básicos do Brasil; Ministério de Minas e Energia: Brasília, Brazil, 2001; 80p. [Google Scholar]
- Martin, L.; Suguio, K.; Flexor, J.M.; Dominguez, J.; Azevedo, A.E.G. Evoluçao da planicie costeira do rio Paraiba do Sul (RJ) durante o quaternario: Influencia das flutuaçoes do nivel do mar. In Anais Do Trigesimo Terceiro Congresso Brasileiro de Geologia; Congresso Brasileiro de Geologia, 33: Rio de Janeiro, Brazil, 1984; pp. 84–97. [Google Scholar]
- da Rocha, T.B.; De Vasconcelos, S.C.; Pereira, T.G.; Fernandez, G.B. Datação por Luminescência Opticamente Estimulada (LOE) nas cristas de praia do delta do rio Paraíba do Sul: Considerações sobre a evolução geomorfológica entre o Pleistoceno superior e o Holoceno. Rev. Bras. Geomorfol. 2019, 20. [Google Scholar] [CrossRef]
- Lämmle, L.; Perez Filho, A.; Donadio, C.; Moreira, V.B.; Santos, C.J.; Souza, A.O. Baixos terraços marinhos associados às transgressões e regressões marinhas holocênicas na Planície Costeira do rio Paraíba do Sul, Rio de Janeiro, Brasil. Rev. Bras. Geomorfol. 2022, 23, 1285–1303. [Google Scholar] [CrossRef]
- Souza, A.O.; Lämmle, L.; Perez Filho, A.; Donadio, C. Recent geomorphological changes in the Paraiba do Sul delta, South America East Coast. Prog. Phys. Geogr. 2022, 46, 566–588. [Google Scholar] [CrossRef]
- Souza, A.O.; Lämmle, L.; Perez Filho, A.; Donadio, C. Reply to the comments on Souza et al. (2022)—Recent geomorphological changes in the Paraiba do Sul delta, South America East Coast. Prog. Phys. Geogr. 2023, 1, 1–10. [Google Scholar] [CrossRef]
- Lämmle, L.; Perez Filho, A.; Donadio, C.; Arienzo, L.; Ferrara, L.; Santos, C.J.; Souza, A.O. Anthropogenic Pressure on Hydrographic Basin and Coastal Erosion in the Delta of Paraíba do Sul River, Southeast Brazil. J. Mar. Sci. Eng. 2022, 10, 1585. [Google Scholar] [CrossRef]
- Costa, L.L.; Bulhões, E.M.R.; Caetano, J.P.A.; Arueira, V.F.; Almeida, D.T.; Vieira, T.B.; Cardoso, L.J.T.; Zalmon, I.R. Do costal erosion and urban development threat loggerhead sea turtle nesting? Implications for sandy beach management. Front. Mar. Sci. 2023, 10, 1242903. [Google Scholar] [CrossRef]
- Longhitano, S.G. Sedimentary facies and sequence stratigraphy of coarse-grained Gilbert-type deltas within the Pliocene thrust-top Potenza Basin (Southern Apennines, Italy). Sediment. Geol. 2008, 210, 87–110. [Google Scholar] [CrossRef]
- Danese, M.; Lazzari, M.; Murgante, B. Integrated geological, geomorphological and geostatistical analysis to study macroseismic effects of 1980 Irpinian earthquake in urban areas (southern Italy). In Lecture Notes in Computer Science; Gervasi, O., Taniar, D., Murgante, B., Laganà, A., Mun, Y., Gavrilova, M.L., Eds.; ICCSA 2009; Springer: Berlin/Heidelberg, Germany, 2009; Volume 5592, pp. 50–65. [Google Scholar]
- Danese, M.; Lazzari, M.; Murgante, B. Geostatistics in Historical Macroseismic Data Analysis. In Transaction on Computational Science VI; Gavrilova, M.L., Tan, C.J.K., Eds.; LNCS 5730; Springer: Berlin/Heidelberg, Germany, 2009; pp. 324–341. [Google Scholar]
- Getis, A.; Ord, J.K. The analysis of spatial association by use of distance statistics. Geogr. Anal. 1992, 24, 189–206. [Google Scholar] [CrossRef]
- Melelli, L. Perugia upside-down: A multimedia exhibition in Umbria (Central Italy) for improving geoheritage and geotourism in urban areas. Resources 2019, 8, 148. [Google Scholar] [CrossRef]
- Melelli, L.; Silvani, F.; Ercoli, M.; Pauselli, C.; Tosi, G.; Radicioni, F. Urban Geology for the Enhancement of the Hypogean Geosites: The Perugia Underground (Central Italy). Geoheritage 2021, 13, 18. [Google Scholar] [CrossRef]
- Wheaton, J.M.; Brasington, J.; Darby, S.E.; Sear, D.A. Accounting for uncertainty in DEMs from repeat topographic surveys: Improved sediment budgets. Earth Surf. Process. Landf. 2010, 35, 136–156. [Google Scholar] [CrossRef]
- Bencardino, F. Benevento, Funzioni Urbane e Trasformazioni Territoriali; Edizioni Scientifiche Italiane S.p.A.: Napoli, Italy, 1991; p. 211. [Google Scholar]
- Valente, A.; Iscaro, C.; Magliulo, P.; Russo, F. The flood event in Benevento on 14th–15th October 2015: A short report. Rend. Line Della Soc. Geol. Ital. 2016, 38, 105–108. [Google Scholar] [CrossRef]
- Guerriero, L.; Focareta, M.; Fusco, G.; Rabuano, R.; Guadagno, F.M.; Revellino, P. Flood hazard of major river segments, Benevento Province, Southern Italy. J. Maps 2018, 14, 597–606. [Google Scholar] [CrossRef]
- Magliulo, P.; Valente, A. GIS-Based Geomorphological Map of the Calore River floodplain near Benevento (Southern Italy) overflooded by the 15th October 2015 event. Water 2020, 12, 148. [Google Scholar] [CrossRef]
- Reynard, E.; Pica, A.; Coratza, P. Urban geomorphological heritage. An overview. In Quaestiones Geographicae; Bogucki Wydawnictwo Naukowe: Poznań, Poland, 2017; Volume 36, pp. 7–20. [Google Scholar]
- Pica, A.; Luberti, G.M.; Vergari, F.; Fredi, P.; Del Monte, M. Contribution for an urban geomorphoheritage assessment method: Proposal from three geomorphosites in Rome (Italy). Quaest. Geogr. 2017, 36, 21–36. [Google Scholar] [CrossRef]
- Pica, A.; Reynard, E.; Grangier, L.; Kaiser, C.; Ghiraldi, L.; Perotti, L.; Del Monte, M. GeoGuides, Urban Geotourism Offer Powered by Mobile Application Technology. Geoheritage 2018, 10, 311. [Google Scholar] [CrossRef]
- Del Monte, M. Geomorphology of Rome; Sapienza Università Editrice: Rome, Italy, 2020; ISBN 9788893771498. [Google Scholar]
- Agnesi, V. La Geomorfologia di Palermo; Sapienza Università Editrice: Rome, Italy, 2021; ISBN 9788893771689. [Google Scholar]
- Calcaterra, D. La Geomorfologia di Napoli; Sapienza Università Editrice: Rome, Italy, 2023; ISBN 9788893772884. [Google Scholar]
- Barbosa, T.S.; Furrier, M. Methodological considerations and proposed integrated legend for anthropogenic geomorphological mapping. Rev. Bras. Geomorfol. 2023, 24. [Google Scholar] [CrossRef]
- Barbosa, T.S.; Furrier, M. Anthropogenic Geomorphological Mapping of the Central Sector of the João Pessoa Metropolitan Region (PB), Brazil. Rev. Bras. De Geomorfol. 2023, 24. [Google Scholar] [CrossRef]
- Chirico, P.G.; Bergstresser, S.E.; De Witt, J.; Alessi, M.A. Geomorphological mapping and anthropogenic landform change in an urbanizing watershed using structure-from-motion photogrammetry and geospatial modeling techniques. J. Maps 2021, 17, 241–252. [Google Scholar] [CrossRef]
- Jancewicz, K.; Traczyk, A.; Migoń, P. Landform modifications within an intramontane urban landscape due to industrial activity, Wałbrzych, SW Poland. J. Maps 2021, 17, 194–201. [Google Scholar] [CrossRef]
- Łajczak, A.; Zarychta, R.; Wałek, G. Changes in the topography of Krakow city centre, Poland, during the last millennium. J. Maps 2021, 17, 186–193. [Google Scholar] [CrossRef]
- Łajczak, A.; Zarychta, R. Kraków—Anthropogenic Changes in the Relief of a Large City. In Landscapes and Landforms of Poland; Migoń, P., Jancewicz, K., Eds.; World Geomorphological Landscapes; Springer: Cham, Switzerland, 2024. [Google Scholar] [CrossRef]
- Molewski, P. Anthropogenic degradation of dunes within a city: A disappearing feature of the cultural landscape of Toruń (Poland). J. Maps 2021, 17, 162–169. [Google Scholar] [CrossRef]
- Wierzbicki, G.; Ostrowski, P.; Bartold, P.; Bujakowski, F.; Falkowski, T.; Osinski, P. Urban geomorphology of the Vistula River valley in Warsaw. J. Maps 2021, 17, 170–185. [Google Scholar] [CrossRef]
- Zwoliński, Z.; Jasiewicz, J.; Mazurek, M.; Hildebrandt-Radke, I.; Makohonienko, M. Geohazards and Geomorphological Setting in Poznań Urban Area, Poland. J. Maps 2021, 17, 202–214. [Google Scholar] [CrossRef]
- Fuse, T.; Shimizu, E.; Morichi, S. A study on geometric correction of historical maps. Int. Arch. Photogramm. Remote Sens. 1998, 32, 543–548. [Google Scholar]
- Niederöst, J. Landscape as a historical object: 3D reconstruction and evaluation of a relief model from the 18th century. In ETH Zurich Research Collection; Swiss Federal Institute of Technology, Institute of Geodesy and Photogrammetry: Zurich, Switzerland, 2002. [Google Scholar] [CrossRef]
- Shimizu, E.; Fuse, T. Rubber-sheeting of historical maps in GIS and its application to landscape visualization of old-time cities: Focusing on Tokyo of the past. Proc. 8th Int. Conf. Comput. Urban Plan. Urban Manag. 2003, 11, 3–8. [Google Scholar]
- Fuse, T.; Shimizu, E. Visualizing the landscape of old-time Tokyo (Edo City). In Processing and Visualization Using High-Resolution Images; Gruen, A., Murai, S., Fuse, T., Remondino, F., Eds.; ISPRS XXXVI-5/W1; ISPRS: Pitsanulok, Thailand, 2004; Available online: http://www.isprs.org/proceedings/XXXVI/5-W1/papers/21.pdf (accessed on 29 January 2024).
- Rodrigues, C. Morfologia original e morfologia antropogênica na definição de unidades espaciais de planejamento urbano: Exemplo na metrópole paulista. Rev. Dep. Geogr. 2005, 17, 101–111. [Google Scholar] [CrossRef]
- Hohensinner, S.; Lager, B.; Sonnlechner, C.; Haidvogl, G.; Gierlinger, S.; Schmid, M.; Krausmann, F.; Winiwarter, V. Changes in water and land: The reconstructed Viennese riverscape from 1500 to the present. Water Hist. 2013, 5, 145–172. [Google Scholar] [CrossRef] [PubMed]
- Jordan, H.; Hamilton, K.; Lawley, R.; Price, S.J. Anthropogenic contribution to the geological and geomorphological record: A case study from Great Yarmouth, Norfolk, UK. Geomorphology 2016, 253, 534–546. [Google Scholar] [CrossRef]
- Knight, J. Transforming the Physical Geography of a City: An Example of Johannesburg, South Africa. In Urban Geomorphology; Mary, J., Thornbush, C.D., Allen, Eds.; Elsevier: Amsterdam, The Netherlands, 2018; pp. 129–147. ISBN 9780128119518. [Google Scholar] [CrossRef]
- Petrus, J.M.; Ruiz, M.; Estrany, J. Interactions between Geomorphology and Urban Evolution Since Neolithic Times in a Mediterranean City. In Urban Geomorphology; Mary, J., Thornbush, C.D., Allen, Eds.; Elsevier: Amsterdam, The Netherlands, 2018; pp. 9–35. ISBN 9780128119518. [Google Scholar] [CrossRef]
- Berčič, T. Virtual Restoration and Preservation of Anthropogenic Nineteenth-Century Landscapes Based on Historical Land-Use Data. In Cultural Urban Heritage; Obad Šćitaroci, M., Bojanić Obad Šćitaroci, B., Mrđa, A., Eds.; The Urban Book Series; Springer: Cham, Switzerland, 2019. [Google Scholar] [CrossRef]
- Brandolini, P.; Faccini, F.; Paliaga, G.; Piana, P. Urban geomorphology in coastal environment: Man-made morpholog-ical changes in a seaside tourist resort (Rapallo, eastern Liguria, Italy). In Quaestiones Geographicae; Bogucki Wy-dawnictwo Naukowe: Poznań, Poland, 2017; Volume 36, pp. 97–110. [Google Scholar]
- Comănescu, L.; Nedelea, A.; Stănoiu, G. Geomorphosites and geotourism in Bucharest city center (Romania). In Quaestiones Geographicae; Bogucki Wydawnictwo Naukowe: Poznań, Poland, 2017; Volume 36, pp. 51–61. [Google Scholar]
- Dall’Aglio, P.L.; De Donatis, M.; Franceschelli, C.; Guerra, C.; Nesci, O.; Piacentini, D.; Savelli, D. Geomorphological and anthropic control of the development of some Adriatic historical towns (Italy) since the Roman age. In Quaestiones Geographicae; Bogucki Wydawnictwo Naukowe: Poznań, Poland, 2017; Volume 36, pp. 111–123. [Google Scholar]
- Górska-Zabielska, M.; Zabielski, R. Potential values of urban geotourism development in a small Polish town (Pruszków, Central Mazovia, Poland). In Quaestiones Geographicae; Bogucki Wydawnictwo Naukowe: Poznań, Poland, 2017; Volume 36, pp. 75–86. [Google Scholar]
- Kubalikova, L.; Kirchner, K.; Bajer, A. Secondary geodiversity and its potential for urban geotourism: A case studyfrom Brno city, Czech Republic. In Quaestiones Geographicae; Bogucki Wydawnictwo Naukowe: Poznań, Poland, 2017; Volume 36, pp. 63–73. [Google Scholar]
- Kubalíková, L.; Drápela, E.; Kirchner, K.; Bajer, A.; Balkova, M.; Kuda, F. Urban geotourism development and geoconservation: Is it possible to find a balance? Environ. Sci. Policy 2021, 121, 1–10, ISSN 1462-9011. [Google Scholar] [CrossRef]
- Nistor, C.; Mihai, B.; Toma, L.; Carlan, I. Photogrammetric modelling for urban medieval site mapping. A casestudy from Curtea de Argeş, Romania. In Quaestiones Geographicae; Bogucki Wydawnictwo Naukowe: Poznań, Poland, 2017; Volume 36, pp. 87–96. [Google Scholar]
- Tičar, J.; Komac, B.; Zorn, M.; Ferk, M.; Hrvatin, M.; Ciglic, R. From urban geodiversity to geoheritage: The caseof Ljubljana (Slovenia). In Quaestiones Geographicae; Bogucki Wydawnictwo Naukowe: Poznań, Poland, 2017; Volume 36, pp. 37–50. [Google Scholar]
- Zwoliński, Z.; Hildebrandt-Radke, I.; Mazurek, M.; Makohonienko, M. Existing and proposed urban geosites values resulting from geodiversity of Poznań City. In Quaestiones Geographicae; Bogucki Wydawnictwo Naukowe: Poznań, Poland, 2017; Volume 36, pp. 125–149. [Google Scholar]
- Pelfini, M.; Brandolini, F.; D’Archi, S.; Pellegrini, L.; Bollati, I. Papia civitas gloriosa: Urban geomorphology for a thematic itinerary on geocultural heritage in Pavia (Central Po Plain, N Italy). J. Maps 2021, 17, 42–50. [Google Scholar] [CrossRef]
- Vegas, J.; Díez-Herrero, A. An Assessment Method for Urban Geoheritage as a Model for Environmental Awareness and Geotourism (Segovia, Spain). Geoheritage 2021, 13, 27. [Google Scholar] [CrossRef]
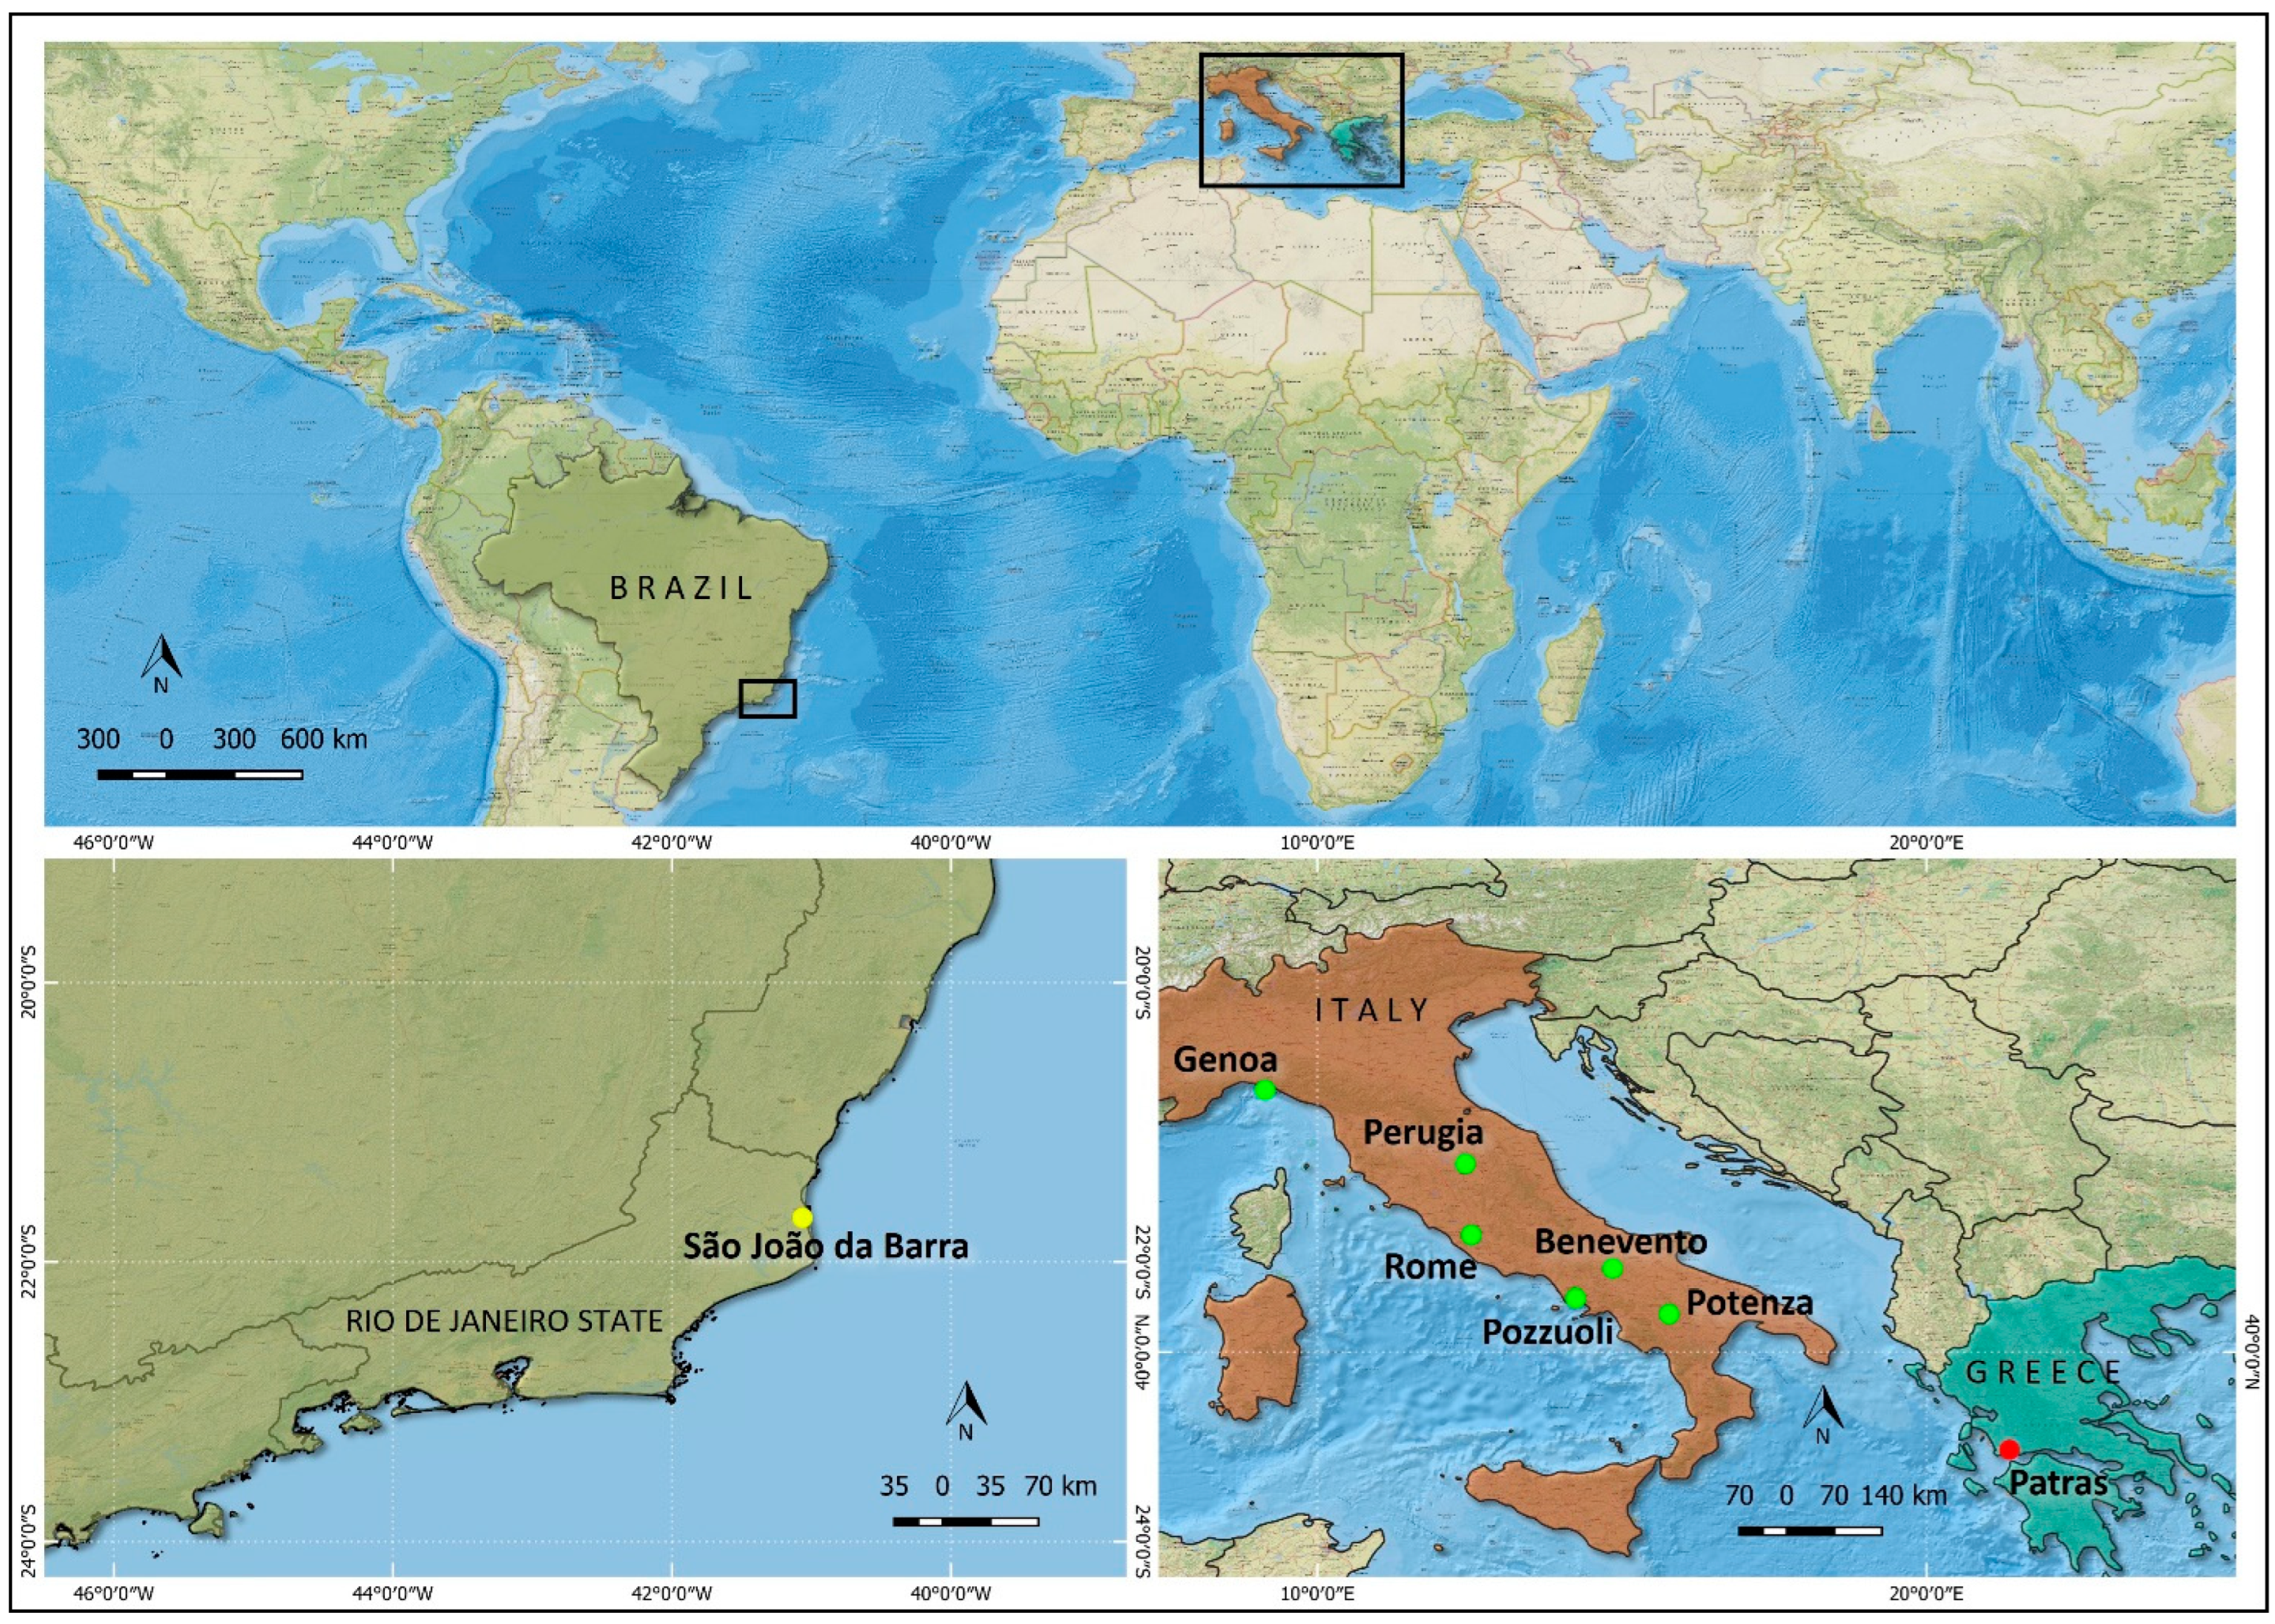
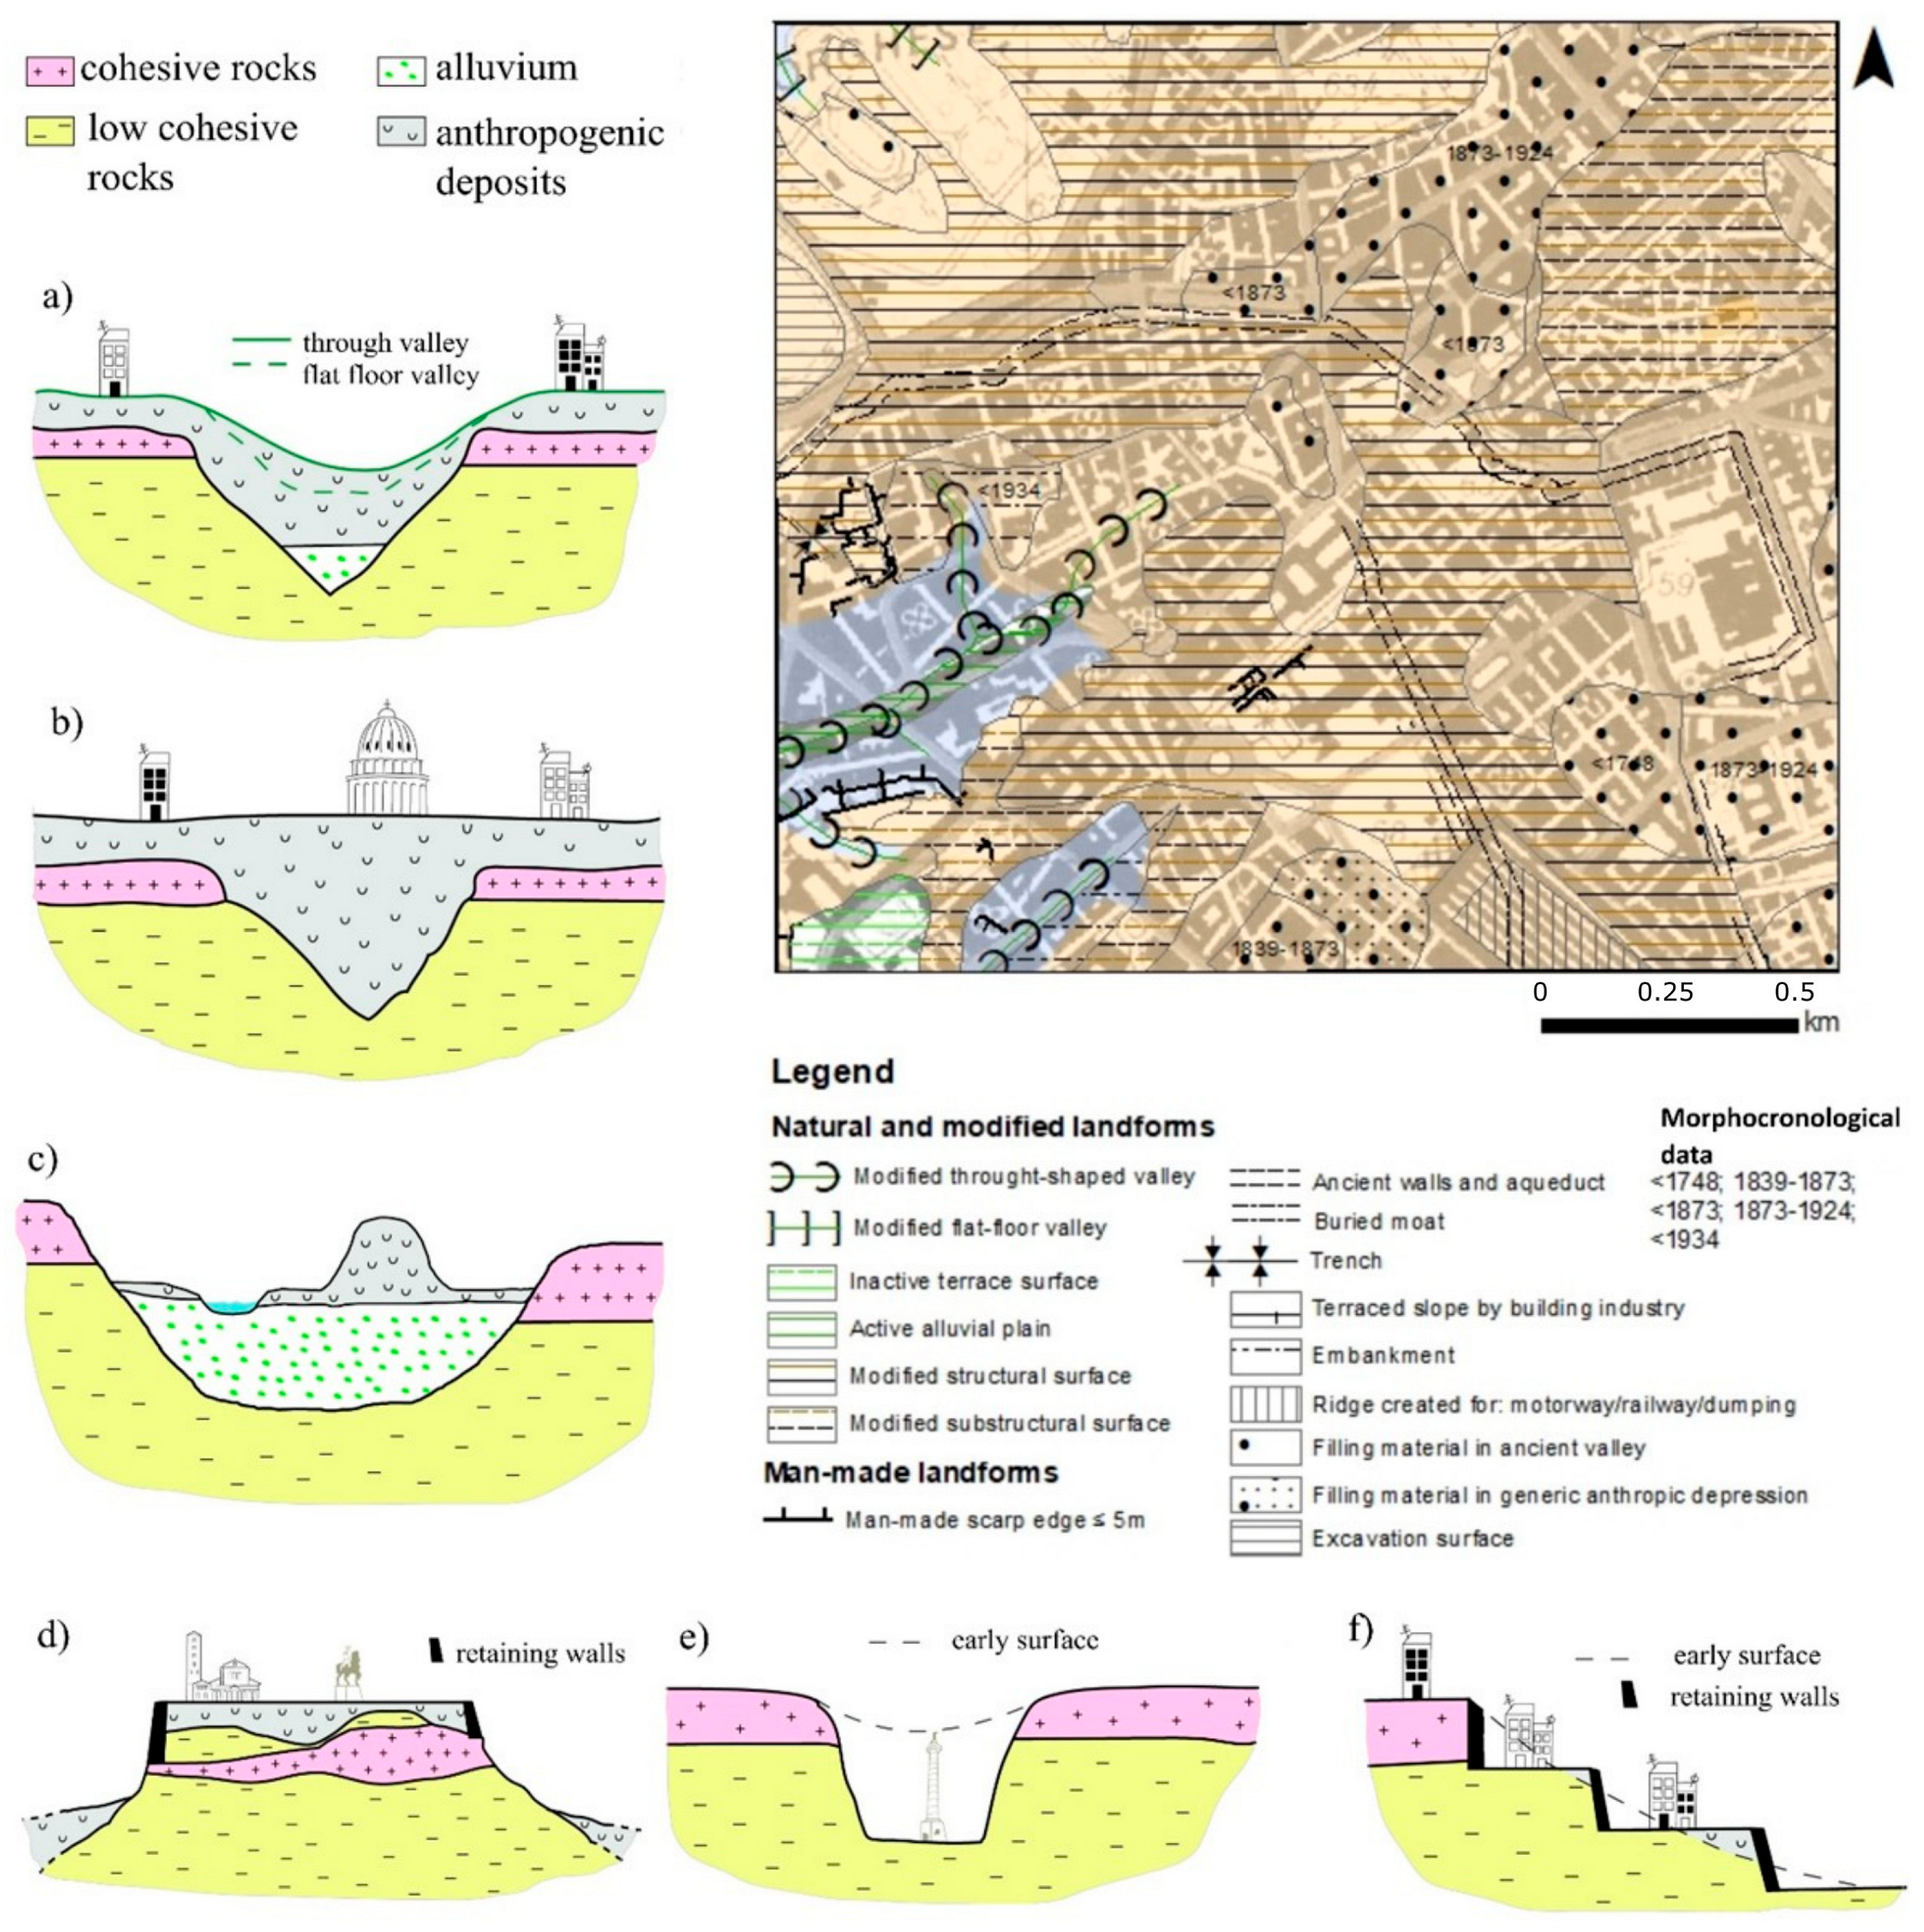
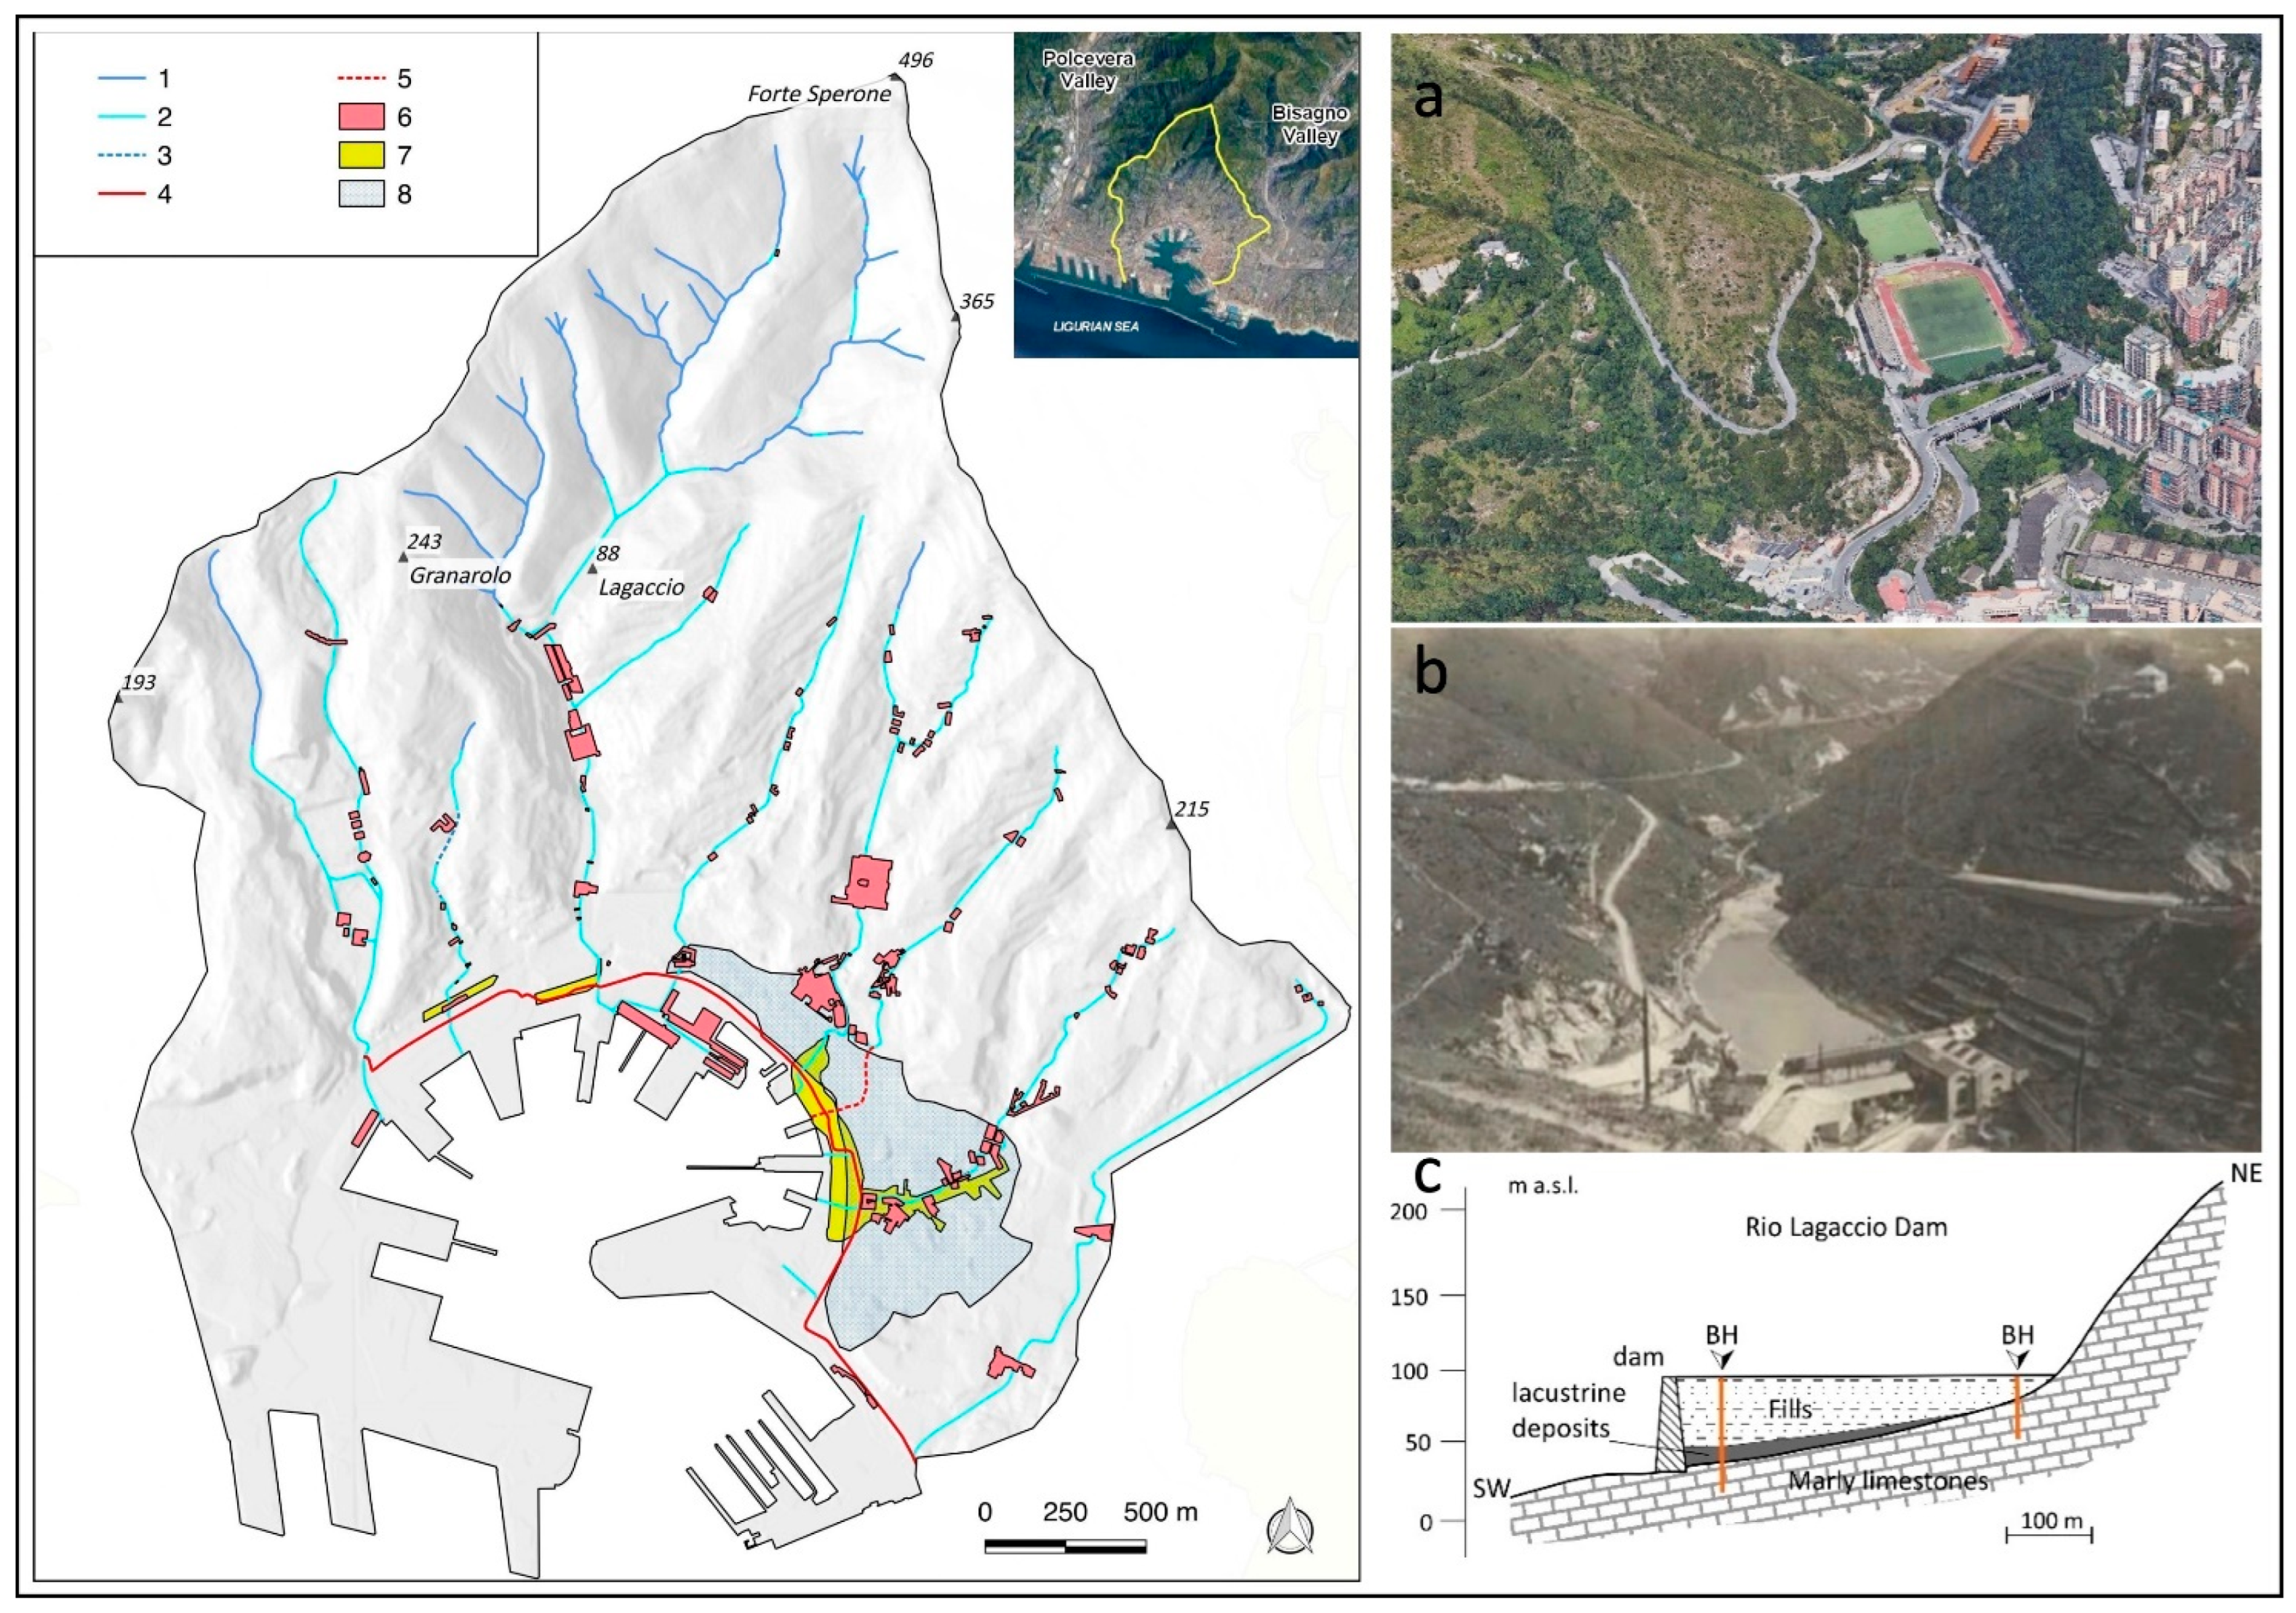
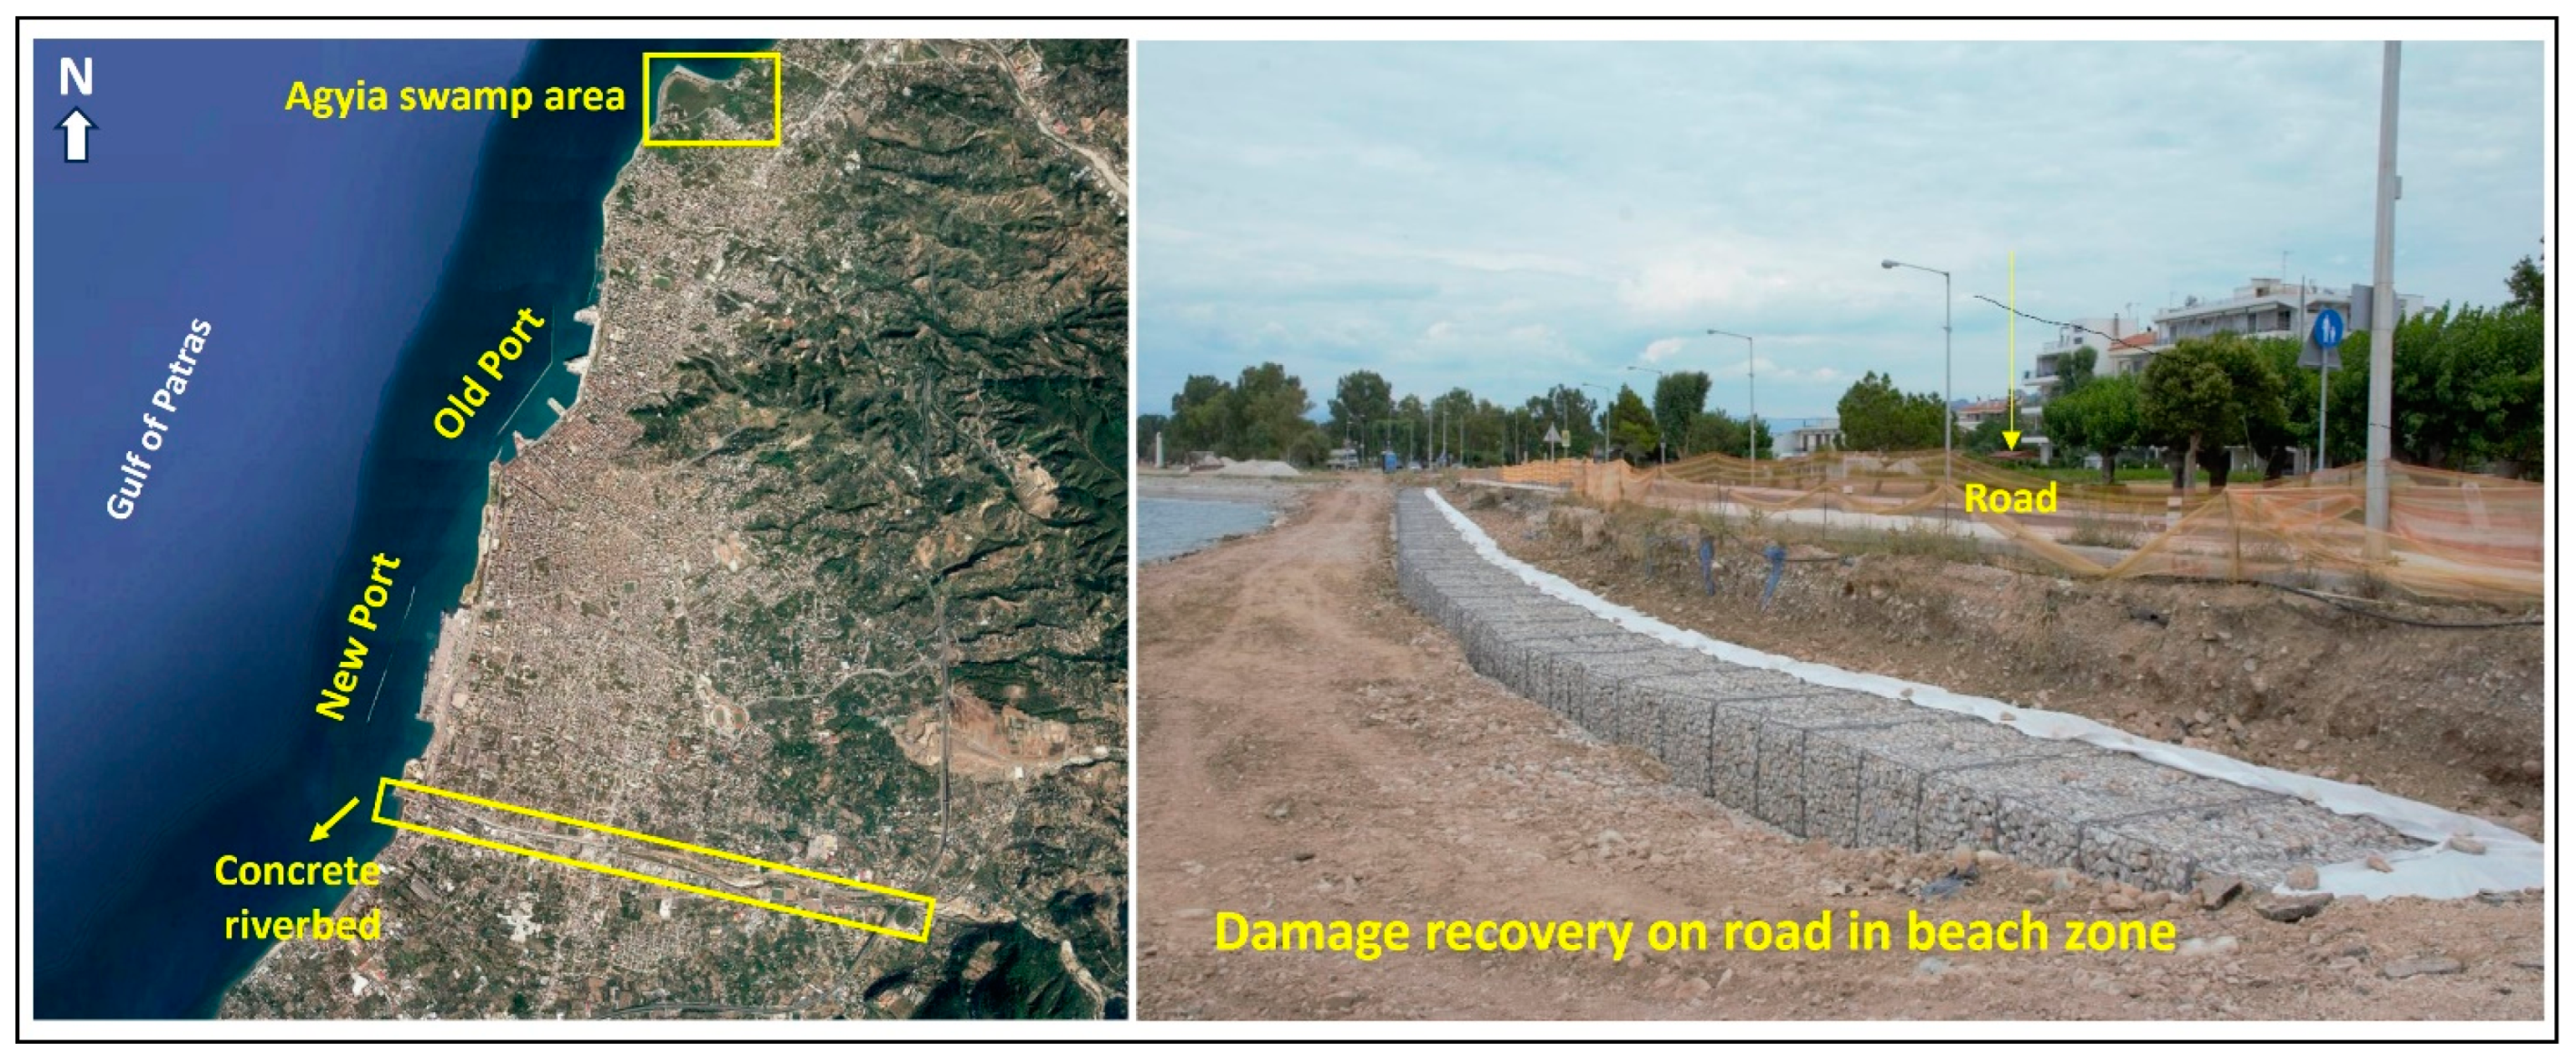
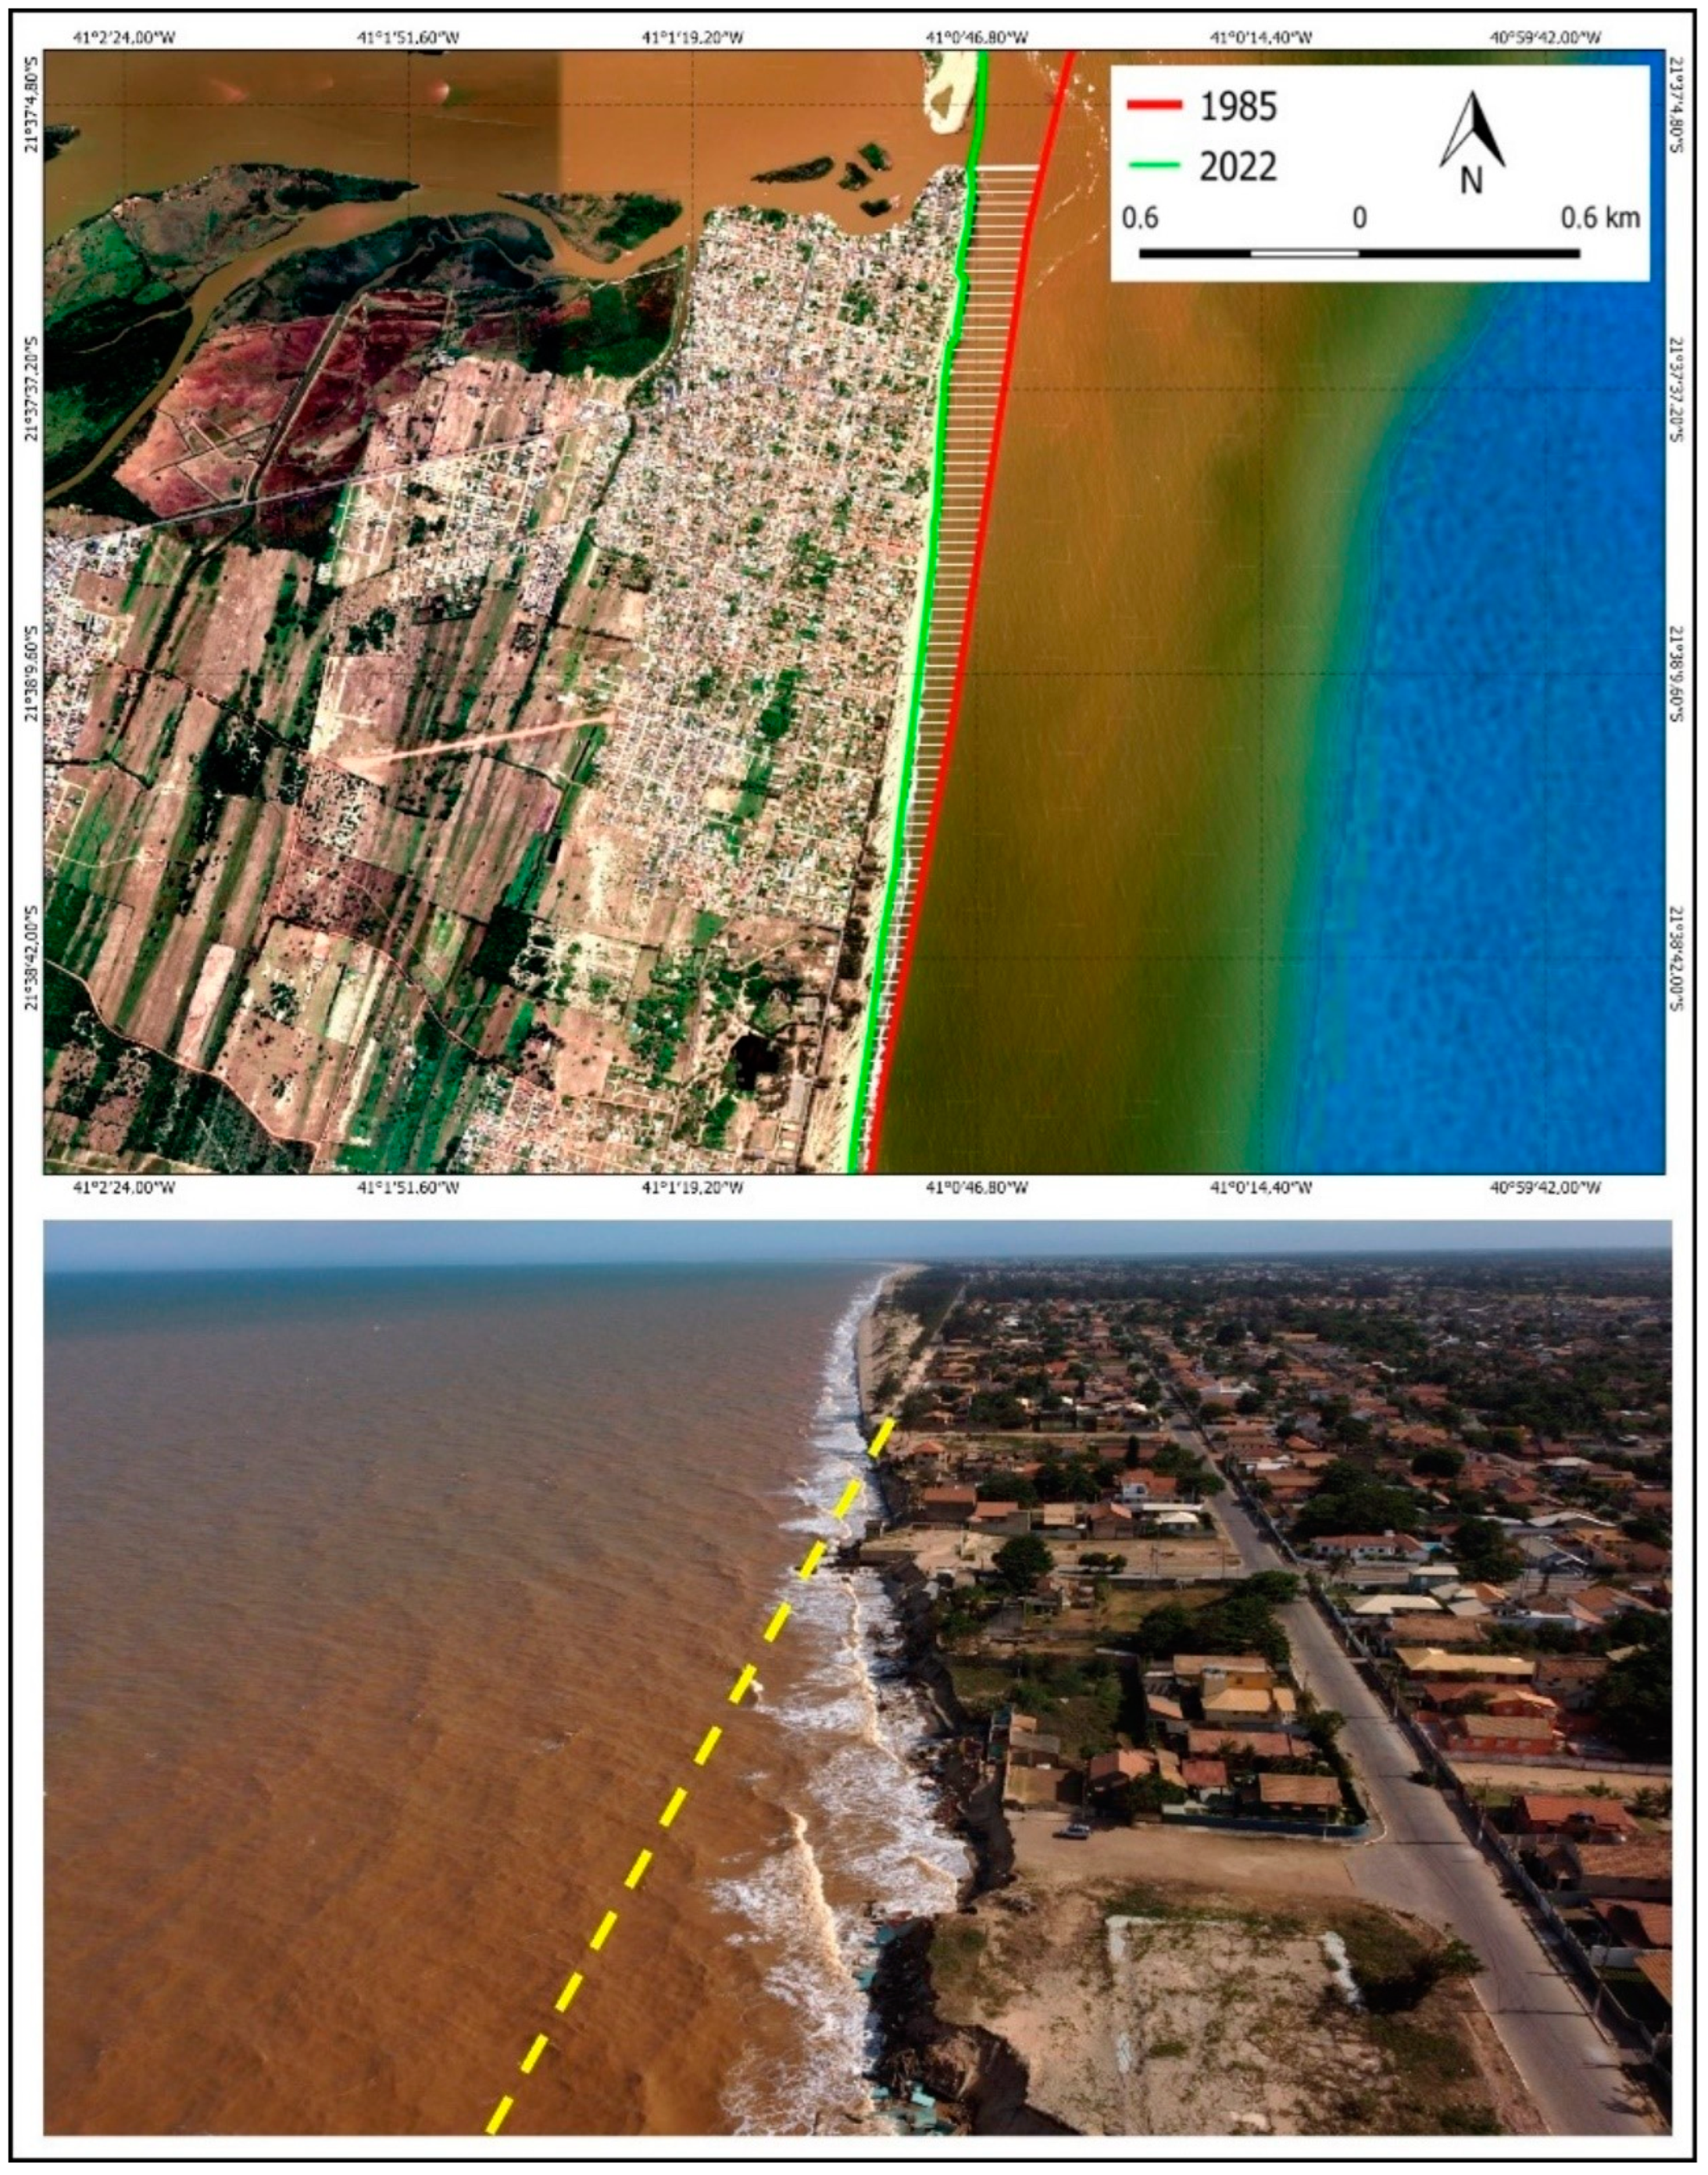

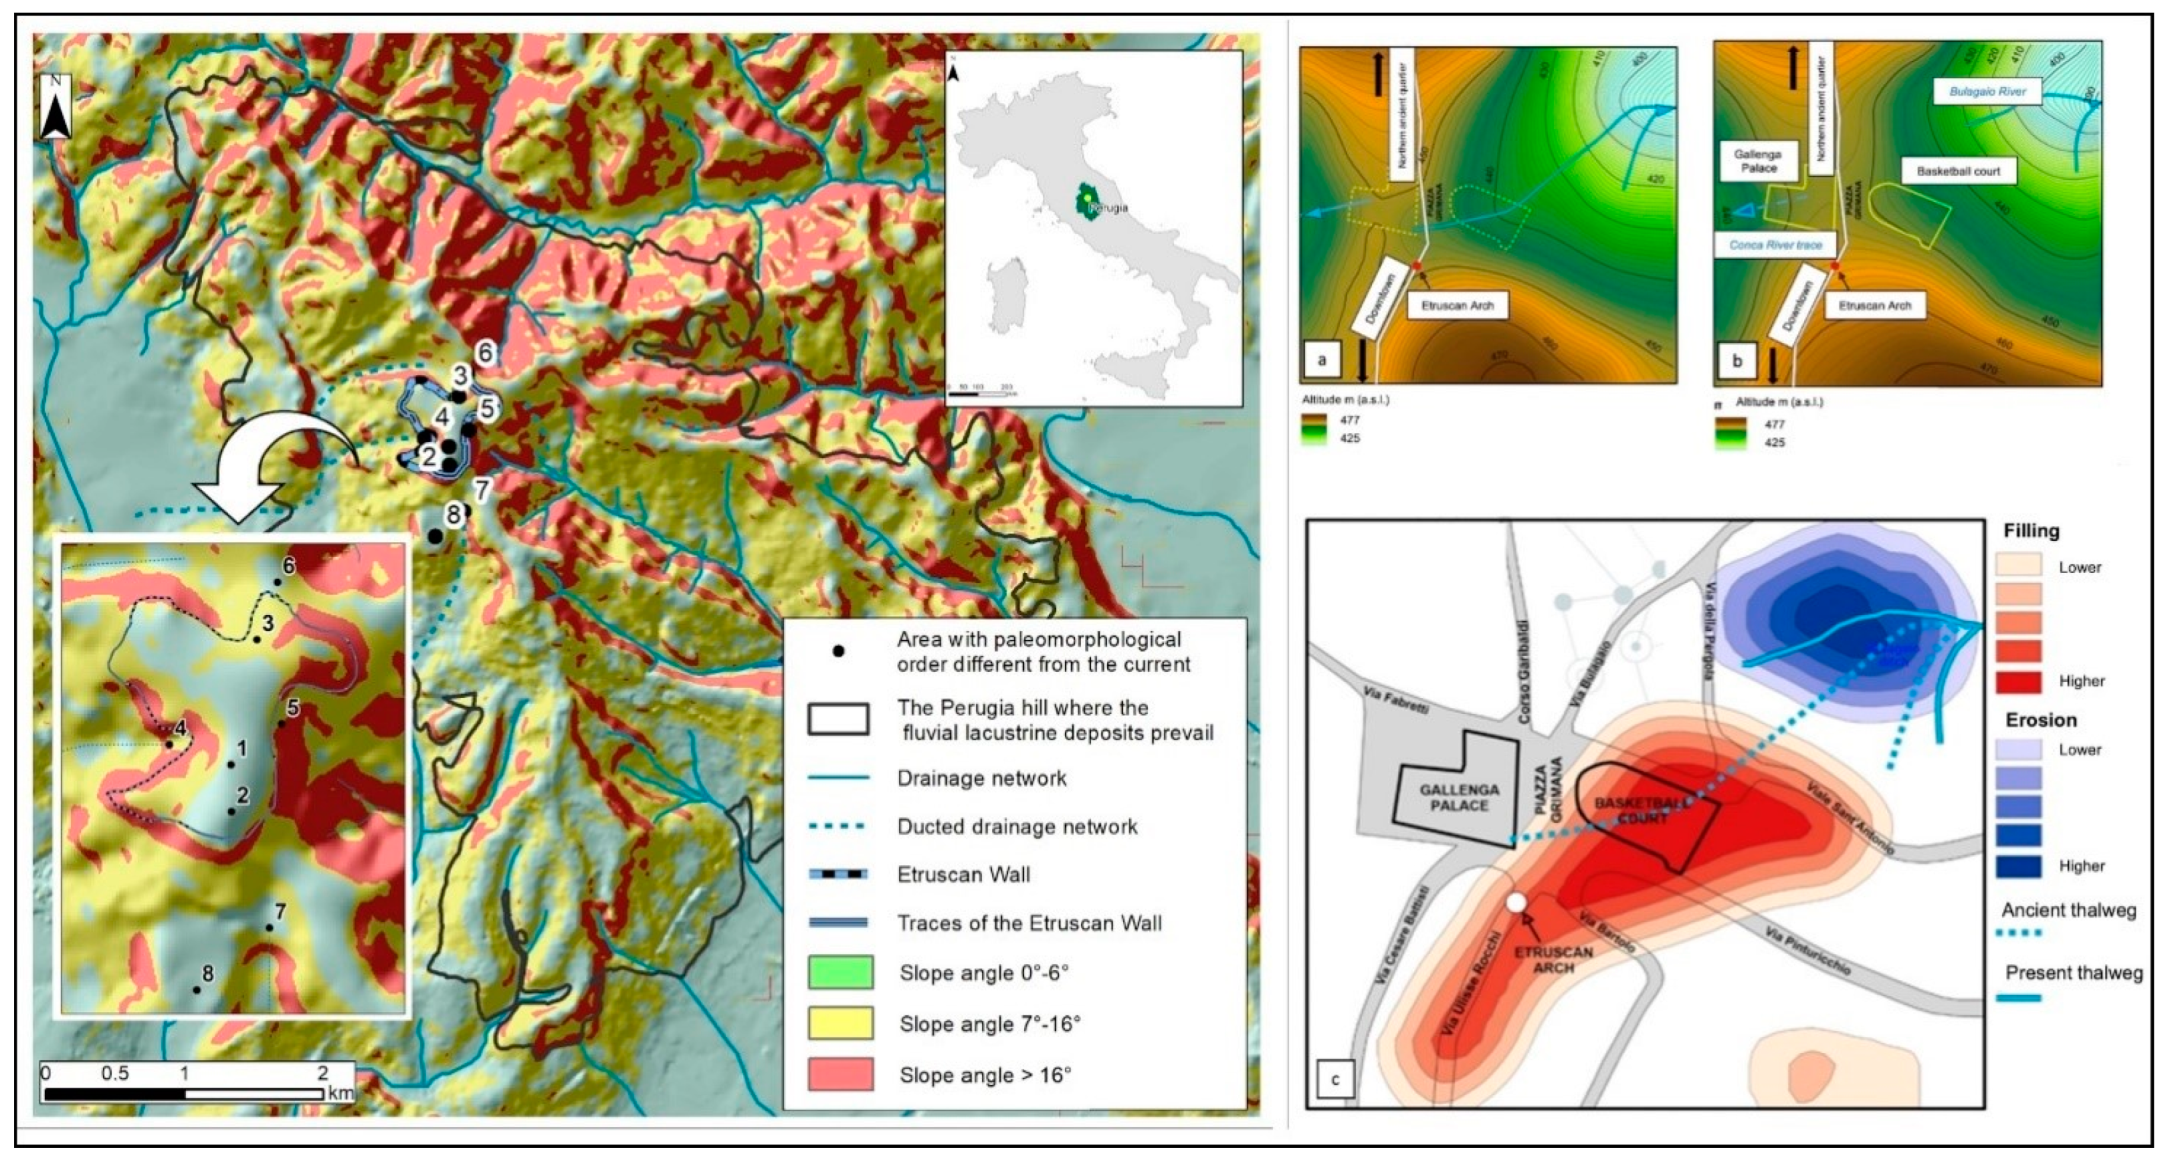
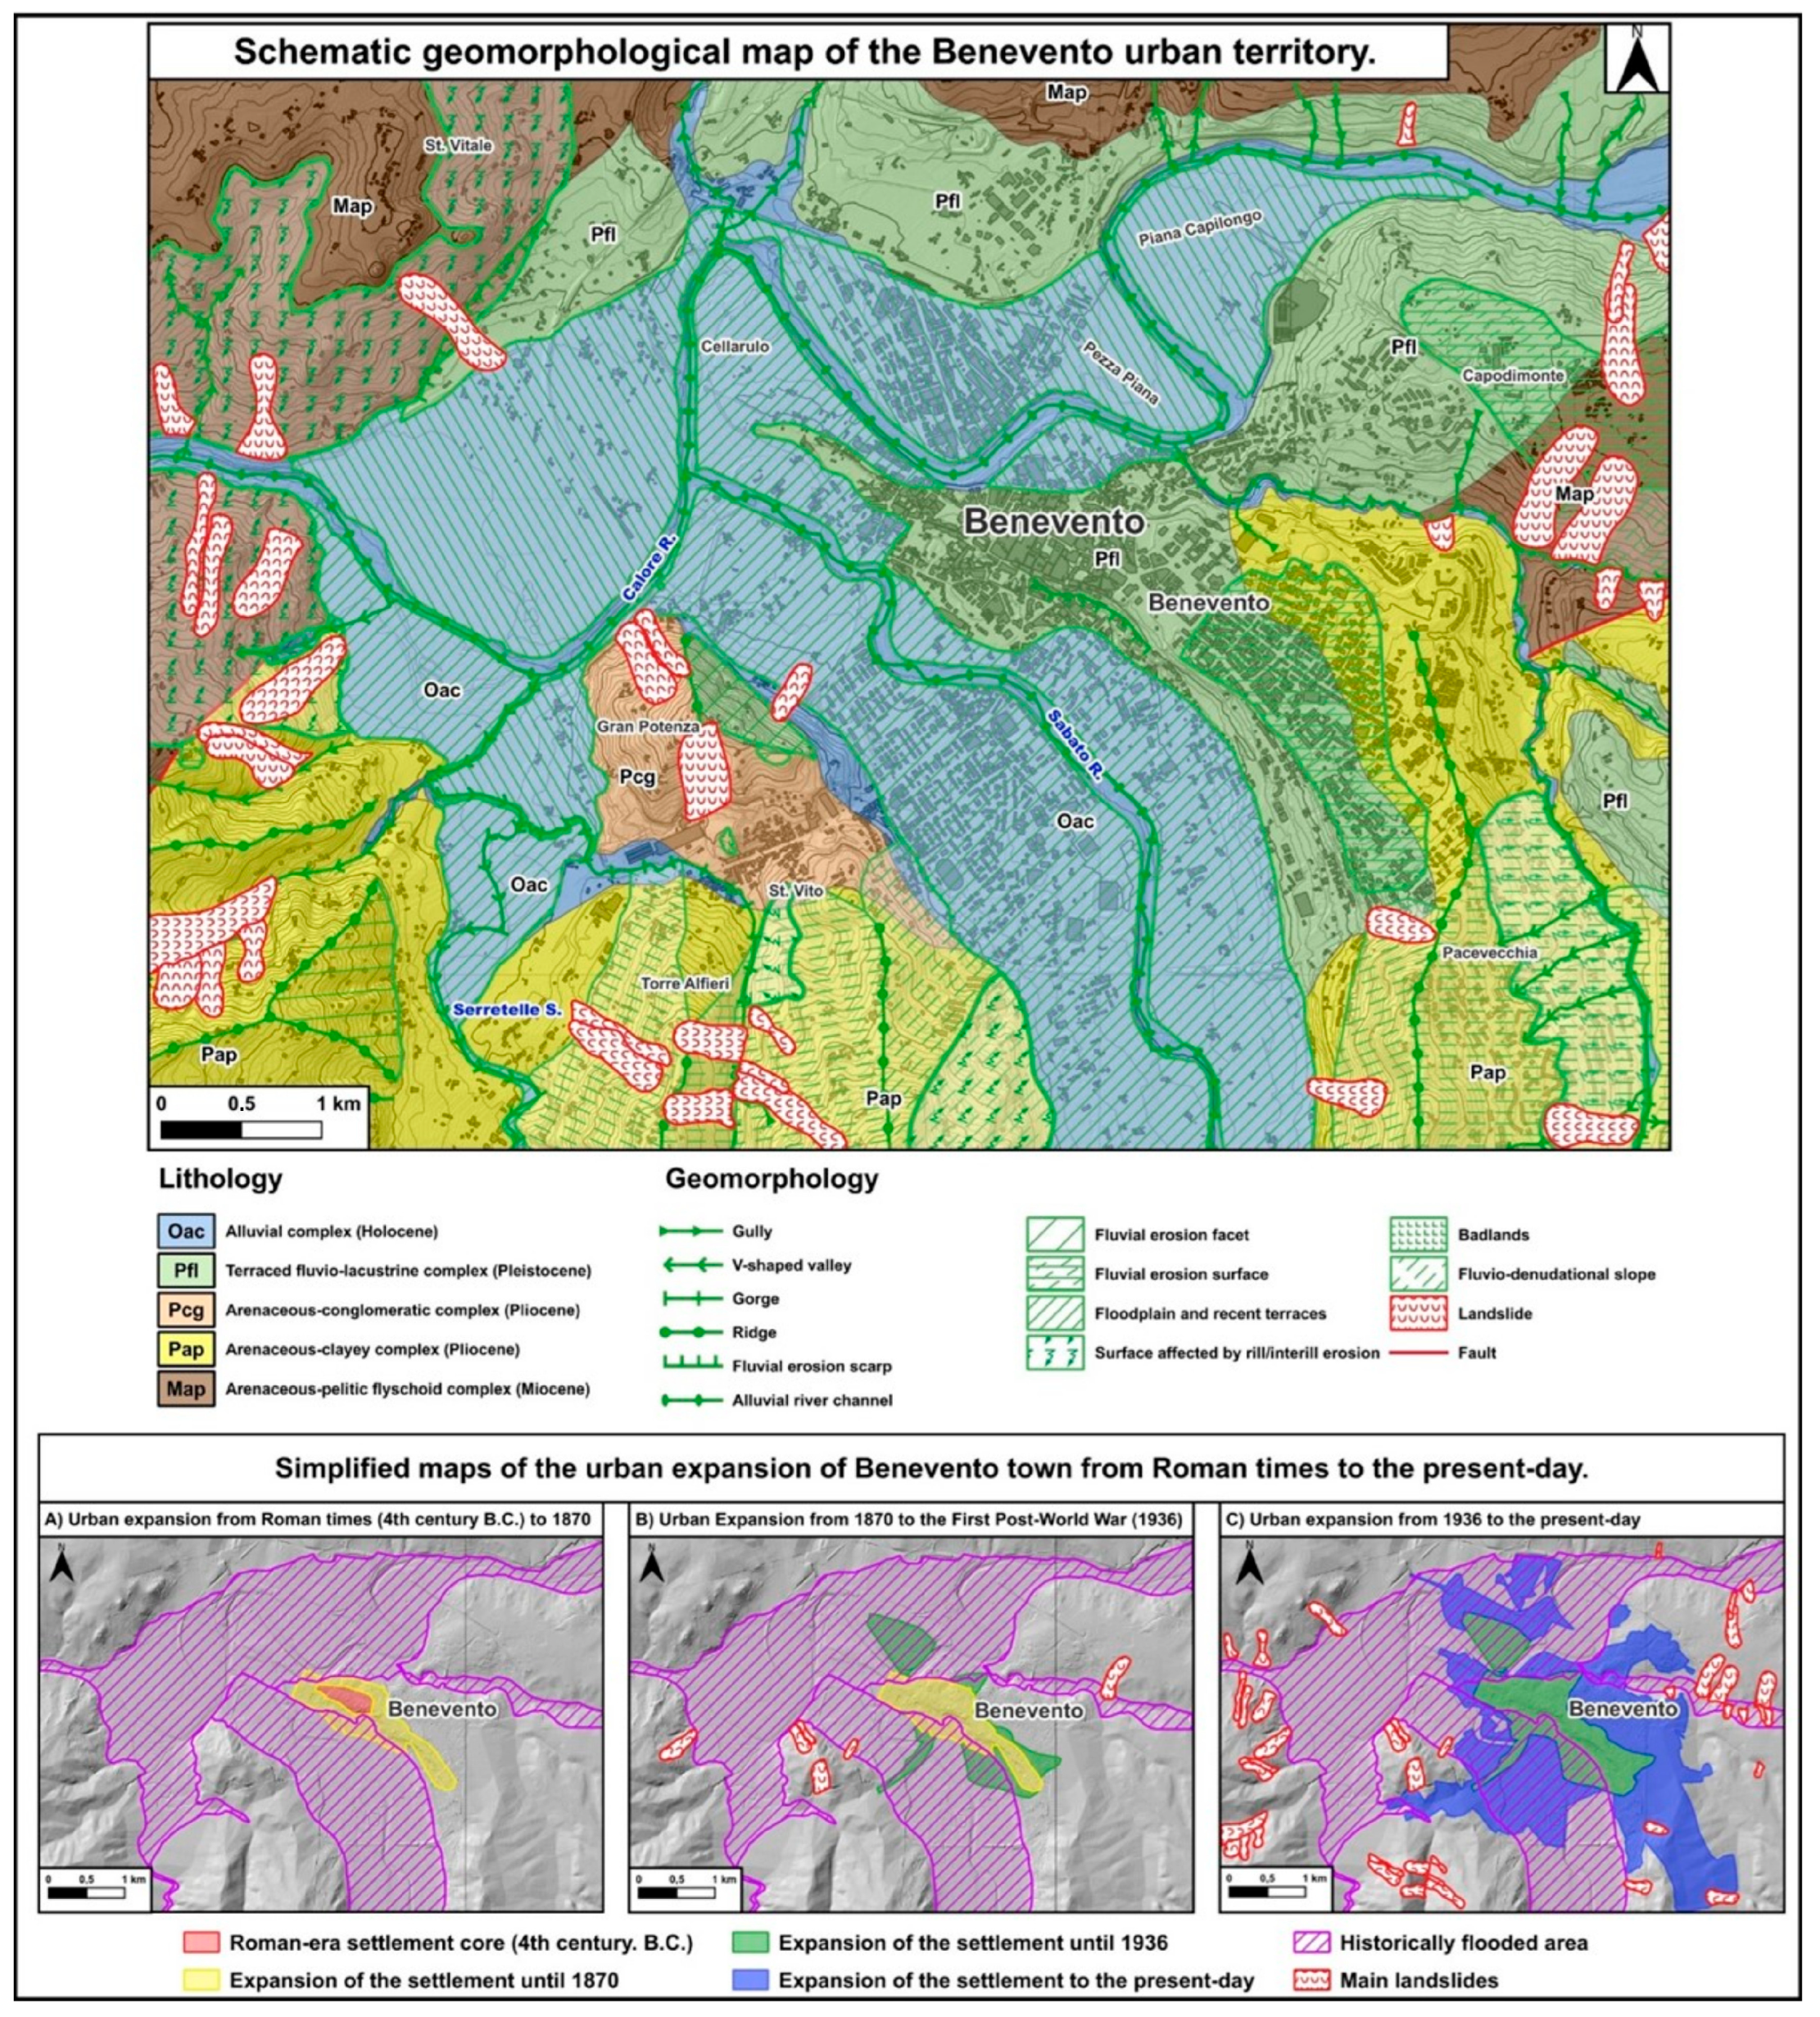
Disclaimer/Publisher’s Note: The statements, opinions and data contained in all publications are solely those of the individual author(s) and contributor(s) and not of MDPI and/or the editor(s). MDPI and/or the editor(s) disclaim responsibility for any injury to people or property resulting from any ideas, methods, instructions or products referred to in the content. |
© 2024 by the authors. Licensee MDPI, Basel, Switzerland. This article is an open access article distributed under the terms and conditions of the Creative Commons Attribution (CC BY) license (https://creativecommons.org/licenses/by/4.0/).