Article

Analysis of the Heterogeneous Coordination between Urban Development Levels and the Ecological Environment in the Chinese Grassland Region (2000–2020): A Case Study of the Inner Mongolia Autonomous Region

1
College of Earth and Environmental Sciences, Lanzhou University, Lanzhou 730000, China
2
Key Laboratory of Western China’s Environmental Systems, Ministry of Education of the People’s Republic of China, Lanzhou University, Lanzhou 730000, China
*
Author to whom correspondence should be addressed.
Land 2024, 13(7), 951; https://doi.org/10.3390/land13070951
Submission received: 24 May 2024 / Revised: 20 June 2024 / Accepted: 26 June 2024 / Published: 28 June 2024

Abstract

:
Scientifically identifying the impact of urban development levels on the ecological environment in China’s grassland regions from a classification perspective is crucial for stabilizing grassland ecosystems and optimizing urban development in grassland cities. Using the Inner Mongolia Autonomous Region as a case study, this research constructs a conceptual analysis framework for the coordinated state between the urban development level and the ecological environment in China’s grassland regions based on the theory of dual economic structures. Employing the Granger causality test, nonlinear fitting, and coupling coordination degree model methods, the heterogeneity and coordination between urban development levels and ecological environment in China’s grassland areas from 2000 to 2020 are comprehensively analyzed. The findings reveal the following: (1) Capital-type central cities and growing resource-based cities, with high levels of development, positively nurture the grassland ecology, exhibit high labor mobility, and experience low endogenous and exogenous pressures, resulting in high coordination. (2) Pure agro-pastoral cities, with low development levels, negatively impact the grassland ecology, have low labor mobility, and face high endogenous and exogenous pressures, resulting in low coordination. (3) Regional central cities, with moderate development levels, exert a neutral counterbalance effect on the grassland ecology, with opposing endogenous and exogenous pressures, leading to moderate coordination. (4) When the impact relationship ranges from “positive-neutral-negative,” the endogenous and exogenous pressures on the grassland ecology by declining resource-based cities and developing agro-pastoral cities are determined by their specific development levels, showing variations from “large → balance → small” to “small → balance → large,” with coordination fluctuating between “high-moderate-low”. (5) Special ecological cities are less affected by urban development levels, with coordination levels determined by the ecological foundation. Analyzing the heterogeneous coordination between urban development levels and the ecological environment for different types of cities in grassland regions is significant for improving the overall quality of the grassland ecological environment and exploring distinctive urban development models.

1. Introduction

Grasslands in China cover 41.7% of the national territory, playing a crucial role in soil and water conservation and atmospheric and climate regulation, and are vital for maintaining ecological security in China, East Asia, and globally [1]. However, since the 1970s, due to climate change and increasingly frequent human activities, most grassland areas in China have experienced varying degrees of degradation, highlighting ecological fragility [2]. Global warming and changes in precipitation are key climate factors affecting the grassland ecosystem [3,4,5,6]. Rising temperatures alter rainfall patterns, with potential evaporation in some grassland areas far exceeding precipitation [7,8], severely reducing the ecosystem services of grasslands, such as water conservation, carbon sequestration, and forage supply [9,10]. The main manifestations are as follows: soil moisture loss or exposure, weakening of carbon sequestration capacity [11,12], reduction of nitrogen nutrient effectiveness [13], weakening of carbon–nitrogen cycling capacity [14,15,16], and degradation of net ecosystem service functions; spatial migration of grassland types, with impacts on vegetation cover, productivity, above-/below-ground biomass, community diversity, and metabolic capacity [17,18,19,20,21,22,23]; and changes in grassland species habitats, species structure, and the food chain system result in reduced diversity and frequent occurrences of plagues and pests [24,25]. Besides the uncontrollable climatic factors, intense human activities are also major contributors to grassland ecological degradation. Research indicates that human activities impact grassland ecosystems even more than climate, exacerbating grassland fragility [26]. Consequently, the relationship between human activities and the ecological environment in grassland areas has garnered significant attention.
Urban development and pastoral activities are the focal points of concern. Firstly, human activities during urban development have a series of impacts on the grassland ecological environment, including the following. (1) Urban daily operations: Urban daily operations emit large amounts of wastewater, toxic gases, and solid waste, causing severe pollution to the air and water bodies [27]. Frequent and extensive daily activities of residents increase carbon emissions and energy consumption, exceeding the self-purification capacity of the grassland system and disrupting ecological balance [28]. (2) Urban land expansion: Urban construction and industrial land expansion reduce grassland ecological land, resulting in aggravated environmental pollution and significant urban heat island effects [29,30]. Based on this, scholars have attempted dynamic studies on grassland land use [31] and explored sustainable land use strategies suitable for different regions [32]. (3) Urban industrial development: With increasing urbanization, secondary and tertiary industries occupy important economic positions. The development of secondary industries has a strong destructive impact on grassland ecology, with unreasonable resource extraction reducing the net primary productivity of vegetation [33], and exacerbating issues such as soil exposure and desertification [34,35]. The development of tertiary industries like tourism also poses serious threats to grassland ecology [36]. Tourism activities disrupt the living environment of plant and animal communities, accelerating grassland vegetation degradation [37]. Based on these impacts, scholars have begun exploring the coupling coordination relationship and development paths between urban development and the ecological environment, discovering that cities in Tibet, Qinghai, and Xinjiang have low coupling coordination levels with grassland ecological environments, but future development trends are positive [38,39,40]. Secondly, pastoral activities directly impact the grassland ecological environment, including the following. (1) Grazing intensity: Overgrazing is the primary human activity causing grassland degradation [41,42]. Most natural grasslands in China have grazing loads exceeding their maximum carrying capacity, with long grazing durations and high pressure. For example, Tibet in China has an overgrazing rate of 89% [43], while Inner Mongolia reaches 102% [44]. Moderate grazing can increase grassland biodiversity without affecting grassland productivity [45,46]. (2) Grazing methods: Grassland enclosure and grazing prohibition are important measures for grassland restoration [47], positively impacting soil, vegetation coverage, and biodiversity in degraded grasslands [48,49]. However, with the increase in enclosure and grazing prohibition years, grassland diversity and richness indices first increase and then decrease, which is not conducive to the stability of the grassland ecosystem [50]. Grass–livestock balance can maintain a reasonable grazing load on grasslands, and seasonal rotational grazing and resting grazing benefit the sustainable regeneration capacity of grasslands [51]. (3) Livestock structure: The types and combinations of livestock also impact the ecological environment of different grassland types. For instance, under moderate grazing intensity, Tibetan sheep are more beneficial than yaks for optimizing the ecological service functions of alpine grasslands [52]; in grassland systems with high plant diversity, a mixed grazing system with multiple livestock species is often more effective [53,54]. In summary, scholars have explored the complex impacts of human activities during urban development and pastoral behaviors on the grassland ecological environment from multiple angles and aspects, which is significant for promoting sustainable grassland development [55]. However, existing research tends to discuss these two types of activities separately, overlooking their interrelationships.
Currently, to curb large-scale grassland degradation, the central and provincial/municipal governments in China have successively introduced policies such as “ecological migration,” aiming to relocate populations to cities and reduce the intensity of pastoral activities in grassland areas [56]. This has directly promoted the rapid improvement of urban development levels in grassland areas, leading to a significant increase in urban population and obvious expansion of urban space [57]. However, population transfers and urban development driven by compulsory policies often lack endogenous economic momentum, leading to frequent population reflux to grasslands. Some scholars point out that due to the symbiotic relationship between herders and grasslands, a new “mobility” urban development model has emerged in Chinese grassland areas, where herders periodically move between cities and grasslands to maximize production benefits [58]. This has prompted scholars to consider and debate the urban development in grassland areas, focusing on scientific issues such as “whether the improvement of urban development levels in grassland areas truly reduces the intensity of pastoral activities and benefits the long-term stability of grassland ecosystems; and what urban development model should be chosen based on the characteristics of grasslands” [59,60]. Therefore, this study aims to explore whether urban development levels have truly improved under policy backgrounds, whether they have reduced the intensity of pastoral activities and improved the ecological environment, and what kind of coordination state exists between the two.
As analyzed above, existing scholars have conducted specific calculations on the impact relationship and coordination between urban development and the ecological environment in grassland areas in China. These studies explore the direct impact of urban construction and operations on the grassland ecosystem from the perspective of urban development itself, explaining the coupling coordination types, evolution processes, and future trends of grassland urban development and the ecological environment. However, they overlook the connection between urban development and grassland livestock activities, and their impact on the grassland ecological environment. They also do not truly address or verify whether the improvement of urban development levels positively affects the grassland ecological environment. Secondly, existing studies on the coordination analysis of grassland areas are generally conducted from the provincial and municipal scales, generalizing the coordination phenomenon without considering the heterogeneity caused by differences in provinces and city types. Additionally, the selection of indicators does not take into account the ecological specificity of grassland areas. Finally, in terms of research methods, most studies use the coupling coordination degree model to identify the degree and types of coordination, with many scholars innovating and improving the traditional coupling coordination model [33]. The coupling coordination degree calculated by this model reflects the comprehensive development coordination level between cities and the ecological environment, which is highly consistent with the urban development level [61,62]. This might overlook the trends and interactions between urban development and ecological environment changes, leading to a biased and inaccurate identification of coordination.
Based on the above analysis, this paper identifies the evolution trends, impact relationships, and coordination states of urban development and the ecological environment in the grassland areas of China from 2000 to 2020. In terms of research scale, this paper follows the existing research scheme, analyzing from the prefecture-level city scale. On this basis, considering the differences in urban types and ecological bases in China’s grassland areas, this paper identifies heterogeneous coordination from a classification perspective. In terms of research methods, it first uses the Granger causality model to test the relationship between the two and then employs nonlinear fitting and coupling coordination models to comprehensively analyze the coordination of different types of cities to make up for the shortcomings of traditional coupling coordination models. In terms of indicator selection, it fully considers the ecological specificity of grassland areas, incorporating indicators such as grassland resource carrying capacity. Finally, to clarify the impact relationship of urban development levels on the ecological environment in China’s grassland areas and identify their coordination, this study comprises the following parts: Section 2 constructs a conceptual framework for the coordination between urban development levels and the ecological environment in China’s grassland regions; Section 3 introduces the case study areas, data collection, and methods; Section 4 analyzes the coordination measurement results for different types of cities; Section 5 is the discussion on the findings; and, finally, a concise conclusion is summarized.

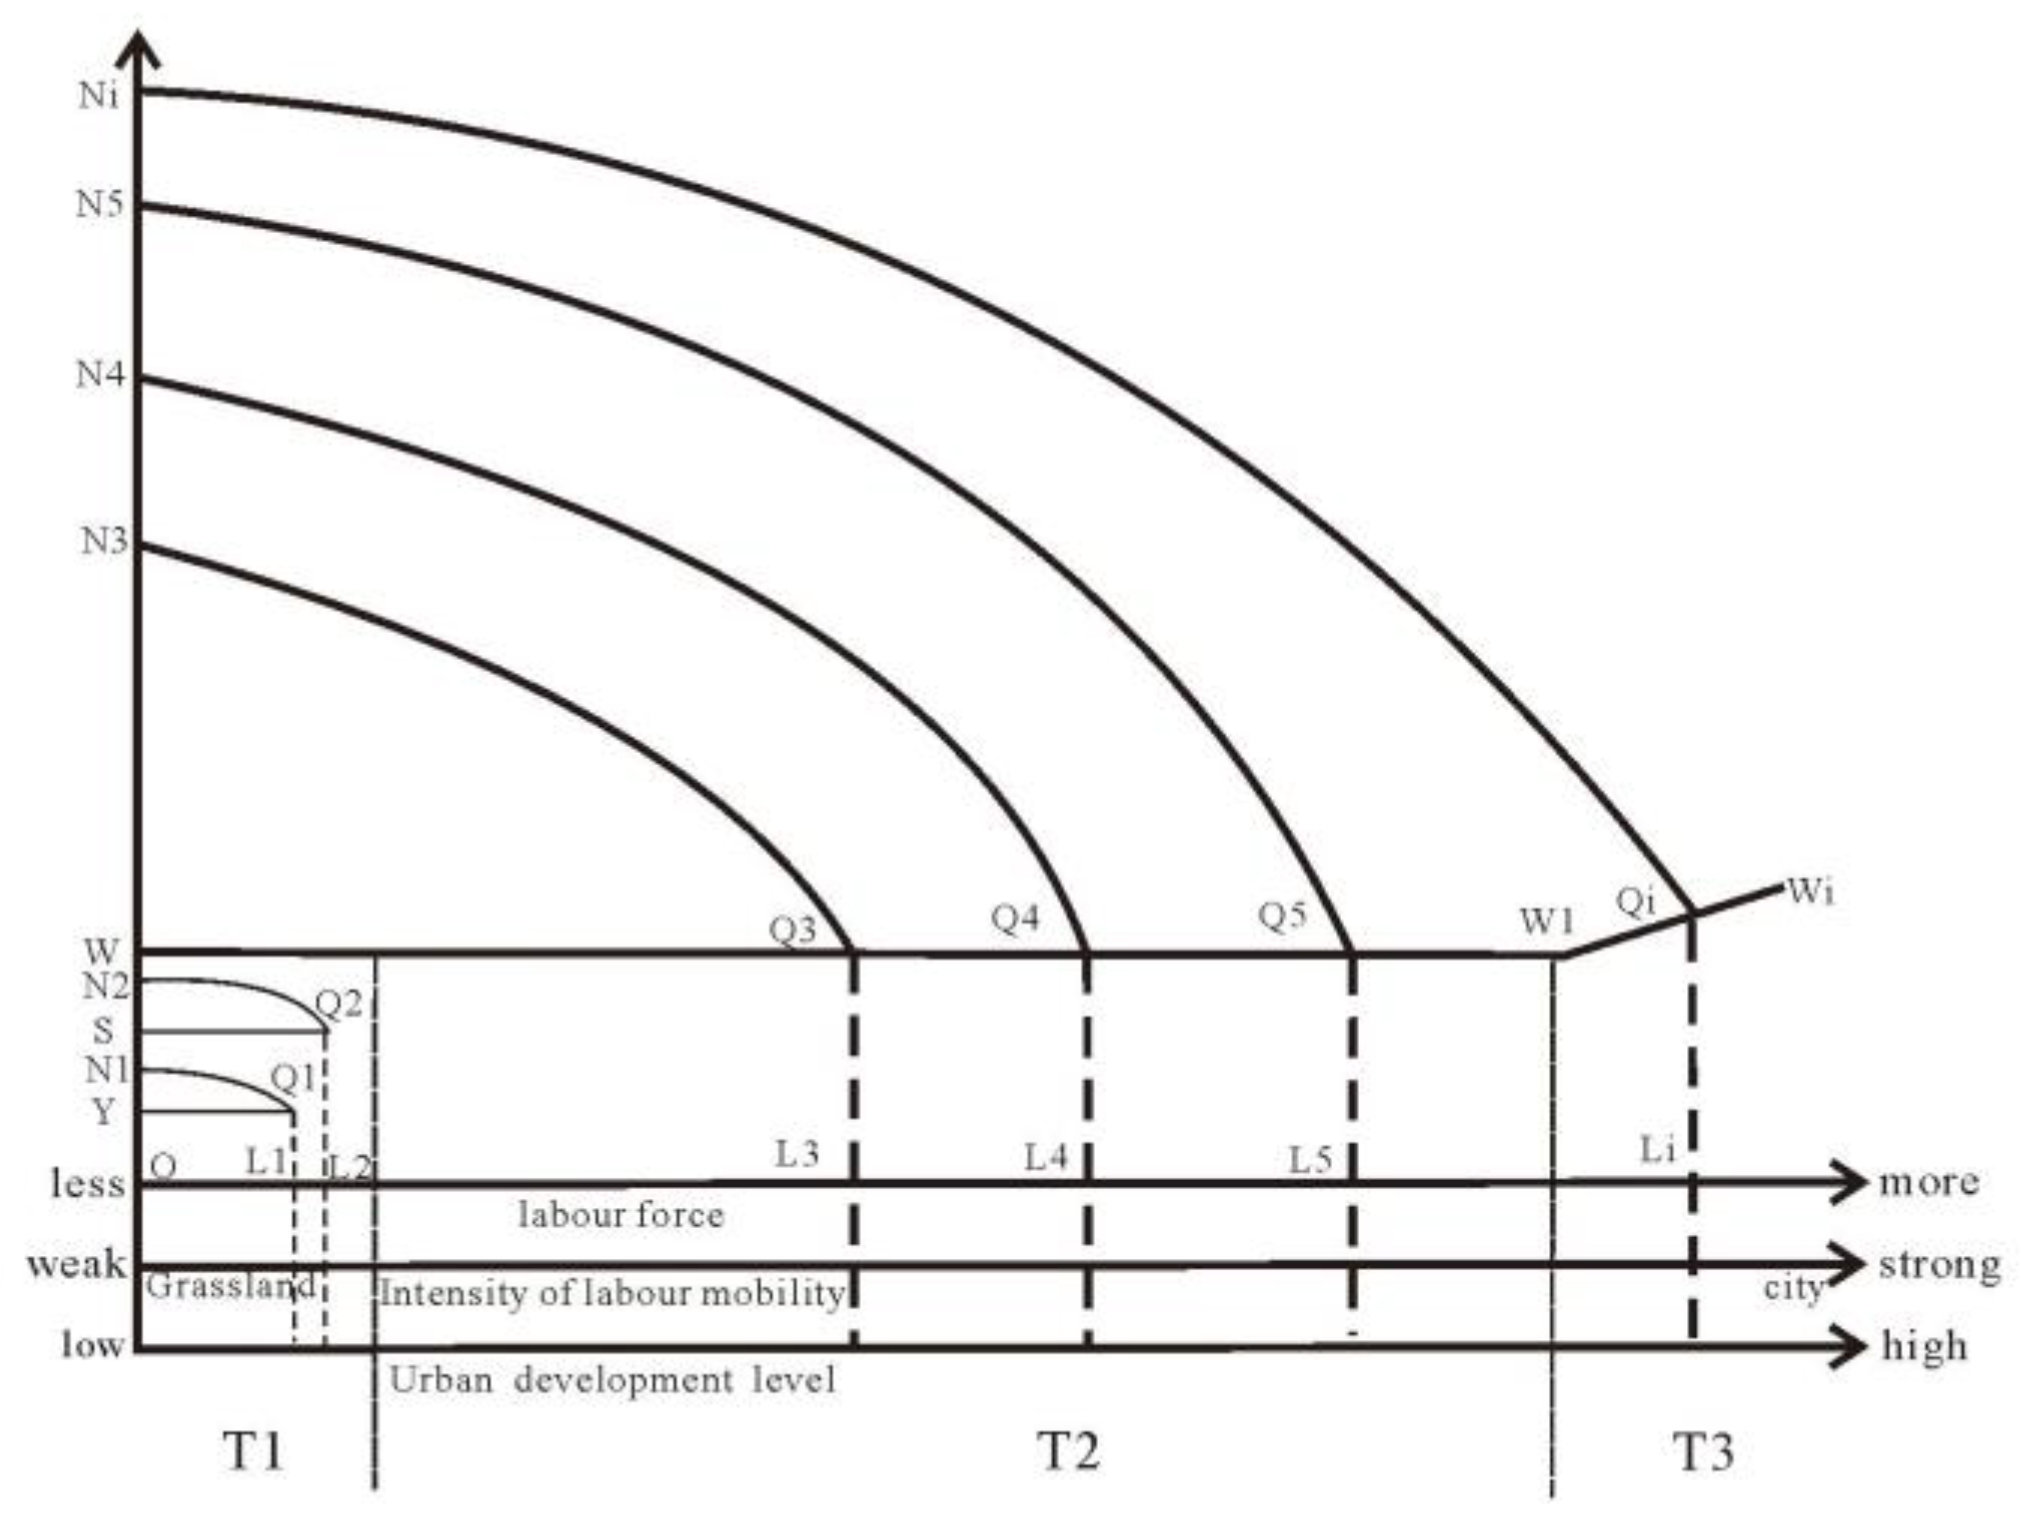
2. Conceptual Framework of Coordination between Urban Development and Ecological Environment in China’s Grassland Areas

On a global scale, grassland systems represent a unique human–land relationship system influenced by both natural environments and human activities [63]. While natural factors such as global warming significantly impact grassland ecosystems, the influence of human activities associated with urban development cannot be overlooked.
Drawing on Lewis’s dual economic structure theory [64], the urban development process in grassland areas primarily involves two sectors: the traditional agro-pastoral sector, which relies on traditional production methods and self-sufficiency, and the modern non-agro-pastoral sector, which employs modern production methods and connects with the outside world [65]. This theory implies a geographical duality [66], with the modern non-agro-pastoral sector represented by urban areas and the traditional agro-pastoral sector by grassland agro-pastoral areas. According to this theory, under certain technological conditions, the enhancement of urban development primarily depends on the economic expansion of the modern non-agro-pastoral sector, with the traditional agro-pastoral sector providing abundant labor. This means that labor and economic activities spontaneously transfer from grassland agro-pastoral areas to modern cities [64]. Assuming that laborers act purely as “economic men,” the core factor driving the spontaneous transfer of labor is the wage income gap between the two sectors [67]. Due to the low production inputs in the traditional sector, there exists “invisible unemployment” in the labor force, meaning that the transfer of a portion of the labor force does not significantly affect the total output of agro-pastoralism. Consequently, some laborers constitute “zero-value” labor within this sector, with low marginal returns on labor and low-income levels for farmers and herdsmen. Under conditions allowing free movement of labor: (1) If the wage level in the modern sector is lower than that in the traditional sector, the marginal productivity (N1Q1) is low, and labor transfer is almost non-existent. There might even be a “return flow” of labor. If the wage level is on par with the traditional sector, due to differences in living costs between the two regions, labor mobility is unlikely to occur. This is the T1 stage. (2) If the wage level in the modern sector is higher than that in the traditional sector, labor transfer progresses in two incremental stages: The modern sector attracts an unlimited supply of labor from the agro-pastoral areas through fixed wages higher than those in the traditional sector. Consequently, the marginal productivity of the modern sector (N3Q3) increases, providing an inherent mechanism for continuous capital accumulation and scale expansion. This leads to a steady increase in labor in the modern urban sector, thereby enhancing the economic level of urban development. This is the T2 stage. Urban development reached a high level, and most of the labor force from the traditional agro-pastoral areas has migrated to the cities. At this point, labor in the traditional sector becomes scarce. Alongside capital accumulation (NiQi), the modern sector needs to increase labor wages and agro-pastoral subsidies, strengthening the “push-pull” dynamics of labor transfer. This is the T3 stage (Figure 1).
In terms of an explanation: OS—wage in the traditional agro-pastoral sectors; OY—wage in the modern sector lower than the traditional sector; OW—wage in the modern sector higher than the traditional sector; WW1Wi—labor supply curve; NiQi—marginal productivity curve; OL1—labor mobility intensity and total determined by N1Q1; OL1QIN1—total economic output of the modern sector, with YN1Q1 representing surplus capital in the modern sector, and YQ1L1O representing wages for laborers. As the modern sector increases its surplus capital through investment and accumulation, N1Q1 rises, leading to an increase in total labor mobility intensity and volume.
Based on the above mechanism of change in the level of urban development under the theory of dual economic structure, the impact of the transfer of population economic activities in urban development on grassland ecosystems is examined from the perspective of labor mobility. The direct impacts are as follows: (1) During stages T1 to T3, as the level of urban development increases, the capacity and attractiveness of the modern non-agro-pastoral sector to absorb the labor population also increase. Consequently, the total pollution emissions and daily energy consumption from urban construction and operation rise, directly affecting the grassland ecosystem. Besides the direct impacts, changes in urban development levels cause labor mobility, leading to a reduction in the total labor force in the grassland agro-pastoral areas. This results in changes in the intensity and frequency of pastoral activities, indirectly impacting the grassland ecosystem [68]. The main indirect impacts include the following. (1) Positive feedback impact: In the T3 stage, the modern non-agro-pastoral sector dominates the economy, absorbing most of the labor force from the traditional agro-pastoral sectors. On this basis, the modern sector reinvests in agro-pastoralism, such as increasing subsidies, which feeds back into the traditional sector. This reduces production pressure on agro-pastoralism, significantly decreasing consumptive activities on the grasslands, thus improving the grassland ecosystem. (2) Negative absorption impact: In the T1 stage, the traditional agro-pastoral sector dominates the economy, and the modern non-agro-pastoral sector lacks the capacity to absorb labor. Farmers and herders can only derive economic income from the traditional sector, increasing production pressure on agro-pastoralism, which damages the grassland ecosystem. (3) Neutral counterbalance impact: In the T2 stage, the marginal productivity of the modern sector increases, with wage levels higher than those in the traditional sector. However, due to the high living costs in modern urban sectors, the net income of labor in both sectors remains relatively balanced. The total labor transfer is moderate, resulting in a counterbalanced development state. (4) Inter-stage impact variability. Between stages T1 and T3, as the total labor force and mobility intensity change, the impact ranges from “positive-neutral-negative,” depending on the economic level and productivity of the modern sector.
Existing research indicates that agro-pastoral production activities have the largest human impact on grasslands. Therefore, this study focuses on the indirect impacts, exploring the coordination between urban development levels and the ecological environment.
Since 2002, China has implemented policies like “New Three Grazing” (prohibiting grazing, resting grazing, and rotational grazing) to protect grassland ecosystems. However, as analyzed above, the level of urban development still significantly impacts grassland ecological environments, leading to heterogeneous coordination across different types of cities. This can be analyzed from the exogenous and endogenous pressures that various types of urban development exert on the grassland system. Exogenous pressure refers to the top-down pressure exerted on the grassland ecosystem by the total labor force, labor mobility intensity, and urban development level. The magnitude of this pressure is generally determined by the economic significance of the modern non-agro-pastoral sector. Endogenous pressure refers to the bottom-up pressure generated by complex factors such as the wage levels and living costs of farmers and herders, which typically correlates positively with exogenous pressure. Based on the labor mobility mechanism under the dual economic structure, assuming that the endogenous pressure in all cities is at the same level, the following can be observed. (1) T3 stage: During the positive feedback impact phase, the urban areas absorb a large amount of labor, and wage levels are high. Both exogenous and endogenous pressures are low, resulting in high coordination. (2) T1 stage: During the negative absorption impact phase, labor mobility intensity is weak, and activities are concentrated in the grassland agro-pastoral areas. The wage income of farmers and herders is low, leading to high exogenous and endogenous pressures, resulting in poor coordination. (3) T2 stage: During the neutral counterbalance impact phase, the total labor force and income levels in both sectors are equivalent. Exogenous and endogenous pressures are in a state of counterbalance, resulting in moderate coordination. (4) Inter-stage (T1 to T3): When the impact fluctuates within the “positive-neutral-negative” range, exogenous and endogenous pressures exhibit two paths of change—“large → counterbalance → small” and “small → counterbalance → large”. Consequently, coordination fluctuates between “high-medium-low”.
Specifically from the perspective of urban classification: (1) When there is a positive impact, the modern sector in cities achieves high levels of capital accumulation, primarily driven by secondary and tertiary industries. This sector absorbs most of the farmers and herders, thereby raising the standards of subsidies for livestock activities. As a result, the intensity of production activities in the grasslands is significantly reduced, leading to high coordination between urban development and the grassland ecosystem. This scenario is often seen in capital-type central cities and growth-type resource cities. (2) When there is a negative impact, traditional agro-pastoral sectors dominate the urban economy, with a high dependence on the primary industry. The modern sector’s low wage levels lead to labor concentration in grassland agro-pastoral areas with minimal mobility. The intensity of agro-pastoral activities fluctuates around the threshold value, leading to low coordination. This is commonly seen in cities primarily focused on purely agro-pastoral cities. (3) Under neutral balancing impacts, both the traditional and modern sectors contribute to urban development, with the primary, secondary, and tertiary industries being equally important. The income levels of farmers and herders are comparable, and grassland production activities continue within the normal threshold. The exogenous and endogenous pressures are in a state of counterbalance, resulting in moderate coordination. This is typically observed in regional central cities. (4) When impacts fluctuate, as the level of economic development in the city fluctuates, the exogenous and endogenous pressures also vary along the two aforementioned paths. The coordination level changes accordingly. This is often seen in declining resource-based cities and developing agro-pastoral cities. (5) Beyond economic regulation-induced coordination, special ecological cities must also be considered. These cities prioritize ecological protection, with minimal exogenous and endogenous pressures. Their coordination is determined by the ecological base rather than urban development levels (Figure 2).

3. Materials and Methods

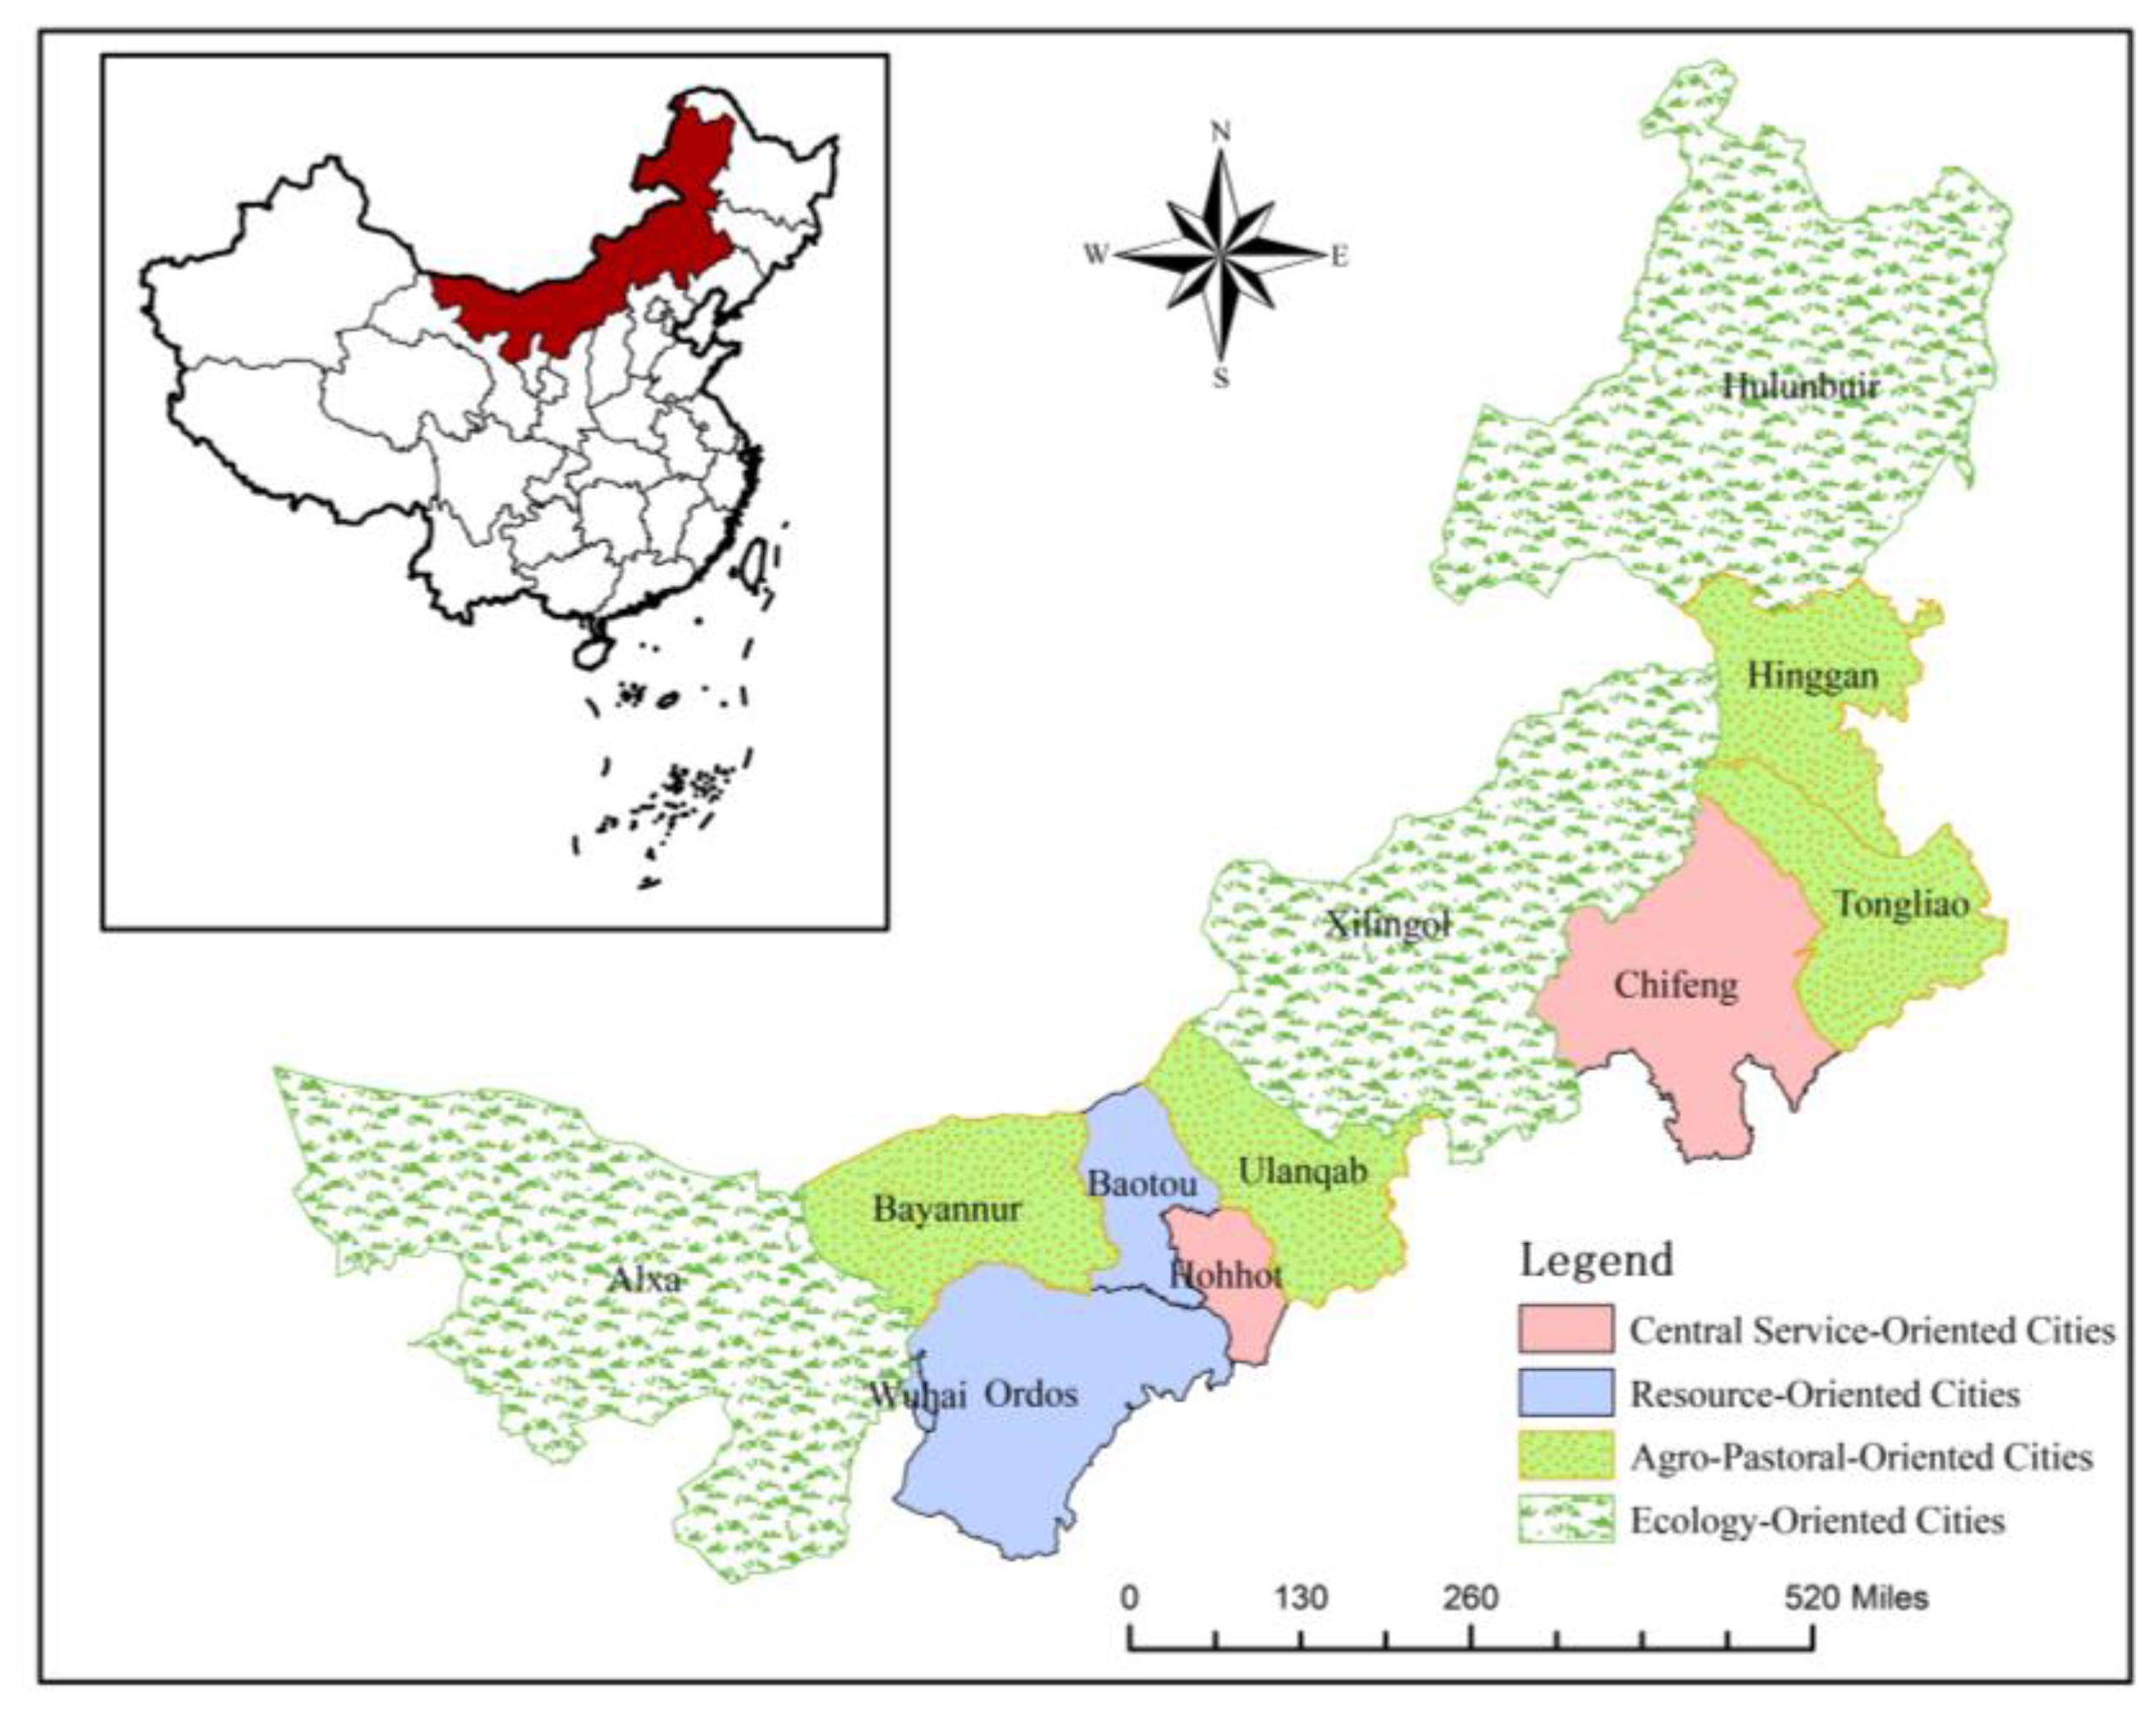
3.1. Study Area and Data Sources

(1) Overview of the Study Area and City Classification
The Inner Mongolia Autonomous Region (IMAR) is the largest ecological functional area in northern China, with grasslands covering 74% of the region. The total economic value of its ecosystem services reaches CNY 572.074 billion. It plays a crucial role in the national “Two Screens and Three Belts” ecological security barrier pattern, holding a unique ecological status. In 2020, Inner Mongolia’s GDP was CNY 1.73598 trillion, with a per capita GDP of CNY 72,062. The region spans east, central, and west parts, with varying development levels and ecological bases. Based on existing classification standards [69], the cities in Inner Mongolia can be categorized into four types: central service-oriented, resource-oriented, agro-pastoral-oriented, and ecology-oriented (Figure 3).
① Central service-oriented cities: Hohhot and Chifeng. Hohhot is the capital of Inner Mongolia, aggregating multiple resources, with a 2020 resident population of 3.4542 million and a tertiary industry accounting for 66.4% of GDP. Chifeng, with the highest population in the region at 4.0313 million in 2020, has a tertiary industry share of 49.2%, serving as the central city of eastern Inner Mongolia. However, its economic base is generally modest, with agro-pastoral sectors accounting for 19.6%.
② Resource-oriented cities: Baotou, Ordos, and Wuhai. Baotou is one of China’s important steel industry bases, with the secondary industry accounting for 41.4% of its GDP in 2020, and an industrial output value of CNY 280.8 billion. Ordos had a secondary industry proportion of 56.8% in 2020, with the highest industrial output value in the region at CNY 371 billion, forming the core urban cluster of Inner Mongolia together with Hohhot and Baotou. Wuhai, with a small land area, has relied on the coal mining industry to drive its urban development for decades, with the secondary industry accounting for 64.5% of its GDP in 2020, clearly reflecting its resource-dominated characteristics.
③ Agro-pastoral-oriented cities: Bayannur, Ulanqab, Tongliao, and Hinggan League. Bayannur, located in the Hetao Plain, had a primary industry share of 25.3% in 2020. Ulanqab is an agro-pastoral interlaced city, with a total agro-pastoral output value of CNY 24,066.11 million in 2020. Tongliao and Xing’an League are pastoral cities, with total agricultural, forestry, and animal husbandry output values reaching CNY 51,102.08 million and CNY 32,002.21 million, respectively, in 2020, and the primary industry accounting for 23.9% and 34.5%, respectively.
④ Ecology-oriented cities: Hulunbuir, Xilingol, and Alxa League. Hulunbuir has 90.26% of its area as an ecological space, with the highest ecosystem service value in the region at CNY 3941.45 billion. Xilingol League had a grassland coverage rate of 96.1% in 2020, ranking second in ecosystem service value in the region at CNY 1010.78 billion. Alxa League, with a fragile ecological environment, had 93.9% of its area as bare land.
(2) Data Sources
Due to the lack of research data, the study period is defined as 2000–2020. Socio-economic data are from the “Inner Mongolia Statistical Yearbook (1999–2021)”. Land cover data are from the annual 30 m land cover data for China (1990–2022) published by the team of Professors Yang Jie and Huang Xin at Wuhan University. The ecosystem service values are calculated using the evaluation method based on unit area value equivalent factors developed by Xie Gaodi [70]. NDVI data are from the China Tibetan Plateau Data Center. Landscape indices are calculated from land cover data using Fragstats 4.2. CO2 emission data are calculated based on relevant algorithms from the literature. PM2.5 concentration data are from the PM2.5 data published by the Atmospheric Composition Analysis Group at Washington University in St. Louis. The estimation of grassland resource supply uses NPP and land use data from Inner Mongolia between 2000 and 2020. The consumption of grassland resources is estimated using livestock statistics from the “Inner Mongolia Statistical Yearbook”. The livestock types mainly include cattle, horses, camels, donkeys, and sheep, which are converted to standard sheep units using conversion factors [71]. The grassland carrying pressure index is calculated using the ratio of actual livestock carrying capacity to theoretical livestock carrying capacity [51]. Missing urban built-up area data for Alxa League are supplemented with land cover data, and missing data for other years are validated and supplemented using interpolation methods.

3.2. Construction of Comprehensive Evaluation Index System

(1) Comprehensive evaluation index system: The process of urban development level improvement is essentially urbanization. Based on this concept, a comprehensive evaluation index system for the urban development level was constructed from four dimensions: population, economy, space, and society.
① Population dimension: This is the core measure of urban development level, referring to the transformation of agro-pastoral populations into non-agro-pastoral populations, reflecting the transfer of labor and economic activities. Key indicators include urban population density and the proportion of urban population.
② Economic dimension: This measures the driving force behind urban development, measuring the proportion of modern sectors within the entire regional economy (GDP). Economic development indicators such as total economic output, the non-agriculturalization of economic structure, and economic investments reflect the level of urban economic development. Therefore, metrics such as per capita GDP and the proportion of secondary and tertiary industries are used to measure economic development levels.
③ Spatial dimension: This is the carrier of urban development, mainly reflected in the increase in the built-up area of the city.
④ Social dimension: This represents the ultimate goal of urban development, which is to improve residents’ living standards and perfect the public service system. Representative indicators include per capita disposable income and the number of health institutions per 10,000 people.
In summary, a comprehensive evaluation index system for urban development levels in each prefecture-level city in Inner Mongolia consists of 10 basic indicators. The entropy method and analytic hierarchy process (AHP) are used to calculate the weights of each indicator and comprehensively evaluate the development levels of each city (Table 1).
The ecological environment in Inner Mongolia has unique characteristics, which must be considered when constructing an evaluation index system to measure its ecological status. Based on existing research [33], the ecological environment evaluation is divided into four dimensions: ecosystem structure, ecological environment function, ecological environment pressure, and ecological environment pattern.
① Ecosystem structure: This refers to the distribution of various ecological land types in Inner Mongolia. Given the narrow and long distribution of the region and the ecological uniqueness of the Mongolian Plateau, indicators such as grassland and forest coverage rates, the proportion of arable land and bare land, and the vegetation coverage index are selected to measure changes in the ecosystem structure.
② Ecological environment function: This measures changes in the value of Inner Mongolia’s ecological environment, commonly using indicators like the proportion of ecological space and ecosystem service value. Given that Inner Mongolia’s land cover is predominantly grassland, the supply function of grassland resources and its variations have significant impacts on the overall ecological environment. Therefore, this indicator is also included in the assessment.
③ Ecological environment pressure: This indicates the pressure on the ecological environment quality of Inner Mongolia caused by human activities during urban development. Common indicators include PM2.5 and CO2 emissions. Given the unique nature of grassland areas, indicators such as grassland resource consumption and grassland carrying pressure are selected to measure the impact of labor and economic activity transfer on the grassland ecological environment.
④ Ecological environment pattern: This measures the distribution and changes in the landscape pattern of Inner Mongolia, which affects the structure and function of the ecological environment. Given the diverse and concentrated distribution of ecological spaces in Inner Mongolia, indicators such as landscape fragmentation, connectivity, and diversity are used to recognize the extent of human activity interference with the grassland ecosystem. Landscape fragmentation represents the degree of ecological space fragmentation, connectivity represents the connection between spatial structural units, and diversity represents the richness and diversity of the ecosystem in terms of structure and function.
In summary, a comprehensive evaluation index system for the ecological environment in Inner Mongolia consists of 13 basic indicators (Table 2).
(2) Indicator Pre-processing and Weight Calculation
First, the indicators are dimensionless to reduce the interference of random factors. Ecological environment indicators are divided into positive and negative effect indicators, each using different standardization formulas:
A i j = x i j   m i n ( x i j ) m a x ( x i j ) m i n ( x i j ) ,   x i j   i s   a   p o s i t i v e   e f f e c t   i n d i c a t o r
A i j = m a x ( x i j ) x i j   m a x ( x i j ) m i n ( x i j ) ,   x i j   i s   a   n e g a t i v e   e f f e c t   i n d i c a t o r
where i is the indicator number; j is the year; xij is the actual calculated value; max(xij) and min(xij) are the maximum and minimum values of indicator i, respectively. After the standardization process, the larger the value of all indicators, the better.
Indicator weights reflect the relative importance of indicators, which is crucial for the accuracy and reliability of evaluation results. This study combines subjective and objective weighting methods, using AHP and the entropy method to calculate the weights of each indicator. The final weight calculation combines these weights. W1i and W2i are the weights calculated by AHP and the entropy method, respectively. The specific calculation formula is as follows:
w i = ( w 1 i × w 2 i ) 1 2 1 n ( w 1 i × w 2 i ) 1 2
(3) Calculation of Comprehensive Evaluation Index
The comprehensive evaluation index is calculated using a system index evaluation model. A linear weighting method is applied to first calculate the specific indicator layers of the population, economy, space, and social factors, as well as ecosystem structure, ecological environment function, ecological environment pressure, and ecological environment pattern, and then summing them up to derive the comprehensive evaluation values of urban development level and ecological environment. The calculation formulas are as follows:
u ( x ) = 1 n w i × x i ,         e ( y ) = 1 m w j × y j
U ( x ) = 1 n W i × f ( x ) ,         E ( y ) = 1 m W j × g ( y )
where u(x) and e(y) represent the comprehensive evaluation values of the secondary indicator layers for urban development and ecological environment; U(x) and E(y) represent the comprehensive evaluation values of the urban development level and ecological environment system; xi and yi are the standardized values of the secondary evaluation indicators for urban development and ecological environment; wi and wj are the comprehensive weights of the secondary evaluation indicators for urban development and ecological environment; Wi and Wj are the weights of the primary evaluation indicators for urban development and ecological environment.

3.3. Measurement Methods of Coupling Coordination Degree

(1) Granger Causality Test Model
The Granger causality test model is a statistical method that can effectively avoid spurious correlations between variables and is commonly used to test causal relationships between variables. This test can determine whether there is a causal relationship between two time series data sets. Simply put, it examines whether the past values of variable y can explain its current value and whether adding the lagged values of variable x significantly improves the explanation of y. If the lagged values of x can effectively improve the explanation of y, x is considered the Granger cause of y [72]. This method can effectively identify whether there is a causal relationship between urban development levels and the grassland ecological environment. Considering the sample size requirements of the test method, this study does not conduct tests at the individual city level. Instead, it classifies cities by type and tests the comprehensive evaluation values of urban development levels and ecological environments from 2000 to 2020 to ensure the accuracy of the test results.
The Granger test requires the time series to be stationary, as non-stationary time series may cause false Granger causality. Therefore, the ADF test method is first used to test the stationarity of the series. The model formula is as follows:
A t = α + β t + β A t 1   + p = 1 q β p A t p + ε t
where At is the time series to be tested, t is the time variable, α is a constant term, βt and βp are trend items, εt is the residual term, and p is the lag order, q is the maximum lag order.
After determining that the time series data are stationary, the Granger causality test between urban development levels and the ecological environment is conducted. The model formula is as follows:
E ( y ) t = α + v = 1 u β v U ( x ) t v + v = 1 u γ v E ( y ) t v + ε t
where α is a constant term; β and γ are the corresponding regression coefficients; u is the maximum lag order of the variables U(x) and E(y); εt is the residual term. The null hypothesis for the test is βv = 0 (v = 1, 2,…, u), indicating that U(x) is not the Granger cause of E(y). If the null hypothesis is rejected, it means that U(x) is the Granger cause of E(y). Otherwise, U(x) is not the Granger cause of E(y).
(2) Nonlinear Fitting Analysis
The Granger causality test can only verify whether urban development levels impact the ecological environment and whether there is a causal relationship; it cannot identify their specific correlation. To answer questions about specific impact types, development trends, and coordination, nonlinear fitting methods are needed for correlation analysis. It should be noted that regardless of the presence of a causal relationship, nonlinear fitting methods can analyze the correlation between variables. This method can adapt to complex data patterns, using nonlinear functions and iterative algorithms to achieve more precise and flexible data fitting [73]. In this study, we employed Origin software version 2019b with the version number 9.65 and used power function fitting to analyze the specific correlation between urban development and the ecological environment, aiming to identify the state of coordinated development. Power functions are advantageous for understanding the dependencies among various variables, offering high accuracy and low computational demand. They are commonly used in studies to identify change patterns and predict future trends, making them suitable for this research. The fitted regression equation is constructed as follows:
E ( y ) = a × U ( x ) b
where a and b are the coefficients of the regression model.
(3) Coupling Coordination Degree Measurement Model
The nonlinear fitting method cannot identify the level of coordination between urban development levels and the ecological environment. The coupling coordination degree model can fill this gap. Borrowing from the concept of coupling degree in physics [74], the calculation formula for the coupling degree between urban development and the ecological environment is as follows:
C = 2 U x E y / ( U x + E y )
where C is the coupling degree index. A larger C value indicates a stronger correlation between urban development and the ecological environment. The coordination degree expresses the comprehensive development level and coordination between the two. On the basis of coupling degree calculation, the coordination degree is further analyzed using the following formulas:
D = C × T
T = α U ( x ) + β E ( y )
where D is the coupling coordination degree; T represents the importance of urban and ecological environment development, with α = β = 0.5 as both systems are equally important.
Referencing existing research results [75], the coupling coordination degree between urban development and the ecological environment is classified into seven types such as optimal coordination and good coordination. Based on the relative sizes of U(x) and E(y), 21 development types are further classified (Table 3).

4. Results

4.1. Granger Causality Test

To effectively identify the impact relationship between urban development levels and the ecological environment in different types of cities in Inner Mongolia, it is crucial to first determine whether a causal relationship exists between the two. Therefore, before analyzing the specific impact types and coordination, the Granger causality test method is used to confirm the impact relationship. Initially, the stationarity of the time series data for the comprehensive urban development level index (U(x)) and the ecological environment index (E(y)) of different types of cities in Inner Mongolia from 2000 to 2020 is tested. The results indicate that the data for U(x) and E(y) in central service-oriented, resource-based, agro-pastoral, and ecologically dominant cities are stationary, allowing for the Granger causality test to be conducted (Table 4). The null hypothesis is set that U(x) is not the Granger cause of E(y), with the results as follows:
For central service-type, resource-based, and agro-pastoral cities, the p-values are all 0.000, less than 0.05, rejecting the null hypothesis and confirming that changes in urban development levels due to labor population and economic activity flow impact the grassland ecological environment. For ecologically dominant cities, the p-value is greater than 0.05, accepting the null hypothesis, indicating that changes in urban development levels do not have a causal relationship with changes in the grassland ecological environment (Table 5).

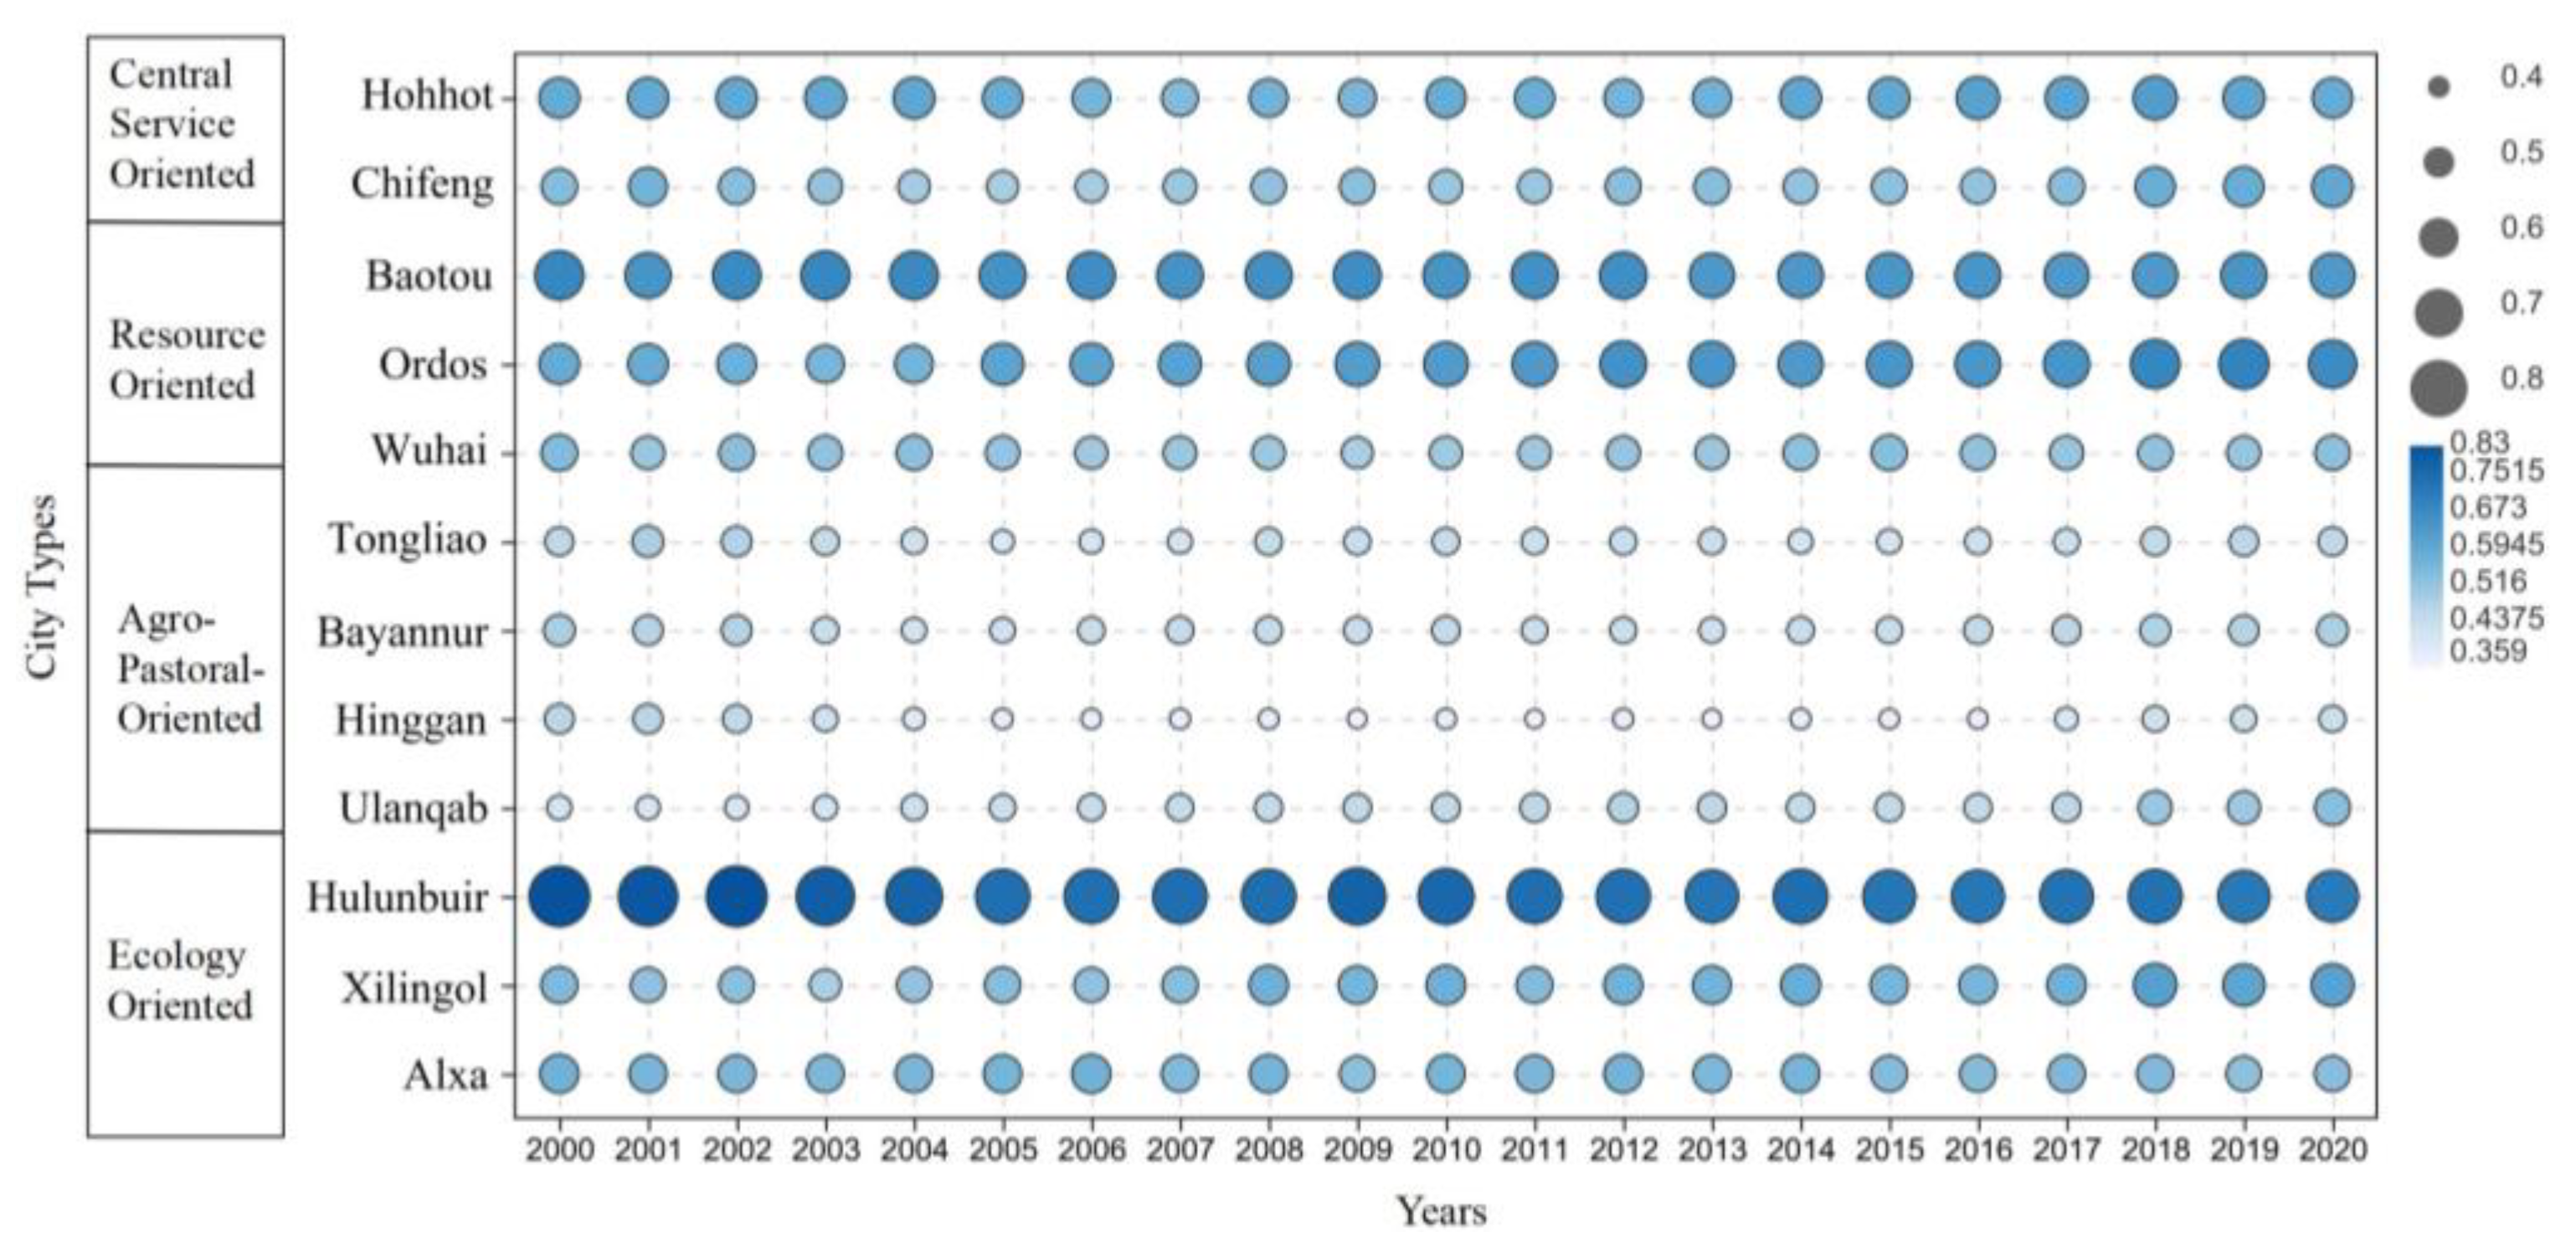
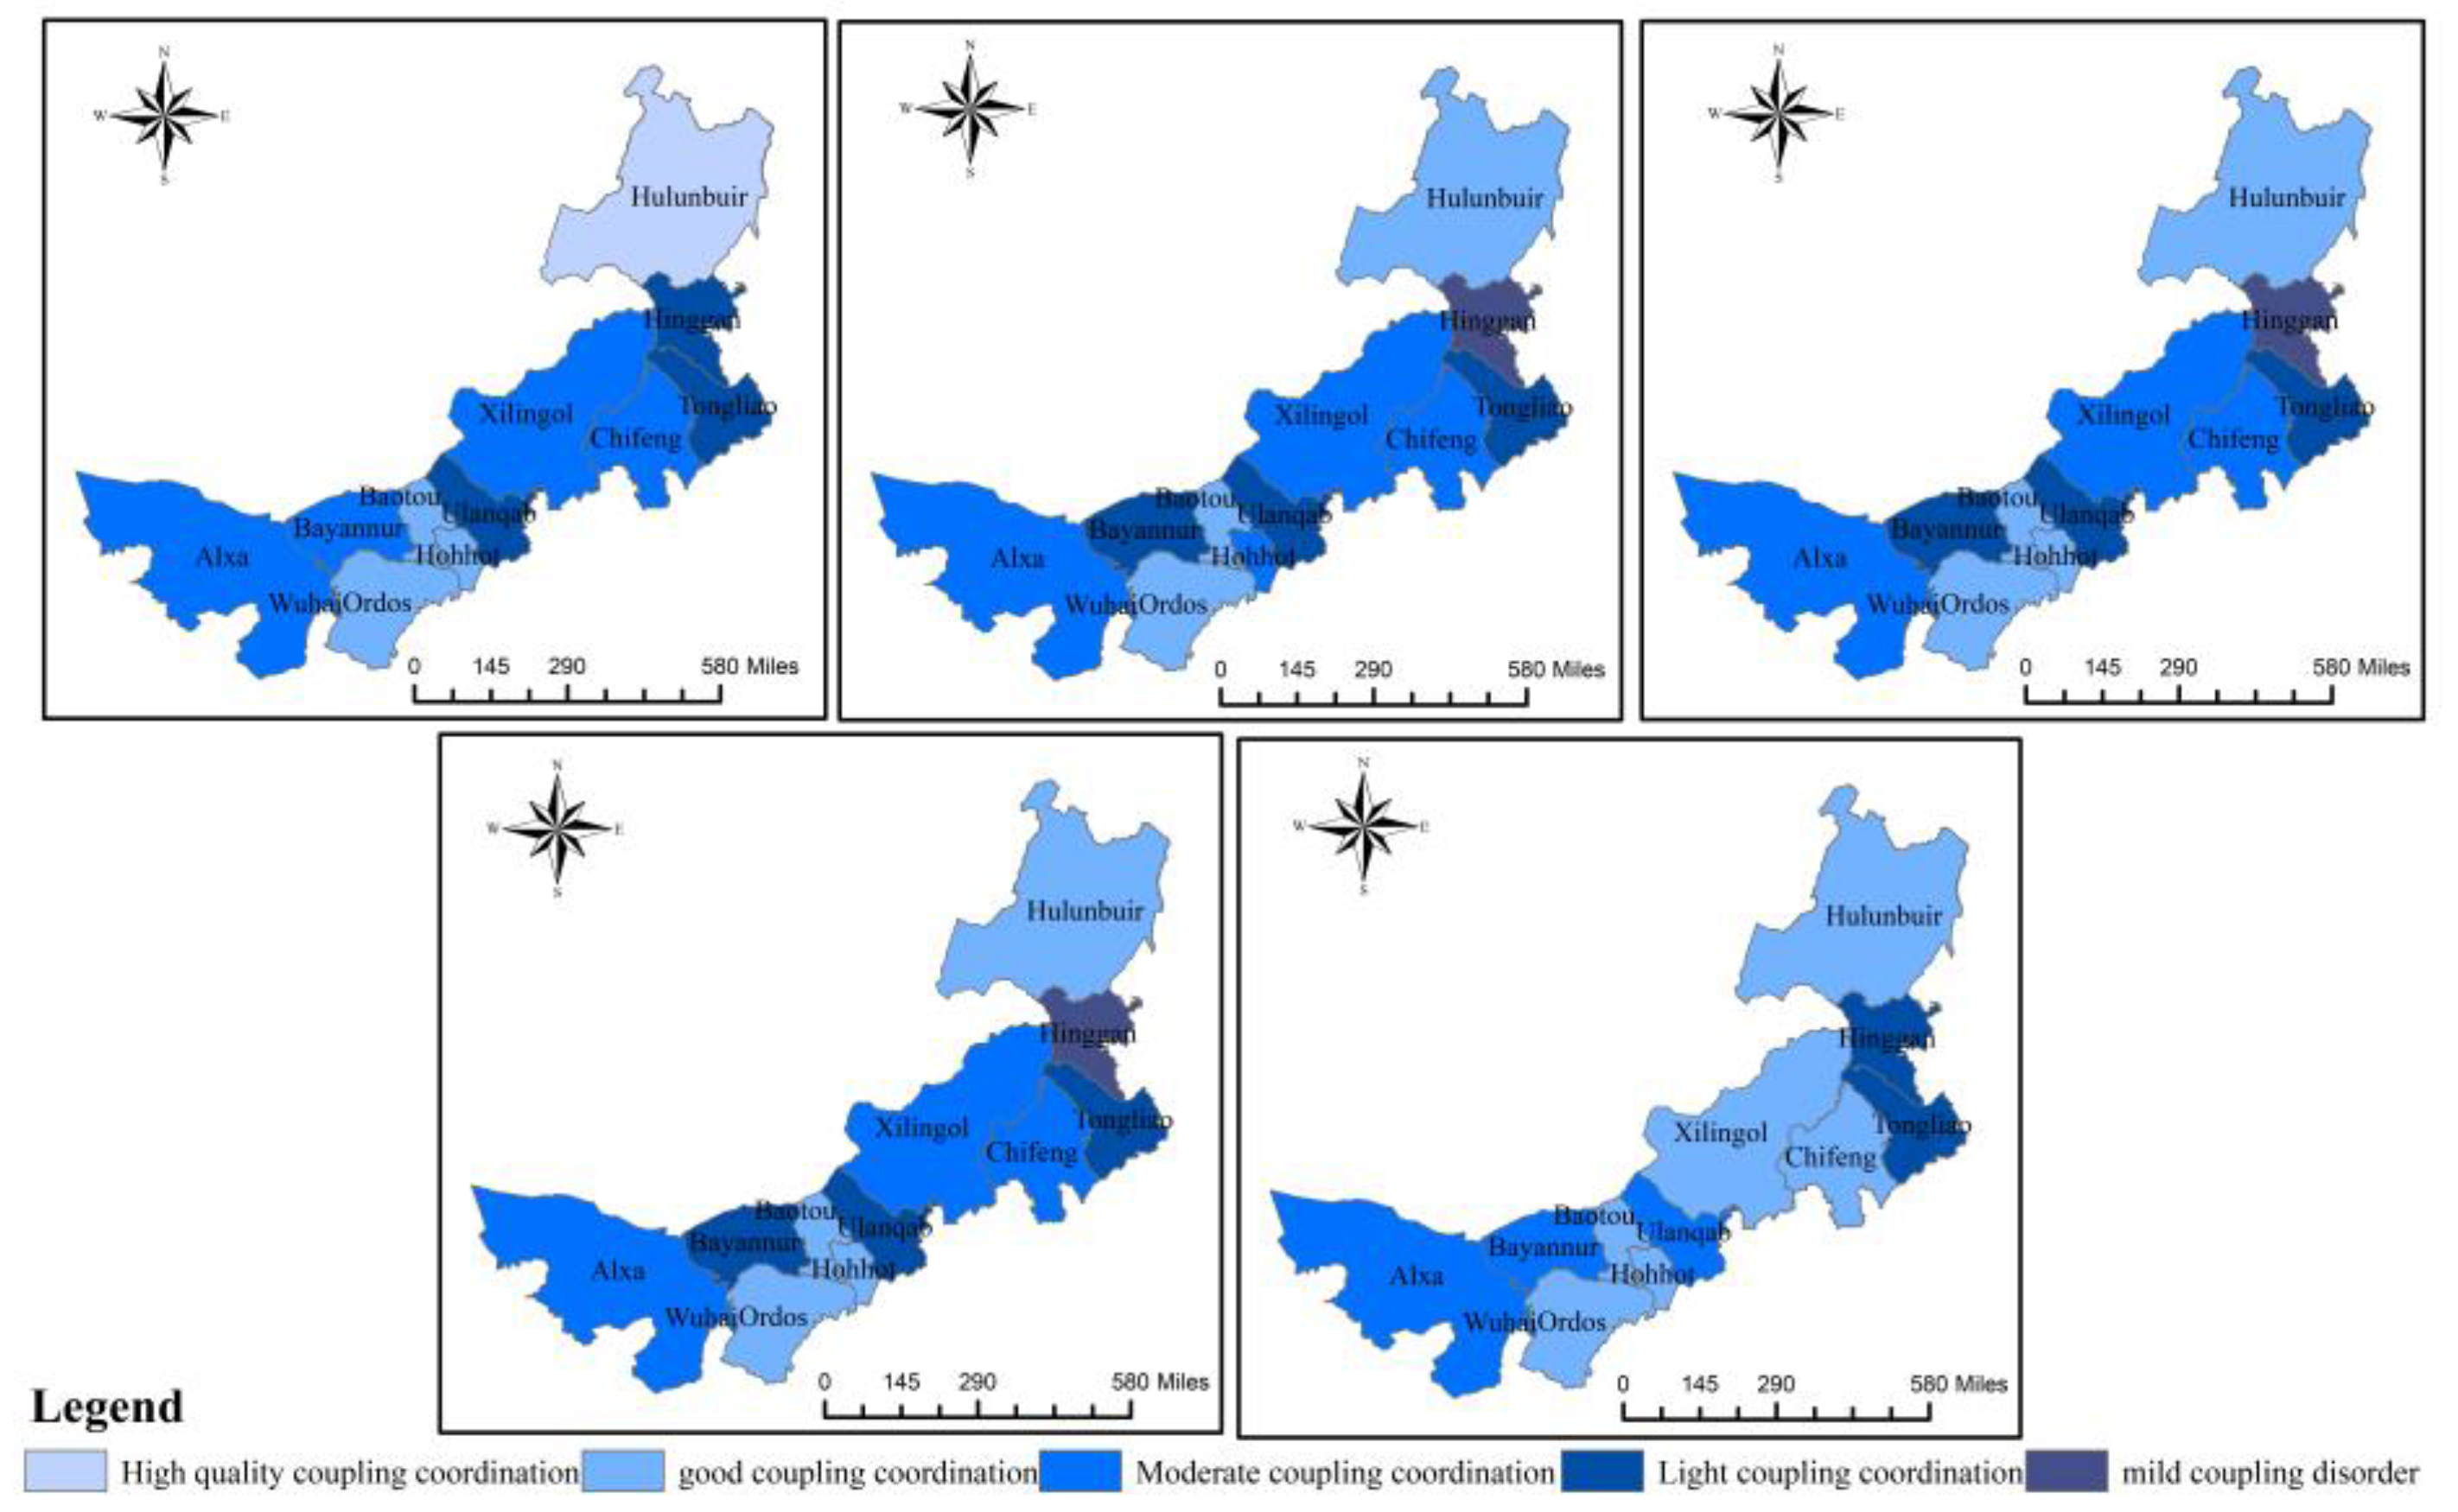
4.2. Coordination Analysis of Urban Development Levels and Ecological Environment from a Classification Perspective

Based on the results of the Granger causality test, nonlinear fitting, and coupling coordination models are utilized to further explore the specific impact types and coordination of central service-oriented, resource-based, and agro-pastoral cities. Although there is no causal relationship between the development of ecologically dominant cities and the ecological environment, correlation analysis helps us identify their coordinated development state. The nonlinear fitting results show the impact relationship of urban development levels on the ecological environment, using the comprehensive development index of urban development levels as the horizontal axis and the comprehensive development index of the ecological environment as the vertical axis. The trends of urban development levels and ecological environment evolution are analyzed with years as the horizontal axis and index values as the vertical axis. The coupling coordination model results are shown in Figure 4 and Figure 5, and Table 6.
(1) Central Service-Oriented Cities
According to the comprehensive calculation results of coordination, the coupling coordination index of the provincial capital city Hohhot ranges between 0.6 and 0.7 (Figure 4), with low exogenous and endogenous pressures, indicating a state of “good coordination coupling-ecological environment lagging (Table 6)”. However, as the urban development level increases, the quality of the grassland ecological environment shows a slight decline, and the coordination is unsustainable (Figure 6). This aligns with our expectations, as Hohhot has a developed modern sector economy dominated by the tertiary industry, with high wage levels attracting many farmers and herdsmen to urban employment. This reduces grassland production activities and significantly decreases grassland resource consumption, with a positive feeding influence and a high degree of coordination. The unsustainable aspect may be related to the direct impact of urban development on the ecological environment. As the provincial capital of an ethnic region, Hohhot experiences rapid development in the secondary and tertiary industries with extensive development methods, causing ecological damage in urban and suburban areas. Additionally, the constant increase in the resident population and rapid urban spatial expansion reduce ecological space and increase carbon emissions, leading to a slight decline in ecological quality.
The regional central city Chifeng shows a coupling coordination index ranging between 0.5 and 0.7 (Figure 4), with moderate coordination, indicating a neutral balancing impact of urban development levels on the ecological environment (Figure 6) and a state of “moderate coordination coupling-synchronous urban development and ecological environment (Table 6)”. Future improvements in the city’s development level may increase exogenous and endogenous ecological pressures, with a tendency for coordination to worsen. This may be influenced by two factors: First, Chifeng’s proximity to Beijing, Liaoning, and Hebei allows for the injection of external resources, promoting the rapid development of modern sector industries and a slight increase in wage levels. However, limited by high urban living costs, only a small portion of farmers and herdsmen seek urban employment, slightly reducing grassland production activities and decreasing exogenous and endogenous pressures. Second, Chifeng’s agro-pastoral output value is the highest in the region, with the traditional agro-pastoral sectors remaining significant, retaining most of the labor force. Although the urban development level slightly improves, the total labor transfer is not substantial, and the phenomenon of grassland population activities and resource consumption remains severe, maintaining high exogenous and endogenous pressures. These factors interact, causing the impact of Chifeng’s urban development level on the grassland ecology to shift from neutral to negative, with coordination moving from medium to low.
(2) Resource-Oriented Cities
Coordination calculation results indicate that the improvement of resource-oriented cities’ development level has a positive feeding effect on the ecological environment, with a good foundation for coupling coordination development.
Among them, the growth-type resource city Ordos has a coupling coordination index ranging between 0.6 and 0.7 (Figure 4), with both urban development levels and ecological environment quality improving (Figure 7), showing a significant positive impact and a state of “good coupling coordination-ecological environment development lagging (Table 6)”. Ordos is primarily dominated by the secondary industry, with a well-developed modern sector economy and higher wages than the traditional sector, resulting in strong labor mobility. Additionally, increased subsidies for agro-pastoral areas have significantly enhanced the city’s “push-pull” effect, attracting many farmers and herdsmen to urban employment, greatly reducing agro-pastoral production activities and decreasing both exogenous and endogenous pressures on the grassland ecological environment, with high coordination and good future growth prospects.
Declining resource-based cities like Baotou and Wuhai have coupling coordination indexes ranging between 0.7 and 0.8 and 0.5 and 0.6 (Figure 4), respectively, in a state of “good/moderate coupling coordination-ecological environment development lagging (Table 6)”. However, the impact of urban development levels on the ecology gradually shifts from positive to neutral, with increasing exogenous and endogenous pressures, causing coordination to move from “high to medium” (Figure 7). The reasons may include facing resource depletion and model innovation issues, leading to a decline in the dominance of modern sector industries and economic levels. This shift causes a short-term focus on the primary and tertiary industries, with renewed attention to traditional agro-pastoral sectors and reduced subsidies. Consequently, urbanized farmers and herdsmen face unemployment and wage reduction risks, potentially returning to the grasslands for production activities, increasing ecological pressures, and reducing coordination from high to medium.
(3) Agro-Pastoral-Oriented Cities
Comprehensive coordination calculation results show that the coupling coordination index of agro-pastoral cities ranges between 0.4 and 0.5 (Figure 4), indicating a negative impact of urban development levels on the ecological environment (Figure 8), with a state of “mild coordination coupling-synchronous urban development and ecological environment (Table 6)” being dominant. In cities like Bayannur and Ulanqab, the impact of urban development levels on the grassland ecological environment shifts from negative to neutral. This may be due to the significant spatial spillover effects of being adjacent to core cities like Hohhot, Baotou, and Ordos. The modern sector industries are gradually developing, with rising wage levels. This breakthrough in the agro-pastoral dominant economy leads to a slight labor flow, with some farmers and herdsmen seeking urban employment, reducing grassland production activity intensity and decreasing both exogenous and endogenous pressures, improving coordination from “low to medium”.
In Tongliao, the coordination between urban development levels and the ecological environment is low, with a significant negative impact and a tendency for imbalance in the future (Figure 8). The city’s traditional agro-pastoral sector dominates its economy, with farmers and herdsmen primarily relying on agro-pastoral production for income, leading to serious grassland resource consumption, frequent overgrazing, and poaching, with grassland carrying capacity hovering near the threshold and high exogenous and endogenous pressures. Additionally, considering Tongliao’s unique situation with a resident population of 2.8675 million in 2020, over half of whom are engaged in agro-pastoral production, the endogenous pressures are significant, resulting in poor coordination.
The cumulative negative impact of urban development levels on the ecological environment leads to Hinggan League’s coordination ranging between mild coordination and imbalance, with both urban development levels and ecological environment quality declining (Figure 8). Although Hinggan League is currently in a low coordination state, it seems more like a “rebound after bottoming out” due to the cumulative negative impact, indicating “pseudo-coordination”. This may be due to Hinggan League’s traditional agro-pastoral sector dominance, with a large labor force leading to severe overexploitation of resources and declining grassland ecological quality. This reduces the regenerative capacity of the grassland ecosystem, causing a vicious cycle with declining agro-pastoral output, resulting in reverse coordination or imbalance. In this scenario, a slight increase in modern sector wage levels can lead to labor transfer, reducing grassland production activities and allowing the ecosystem to recover, shifting from imbalance to low coordination.
(4) Ecology-Oriented Cities
In ecology-oriented cities with good ecological environments, such as Hulunbuir and Xilingol, both urban development levels and ecological environment quality improve simultaneously, with coordination development indexes between 0.5 and 0.9 (Figure 4), indicating a state of “moderate/good coordination coupling-urban development lagging (Table 6)”. On the one hand, Hulunbeier and Xilingol have high grassland and forest coverage, which plays a crucial role in the northern land ecosystem of China. For this reason, the state, autonomous regions, and localities have introduced relevant policies to increase subsidies, rewards, and penalties, and to relocate herding populations to urban areas or allow them to move between urban and grassland areas, aiming at reducing the pressure of grassland agro-pastoral husbandry and protecting the ecological function of grasslands. On the other hand, the two cities have a good ecological base, which provides a greater potential for agro-pastoral husbandry. This can accommodate a larger amount of livestock to meet the economic needs of farmers and herders, and the endogenous pressure becomes smaller.
However, the development and ecological environment indexes of Hulunbeier are decreasing, and the coordination is also decreasing (Figure 9). This may be related to the special characteristics of the city: (1) Hulunbeier is located on the northern border of China, the climate environment is harsh, and the population loss is serious. Coupled with the large area of grassland, herdsmen live in the grassland for a long time, with very poor aggregation, a low comprehensive development index of knowledge, and are marginalized in their own regional urbanization process. (2) With the support of policies, Hulunbeier has a high starting point for development, but the endogenous economic power is insufficient to solve the needs of urban herders to increase their incomes, so there may be a phenomenon of herders returning to the grassland.
Ecologically fragile cities’ level of development has risen, while the ecological environment has deteriorated (Figure 9), and the coordinated development index ranges from 0.5 to 0.6 (Figure 4), indicating “moderate coordination-synchronous development of urban development and ecological environment (Table 6)”. On the one hand, Alxa League gives priority to ecological conservation, has serious soil sandification, a desert area of more than 93%, barren land, lack of resources, resulting in coordination in the middle. On the other hand, due to the need for ecological and environmental conservation, Alxa’s urban development is being pushed back, and the state of coordination is not sustainable, so it may change from medium to low in the future.

5. Discussion

This study, based on the dual economic structure theory and the mechanism of labor mobility, explores the relationship between changes in urban development levels and the intensity of grassland pastoral activities from a classification perspective, and its impact on the grassland ecosystem. The findings indicate that as the intensity of labor mobility changes, the total labor volume in grassland agro-pastoral areas and modern urban areas fluctuates, causing urban development levels to also fluctuate. This leads to changes in the frequency of grassland agro-pastoral activities, which indirectly have positive, neutral, or negative effects on the ecosystem. The exogenous and endogenous pressures of the grassland ecosystem and coordination also show heterogeneity under different impact relationships. To some extent, this verifies the research conclusions of Liao and other scholars [33,61]. Essentially, this heterogeneity in coordination, indirectly caused by labor mobility, is mainly reflected in the differences in the intensity of grassland pastoral activities. Most studies confirm that high-intensity grazing leads to soil degradation, a sharp decline in grass yield, degradation of plant root systems, and other issues, which are the main reasons for the decline in the service capacity of the grassland ecosystem. However, the intensity of grazing is closely related to the number of laborers in agro-pastoral areas and the economic level of modern sectors. When the level of urban development is high, the economic capability of modern urban sectors is stronger than that of traditional sectors, causing labor and economic activities to shift from the grasslands to the cities. This reduces the intensity of grazing, thereby enhancing the service capacity of the grassland ecosystem, and vice versa. However, it must be pointed out that this heterogeneity coordination pattern is based on traditional dual economic structure theory, which primarily considers the economic imbalance between the two regions caused by surplus capital accumulation, wage levels, and labor mobility while lacking consideration of factors such as human capital, technological progress, and knowledge innovation. Further exploration is needed in the future. Additionally, there are grassland ecological cities that operate outside economic laws, where specific coordination is determined by the quality of the ecological base.
The research conclusions provide the following insights for the future coordinated development of various types of cities. First, for cities with moderate to low coordination, mandatory population transfer policies cannot alleviate grazing pressure, and the level of urban development does not truly improve, with grassland degradation remaining severe. The urgent task is to promote the rapid development of modern non-agro-pastoral sectors, strengthen the endogenous economic power of cities, enhance their capacity and attractiveness for agro-pastoral populations, accelerate spontaneous labor transfer, reduce grazing intensity in grassland areas, and thereby restore the service capacity of the grassland ecosystem. Second, for cities with high coordination, on the one hand, it is necessary to ensure sufficient endogenous economic power, promote continuous innovation and upgrading of modern non-agro-pastoral industries, break through development bottlenecks, raise wage levels, and more widely absorb agricultural labor. However, it is also important to avoid turning grassland areas into “no-man’s land”. Studies have shown that long-term prohibition of grazing in grassland areas separates humans from nature, causing a dual separation between humans and nature [76,77,78]. This disrupts the “human-grass-animal” balance chain, leading to pasture aging, superior forage being replaced by inferior weeds, changes in plant communities, and a significant reduction in grassland utilization [79]. Therefore, these cities should control the intensity and total amount of labor mobility to effectively promote coordinated development. On the other hand, attention should be focused on the direct impacts of carbon emissions and gas pollution generated during urban development. Such anthropogenic climate changes are affecting the natural and biological systems of grassland areas [27]. Third, for ecological cities, the intensity of ecological protection and governance capabilities are crucial. Therefore, ensuring the implementation of protection policies, appropriate protection behaviors, and advanced protection technologies will be a continuous task in the future.
Reviewing the coordinated development status of different types of cities in Inner Mongolia over the past twenty years, it is found that the improvement in urban development levels indeed helps alleviate the pressure on the grassland ecological environment, which has a positive impact on the grassland ecosystem. However, some cities in grassland areas have low development levels, with traditional agro-pastoral sectors still being the focus of regional development. Urban development driven by policies lacks endogenous economic power, labor mobility intensity is low, and some cities exhibit a “return flow” phenomenon. This results in no significant reduction in pastoral activities, with ecological environmental pressure not genuinely alleviated, and thus failing to sustainably protect the grassland ecosystem. This is particularly evident in purely agro-pastoral cities. Only the development of central and resource-based cities with sufficient endogenous economic power can truly have a long-term protective effect on the grassland ecosystem. The grassland ecosystem has multiple service values such as windbreak and sand fixation, water conservation, and climate regulation. This value has the characteristic of “affecting the whole body with one move”. The heterogeneity in the coordination of different types of cities may ultimately lead to a reduction in the service capacity of the entire grassland ecosystem. Therefore, the national and regional governments need to continue providing policy support to agro-pastoral cities, mobilizing urban resources to fundamentally solve the problem of ecological environment degradation and ensure the sustainable regenerative capacity of the grassland ecosystem.

6. Conclusions

This study constructed a conceptual framework for the relationship between urban development levels and ecological environment coordination from a classification perspective. Using the Granger causality model, this study examines whether there is an impact relationship between the two. Employing the nonlinear fitting and coupling coordination model methods, we comprehensively analyzed the impact of urban development levels on the ecological environment and the coordination of different types of cities in Inner Mongolia. The conclusions are as follows:
(1) When urban development positively nurtures the grassland ecological environment, coordination levels are high. Provincial capital-type central cities and growing resource-based cities dominate the modern non-agro-pastoral sectors, providing feedback to agro-pastoral sectors, raising ecological compensation standards, and attracting significant migration of agro-pastoral populations to cities, which reduces grassland production activities and pressures, thus achieving high coordination. However, due to issues like extensive development methods and population pressure, provincial capital-type central cities’ development levels significantly impact grassland ecology and require attention.
(2) When urban development negatively absorbs the grassland ecological environment, coordination levels are low. Purely agricultural cities, dominated by traditional agro-pastoral sectors, have high production intensity and significant resource consumption, resulting in high exogenous and endogenous pressures and low coordination.
(3) When urban development levels have a neutral counteracting effect on the grassland ecological environment, exogenous and endogenous pressures are in a state of opposition, resulting in moderate coordination. Regional central cities have moderate levels of modern sector development, with both primary and tertiary industries occupying important economic positions, allowing normal agro-pastoral production activities to continue. Due to the living costs in modern urban sectors, labor mobility intensity is average, and the total labor volume between the two regions is roughly balanced. However, in Chifeng, the impact of urban development on the ecological environment is shifting from neutral to negative, with coordination trending from moderate to low.
(4) When the impact relationship fluctuates between positive, neutral, and negative, coordination levels also oscillate between high, medium, and low. In declining resource-based cities, the development level of non-agro-pastoral industries decreases, and the ecological pressures gradually increase, showing a trend of coordination moving from “high to medium”. In developing agro-pastoral cities, non-agro-pastoral industries begin to develop, pressures decrease, and the coordination state moves from “low to medium”.
(5) Special grassland ecological-oriented cities can be classified into two specific types: good and fragile. The development of these cities is aimed at ecological environment protection, having no impact on the ecological environment. They have high standards for ecological compensation and low exogenous and endogenous pressures, and their level of coordination is largely determined by the quality of the ecological base. However, correlation analyses have shown that the need for ecological protection limits urban development, negatively impacting the synergistic development of both.
(6) The combination of causal analysis and correlation analysis methods can accurately identify the types and coordination levels of the impact of different types of urban development on the ecological environment. In correlation analysis methods, the results from the coupling coordination model align well with individual factors like urban development and ecological environment indices. Cities with high development or ecological indices tend to exhibit high coupling coordination. However, this approach overlooks the trends in urban development and ecological environment changes and the specific impact relationships between them, failing to identify issues like ecological degradation or urban development setbacks. While the nonlinear fitting method can address these gaps, it cannot determine the specific degree of coordination. Combining both methods allows for the scientific identification of the coordination levels and the sustainability of various cities.
There are limitations to this study: First, this study is based on traditional dual economic structure theory, focusing on the macro-level impact of labor mobility driven by the expansion of modern sectors and wage increases on urban development levels and the grassland ecological environment. It assumes that grassland areas only involve traditional agro-pastoral activities, neglecting emerging industries such as tourism. Future research should incorporate these aspects. Second, due to the economic backwardness of grassland areas, the analysis of labor mobility mechanisms only considers surplus capital accumulation and wage levels. Future research should draw from new economic theories to explore the impact of technological progress, knowledge accumulation, and other factors on labor mobility and urban development levels. Third, the study lacks an in-depth exploration of the mechanisms through which urban development levels impact the ecological environment. There are macro and micro differences in the different types of cities. Future research should clarify these internal mechanisms to provide insights into the development of grassland cities domestically and internationally.

Author Contributions

Conceptualization, software, formal analysis, data curation, and writing—original draft preparation, Y.W.; funding acquisition, validation, methodology, visualization, supervision, resource, project administration, and writing—review and editing, Y.Y. All authors have read and agreed to the published version of the manuscript.

Funding

This research was funded by The National Natural Science Foundation of China, grant number 41971198.

Data Availability Statement

The raw data supporting the conclusions of this article will be made available by the authors upon request.

Conflicts of Interest

The authors declare no conflicts of interest.

References

  1. Xu, B.; Yang, X.C.; Jin, Y.X.; Wang, D.L.; Yang, Z.; Li, J.Y.; Liu, H.Q.; Yu, H.D.; Ma, H.L. Monitoring and evaluation of grassland-livestock balance in pastoral and semi-pastoral counties of China. Geogr. Res. 2006, 31, 1998–2006. [Google Scholar]
  2. Guo, W.W.; Jin, L.; Li, W.; Wang, W.T. Assessing the vulnerability of grasslands in Gannan of China under the dual effects of climate change and human activities. Ecol. Indic. 2023, 148, 110100. [Google Scholar] [CrossRef]
  3. Collins, S.L.; Calabrese, L.B. Effects of fire, grazing and topographic variation on vegetation structure in tall grass prairie. J. Veg. Sci. 2012, 23, 563–575. [Google Scholar] [CrossRef]
  4. Foggin, M. Pastoralists and wildlife conservation in western China: Collaborative management within protected areas on the Tibetan Plateau. Pastor. Res. Policy Pract. 2012, 2, 17. [Google Scholar] [CrossRef]
  5. Fassnacht, F.E.; Li, L.; Fritz, A. Mapping degraded grassland on the Eastern Tibetan Plateau with multi-temporal Landsat 8 data-where do the severely degraded areas occur? Int. J. Appl. Earth Obs. Geoinf. 2015, 42, 115–127. [Google Scholar] [CrossRef]
  6. Bardgett, R.D.; Bullock, J.M.; Lavorel, S.; Manning, P.; Schaffner, U.; Ostle, N.; Chomel, M.; Durigan, G.; Fry, E.L.; Johnson, D.; et al. Combatting global grassland degradation. Nat. Rev. Earth Environ. 2021, 2, 720–735. [Google Scholar] [CrossRef]
  7. Wallace, J.S. Increasing agricultural water use efficiency to meet future food production. Agric. Ecosyst. Environ. 2000, 82, 105–119. [Google Scholar] [CrossRef]
  8. Morgan, J.A.; Lecain, D.R.; Mosier, A.R.; Milchunas, D.G. Elevated CO2 enhances water relations and productivity and affects gas exchange in C3 and C4 grasses of the Colorado short grass steppe. Glob. Chang. Biol. 2001, 7, 451–466. [Google Scholar] [CrossRef]
  9. Huang, L.; Xu, X.; Shao, Q.; Liu, J. Improving carbon mitigation potential through grassland ecosystem restoration under climatic change in Northeastern Tibetan Plateau. Adv. Meteorol. 2014, 1, 379306. [Google Scholar] [CrossRef]
  10. Richter, F.; Jan, P.; El Benni, N.; Lüscher, A.; Buchmann, N.; Klaus, V.H. A guide to assess and value ecosystem services of grasslands. Ecosyst. Serv. 2021, 52, 101376. [Google Scholar] [CrossRef]
  11. Saleska, S.R.; Shaw, M.R.; Fischer, M.L.; Dunne, J.A.; Still, C.J.; Holman, M.L.; Harte, J. Plant community composition mediates both large transient decline and predicted long-term recovery of soil carbon under climate warming. Glob. Biogeochem. Cycles 2002, 16, 1055. [Google Scholar] [CrossRef]
  12. Liu, D.; Song, X.; Hu, J.; Liu, Y.; Wang, C.; Henkin, Z. Precipitation affects soil nitrogen fixation by regulating active diazotrophs and nitrate nitrogen in an alpine grassland of Qinghai-Tibetan Plateau. Sci. Total Environ. 2024, 919, 170648. [Google Scholar] [CrossRef] [PubMed]
  13. Collins, S.; Lind, E.; Harpole, W.S.; Heckman, R.; Du, G.; Adler, P.; Wedin, D.; Stevens, C.; Kirkman, K.; Jin, V.; et al. Grassland productivity limited by multiple nutrients. Nat. Plants 2015, 1, 15080. [Google Scholar]
  14. Binkley, D.; Hart, S.C. The component of nitrogen availability assessments in forest soils. Adv. Soil Sci. 1989, 10, 57–112. [Google Scholar]
  15. Seastedt, T.R.; Briggs, J.M.; Gibson, D.J. Controls of nitrogen limitation intall grass prairie. Oecologia 1991, 87, 72–79. [Google Scholar] [CrossRef] [PubMed]
  16. Vitousek, P.M.; Howarth, R.W. Nitrogen limitation on land and in the sea: How can it occur. Biogeochemistry 1991, 13, 87–95. [Google Scholar] [CrossRef]
  17. Tilman, D. Secondary succession and t he pattern of plant dominance along experimental nitrogen gradients. Ecol. Monogr. 1987, 57, 189–214. [Google Scholar] [CrossRef]
  18. Wedin, D.; Tilman, D. Competition among grasses along a nitrogen gradient: Initial conditions and mechanisms of competition. Ecol. Monogr. 1993, 63, 199–229. [Google Scholar] [CrossRef]
  19. Van Oijen, M.; Bellocchi, G.; Höglind, M. Effects of climate change on grassland biodiversity and productivity: The need for a diversity of models. Agronomy 2018, 8, 14. [Google Scholar] [CrossRef]
  20. Liu, W.; Mo, X.; Liu, S.; Lu, C. Impacts of climate change on grassland fractional vegetation cover variation on the Tibetan Plateau. Sci. Total Environ. 2024, 939, 173320. [Google Scholar] [CrossRef]
  21. Wang, Y.; Liu, Y.; Chen, P.; Song, J.; Fu, B. Interannual precipitation variability dominates the growth of alpine grassland above-ground biomass at high elevations on the Tibetan Plateau. Sci. Total Environ. 2024, 931, 172745. [Google Scholar] [CrossRef] [PubMed]
  22. Lin, X.; Zhao, H.; Zhang, S.; Singh, V.P.; Li, R.; Luo, M.; Wang, S.; Zhao, X.; Lv, S.; Chen, X. Global response of different types of grasslands to precipitation and grazing, especially belowground biomass. Agric. Ecosyst. Environ. 2024, 363, 108852. [Google Scholar] [CrossRef]
  23. Chen, B.; Jiapaer, G.; Yu, T.; Zhang, L.; Tu, H.; Liang, H.; Lin, K.; Ju, T.; Ling, Q. The role of climatic factor timing on grassland net primary productivity in Altay, Xinjiang. Ecol. Indic. 2023, 157, 111243. [Google Scholar] [CrossRef]
  24. Aditya, G.; Arjun, K.; Ganesh, T. Rodent communities in a neglected grassland landscape: Investigating species-specific responses of grassland rodents to habitat type and shrub presence. J. Arid. Environ. 2024, 222, 105156. [Google Scholar]
  25. Virve, S.; Tsipe, A.; Kaasik, A.; Meeli, M.; Tiit, T. Insect-pollinated plants are first to disappear from overgrowing grasslands: Implications for restoring functional ecosystems. Biol. Conserv. 2024, 291, 110457. [Google Scholar]
  26. Liu, J.; Hu, Y.; Lu, W. A review of research on the relationship between grasslands and human activities. Ecol. Indic. 2024, 165, 112178. [Google Scholar] [CrossRef]
  27. Rosenzweig, C.; Karoly, D.; Vicarelli, M.; Neofotis, P.; Wu, Q.; Casassa, G.; Menzel, A.; Root, T.L.; Estrella, N.; Seguin, B.; et al. Attributing physical and biological impacts to anthropogenic climate change. Nature 2008, 453, 353–357. [Google Scholar] [CrossRef] [PubMed]
  28. Xu, L.; Xu, Y.; Duan, J.; Wang, Y.; Yang, H. Assessing the spatial occupation and ecological impact of human activities in Chengguan district, Lhasa city, Tibetan Plateau. Sci. Rep. 2024, 14, 67. [Google Scholar]
  29. Zhen, J.; Wang, Y.; Tian, Y.; He, S.; Wang, J. Study on ecological environment effects of urban spatial expansion: Taking Inner Mongolia Hohhot City as an example. Geogr. Res. 2019, 38, 1080–1091. [Google Scholar]
  30. Lü, L.; Zhao, Y.; Chu, L.; Wang, Y.; Zhou, Q. Grassland coverage change and its humanity effect factors quantitative assessment in Zhejiang province, China, 1980–2018. Sci. Rep. 2022, 12, 288. [Google Scholar] [CrossRef]
  31. Wang, X.; Zheng, D.; Shen, Y. Land use change and its driving forces on the Tibetan Plateau during 1990–2000. Catena 2008, 72, 56–66. [Google Scholar] [CrossRef]
  32. Wang, X.; Yang, Y.; Zhang, H.; Zhang, H. Optimization of agricultural land use structure in reclamation area, Yili prefecture, Xinjiang. Resour. Sci. 2009, 31, 2024–2028. [Google Scholar]
  33. Feng, H.; Zhou, J.; Zhou, A.; Su, D.; Han, X.; Xiong, R. Co-evolution mechanism of grassland degradation and its belowground habitat under the influence of coal mining activities. Catena 2024, 241, 107997. [Google Scholar] [CrossRef]
  34. Han, Z.; Song, W.; Deng, X.; Xu, X. Grassland ecosystem responses to climate change and human activities within the Three-River Headwaters region of China. Sci Rep. 2018, 8, 9079. [Google Scholar] [CrossRef]
  35. Zhang, R.; Liang, T.; Guo, J.; Xie, H.; Feng, Q.; Aimaiti, Y. Grassland dynamics in response to climate change and human activities in Xinjiang from 2000 to 2014. Sci. Rep. 2018, 8, 2888. [Google Scholar] [PubMed]
  36. Li, S.; Zhang, Y.; Wang, Z.; Li, L. Mapping human influence intensity in the Tibetan Plateau for conservation of ecological service functions. Ecosyst. Serv. 2018, 30, 276–286. [Google Scholar] [CrossRef]
  37. Lu, J.; Wang, Y.; Liu, L. An evaluation of prairie ecosystem’s tourism value-a case study on sizi wang Banner of Inner Mongolia. Tour. Trib. 2006, 19, 69–74. [Google Scholar]
  38. Feng, Y.; Li, G. Interaction between urbanization and eco-environment in Tibetan Plateau. Acta Geogr. Sin. 2020, 75, 1386–1405. [Google Scholar]
  39. Zibibula, I.; Suriya, M.; Paxagul, A. The analysis of the comprehensive level coordination degree between the urbanization and eco-environment system in Aksu city. Geogr. Res. 2011, 30, 496–504. [Google Scholar]
  40. Zhang, M.; Wang, D. Measurement of the coupled relationship between urbanisation and ecological environment in Qinghai. Qinghai Soc. Sci. 2018, 38, 59–65. [Google Scholar]
  41. Török, P.; Penksza, K.; Tóth, E.; Kelemen, A.; Sonkoly, J.; Tóthmérész, B. Vegetation type and grazing intensity jointly shape grazing effects on grassland biodiversity. Ecol. Evol. 2018, 8, 10326–10335. [Google Scholar] [CrossRef] [PubMed]
  42. Cristina, H.J.; Martín, O. Effects of grazing intensity on plant richness and diversity: A meta-analysis. Oikos 2018, 127, 757–766. [Google Scholar]
  43. Qian, S.; Mao, L.X.; Hou, Y.Y.; Fu, Y.; Zhang, H.Z. Livestock carrying capacity and balance between carrying capacity of grassland with added forage and actual livestock in the Qinghai-Tibet Plateau. J. Nat. Resour. 2007, 22, 389–397. [Google Scholar]
  44. Li, Y.; Ji, J. Assessment of the productivity and livestock carrying capacity of Inner Mongolia grassland byregional scale modeling. J. Nat. Resour. 2004, 19, 610–616. [Google Scholar]
  45. Zanella, P.G.; Junior, L.H.P.D.G.; Pinto, C.E.; Baldissera, T.C.; Werner, S.S.; Garagorry, F.C.; Jaurena, M.; Lattanzi, F.A.; Sbrissia, A.F. Grazing intensity drives plant diversity but does not affect forage production in a natural grassland dominated by the tussock-forming grass Andropogon lateralis Nees. Sci. Rep. 2021, 11, 16744. [Google Scholar] [CrossRef] [PubMed]
  46. Borer, E.T.; Seabloom, E.W.; Gruner, D.S.; Harpole, W.S.; Hillebrand, H.; Lind, E.M.; Adler, P.B.; Alberti, J.; Anderson, T.M.; Bakker, J.D.; et al. Herbivores and nutrients control grassland plant diversity via light limitation. Nature 2014, 508, 517–520. [Google Scholar] [CrossRef] [PubMed]
  47. Zeng, X.; Tang, K.; Lu, Y. Fence Effect: Property Division and Integrity of Grassland Ecosystem. China Population. Resour. Environ. 2014, 24, 88–93. [Google Scholar]
  48. Li, Y.; Dong, S.; Li, X.; Lu, W. Effect of grassland enclosure on vegetation composition and production in Head water of Yellow River. Acta Agrestia Sin. 2012, 20, 275–279. [Google Scholar]
  49. Shan, G.L.; Xue, S.M.; Chen, G.; Kuang, C.Y.; Liu, Z.L.; Chu, X.H. Influence of seasonal exclosure on vegetation restoration in typical steppe, Inner Mongolia. Acta Agrestia Sin. 2012, 20, 812–818. [Google Scholar]
  50. Chen, Q.; Shang, Y.; Zhu, R.; Bao, Q.; Lin, S. Long-term enclosure at heavy grazing grassland affects soil nitrification via ammonia-oxidizing bacteria in Inner Mongolia. Sci. Rep. 2022, 12, 464. [Google Scholar] [CrossRef] [PubMed]
  51. Huang, L.; Zhai, J.; Zhu, P.; Zheng, Y. Spatiotemporal evolution characteristics of livestock-carrying pressure in China and its implications for grassland ecosystem conservation pattern. Acta Geogr. Sin. 2020, 75, 2396–2407. [Google Scholar]
  52. Feng, B.; Liu, Y.Z.; Liu, W.T.; Lv, W.D.; Sun, C.C.; Yang, Z.Z.; Li, C.D.; Zhou, Q.Y.; Wang, F.C.; Yang, X.X.; et al. Soil physicochemical properties and plant functional traits regulate ecosystem multifunctionality of alpine grassland under different livestock grazing assemblies. Agric. Ecosyst. Environ. 2024, 366, 108947. [Google Scholar] [CrossRef]
  53. Liu, J.; Feng, C.; Wang, D.; Wang, L.; Wilsey, B.J.; Zhong, Z. Impacts of grazing by different large herbivores in grassland depend on plant species diversity. J. Appl. Ecol. 2015, 52, 1053–1062. [Google Scholar] [CrossRef]
  54. Wang, L.; Delgado-Baquerizo, M.; Wang, D.; Isbell, F.; Liu, J.; Feng, C.; Liu, J.; Zhong, Z.; Zhu, H.; Yuan, X.; et al. Multidiversity and multifunctionality in managed grasslands. Proc. Natl. Acad. Sci. USA 2019, 116, 6187–6192. [Google Scholar] [CrossRef] [PubMed]
  55. Teague, R.; Kreuter, U. Managing Grazing to Restore Soil Health, Ecosystem Function, and Ecosystem Services. Front. Sustain. Food Syst. 2020, 4, 534187. [Google Scholar] [CrossRef]
  56. Yi, X.; Xu, Y. Urbanization in China’s Pastoral Regions since 2000: Review and Suggestions. Urban Plan. Forum 2021, 64, 60–66. [Google Scholar]
  57. Li, Y. Development History and Functional Evolution of Inner Mongolian Pastoral Towns in the Process of Urbanisation. Gansu Theory Res. 2014, 23, 170–173. [Google Scholar]
  58. Meng, C.; Chen, H. “The interactive community of urban and pastoral areas”: The compression of time and space in the dual society of Inner Monglia cities pastoral areas. J. Qinghai Minzu Univ. (Soc. Sci.) 2020, 46, 99–103. [Google Scholar]
  59. Dai, Z.; Min, W.; Cai, R.; Deng, A. The practical alternative of the modernization and sustainable development of western minority pastoral areas-pastoral area township construction. J. Northwest Minzu Univ. (Philos. Soc. Sci.) 2006, 28, 99–103. [Google Scholar]
  60. Wang, L.; Zhao, M. Spatial pattern of urbanization in China’s pastoral areas-the case of Xilinguole Meng. Urban Plan. Forum 2013, 56, 40–46. [Google Scholar]
  61. Liao, W.; Qin, K.; Tong, T.; Peng, T. Coupling relationship between urbanization and forest ecological carrying capacity on the Yangtze River Economic Belt. J. Zhejiang AF Univ. 2019, 36, 349–358. [Google Scholar]
  62. Zhang, J.; Zhang, P.; Wang, R.; Liu, Y.; Lu, S. Identifying the coupling coordination relationship between urbanization and forest ecological security and its impact mechanism: Case study of the Yangtze River Economic Belt, China. J. Environ. Manag. 2023, 8, 118–327. [Google Scholar] [CrossRef] [PubMed]
  63. Wu, C. On the core of research in geography—A territorial system of human-earth relations. Econ. Geogr. 1991, 10, 1–6. [Google Scholar]
  64. Lewis, A. Economic Development with Unlimited Supplies of Labour. Manch. Sch. Econ. Soc. Stud. 1954, 22, 139–191. [Google Scholar] [CrossRef]
  65. Young, A. Learning by doing and the dynamic effects of international trade. NBER Work. Pap. Ser. 1991, 71, 3577. [Google Scholar]
  66. Myrdal, G. Economic Theory and Underdeveloped Regions; Harper & Row publishers: New York, NY, USA, 1957; p. 166. [Google Scholar]
  67. Wang, X.; Piesse, J. The Micro-foundations of dual economy models. Manch. Sch. 2013, 81, 80–101. [Google Scholar] [CrossRef]
  68. Chen, Z.; Li, D. A growth model of dual economy with endogenous agricultural technology progress—The re-analysis of ”East Asian Miracle” and Chinese economy. Econ. Res. J. 2004, 49, 16–27. [Google Scholar]
  69. Chen, Z.; Wang, F.; Li, S.; Feng, Y.; Chen, J. Classification of county leading function types and pattern recognition of its spatial structure based on multi-source data. J. Geo-Inf. Sci. 2021, 23, 2215–2231. [Google Scholar]
  70. Xie, G.D.; Zhang, C.X.; Zhang, L.M.; Chen, W.H.; Li, S.M. Improvement of the Evaluation Method for Ecosystem Service Value Based on Per Unit Area. J. Nat. Resour. 2015, 30, 1243–1254. [Google Scholar]
  71. Dong, Y.; Yan, H.; Du, W.; Hu, Y. Spatio-temporal analysis of grassland carrying capacity in Mongolian Plateau based on supply-consumption relationship. J. Nat. Resour. 2019, 34, 1093–1107. [Google Scholar] [CrossRef]
  72. Wang, F.; Liu, Y. Panel Granger Test on urban land expansion and fiscal revenuegrowth in China’s prefecture-level cities. Acta Geogr. Sin. 2013, 68, 1595–1606. [Google Scholar]
  73. Cui, X. Curve fitting of urbanization and air pollution in economic development of Hohhot city, Inner Mongolia. J. Arid. Land Resour. Environ. 2017, 31, 44–49. [Google Scholar]
  74. Shao, J.; Leng, J. Types and spatial pattern of coupling coordination between the new-type urbanization and eco-environment in Wuling Mountainous area of Hunan. Econ. Geogr. 2022, 42, 87–95. [Google Scholar]
  75. Liao, C. Quantitative judgement and classification system for coordinated development of environment and economy—A case study of the city group in the Pearl River Delta. Trop. Geogr. 1999, 19, 76–82. [Google Scholar]
  76. Marcus, C. Conservation policy and indigenous peoples. Environ. Sci. Policy 2004, 3, 145–153. [Google Scholar]
  77. Adams, W.M.; Hutton, J. People, Parks and Poverty: Political Ecology and Biodiversity Conservation. Conserv. Soc. 2007, 5, 147–183. [Google Scholar]
  78. Hou, L.; Xia, F.; Chen, Q.; Huang, J.; He, Y.; Rose, N.; Rozelle, S. Grassland ecological compensation policy in China improves grassland quality and increases herders’Income. Nat. Commun. 2021, 12, 4683. [Google Scholar] [CrossRef] [PubMed]
  79. Kurek, P.; Steppa, R.; Grzywaczewski, G.; Tryjanowski, P. The silence of the lambs? Plant diversity in abandoned sheep. Plant Soil Environ. 2016, 62, 1–8. [Google Scholar] [CrossRef]
Figure 1. Labor mobility mechanism model.
Land 13 00951 g001
Figure 2. Conceptual model of the coordination.
Land 13 00951 g002
Figure 3. Cities in Inner Mongolia and their five categories.
Land 13 00951 g003
Figure 4. Temporal changes in the coupling coordination index.
Land 13 00951 g004
Figure 5. Spatial evolution of the coupling coordination index.
Land 13 00951 g005
Figure 6. Coordination status of central service cities.
Land 13 00951 g006
Figure 7. Coordination status of resource-based cities.
Land 13 00951 g007
Figure 8. Coordination status of agro-pastoral cities.
Land 13 00951 g008
Figure 9. Coordination status of ecological cities.
Land 13 00951 g009
Table 1. Comprehensive evaluation indicators and weights for urban development level.
First Level IndicatorAHP WeightsEntropy
Weights
Combined WeightsSecond Level IndicatorAHP WeightsEntropy
Weights
Combined Weights
Population Dimension0.13350.21030.1124Population Density (km2/person)0.3333 0.5156 0.3474
Urban Population Ratio (%)0.6667 0.4844 0.6526
Economic Dimension0.33470.20620.2763GDP per Capita (CNY 10,000/person)0.2744 0.2408 0.3321
GDP of Secondary and Tertiary Industries (CNY 10,000)0.2559 0.1365 0.1757
Fiscal revenue as a share of regional GDP (%)0.1388 0.1536 0.1072
Total investment in fixed assets of the whole society (million CNY)0.1348 0.2512 0.1702
Balance of personal savings deposits 0.1961 0.2178 0.2735
Spatial
Dimension
0.22000.31760.2796Urban Construction Area (km2)1.0000 1.0000 1.0000
Social
Dimension
0.31160.26590.3316Disposable Income Per Capital (CNY)0.4559 0.3536 0.4866
Number of beds in health institutions per 10,000 population (beds)0.3073 0.2407 0.2234
Total retail sales of consumer goods (CNY 10,000)0.2368 0.4057 0.2900
Table 2. Comprehensive evaluation indicators and weights for ecological environment.
First Level IndicatorAHP WeightsEntropy
Weights
Combined WeightsSecond Level IndicatorAHP WeightsEntropy
Weights
Combined Weights
Ecosystem structure0.2352 0.2142 0.2123 Grassland coverage rate (%) (+)0.2875 0.0545 0.0913
Forest coverage rate (%) (+)0.1760 0.3973 0.4074
Percentage of agricultural land (%) (+)0.1333 0.1087 0.0607
Percentage of bare land (%) (+)0.1389 0.3558 0.2879
Vegetation cover index (+)0.2644 0.0837 0.0607
Ecosystem
function
0.2291 0.6339 0.6119 Ecological space share (%) (+)0.4905 0.1233 0.2155
Value of ecosystem services ($) (+)0.1976 0.4671 0.3291
Grassland resource availability (kg/m2) (+))0.3119 0.4096 0.4554
Ecosystem pressure0.3739 0.0808 0.1274 Consumption of grassland resources (gc/m2) (−)0.2399 0.2569 0.2552
Grassland carrying pressure index (−)0.4331 0.2127 0.3815
PM₂.₅ concentration (µg/m3) (−)0.1275 0.2515 0.1328
CO₂ emission intensity (10,000 tons) (−)0.1996 0.2789 0.2305
Ecosystem
landscape
0.1618 0.0711 0.0485 Landscape fragmentation (−)0.3482 0.4263 0.4831
Landscape connectivity (+)0.4913 0.2017 0.3225
Landscape diversity (+)0.1605 0.3721 0.1944
Table 3. Classification intervals and types of coupling coordination degree between urban development and ecological environment.
D-Value IntervalTypesU(x) − E(y)Specific TypesEncodings
0 < D < 0.2Heavily disordered couplingU(x) − E(y) > 0.15Ecological lagging type (1)A1
−0.15 < U(x) − E(y) < 0.15Urban development and ecosystem synchronization type (2)A2
U(x) − E(y) < 0.15Lagging urban development (3)A3
0.2 < D ≤ 0.3Moderately dysfunctional couplingU(x) − E(y) > 0.15Ecological lagging type (1)B1
−0.15 < U(x) − E(y) < 0.15Urban development and ecosystem synchronization type (2)B2
U(x) − E(y) < 0.15Lagging urban development (3)B3
0.3 < D ≤ 0.4Mildly dysfunctional couplingU(x) − E(y) > 0.15Ecological lagging type (1)C1
−0.15 < U(x) − E(y) < 0.15Urban development and ecosystem synchronization type (2)C2
U(x) − E(y) < 0.15Lagging urban development (3)C3
0.4 < D ≤ 0.5Mildly coordinated couplingU(x) − E(y) > 0.15Ecological lagging type (1)D1
−0.15 < U(x) − E(y) < 0.15Urban development and ecosystem synchronization type (2)D2
U(x) − E(y) < 0.15Lagging urban development (3)D3
0.5 < D ≤ 0.6Moderately coordinated couplingU(x) − E(y) > 0.15Ecological lagging type (1)E1
−0.15 < U(x) − E(y) < 0.15Urban development and ecosystem synchronization type (2)E2
U(x) − E(y) < 0.15Lagging urban development (3)E3
0.6 < D ≤ 0.8Good coordinated couplingU(x) − E(y) > 0.15Ecological lagging type (1)F1
−0.15 < U(x) − E(y) < 0.15Urban development and ecosystem synchronization type (2)F2
U(x) − E(y) < 0.15Lagging urban development (3)F3
0.8 < D ≤ 1Optimal
coordinated coupling
U(x) − E(y) > 0.15Ecological lagging type (1)G1
−0.15 < U(x) − E(y) < 0.15Urban development and ecosystem synchronization type (2)G2
U(x) − E(y) < 0.15Lagging urban development (3)G3
Table 4. Stationarity test (ADF) results.
City TypesIndicatorsDifferencing OrdertpCritical ValueTest Results
1%5%10%
Central Service-OrientedU(x)1−168.8710.000−3.606−2.937−2.607smooth
E(y)1−83.770.000−3.606−2.937−2.607smooth
Resource-Oriented U(x)1−7.3500.000−3.548−2.913−2.594smooth
E(y)1−4.5270.000−3.558−2.917−2.596smooth
Agro-Pastoral-OrientedU(x)1−5.8900.000−3.516−2.899−2.587smooth
E(y)1−3.4530.009−3.525−2.903−2.589smooth
Ecology-OrientedU(x)1−8.6350.000−3.542−2.910−2.593smooth
E(y)1−8.3420.000−3.542−2.910−2.593smooth
Table 5. Granger causality test results.
City TypesNull HypothesisFpLag OrderResult
Central Service-Oriented2000–2020
U(x) → E(y)
37.0460.0001The changes in urban development levels are Granger causes of ecological environment changes
Resource-Oriented2000–2020
U(x) → E(y)
130.7990.0001The changes in urban development levels are Granger causes of ecological environment changes
Agro-Pastoral-Oriented2000–2020
U(x) → E(y)
28.0550.0001The changes in urban development levels are Granger causes of ecological environment changes
Ecology-Oriented2000–2020
U(x) → E(y)
0.3410.5621The changes in urban development levels are not Granger causes of ecological environment changes
Table 6. U(x) − E(y) values, and determination of coupling coordination development types.
No.City2000Types2005Types2010Types2015Types2020Types
1Huhhot0.478101562F10.545443228E10.612565038F10.652946196F10.635166137F1
2Chifeng−0.002279604E2−0.074698213E20.033227554E2−0.001134028E20.147162407F2
3Baotou0.624002356F10.665921385F10.642652089F10.484960664F10.512531568F1
4Ordos0.123578716F20.231615643F10.302689774F10.331457142F10.45317088F1
5Wuhai0.234871206E10.240242762E10.254199941E10.219483642E10.173454769E1
6Tongliao−0.283857897G3−0.383302373F3−0.351046059F3−0.430041101F3−0.474223258F3
7Bayannur−0.158717339E3−0.237825584E3−0.125625359E2−0.178029956E3−0.084915776F2
8Hinggan0.046637747D2−0.035506591D20.118909796D20.10323715D20.083571237D2
9Ulanqab−0.032473004E2−0.09106178D2−0.039710289D2−0.069233193D2−0.021031447E2
10Hulunbuir−0.143424036D2−0.232449655C3−0.199354601C3−0.218836814C3−0.144371376D2
11Xilinguol−0.126346364D2−0.108716179D2−0.067531285D2−0.101234641D20.022221211E2
12Alax0.1063455E20.04763847E20.05459179E2−0.041661334E2−0.043627434E2
Disclaimer/Publisher’s Note: The statements, opinions and data contained in all publications are solely those of the individual author(s) and contributor(s) and not of MDPI and/or the editor(s). MDPI and/or the editor(s) disclaim responsibility for any injury to people or property resulting from any ideas, methods, instructions or products referred to in the content.

