Article

A Spatio-Temporal Examination of Land Use and Land Cover Changes in Smart Cities of the Delhi–Mumbai Industrial Corridor

by
Arun Kanchan
1,*,
Vilas Nitivattananon
1,
Nitin K. Tripathi
2,
Ekbordin Winijkul
3 and
Ranadheer Reddy Mandadi
2
1
Urban Innovation and Sustainability, Asian Institute of Technology, Khlong Luang 12120, Thailand
2
Remote Sensing and Geographic Information Systems, Asian Institute of Technology, Khlong Luang 12120, Thailand
3
Environmental Engineering and Management, Khlong Luang 12120, Thailand
*
Author to whom correspondence should be addressed.
Land 2024, 13(7), 957; https://doi.org/10.3390/land13070957
Submission received: 15 May 2024 / Revised: 21 June 2024 / Accepted: 24 June 2024 / Published: 29 June 2024
(This article belongs to the Special Issue Applying Earth Observation Data for Urban Land-Use Change Mapping)

Abstract

:
This study provides a detailed analysis of land use and land cover (LULC) changes at the district level within the Delhi–Mumbai Industrial Corridor (DMIC) from 2001 to 2021. Using the Indian Meteorological Department’s sub-divisional framework and MODIS data across seven primary LULC classes, the analysis is instrumental in informing infrastructure planning for existing and future smart cities and industrial clusters within the DMIC. The key findings reveal a yearly increase of 3031.40 sq. km. per year in agricultural land, with decreases in shrubland, grassland, and bareland of −1774.72 sq. km. per year, −1119.62 sq. km. per year, and −203.76 sq. km. per year, respectively. On the other hand, forests grew by a modest 148.14 sq. km. per year, while waterbodies and built-up lands saw minor increases of 55.73 sq. km. and 21.48 sq. km. per year. Ecologically Sensitive Areas (ESAs) were evaluated for LULC changes. The smart cities of Pune and Thane serve as excellent examples of balanced urban development and natural growth management. However, the study also highlights the need for further research to investigate LULC impacts on climatic variables, advocating for a regional planning approach in the DMIC.

1. Introduction

The Delhi–Mumbai Industrial Corridor (DMIC) stands as a testament to India’s commitment to economic growth and sustainable development. It is a monumental infrastructure project, one of the country’s largest and most ambitious, to foster economic growth and sustainable development in the region (NICDC, 2021) [1]. Spanning over 1483 km and encompassing several states and Union Territories (UTs), this mega-regional project holds immense potential to impact existing land use and land cover significantly (LULC), as well as climatology in the affected areas (Jain, 2014; Jain, 2021) [2,3].
The zone of influence (ZoI) encompasses eight states and three Union Territories (UTs), covering fourteen Indian Meteorological Department (IMD) sub-divisions, as shown in Table 1. It also encompasses 24 smart cities under the Smart Cities Mission (SCM) program [4] and 121 other districts. The plan for the ZoI includes investment regions (minimum 200 sq. km.) and industrial areas (minimum 100 sq. km.), integrated with road and rail for freight transit. These investment regions and investment areas are estimated to generate 3500 sq. km. of built-up land, excluding supporting feeder roads and infrastructure.
The DMIC aims to foster regional economic growth by maximizing existing capacities and improving the investment climate by developing supportive, long-term infrastructure. The Government of India (GoI, 2007) [5] has planned a project area with a potential zone of influence (ZoI) of 150 to 200 km on either side of the Western Dedicated Freight Corridor (WDFC).
The DMIC’s topographical and climatic diversity necessitates a methodological approach that transcends state or UT administrative boundaries for analysis. The IMD sub-divisions offer a suitable framework for this purpose, providing a uniform basis for facilitating a more accurate assessment of local ecosystems and climate changes in the 14 sub-divisions and the UT of Dadra and Nagar Haveli within the DMIC. Identifying sub-division-specific impacts of LULC changes enables policymakers to craft policies addressing the impact of environmental dynamics and infrastructural development on the region’s ecological and socio-economic systems.
Under the SCM in India, a city qualifies as “smart” by meeting several critical indicators and criteria focused on sustainable and inclusive development. Launched in June 2015, the SCM aims to leverage technology to enhance citizens’ quality of life and economic prospects, emphasizing sustainable environment practices such as waste management and energy efficiency. The integration of comprehensive urban planning, focusing on land use and spatial planning, ensures balanced regional development. These criteria collectively contribute to creating technologically advanced, environmentally sustainable, and socially inclusive urban spaces. Therefore, evaluating existing smart cities within the DMIC for baseline LULC conditions and changes is critical.
Upon its full development, experts classify the DMIC as a mega-region [6], encompassing mega-cities like Delhi and Mumbai (with populations exceeding 10 million) and cities poised to become mega-cities by 2030, such as Ahmedabad, in addition to various smaller townships and rural agricultural zones. Experts anticipate that the DMIC’s development will catalyze substantial economic growth, urbanization, and industrialization in the forthcoming decades.

1.1. Remote Sensing and GIS in LULC Studies

Previous studies have demonstrated the utility of remote sensing in analyzing urban sprawl, particularly in Ajmer City, revealing key metrics and relationships essential for environmental monitoring. These studies have used metrics to understand urban expansion and its environmental impact (Jat et al., 2008) [7]. MODIS has significantly contributed to environmental studies, with refinements in data collection and analysis methods enhancing our understanding of land surface dynamics. The improvements in MODIS data provide a clearer picture of land cover changes over time (Sulla-Menashe et al., 2019) [8]. Lal et al. (2022) [9] highlighted the effects of LULC changes on hydro-climatic variables, noting significant cooling impacts in major regions and variations in the atmosphere’s lower boundary. The study emphasizes the importance of monitoring these changes for better climate predictions.
In an urban context, Mathan and Krishnaveni (2019) [10] observed substantial urban expansion in the Chennai Metropolitan Area, with marked decreases in green areas and waterbodies, as seen in other global urbanization trends. Urbanization has resulted in significant environmental changes, particularly affecting surface air temperature and contributing to the cooling impacts observed in Chennai. The study showcases how urban expansion modifies local climate conditions. Similarly, Sahana, Ahmed, and Sajjad (2016) [11] analyzed the Sundarban Biosphere Reserve, finding that land cover shifts led to increased surface temperatures, a pattern echoed by Nayak (2021) [12] in central India, where changes favored agricultural and dense forests over small vegetation lands and open forests.
While these urban studies provide critical insights into urban expansion and its environmental consequences, comparable studies are needed to understand similar impacts in a rapidly developing industrial corridor such as the DMIC.

1.2. LULC Change Dynamics in India

In recent years, research has focused on land use and land cover change (LULCC) across different regions of India, highlighting the spatio-temporal dynamics and environmental repercussions of such transformations. Duraisamy, Bendapudi, and Jadhav (2018) [13] investigated the semi-arid Mula Pravara river basin in Maharashtra, identifying significant LULCC driven by factors enhancing water resource access. Garai and Narayana (2018) [14] explored the Godavari basin’s LULC changes, highlighting significant environmental impacts from industrial activities. The satellite data revealed how industrial activities have altered land use and cover, leading to environmental degradation. Moulds, Buytaert, and Mijic´ (2018) [15] developed high-resolution land use/cover maps for India from 1960 to 2010, utilizing a regional change model informed by district-level data, marking a methodological advance in tracking LULCC.
These studies collectively paint a complex picture of LULC in India, reflecting both natural ecosystem alterations and anthropogenic influences, with varying implications for local and regional climates, hydrology, and biodiversity. Further, these regional studies underscore the varied drivers of LULC changes across different ecological zones in India. However, a gap remains in understanding these drivers within the context of mega-infrastructure projects like the DMIC.

1.3. Focused Studies on DMIC

Previous studies on the DMIC have utilized remote sensing techniques and geospatial analysis to evaluate impacts, emphasizing the importance of these tools for comprehensive assessments. This review is helpful and important for monitoring regional planning and development in the DMIC (Jain, 2014) [2]. Mukhopadhyay (2017) [6] evaluated the DMIC as a mega-region, emphasizing the use of various tools to assess the impacts of this extensive industrial corridor on regional development and environmental sustainability. The study underscores the DMIC’s role in restructuring spatial development and accelerating industrialization. Regional planning plays a crucial role in reducing spatial disparities, particularly in large cities where inadequate urban infrastructure often exacerbates inequalities. Evaluation tools have highlighted these disparities, providing insights for better urban planning and infrastructure development (Jain, 2019) [16].
Ramachandran (2019) [17] reviewed issues with intrastate corridor development, focusing on the utilization of evaluation tools to address challenges in planning and implementation. These tools are critical for overcoming obstacles and achieving effective development outcomes in intrastate corridors. Williams et al. (2019) [18] analyzed the implementation of the DMIC in Gujarat, restructuring spatial development to accelerate urbanization and industrialization. The study details significant changes in land use patterns, which are indicative of broader regional development strategies. The impact of urbanization on surface air temperature has been modeled using weather research and forecasting, which highlight the critical role of LULC changes in influencing temperature variability (Jain, 2021) [3].
Kumar and Sharma (2018) [19] investigated land transformation due to urbanization in the DMIC region, highlighting the rapid changes in land use driven by highway peripheral developments. The study emphasizes the need for effective land management to mitigate adverse environmental impacts. Biswas et al. (2019) [20] examined the LULC impact in the vicinity of industrial areas, employing spatio-temporal analysis to assess how industrialization has accelerated urban land cover changes globally and locally. The study provides a detailed temporal analysis of land cover changes, crucial for understanding urbanization trends.
Despite these prior studies, research focusing on LULC changes at the district level and implications for smart cities within the DMIC framework remains sparse.

1.4. Comparative Studies: DMIC and BRI

The DMIC in India benefits from land use research on international mega-projects such as China’s Belt and Road Initiative (BRI). While the BRI is significantly larger and transboundary and the DMIC is within India, both projects alter LULC in their respective zones of influence, especially due to the expected increase in built-up land and urbanization.
Recent BRI-related studies have increasingly focused on its impacts on land use land cover change (LULCC), trade, and ecosystem services across Central Asia, highlighting the multifaceted consequences of large-scale infrastructure projects. Zhang et al. (2022) [21] demonstrated that the Belt and Road Initiative (BRI) significantly influences agricultural land use, confirming earlier findings about the increase in trade activities and economic development driving land use changes. The study highlights the BRI’s role in reshaping agricultural landscapes and its broader economic implications. Complementing this perspective, Zhang et al. (2022) [22] explored the spatio-temporal dynamics of LULC in BRI regions, utilizing the Landscape Ecological Risk Index to assess how the initiative impacts land cover and ecological risks over time. The study provides a comprehensive analysis of ecological risks associated with the BRI, emphasizing the need for sustainable land management.
Adding a monitoring dimension, Naboureh et al. (2020) [23] reviewed the challenges associated with LULCC mapping in the China–Central Asia–West Asia Economic Corridor (a critical component of the BRI), emphasizing the need for improved methodologies to address issues in accuracy and consistency. The study highlights the importance of accurate mapping for effective land use planning and the development of robust environmental policies. Chen et al. (2018) [24] examined spatio-temporal changes in cultivated land in China, utilizing FAO statistics and GlobeLand30 data to highlight significant fluctuations in land use over recent decades. This analysis is crucial for understanding agricultural trends and planning for sustainable land management.
Dong et al. (2021) [25] analyzed the environmental and socioeconomic drivers of LUCC in the China–Mongolia–Russia Economic Corridor, identifying key factors influencing land use changes between 1992 and 2015. The study emphasizes the role of economic activities and policy decisions in shaping land use patterns. In a parallel vein, Zuo et al. (2020) [26] investigated the effects of land use changes on ecosystem services, quantifying significant changes and their implications for environmental sustainability. The study highlights the critical need to balance development and ecosystem conservation. Teo et al. (2019) [27] characterized how several types of infrastructure development affect other components of the Earth’s systems, including the atmosphere, hydrosphere, geosphere, and biosphere.
These BRI findings underscore the importance of monitoring and understanding LULC changes in large infrastructure projects. Lessons from BRI studies can inform the approach to analyzing and mitigating similar impacts within the DMIC.

1.5. Research Gap

Many LULC-based studies have been conducted in India, primarily focused on specific regions or smaller research areas. However, a comprehensive understanding of LULC changes across the entire DMIC, particularly concerning the impact of large-scale infrastructure development, is still lacking. As a significant economic corridor in India, it is crucial to study the changes in land use and their ecological impacts within the DMIC.
The primary objective of this study is to provide a comprehensive analysis of the current LULC patterns within the DMIC and to understand how these patterns have evolved over the last two decades. Additionally, the study aims to investigate the specific changes in LULC within the IMD sub-divisions of the DMIC to identify regional variations. Another key objective is to compare the LULC changes in smart cities with other districts within the DMIC, highlighting the impacts of urbanization and infrastructure development. Furthermore, the study looks at the Ecologically Sensitive Areas (ESAs) within the DMIC, thereby providing valuable insights for sustainable land use planning and policy formulation.
Despite prior studies, as detailed above, research focusing on LULC changes at the district level and implications for smart cities within the DMIC framework remains sparse. This gap highlights a critical need for detailed examination, particularly in understanding the spatio-temporal dynamics of large-scale infrastructure projects. This paper aims to fill the research gap by analyzing the baseline conditions in LULC in the DMIC before its significant and accelerated expansion over the next few decades. Accordingly, our study discusses the following:
  • What are the current LULC patterns within the DMIC, and how have they changed in the last two decades?
  • How have the IMD sub-divisions within the DMIC experienced changes in LULC?
  • How do changes in LULC in smart cities compare with other districts within the DMIC?
This research provides a baseline reference for land use decision-makers in the DMIC and equips them with the necessary insights to formulate effective land use development and optimization policies. By ensuring sustainable land use development and protecting the ecological environment, this study has the potential to significantly impact the DMIC’s future. Further, synthesizing the spatio-temporal dynamics documented in Indian contexts and comparative international projects like the BRI, this study contributes to understanding the relationship between large-scale infrastructure development and land use changes.

2. Materials and Methods
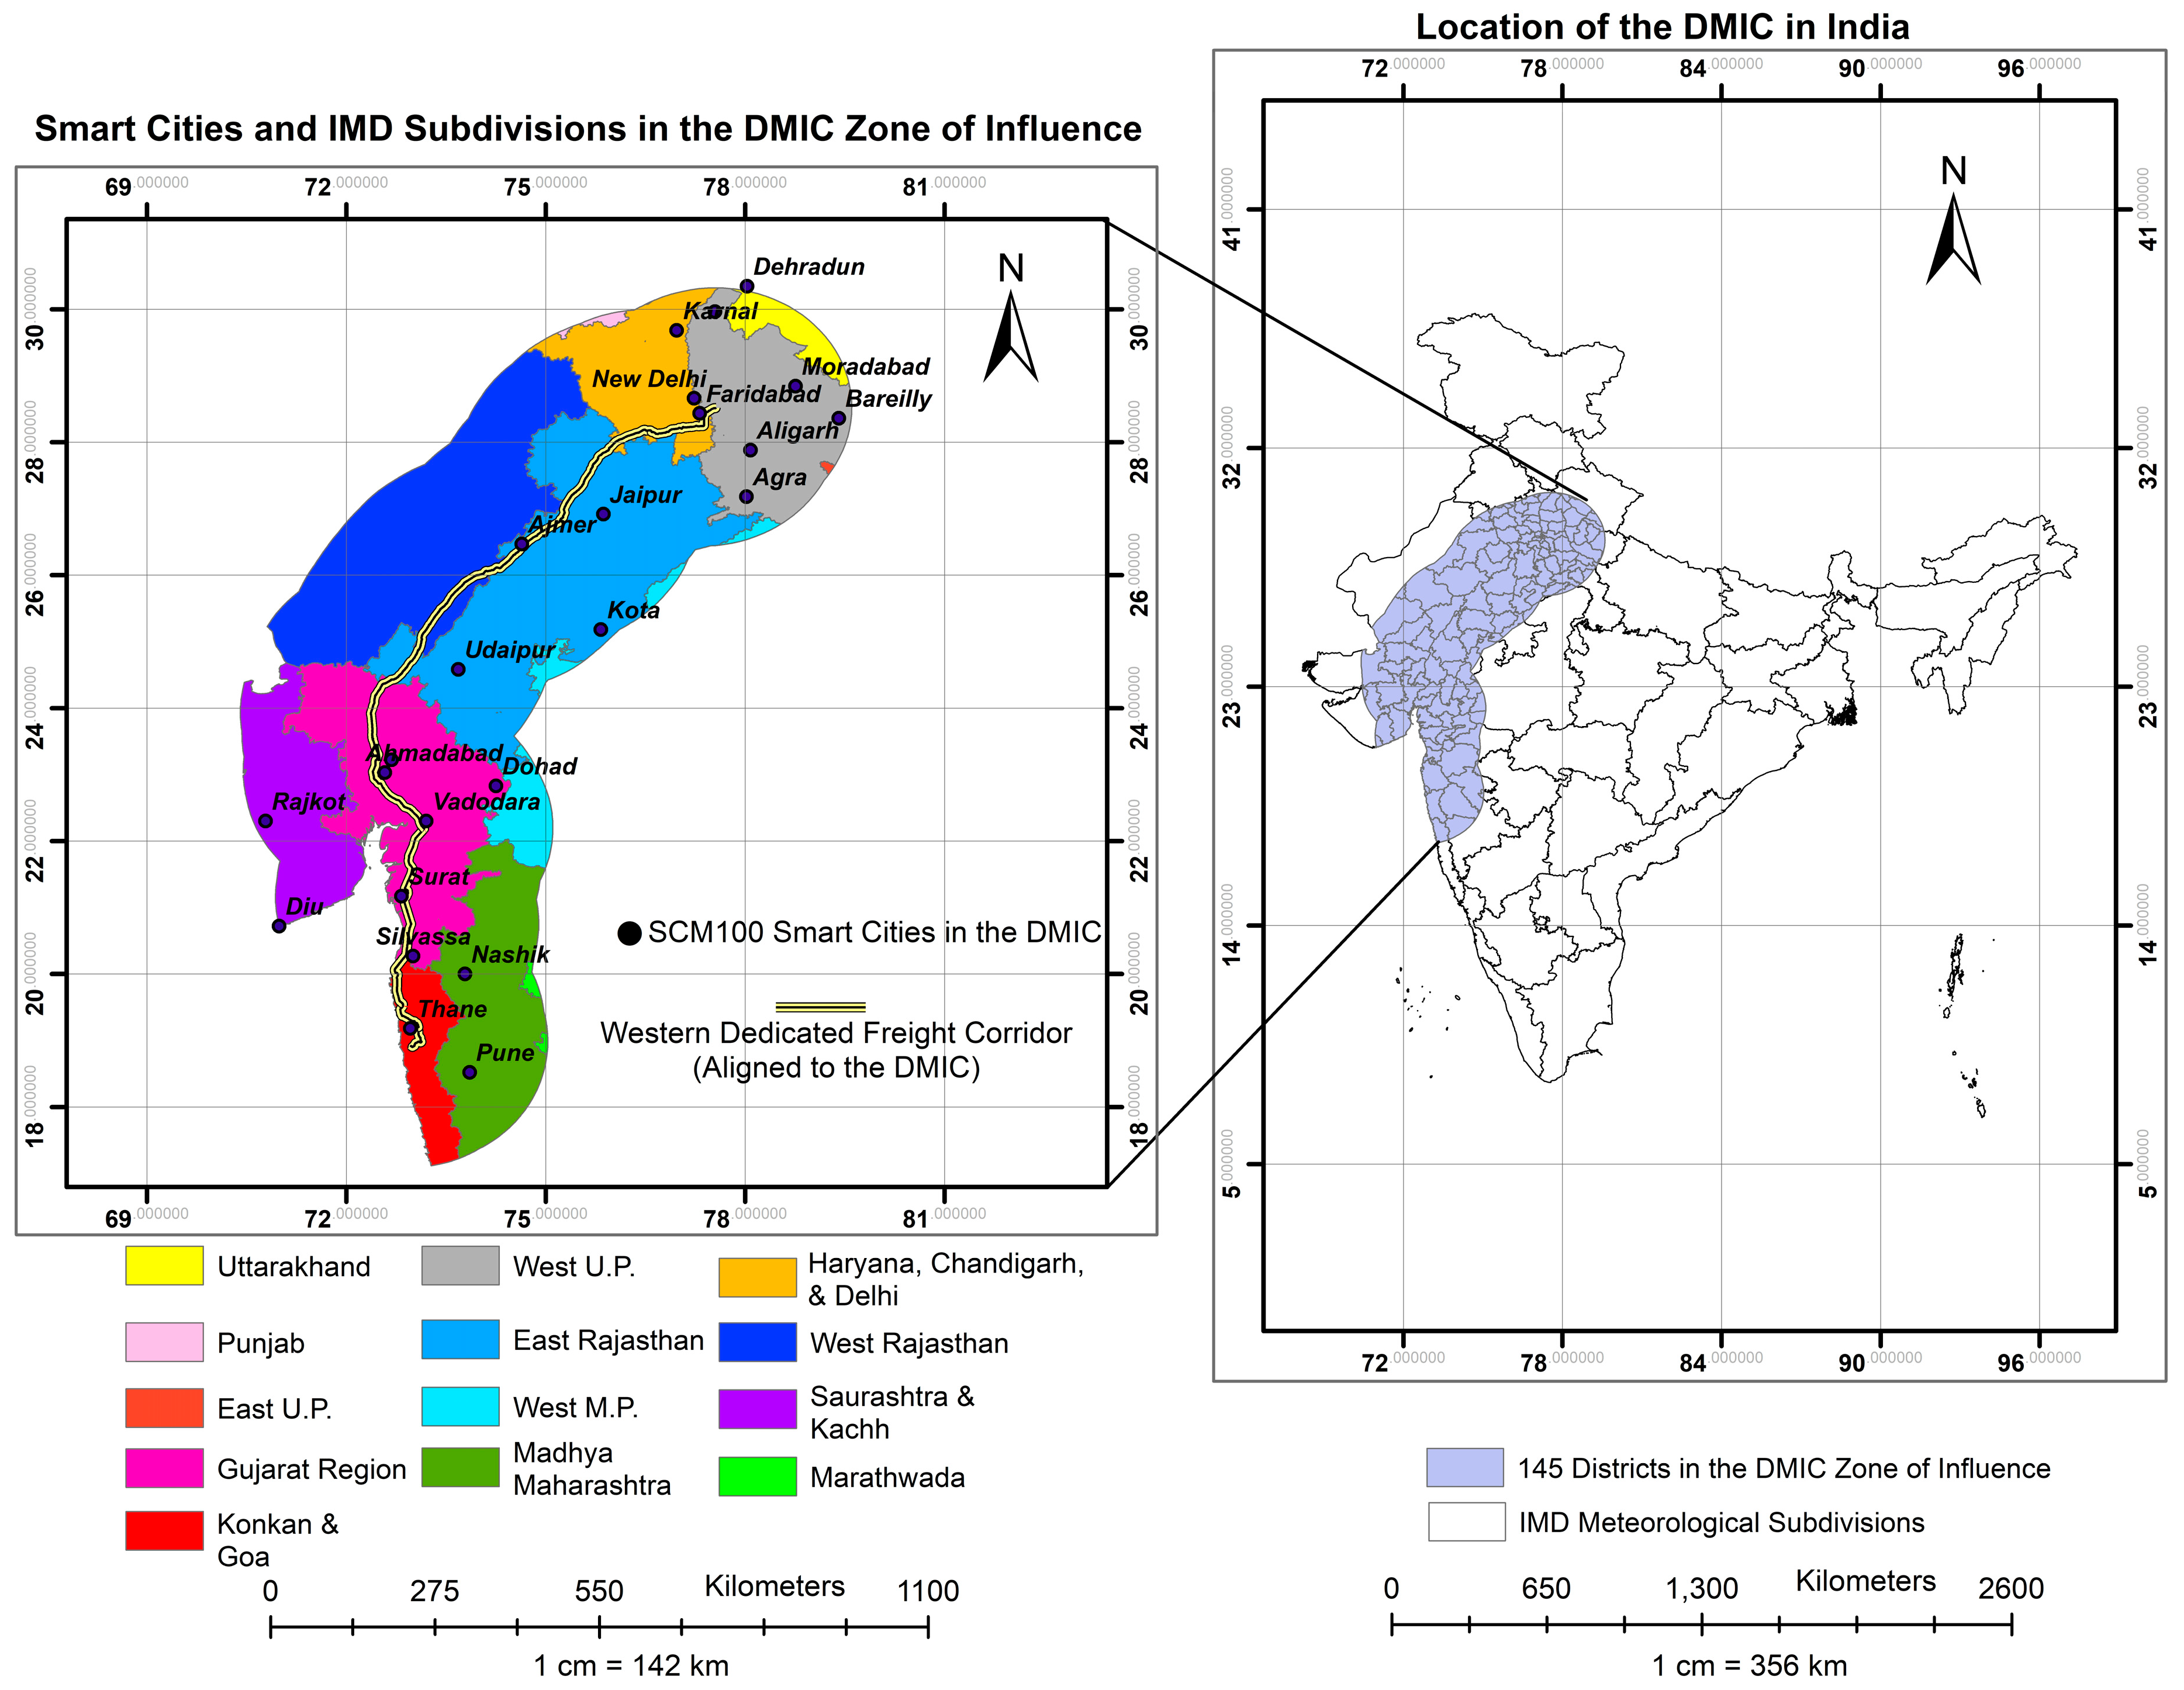
The inter-relationships between various LULC classes are complex, presenting challenges in identifying the most appropriate methods to analyze their connections over time (Hansen, 2013) [28]. Researchers have employed machine learning (ML) models to enhance the understanding of this relationship and the accuracy of LULC prediction. In the DMIC region, the study utilized various machine-learning models, notably the Support Vector Machine (SVM) (Cortes and Vapnik, 1995) [29], the Random Forest (Breiman, 2001) [30], and the Classification and Regression Tree (Breiman, 1984) [31]. This information can contribute to assessing the land allocation aspects of urban planning (Ouma, 2022) [32] and determining the priorities of different policy measures in retaining the overall ecological balance in the DMIC region.
The study employs these three advanced classification techniques to ensure the accuracy and reliability of the LULC classification results (Foody and Mathur, 2004; Congalton and Green, 2008) [33,34]. During ground truthing, multiple classifiers are tested separately to identify the most accurate individual classifier, thus improving overall prediction accuracy (Mountrakis et al., 2011) [35].
This study employs various frameworks and concepts to enhance the accuracy and reliability of LULC classification results. Key frameworks include using IMD sub-divisions as analytical units, which provide a uniform basis for assessing local ecosystems and climate changes at the district level. Integrating remote sensing and GIS techniques is central to this study, enabling detailed spatio-temporal analysis. Figure 1 displays the methodology flowchart, detailed in the following sections.

2.1. Study Area

The DMIC runs adjacent to the WDFC, connecting Dadri in the National Capital Region to Mumbai’s Jawaharlal Nehru Port, and is approximately 1483 km in length. As shown in Figure 2, the corridor lies between 17°13′ N and 30°17′ N latitude and between 70°22′ E and 79°18′ E longitude.
Regarding land mass, the DMIC covers an extensive region passing through states such as Gujarat, Haryana, Madhya Pradesh, Maharashtra, Uttar Pradesh, and Rajasthan. The ZoI of 647,627.75 sq. km. also includes portions of the UT of Daman and Diu, Dadra and Nagar Haveli, the National Capital Territory (NCT of Delhi), and parts of Uttarakhand and Punjab states. In terms of IMD sub-divisions under the ZoI, East Rajasthan (24.15% and 23 districts), West Rajasthan (14.29% and 7 districts), Gujarat Region (14.17% and 18 districts), West Uttar Pradesh (10.61% and 23 districts), and Madhya Maharashtra (10.22% and 8 districts) have the largest shares.
The region’s topography is diverse and includes parts of the Indo-Gangetic Plain, the Thar Desert, the Aravalli Range, and the Western Ghats. Major rivers, such as the Yamuna, Chambal, and Sabarmati, traverse the region. Additionally, a range of Ecologically Sensitive Areas, including national parks, wildlife sanctuaries, biosphere reserves, wetlands, rivers, grasslands, and coastal ecosystems, are bound by the DMIC. These areas span multiple districts and IMD sub-divisions, reflecting the region’s rich biodiversity and ecological significance. Effective conservation strategies and sustainable development practices are essential to protect these valuable natural resources while promoting economic growth within the DMIC. As the DMIC extends towards the south, the elevation decreases, and the corridor approaches the coastline of the Arabian Sea. Coastal areas within the DMIC’s ZoI include Mumbai and the Gulf of Khambhat in Gujarat.

2.2. Data Collection

We used Google Earth Engine (GEE) to acquire MODIS satellite imagery with a resolution of 500 m for the 20-year “lookback period” from 2001 to 2021. Concurrently, we sourced shapefiles delineating DMIC Buffer, District, and IMD sub-divisions through ArcGIS digitization.

2.3. Data Analysis Methods

The study employs machine learning models, notably the Support Vector Machine (SVM), the Random Forest (RF), and the Classification and Regression Tree (CART), to enhance the understanding and accuracy of LULC classification. Ground truthing was conducted using high-resolution base maps to validate the accuracy of the classifications, with a Kappa coefficient of 0.85 as the benchmark for acceptable agreement.

2.4. Study Process/Steps

2.4.1. Data Acquisition and Integration

We combined the processed satellite data with the digitized GIS data to create an integrated dataset, forming a comprehensive base for further analysis. GEE was used in this study as it offers a variety of tools and algorithms for image classification, change detection, time series analysis, and machine learning, making it an ideal platform for conducting comprehensive studies on land use and land cover changes, land surface temperature variations, and other environmental applications (Donchyts et al., 2016) [36]. The study used Land Cover Type 1 from the Annual International Geosphere-Biosphere Programme (Schneider et al., 2013; IGBP, 2022) [37,38]. LULC classes, measured in square kilometers, were derived from the MODIS data and aggregated from monthly to annual scales (Friedl et al., 2010) [39]. The observed seventeen LULC classes were compressed into seven classes critical for the baseline analysis (Congalton and Green, 2008) [34], as noted in Table 2.
The research derived seven classes from the original seventeen by combining similar land covers, as noted in the “Reclassification Description” column. Table 3 shows the combined LULC classes and the associated area in the DMIC ZoI.

2.4.2. Classifier Application

Three ML classifiers were applied to these seven classes to ensure the accuracy and reliability of the LULC classification results. These classifiers include SVM, RF, and CART. SVM is a supervised learning method for constructing optimal separating hyperplanes in multi-dimensional space. RF is an ensemble learning method that constructs multiple decision trees and combines their results to improve the overall prediction accuracy. CART is a decision tree-based classifier that recursively splits the dataset into subsets based on the most significant feature to minimize the Gini impurity.

2.4.3. Accuracy Assessment via Ground Truthing

Next, to validate the accuracy of the LULC classification, ground truthing was conducted using high-resolution base maps (Congalton and Green, 2008) [34]. This process involves comparing the classified satellite images with the reference data obtained from the ground or other reliable sources. Researchers evaluate the classification accuracy using measures like the Kappa coefficient (Jensen, 2005) [40], with a Kappa coefficient of 0.85 as the benchmark for acceptable agreement. Landis and Koch (1977) [41] and Congalton and Green (2008) [34] categorize a Kappa value above 0.80 as a high agreement and a value between 0.40 and 0.80 as moderate to substantial agreement. In this study, the Random Forest (RF) Kappa score of 0.88 surpassed those of SVM (0.86) and CART (0.84), leading to the selection of RF for further analysis.

2.5. Time-Series Trend Analysis

Using the LULC classified via RF, a time-series analysis [42] was run on the 2000–2021 period to detect trends in LULC changes. In the time-series trend analysis, we first applied the Mann–Kendall test to determine statistically significant trends in LULC, followed by Sen’s slope method to quantify the magnitude of these trends. The study conducted trend analysis for LULC changes across the DMIC ZoI, its 14 IMD sub-divisions, and 145 districts, which include 24 smart cities and 121 other districts. The utilization of the Mann–Kendall trend test and Sen’s slope estimator played a crucial role in the analysis of climatic trends, such as in identifying and measuring alterations in surface air temperatures, precipitation, and various ecological factors in diverse geographical areas. Notably, studies have shown their efficacy in investigating temperature and precipitation patterns in Iraq, uncovering statistically significant climatic fluctuations over time (Roboaa, 2015) [43]. Researchers utilized comparable approaches to assess temperature trends in Gombe State, addressing local climatic dynamics (Alhaji, 2018) [44]. The use of the Mann–Kendall test with innovative trend methodologies for water quality parameters in Turkey demonstrates the versatility and relevance of these techniques in environmental investigations (Kisi, 2014) [45].
Kendall’s tau and Sen’s slope (Sen, 1968) [46] are non-parametric statistical methods in time-series analysis, notably in environmental studies that handle non-normally distributed data or outliers. Kendall’s tau assesses the strength and direction of the monotonic relationship between two variables. A significant p-value indicates a monotonic trend. The tau value suggests the strength and direction of the LULC change trend—a positive value indicates an increasing trend, and a negative value indicates a decreasing trend. The study further employs Sen’s slope to estimate the magnitude of Kendall’s tau trend. This value, representing the median of all slopes between pairs of time points, offers a robust estimate of the rate of change over time. Table 4 displays a p-value and associated probabilities for evaluating Kendall’s tau significance. For each p-value noted in the table, a symbol (+, *, **, ***) has been assigned and used throughout Section 3.

3. Results

3.1. Overall LULC Changes in the DMIC ZoI

Our analysis of land use and land cover changes over two decades has provided valuable insights into the dynamics of different land use classes. The findings in Table 5 highlight important trends in LULC changes. Graphs for Sen’s slopes for the DMIC have been included in Supplementary Section A (Sen’s slope graphs for the DMIC, smart cities, and other districts). This section summarizes the results and discusses the following questions:
“What are the current LULC patterns within the DMIC, and how have they changed in the last two decades?”

3.1.1. Current LULC Patterns

In 2021, agricultural land is the largest LULC class with 514,503.25 sq. km, which is 79.44% of the total land mass of 647,627.75 sq. km. covered under the ZoI of the DMIC. Shrubland is the next-largest LULC class at 55,838.50 sq. km. (8.6% of total DMIC ZoI). Grassland is the third-largest LULC class with 37,446.25 sq. km. (5.78% of total DMIC ZoI). Built-up land with 13,892.75 sq. km. (2.15% of total DMIC ZoI), forests with 10,949.5 sq. km. (1.69% of total DMIC ZoI), and bareland with 10,916.5 sq. km. (1.69% of total DMIC ZoI) are the next-largest classes represented in the DMIC. The waterbody is the smallest LULC class with a total area of 4081.00 sq. km. (0.63% of total DMIC ZoI). The infrastructure developed under the DMIC program is estimated at a minimum of 3500 sq. km.—a significant addition of 25% over the current built-up area of 13,892.75 sq. km.
Therefore, agriculture dominates the current landscape of the DMIC. All other classes are significantly less and limited. Therefore, any greenfield infrastructural development must consider the paucity of natural land classes and the limited built-up land and waterbody areas.

3.1.2. Decadal Changes in LULC

Between 2001 and 2021, agriculture experienced a positive trend, with a Kendall’s tau of 0.676***, indicating a moderate, statistically significant correlation with an increase of 3031.40 sq. km. per year in the DMIC ZoI. Built-up areas (including urban) were the only category to demonstrate a perfect positive trend, with a Kendall’s tau of 1.0***, indicating a strong correlation that is statistically significant with an increase of 21.48 sq. km. per year. The waterbody exhibited a positive trend, with a Kendall’s tau of 0.619***, indicating a moderate, statistically significant correlation with an increase of 55.73 sq. km. per year. Forest areas exhibited a positive trend, with a Kendall’s tau of 0.343*, indicating a weak correlation that is statistically significant with an increase of 148.14 sq. km. per year.
During this period, bareland showed a negative trend, with a Kendall’s tau of −0.667***, indicating a moderate correlation that is statistically significant with a reduction of −203.76 sq. km. per year. Grassland revealed a negative trend, with a Kendall’s tau of −0.819***, indicating a strong correlation that is statistically significant with a reduction of −1119.62 sq. km. per year. Shrubland showed a negative trend, with a Kendall’s tau of −0.505***, indicating a moderate correlation that is statistically significant with a reduction of −1774.72 sq. km. per year.
Notably, all observed changes except for the forest category had p-values well below 0.001, indicating highly significant trends. The considerable expansion in agricultural land highlights the substantial impact of human intervention on land use patterns. The statistically significant negative trend in grassland and shrubland suggests conversions to other land uses due to agricultural expansion and increased built-up areas.
The reduction in bareland, alongside the increase in waterbodies, may reflect changes in land management practices, climate change impacts, or both. These shifts are essential for understanding ecological balances, water resource management, and conservation efforts. The strong positive correlation observed in urban built-up areas, with a statistically significant p-value, underscores the pace of urbanization requiring careful urban planning and policy interventions to mitigate environmental impacts.

3.1.3. Land Use Transfer Matrix

In addition to the time-series analysis, a correlation test was run to understand how land cover types relate over time. This provides insights into land use patterns and land cover change dynamics.
Understanding the relationships between different LULC classes is crucial for sustainable land management and planning. This study examines the land use transfer matrix for various LULC classes within the DMIC to identify significant direct and inverse relationships. The LULC classes analyzed include forest, shrubland, grassland, waterbody, agriculture, built-up, and bareland, as shown in Table 6 for the entire DMIC at a 95% confidence level.
The positive correlation between waterbody and agriculture (r = 0.676) indicates that regions with significant agricultural activities also have substantial waterbodies. This relationship highlights the importance of sustainable water management practices in agricultural areas to ensure water availability for crop production. The positive correlation between forests and built-up areas (r = 0.343) suggests a link between urban development in certain regions and forest conservation or afforestation efforts, albeit a weak association. This relationship might indicate a trend towards integrating green spaces within urban environments, focusing on sustainable urban planning practices.
Furthermore, the positive correlation between waterbody and built-up areas (r = 0.619) suggests that urban regions within the DMIC might be designed with waterbodies, possibly for aesthetic or recreational purposes. This trend may reflect efforts to incorporate natural water features into urban landscapes, contributing to improved urban livability and environmental quality. The positive correlation between grassland and bareland (r = 0.581) suggests that regions with significant grassland areas also tend to have considerable bareland. This relationship might indicate transitional zones where bareland is gradually converted to grassland or vice versa, underscoring the dynamic nature of land cover changes.
Conversely, the strong negative correlation between shrubland and agriculture (r = −0.829) indicates that an increase in agricultural activities is associated with a significant reduction in shrubland areas. This relationship underscores the pressure on shrubland ecosystems due to the expansion of agricultural lands, which can affect biodiversity and ecosystem services. Similarly, the strong negative correlation between grassland and built-up areas (r = −0.819) suggests that urban expansion is often at the expense of grassland. This highlights the competition between urban development and natural land covers, raising concerns about the loss of grassland habitats due to urbanization.
The negative correlation between grassland and waterbody (r = −0.648) indicates that increases in grassland areas are associated with decreases in waterbodies. This relationship might be due to land conversion practices affecting water retention or drainage patterns, emphasizing the need for integrated land and water management strategies. The negative correlation between bareland and agriculture (r = −0.552) suggests that areas with higher agricultural activities tend to have less bareland, reflecting the conversion of bareland to cultivated fields. This relationship indicates active land use changes aimed at increasing agricultural productivity but also points to potential land degradation issues if not managed sustainably.
Additionally, the negative correlation between shrubland and waterbody (r = −0.619) suggests that increased waterbodies are associated with reduced shrubland areas. This relationship could indicate the inundation of shrubland areas or changes in land use priorities that favor water retention and management over maintaining shrubland ecosystems.

3.2. LULC Changes in the IMD Sub-Divisions

The Sen’s slope for each LULC class within various IMD sub-divisions reflects the same general growth or decline patterns as the overall DMIC ZoI. Table 7 documents the LULC changes at the IMD sub-division level, where Kendall’s tau shows the statistical significance for each Sen’s slope listed. This section provides a summary of the results and discusses the following question:
“How have the IMD sub-divisions within the DMIC experienced changes in LULC?”
Highlights for each of the IMD sub-division LULC changes are noted below:
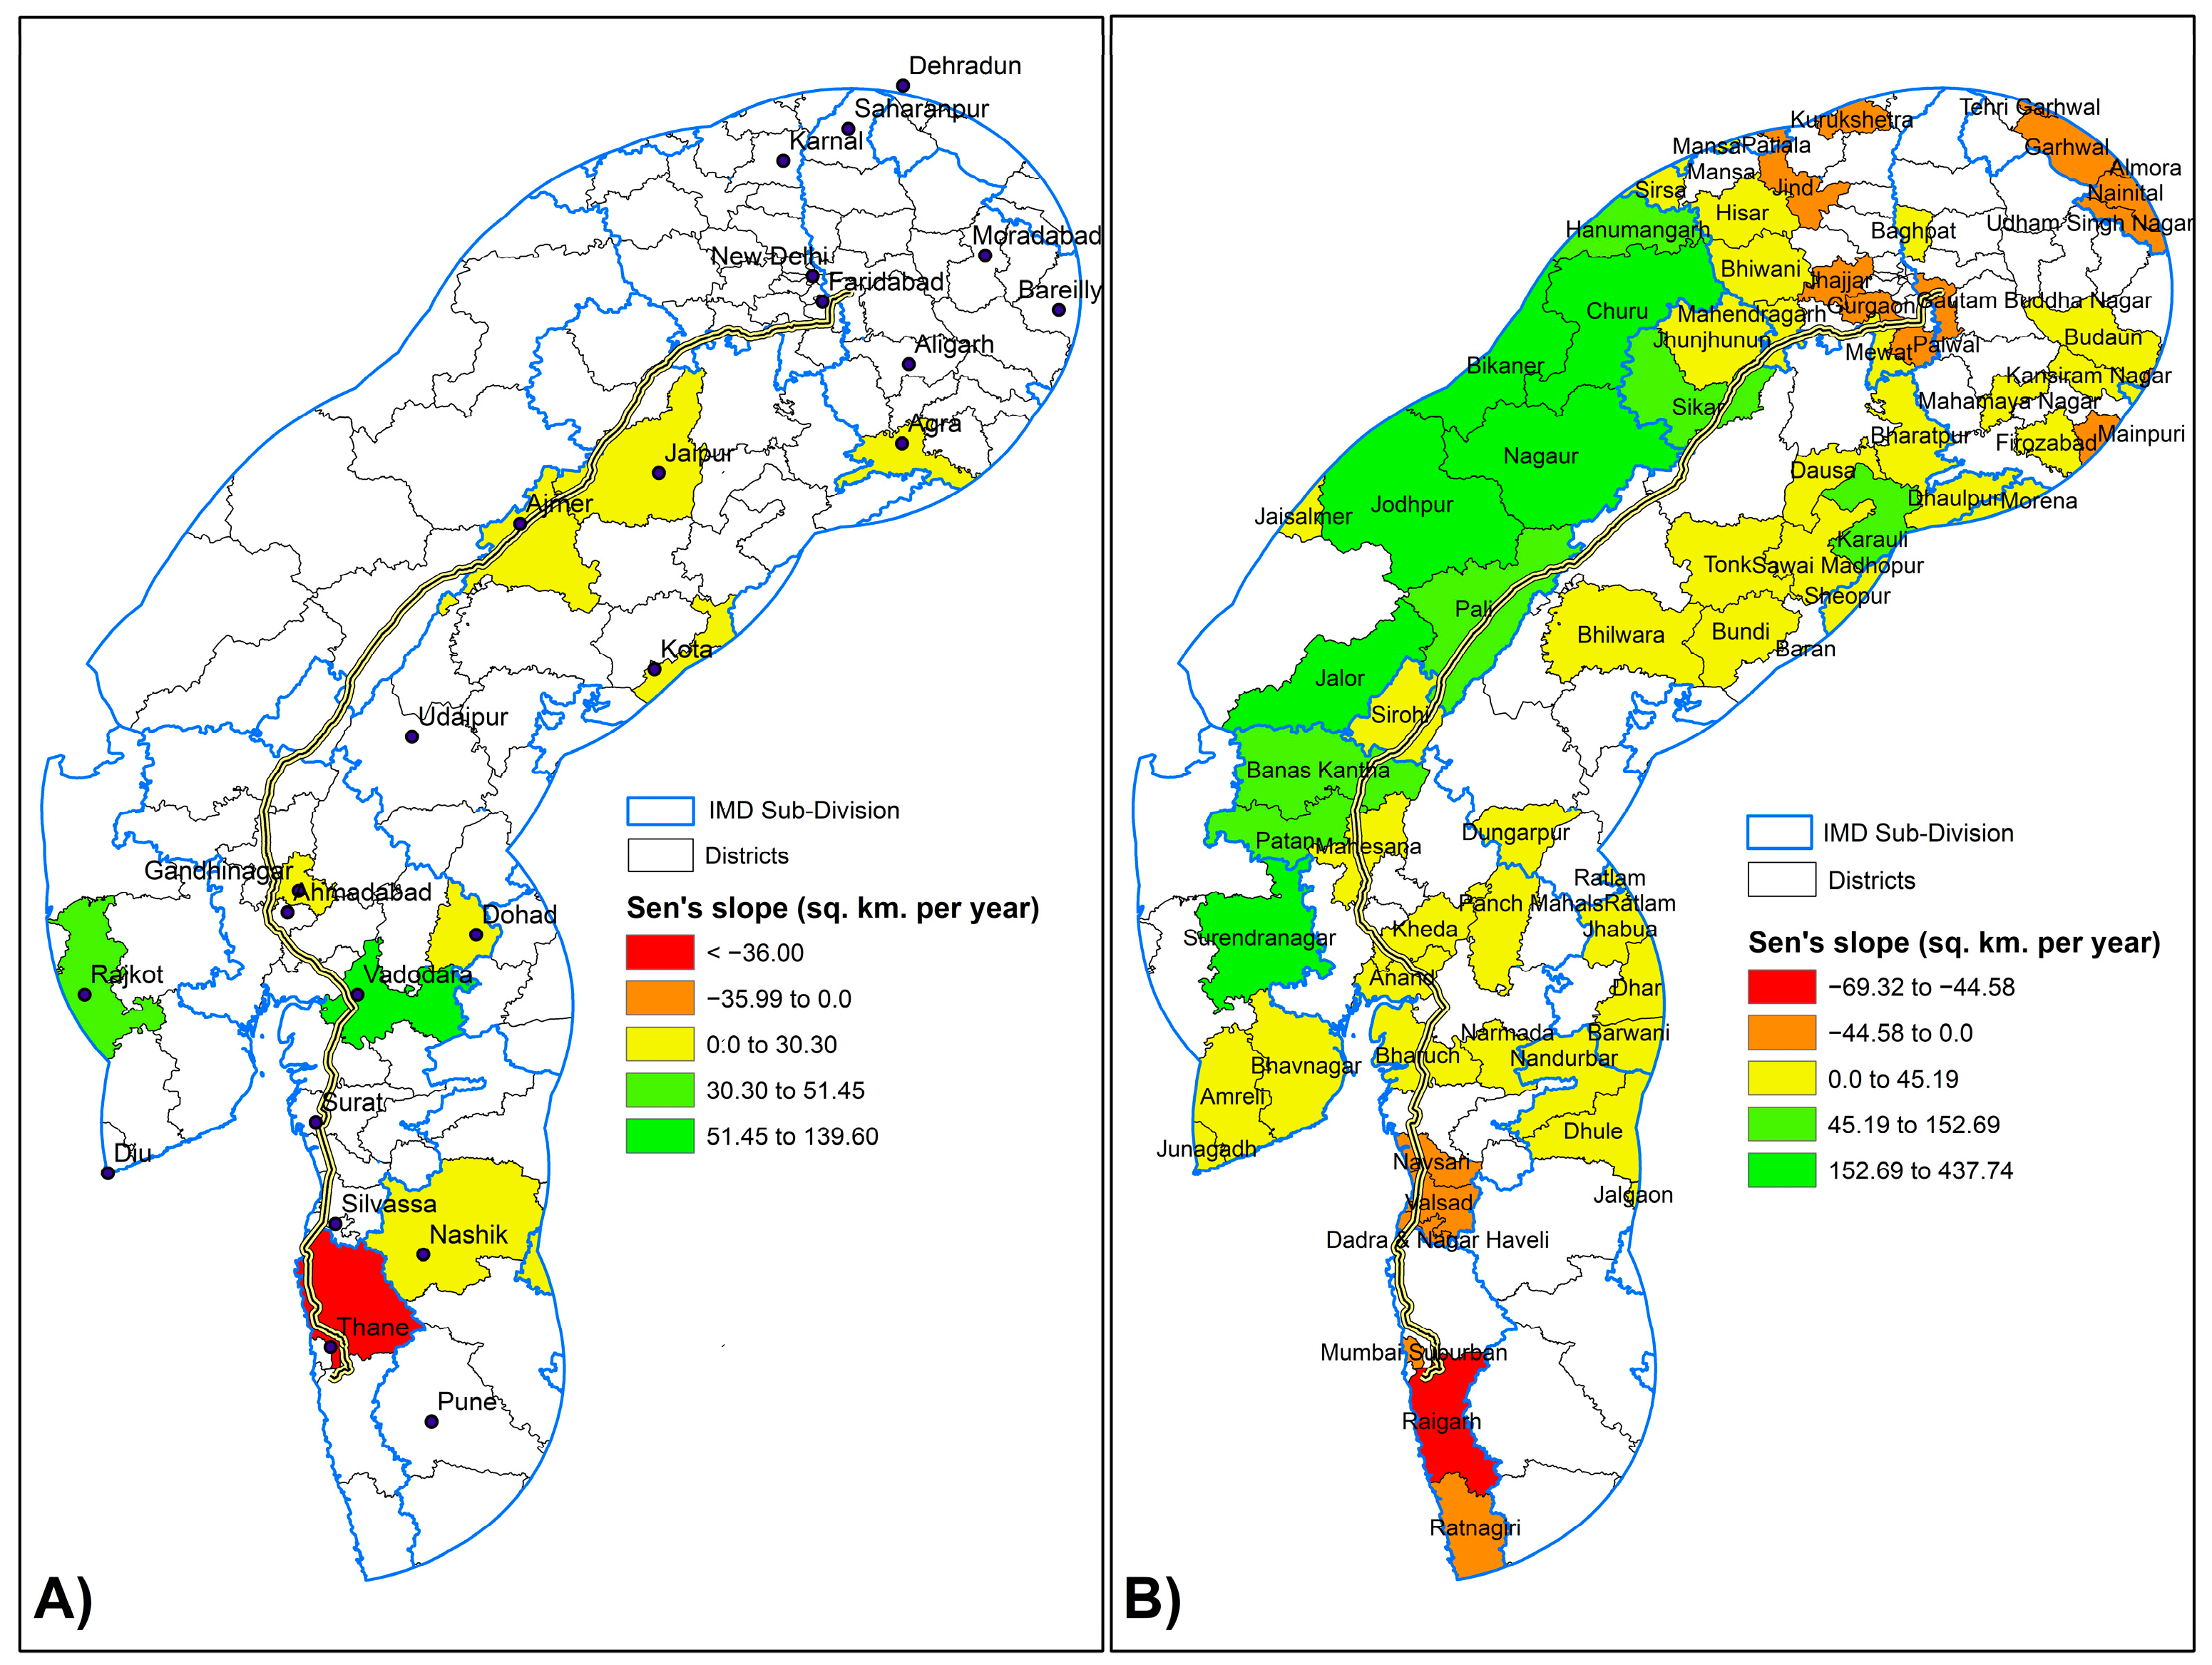
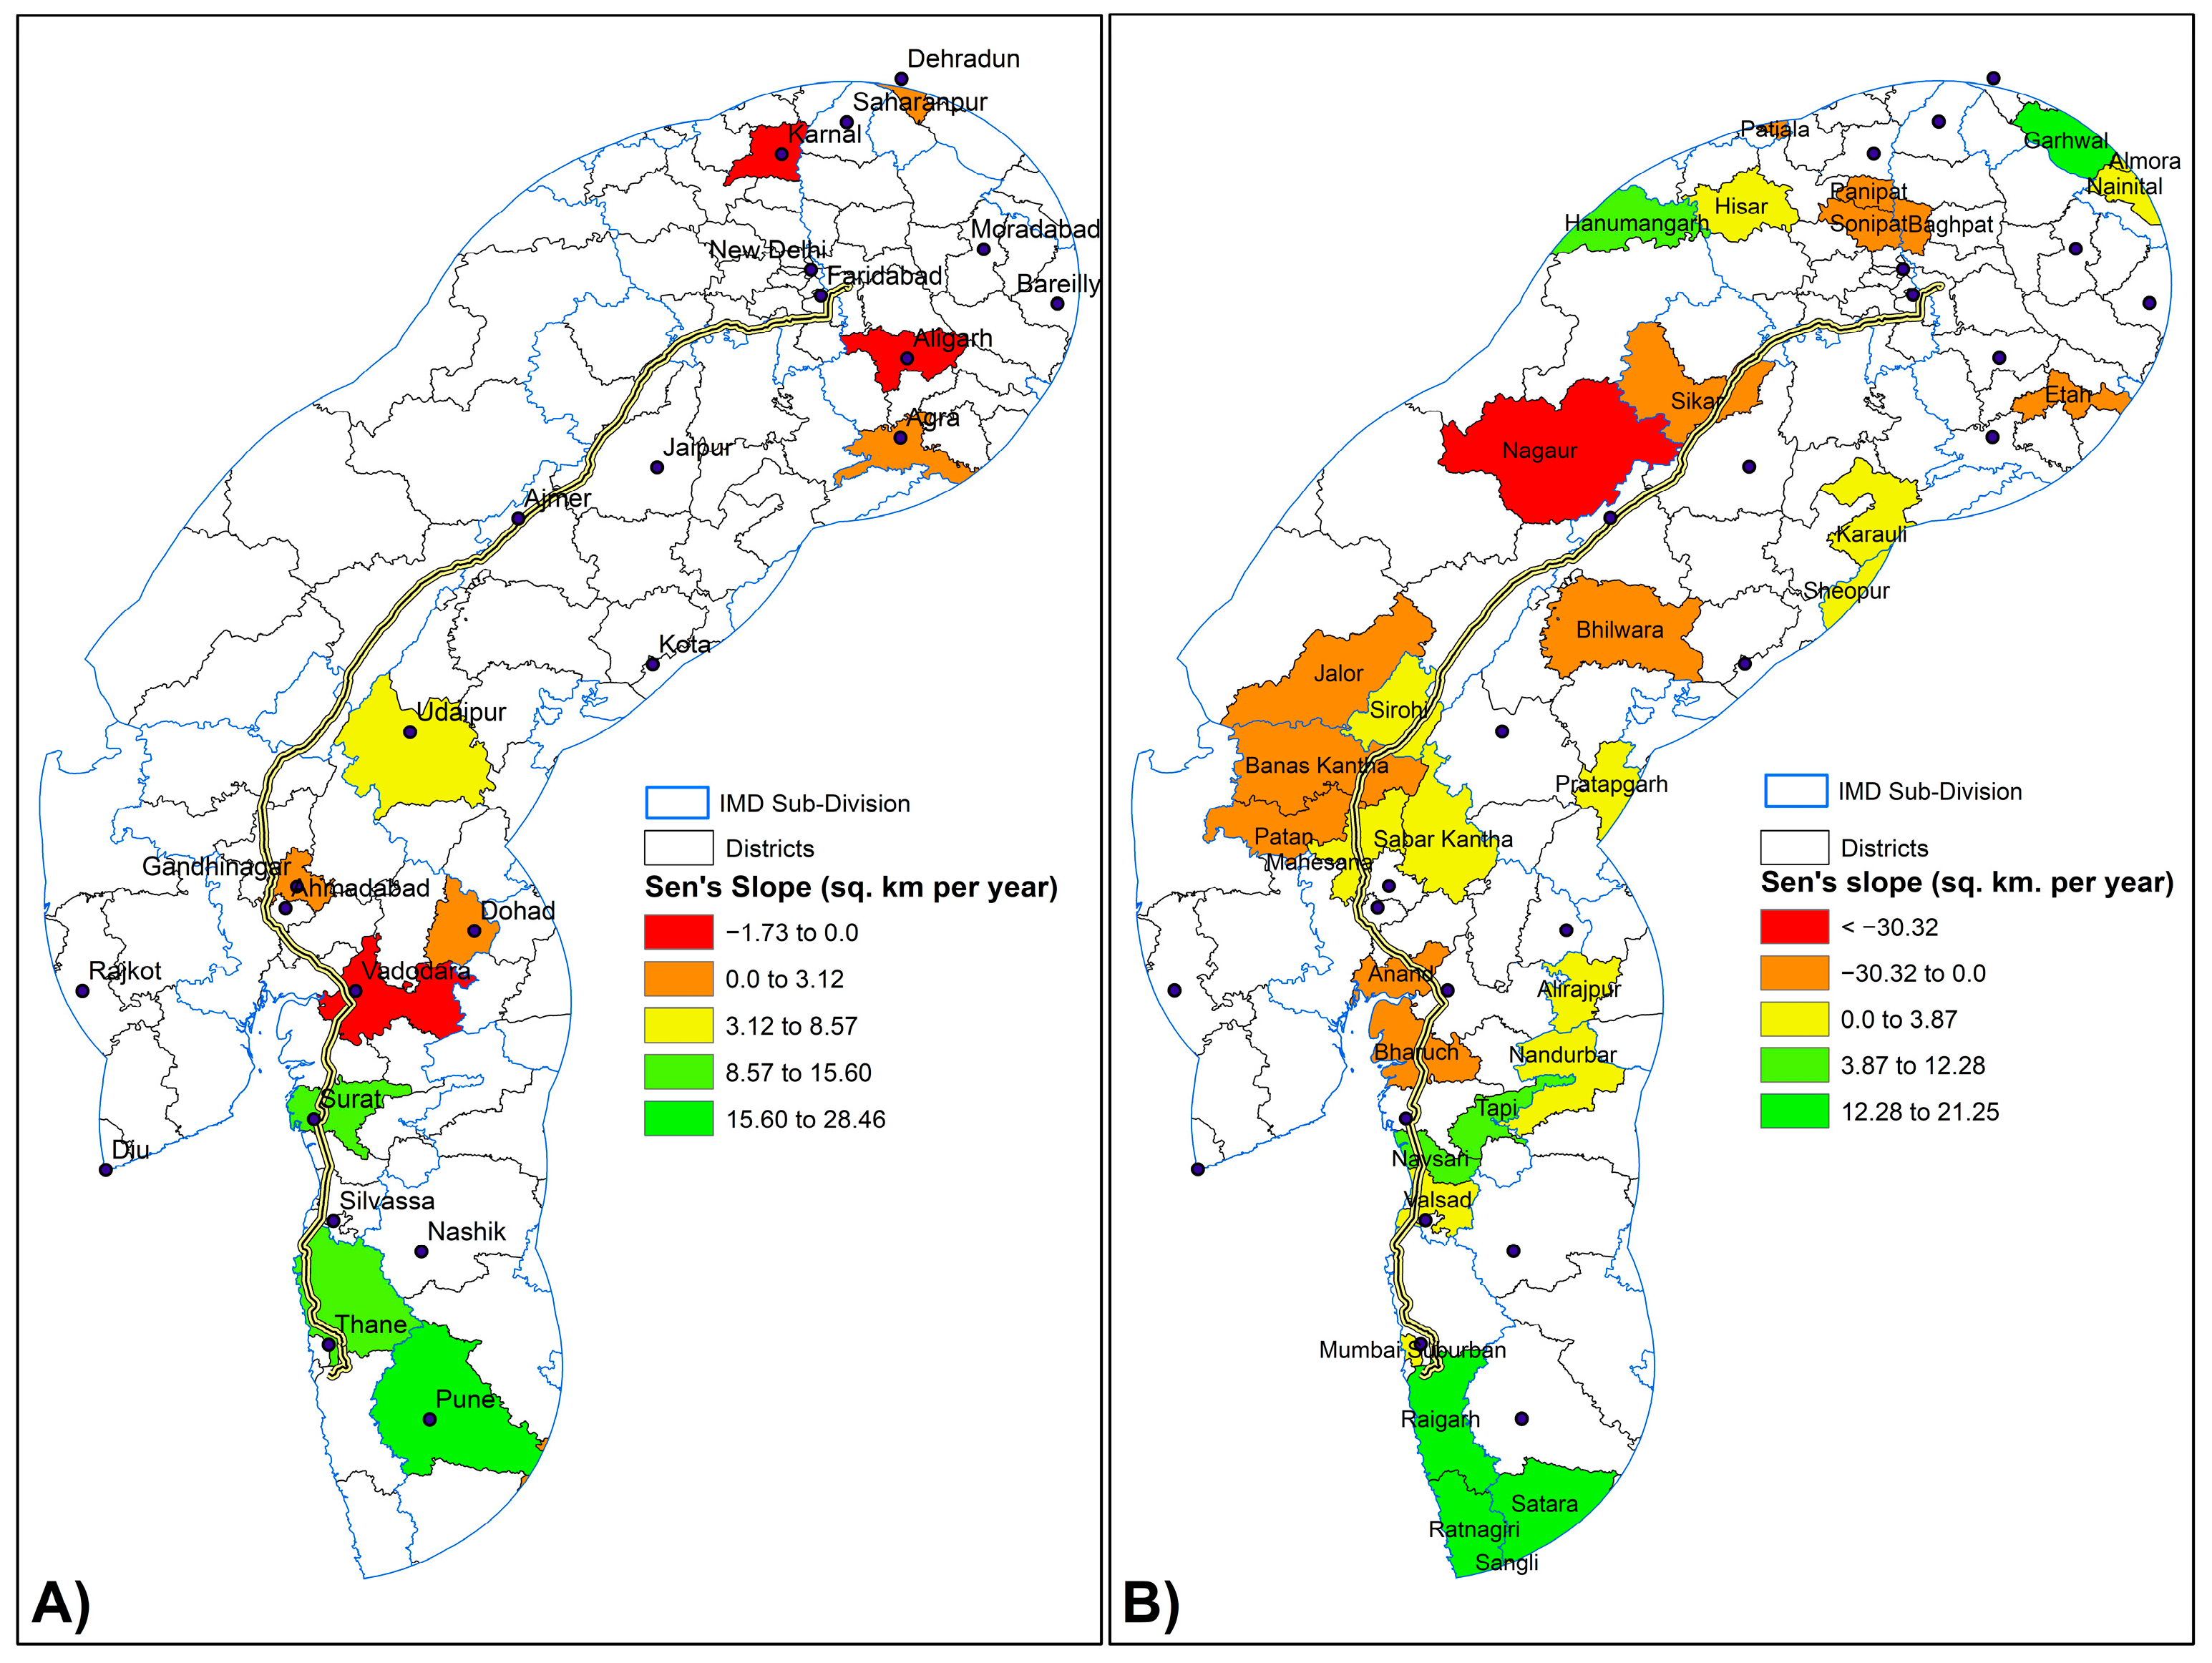
  • Chandigarh, Haryana, and Delhi: Noteworthy is the increase in agriculture with a Sen’s slope of 64.33 sq. km. per year. Concurrently, grassland and shrubland decreased at a rate of −34.60 sq. km. per year and −33.44 sq. km. per year, respectively. The area also witnessed the highest increase in built-up land at 7.50 sq. km. per year.
  • East Madhya Pradesh: Noteworthy is the increase in agriculture, with a Sen’s slope of 4.69 sq. km. per year, and a concurrent decrease in grassland, at a rate of −4.50 sq. km. per year.
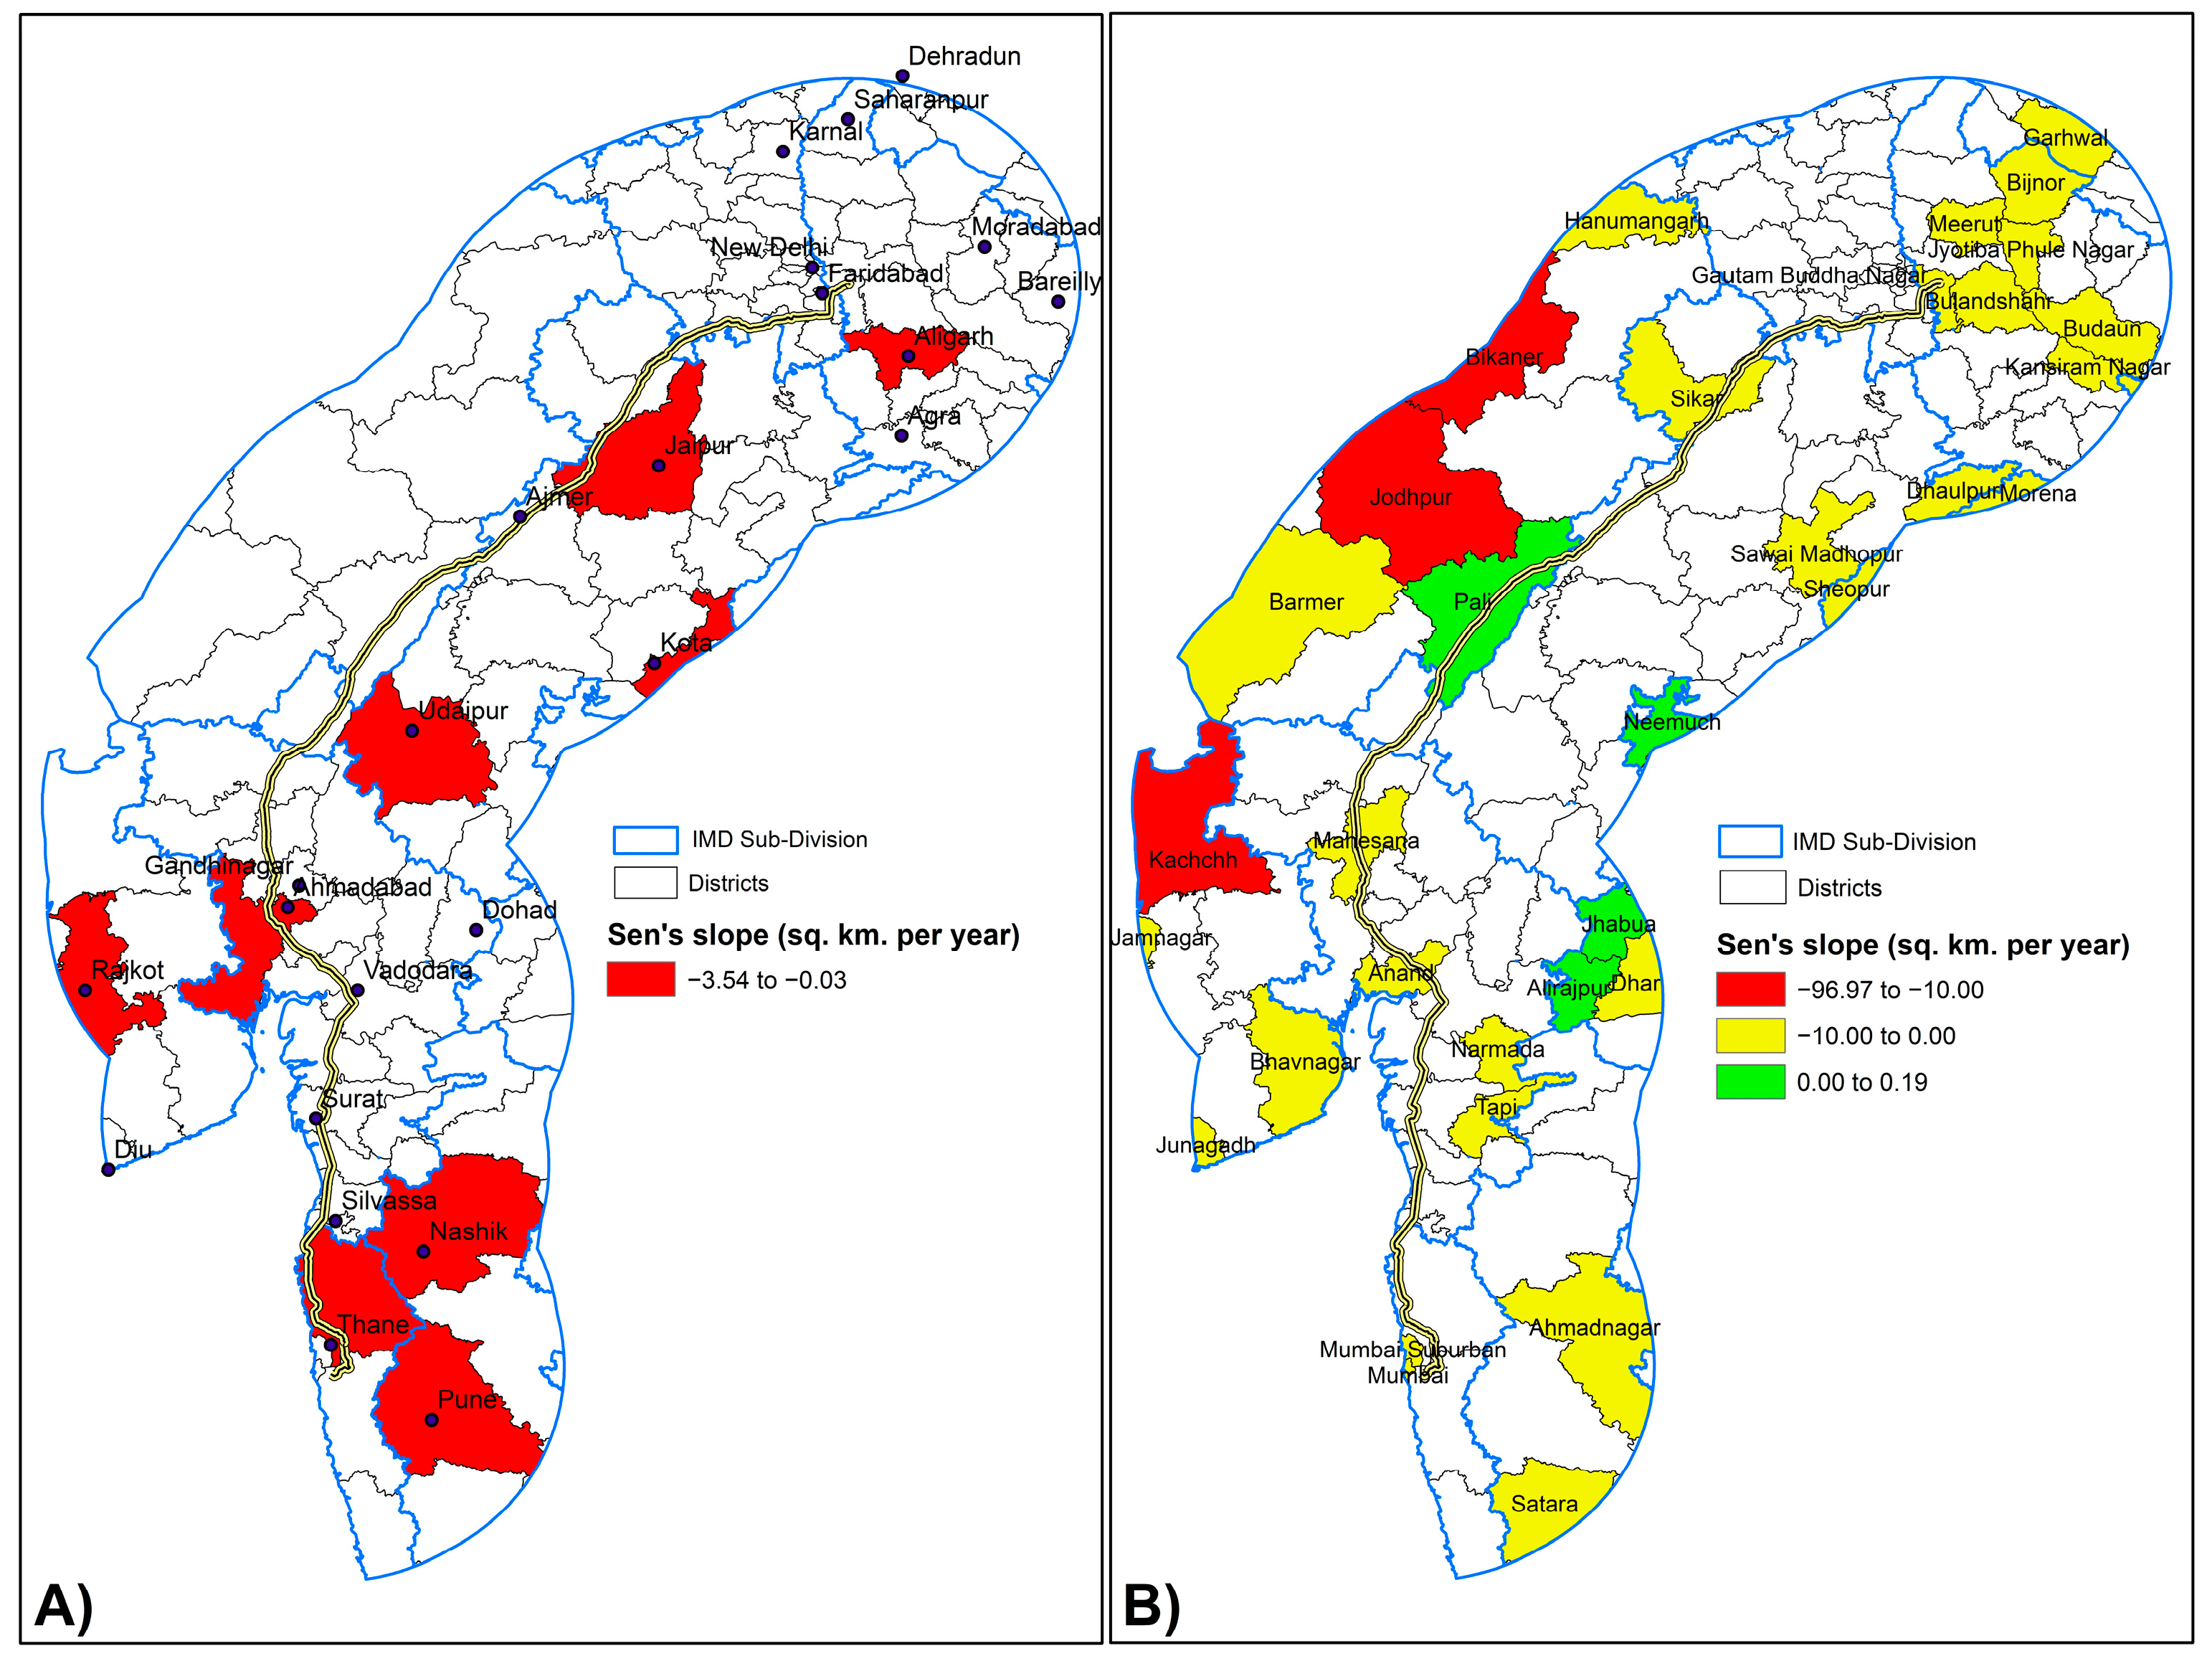
  • East Rajasthan: This IMD sub-division witnessed the second-highest increase in agriculture, with a Sen’s slope of 599.15 sq. km. per year. The data show the third-highest increase in waterbodies among all the IMD sub-divisions, at 6.35 sq. km. per year.
  • East Uttar Pradesh: There are minor increases in agriculture of 0.29 sq. km. per year, with decreases in bareland of −0.06 sq. km. per year and grassland of −0.25 sq. km. per year.
  • Gujarat Region: This IMD sub-division witnessed the third-highest increase in agriculture, with a Sen’s slope of 423.85 sq. km. per year. The study notes significant decrease in grassland (253.98 sq. km. per year) and shrubland (−177.06 sq. km. per year). The Gujarat Region also has the second-highest increase in waterbodies among all the IMD sub-divisions, at 15.37 sq. km. per year.
  • Konkan and Goa: Amongst all IMD sub-divisions, Konkan and Goa exhibited the highest increase in forest with a Sen’s slope of 56.47 sq. km. per year with the highest decrease in agriculture at −151.05 sq. km. per year.
  • Madhya Maharashtra: Agriculture has increased by 123.84 sq. km. per year, with a concurrent decrease in grassland of −172.49 sq. km. per year. It also witnessed the second-highest increase in forest, with a Sen’s slope of 41.12 sq. km. per year
  • Marathwada: A minor increase in agriculture with a Sen’s slope of 0.14 sq. km. per year was offset by a decrease of −0.15 in grassland for this IMD sub-division.
  • Punjab: There are minor increases in agriculture of 0.03 sq. km. per year, with a concurrent decrease in shrubland of −0.03 sq. km. per year.
  • Saurashtra and Kachh: The data show a considerable increase in agriculture of 361.18 sq. km. per year and significant decreases in grassland by −187.55 sq. km. and shrubland by −117.66 sq. km. per year. The data show the highest increase in waterbodies among all the IMD sub-divisions, at 22.08 sq. km. per year.
  • Uttarakhand: The data show the second-highest increase in forest among all the IMD sub-divisions at 24.72 sq. km. per year. Concurrently, the second-highest decrease in agriculture among all IMD sub-divisions is −25.28 sq. km. per year.
  • West Madhya Pradesh: Agriculture sees modest increases, at 38.50 sq. km. per year. Concurrently, grassland decreases by −37.36 sq. km. per year.
  • West Rajasthan: Amongst the IMD sub-divisions, West Rajasthan shows the highest increase in agriculture at 1593.31 sq. km. per year. The area also witnessed the highest decreases in shrubland at −1122.79 sq. km. per year, a decrease in grassland at −232.98 sq. km. per year, and a decrease in bareland at −137.90 sq. km. per year.
  • West Uttar Pradesh: There is a minor decrease in agriculture of −3.29 sq. km. per year and forests of 3.42 sq. km. per year. The area also witnessed the second-highest increase in built-up land at 5.92 sq. km. per year.
A substantial agricultural expansion was witnessed in West Rajasthan during 2001–2021, potentially reflecting successful agricultural policies or shifts in land use, but this comes with losses in shrubland. East Rajasthan, the Gujarat Region, and Saurashtra and Kachh are other IMD sub-divisions with notable higher-than-average increases in agricultural land. A decline in natural land covers (grassland and shrubland) with a higher-than-average growth in agricultural land in the Gujarat Region may reflect the impact of human activities and necessitate measures for ecological conservation. The Gujarat Region is also an area with the second-highest increase in waterbody due to effective water resource management or changing patterns in precipitation and hydrology.
Urban development remained fairly stable in most IMD sub-divisions, with the Chandigarh, Haryana, Delhi, and West Uttar Pradesh regions registering a higher-than-average increase in built-up land. The dominance of rural areas within the DMIC ZoI and the 500 m spatial resolution of MODIS data may necessitate further research with higher resolutions to accurately determine the extent of urban LULC changes.
The results suggest that while some IMD sub-divisions have experienced significant agricultural growth, others show a decline in natural land covers, indicating potential overuse or conversion to other land uses. There is limited evidence of planned conservation and ecological maintenance. These findings highlight the need for a regional strategy to balance economic development with environmental conservation within the DMIC.

3.3. LULC Changes in the Smart Cities and the District Level

The study area encompasses 121 districts and 24 smart cities. The study conducted further analysis at the district level for each of the seven LULC classes, identifying smart cities and districts with notable LULC changes. The smart cities and districts with notable changes in LULC are identified. The complete list of 121 districts and 24 smart cities, along with the associated Kendall’s tau, p-value, and Sen’s slope, can be found in Supplementary Section B (Summary of time series for smart cities and other districts-Table S1. Summary of Kendall’s tau and Sen’s slope for time series analysis of decadal LULC changes for smart cities in the DMIC, and Table S2. Summary of Kendall’s tau and Sen’s slope for time series analysis of decadal LULC changes for districts in the DMIC). This section summarizes the results and discusses the following questions:
“How do changes in LULC in smart cities compare with other districts within the DMIC?”

3.3.1. Changes in Agricultural LULC

Agricultural land is the largest class in the area (514,503.25 sq. km. or 79.44% of DMIC ZoI), and changes in this LULC can significantly impact regional economic development and ecological balance. In general, throughout the DMIC ZoI, the agricultural land increased in size, with some exceptional decreases in smart cities or other districts. The change was throughout the study area. Details of the findings on smart cities and other districts are stated below.
Smart Cities: A significant positive trend in agricultural land change was observed in the analysis of smart cities within the DMIC. The top two cities belonging to the IMD sub-division of the Gujarat Region with the most substantial positive trends were Ahmedabad, with a Kendall’s tau of 0.92*** and a Sen’s slope of 139.60 sq. km. per year, and Vadodara, with a Kendall’s tau of 0.86*** and a Sen’s slope of 51.45 sq. km. per year. These districts displayed strong positive correlations between time and agricultural land area increase, signaling the robust growth of farming from 2001 to 2021.
Conversely, Thane in the Konkan and Goa IMD sub-division, with a Kendall’s tau of −0.80*** and a Sen’s slope of −36.07 sq. km. per year, showed a significant decline in agricultural land.
Other Districts: Among other districts within the study area, the top districts exhibiting positive trends in agricultural land change were Churu, with a Kendall’s tau of 0.60*** and a Sen’s slope of 437.74 sq. km. per year; Jodhpur, with a Kendall’s tau of 0.52*** and a Sen’s slope of 403.42 sq. km. per year; and Nagaur, with a Kendall’s tau of 0.62*** and a Sen’s slope of 315.85 sq. km. per year. These figures indicate considerable increases in agricultural land, with strong statistical significance.
On the other end of the spectrum, the districts with negative trends were Raigarh, with a Kendall’s tau of −0.88*** and Sen’s slope of −69.33 sq. km. per year; Ratnagiri, with a Kendall’s tau of −0.86*** and a Sen’s slope of −44.58 sq. km. per year; and Valsad, with a Kendall’s tau of −0.75*** and a Sen’s slope of −12.00 sq. km. per year.
The overall trends suggest that while some districts within the DMIC are experiencing growth in agricultural land, others face challenges that may lead to stagnation or decline. Figure 3 shows the changes in agricultural land area in contiguous districts (for example, West Rajasthan) within the individual IMD sub-divisions, with some exceptions. The factors driving these changes may vary significantly across the regions, and further investigation is required to understand these trends’ underlying causes and develop region-specific strategies for sustainable land use management.

3.3.2. Changes in Bareland LULC

Bareland is one of the smallest classes in area size (10,916.5 sq. km. or 1.69% of the DMIC ZoI), and changes in this LULC can indicate conversions to other LULCs, such as urban or agricultural land. Throughout the DMIC ZoI, the bareland areas decreased in size, with lesser decreases in smart cities and more decreases in other districts. Across the region, the changes in bareland were heterogenous, as noted in Figure 4. Details of the findings on smart cities and other districts are stated below.
Smart Cities: For the smart cities, the trend in the bareland LULC class showed a significant decline. The top three districts with the most pronounced negative trends, as indicated by Kendall’s tau with corresponding p-values, were Ahmedabad, with a Kendall’s tau of −0.60*** and a Sen’s slope of −3.54 sq. km. per year; Pune, with a Kendall’s tau of −0.66*** and a Sen’s slope of −2.83 sq. km. per year; and Nashik, with a Kendall’s tau of −0.58** and a Sen’s slope of −2.48 sq. km. per year. All other smart cities showed reductions in bareland.
Other Districts. The analysis of other districts within the DMIC also showed a higher decline in bareland areas than in smart cities. The top three districts with significant negative trends were Jodhpur, with a Kendall’s tau of −0.54*** and a Sen’s slope of −96.97 sq. km. per year; Kachchh, with a Kendall’s tau of −0.56*** and a Sen’s slope of −44.10 sq. km. per year; and Bikaner with a Kendall’s tau of −0.64*** and a Sen’s slope of −37.63 sq. km. per year. Unlike the smart cities, which had only declined, some districts showed positive trends in bareland areas. These include Alirajpur, with a Kendall’s tau of 0.44** and a Sen’s slope of 0.20 sq. km. per year; Neemuch, with a Kendall’s tau of 0.48** and a Sen’s slope of 0.11 sq. km. per year; and Pali, with a Kendall’s tau of 0.47** and a Sen’s slope of 0.10 sq. km. per year.
The decline in bareland in urban agglomerations such as Thane, Pune, and Nashik (all smart cities) is contiguous, as seen in Figure 4.

3.3.3. Changes in Forest LULC

Forests are one of the smallest classes in area size (37,446.25 sq. km. or 1.69% of the DMIC ZoI), and changes in this LULC can have critical implications on biodiversity and carbon sequestration. The forest areas increased in size in most of the smart cities but with substantial decreases in certain of the other districts of the DMIC ZoI. Figure 5 shows the distinction between smart cities and other districts regarding changes in forests. Details of the findings on smart cities and other districts are noted below.
Smart Cities: This loss of forest cover has implications for biodiversity and carbon sequestration. For the smart cities in the DMIC, forest area changes from 2001 to 2021 indicate increases but with varying trends. The top three districts with the greatest increases in forest area, as denoted by Kendall’s tau and Sen’s slope, are Pune, with a Kendall’s tau of 0.600*** and Sen’s slope of 28.46 sq. km. per year; Thane, with a Kendall’s tau of 0.562*** and a Sen’s slope of 15.60 sq. km. per year, suggesting notable afforestation or reforestation activities; and Surat, with a Kendall’s tau of 0.752*** and a Sen’s slope of 12.62 sq. km. per year, which could reflect successful environmental policies or natural forest regeneration.
Other Districts: Within the DMIC, other districts exhibit the largest increases in forest areas, notably Raigarh, with a Kendall’s tau of 0.79*** and a Sen’s slope of 21.25 sq. km. per year; Ratnagiri, with a Kendall’s tau of 0.75*** and a Sen’s slope of 18.97 sq. km. per year; and Garhwal, with a Kendall’s tau of 0.84*** and a Sen’s slope of 16.74 sq. km. per year.
These districts exhibit significant positive trends indicative of effective forest conservation strategies or natural reforestation.
On the contrary, the districts with the greatest decline in forest areas are Nagaur, with a Kendall’s tau of −0.48** and a Sen’s slope of −30.32 sq. km. per year; Anand, with a Kendall’s tau of −0.59*** and Sen’s slope of −3.92 sq. km. per year; and Baghpat, with a Kendall’s tau of −0.60*** and a Sen’s slope of −3.45 sq. km. per year.
These reductions may be due to several factors, including land use change, agriculture-driven deforestation, or urban development pressures.
The reductions in forests are heterogeneous, as seen in Figure 5. However, the southern part of the DMIC, which includes the smart cities of Thane and Pune and the districts Raigarh, Ratnagiri, and Satara, has homogeneous increases in forests. Expanding forest areas in these districts demonstrates the potential for ecological recovery and the success of green initiatives. Conversely, the decline in other regions emphasizes the need for enhanced conservation efforts and the careful evaluation of land use policies to mitigate the loss of forested lands.

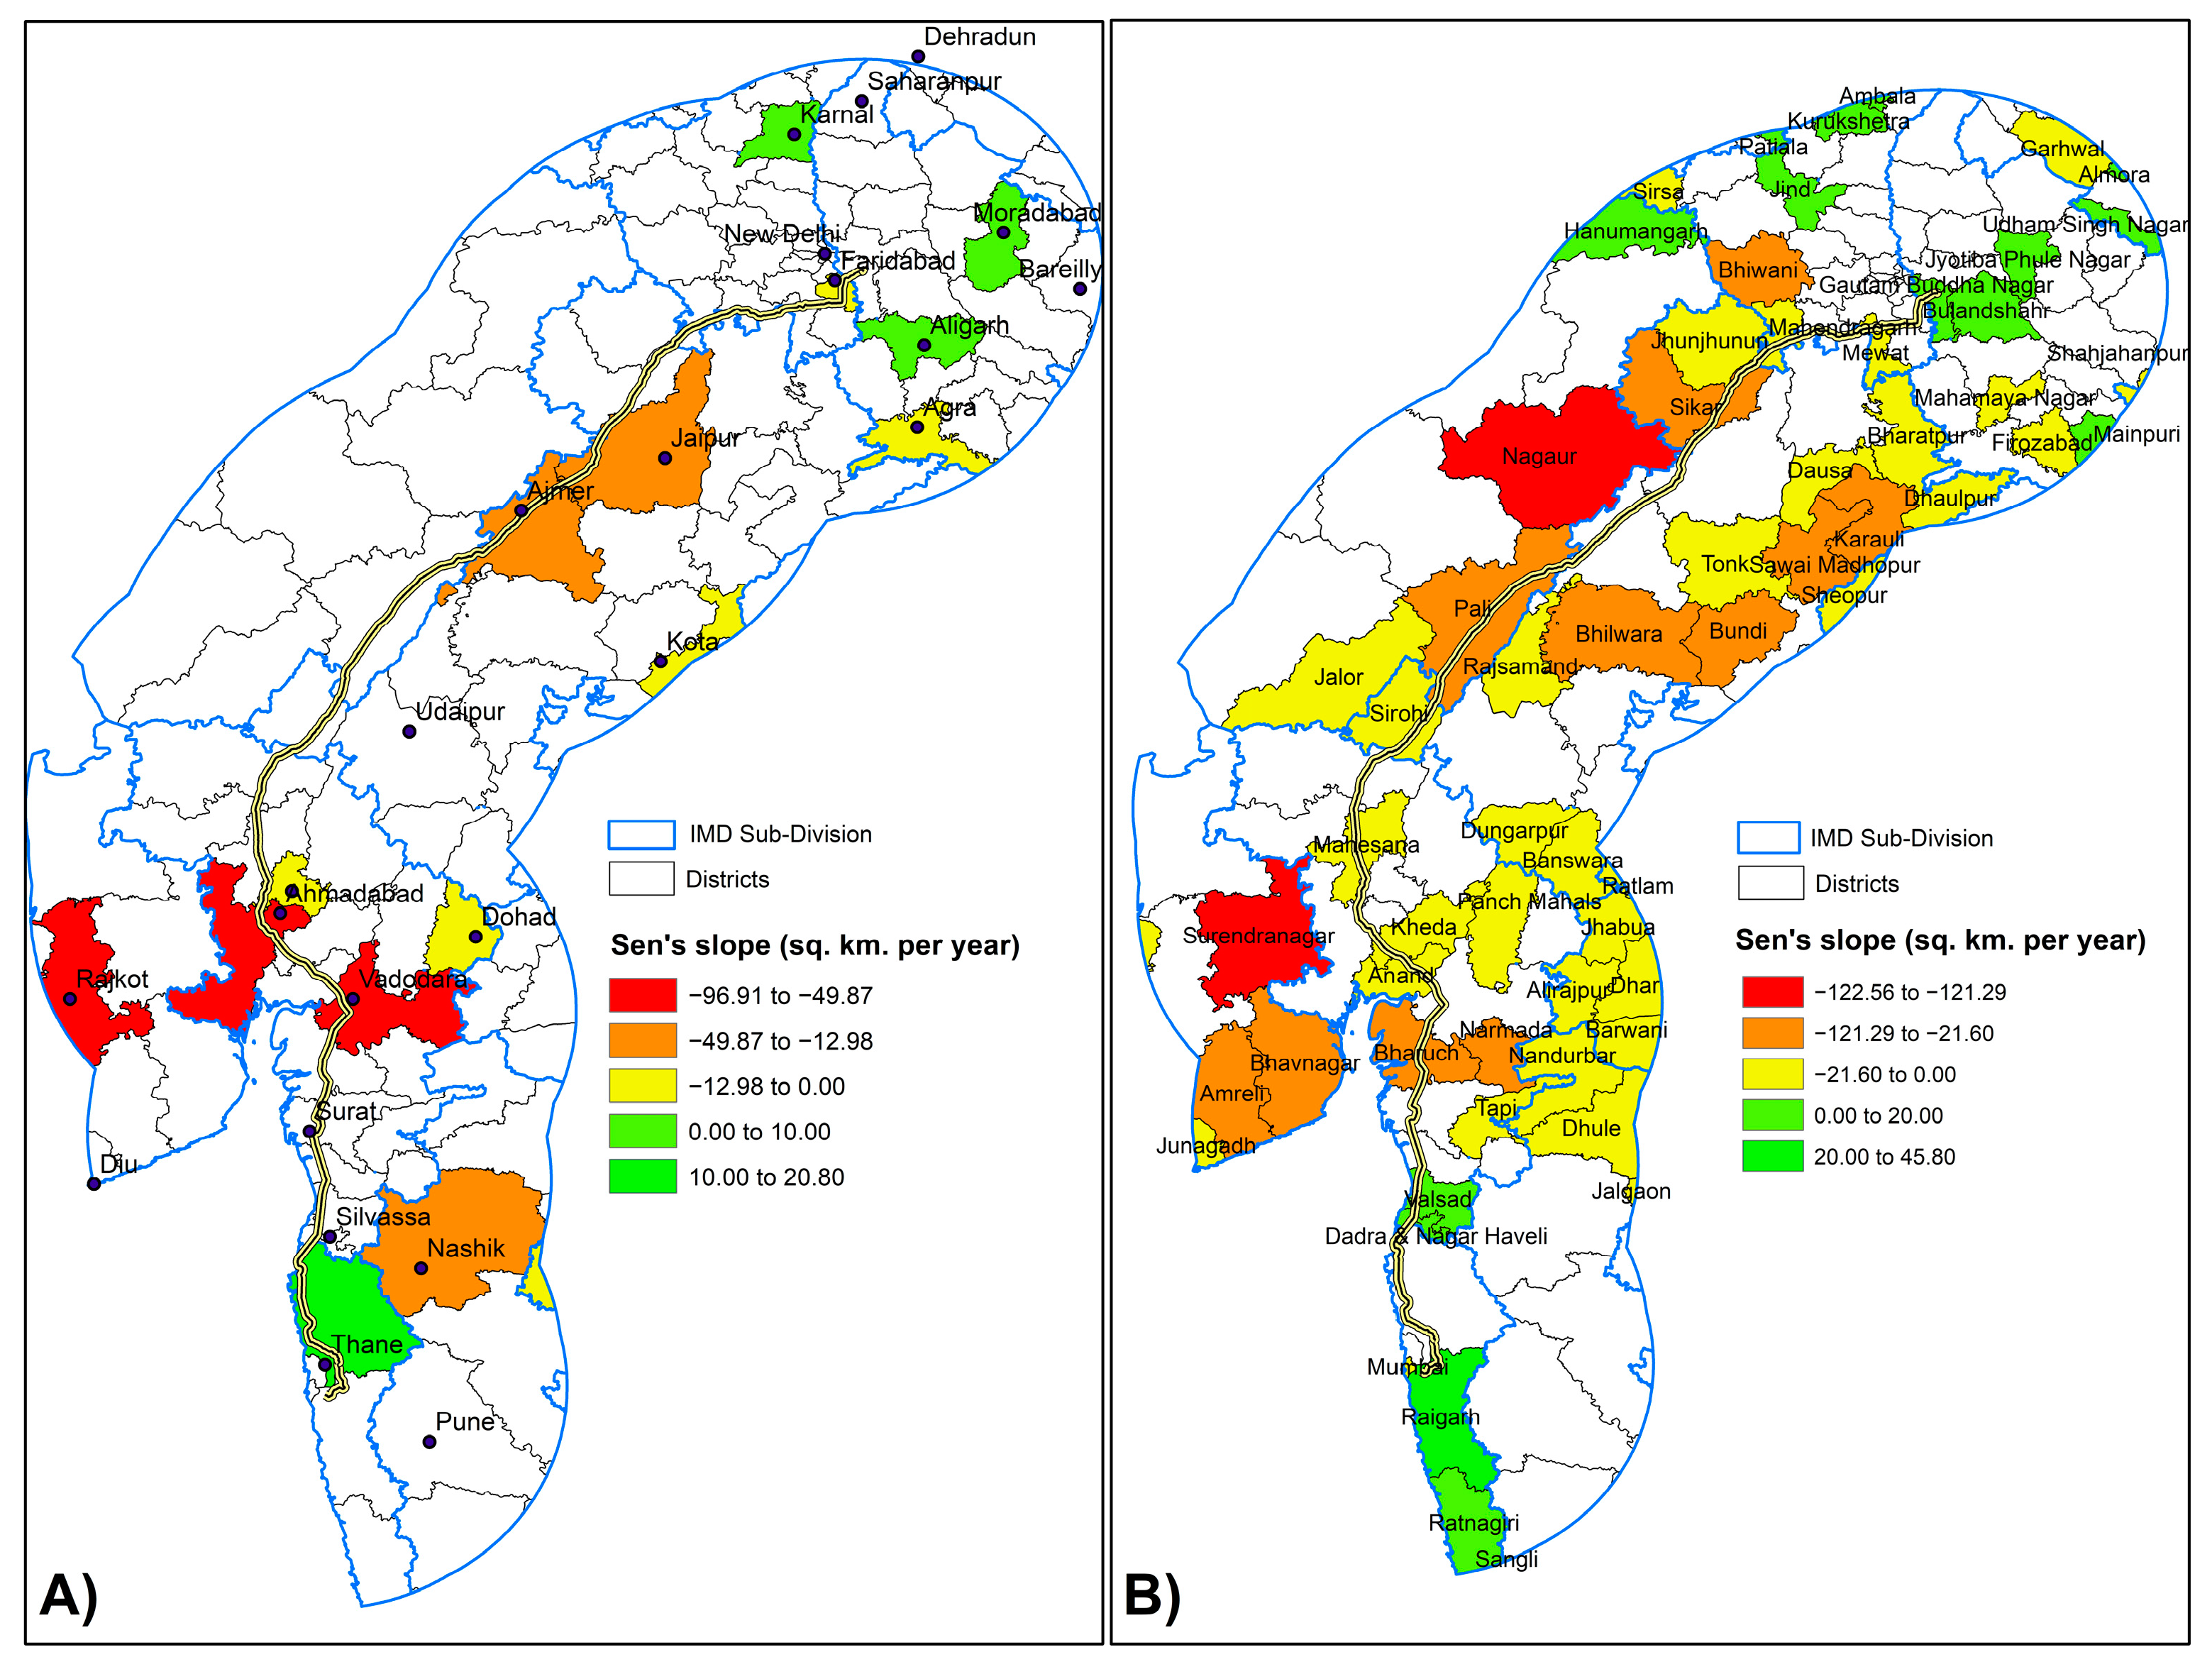
3.3.4. Changes in Grassland LULC

After agricultural land and shrubland, grassland is the third-largest class in the area (55,838.5 sq. km. or 5.78% of DMIC ZoI), and changes in this LULC can significantly impact the alteration of ecosystems. In general, throughout the DMIC ZoI, the grassland areas decreased with some exceptions. Figure 6 shows the heterogeneous spread of the grassland changes. Details of the findings on smart cities and other districts are noted below.
Smart Cities: For the smart cities, the greatest increases in grassland include Thane, with a Kendall’s tau of 0.72*** and a Sen’s slope of +20.80 sq. km. per year; Karnal, with a Kendall’s tau of 0.58*** and a Sen’s slope of +0.88 sq. km. per year; and Moradabad, with a Kendall’s tau of 0.43** and a Sen’s slope of +0.86 sq. km. per year. Notably, Sen’s slope drops from Thane to Karnal by a significant margin.
The greatest declines in grassland are in Ahmadabad, with a Kendall’s tau of −0.81*** and a Sen’s slope of −96.91 sq. km. per year; Rajkot, with a Kendall’s tau of −0.82*** and a Sen’s slope of −51.15 sq. km. per year; and Vadodara, with a Kendall’s tau of −0.87*** and a Sen’s slope of −49.88 sq. km. per year.
Other Districts: The different districts with the greatest increases in grassland include Raigarh, with a Kendall’s tau of 0.86*** and Sen’s slope of +45.80 sq. km. per year; Hanumangarh, with a Kendall’s tau of 0.44** and a Sen’s slope of +19.41 sq. km. per year; and Ratnagiri, with a Kendall’s tau of 0.56*** and a Sen’s slope of +19.38 sq. km. per year.
For the other districts, the greatest decreases in grassland include Nagaur, with a Kendall’s tau of −0.71*** and a Sen’s slope of −122.56 sq. km. per year; Surendranagar, with a Kendall’s tau of −0.91*** and a Sen’s slope of −121.29 sq. km. per year; and Bharuch, with a Kendall’s tau of −0.93*** and a Sen’s slope of −44.96 sq. km. per year.
The reduction in grassland areas and increases in agricultural land point to a significant transformation of natural and semi-natural landscapes, raising concerns about the loss of biodiversity and alteration of ecosystems.

3.3.5. Changes in Shrubland LULC

After agricultural land, shrubland is the largest class in the area (13,892.75 sq. km. or 8.62% of DMIC ZoI), and changes in this LULC can significantly impact local biodiversity, soil stability, and microclimate regulation. Throughout the DMIC ZoI, shrubland areas had the highest decreases in most districts. Figure 7 shows the homogeneous spread of the shrubland changes. Details of the findings on smart cities and other districts are noted below.
Smart Cities: In smart cities, Ahmadabad, Jaipur, and Ajmer exhibit decreases in shrubland, with a Kendall’s tau of −0.67*** and a Sen’s slope of −35.43 sq. km. per year for Ahmadabad; −0.67*** and −16.50 sq. km. per year for Jaipur; and −0.68*** and −8.27 sq. km. per year for Ajmer.
Other Districts: Jind displayed the sole increase in shrubland, marked by a Kendall’s tau of 0.70*** and a modest Sen’s slope of 0.045 sq. km. per year. The districts of Mewat, Tapi, Morena, and Bid indicated no change in the Sen’s slope for shrubland. The decreases in shrubland, on the other hand, were fairly substantial: Jodhpur had a Kendall’s tau of −0.42** and Sen’s slope of −243.21 sq. km. per year; Jalor had a Kendall’s tau of −0.61*** and a Sen’s slope of −197.94 sq. km. per year; and Nagaur had a Kendall’s tau of −0.50** and a Sen’s slope of −159.88 sq. km. per year. This rounded out the list of highest decreases in shrubland in other districts of the DMIC ZoI.
As seen in Figure 7, the shrubland reductions are homogeneous within the IMD sub-divisions of West Rajasthan, East Rajasthan, and the Gujarat Region. These shrubland changes may affect local biodiversity, soil stability, and microclimate regulation. The transformation of shrublands raises concerns about the loss of these unique ecosystems, which often serve as important habitats for wildlife.

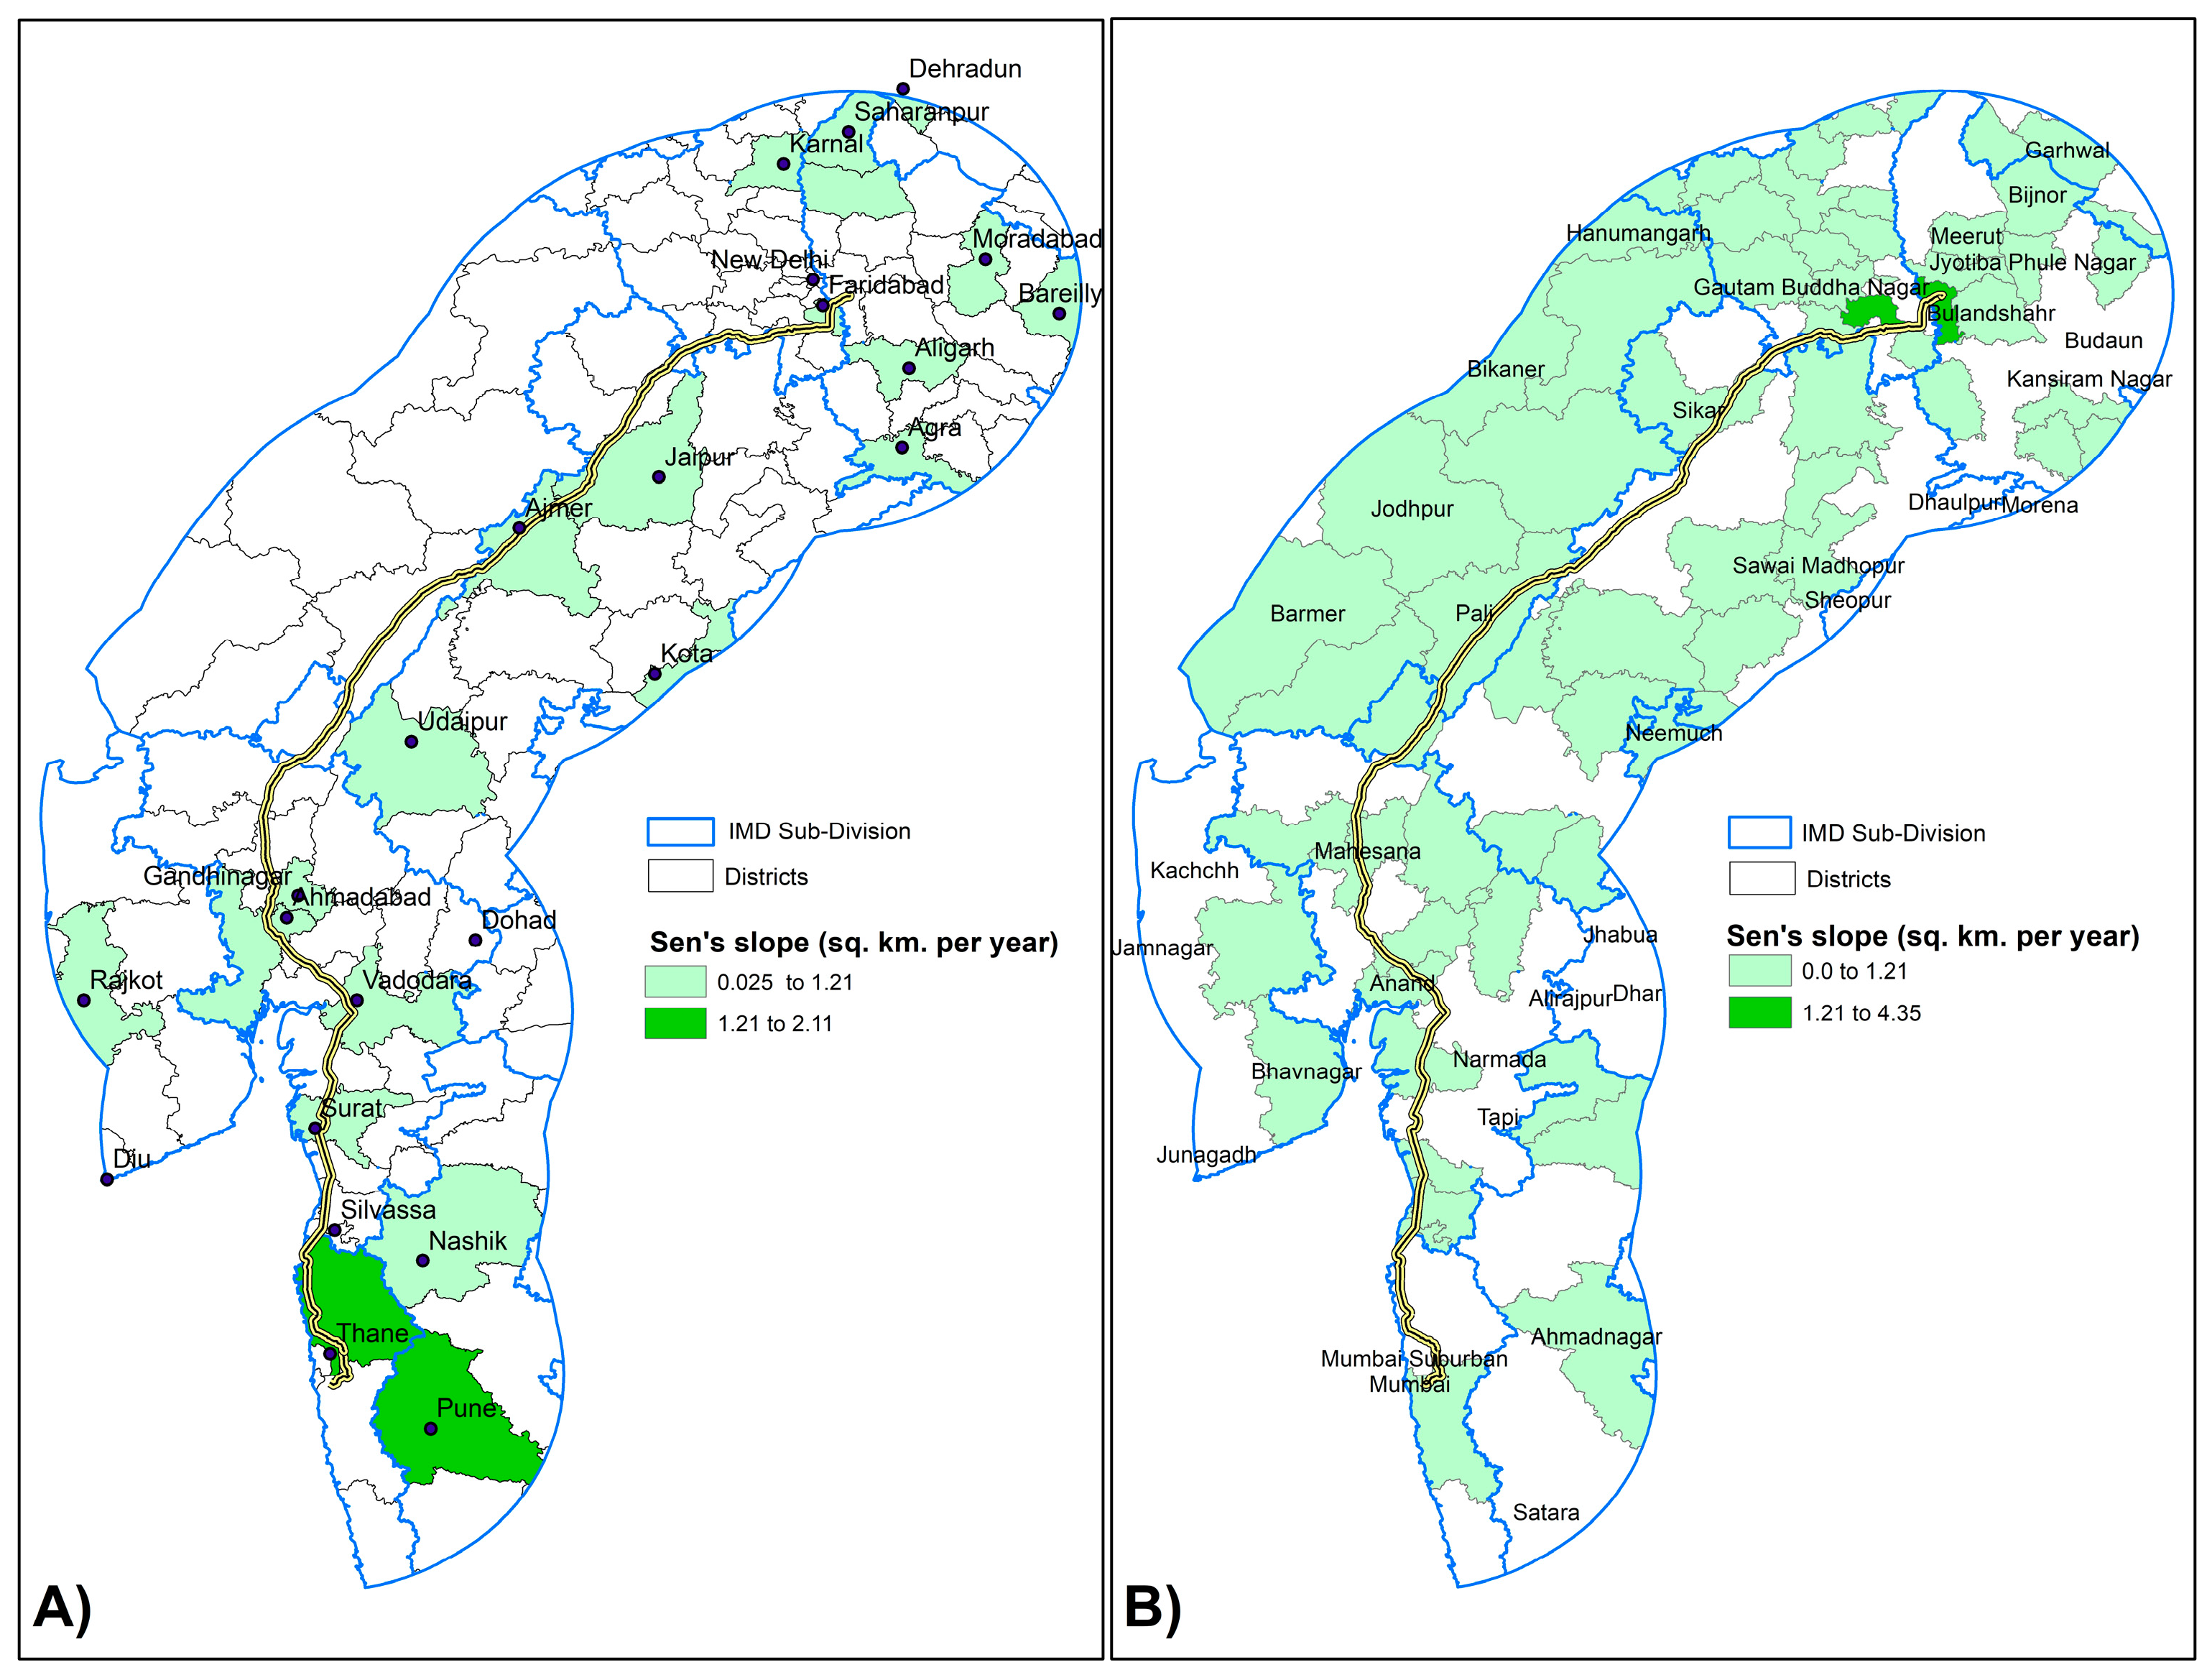
3.3.6. Changes in Built-Up LULC

Built-up land (including urban areas) is one of the smallest classes in area size (10,949.5 sq. km. or 2.15% of the DMIC ZoI). Throughout the DMIC ZoI, the urban areas increased, with no decreases in smart cities or other districts. Figure 8 illustrates the increase in homogeneity across built-up land, marked by green-shaded areas in small increments. The detailed findings on smart cities and other districts are noted below.
Smart Cities: The Sen’s slope data for urban and built-up land LULC changes in the DMIC region show an increase in urbanization, particularly in districts near cities such as Thane, Pune, Surat, Ahmedabad, Faridabad, and Jaipur. Built-up areas for any smart cities within the DMIC ZoI did not decrease.
The highest increases were Thane, with a Kendall’s tau of 1.00*** and Sen’s slope of 2.11 sq. km. per year; Pune, with a Kendall’s tau of 0.99*** and a Sen’s slope of 1.91 sq. km. per year; and Surat, with a Kendall’s tau of 0.99*** and a Sen’s slope of 1.16 sq. km. per year.
Other Districts: The other districts saw larger increases in built-up land than the smart cities, e.g., Gautam Buddha Nagar, with a Kendall’s tau of 0.99*** and a Sen’s slope of 4.35 sq. km. per year; Gurgaon, with a Kendall’s tau of 0.99*** and a Sen’s slope of 2.38 sq. km. per year; and Udham Singh Nagar, with a Kendall’s tau of 0.97*** and a Sen’s slope of 1.21 sq. km. per year. Districts like Gandhinagar, Udaipur, and Bareilly suggest a more moderated or planned urban growth due to their low Sen’s slopes yet significant Kendall’s tau results. The negligible changes in areas like North Delhi and South Delhi might reflect development saturation. Also, the expansion of built-up areas in urban settings is typically in brownfield areas and may be lesser than the minimum mapping unit for MODIS land cover products.
Hence, further research is recommended using the highest available imagery (30 m or higher resolution).

3.3.7. Changes in Waterbody LULC

Waterbodies are the smallest class in area size (4081 sq. km. or 0.63% of the DMIC ZoI). Throughout the DMIC ZoI, the waterbody LULC class increased, with no decreases in the smart cities or other districts. The increase can be seen in Figure 9 and is noteworthy as the upper half of the DMIC ZoI seems to have no districts with a statistically significant (p-value < 0.1) growth, except for Jhajjar. A notable observation is the correlation between the increase in urban and built-up areas and waterbody areas in several adjacent districts in the lower half of the DMIC ZoI. Details of the findings on smart cities and other districts are noted below.
Smart Cities: Among the smart cities were Pune, with a Kendall’s tau of 0.47** and a Sen’s slope of 2.56 sq. km. per year; Thane, with a Kendall’s tau of 0.47** and a Sen’s slope of 2.41 sq. km. per year; and Ahmadabad, with a Kendall’s tau of 0.76*** and a Sen’s slope of 2.31 sq. km. per year.
Other Districts: Other districts included Kachchh, with a Kendall’s tau of 0.50** and a Sen’s slope of 15.32 sq. km. per year; Bhavnagar, with a Kendall’s tau of 0.94*** and a Sen’s slope of 4.80 sq. km. per year; and Panch Mahals, with a Kendall’s tau of 0.70*** and a Sen’s slope of 2.71 sq. km. per year.
The changes in waterbody areas across the smart cities and other districts within the DMIC from 2001 to 2021 reveal distinct patterns. Pune and Thane, with moderate increases in waterbody areas, might reflect efforts in water conservation or the result of seasonal variability captured over the years. Ahmadabad’s higher Sen’s slope suggests improved water management strategies.
Large-scale water conservation projects or changes in land use practices that favor waterbody expansion could explain the notable increases in waterbody areas in Kachchh and Bhavnagar.

4. Discussions

4.1. Implications for Smart Cities and Planned Industrial Clusters

4.1.1. Smart Cities

Smart cities, such as Ahmedabad (Gujarat Region), Jaipur (East Rajasthan), and Pune (Madhya Maharashtra), show significant positive trends in urban growth. This rapid urbanization, while driving economic development and infrastructure improvement, also poses challenges such as increased pollution, higher energy consumption, and pressure on existing urban services. For example, Pune’s substantial urban sprawl often leads to encroachment on agricultural and natural lands, impacting local biodiversity and water resources. The rapid expansion of urban areas reduces green spaces, affecting the local climate and air quality and increasing the urban heat island effect.
Many cities, including Agra (West Uttar Pradesh), Ahmedabad (Gujarat Region), and Nashik (Madhya Maharashtra), show significant increases in agricultural land. While this boosts food production and supports local economies, it often comes at the cost of natural habitats. In Ahmedabad, agriculture has expanded significantly, converting natural ecosystems into farmlands. This expansion can lead to soil degradation, water scarcity due to increased irrigation demands, and biodiversity loss as native species are displaced by monocultures. Reducing natural habitats such as wetlands and forests can also disrupt local water cycles, exacerbating the effects of droughts and floods.
The decline in natural land cover, particularly forests and shrublands, is notable in cities like Faridabad (Chandigarh, Haryana, Delhi IMD sub-division), Gandhinagar (Gujarat Region), and Jaipur (East Rajasthan). Gandhinagar, for instance, has experienced a marked decrease in shrubland. This loss of natural habitats disrupts local flora and fauna, reducing biodiversity. Shrinking green spaces affect ecosystem services, climate regulation, and recreational spaces for urban populations.

4.1.2. Industrial Clusters and Industrial Areas Planned for the DMIC

The DMIC encompasses several projects that may significantly impact natural land cover. Here, we analyze five such projects based on current LULC changes and recommend whether they should proceed as greenfield or brownfield developments to minimize environmental impacts:
Faridabad-Palwal (Chandigarh, Haryana, Delhi IMD sub-division): The baseline conditions in this area indicate a substantial reduction in forest cover and shrubland, accompanied by increased urbanization and industrial activities. The decrease in natural habitats has fragmented ecosystems and increased human-wildlife conflict, reducing biodiversity and essential ecosystem services like air purification. Given the extensive urban and industrial infrastructure, the Faridabad-Palwal project, under the auspices of the DMIC, should proceed as a brownfield development, focusing on revitalizing degraded areas. Implementing green belts and reforestation projects will help mitigate the adverse environmental impacts and enhance local biodiversity.
Jaipur-Dausa (East Rajasthan IMD sub-division): The Jaipur-Dausa project area has experienced significant declines in shrubland and savanna, driven by expanding agriculture and urban areas since 2001, as indicated in the study. These changes have disrupted local flora and fauna, especially species dependent on these habitats. This project should be approached as a brownfield initiative to minimize further environmental degradation and repurposing existing agricultural lands and urban spaces. Establishing green corridors and incorporating sustainable urban planning can help maintain ecological balance and support biodiversity conservation efforts.
Vadodara-Ankleshwar (Gujarat Region IMD sub-division): The area has reduced natural waterbodies and forest cover due to increased industrial and agricultural activities. These changes have impacted aquatic ecosystems and terrestrial biodiversity, with industrial activities contributing to pollution. Given the existing industrial landscape, a brownfield development approach is recommended. This will limit the conversion of remaining natural habitats, and incorporating advanced water management systems and pollution control measures will be essential to mitigate environmental impacts and protect local ecosystems.
Nashik-Sinnar (Madhya Maharashtra IMD sub-division): Urban expansion and agricultural development in the Nashik-Sinnar project area have significantly declined forest and shrubland areas. This loss of natural habitats has led to deforestation, reduced biodiversity, and exacerbated the urban heat island effect. The project should be developed as a brownfield initiative, focusing on existing urban and agricultural lands to prevent further habitat loss. Integrating extensive green spaces and sustainable land management practices within the urban planning framework will mitigate environmental impacts and enhance the area’s ecological resilience.
Pali-Marwar (West Rajasthan IMD sub-division): The area has extensive agricultural expansion and decreased natural forest and shrubland, with urban growth further impacting these habitats. The conversion of natural lands to agricultural and urban uses has disrupted local ecosystems and reduced biodiversity. The Pali-Marwar project should be developed as a brownfield initiative, utilizing converted agricultural and urban lands to minimize additional habitat loss. Implementing sustainable agricultural practices and creating conservation areas within the development plan will help preserve remaining natural habitats and support local biodiversity.
The assessment of these DMIC projects highlights the significant negative impacts on natural land cover due to LULC changes. Adopting brownfield development strategies for these projects will help minimize further environmental degradation. By focusing on sustainable urban planning, green infrastructure, and conservation efforts tailored to each project’s unique context, these developments can balance economic growth with ecological preservation, ensuring long-term environmental sustainability and resilience.
The LULC changes within the DMIC highlight a clear trend of the depletion of natural land cover due to anthropogenic activities. The observed trends call for urgent policy interventions to mitigate the adverse impacts on biodiversity and ecosystem services. Strategies such as implementing conservation corridors, enforcing land-use regulations, and promoting sustainable agriculture practices are essential to preserve the remaining natural habitats and ensure the long-term ecological health of the DMIC region.

4.2. Ecologically Sensitive Areas

The DMIC encompasses several ESAs in the 121 other districts, where the analysis of LULC changes reveals significant trends in the depletion of natural resources due to anthropogenic expansions. A complete list of the ESAs, their profiles, locations, and LULC changes is included in Supplementary Section C (Table S3 Summary of time series for Ecologically Sensitive Areas in the DMIC). This study utilizes Kendall’s tau and Sen’s slope statistics to quantify these changes, highlighting the transition from natural land covers to anthropogenic land uses. The key findings are noted below:
Forest to Agriculture Conversion: In Ranthambhore National Park (Sawai Madhopur district in East Rajasthan IMD sub-division) and the Gulf of Khambhat (Districts of Anand, Bharuch, and Surat in the Gujarat Region), forests exhibit a statistically significant decline. Simultaneously, agriculture in these regions has shown substantial growth, indicating that forested areas are being converted to agricultural land, driven by the demand for food production and economic development. The decline in forest cover in Ranthambhore National Park could lead to habitat loss for Bengal tigers and leopards, reducing their available hunting grounds and increasing human–wildlife conflict. The conversion of forests to agriculture in the Gulf of Khambhat may affect the habitat of diverse bird species and mangrove ecosystems, which are crucial for many fish species’ breeding and nursery grounds.
Shrubland and Grassland Depletion: The depletion of shrubland and grassland is particularly notable in several regions. In the Nalsarovar Bird Sanctuary (Districts of Ahmedabad in Gujarat Region and Surendranagar in Saurashtra and Kacchh IMD sub-division), shrubland has declined significantly, paralleled by a substantial decrease in grassland. Concurrently, agricultural expansion suggests that these natural habitats are being transformed into cropland. This trend is consistent in the Kumbhalgarh Wildlife Sanctuary (Districts of Rajsamand, Udaipur, Pali, and Sirohi in West Rajasthan IMD sub-division), where shrubland and grassland are being supplanted by agriculture. The loss of shrubland and grasslands in Nalsarovar Bird Sanctuary could impact the habitat of migratory birds, such as flamingos, disrupting their breeding and feeding grounds. The reduction in shrubland and savanna in Kumbhalgarh Wildlife Sanctuary may lead to a decline in herbivorous species like the Indian gazelle and negatively affect predator species like the Indian wolf that rely on these prey species.
Impact on Waterbodies: While natural land cover classes such as forests, shrublands, and savannas are declining, there is a concurrent increase in waterbodies driven by the development of irrigation and other water management projects. For example, in the Rann of Kutch (Districts of Kachchh, Surendranagar, Banas Kantha, in the Saurashtra and Kacchh IMD sub-division), the area covered by waterbodies has increased significantly, reflecting efforts to enhance water resources for agricultural and urban use. Increased waterbodies can benefit aquatic plants and provide habitat for species like the Indian wild ass and various migratory birds. However, it may also lead to the displacement of terrestrial flora and fauna due to changing landscapes.
Bareland Reduction: In Velavadar Blackbuck National Park (Bhavnagar district in Saurashtra and Kutch IMD sub-division), bareland has significantly decreased while agriculture has increased. This suggests that previously uncultivated lands are being brought under agricultural production, driven by the expansion needs of the agrarian economy. The conversion of bareland to agricultural fields can disrupt the habitat of the blackbuck and other grassland species, leading to reduced grazing areas and increased human-wildlife conflict in the national park.

4.3. Comparison of LULC Changes with Other Large-Scale Infrastructure Projects

Our observation of a substantial increase in agricultural land, a trend also found in studies such as Meiyappan et al. (2016) [47], underscores the significance of the DMIC and BRI in the context of global infrastructure projects. Like the DMIC, the BRI has significantly altered land use patterns, particularly by converting natural habitats into agricultural and industrial zones. Both projects have grappled with the challenge of balancing economic development with environmental sustainability. However, the BRI’s scale and geographic diversity present unique challenges, such as transnational coordination and varying environmental regulations across countries, that are not as prominently seen in the DMIC.
Our findings on the DMIC underscore the role of economic development in driving land use changes—a crucial point that needs to be addressed in sustainable planning. Increased trade activities and economic development are key drivers of these changes. This is further supported by Zhang et al. (2022) [21], who demonstrated that the BRI significantly influences agricultural land use, confirming earlier findings. Their study explored the spatio-temporal dynamics of LULC in BRI regions, utilizing the Landscape Ecological Risk Index to assess how the initiative impacts land cover and ecological risks over time, which can be the subject of further research in the DMIC.
The decreases in shrubland and grassland observed in our study are not isolated incidents; they are consistent with global patterns seen in other large-scale infrastructure projects. For instance, due to infrastructure development, the BRI regions have experienced similar reductions in natural landscapes. Our findings, which corroborate these trends and highlight the impacts of the DMIC’s industrial activities on local vegetation, contribute to the global urbanization and environmental change discourse, adding a valuable regional perspective.
Our observations on the DMIC underscore the importance of strategic planning to minimize negative ecological impacts. Teo et al. (2019) [27] supports this by characterizing the impacts of several BRI infrastructure projects on local ecosystems and proposing a typology to understand better and mitigate environmental disruptions.
Additionally, our study on the DMIC highlights challenges in LULCC mapping, emphasizing the need for improved methodologies to address issues in accuracy and consistency. This is consistent with findings by Naboureh et al. (2020) [23], who reviewed similar challenges and underscored the importance of accurate mapping for effective land use planning and the development of robust environmental policies.
The modest increase in forest areas observed in our study indicates the success of afforestation and reforestation efforts by smart cities such as Pune and Surat. This is consistent with similar global initiatives, such as China’s Green Great Wall project, which aims to combat desertification through large-scale tree planting. The difference is that the Green Great Wall is federally funded in China, while it is enabled as a local city-level reforestation initiative in India.
The European Union’s reforestation efforts, part of their broader environmental sustainability goals, also provide a useful comparison. The EU has implemented extensive programs to restore natural habitats and enhance biodiversity. These efforts in the EU are driven by strong policy frameworks and significant investment in environmental restoration, demonstrating the importance of governance in successful reforestation initiatives.
Similar trends of urban expansion and increased built-up areas have been noted in the context of the European Union’s Trans-European Transport Network (TEN-T). However, the EU’s regulatory framework and environmental impact assessments provide a more structured approach to mitigating negative impacts than the DMIC. Our findings highlight the need for enhanced regulatory mechanisms governing the construction and operational phases of the DMIC to balance development with sustainability. This can be achieved through enhancing the SCM Livability Index and aligning DMIC with the Sustainable Development Goals (SDGs).

4.4. Implications for Policy and Planning

The observed trends in LULC changes, particularly the expansion of agricultural land and the reduction of natural landscapes, call for targeted policies that balance economic growth with environmental conservation. Promoting sustainable agricultural practices, enhancing green urban spaces, and implementing stringent land-use regulations are essential strategies to mitigate the adverse effects of urbanization and industrialization. Two policies can regulate the construction and operational phases of the DMIC.
Our findings emphasize the need for sustainable land management practices in the DMIC, highlighting significant fluctuations in land use over recent decades. Although our approach utilized MODIS data, this finding aligns with the work of Chen et al. (2018) [24], who examined spatio-temporal changes in agricultural land in China using alternative approaches such as the Food and Agriculture Organization (FAO) statistics and GlobeLand30 data.

4.4.1. The SCM City Livability Index

Integrating LULC studies into the SCM Livability Index Model significantly impacts urban sustainability and compliance monitoring. Specifically, incorporating LULC metrics into indices such as the Mixed Use and Compactness Index, Open Space Index, Housing and Inclusiveness Index, Pollution Index, and Mobility Index can support a better understanding of land transformation’s effects on ecosystems. These indices track changes like green space conversion and habitat fragmentation, essential for developing balanced land use strategies, preserving biodiversity, and reducing urban sprawl.

4.4.2. Sustainable Development Goals

In India, Niti Aayog is the nodal governmental agency that sets the data collection and reporting framework, whereas the individual states have annual implementation responsibilities. While SDGs are not applied to large infrastructure projects, several elements of the program, particularly in the context of monitoring LULC changes, can be considered:
  • Sustainable Urbanization (SDG 11.3): Monitoring the ratio of the land consumption rate to the population growth rate and ensuring participatory urban planning processes to create inclusive, sustainable communities.
  • Climate Resilience (SDG 13.1 and 13.2): Integrating climate change adaptation measures and disaster risk reduction strategies into the project planning and implementation phases. This would include time-series analysis, as conducted in this study.
  • Conservation of Terrestrial Ecosystems (SDG 15.1 and 15.3): Ensuring the conservation and sustainable use of forests and wetlands, combating land degradation, and striving for land degradation neutrality by monitoring changes in forest cover and protecting important biodiversity sites.
  • Protection of Water-related Ecosystems (SDG 6.6): Protecting and restoring water-related ecosystems impacted by the DMIC projects, such as rivers and wetlands, to maintain biodiversity and water quality.
  • Sustainable Infrastructure (SDG 9.1): Developing resilient infrastructure that supports economic development while minimizing environmental impact, ensuring equitable access to infrastructure for all communities.
By aligning the DMIC project with these SDGs, the initiative can foster sustainable development that balances economic growth with environmental conservation and social well-being.

4.5. Limitations and Future Research Directions

Future research should address several limitations of our study. The dominance of rural areas within the DMIC ZoI and the 500 m spatial resolution of MODIS data may necessitate further research with higher resolutions (30 m) to determine the extent of urban LULC changes. Utilizing higher-resolution data and more advanced machine-learning models would also enhance the accuracy and granularity of LULC analyses. Future research should explore the causal mechanisms behind the correlations and develop targeted interventions to address the district-specific identified challenges. Extending the temporal scope beyond 2021 would provide a more comprehensive view of the ongoing changes and their long-term impacts. Additionally, more comparative studies with other large-scale infrastructure projects globally could enrich our understanding of LULC dynamics and further validate our findings.

5. Conclusions

This study examines LULC changes over 2 decades in 121 districts and 24 smart cities under the DMIC’s zone of influence. The methodology provides a robust framework for LULC analysis over a two-decade span, enabling the high-accuracy assessment of changes and trends. Integrating satellite imagery and GIS digitization, overlaid upon the IMD sub-divisional framework and advanced statistical tests, ensures that the results are scientifically reliable and can inform future land management and policy decisions.
While agricultural land has expanded year-on-year, shrubland and grassland areas have declined. Major infrastructure projects developing built-up and urban areas in the DMIC over the next few decades must consider this baseline of LULC changes observed over the last two decades.
Our study documents the effectiveness of reforestation efforts within the specific context of smart cities in the DMIC, providing a model for similar initiatives elsewhere. This regional success story can inform policy and practice in other regions pursuing similar environmental restoration goals.
This study’s regional analysis goes beyond administrative boundaries by using the IMD sub-divisions as a framework. The IMD sub-divisions represent contiguous, cohesive, and homogenous tracts of land, transcending administrative boundaries. This approach enables our LULC analysis and is useful for the short-term and long-term monitoring of LULC changes in the DMIC. The IMD sub-divisional approach is unique compared to other research that uses political boundaries, such as states, provinces, or countries.
Further, the IMD framework as an analytical unit is foundational for other agroecological, climatic, meteorological, and environmental research. The IMD also publishes internationally accepted datasets that researchers can use to integrate with this DMIC study for additional outcomes. The dominance of rural areas within the DMIC ZoI and the 500 m spatial resolution of MODIS data may necessitate further research with higher resolutions to determine the extent of urban LULC changes accurately and accordingly, further research is needed to refine the LULC classification at higher spatial resolutions. Additionally, more in-depth studies should explore the relationship between LULC changes and land surface temperature, precipitation, and relative humidity to better understand the potential effects on population settlements in the DMIC study area.
This study offers significant insights and methodologies that can be applied to other infrastructure projects globally, such as the Chennai Bengaluru Industrial Corridor in India and the Eastern Economic Corridor in Thailand. By systematically analyzing the LULC dynamics, this study provides critical insights into the anthropogenic drivers of land cover changes. These findings serve as a valuable reference for policymakers, conservationists, and researchers engaged in sustainable development planning within the DMIC. The balance between urban growth and conservation remains crucial for the sustainable development of these rapidly evolving smart cities.

Supplementary Materials

The following supporting information can be downloaded at: https://www.mdpi.com/article/10.3390/land13070957/s1, Supplementary Section A. Sen’s slope graphs for the DMIC, smart cities, and other districts. Supplementary Section B. Summary of time series for smart cities and other districts. Table S1. Summary of Kendall’s tau and Sen’s slope for time series analysis of decadal LULC changes for smart cities in the DMIC. Table S2. Summary of Kendall’s tau and Sen’s slope for time series analysis of decadal LULC changes for districts in the DMIC. Supplementary Section C. Table S3. Summary of time series for Ecologically Sensitive Areas in the DMIC.

Author Contributions

A.K. conceptualized and wrote the manuscript. V.N. guided the methodology. N.K.T. recommended the manuscript’s visual presentation and mapping content. E.W. recommended the statistical tests in the trend analysis. R.R.M. processed MODIS data via Google Earth Engine and ran the ground truthing exercise. A.K. processed the LULC data using IBM SPSS, developed all maps using ArcGIS, and ran the statistical tests using IBM SPSS, Excel, and XLSTAT. All authors have read and agreed to the published version of the manuscript.

Funding

This research received no external funding.

Data Availability Statement

The original contributions presented in the study are included in the article; further inquiries can be directed to the corresponding author.

Conflicts of Interest

There are no potential conflicts of interest.

References

  1. National Industrial Corridor Development Corporation. Available online: https://www.nicdc.in/index.php/delhi-mumbai-industrial-corridor-dmic.html (accessed on 6 February 2021).
  2. Jain, S.; Panda, J.; Kant, S. Possible socio-scientific issues of Land-use and Land-cover change impact and associated tools of study with a special reference to Delhi-Mumbai Industrial Corridor Region. Int. J. Earth Atmos. Sci. 2014, 1, 58–70. [Google Scholar]
  3. Jain, S.; Roy, S.; Panda, J. Modeling land-use and land-cover change impact on summertime near-surface temperature variability over the Delhi-Mumbai Industrial Corridor. Model. Earth Syst. Environ. 2021, 7, 1309–1319. [Google Scholar] [CrossRef]
  4. Smart City Mission. Available online: http://164.100.161.224/content/ (accessed on 1 March 2024).
  5. Concept Paper of DMIC. Available online: https://dmaicindia.files.wordpress.com/2013/07/concept-paper-of-dmic-2007.pdf (accessed on 25 September 2023).
  6. Mukhopadhyay, C. Is the Delhi Mumbai Industrial Corridor (DMIC) an Emerging ‘Megaregion’ in India. Plan. Theory Pract. 2018, 19, 305–309. [Google Scholar] [CrossRef]
  7. Jat, M.K.; Garg, P.K.; Khare, D. Monitoring and modelling of urban sprawl using remote sensing and GIS techniques. Int. J. Appl. Earth Obs. Geoinf. 2008, 10, 26–43. Available online: https://www.sciencedirect.com/science/article/pii/S0303243407000335 (accessed on 25 November 2023). [CrossRef]
  8. Sulla-Menashe, D.; Gray, J.M.; Abercrombie, S.P.; Friedl, M.A. Hierarchical mapping of annual global land cover 2001 to present: The MODIS Collection 6 Land Cover product. Remote Sens. Environ. 2019, 222, 183–194. [Google Scholar] [CrossRef]
  9. Lal, P.; Dubey, A.K.; Kumar, A. Measuring the control of landscape modifications on surface temperature in India. Geocarto Int. 2022, 37, 15736–15753. [Google Scholar] [CrossRef]
  10. Mathan, M.; Krishnaveni, M. Monitoring spatio-temporal dynamics of urban and peri-urban land transitions using ensemble of remote sensing spectral indices-a case study of Chennai Metropolitan Area. Environ. Monit. Assess. 2020, 192, 15. [Google Scholar]
  11. Sahana, R.; Ahmed, R.; Sajjad, H. Analyzing land surface temperature distribution in response to land use/land cover change using split window algorithm and spectral radiance model in Sundarban Biosphere Reserve. Model. Earth Syst. Environ. 2016, 2, 1–11. [Google Scholar] [CrossRef]
  12. Nayak, S. Land use and land cover change and their impact on temperature over central India. Lett. Spat. Resour. Sci. 2021, 14, 129–140. [Google Scholar] [CrossRef]
  13. Duraisamy, V.; Bendapudi, R.; Jadhav, A. Identifying hotspots in land use land cover change and the drivers in a semi-arid region of India. Environ. Monit. Assess. 2018, 190, 535. [Google Scholar] [CrossRef]
  14. Garai, D.; Narayana, A.C. Land use/land cover changes in the mining area of Godavari coal fields of southern India. Egypt. J. Remote Sens. Space Sci. 2018, 21, 375–381. [Google Scholar] [CrossRef]
  15. Moulds, S.; Buytaert, W.; Mijic, A. A spatio-temporal land use and land cover reconstruction for India from 1960–2010. Sci. Data 2018, 5, 1–11. [Google Scholar] [CrossRef]
  16. Jain, M.; Korzhenevych, A. Detection of urban system in India: Urban hierarchy revisited. Landsc. Urban Plan. 2019, 190, 103588. [Google Scholar] [CrossRef]
  17. Ramachandran, H. Review of Industrial and Development Corridors in India. Available online: https://isid.org.in/publication/h-ramachandran-review-of-industrial-and-development-corridors-in-india-wp217-december-2019/ (accessed on 25 November 2023).
  18. Williams, G.; Mahadevia, D.; Schindler, S.; Chattaraj, S. Megaprojects, mirages, and miracles: Territorializing the Delhi-Mumbai Industrial Corridor (DMIC) and state restructuring in contemporary India. Territ. Politics Gov. 2023, 11, 456–477. [Google Scholar] [CrossRef]
  19. Kumar, J.; Sharma, R. Highway peripheral urbanization, industrialization, and land use change: A case study of NH-48 in National Capital Region. GeoJournal 2023, 88, 2969–2981. [Google Scholar] [CrossRef]
  20. Biswas, P.; Dey, P. Spatio-temporal impact of industrial corridor development on built-up growth: A case of Delhi-Mumbai industrial corridor, India. GeoJournal 2023, 88, 3791–3815. [Google Scholar] [CrossRef]
  21. Zhang, J.; Ren, M.; Lu, X.; Li, Y.; Cao, J. Effect of the Belt and Road Initiatives on Trade and Its Related LUCC and Ecosystem Services of Central Asian Nations. Land 2022, 11, 828. [Google Scholar] [CrossRef]
  22. Zhang, X.; Yao, Y.; Luo, J.; Liang, W. Exploring Changes in Land Use and Landscape Ecological Risk in Key Regions of the Belt and Road Initiative Countries. Land 2022, 11, 940. [Google Scholar] [CrossRef]
  23. Naboureh, A.; Bian, J.; Lei, G.; Li, A. A review of land use/land cover change mapping in the China- Central Asia-West Asia economic corridor countries. Big Earth Data 2020, 5, 237–257. [Google Scholar] [CrossRef]
  24. Chen, D.; Yu, Q.; Hu, Q.; Xiang, M.; Zhou, Q.; Wu, W. Cultivated land change in the Belt and Road Initiative region. J. Geogr. Sci. 2018, 28, 1580–1594. [Google Scholar] [CrossRef]
  25. Dong, S.; Li, Y.; Li, Y.; Li, S. Spatiotemporal patterns and drivers of Land Use and Land Cover Change in the China-Mongolia- Russia Economic Corridor. Pol. J. Environ. Stud. 2021, 30, 2527–2541. [Google Scholar] [CrossRef]
  26. Zuo, Q.; Li, X.; Hao, L.; Hao, M. Spatiotemporal evolution of Land-Use and ecosystem services valuation in the Belt and Road Initiative. Sustainability 2020, 12, 6583. [Google Scholar] [CrossRef]
  27. Teo, H.C.; Lechner, A.M.; Walton, G.W.; Chan, F.K.S.; Cheshmehzangi, A.; Tan-Mullins, M.; Chan, H.K.; Sternberg, T.; Campos-Arceiz, A. Environmental impacts of infrastructure development under the Belt and Road Initiative. Environments 2019, 6, 72. [Google Scholar] [CrossRef]
  28. Hansen, M.C.; Potapov, P.V.; Moore, R. High-resolution global maps of 21st-century forest cover change. Science 2013, 342, 850–853. [Google Scholar] [CrossRef] [PubMed]
  29. Cortes, C.; Vapnik, V. Support-Vector Networks. Mach. Learn. 1995, 20, 273–297. [Google Scholar] [CrossRef]
  30. Breiman, L. Random Forests. Mach. Learn. 2001, 45, 5–32. [Google Scholar] [CrossRef]
  31. Breiman, L.; Friedman, J.; Olshen, R.A.; Stone, C. Classification and Regression Trees, 1st ed.; Chapman and Hall/CRC: Boca Raton, FL, USA, 1984. [Google Scholar]
  32. Ouma, Y.; Nkwae, B.; Moalafhi. Comparison of Machine Learning Classifiers for Multitemporal and Multisensor Mapping of Urban LULC Features, The International Archives of the Photogrammetry. Remote Sens. Spat. Inf. Sci. 2022, XLIII-B3-2022, 681–689. [Google Scholar] [CrossRef]
  33. Foody, G.M.; Mathur, A. Toward intelligent training data allocation for the classification of remotely sensed data. Int. J. Remote Sens. 2004, 25, 3031–3036. [Google Scholar] [CrossRef]
  34. Congalton, R.G.; Green, K. Assessing the Accuracy of Remotely Sensed Data: Principles and Practices; CRC Press: Boca Raton, FL, USA, 2008. [Google Scholar]
  35. Mountrakis, G.; Im, J.; Ogole, C. Support vector machines in remote sensing: A review. ISPRS J. Photogramm. Remote Sens. 2011, 66, 247–259. Available online: https://www.sciencedirect.com/science/article/pii/S0924271610001140 (accessed on 12 October 2023). [CrossRef]
  36. Donchyts, G.; Baart, F.; Winsemius, H.; Gorelick, N.; Kwadijk, J.; Giesen, N.V.D. Earth’s surface water change over the past 30 years. Nat. Clim. Chang. 2016, 6, 810–813. [Google Scholar] [CrossRef]
  37. Schneider, D.P.; Deser, C.; Fasullo, J.; Trenberth, K.E. Climate Data Guide Spurs Discovery and Understanding. Eos Trans. Am. Geophys. Union 2013, 94, 121–122. [Google Scholar] [CrossRef]
  38. The Climate Data Guide. Available online: https://climatedataguide.ucar.edu/climate-data/ceres-igbp-land-classification (accessed on 25 December 2023).
  39. Friedl, M.; Sulla-Menashe, D.; Tan, B.; Schneider, A.; Ramankutty, N.; Sibley, A.; Huang, X. MODIS Collection 5 global land cover: Algorithm refinements and characterization of new datasets. Remote Sens. Environ. 2010, 114, 168–182. [Google Scholar] [CrossRef]
  40. Jensen, J.R. Introductory Digital Image Processing: A Remote Sensing Perspective, 4th ed.; Prentice-Hall Inc.: Upper Saddle River, NJ, USA, 2005. [Google Scholar]
  41. Landis, J.R.; Koch, G. The Measurement of Observer Agreement for Categorical Data. Biometrics 1977, 33, 159–174. [Google Scholar] [CrossRef]
  42. XLSTAT Statistical and Data Analysis Solution. Available online: www.xlstat.com/en (accessed on 12 October 2023).
  43. Roboaa, E.M.; Al-Barazanji, Z.; Mann. Kendall trend analysis of surface air temperatures and rainfall in Iraq. Q. J. Hung. Meteorol. Serv. 2015, 119, 493–514. [Google Scholar]
  44. Alhaji, U.U.; Yusuf, A.S.; Edet, C.O.; Oche, C.O.; Agbo, E. Trend analysis of temperature in Gombe state using Mann Kendall trend test. J. Sci. Res. Rep. 2018, 20, 1–9. [Google Scholar] [CrossRef]
  45. Kisi, O.; Ay, M. Comparison of Mann-Kendall and innovative trend method for water quality parameters of the Kizilirmak River. Turk. J. Hydrol. 2014, 513, 362–375. [Google Scholar] [CrossRef]
  46. Sen, P.K. Estimates of the Regression Coefficient Based on Kendall’s Tau. J. Am. Stat. Assoc. 1968, 63, 1379–1389. [Google Scholar] [CrossRef]
  47. Meiyappan, P.; Roy, P.S.; Sharma, Y.; Ramachandran, R.M.; Joshi, P.K.; DeFries, R.S.; Jain, A.K. Dynamics and determinants of land change in India: Integrating satellite data with village socioeconomics. Reg. Environ. Chang. 2016, 17, 753–766. [Google Scholar] [CrossRef]
Figure 1. Methodology flowchart.
Land 13 00957 g001
Figure 2. The study area (DMIC) with the smart cities and IMD sub-divisions.
Land 13 00957 g002
Figure 3. Agricultural LULC changes between 2000 and 2021 in the DMIC ZoI—(A) Sen’s Slope —Agriculture LULC Changes in Smart Cities. (B) Sen’s Slope—Agriculture LULC Changes in Other Districts.
Land 13 00957 g003
Figure 4. Bareland LULC changes between 2000 and 2021 in the DMIC ZoI—(A) Sen’s Slope—Bareland LULC Changes in Smart Cities. (B) Sen’s Slope—Bareland LULC Changes in Other Districts.
Land 13 00957 g004
Figure 5. Forest LULC changes between 2000 and 2021 in the DMIC ZoI—(A) Sen’s SlopeForest LULC Changes in Smart Cities. (B) Sen’s Slope—Forest LULC Changes in Other Districts.
Land 13 00957 g005
Figure 6. Grassland LULC changes between 2000 and 2021 in the DMIC ZoI—(A) Sen’s Slope—Grassland LULC Changes in Smart Cities. (B) Sen’s Slope—Grassland LULC Changes in Other Districts.
Land 13 00957 g006
Figure 7. Shrubland LULC changes between 2000 and 2021 in the DMIC ZoI—(A) Sen’s Slope—Shrubland LULC Changes in Smart Cities. (B) Sen’s Slope—Shrubland LULC Changes in Other Districts.
Land 13 00957 g007
Figure 8. Built-up LULC changes between 2000 and 2021 in the DMIC ZoI—(A) Sen’s Slope—Built-Up LULC Changes in Smart Cities. (B) Sen’s Slope—Built-Up LULC Changes in Other Districts.
Land 13 00957 g008
Figure 9. Waterbody LULC changes between 2000 and 2021 in the DMIC ZoI—(A) Sen’s Slope—Waterbody LULC Changes in Smart Cities. (B) Sen’s Slope—Waterbody LULC Changes in Other Districts.
Land 13 00957 g009
Table 1. IMD sub-divisions, zone of influence, and smart cities within the DMIC.
IMD
Sub-Division/Union Territory
Total Area under
the DMIC ZoI in
Total Area
Under the
Total #
of Districts
Smart Cities 1
sq. km.DMIC ZoI in %
Chandigarh,61,339.009.47%30Faridabad, Karnal, and
Haryana, New Delhi
and Delhi
Dadra and622.250.10%3Diu and Silvassa 2
Nagar Haveli 2
East Madhya3630.250.56%1
Pradesh
East156,423.7524.15%23Ajmer
Rajasthan
East Uttar285.500.04%1Agra
Pradesh
Gujarat91,741.0014.17%18Ahmedabad, Dohad,
Region Gandhinagar, Surat,
and Vadodara
Konkan and23,403.253.61%5Thane
Goa
Madhya66,206.0010.22%8Nashik
Maharashtra
Marathwada464.000.07%1Pune
Punjab1293.750.20%3
Saurashtra and52,533.258.11%7Rajkot
Kachh
Uttarakhand11,374.501.76%7Dehradun
West17,077.752.64%8
Madhya
Pradesh
West92,522.0014.29%7Jaipur, Kota, and
Rajasthan Udaipur
West Uttar68,711.5010.61%23Aligarh, Bareilly,
Pradesh Moradabad, and
Saharanpur
15 IMD sub-divisions647,627.75100.00%14524 Smart Cities
1. Smart cities under the Smart Cities Mission (https://smartcities.gov.in/cities-profiles, accessed on 1 March 2024) 2. Diu and Silvassa are smart cities in the Dadra and Nagar Haveli Union Territory, which is within the DMIC zone of influence.
Table 2. IGBP classifications of land cover and reclassification.
LC #LC DescriptionReclassification Description
1Evergreen Needleleaf Forests: dominated by evergreen conifer trees (canopy > 2 m).
Tree cover > 60%.
Combined into Forests
2Evergreen Broadleaf Forests are dominated by evergreen broadleaf and palmate trees (canopy > 2 m). Tree cover > 60%.Combined into Forests
3Deciduous Needleleaf Forests: dominated by deciduous needleleaf (larch) trees (canopy > 2 m). Tree cover > 60%.Combined into Forests
4Deciduous Broadleaf Forests: dominated by deciduous broadleaf trees (canopy > 2 m). Tree cover > 60%.Combined into Forests
5Mixed Forests: dominated by neither deciduous nor evergreen (40–60% of each) tree type (canopy > 2 m). Tree cover > 60%.Combined into Forests
6Closed Shrublands: dominated by woody perennials (1–2 m height) >60% cover.Reclassified and combined into Shrublands
7Open Shrublands: dominated by woody perennials (1–2 m height) 10–60% cover.Reclassified and combined into Shrublands
8Woody Savannas: tree cover 30–60% (canopy > 2 m).Reclassified and combined into Grasslands/Savannas
9Savannas: tree cover 10–30% (canopy > 2 m).Reclassified and combined into Grasslands/Savannas
10Grasslands: dominated by herbaceous annuals (<2 m).Reclassified and combined into Grasslands/Savannas
11Permanent Wetlands: permanently inundated lands with 30–60% water cover and >10% vegetated cover.Combined into Waterbody
12Croplands: at least 60% of area is cultivated cropland.Combined into Agriculture
13Urban and Built-up Lands: at least 30% impervious surface area including building materials, asphalt and vehicles.Renamed as Built-up Land
14Cropland/Natural Vegetation Mosaics: mosaics of small-scale cultivation 40–60% with natural tree, shrub, or herbaceous vegetation.Combined into Agriculture
15Permanent Snow and Ice: at least 60% of area is covered by snow and ice for at least 10 months of the year.No Change
16Barren: at least 60% of area is non-vegetated barren (sand, rock, soil) areas with less than 10% vegetation.Renamed as Bareland
17Water Bodies: at least 60% of area is covered by permanent waterbodies.Combined into Waterbody
Table 3. Combined LULC classes and area in the DMIC ZoI.
LC #LULC ClassArea in sq. km. and Percent of Area (%)
1Agriculture514,503.25 (79.44%)
2Bareland10,916.5 (1.69%)
3Built-up land (including urban)10,949.5 (1.69%)
4Forest37,446.25 (5.8%)
5Grassland55,838.5 (8.6%)
6Shrubland13,892.75 (2.15%)
7Waterbody4081.00 (0.63%)
647,627.75 (100%)
Table 4. Alpha (p-value) symbols in Kendall’s tau and associated probabilities used in the study.
Alpha (p-Value)Symbols Used in Kendall’s Tau SignificanceProbability
0.10For p-value <= 0.1, the symbol used is +90.00%
0.05For p-value <= 0.05, the symbol used is *95.00%
0.01For p-value <= 0.01, the symbol used is **99.00%
0.001For p-value <= 0.001, the symbol used is ***99.90%
Table 5. LULC changes during 2001–2021 in the DMIC ZoI.
LULC ClassesCurrent LULC Area in sq. km. as of 2021 (% of Total)Kendall’s tau (LULC Changes during 2001–2021)p-Value (Significance Symbol) 1Sen’s Slope in sq. km. per Year Change during 2001–2021
Agriculture514,503.25 (79.44%)0.676<0.0001 (***)3031.40
Bareland10,916.5 (1.69)−0.667<0.0001 (***)−203.76
Forest10,949.5 (1.69%)0.3430.031 (*)148.14
Grassland37,446.25 (5.8%)−0.819<0.0001 (***)−1119.62
Shrubland55,838.5 (8.6%)−0.5050.001 (***)−1774.72
Built-up (including urban)13,892.75 (2.15%)1.000<0.0001 (***)21.48
Waterbody4081 (0.63%)0.619<0.0001 (***)55.73
647,627.75 (100%)
1 For p-value <= 0.05, significance symbol = * (95% probability) and for p-value <= 0.001, significance symbol = *** (99.9% probability).
Table 6. Land use transfer matrix.
LULC ClassForestShrublandGrasslandWaterbodyAgricultureBuilt-UpBareland
Forest1−0.095−0.3330.2670.1520.343−0.390
Shrubland−0.09510.514−0.619−0.829−0.5050.495
Grassland−0.3330.5141−0.648−0.686−0.8190.581
Waterbody0.267−0.619−0.64810.6760.619−0.610
Agriculture0.152−0.829−0.6860.67610.676−0.552
Built-up0.343−0.505−0.8190.6190.6761−0.667
Bareland−0.3900.4950.581−0.610−0.552−0.6671
Table 7. IMD sub-divisions and Sen’s slope for LULC changes between 2001 and 2021.
Sen’s Slope for LULC Changes in sq. km. per Year 1
No.IMD Sub-Division 2AgricultureBarelandForest GrasslandShrub-LandBuilt-Up Waterbody
1Chandigarh, Haryana, and Delhi 64.33 - 1.07 (34.60) (33.44) 7.50 0.08
2East Madhya Pradesh 4.69 (0.45) - (4.50) - - 0.29
3East Rajasthan 599.14 (1.64) 8.46 (288.24) (317.25) 2.27 6.35
4East Uttar Pradesh 0.29 (0.06) - (0.25) - - -
5Gujarat Region 423.85 (7.14) 35.48 (253.98) (177.06) 3.08 15.37
6Konkan and Goa (151.05) (0.64) 56.47 85.95 - 3.05 4.65
7Madhya Maharashtra 123.84 (7.04) 41.12 (172.29) (4.37) 2.19 5.71
8Marathwada 0.14 - - (0.15) - - -
9Punjab (0.03) - - 0.02 (0.03) - -
10Saurashtra and Kachh 361.18 (48.44) 8.72 (187.55) (117.66) 0.48 22.08
11Uttarakhand (25.28) (0.06) 24.72 5.21 - 1.61 0.74
12West Madhya Pradesh 38.50 (0.24) 0.67 (37.36) (2.13) 0.07 0.17
13West Rajasthan 1593.31 (137.90) (28.57) (232.98) (1122.79) 0.93 0.05
14West Uttar Pradesh (3.29) (2.80) (3.42) 2.15 - 5.92 0.12
1 Sen’s slopes for LULC changes in sq. km. per year shown in the table are associated with p-values of lesser than 0.1 (90% to 99.90% probability), 2 Dadra and Nagar Haveli is a Union Territory within the DMIC zone of influence. This Union Territory was also modeled as it has two smart cities, Diu and Silvassa. The Sen’s slope for LULC changes for Dadra and Nagar Haveli for agriculture is (1.51) sq. km. per year, for bareland is (0.15) sq. km. per year, for grassland is 1.11 sq. km. per year, for built-up land is 0.31 sq. km. per year, and for waterbody is 0.23 sq. km. per year.
Disclaimer/Publisher’s Note: The statements, opinions and data contained in all publications are solely those of the individual author(s) and contributor(s) and not of MDPI and/or the editor(s). MDPI and/or the editor(s) disclaim responsibility for any injury to people or property resulting from any ideas, methods, instructions or products referred to in the content.

