Article

Water-Nutrient Coupling Strategies That Improve the Carbon, Nitrogen Metabolism, and Yield of Cucumber under Sandy Cultivated Land

1
College of Horticulture and Forestry, Tarim University, Aral 843300, China
2
Xinjiang Production & Construction Corps Key Laboratory of Facility Agriculture, Tarim University, Aral 843300, China
*
Author to whom correspondence should be addressed.
Land 2024, 13(7), 958; https://doi.org/10.3390/land13070958
Submission received: 28 May 2024 / Revised: 25 June 2024 / Accepted: 26 June 2024 / Published: 29 June 2024
(This article belongs to the Special Issue Plant-Soil Interactions in Agricultural Systems)

Abstract

:
The purpose of this study was to explore the carbon and nitrogen metabolism mechanisms of sand-cultivated cucumbers under different deficit irrigation–nitrogen management strategies and provide a theoretical basis for their greenhouse management. This study set up two factors, the deficit irrigation level and the nitrogen application rate, and conducted an experiment on deficit irrigation–nitrogen coupling of sand-cultivated cucumbers using a quadratic saturation D–optimal design. Seven treatments were set up in the experiment, to measure the soluble sugar and protein contents, as well as the activity of key enzymes for carbon and nitrogen metabolism at five different growth stages. The results indicate that the 80% irrigation with 623 kg N hm−2 (IN4) treatment significantly improved the soluble sugar, protein, and actual leaf nitrogen contents of cucumber at the five different growth stages and, as a result, achieved higher sucrose synthase (SS) and sucrose phosphate synthase (SPS) activities in the cucumber leaves. Furthermore, such improvements were due to the reduction in oxidative damage of sand–cultivated cucumber at various growth stages. The IN4 and 89% irrigation with 1250 kg N hm−2 (IN5) treatments significantly increased the activities of RuBisCO, catalase (CAT), peroxidise (POD), and superoxide dismutase (SOD) at various growth stages of sand-cultivated cucumber. The higher activities of glutamate dehydrogenase (GLDH), glutamate synthase (GOGAT), nitrate reductase (NR), glutamine synthase (GS), acid invertase enzyme (AIE), neutral invertase enzyme (NIE), and better antioxidative enzyme activities were recorded under the IN4 treatments at various growth stages, which effectively improve (69.6%) cucumber yield. The soil properties, carbon and nitrogen metabolism, and antioxidant metabolism were positively correlated with sand-cultivated cucumber yield in a greenhouse. We concluded that the IN4 treatment was the better deficit irrigation–nitrogen management strategy because it considerably improves carbon and nitrogen metabolism, antioxidant enzyme activities, and sand–cultivated cucumber yield in a greenhouse.

1. Introduction

For decades, world agriculture has been challenged by water shortages and nitrogen pollution [1]. Blindly increasing the amounts of irrigation and chemical fertilizer applied can improve vegetable yield, but this approach has caused several problems, such as a decline in vegetable quality, secondary soil salinization, and energy waste [2,3]. Therefore, it is an important task facing modern agriculture to reduce the emissions of agricultural pollutants to the minimum while maintaining the production and quality of crops. Improvements in irrigation systems and the optimization of the application of nitrogen fertilizer are effective strategies to solve this problem [4,5,6]. Over the past decade, accurate and efficient irrigation and fertilization management has become a major issue in agricultural production [7], particularly in drought and half-drought areas [8]. Ali et al. [9] estimated that, by 2050, drought will seriously affect the growth of more than 50% of crops that can be cultivated. There is rapid progress in the development of economical and efficient fertilization in the greenhouse water-saving stage of fertilizer irrigation and irrigation [10,11]. Therefore, it is necessary to maintain the amount of production of crops and to control the water-saving irrigation nitrogen management measures to increase the production of cucumber under sandy conditions.
Drought stress adversely affects the content of soluble protein (SP) in cucumber leaves, thereby affecting plant sucrose content [11]. Under drought conditions, irrigation promotes plant tissue development and causes a significant increase in nitrogen and SPS content [12]. However, water stress adversely affects the biochemical and physiological processes of plants [13]. The changes in these biochemical and physiological processes also affect plant growth and eventually reduce the production of cucumbers [14]. These results suggest that alternate irrigation strategies can improve the water use efficiency [15] of crops without significantly reducing production and can improve the quality of fruit [16] at the same time. In addition to moisture management, nitrogen nutrition is also an important plant macronutrient, which is an important component of proteins and enzymes and is very important for plant growth, production, and the quality of fruit. Many studies have investigated the combination of irrigation and nitrogen supply [17,18]. Because of the serious waste of resources caused by unreasonable irrigation fertilization, water utilization efficiency is low; groundwater contamination is serious, and the base and production efficiency of soil are low [19,20].
The irrigation nitrogen coupling strategy has a major beneficial effect on the plant–soil system by improving soil structure and permeability to increase the salt leaching rate [21,22], providing essential nutrients for plants [23], and rebuilding microbial activity and populations [24]. Research has shown that, under insufficient irrigation conditions, irrigation mainly improves the quality of cucumber fruits by increasing the content of soluble solids and vitamin C as well as the sugar-to-acid ratio [25]. A lower N supply reduces the quantity and yield of fruits, while it enhances some quality attributes of fruits, manifested by greater hardness and a higher sugar concentration [26].
Thus, oxidative damage adversely affects plant performance [27]. However, crops have developed an advanced antioxidant defense system using enzymes such as superoxide dismutase (SOD), peroxide (POD), and catalase (CAT) [28]. Therefore, it is an important strategy to increase the photosynthetic capacity of plants by raising the activity of SOD, POD, Rubisco, and CAT in the leaves under dry conditions [29]. Water stress may cause a significant decline in the production and quality of vegetable crops [30], which are highly sensitive to water stress. The water–nitrogen binding strategy affects the nutrient absorption of the root system of crops by changing mineral nutrients in the root environment and can affect the overall growth of crops [31]. Within a certain range, improving the water–nitrogen binding strategy can reduce the loss of mineral nutrients and avoid the waste of fertilizer [32], thereby reducing production costs and groundwater pollution and raising the production of crops [33]. Therefore, it is important to understand the response and adaptation to the drought conditions of high-value vegetable crops, to establish effective crop production strategies and to increase the productivity of vegetable crops [34].
Cucumber is one of the most economically relevant vegetable crops in China [35]. In China, cucumber is a vegetable crop commonly seen in agricultural production systems and is a protected vegetable production system. However, strategies for protecting cucumber from oxidative damage and retarding the aging process are important to improve antioxidant defense systems [36]. However, as far as we know, studies have not yet been conducted to understand the response to oxidative stress by drought in a greenhouse of cucumber, soil properties, leaf nitrogen content, and cucumber yield. Therefore, the coordinated effects of irrigation–nitrogen coupling strategies on carbon and nitrogen metabolism mechanisms, antioxidant systems, rubisco activity, nitrogen content, and sand-cultivated cucumber yields were investigated. The results are predicted to provide some explanations for the increase in cucumber yield by irrigation–nitrogen coupling strategies in a greenhouse.

2. Materials and Methods

2.1. Research Study Area

The experiment was conducted from March to July 2021 at the Horticultural Experiment Station of Tarim University (81°17′ E, 40°32′ N, altitude 990 m) in an energy–saving greenhouse. The cucumber variety “Yushengmei”, which was used by local farmers, was planted. The soil physicochemical properties of the research site were Eum–Orthrosols (Chinese Soil Taxonomy), with an organic matter = 6.53 g kg−1, total nitrogen (TN) = 1.29 g kg−1, total phosphorus (TP) = 0.24 g kg−1, total potassium (TK) = 0.46 g kg−1, available nitrogen (AN) = 6.61 mg kg−1, available phosphorus (AP) = 8.01 mg kg−1, available potassium (AK) = 38.34 mg kg−1, nitrate nitrogen = 0.12 mg kg−1, ammonium nitrogen = 3.32 mg kg−1, pH value of 7.49, and EC value of 3.16 μS/cm, respectively. The experiment adopts slot cultivation, with an area of 0.5 × 2.6 m = 1.3 m2 and a depth of 0.4 m for each cultivation slot. The plant spacing is set at 0.25 m, the large row spacing is 0.6 m, and the small row spacing is 0.3 m. Double–row cultivation is carried out, with 20 cucumbers planted in each plot and 50,000 seedlings preserved per hectare. A total of 7 treatments were set up, each with 3 replicates, for a total of 21 treatments with 420 cucumber plants. We installed a row of protective cultivation tanks on both sides of the greenhouse.

2.2. Experimental Design

The experiment was conducted with two factors: the irrigation level and nitrogen application rate. A quadratic saturation D–optimal design (6–point design with p = 2) was adopted, and a treatment IN7 with the highest code value was added. Temperature and humidity are collected with a temperature and humidity RR-9100 logger (Beijing Yugen technology co led., Beijing China) in Figure 1. This treatment was only used as a reference and did not participate in regression analysis to maintain the superiority of the original plan (Table 1).
The irrigation amount is calculated according to Formula (1), with the maximum irrigation limit set at 100% of the field capacity and the minimum value set at 65% of the field capacity; the lower limit of soil moisture is the actual substrate moisture content of each treatment measured at 8:00 a.m. every day. The substrate moisture content is measured in real-time using a DM–300 (Shenzhen Enzi Electronics Co., Shenzhen, China) soil moisture analyzer, and the soil is regularly collected and calibrated using the drying method. When the soil moisture content approaches or decreases to 60% of the lower limit of irrigation, irrigation is carried out, and fertilizer is applied together with the water.
M Irrigation   = r × p × h × θ f × q 1 q 2 η
In the formula, r = soil bulk density, which is 1.61 g cm3; p = soil moisture ratio, taken as 100%; h = wet layer of irrigation plan, taken as 0.35 m; θf = field water capacity, 14.02%; q1 and q2 = represent the upper limit and lower limit of the soil moisture, respectively (expressed as a percentage of relative field water capacity); η = the water use coefficient is 0.9 for drip irrigation.
The elemental fertilizers used in large amounts in the experiment were urea (containing N 46%), potassium dihydrogen phosphate (containing P2O5 51%), and potassium sulfate (containing K2O 50%). Based on the nutrient content in the substrate and the principle of nutrient balance, the amount of phosphorus and potassium fertilizers was set to 290 kg hm2 and 800 kg hm2, respectively. Nitrogen, phosphorus, and potassium fertilizers were topdressing with water and applied every 5 days, a total of 20 times. Nitrogen fertilizer was applied in equal amounts each time in each treatment, with 49% phosphorus fertilizer and 21% potassium fertilizer applied in the first 7 times. The remaining phosphorus and potassium fertilizer were applied in equal amounts each time, and trace elements were sprayed in an appropriate amount according to plant growth requirements.

2.3. Data Collection and Measurements

We extracted the fourth functional leaf from top to bottom from five cucumber plants during the seedling stage (20 days after water and nitrogen treatment), flowering stage (35 days after water and nitrogen treatment), initial melon stage (53 days after water and nitrogen treatment), vigorous melon stage (78 days after water and nitrogen treatment), and final melon stage (100 days after water and nitrogen treatment) for the determination of carbon and nitrogen metabolism and related enzyme activities. We measured the total soluble sugar content in leaves using the anthrone method; the soluble protein content was stained using the Coomassie Brilliant Blue G–250 staining method. The activity of key enzymes for carbon and nitrogen metabolism was measured using a plant ELISA kit (Jiangsu Kete Biotechnology Co., Ltd., Yancheng, China), including sucrose phosphate synthase (SPS), sucrose synthase (SS), nitrate reductase (NR), glutamate synthase (GOGAT), glutamate dehydrogenase (GLDH), glutamine synthase (GS), acid invertase enzyme (AIE), and neutral invertase enzyme (NIE). The dry sample of the leaves was crushed through a 0.149 mm mesh sieve and digested using the H2SO4–H2O2 method. The digested solution was used for the determination of total nitrogen content using a fully automatic SmartChem200 intermittent chemical analyzer (AMS, Rome, Italy).

2.4. Enzyme Extracts Preparation and Antioxidant Enzyme Activities

We took v phosphate buffer (pH 7.8), 0.1 mM EDTA Na2, and 1% insoluble PVP from 0.5 g of leaf homogenate with the midrib removed. We centrifuged the homogenate at 15,000× g for 10 min at 40 °C. After centrifugation, we took the upper supernatant for enzyme determination. According to the technique used by Li [37], the total SOD activity was analyzed at 560 nm. SOD activity is expressed as U g−1 FW h−1. According to Amalo et al. [38], the POD activity was calculated using guaiacol at 470nm. POD activity is expressed as U g−1 FW min−1. The determination of CAT activity was based on the method proposed by Tan et al. [39]. CAT activity is expressed as U g−1 FW min−1.
From the early stage of cucumber fruiting to seedling pulling, the harvested cucumber fruits are directly weighed using a one percent balance. We calculated the individual fruit weight and yield of cucumbers harvested in each community and converted the yield per hectare.

2.5. Statistical Analysis

We analyzed the data using SPSS 18.0 (IBM, San Jose, CA, USA) and analyzed the data obtained from each sampling event separately. Multiple comparisons were tested using Duncan’s new multiple-range test. If the F–test was significant, we evaluated the mean using the (LSD 0.05) multiple comparison test.

3. Results

3.1. Soluble Sugar, Soluble Protein, and Actual Leaf Nitrogen Contents

The soluble sugar and protein contents of cucumber leaves significantly increased with the increasing drip irrigation and nitrogen application rates at various growth stages (Table 2 and Table 3). The soluble sugar content was closely correlated to the protein content and considerably improved the cucumber yield. The soluble sugar and protein contents of leaves were considerably greater from 20 DAT to 78 DAT, whereas they significantly declined from 78 DAT to 100 DAT during the same treatments for the 2021 study year. The mean soluble sugar and protein contents under the IN4 and IN5 treatments considerably increased by 24.6% and 19.7% and 26.1% and 30.1%, respectively, compared to those in the IN1 treatment. During the 2021 study year, soluble sugar and protein contents under the IN4 treatment were significantly higher than the rest of all other treatments at 20, 35, 53, 78, and 100 DAT. However, with respect to the supply of maximum drip irrigation (100%) and nitrogen fertilizer (1250 kg hm−2), there were no significant differences recorded in soluble sugar and protein contents at various growth stages. The drip irrigation considerably affected the soluble sugar and protein contents of leaves at each nitrogen application level during the various growth stages of cucumber.
The IN4 and IN5 treatments had significantly (p < 0.05) greater leaf nitrogen contents during various growth stages of cucumber than the rest of all other treatments (Table 3). There were non-significant differences in leaf nitrogen content at the IN4 and IN5 treatments during various growth stages. Samples from the IN4 treatment had significantly higher leaf nitrogen content than that of all of the other treatments at each growth stage (with the exception of the IN5 treatment). During the 2021 study year, the IN4 and IN5 treatments significantly increased leaf nitrogen content by 27.5% and 33.1% more than that of the IN1 treatment. The leaf nitrogen content significantly increased from 20 DAT to 53 DAT, while the leaf nitrogen content revealed a considerably decreasing trend from 53 DAT to 100 DAT among all the treatments. The leaf nitrogen content considerably improved by 5.5% more in the IN5 treatment than in the IN4 treatment.

3.2. Acid Invertase Enzyme (AIE), Neutral Invertase Enzyme (NIE), and Nitrate Reductase (NR) Activities

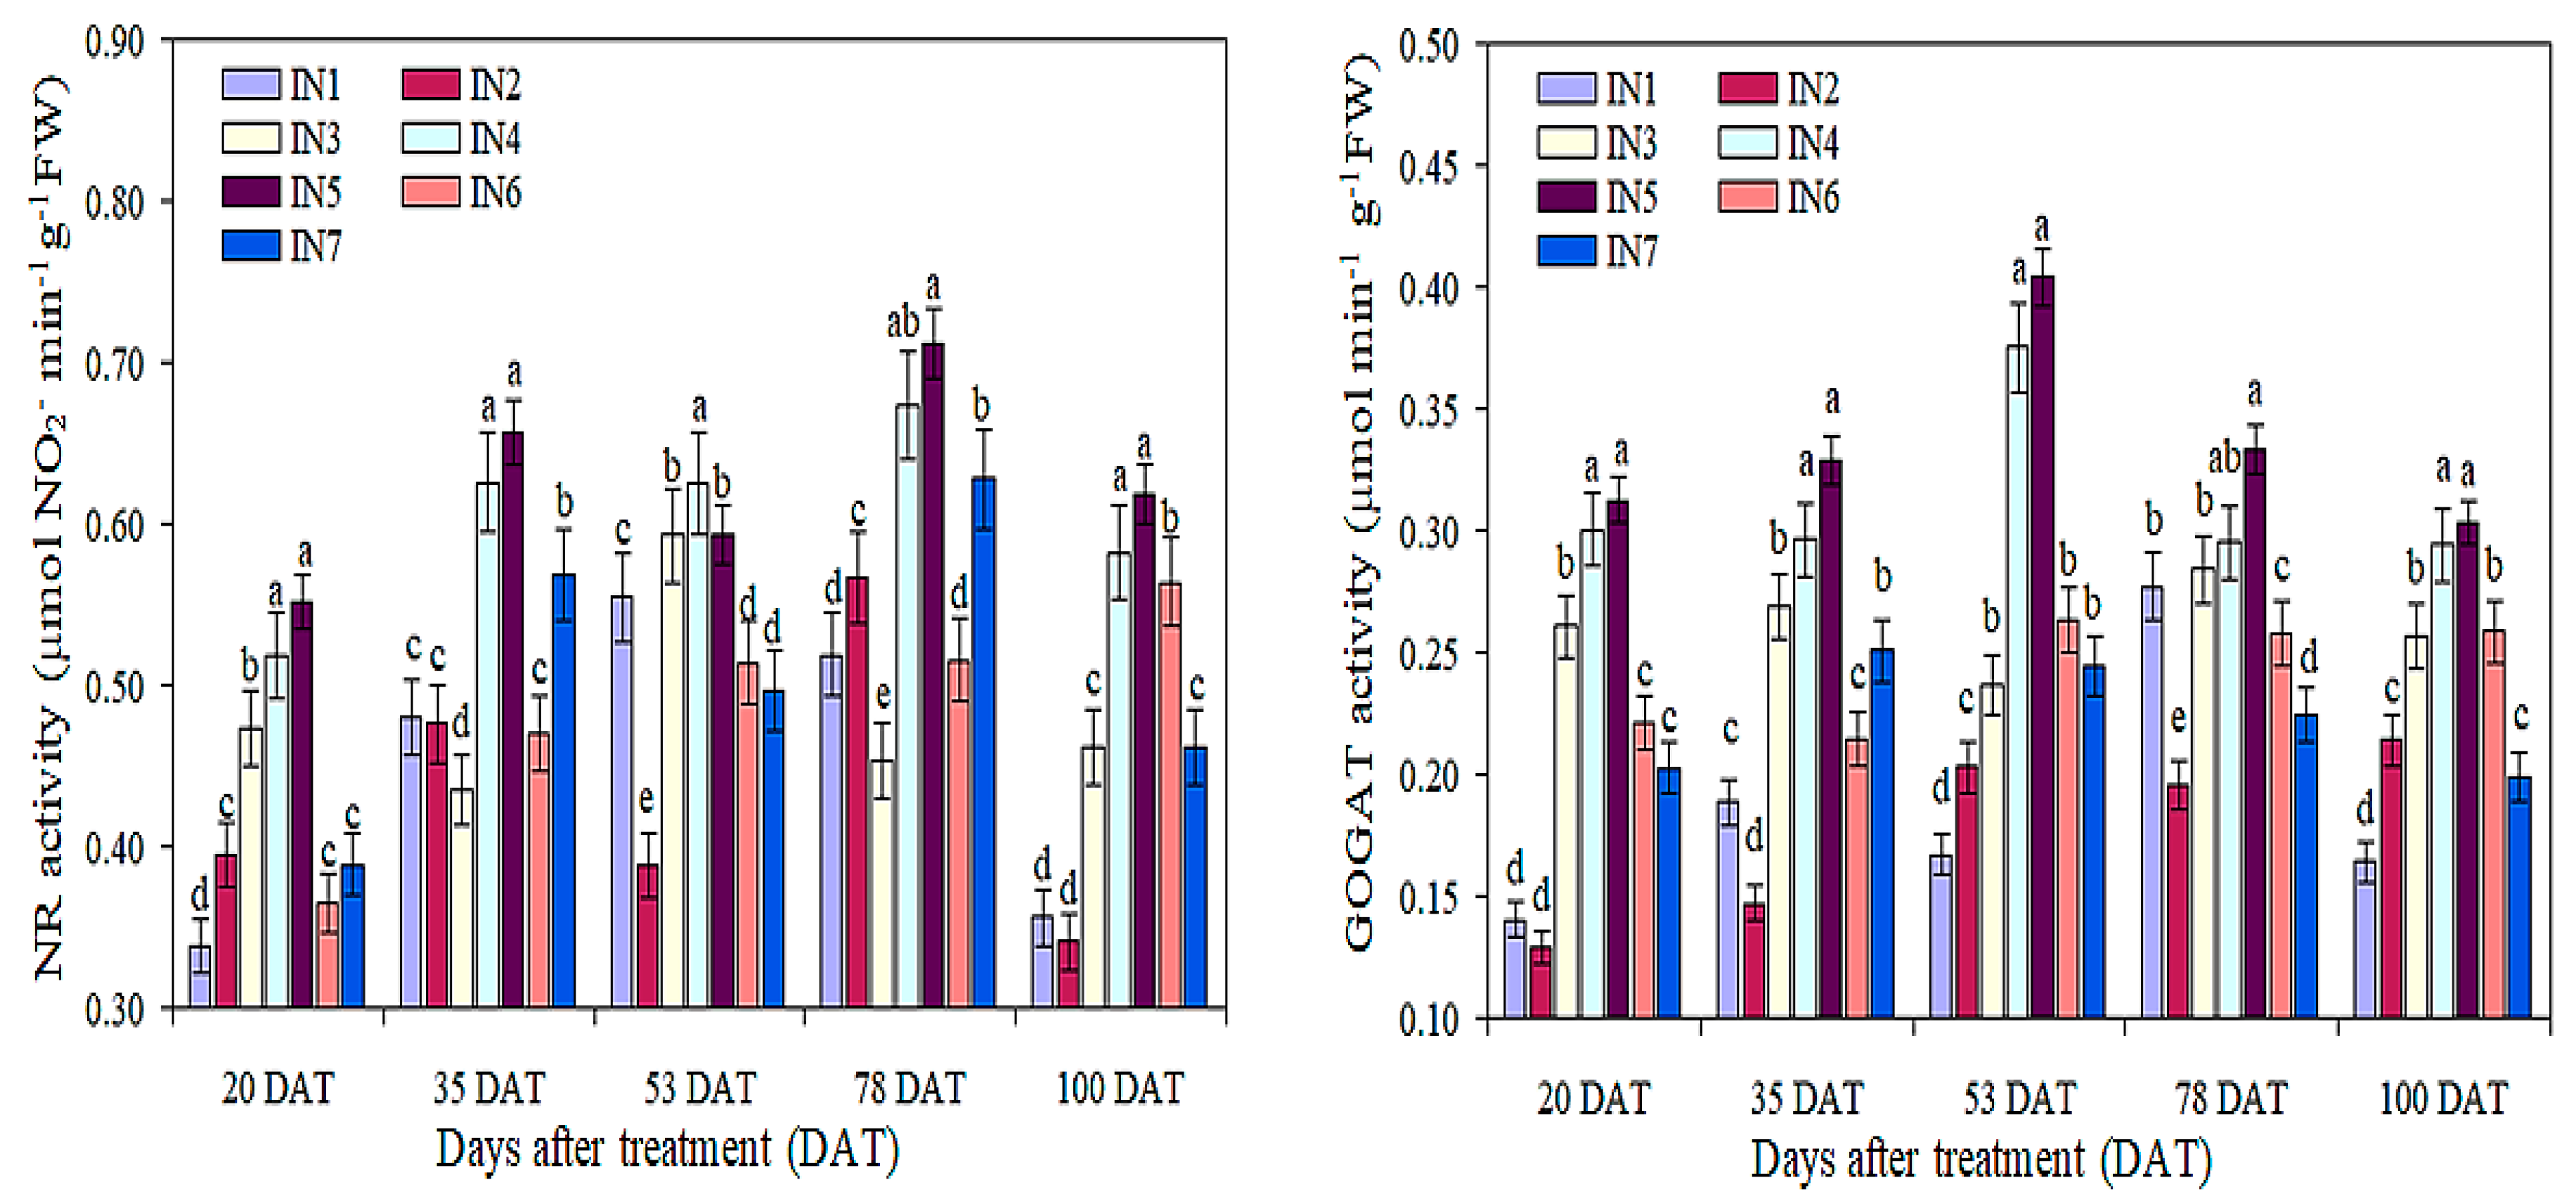
Under the IN4 and IN5 treatments, the AIE, NIE, and NR contents of cucumber leaves considerably increased at various growth stages (Table 4 and Figure 2). The AIE, NIE, and NR contents of cucumber leaves improved gradually at 20 to 53 DAT and then decreased from 53 to 100 DAT. Moreover, AIE, NIE, and NR contents rapidly increased from 35 to 53 DAT under both IN4 and IN5 treatments. However, during the 2021 study year, the average of the five different growth stages of cucumber revealed that the IN4 and IN5 treatments had produced considerably more (15.9% and 18.1%) AIE (23.9% and 23.5%) NIE, and (25.8% and 28.8%) NR in the cucumber leaves than that of the IN1 treatment. The AIE, NIE, and NR contents of cucumber leaves were considerably greater in the IN5 treatment, compared with all other treatments at 20, 35, 53, 78, and 100 DAT. During 53 DAT, AIE, NIE, and NR contents of cucumber leaves reached the highest values under the various treatments.

3.3. Glutamate Synthase (GOGAT), Glutamate Dehydrogenase (GLDH), and Glutamine Synthase (GS) Activities

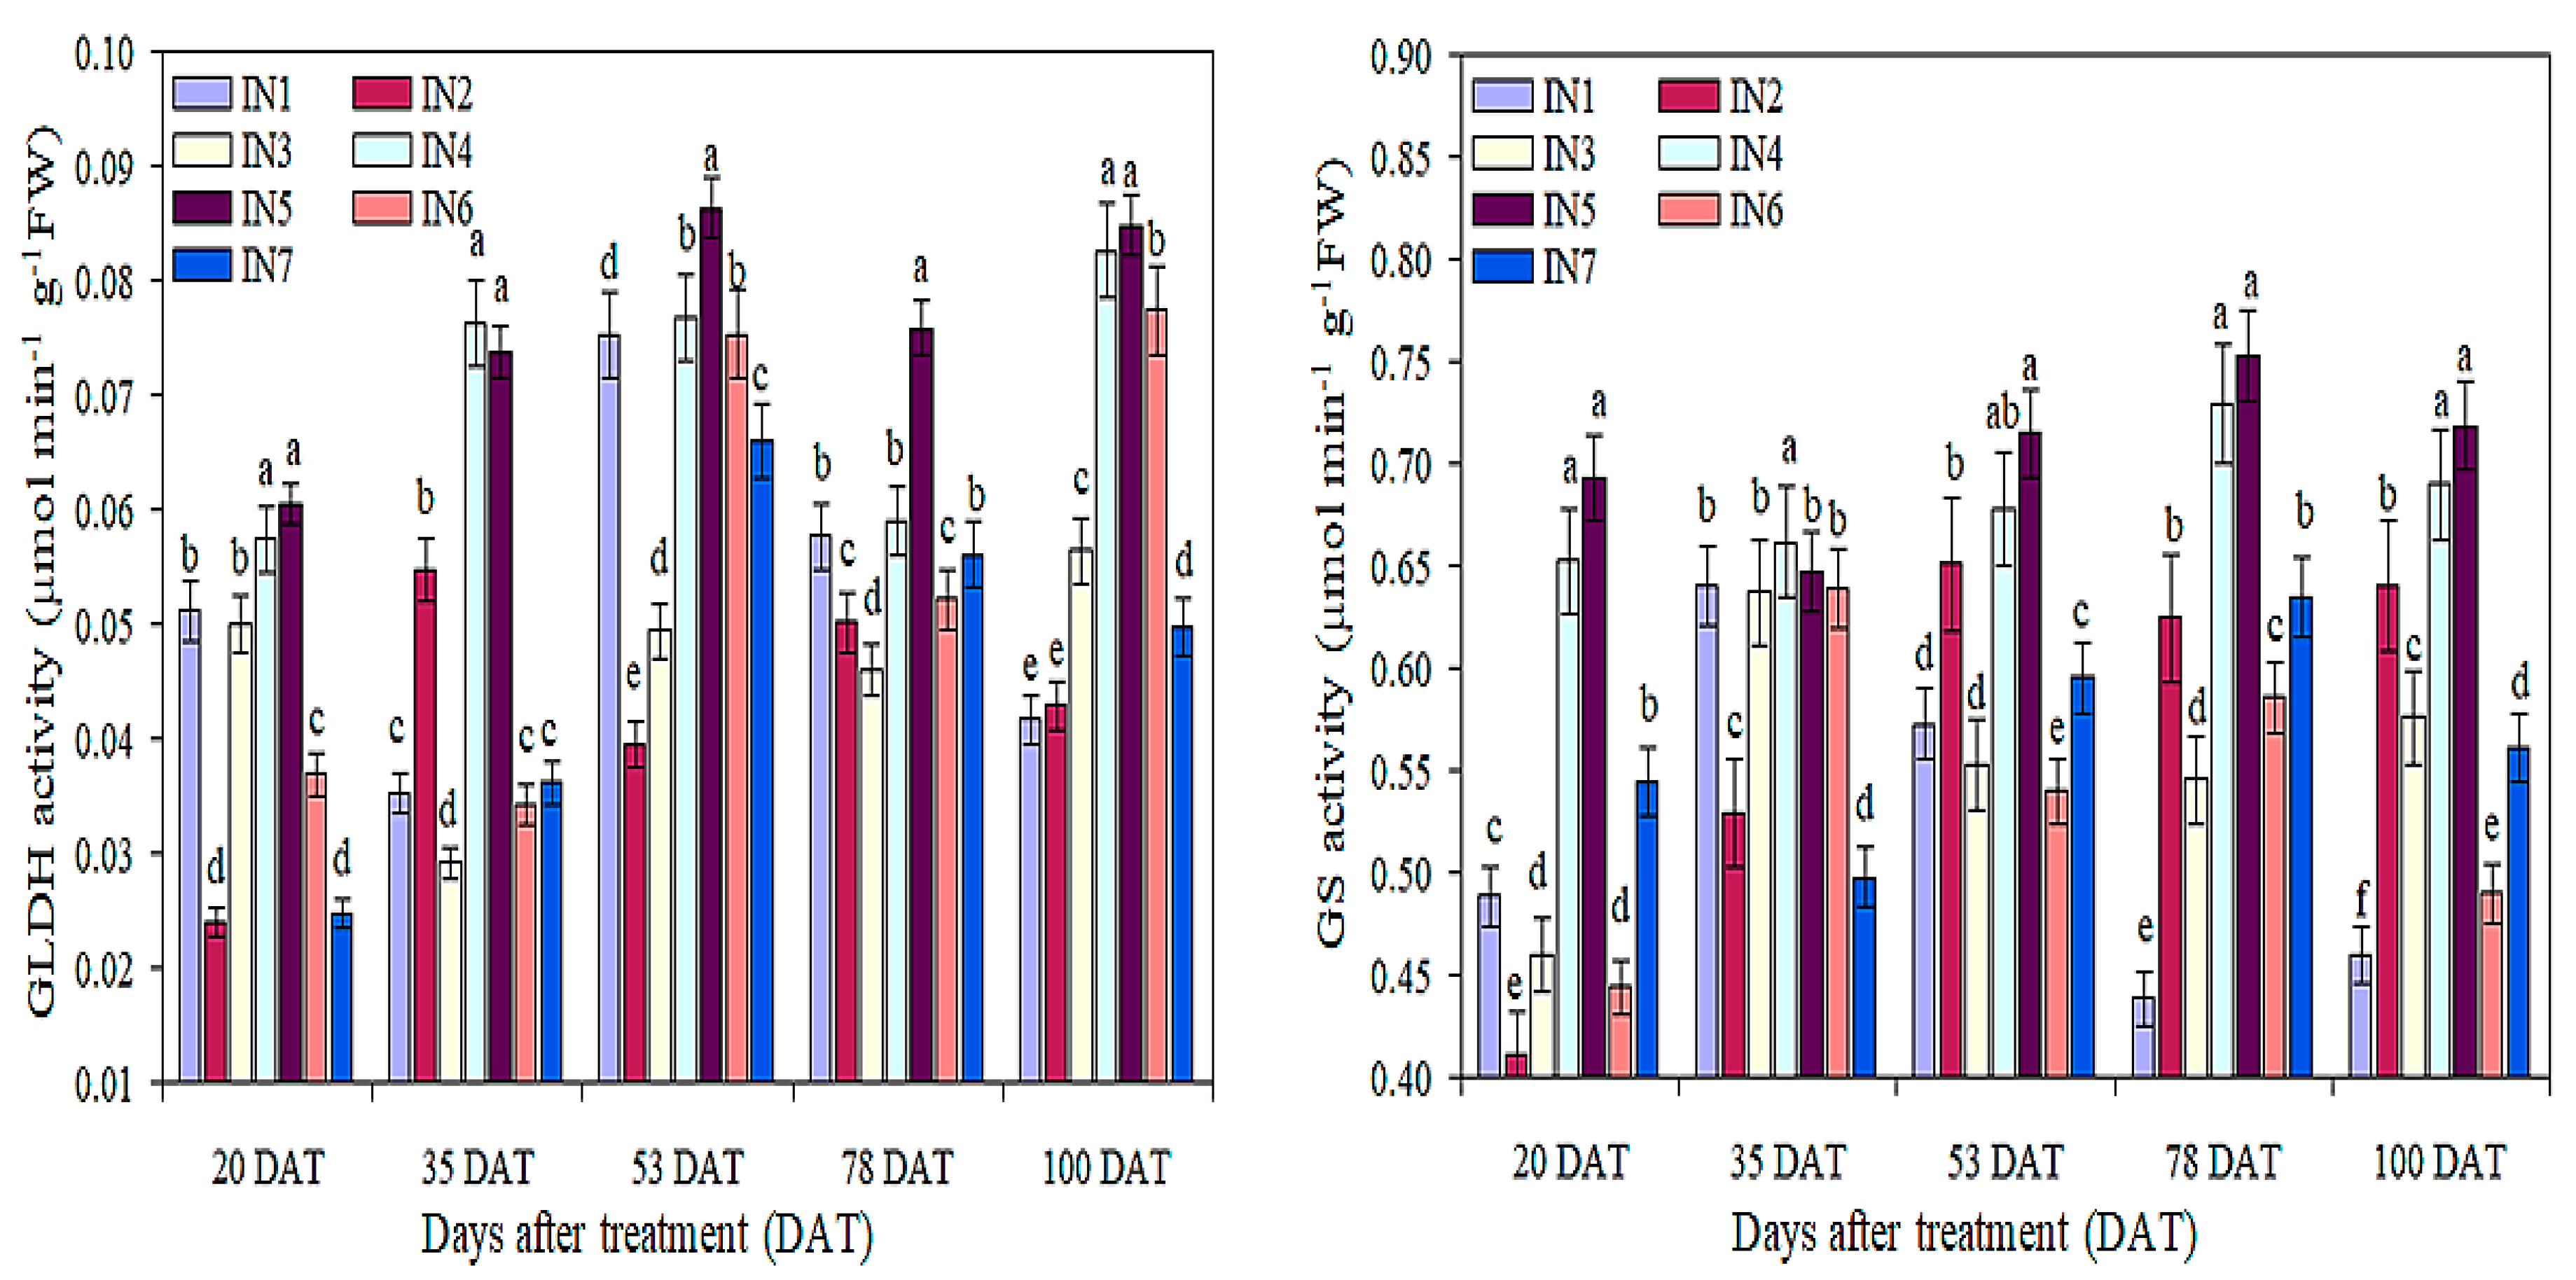
Under the IN4 and IN5 treatments, the GOGAT, GLDH, and GS activities at various growth stages were considerably greater than that of all other treatments (Figure 2 and Figure 3). Under the IN4 and IN5 treatments, the GOGAT, GLDH, and GS activities significantly increased with increasing irrigation (80%) and nitrogen fertilizer (623 kg hm−2) at 20, 35, 53, 78, and 100 DAT. The GOGAT contents, under the IN4 treatment at 20, 35, 53, 78, and 100 DAT, were significantly greater by 53%, 27%, 39%, 6%, and 44%, respectively, and the GLDH contents were significantly greater by 11%, 54%, 2%, 2%, and 50%, and the GS contents were significantly greater by 22%, 3%, 16%, 38%, and 32% than those of the IN1 treatment. The GOGAT contents under the IN5 treatment, at 20, 35, 53, 78, and 100 DAT, were significantly greater by 55%, 43%, 59%, 17%, and 46%, the GLDH contents were significantly greater by 27%, 52%, 13%, 24%, and 51%, and the GS contents were significantly greater by 30%, 1%, 20%, 42%, and 36% than those of the IN1 treatment. During the 53 DAT, GOGAT, GLDH, and GS activities of cucumber leaves reached the highest values under the various treatments.

3.4. Sucrose Phosphate Synthase (SPS) and Sucrose Synthase (SS) Activities

The interactive effect of irrigation with the nitrogen application strategy significantly increased the SPS and SS activities of cucumber leaves (Figure 4). However, there was no considerable variance recorded in the SPS and SS activities under the IN4 and IN5 treatments. The IN4 treatment significantly increased the SPS and SS activities by 16.9% and 9.4% more than those of the IN1 treatment. Under the IN5 treatment, there were significant increases in SPS and SS activities by 21.7% and 11.6% more than those of the IN1 treatment. There were non-significant variances between the IN4 and IN5 treatments. At each drip irrigation with nitrogen application levels, the SPS and SS activities were significantly greater under the IN4 and IN5 treatments, respectively.

3.5. CAT, POD, RuBisCO, and SOD Activities

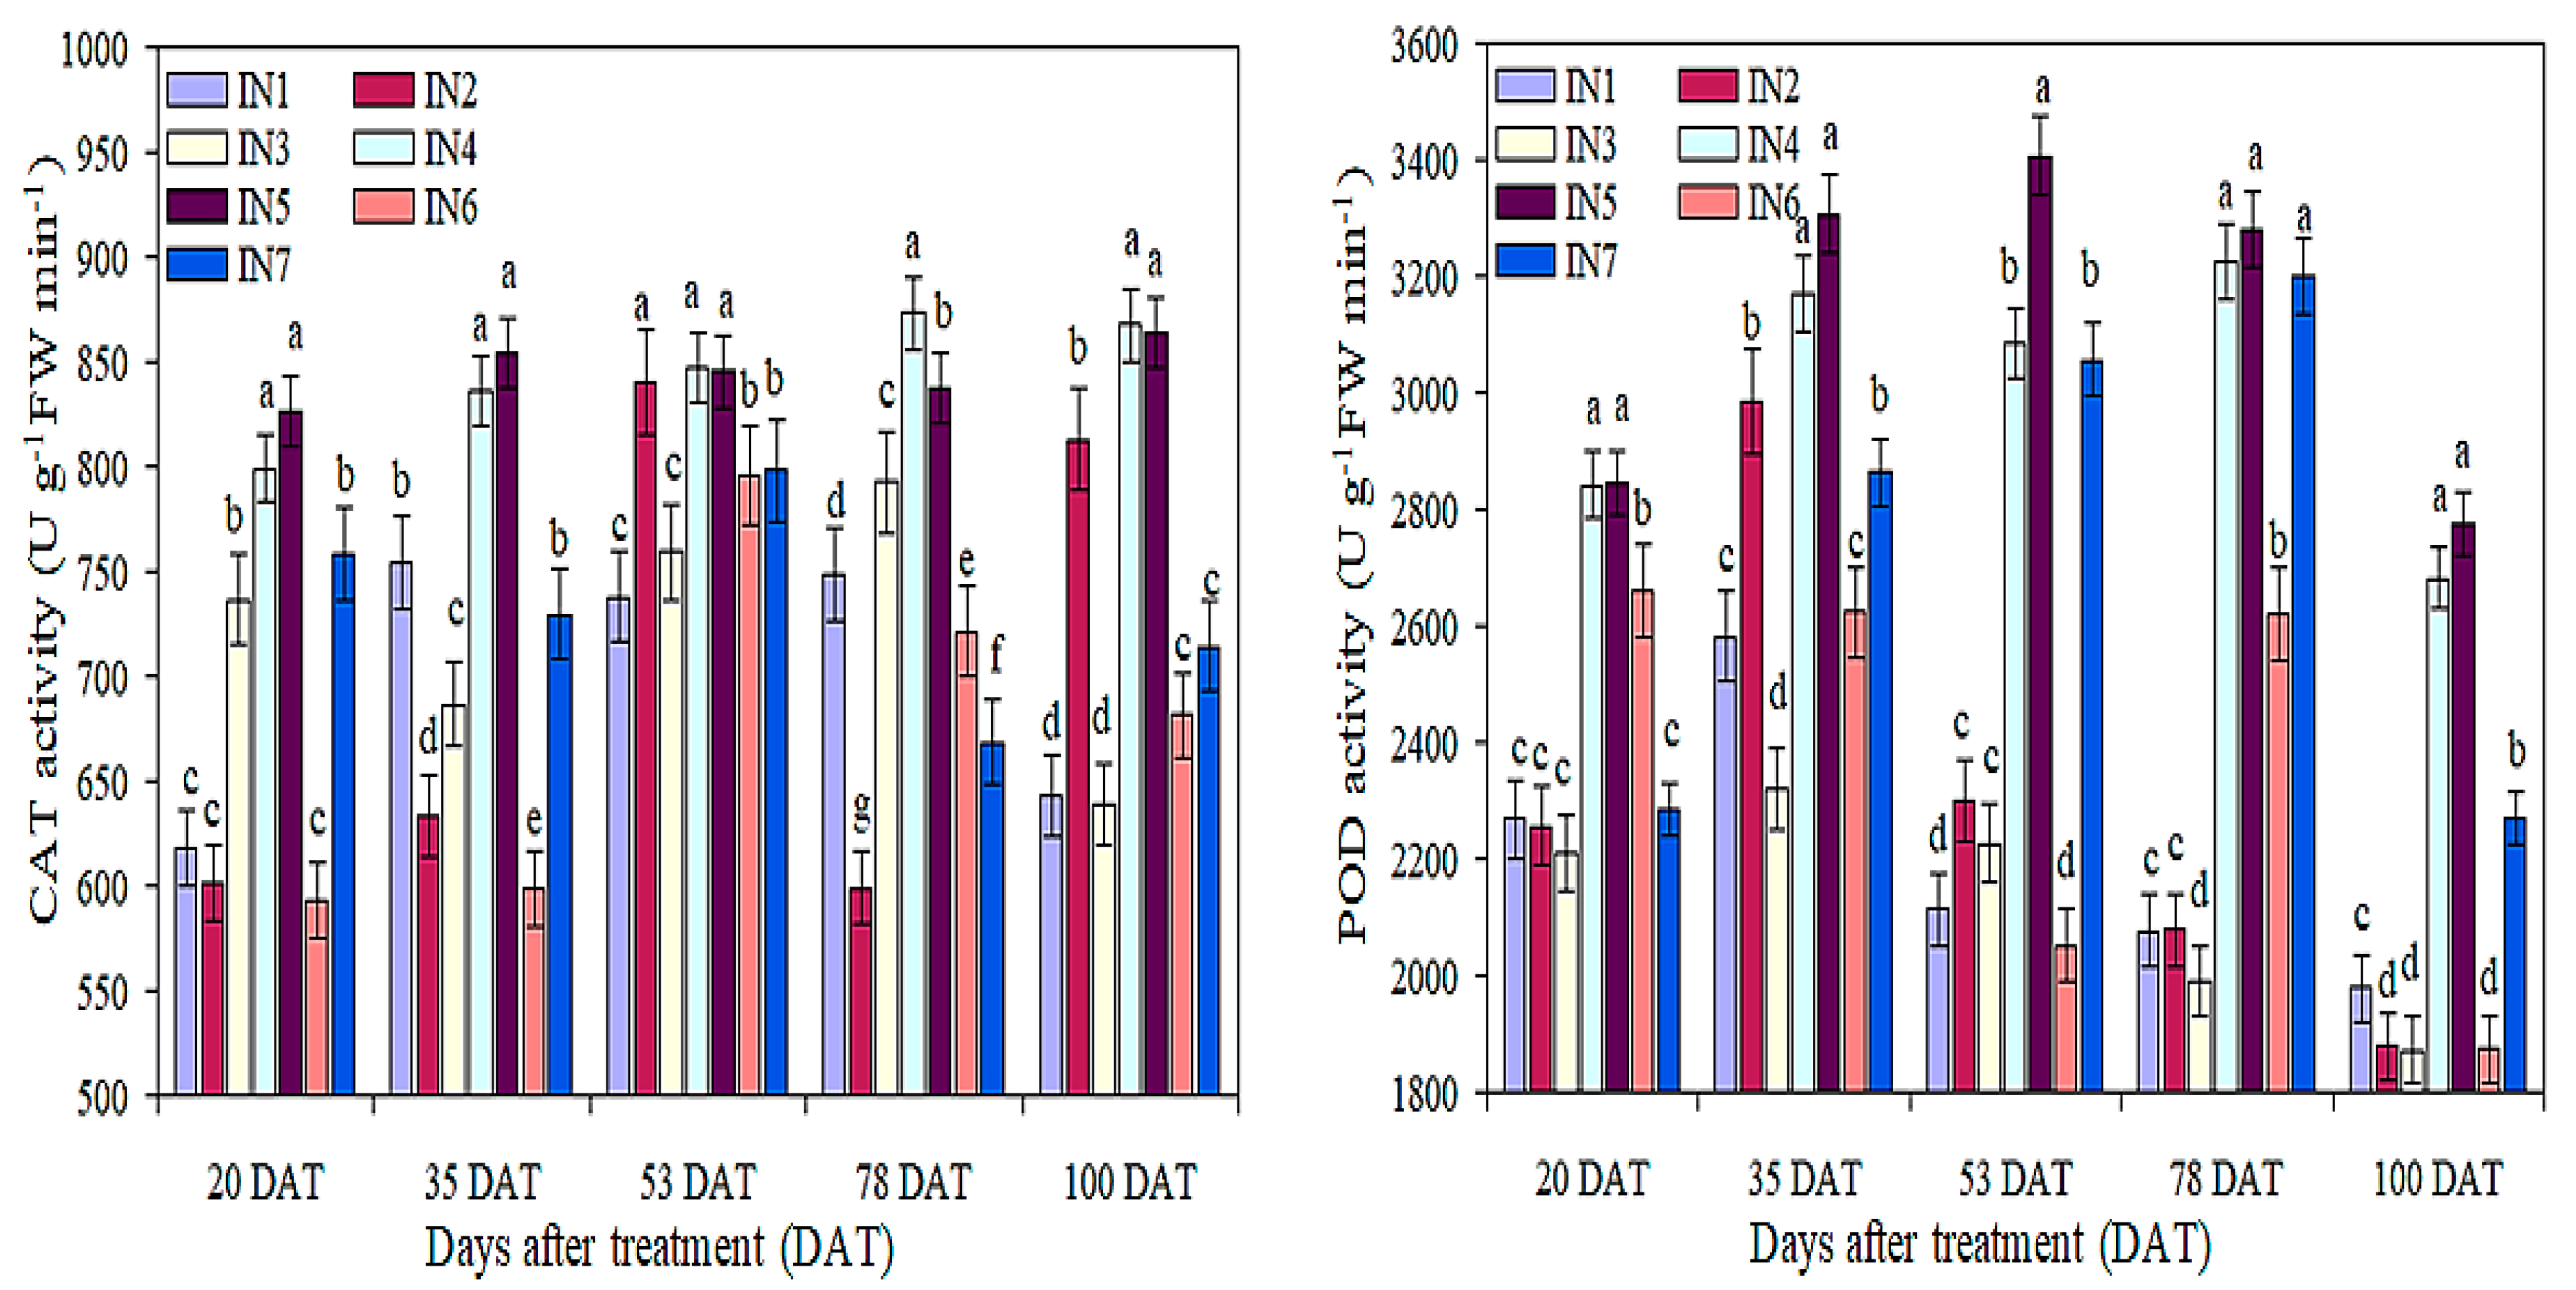
Figure 5 and Table 5 show that, under irrigation and nitrogen fertilizer application, the activities of CAT, POD, RuBisCO, and SOD in cucumber leaves significantly increased at 20, 35, 53, 78, and 100 DAT. Under IN4 and IN5 treatments, the CAT, POD, RuBisCO, and SOD activities of cucumber leaves reached their maximum values at 78 DAT, but there was a non–significant variance between 53 and 78 DAT. Subsequently, the CAT, POD, Rubisco, and SOD activities of cucumber leaves rapidly decreased at 100 DAT, respectively. Furthermore, the difference between IN4 and IN5 treatments was non−significant in all growth stages of cucumber. The activities of CAT, POD, RuBisCO, and SOD in cucumber leaves significantly increased from 20 to 78 DAT, and sharply decreased from 78 to 100 DAT. The effects of IN5 treatment on CAT, POD, RuBisCO, and SOD activities in cucumber leaves at different growth stages were considerably greater than those of the IN1 treatment. The average values of CAT, POD, RuBisCO, and SOD activities in cucumber leaves treated with IN4 and IN5 were significantly higher than those treated with IN1 (16.5%, 25.6%, 18.1%, and 29.4% and 18.1%, 29.4%, 25.7%, and 35.8%, respectively) at five different growth stages. Under conditions of 20, 35, 53, 78, and 100 DAT, the effects of IN4 and IN5 treatments on CAT, POD, RuBisCO, and SOD activities in cucumber leaves were not significant.

3.6. Cucumber Yield (t hm-2) and Pearson’s Correlation Coefficients

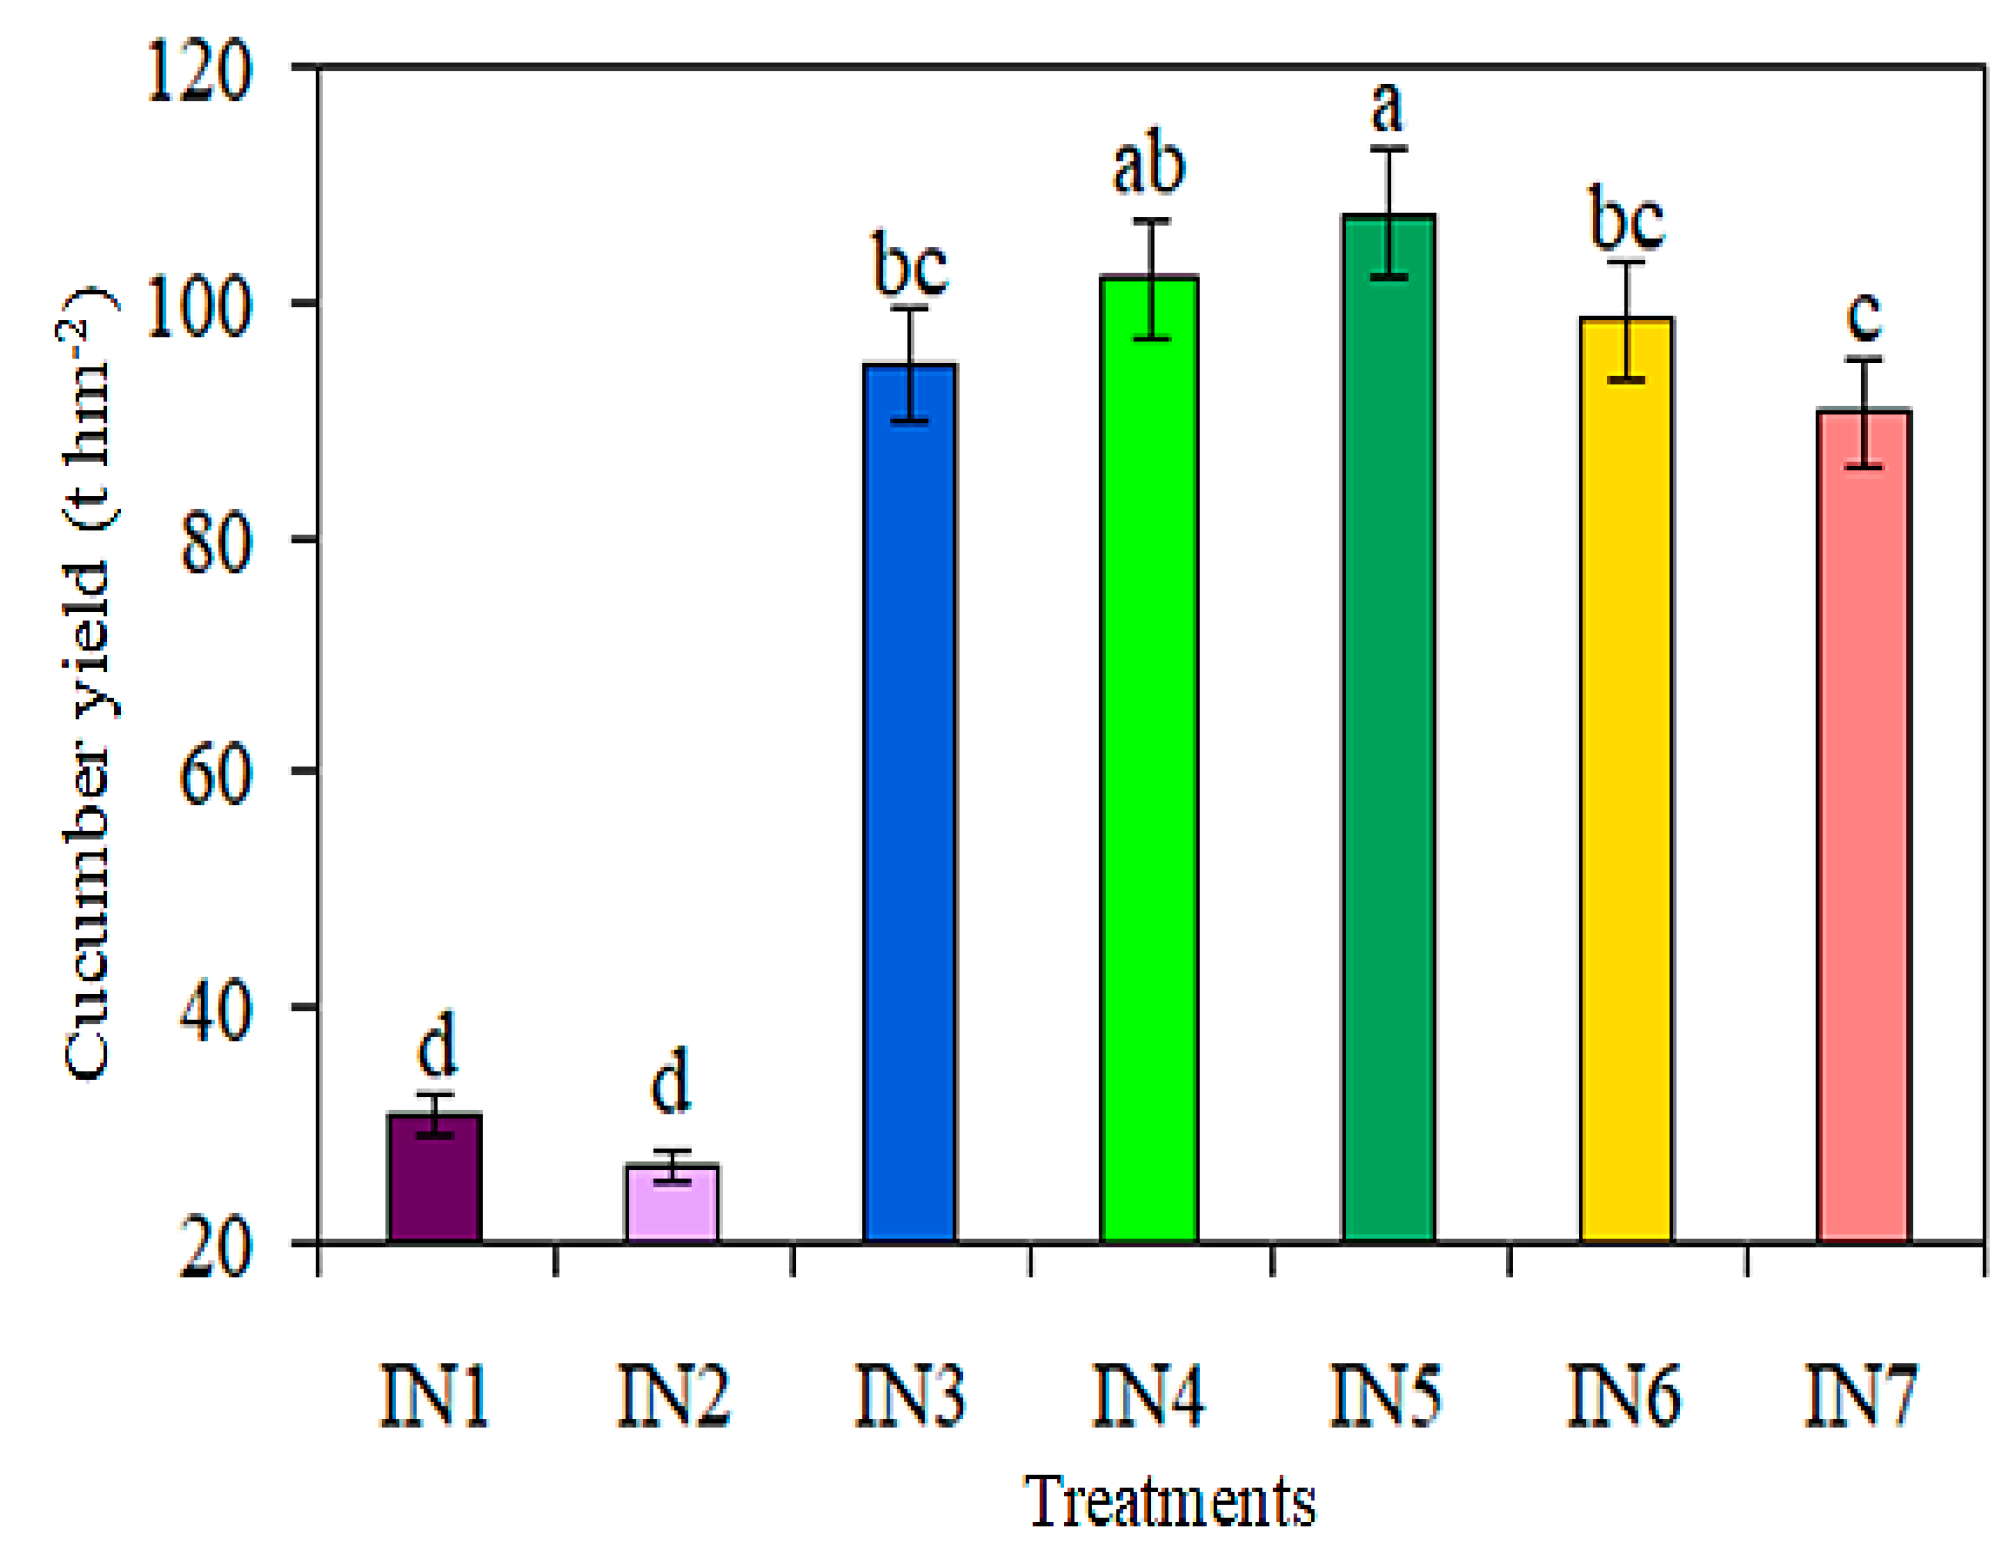
The cucumber yield was significantly improved by the interactive effect of irrigation–nitrogen coupling strategies during the 2021 study year (Figure 6). The cucumber yield significantly enhanced with the supply of irrigation and nitrogen fertilizer application, but differences were not significant under the IN4 and IN5 treatments. The cucumber yield was greater under the IN4 and IN5 treatments than under all other treatments. The cucumber yield revealed that, under IN4 and IN5, it produced maximum values of 69.7% and 72.2%, as compared with the IN1 treatment. When compared to the IN2 treatment, the cucumber yield under the IN1, IN3, IN4, IN5, IN6, and IN7 treatments were significantly improved by 14.8%, 67.3%, 74.2%, 75.5%, 73.2%, and 70.9%, respectively. Table 6 displays Pearson’s correlation coefficients by using the quadratic saturation D−optimal design of the irrigation water with the nitrogen coupling of sand−cultivated cucumbers. A significant positive correlation was observed between carbon and nitrogen metabolism, antioxidant enzyme activities, and sand–cultivated cucumber yield in a greenhouse.

4. Discussion

The uneven distribution of precipitation causes soil drought and adversely affects soluble sugars and the protein content and antioxidant enzyme activities in cucumber leaves and causes drought-induced plant stress at an important growth stage [40,41]. Studies also show that soluble sugars, proteins, and nitrogen content are sensitive to dry stress [42], and changes in parameters can indicate whether the alternate irrigation mode impairs antioxidant enzyme activity. The higher content of soluble sugars and proteins in cucumber leaves is a sustainable and high−yield result. In the same treatment of the 2021 study year, the soluble sugar and protein content of leaves significantly increased from 20 DAT to 78 DAT, while it significantly decreased from 78 DAT to 100 DAT. Under drought stress, the amount of SP content is low, and the content of sucrose decreases, affecting the grain filling rate and crop yield [43]. Water stress facilitates stomatal closure, thereby affecting the diffusion of CO2 from the air to the cell, which is the main cause of decreased SP content [44]. The average soluble sugar and protein content of IN4 and IN5 treatments were significantly increased (24.6% and 19.7%) and (26.1% and 30.1%) compared to IN1 treatment, respectively. Thus, carbon and nitrogen metabolism are not only interrelated but also have a certain degree of mutual inhibition [45]. Drip irrigation has a significant impact on the soluble sugar and protein content of cucumber leaves at different growth stages and nitrogen application levels. An earlier study also observed that, compared to traditional planting without using plastic film, wheat flag leaves had higher nitrogen SP contents due to the use of plastic film for drip irrigation [46]. In the 2021 study year, IN4 and IN5 treatments significantly increased leaf nitrogen contents by 27.5% and 33.1% compared to the IN1 treatment. This is consistent with the results of Xu et al. [47]; the decrease in nitrogen application increased the sugar concentration of cucumber, and the excessive application of nitrogen fertilizer was disadvantageous for the absorption of cucumber. Under drought conditions, supplementary irrigation promotes the development of plant tissues, significantly increasing the soluble sugar, protein, and nitrogen content of cucumber leaves [48].
Under the ADI treatment, medium and high levels of nitrogen administration reduced nitrite concentrations in cucumber fruits. Since nitrite reductase is insufficient in the fruit, the nitrite is not able to be reduced to the ammonia nitrogen, and the nitrite that is transported from the leaf accumulates, and it is a negative factor that finally affects the quality [49]. Under the IN4 and IN5 treatments, the AIE, NIE, and NR contents of cucumber leaves significantly increased at different growth stages. The AIE, NIE, and NR contents of cucumber leaves gradually increased at 20–53 DAT and then decreased from 53 to 100 DAT. In addition, under the treatments of IN4 and IN5, the contents of AIE, NIE, and NR rapidly increased from 35 DAT to 53 DAT. However, nitrogen application treatment improved the photosynthetic performance of leaves, providing more electronic and chemical energy to reduce nitrite in leaves, ultimately reducing the transfer of nitrite from leaves to fruits [50]. However, in the data from the 2021 study year, the average values of five different growth stages of cucumber showed that, compared to the IN1 treatment, the IN4 and IN5 treatments produced significantly more (15.9% and 18.1%) AIE, (23.9% and 23.5%) NIE, and (25.8% and 28.8%) NR in cucumber leaves. During the 53 DAT, the AIE, NIE, and NR contents of cucumber leaves reached their highest values under different treatments. Many of the previous studies focused on the binding of irrigation and fertilization [51] or the IA and irrigation frequency to determine optimal management scheduling [52].
Under the water fertilizer binding action, the soil enzyme activity increases, and the crop root system enhances the absorption of mineral nutrients in the soil [53]. Under the IN4 and IN5 treatments, the GOGAT, GLDH, and GS activities at various growth stages were considerably greater than that of the rest of all other treatments. Under the IN4 and IN5 treatments, the GOGAT, GLDH, and GS activities significantly increased with increasing irrigation (80%) and nitrogen fertilizer (623 kg hm−2) at 20, 35, 53, 78, and 100 DAT. The GOGAT contents under the IN4 treatment at 20, 35, 53, 78, and 100 DAT were significantly greater by 53%, 27%, 39%, 6%, and 44%, respectively, GLDH contents were significantly greater by 11%, 54%, 2%, 2%, and 50%, and the GS contents were significantly greater by 22%, 3%, 16%, 38%, and 32%, respectively, than those of the IN1 treatment. Research shows that the combination of temperature, water, and fertilizer promotes the respiration of soil microbes and root systems [54], enriches soil microbial biomass [55], promotes microbial reproduction and growth, and improves the root system and soil microenvironment [56,57]. The combination of temperature, water, and fertilizer enhances soil enzyme activity and enhances the absorption of mineral nutrients in soil by crop root systems [14].
The interaction between irrigation and nitrogen application strategies significantly improved the SPS and SS activities of cucumber leaves. However, there was no significant difference in SPS and SS activities between IN4 and IN5 treatments. Previous studies have also observed similar trends [34,36,39]. The IN4 treatment significantly increased the SPS and SS activities by 16.9% and 9.4% more than those of the IN1 treatment. At each drip irrigation with nitrogen application levels, the SPS and SS activities were significantly greater under the IN4 and IN5 treatments. As is well known, SPS and SS activities are the first responses of plants to water stress and play a sufficient role in plant stress resistance [22,24]. SPS and SS activities can enhance plants’ damage repair abilities by increasing antioxidant activity under drought conditions [28].
Water deficiency is always associated with increased oxidative stress caused by increased ROS accumulation [18,19]. Under the IN4 and IN5 treatments, the CAT, POD, RuBisCO, and SOD activities of cucumber leaves reached their maximum values at 78 DAT, but there was no significant difference between 53 and 78 DAT treatments. Subsequently, the CAT, POD, Rubisco, and SOD activities of cucumber leaves rapidly decreased at 100 DAT, respectively. The difference between the IN4 and IN5 treatments was not remarkable at all growth stages of cucumber. The highest activity of antioxidant enzymes is the response to the decrease in the soil’s water storage capacity [10]. Under severe drought conditions, the formation of H2O2 and O2 in crop leaves markedly increased [33]. In this study, the CAT, POD, RuBisCO, and SOD activities of cucumber leaves significantly increased from 20 to 78 DAT and sharply decreased from 78 to 100 DAT under each irrigation and nitrogen fertilizer application level. The average values of five different growth stages indicate that the average activities of CAT, POD, RuBisCO, and SOD in cucumber leaves treated with IN4 and IN5 are significantly higher than those treated with IN1. Therefore, oxidative damage adversely affects plant performance, PN value, and chlorophyll content [44]. Fotelli et al. [55] confirmed that the SP content and SOD, POD, and CAT activities of wheat flag leaves decreased with the decrease in the irrigation rate and accelerated the senescence rate of late–growing leaves. Irrigation and fertilization affect cucumber growth, development, production, and quality [42,58]. Cucumber plants are highly sensitive to soil moisture conditions, especially in a greenhouse; therefore, the soil moisture supply has a significant effect on the growth and yield of cucumber [9]. The cucumber yield was highest in the IN4 and IN5 treatments. The results showed that, compared with the IN1 treatment, the IN4 and IN5 treatments had the highest cucumber yield, with 69.7% and 72.2%, respectively.

5. Conclusions

The sandy deficit irrigation with nitrogen management strategies significantly increased the soluble sugar, protein, and actual leaf nitrogen contents and improved soil chemical properties in the root zone of cucumber, thereby improving plant growth and yield. The growth and yield of sand–cultivated cucumber were evaluated comprehensively by using a quadratic saturation D–optimal design. Furthermore, such improvements were due to the reduction in oxidative damage during different growth stages of sand–cultivated cucumber. The IN4 and IN5 treatments significantly increased the activities of RuBisCO, CAT, POD, and SOD during different growth stages of sand–cultivated cucumber. Furthermore, the IN4 treatment attained the highest value at 53 DAT, while also exhibiting significant declines at 100 DAT. The higher activities of NR, GOGAT, GLDH, GS, AIE, NIE, and better antioxidative enzyme activities in the IN4 treatment at various growth stages effectively improved (69.6%) cucumber yield. The soil properties, carbon and nitrogen metabolism, and antioxidant enzyme activities were positively correlated with sand-cultivated cucumber yield in a greenhouse. In conclusion, with respect to global climate change, these results play an important role in guiding deficit irrigation–nitrogen coupling strategies under sand-cultivated cucumber in a greenhouse. Further research is required to test how deficit irrigation–nitrogen coupling strategies influence soil properties and cucumber growth under long–term sand-cultivated conditions.

Author Contributions

Methodology, X.M. and Z.X.; Software, X.M.; Formal analysis, T.W.; Investigation, X.M.; Resources, Y.C.; Data curation, Y.C. and Z.X.; Writing—original draft, Z.T.; Writing—review & editing, X.M., Y.C., M.C., Z.X. and H.D.; Visualization, Z.X.; Supervision, Z.T. and M.C.; Project administration, Z.T. and H.D.; Funding acquisition, Z.T. and M.C. All authors have read and agreed to the published version of the manuscript.

Funding

XPCC Financial Science and Technology Plan Project (2023AB071); Tianshan Talent Training Program (2023TSYCCY0002); Tumushuk Science and Technology Project of the 3rd Division (KY2022GG05), President’s Fund Project of Tarim University (TDZKSS202346); Agricultural Key Core Technology Research Project of the Corps (NYHXGG2023AA304).

Data Availability Statement

The raw data supporting the conclusions of this article will be made available by the authors on request.

Conflicts of Interest

The authors declare no conflicts of interest.

References

  1. Cheng, M.; Wang, H.; Fan, J.; Zhang, S.; Liao, Z.; Zhang, F.; Wang, Y. A global meta-analysis of yield and water use efficiency of crops, vegetables and fruits under full, deficit and alternate partial root-zone irrigation. Agric. Water Manag. 2021, 248, 106771. [Google Scholar] [CrossRef]
  2. Du, T.; Kang, S.; Zhang, J.; Davies, W.J. Deficit irrigation and sustainable water-resource strategies in agriculture for China’s food security. J. Exp. Bot. 2015, 66, 2253–2269. [Google Scholar] [CrossRef]
  3. Mutambara, S.; Darkoh, M.B.K.; Atlhopheng, J.R. A comparative review of water management sustainability challenges in smallholder irrigation schemes in Africa and Asia. Agric. Water Manag. 2016, 171, 63–72. [Google Scholar] [CrossRef]
  4. Wei, Z.H.; Du, T.S.; Li, X.N.; Fang, L.; Liu, F.L. Interactive effects of elevated CO and N fertilization on yield and quality of tomato grown under reduced irrigation regimes. Front. Plant Sci. 2018, 9, 328. [Google Scholar] [CrossRef]
  5. Liu, H.; Li, H.H.; Ning, H.F.; Zhang, X.X.; Li, S.; Pang, J.; Wang, G.S.; Sun, J.S. Optimizing irrigation frequency and amount to balance yield, fruit quality and water use efficiency of greenhouse tomato. Agric. Water Manag. 2019, 226, 105787. [Google Scholar] [CrossRef]
  6. Liu, H.J.; Yin, C.Y.; Gao, Z.Z.; Hou, L.Z. Evaluation of cucumber yield, economic benefit and water productivity under different soil matric potentials in solar greenhouses in North China. Agric. Water Manag. 2021, 243, 106442. [Google Scholar] [CrossRef]
  7. Wang, Q.; Men, L.Z.; Gao, L.H.; Tian, Y.Q. Effect of grafting and gypsum application on cucumber (Cucumis sativus L.) growth under saline water irrigation. Agric. Water Manag. 2017, 188, 79–90. [Google Scholar] [CrossRef]
  8. Chen, W.; Hou, Z.; Wu, L.; Liang, Y.; Wei, C. Evaluating salinity distribution in soil irrigated with saline water in arid regions of northwest China. Agric. Water Manag. 2010, 97, 2001–2008. [Google Scholar] [CrossRef]
  9. Ali, S.; Xu, Y.; Ma, X.; Ahmad, I.; Kamran, M.; Dong, Z.; Cai, T.; Jia, Q.; Ren, X.; Zhang, P.; et al. Planting models and deficit irrigation strategies to improve wheat production and water use efficiency under simulated rainfall conditions. Front. Plant Sci. 2017, 8, 1408. [Google Scholar] [CrossRef]
  10. Chen, Z.; Tian, T.; Gao, L.; Tian, Y. Nutrients, heavy metals and phthalate acid esters in solar greenhouse soils in Round-Bohai Bay-Region, China: Impacts of cultivation year and biogeography. Environ. Sci. Pollut. Res. 2016, 23, 13076–13087. [Google Scholar] [CrossRef]
  11. Cao, C.Y.; Jiang, S.Y.; Zhang, Y.; Zhang, F.X.; Han, X.S. Spatial variability of soil nutrients and microbiological properties after the establishment of leguminous shrub Caragana microphylla Lam. plantation on sand dune in the Horqin Sandy Land of Northeast China. Ecol. Eng. 2011, 37, 1467–1475. [Google Scholar] [CrossRef]
  12. Cui, Y.; Tian, Z.; Zhang, X.; Muhammad, A.; Han, H.; Jiang, D.; Cao, W.; Dai, T. Effect of water deficit during vegetative growth periods on post-anthesis photosynthetic capacity and grain yield in winter wheat (Triticum aestivum L.). Acta Physiol. Plant. 2015, 37, 196. [Google Scholar] [CrossRef]
  13. Gupta, A.K.; Kaur, K.; Kaur, N. Stem reserve mobilization and sink activity inwheat under drought conditions. Am. J. Plant Sci. 2011, 2, 70–77. [Google Scholar] [CrossRef]
  14. Sun, Y.; Hu, K.; Fan, Z.; Wei, Y.; Lin, S.; Wang, J. Simulating the fate of nitrogen and optimizing water and nitrogen management of greenhouse tomato in North China using the EU-Rotate_N model. Agric. Water Manag. 2013, 128, 72–84. [Google Scholar] [CrossRef]
  15. Ran, Y.; Xie, J.; Xu, X.; Li, Y.; Liu, Y.; Zhang, Q.; Li, Z.; Xu, J.; Di, H. Warmer and drier conditions and nitrogen fertilizer application altered methanotroph abundance and methane emissions in a vegetable soil. Environ. Sci. Pollut. Res. 2017, 24, 2770–2780. [Google Scholar] [CrossRef] [PubMed]
  16. Cao, Q.; Wang, S.Z.; Gao, L.H.; Ren, H.Z.; Chen, Q.Y.; Zhao, J.W.; Wang, Q.; Sui, X.L.; Zhang, Z.X. Effect of alternative furrow irrigation on growth and water us of cucumber in solar greenhouse. Trans. Chin. Soc. Agric. Eng. 2010, 29, 47–53, (In Chinese with English abstract). [Google Scholar]
  17. Wang, Y.; Jensen, C.R.; Liu, F. Nutritional responses to soil drying and rewetting cycles under partial root-zone drying irrigation. Agric. Water Manag. 2017, 179, 254–259. [Google Scholar] [CrossRef]
  18. Yu, B.; Yan, S.; Zhou, H.; Dong, R.; Lei, J.; Chen, C.; Cao, B. Overexpression of CsCaM3 improves high temperature tolerance in cucumber. Front. Plant Sci. 2018, 9, 797. [Google Scholar] [CrossRef]
  19. Fazeli, F.; Ghorbanli, M.; Niknam, V. Effect of drought on biomass, protein content, lipid peroxidation and antioxidant enzymes in two sesame cultivars. Biol. Plant. 2007, 51, 98–103. [Google Scholar] [CrossRef]
  20. Hou, M.; Jin, Q.; Lu, X.; Li, J.; Zhong, H.; Gao, Y. Growth, water use, and nitrate-15N uptake of greenhouse tomato as influenced by different irrigation patterns, 15N labeled depths, and transplant times. Front. Plant Sci. 2017, 8, 666. [Google Scholar] [CrossRef]
  21. Lakhdar, A.; Hafsi, C.; Debez, A.; Montemurro, F.; Jedidi, N.; Abdelly, C. Assessing solid waste compost application as a practical approach for salt-affected soil reclamation. Acta Agric. Scand. Sect. B—Soil Plant Sci. 2011, 61, 284–288. [Google Scholar] [CrossRef]
  22. Lakhdar, A.; Rabhi, M.; Ghnaya, T.; Montemurro, F.; Jedidi, N.; Abdelly, C. Effectiveness of compost use in salt-affected soil. J. Hazard. Mater. 2009, 171, 29–37. [Google Scholar] [CrossRef] [PubMed]
  23. Lakhdar, A.; Hafsi, C.; Rabhi, M.; Debez, A.; Montemurro, F.; Abdelly, C.; Jedidi, N.; Ouerghi, Z. Application of municipal solid waste compost reduces the negative effects of saline water in Hordeum maritimum L. Bioresour. Technol. 2008, 99, 7160–7167. [Google Scholar] [CrossRef] [PubMed]
  24. Farooq, M.; Wahid, A.; Kobayashi, N.; Fujita, D.; Basra, S.M. Plant drought stress: Effects, mechanisms and management. Agron. Sustain. Dev. 2009, 29, 185–212. [Google Scholar] [CrossRef]
  25. Farneselli, M.; Benincasa, P.; Tosti, G.; Simonne, E.; Guiducci, M.; Tei, F. High fertigation frequency improves nitrogen uptake and crop performance in processing tomato grown with high nitrogen and water supply. Agric. Water Manag. 2015, 154, 52–58. [Google Scholar] [CrossRef]
  26. Huang, Y.; Tang, R.; Cao, Q.; Bie, Z. Improving the fruit yield and quality of cucumber by grafting onto the salt tolerant rootstock under NaCl stress. Sci. Hortic. 2009, 122, 26–31. [Google Scholar] [CrossRef]
  27. Sharma, D.K.; Andersen, S.B.; Ottosen, C.-O.; Rosenqvist, E. Wheat cultivars selected for high Fv/Fm under heat stress maintain high photosynthesis, total chlorophyll, stomatal conductance, transpiration and dry matter. Physiol. Plant. 2015, 153, 284–298. [Google Scholar] [CrossRef]
  28. Singh, M.C.; Singh, J.P.; Pandey, S.K.; Mahay, D.; Shrivastva, V. Factors affecting the performance of greenhouse cucumber cultivation-a review. Int. J. Curr. Microbiol. Appl. Sci. 2017, 6, 2304–2323. [Google Scholar] [CrossRef]
  29. Wang, Z.; Liu, Z.; Zhang, Z.; Liu, X. Subsurface drip irrigation scheduling for cucumber (Cucumis sativus L.) grown in solar greenhouse based on 20 cm standard pan evaporation in Northeast China. Sci. Hortic. 2009, 123, 51–57. [Google Scholar] [CrossRef]
  30. Fasina, A.; Awe, G.; Ilori, A.; Babalola, T.; Ogunleye, K. Effect of drip irrigation frequency and N-fertilization on yield and water use efficiency of cucumber (Cucumis sativus) in Ado-Ekiti. Niger. Res. Crop. 2021, 22, 292–300. [Google Scholar]
  31. Blandino, M.; Reyneri, A. Effect of fungicide and foliar fertilizer application to winter wheat at anthesis on flag leaves senescence, grain yield, flour bread-making quality and DON contamination. Eur. J. Agron. 2009, 30, 275–282. [Google Scholar] [CrossRef]
  32. Tian, Y.; Zhang, X.; Wang, J.; Gao, L. Soil microbial communities associated with the rhizosphere of cucumber under different summer cover crops and residue management: A 4-year field experiment. Sci. Hortic. 2013, 150, 100–109. [Google Scholar] [CrossRef]
  33. Khan, N.; Bano, A.; Rahman, M.A.; Rathinasabapathi, B.; Babar, M.A. UPLC-HRMS-based untargeted metabolic profiling reveals changes in chickpea (Cicer arietinum) metabolome following long-term drought stress. Plant Cell Environ. 2019, 42, 115–132. [Google Scholar] [CrossRef] [PubMed]
  34. Ren, X.; Jia, Z.; Chen, X. Rainfall concentration for increasing corn production under semiarid climate. Agr. Water Manag. 2008, 95, 1293–1302. [Google Scholar] [CrossRef]
  35. Reddy, A.R.; Chaitanya, K.V.; Vivekanandan, M. Drought-induced responses of photosynthesis and antioxidant metabolism in higher plants. J. Plant Physiol. 2004, 11, 15602811. [Google Scholar] [CrossRef] [PubMed]
  36. He, Z.H.; Li, M.L.; Cai, Z.L.; Zhao, R.; Hong, T.T.; Yang, Z.; Zhang, Z. Optimal irrigation and fertilizer amounts based on multi-level fuzzy comprehensive evaluation of yield, growth and fruit quality on cherry tomato. Agric. Water Manag. 2021, 243, 106360. [Google Scholar] [CrossRef]
  37. Li, H.S. Principles and Techniques of Plant Physiological Experiment; Higher Education Press: Beijing, China, 2000; pp. 119–120. (In Chinese) [Google Scholar]
  38. Amalo, K.; Chen, G.X.; Asade, K. Separate assays specific for ascorbate peroxidase and guaiacal peroxidase and for the chloroplastic and cytosolic isozymes of ascorbate peroxidase implants. Plant Cell Physiol. 1994, 35, 497–504. [Google Scholar]
  39. Tan, W.; Liu, J.; Dai, T.; Jing, Q.; Cao, W.; Jiang, D. Alternations in photosynthesis and antioxidant enzyme activity in winter wheat subjected to post-anthesis water-logging. Photosynthetica 2008, 46, 21–27. [Google Scholar] [CrossRef]
  40. Wu, Y.; Xi, X.; Tang, X.; Luo, D.; Gu, B.; Lam, S.K.; Vitousek, P.M.; Chen, D. Policy distortions, farm size, and the overuse of agricultural chemicals in China. Proc. Natl. Acad. Sci. USA 2018, 115, 7010–7015. [Google Scholar] [CrossRef]
  41. Perchlik, M.; Tegeder, M. Leaf amino acid supply affects photosynthetic and plant nitrogen use efficiency under nitrogen stress. Plant Physiol. 2018, 178, 174–188. [Google Scholar] [CrossRef]
  42. Shi, J.; Yasuor, H.; Yermiyahu, U.; Zuo, Q.; Ben-Gal, A. Dynamic responses of wheat to drought and nitrogen stresses during re-watering cycles. Agric. Water Manag. 2014, 146, 163–172. [Google Scholar]
  43. Ouyang, Z.; Tian, J.C.; Zhao, C.; Yan, X.F. Coupling model and optimal combination scheme of water, fertilizer, dissolved oxygen and temperature in greenhouse tomato under drip irrigation. Int. J. Agric. Biol. Eng. 2021, 14, 37–46. [Google Scholar]
  44. Roca, L.F.; Romero, J.; Boh’orquez, J.M.; Alcántara, E.; Fernández-Escobar, R.; Trapero, A. Nitrogen status affects growth, chlorophyll content and infection by Fusicladium oleagineum in olive. Crop Prot. 2018, 109, 80–85. [Google Scholar] [CrossRef]
  45. Anjum, S.A.; Wang, L.C.; Farooq, M.; Hussain, M.; Xue, L.L.; Zou, C.M. Brassinolide application improves the drought tolerance in maize through modulation of enzymatic antioxidants and leaf gas exchange. J. Agron. Crop Sci. 2011, 197, 177–185. [Google Scholar]
  46. Kaur, K.; Kaur, N.; Gupta, A.K.; Singh, I. Exploration of the antioxidative defense system to characterize chickpea genotypes showing differential response towards water deficit conditions. Plant Growth Regul. 2013, 70, 49–60. [Google Scholar] [CrossRef]
  47. Xu, G.; Fan, X.; Miller, A.J. Plant nitrogen assimilation and use efficiency. Annu. Rev. Plant Biol. 2012, 63, 153–182. [Google Scholar]
  48. Lum, M.S.; Hanafi, M.M.; Rafii, Y.M.; Akmar, A.S.N. Effect of drought stress on growth, proline and antioxidant enzyme activities of upland rice. J. Anim. Plant Sci. 2014, 24, 1487–1493. [Google Scholar]
  49. Kang, S.Z.; Hao, X.M.; Du, T.S.; Tong, L.; Su, X.L.; Lu, H.N.; Li, X.L.; Huo, Z.L.; Li, S.E.; Ding, R.S. Improving agricultural water productivity to ensure food security in China under changing environment: From research to practice. Agric. Water Manag. 2017, 179, 5–17. [Google Scholar] [CrossRef]
  50. Valdés, R.; Miralles, J.; Franco, J.A.; Sánchez-Blanco, M.J.; Bañón, S. Using soil bulk electrical conductivity to manage saline irrigation in the production of potted poinsettia. Sci. Hortic. 2014, 170, 1–7. [Google Scholar] [CrossRef]
  51. Beck, E.H.; Fetitig, S.; Knake, C.; Hartig, K.; Bhattarai, T. Specific and unspecificresponses of plants to cold and drought stress. J. Biosci. 2007, 32, 501–510. [Google Scholar]
  52. Miller, G.; Suzuki, N.; Ciftci-Yilmaz, S.; Mittler, R. Reactive oxygen species homeostasis and signaling during drought and salinity stresses. Plant Cell Environ. 2010, 33, 453–467. [Google Scholar] [CrossRef]
  53. Sairam, R.K.; Srivastava, G.C. Water stress tolerance of wheat (Triticum aestivum L.): Variations in hydrogen peroxide accumulation and antioxidant activity in tolerant and susceptible genotypes. J. Agron. Crop Sci. 2001, 186, 63–70. [Google Scholar] [CrossRef]
  54. Yan, M.F.; Zhang, X.S.; Jiang, Y.; Zhou, G.S. Effects of irrigation and plowing on soil carbon dioxide efflux in a poplar plantation chronosequence in northwest China. Soil Sci. Plant Nutr. 2011, 57, 466–474. [Google Scholar] [CrossRef]
  55. Fotelli, M.N.; Rennenberg, H.; Gessler, A. Effects of drought on the competitive interference of an early successional species (Rubus fruticosus) on Fagus sylvatica L. seedlings: N-15 uptake and partitioning, responses of amino acids and other N compounds. Plant Biol. 2002, 4, 311–320. [Google Scholar] [CrossRef]
  56. Abdalhi, M.A.M.; Cheng, J.L.; Feng, S.Y.; Yi, G. Performance of drip irrigation and nitrogen fertilizer in irrigation water saving and nitrogen use efficiency for waxy maize (Zea mays L.) and cucumber (Cucumis sativus L.) under solar greenhouse. Grassl. Sci. 2016, 62, 174–187. [Google Scholar] [CrossRef]
  57. Li, D.; Dong, J.L.; Gruda, N.S.; Li, X.; Duan, Z.Q. Elevated root-zone temperature promotes the growth and alleviates the photosynthetic acclimation of cucumber plants exposed to elevated [CO2]. Environ. Exp. Bot. 2022, 194, 104694. [Google Scholar] [CrossRef]
  58. Zhu, Y.; Cai, H.J.; Song, L.B.; Chen, H. Aerated irrigation promotes soil respiration and microorganism abundance around tomato rhizosphere. Soil Sci. Soc. Am. J. 2019, 83, 1343–1355. [Google Scholar] [CrossRef]
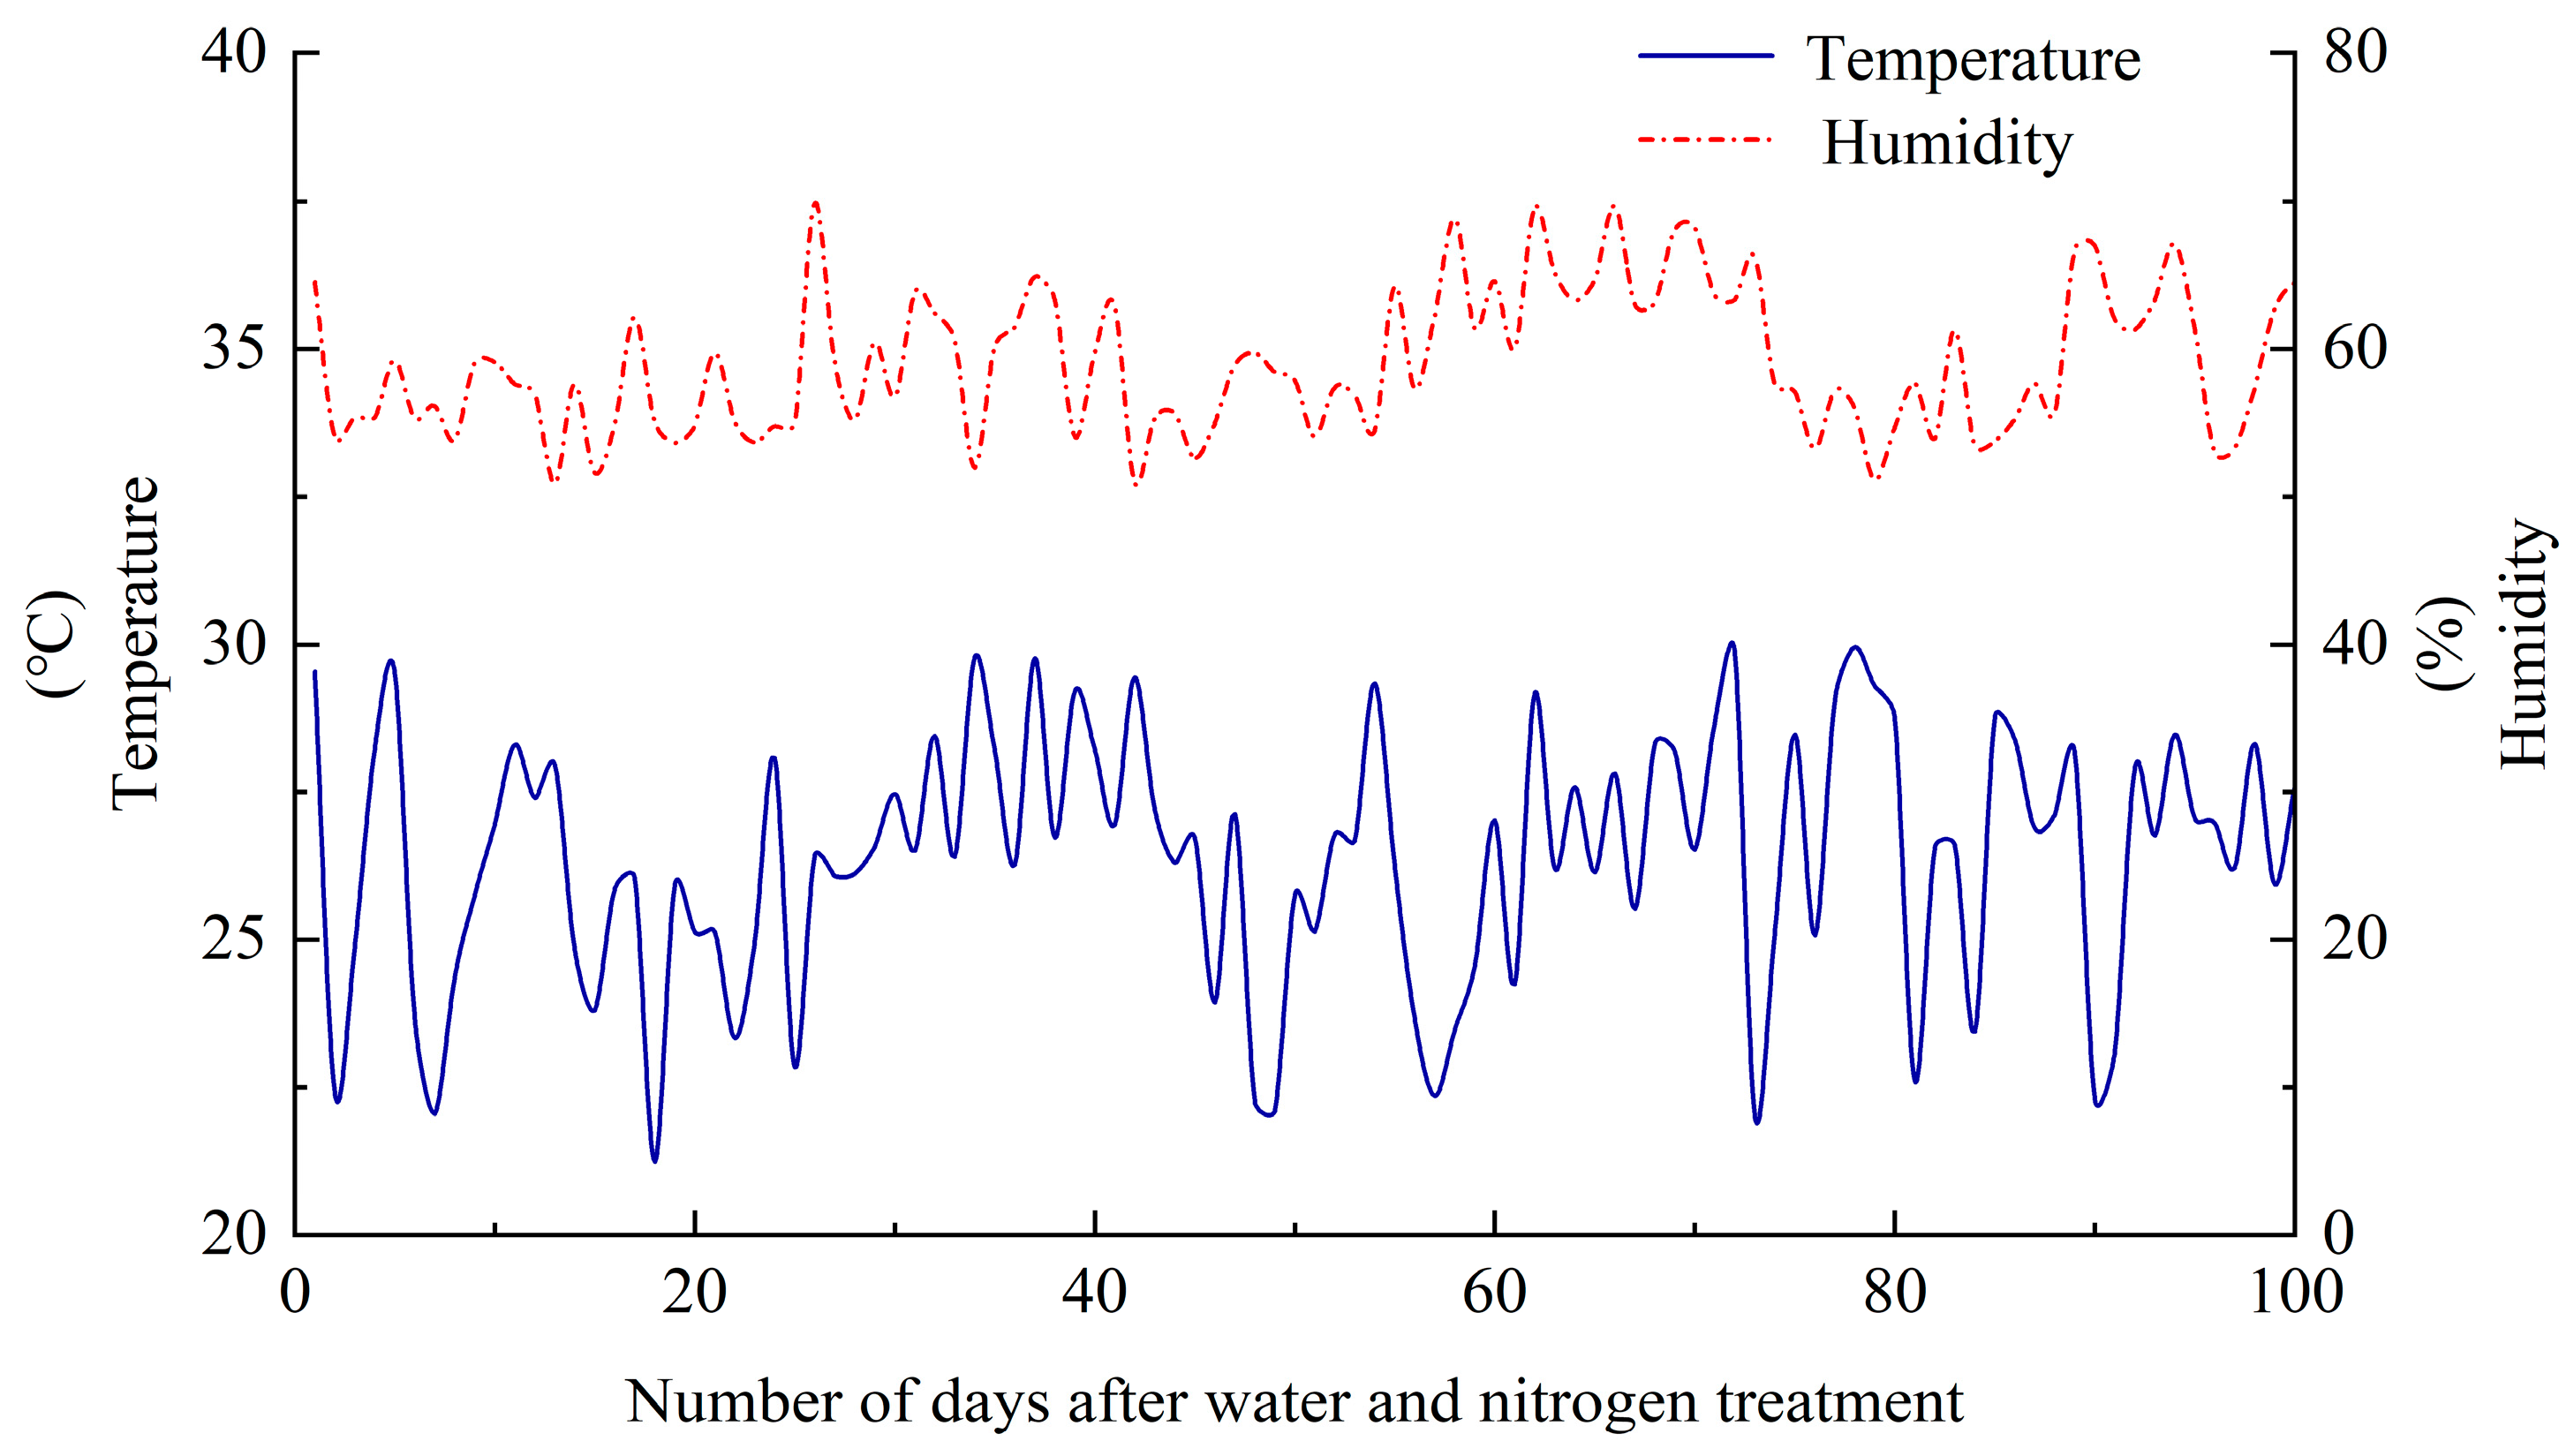
Figure 1. Temperature and humidity at the experimental site.
Land 13 00958 g001
Figure 2. Effects of irrigation water with nitrogen coupling of sand−cultivated cucumbers using a quadratic saturation D−optimal design on nitrate reductase activity and glutamate synthase activity. Note: IN1: 65% irrigation with 150 kg N hm−2; IN2: 100% irrigation with 150 kg N hm−2; IN3: 65% irrigation with 1250 kg N hm−2; IN4: 80% irrigation with 623 kg N hm−2; IN5: 89% irrigation with 1250 kg N hm−2; IN6: 100% irrigation with 917 kg N hm−2; IN7: 100% irrigation with 1250 kg N hm−2. DAT: days after irrigation water and nitrogen treatments. The error bars represent the value of the standard deviation (SD), and different lowercase letters indicate significant differences at p < 0.05.
Land 13 00958 g002
Figure 3. Effects of irrigation water with nitrogen coupling of sand−cultivated cucumbers using a quadratic saturation D−optimal design on glutamate dehydrogenase activity and glutamine synthase activity. Note: IN1: 65% irrigation with 150 kg N hm−2; IN2: 100% irrigation with 150 kg N hm−2; IN3: 65% irrigation with 1250 kg N hm−2; IN4: 80% irrigation with 623 kg N hm−2; IN5: 89% irrigation with 1250 kg N hm−2; IN6: 100% irrigation with 917 kg N hm−2; IN7: 100% irrigation with 1250 kg N hm−2. DAT: days after irrigation water and nitrogen treatments. The error bars represent the value of the standard deviation (SD), and different lowercase letters indicate significant differences at p < 0.05.
Land 13 00958 g003
Figure 4. Effects of irrigation water with nitrogen coupling of sand−cultivated cucumbers using a quadratic saturation D−optimal design on sucrose phosphate synthase activity and sucrose synthase activity. Note: IN1: 65% irrigation with 150 kg N hm−2; IN2: 100% irrigation with 150 kg N hm−2; IN3: 65% irrigation with 1250 kg N hm−2; IN4: 80% irrigation with 623 kg N hm−2; IN5: 89% irrigation with 1250 kg N hm−2; IN6: 100% irrigation with 917 kg N hm−2; IN7: 100% irrigation with 1250 kg N hm−2. DAT: days after irrigation water and nitrogen treatments. The error bars represent the value of the standard deviation (SD), and different lowercase letters indicate significant differences at p < 0.05.
Land 13 00958 g004
Figure 5. Effects of irrigation water with nitrogen coupling of sand−cultivated cucumbers using a quadratic saturation D−optimal design on catalase activity and peroxidase activity. Note: IN1: 65% irrigation with 150 kg N hm−2; IN2: 100% irrigation with 150 kg N hm−2; IN3: 65% irrigation with 1250 kg N hm−2; IN4: 80% irrigation with 623 kg N hm−2; IN5: 89% irrigation with 1250 kg N hm−2; IN6: 100% irrigation with 917 kg N hm−2; IN7: 100% irrigation with 1250 kg N hm−2. DAT: days after irrigation water and nitrogen treatments. The error bars represent the value of the standard deviation (SD), and different lowercase letters indicate significant differences at p < 0.05.
Land 13 00958 g005
Figure 6. Effects of irrigation water with nitrogen coupling of sand−cultivated cucumbers using a quadratic saturation D−optimal design on cucumber yield (t. hm−2). Note: IN1: 65% irrigation with 150 kg N hm−2; IN2: 100% irrigation with 150 kg N hm−2; IN3: 65% irrigation with 1250 kg N hm−2; IN4: 80% irrigation with 623 kg N hm−2; IN5: 89% irrigation with 1250 kg N hm−2; IN6: 100% irrigation with 917 kg N hm−2; IN7: 100% irrigation with 1250 kg N hm−2. DAT: days after irrigation water and nitrogen treatments. The error bars represent the value of the standard deviation (SD), and different lowercase letters indicate significant differences at p < 0.05.
Land 13 00958 g006
Table 1. The specific experimental design scheme.
TreatmentsActual Value
Irrigation Level (%)N Application (kg hm−2)
IN165150
IN2100150
IN3651250
IN480623
IN5891250
IN6100917
IN71001250
Table 2. Effects of different treatments on soluble sugar contents and soluble protein contents of cucumber during the 2021 study year.
TreatmentsSoluble Sugar Contents (mg g−1 FW)Soluble Protein Contents (mg g−1 FW)
Days after Treatment (DAT)Days after Treatment (DAT)
20
DAT
35
DAT
53
DAT
78
DAT
100
DAT
20
DAT
35
DAT
53
DAT
78
DAT
100
DAT
IN13.5 ± 0.19 b4.3 ± 0.14 b5.0 ± 0.11 b7.7 ± 0.14 b5.6 ± 0.12 c17.8 ± 0.27 c26.0 ± 0.31 d30.5 ± 0.29 d38.0 ± 0.35 c39.6 ± 0.30 c
IN22.9 ± 0.15 b4.2 ± 0.18 b4.9 ± 0.19 b7.3 ± 0.15 c5.4 ± 0.15 c16.7 ± 0.24 c21.4 ± 0.33 e24.9 ± 0.27 e33.7 ± 0.33 d31.7 ± 0.29 d
IN34.5 ± 0.21 a5.0 ± 0.22 a5.9 ± 0.18 b9.1 ± 0.18 a6.9 ± 0.19 a19.3 ± 0.22 b38.7 ± 0.29 b41.4 ± 0.22 c44.3 ± 0.37 b46.7 ± 0.28 b
IN44.7 ± 0.22 a5.5 ± 0.24 a6.7 ± 0.23 a10.3 ± 0.19 a7.5 ± 0.16 a20.0 ± 0.19 a42.5 ± 0.25 a43.5 ± 0.21 a46.6 ± 0.38 ab53.2 ± 0.33 a
IN54.9 ± 0.13 a5.6 ± 0.21 a6.1 ± 0.26 a9.1 ± 0.22 a 7.0 ± 0.21 a23.1 ± 0.28 a44.7 ± 0.22 a44.3 ± 0.26 a50.1 ± 0.39 a55.4 ± 0.36 a
IN64.3 ± 0.11 a4.9 ± 0.17 b6.2 ± 0.24 a9.0 ± 0.21 a6.6 ± 0.16 b18.3 ± 0.30 b33.7 ± 0.21 c38.2 ± 0.24 b45.6 ± 0.33 b44.5 ± 0.39 b
IN74.1 ± 0.10 a4.9 ± 0.19 b6.1 ± 0.21 a8.1 ± 0.22 b6.3 ± 0.22 b19.4 ± 0.25 b39.6 ± 0.35 b37.9 ± 0.28 b44.9 ± 0.31 b40.7 ± 0.34 c
Note: IN1: 65% irrigation with 150 kg N hm−2; IN2: 100% irrigation with 150 kg N hm−2; IN3: 65% irrigation with 1250 kg N hm−2; IN4: 80% irrigation with 623 kg N hm−2; IN5: 89% irrigation with 1250 kg N hm−2; IN6: 100% irrigation with 917 kg N hm−2; IN7: 100% irrigation with 1250 kg N hm−2. DAT: days after irrigation water and nitrogen treatments. Values are given as means ± standard deviations, and different lowercase letters indicate significant differences at p ≤ 0.05 levels in the same line (LSD; n = 3).
Table 3. Effects of different treatments on actual leaf nitrogen content of cucumber during the 2021 study year.
TreatmentsActual Leaf Nitrogen Content (mg g−1)
Days after Treatment (DAT)
20 DAT35 DAT53 DAT78 DAT100 DAT
IN127.2 ± 0.31 e39.7 ± 0.34 e37.0 ± 0.30 e49.5 ± 0.35 c48.1 ± 0.33 c
IN223.4 ± 0.36 f40.5 ± 0.38 d36.2 ± 0.31 e52.9 ± 0.36 b41.2 ± 0.31 e
IN336.7 ± 0.34 d42.3 ± 0.35 d48.8 ± 0.34 d48.5 ± 0.33 c50.2 ± 0.34 ab
IN452.9 ± 0.37 b58.9 ± 0.32 ab59.3 ± 0.32 ab56.7 ± 0.32 a51.6 ± 0.35 a
IN565.0 ± 0.39 a61.6 ± 0.37 a63.4 ± 0.35 a59.9 ± 0.35 a53.2 ± 0.36 a
IN639.4 ± 0.38 c53.3 ± 0.39 c54.0 ± 0.37 c51.1 ± 0.40 b50.3 ± 0.33 ab
IN742.1 ± 0.41 c54.5 ± 0.40 c48.3 ± 0.39 d55.2 ± 0.41 b44.3 ± 0.31 d
Note: IN1: 65% irrigation with 150 kg N hm−2; IN2: 100% irrigation with 150 kg N hm−2; IN3: 65% irrigation with 1250 kg N hm−2; IN4: 80% irrigation with 623 kg N hm−2; IN5: 89% irrigation with 1250 kg N hm−2; IN6: 100% irrigation with 917 kg N hm−2; IN7: 100% irrigation with 1250 kg N hm−2. DAT: days after irrigation water and nitrogen treatments. Values are given as means ± standard deviations, and different lowercase letters indicate significant differences at p ≤ 0.05 levels in the same line (LSD; n = 3).
Table 4. Effects of different treatments on acid invertase enzyme activity and neutral invertase enzyme of cucumber during the 2021 study year.
TreatmentsAcid Invertase Enzyme (IU g−1) Neutral Invertase Enzyme (IU g−1)
Days after Treatment (DAT)Days after Treatment (DAT)
20
DAT
35
DAT
53
DAT
78
DAT
100
DAT
20
DAT
35
DAT
53
DAT
78
DAT
100 DAT
IN10.514 ± 0.81 d0.603 ± 0.56 e0.772 ± 0.53 c0.769 ± 0.56 c0.744 ± 0.66 b0.161 ± 0.55 b0.190 ± 0.57 c0.223 ± 0.68 b0.179 ± 0.62 c0.284 ± 0.68 b
IN20.613 ± 0.69 c0.721 ± 0.66 c0.568 ± 0.56 e0.611 ± 0.59 e0.687 ± 0.72 c0.222 ± 0.59 a0.200 ± 0.59 c0.146 ± 0.88 d0.234 ± 0.66 b0.213 ± 0.71 c
IN30.628 ± 0.51 c0.672 ± 0.76 d0.821 ± 0.65 b0.748 ± 0.63 c0.730 ± 0.63 b0.147 ± 0.61 b0.154 ± 0.66 d0.210 ± 0.64 b0.168 ± 0.63 c0.165 ± 0.78 d
IN40.790 ± 0.71 a0.786 ± 0.83 b0.830 ± 0.44 b0.810 ± 0.66 a0.829 ± 0.60 a0.224 ± 0.69 a0.275 ± 0.88 a0.289 ± 0.77 a0.284 ± 0.69 a0.290 ± 0.72 a
IN50.760 ± 0.49 a0.862 ± 0.82 a0.947 ± 0.67 a0.837 ± 0.69 a0.846 ± 0.55 a0.222 ± 0.70 a0.293 ± 0.56 a0.252 ± 0.72 a0.284 ± 0.73 a0.304 ± 0.81 a
IN60.740 ± 0.61 b0.600 ± 0.49 e0.660 ± 0.82 d0.790 ± 0.80 b0.592 ± 0.58 d0.153 ± 0.82 b0.249 ± 0.54 bc0.199 ± 0.78 c0.213 ± 0.81 b0.266 ± 0.91 b
IN70.474 ± 0.58 e0.767 ± 0.58 c0.677 ± 0.80 d0.694 ± 0.71 d0.638 ± 0.49 d0.233 ± 0.84 a0.268 ± 0.66 b0.142 ± 0.80 d0.216 ± 0.75 b0.185 ± 0.95 d
Note: IN1: 65% irrigation with 150 kg N hm−2; IN2: 100% irrigation with 150 kg N hm−2; IN3: 65% irrigation with 1250 kg N hm−2; IN4: 80% irrigation with 623 kg N hm−2; IN5: 89% irrigation with 1250 kg N hm−2; IN6: 100% irrigation with 917 kg N hm−2; IN7: 100% irrigation with 1250 kg N hm−2. DAT: days after irrigation water and nitrogen treatments. Values are given as means ± standard deviations, and different lowercase letters indicate significant differences at p ≤ 0.05 levels in the same line (LSD; n = 3).
Table 5. Effects of different treatments on the RuBisCO activity and superoxide dismutase activity of cucumber during the 2021 study year.
TreatmentsRuBisCO (Ug−1 FW h−1)SOD Activity (Ug−1 FW h−1)
Days after Treatment (DAT)Days after Treatment (DAT)
20 DAT35 DAT53 DAT78 DAT100 DAT20 DAT35 DAT53 DAT78 DAT100 DAT
IN10.877 ± 0.31 b0.873 ± 0.33 b0.831 ± 0.22 d0.703 ± 0.26 e0.723 ± 0.33 c591 ± 0.95 d457 ± 0.56 e1171 ± 0.55 b1032 ± 0.88 d814 ± 0.61 c
IN20.900 ± 0.29 a0.624 ± 0.31 d0.896 ± 0.26 b0.927 ± 0.32 b0.785 ± 0.31 c372 ± 0.87 f726 ± 0.67 c716 ± 0.63 d1237 ± 0.91 c507 ± 0.72 e
IN30.801 ± 0.23 c0.868 ± 0.30 b0.864 ± 0.30 c0.756 ± 0.23 d0.745 ± 0.29 c814 ± 0.83 c861 ± 0.63 b973 ± 0.51 c1029 ± 0.83 d865 ± 0.59 c
IN40.933 ± 0.33 a1.043 ± 0.28 a1.017 ± 0.33 a1.077 ± 0.22 a0.823 ± 0.27 b926 ± 0.75 b918 ± 0.51 a1347 ± 0.47 a1336 ± 0.71 b1224 ± 0.65 b
IN50.941 ± 0.27 a1.138 ± 0.26 a1.133 ± 0.28 a1.146 ± 0.21 a1.039 ± 0.24 a1175 ± 0.61 a941 ± 0.49 a1351 ± 0.42 a1415 ± 0.67 a1445 ± 0.44 a
IN60.626 ± 0.29 d0.832 ± 0.23 c0.922 ± 0.26 b0.768 ± 0.20 d0.793 ± 0.23 c519 ± 0.69 d695 ± 0.66 d632 ± 0.39 e1291 ± 0.77 c631 ± 0.55 d
IN70.916 ± 0.30 a0.848 ± 0.21 b1.006 ± 0.22 a0.841 ± 0.19 c0.677 ± 0.26 d493 ± 0.59 e786 ± 0.72 c909 ± 0.41 c745 ± 0.65 e1202 ± 0.62 b
Note: IN1: 65% irrigation with 150 kg N hm−2; IN2: 100% irrigation with 150 kg N hm−2; IN3: 65% irrigation with 1250 kg N hm−2; IN4: 80% irrigation with 623 kg N hm−2; IN5: 89% irrigation with 1250 kg N hm−2; IN6: 100% irrigation with 917 kg N hm−2; IN7: 100% irrigation with 1250 kg N hm−2. DAT: days after irrigation water and nitrogen treatments. Values are given as means ± standard deviations, and different lowercase letters indicate significant differences at p ≤ 0.05 levels in the same line (LSD; n = 3).
Table 6. Correlation coefficients of irrigation water with nitrogen coupling of sand−cultivated cucumbers using a quadratic saturation D−optimal design.
AIECAT GLDHGSGOGATNIENRPODRUBSODSPSPSSSCSSTN
CAT0.945 **
GLDH0.921 **0.872 *
GS0.891 **0.961 **0.859 *
GOGAT0.917 **0.830 *0.848 *0.819 *
NIE0.775 *0.835 *0.912 **0.859 *0.643
NR0.940 **0.950 **0.919 **0.926 **0.921 **0.852 *
POD0.762 *0.887 **0.824 *0.899 **0.7270.898 **0.919 **
RUB0.890 **0.965 **0.888 **0.977 **0.812 *0.868 *0.928 **0.920 **
SOD0.988 **0.972 **0.909 **0.917 **0.904 **0.779 *0.948 **0.809 *0.934 **
SP0.851 *0.764 *0.769 *0.6900.947 **0.5670.891 **0.6990.6970.835 *
SPS0.894 **0.964 **0.909 **0.983 **0.826 **0.907 **0.954 **0.948 **0.992 **0.927 **0.727
SSC0.799 **0.689 **0.6970.6280.877 **0.5380.830 *0.6100.5770.7440.946 **0.635
SS0.889 **0.895 **0.932 **0.806 *0.7160.880 **0.869 **0.815 *0.873 *0.904 **0.6900.874 *0.587
TN0.852 *0.824 *0.885 *0.825 *0.932 **0.793 *0.958 **0.871 *0.827 *0.846 *0.924 **0.871 *0.869 *0.763 *
Y0.6470.5560.5750.5290.850 *0.4050.754 *0.5820.4960.6140.932 **0.5520.937 **0.4220.863 *
Note: AIE: acid Invertase enzyme; CAT: catalase activity; GLDH: glutamate dehydrogenase activity; GS: glutamine synthase activity; GOGAT: glutamate synthase activity; NIE: neutral invertase enzyme; NR: nitrate reductase activity; POD: peroxidase activity; RUB: RuBisCO; SOD: superoxide dismutase activity; SP: soluble protein content; SPS: sucrose phosphate synthase activity; SSC: soluble sugar content; SS: sucrose synthase activity; TN: total nitrogen content; Y: cucumber yield. * Significant at the 0.05 probability level. ** Significant at the 0.01 probability level.
Disclaimer/Publisher’s Note: The statements, opinions and data contained in all publications are solely those of the individual author(s) and contributor(s) and not of MDPI and/or the editor(s). MDPI and/or the editor(s) disclaim responsibility for any injury to people or property resulting from any ideas, methods, instructions or products referred to in the content.