Article

Has the Digital Economy Improved the Urban Land Green Use Efficiency? Evidence from the National Big Data Comprehensive Pilot Zone Policy

1
School of Economics and Trade, Hunan University, Changsha 410006, China
2
School of Finance and Statistics, Hunan University, Changsha 410006, China
*
Author to whom correspondence should be addressed.
Land 2024, 13(7), 960; https://doi.org/10.3390/land13070960
Submission received: 23 May 2024 / Revised: 21 June 2024 / Accepted: 27 June 2024 / Published: 30 June 2024

Abstract

:
The advancement of the big data industry is playing a pivotal role in urban land management refinement. Recently, China initiated a big data strategy, establishing national big data comprehensive pilot zones (NBDCPZs) across diverse regions. These initiatives present substantial opportunities for enhancing the urban land green use efficiency (ULGUE). Consequently, in this study, we utilized the super-efficiency slack-based measure (SBM) model with undesirable outputs to assess the ULGUEs across 281 prefecture-level cities in China from 2006 to 2021. Subsequently, leveraging the NBDCPZ establishment as a quasi-natural experiment, we employed the difference-in-differences (DID) method to empirically explore the impact of the NBDCPZ policy on the ULGUE for the first time. The findings revealed the following: (1) The implementation of the NBDCPZ policy significantly enhances the ULGUE; (2) the effects are mediated through mechanisms such as fostering technological innovation, mitigating resource misallocation, and promoting industrial agglomeration; (3) the heterogeneity analysis emphasizes the increased policy effectiveness in cities characterized by fewer natural resources, lower economic growth pressures, stable development stages, and moderate digital infrastructure and human capital levels; and (4) further analysis demonstrates the significant positive spillover effects of the NBDCPZ policy on the ULGUEs of neighboring non-pilot cities, with a diminishing impact as the proximity between pilot and non-pilot cities decreases. Overall, this study contributes to the literature on the relationship between the digital economy and land utilization, offering valuable insights for achieving sustainable urban development.

1. Introduction

Since the turn of the 21st century, China’s urbanization has surged, with the urbanization rate jumping from 36.09% at the beginning of the century to 66.16% by the end of 2023. However, this rapid, land-intensive urban growth has posed serious threats to land-use efficiency and sustainable resource utilization, resulting in the scarcity of arable land [1], the significant depletion of natural resources [2], and increased environmental degradation [3]. According to the National Land Planning Outline, between 2006 and 2016, China’s water and energy consumption per unit of GDP were 3.3 times and 2.5 times the global average, respectively, with 16.1% of the nation’s soil exceeding the pollution standards. Despite these high land-use costs, the returns have been disproportionate [4,5]. In 2018, industrial land constituted nearly 20% of China’s total land use—about double the global average at the time—and the per capita industrial added value was only USD 2726, merely 29.7% of that in Germany, the global leader. It is clear that enhancing the land-use efficiency and achieving sustainable urban development have emerged as critical challenges in China’s modernization efforts.
In response, the Chinese government highlighted the need for an accelerated transition to sustainable environmental practices and more intensive land use in the “14th Five-Year Plan for National Economic and Social Development (2021–2025)”, released in 2021. This policy underscores a pivotal shift in China’s urban land-use strategy from the sole emphasis on GDP growth to a more integrated and comprehensive evaluation framework. This shift is in line with the evolving concept of the urban land green use efficiency (ULGUE), which seeks to optimize the urban land economic and ecological benefits while minimizing the resource consumption and environmental impact [6,7]. Unlike land-use efficiency concepts that focus solely on the economic output per unit of land, the ULGUE encompasses both economic and ecological dimensions, reflecting an economy’s production scale and technological level [8]. The ULGUE is crucial, as it reflects the material and environmental quality of urban living conditions [9]. Discussion on the factors that improve the ULGUE has been a focal point in recent research [10,11].
Traditionally, studies have focused on enhancing labor productivity [12], adjusting the land supply [13], and improving transportation infrastructure [14]. However, with the widespread application of internet technology and the development of digital services such as cloud computing and the Internet of Things, big data has emerged as a new production factor that is being rapidly integrated into various aspects of urban production, consumption, and distribution [15,16,17]. There are two main reasons for this shift. First, in the context of the digital economy, land management departments can leverage technologies such as land information systems to improve urban planning, scientifically allocate land construction quotas, and monitor land pollution in real time, directly impacting the ULGUE [18,19,20]. Second, businesses can use big data technology to identify target customers [21], shape consumer perceptions [22], predict market risks [23], and monitor their energy consumption [24], thereby indirectly enhancing the ULGUE by improving their production processes and optimizing their operational efficiencies [25]. To stimulate the development of China’s digital economy, the State Council issued the “Big Data Development Outline” in 2015, officially designating Guizhou Province as the nation’s first comprehensive big data pilot zone. In October 2016, to further implement China’s big data strategy, the National Development and Reform Commission, in conjunction with the Ministry of Industry and Information Technology and other relevant departments, approved the initiation of NBDCPZ construction in seven regions, including Beijing, Tianjin, Inner Mongolia, and Henan (see Figure 1 for the spatial distribution of the NBDCPZ regions). According to the construction plan, the pilot cities aim to explore data center integration and utilization, data resource open sharing, and the development of data industry clusters within the big data domain. Additionally, the big data industrial parks focus on key digital economy industries such as artificial intelligence, 5G, blockchain, and the Internet of Things, promoting the application of cutting-edge digital technologies within the pilot zones to spur overall digital economic development in these areas.
Notably, the policy document emphasizes the role of these initiatives in enhancing land data collection, improving the allocation of land and other resources, and promoting urban sustainability. Local governments are urged to utilize big data technologies within their NBDCPZs, such as satellite remote sensing, drones, and the Internet of Things, to establish environmental monitoring systems and achieve precise urban ecosystem management.
Has the NBDCPZ construction truly improved the ULGUE? If so, what are the possible mechanisms of influence? Clarifying these questions is crucial for advancing green and sustainable land utilization. Utilizing panel data from 281 prefecture-level cities from 2006 to 2021, in this study, we made the first attempt to investigate the impact of the NBDCPZ policy on the ULGUE. The potential contributions of this study are as follows:
  • The existing research primarily focuses on either the economic benefits [26,27] or the environmental benefits [28,29] of the digital economy in isolation. By incorporating pollutant emissions as undesirable outputs in the assessment of the ULGUE, in this paper, we provide a more comprehensive understanding of the consequences of the NBDCPZ policy on land use;
  • While prior studies tend to analyze the economic and environmental benefits of the big data industry from perspectives such as technological innovation, resource allocation, and industrial structures [30,31], in this paper, we identify and validate an important but overlooked channel: the policy’s role in promoting the ULGUE by attracting big data enterprises and talent, thereby facilitating industrial agglomeration;
  • When analyzing the heterogeneous effects of the NBDCPZ policy, the existing literature often focuses on the city size and location [24,30]. However, in this paper, we highlight the importance of a city’s economic conditions, hardware, and talent availability. Moreover, we investigate the policy’s effects across various development stages, economic growth pressures, and digital infrastructure and human capital levels, providing clearer guidance for the selection of suitable big data pilot zones;
  • The high mobility of data elements implies that the impact of the NBDCPZ policy is likely to spill over to non-pilot cities [32,33], potentially violating the stable-unit treatment value assumption (SUTVA) of the difference-in-differences (DID) model. Therefore, we employ a spatial difference-in-differences (SDID) method to further explore the spillover effects, offering valuable insights for policymakers aiming to optimize land utilization.
The subsequent sections of this paper are organized as follows: Section 2 outlines the theoretical analysis and hypotheses. Section 3 introduces the model setting, variable descriptions, and data sources. Section 4 reports the empirical results, including those from the benchmark regression, parallel-trend, and robustness tests. Section 5 delves into the mechanisms underlying the impact of the NBDCPZ policy on the ULGUE. Section 6 examines the heterogeneity impact and spatial spillover effects of the NBDCPZs. The conclusions and implications are presented in Section 7. The research framework is shown in Figure 2.

2. Theoretical Analysis and Hypothesis

2.1. Technological Innovation

The ULGUE, defined as the achievement of the maximum economic, social, and ecological outputs with minimal land input under specific technological conditions [34], is heavily reliant on technological advancement. The establishment of NBDCPZs influences the ULGUE via two mechanisms. First, it accelerates technology dissemination and application by leveraging big data platforms and enhancing knowledge sharing among enterprises, thereby boosting productivity [35,36]. Second, it mitigates the risks associated with innovation. Given the long-term and uncertain nature of innovation, enterprises often lack motivation due to insufficient returns [37]. Big data technologies can offer precise matching and communication platforms for enterprises and consumers, reducing information asymmetry and boosting innovation investment success rates [38].
The NBDCPZ policy mainly enhances the ULGUE through four avenues. First, the policy encourages technological innovation in agriculture, accelerating the digitization of the production and management services in rural areas, thereby increasing the total factor productivity of rural land. Second, it fosters innovation in construction by integrating Internet of Things sensing devices and communication systems into projects, enabling high-performance algorithms to optimize the building operations and reduce the daily energy consumption [39]. Third, it advances land monitoring and planning through digital remote-sensing technology, facilitating efficient land allocation [40]. Lastly, it drives technological innovation in road transportation, improving logistics management and reducing urban air pollution. Correspondingly, we propose the following hypothesis:
H1. 
The NBDCPZ policy enhances the ULGUE by elevating technological innovation.

2.2. Resource Misallocation

Under perfect competition, production factors flow towards regions and sectors with the highest marginal outputs until the law of diminishing returns equalizes the outputs across the economy, achieving optimal resource allocation. However, administrative barriers, industry monopolies, and information asymmetry often prevent efficient resource use. This issue is exacerbated in emerging economies with underdeveloped markets [41,42]. Estimates by Hsieh and Klenow [43] suggested that China’s manufacturing productivity could increase by 86–110% in the absence of resource misallocation. Thus, addressing resource misallocation is crucial for improving the ULGUE in China [44].
Due to the rigidity of the land supply in China, public land transactions often show irrational allocation [45]. Big data technologies such as satellite remote sensing and the terrestrial Internet of Things can help land authorities collect land information promptly and optimize land-use decisions [31]. Banks within NBDCPZs can integrate digital technology with conventional financial models to detect non-compliant behaviors among enterprises and individuals utilizing vast data resources, reducing the likelihood of loan defaults stemming from moral hazards and adverse selection, thereby promoting green innovation [46]. Additionally, the establishment of NBDCPZs increases the demand for high-skilled labor and correspondingly reduces low-skilled employment [47,48]. This process continues until the labor resources achieve equilibrium across regions and industries, leading to the optimization of the ULGUE [49]. Therefore, the following hypothesis is proposed:
H2. 
The NBDCPZ policy enhances the ULGUE by reducing capital misallocation.

2.3. Optimization of Industrial Structure

The industrial structure refers to the composition, proportion, and interrelationship of various sectors within an economy. As society evolves, this structure is constantly optimized. The existing studies describe this dynamic adjustment through two main concepts: industrial structure rationalization and industrial structure upgrading. Industrial structure rationalization involves adjusting the resource allocation and factor inputs to achieve a balanced proportion and productive relationships among industries. Industrial structure upgrading refers to the transition of industries from low-efficiency utilization to high-efficiency utilization [50,51].
In line with the NBDCPZ policy, pilot cities are expediting industrial structure rationalization through various methods. For example, the NBDCPZs have established a nationwide big data exchange, aiming to standardize data circulation. By constructing a smart financial platform covering the provincial, municipal, and county levels, the exchange has improved the cities’ capabilities in inclusive finance, green finance, and financial regulation and has, thereby, facilitated cross-sectoral resource mobility and promoted industrial structure rationalization [52]. Additionally, the construction of NBDCPZs supports industrial structure upgrading via the use of internet development funds to channel resources to high-tech sectors, which do not generate a lot of physical pollution. This process phases out outdated, high-energy-consuming, and high-polluting industries and drives the digital transformation of industries such as phosphorus chemical, tobacco, and energy enterprises, thereby enhancing production processes and improving the ULGUE [53,54]. Correspondingly, the following hypotheses are proposed:
H3a. 
The NBDCPZ policy enhances the ULGUE by promoting industrial structure rationalization.
H3b. 
The NBDCPZ policy enhances the ULGUE through industrial structure upgrading.

2.4. Industrial Agglomeration

New economic geography theory and external economy theory suggest that industrial agglomeration can generate interrelated production networks within the regional scope, leading to economies of scale and scope, thereby increasing the output per unit of land area and enhancing the ULGUE [55].
Specifically, the establishment of NBDCPZs can influence the ULGUE through two pathways: industrial specialization enhancement and collaborative agglomeration in pilot cities. Industrial specialization agglomeration involves the concentration of the same industry within a specific area [56]. Local governments are constructing 5G base stations and international internet data channels, as per the NBDCPZ development plan, creating favorable conditions for the specialization agglomeration of the big data industry. These digital infrastructures not only foster the growth of the data element market [57,58], but they also attract talent by offering high-quality public services, contributing to a “reservoir of highly skilled labor” [59] and improving the matching efficiency between enterprises and workers. Furthermore, recognizing the dispersed nature of big data enterprises [60], governments have established numerous industrial parks in response to the NBDCPZ policy, addressing the challenge of the low ULGUEs caused by scattered industrial land locations [61]. Additionally, specialized enterprises generally have lower organizational management costs and stronger technological absorption capabilities compared to large, integrated enterprises [62], indicating that specialization agglomeration can improve the ULGUE by promoting enterprise specialization [63].
Collaborative industrial agglomeration refers to the clustering of interrelated industries within a geographic area [64]. Unlike specialization agglomeration, collaborative industrial agglomeration emphasizes the connections between different industries. According to the NBDCPZ policy, regional governments must support both upstream and downstream enterprises, facilitating the coordinated development of various industries. Jacobs’ externality theory suggests that collaborative agglomeration can improve the ULGUE by facilitating resource acquisition, accelerating technology dissemination and cross-industry interaction, and promoting the sharing of customers and suppliers [65]. Thus, the following hypotheses are proposed:
H4a. 
The NBDCPZ policy enhances the ULGUE by promoting industrial specialization agglomeration.
H4b. 
The NBDCPZ policy enhances the ULGUE by promoting collaborative industrial agglomeration.

3. Model Setting, Variables, and Data Sources

3.1. Model Setting

Given the regional and temporal variations in the NBDCPZ policy, in this study, we employed a multi-period DID method to investigate its impact on the ULGUE. The model is formulated as follows:
U L G U E i t = α 0 + α 1 N B D C P Z i t + α k C o n t r o l s i t + μ i + λ t + ε i t
where the subscripts i and t denote cities and years, respectively; U L G U E i t denotes the urban land green use efficiency of city i in year t; N B D C P Z i t indicates whether city i initiated the construction of a national big data comprehensive pilot zone in year t, and its coefficient ( α 1 ) measures the policy’s impact on the ULGUE (an α 1 significantly greater than 0 suggests that the increases in the ULGUEs in the pilot cities exceed those in the non-pilot cities, addressing the questions raised in the Section 1); C o n t r o l s i t denotes a series of control variables, with α k representing their coefficients; α 0 is the intercept term; μ i and λ t denote the city and time fixed effects, respectively; ε i t reflects the error term.

3.2. Variables

3.2.1. Dependent Variable

The measurement of the ULGUE has been a significant research topic. Traditional data envelopment analysis (DEA) methods determine the indicator weights through optimization under multiple input and output scenarios, providing an objective reflection of the ULGUE [53]. However, as land eco-efficiency has gained more attention, the DEA model’s inability to incorporate undesirable outputs has become a notable limitation. To address this, Tone [66] developed the super-efficiency slack-based measure (SBM) model with undesirable outputs, enhancing the efficiency measurement in such contexts. This model’s advantage has led to its widespread use in assessing the ULGUE. Its calculation formula is as follows [67]:
min θ = 1 m i m x ¯ x i 0 1 q 1 + q 2 s q 1 y ¯ d y s 0 d + k q 2 y ¯ u y k 0 u
s . t .   x ¯ j = 1 , j 0 n λ j x i j ; y ¯ d j = 1 , j 0 n λ j y s j d ; y ¯ u j = 1 , j 0 n λ j y k j u ; x ¯ x i 0 ;         y ¯ d y s 0 d ;         y ¯ u y k 0 u ;         λ j 0
where θ represents the ULGUE; m, q 1 , and q 2 denote the numbers of input, desirable output, and undesirable output indicators, respectively; λ j indicates the weight of each indicator; x i j , y s j d , and y k j u represent the input, desirable output, and undesirable output matrices for the cities, respectively; x ¯ , y ¯ d , and y ¯ u denote the slack terms for the corresponding variables [14,30].
The variables required for the measurement are as follows: (1) The inputs: Specifically, the urban construction land area gauges the land input, the fixed-asset investment serves as an indicator of the urban capital input, and the number of employees in the secondary and tertiary industries within the urban area represents the labor input indicator. (2) The desired outputs: The desired land outputs include the economic, social, and ecological benefits. To quantify the economic benefits of land, we utilized the value added from the secondary and tertiary industries within the urban area, as these sectors are the primary drivers of the urban economic activity. For the social benefits, we used the per capita disposable income of urban residents as an indicator. As a measure of the ecological benefits, we chose the green coverage rate of built-up areas, which directly reflects the ecological status of the land. (3) The undesirable outputs: The undesirable outputs represent the by-products of the urban land use that were not anticipated by society. Following previous studies, we selected industrial wastewater discharge, industrial sulfur dioxide emissions, and industrial smoke (dust) emissions as the undesirable output indicators. To reduce data dispersion and heteroscedasticity, logarithmic transformations were applied to these indicators [68]. Detailed descriptions of the indicators used to calculate the ULGUE are shown in Table 1.
Figure 3 illustrates the spatial distributions of the ULGUEs in the sample cities for the years 2006, 2011, 2016, and 2021. Overall, the ULGUEs in China have shown a significant improvement over the years. Spatially, the ULGUEs are higher in the southeastern coastal and western regions, exhibiting a clear spatial clustering tendency. This finding is consistent with the results reported in other literature [67].

3.2.2. Independent Variable

In this study, we regarded the NBDCPZ policy as a quasi-natural experiment. The core explanatory variable, the NBDCPZ variable, was derived from the interaction term of the TREAT and TIME variables. Specifically, the TREAT variable was a dummy variable taking the value of 1 if a city was included on the NBDCPZ policy list and a value of 0 otherwise. The TIME variable was determined based on the implementation timing of the NBDCPZ policy. If the pilot city was approved for construction in the year or before, it took a value of 1; otherwise, it took a value of 0.

3.2.3. Control Variables

Referring to the relevant literature, the control variables used in the model were as follows: (1) the per capita GDP (PGDP) logarithm, used to measure a city’s affluence [67]; (2) the urban gross domestic product (GDP) logarithm, used to measure the economic development level [34]; (3) the infrastructure level (INF), represented by the logarithm of the ratio of the urban road mileage to the urban construction land area [70]; (4) the government intervention intensity (GOV), represented by the proportion of the urban fiscal expenditure to the urban gross domestic product [30]; (5) the urban resource endowment (RES), measured by the proportion of mining workers to the total employment [75]; and (6) the population density (DEN), represented by the logarithm of the number of people per unit area in the city [24]. All the continuous variables were winsorized at the 1st and 99th percentiles to mitigate the impact of outliers.

3.3. Data Sources

The NBDCPZ policy was initiated in 2015 and has been gradually expanded to various cities across China. By 2021, the policy had been implemented in 55 cities nationwide. Based on the policy timeline and data availability, in this study, we followed the existing literature and excluded cities with significant data gaps, mainly cities in Tibet, Xinjiang, and Ningxia [30,67]. The research period was set from 2006 to 2021, compiling panel data from 281 prefecture-level cities in China. To address missing observations in certain years, methods such as linear interpolation were applied for completion. The data utilized in this study were predominantly sourced from official documents or websites including the China City Statistical Yearbook, China Energy Statistical Yearbook, China Research Data Services Platform, Express Professional Superior Data Platform, and Macroeconomic and Real Estate Database, among others. The descriptive statistics for all variables are shown in Table 2.

4. Results

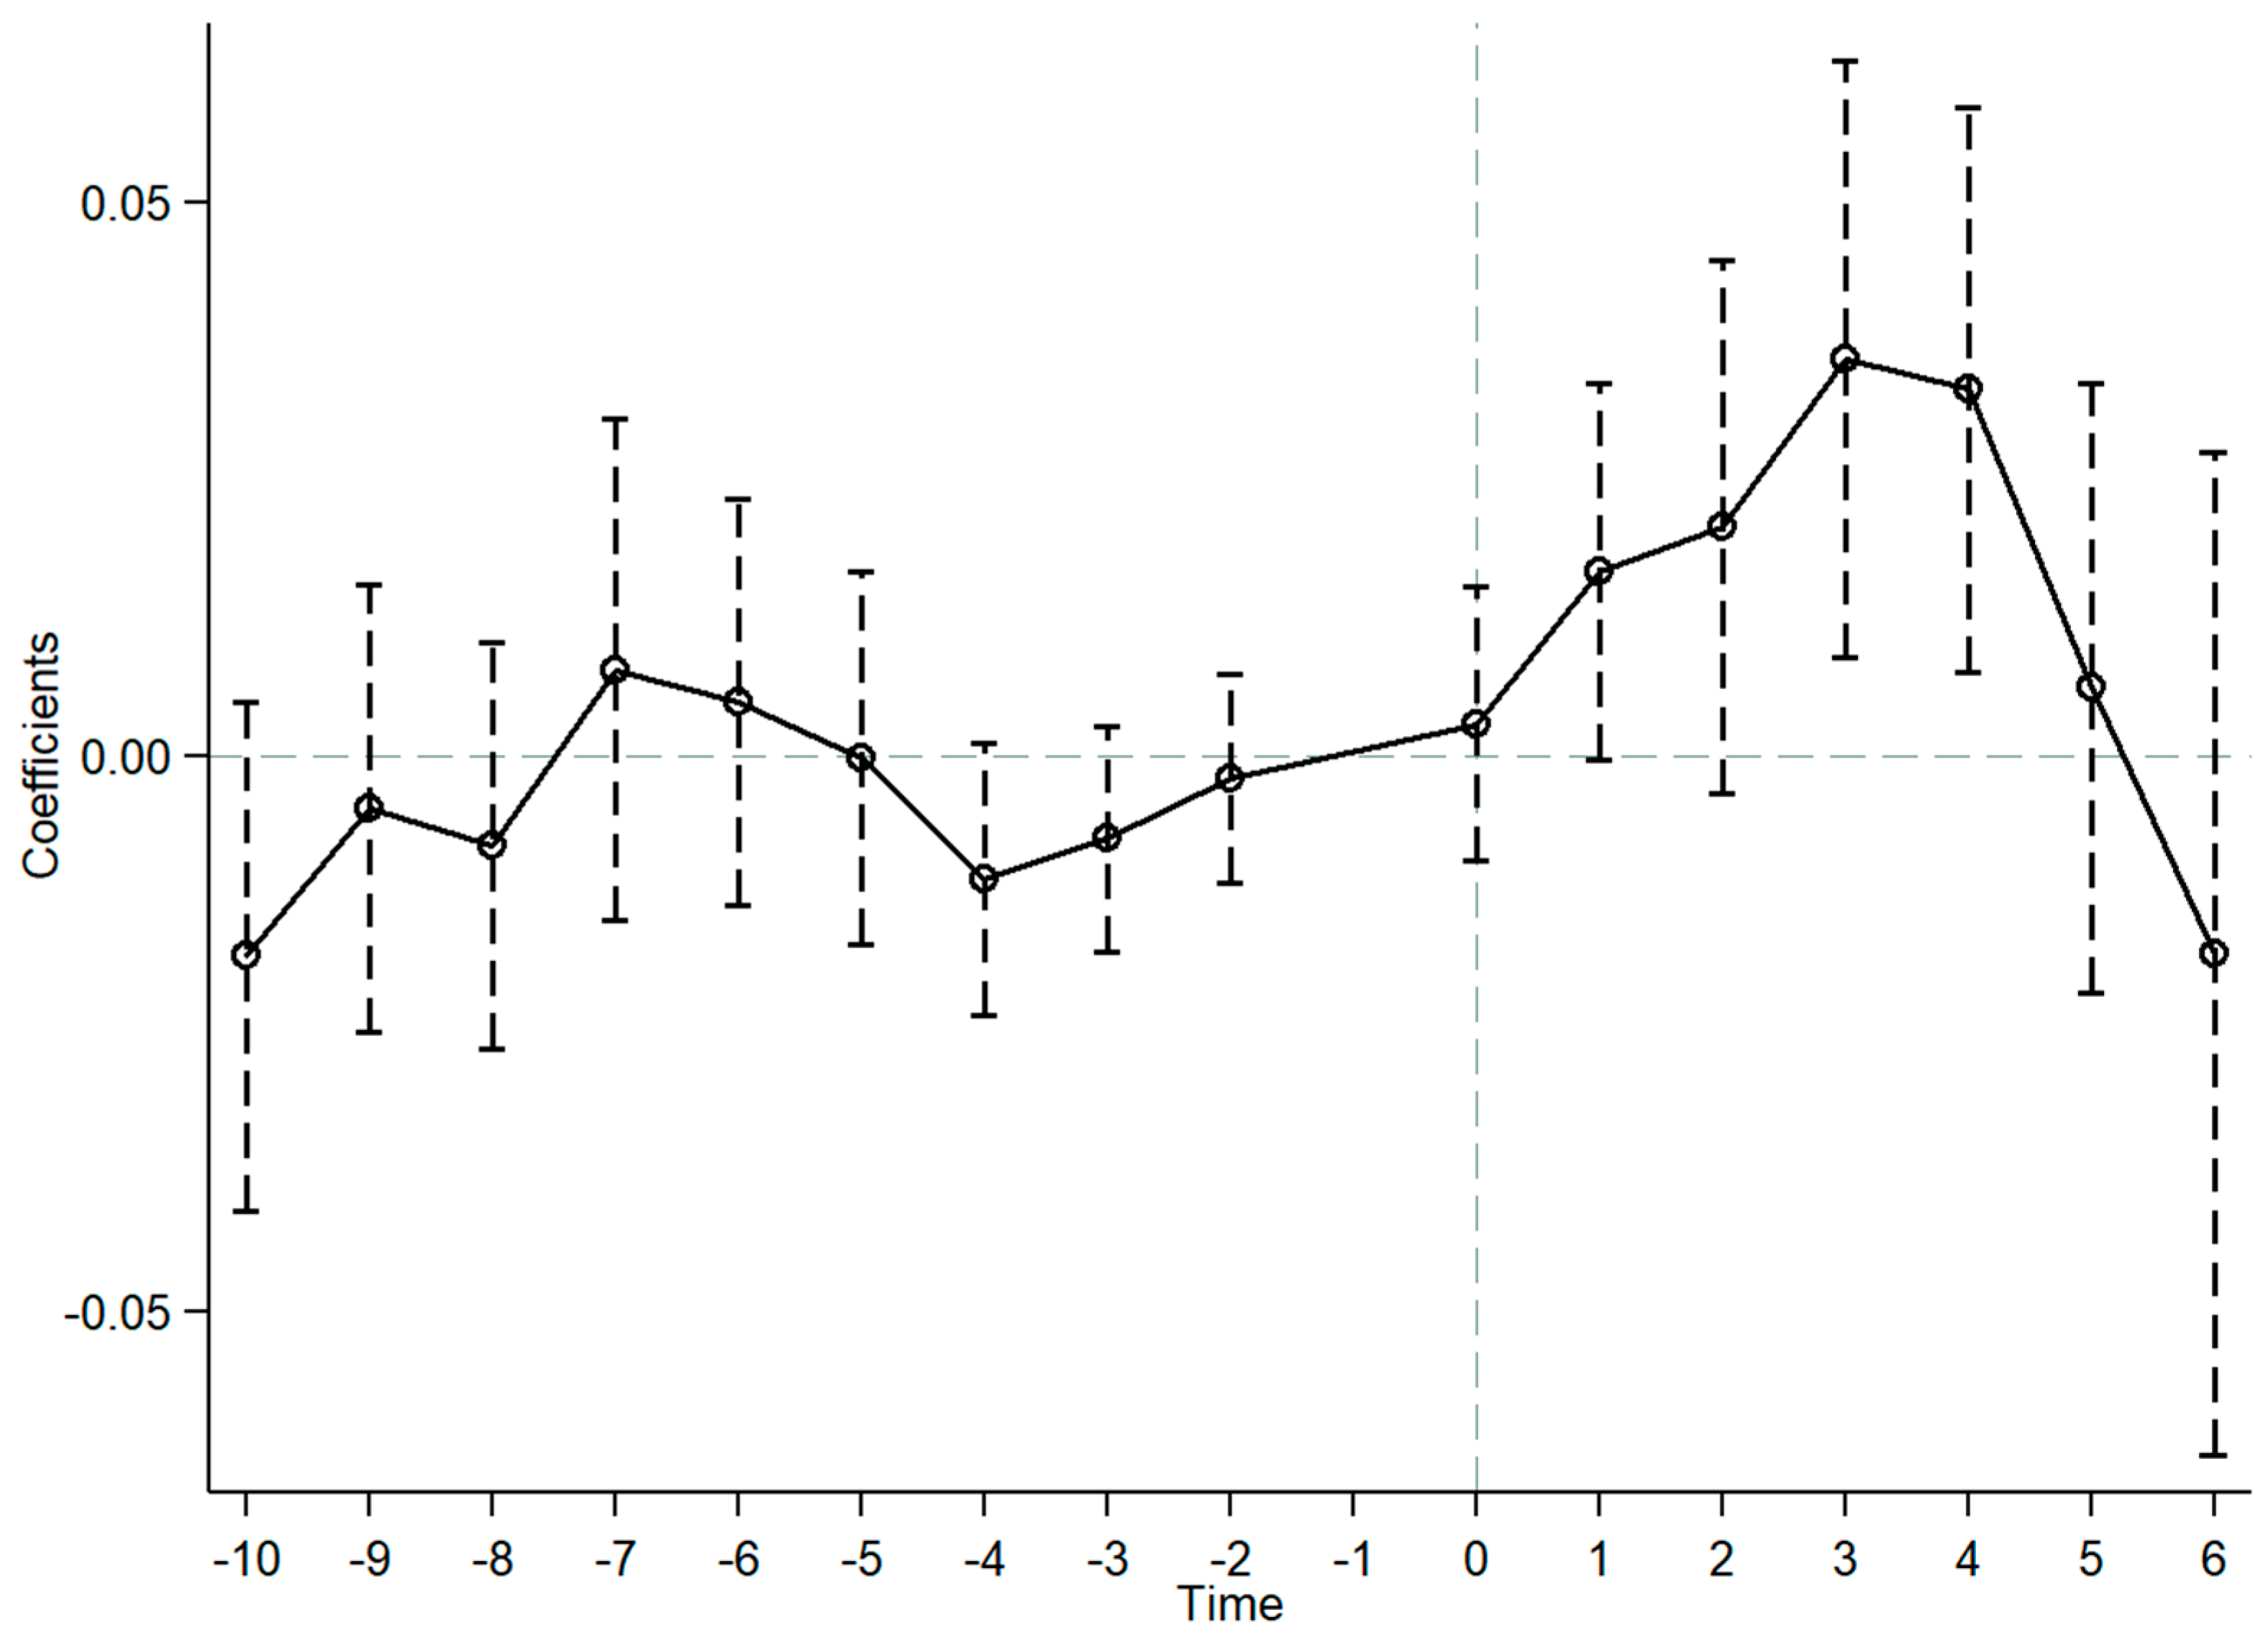
4.1. Parallel-Trend Test

Using a multiple-period DID model to evaluate the impact of the NBDCPZ policy on the ULGUE, we assumed that there were no significant differences between the experimental and control groups before the policy implementation. To test this assumption, we set up the following equation:
U L G U E i t = β 0 + β 10 N B D C P Z i 10 + β 9 N B D C P Z i 9 + + β 6 N B D C P Z i 6 + γ k C o n t r o l s i t + μ i + λ t + ε i t
where N B D C P Z i ± t denotes a series of dummy variables. A value of 1 is assigned to N B D C P Z i t if city i is on the NBDCPZ policy list and if the observation period is precisely t years before the NBDCPZ establishment. Similarly, a value of 1 is assigned to N B D C P Z i t if the observation period is exactly t years after the NBDCPZ establishment. Otherwise, the value is set to 0. The first year before the NBDCPZ establishment (i.e., N B D C P Z i 1 ) serves as the benchmark year. Figure 4 presents the parallel-trend test results, with the horizontal axis indicating the years relative to the NBDCPZ establishment and the vertical axis indicating the estimated results.

4.2. Benchmark Regression

Table 3 presents the results from Equation (1). Column (1) does not include the control variables, while Columns (2) and (3) progressively add various city-level controls. All regressions were controlled for time and city fixed effects. As shown in Table 3, the coefficient for the key variable, the NBDCPZ variable, is consistently positive and significant at the 1% level, indicating a positive correlation between the NBDCPZ establishment and ULGUE. Regarding the control variables, PGDP, INF, RES, and DEN exhibit positive impacts on the ULGUE, while GDP and GOV exhibit negative correlations with it.

4.3. Robustness Tests
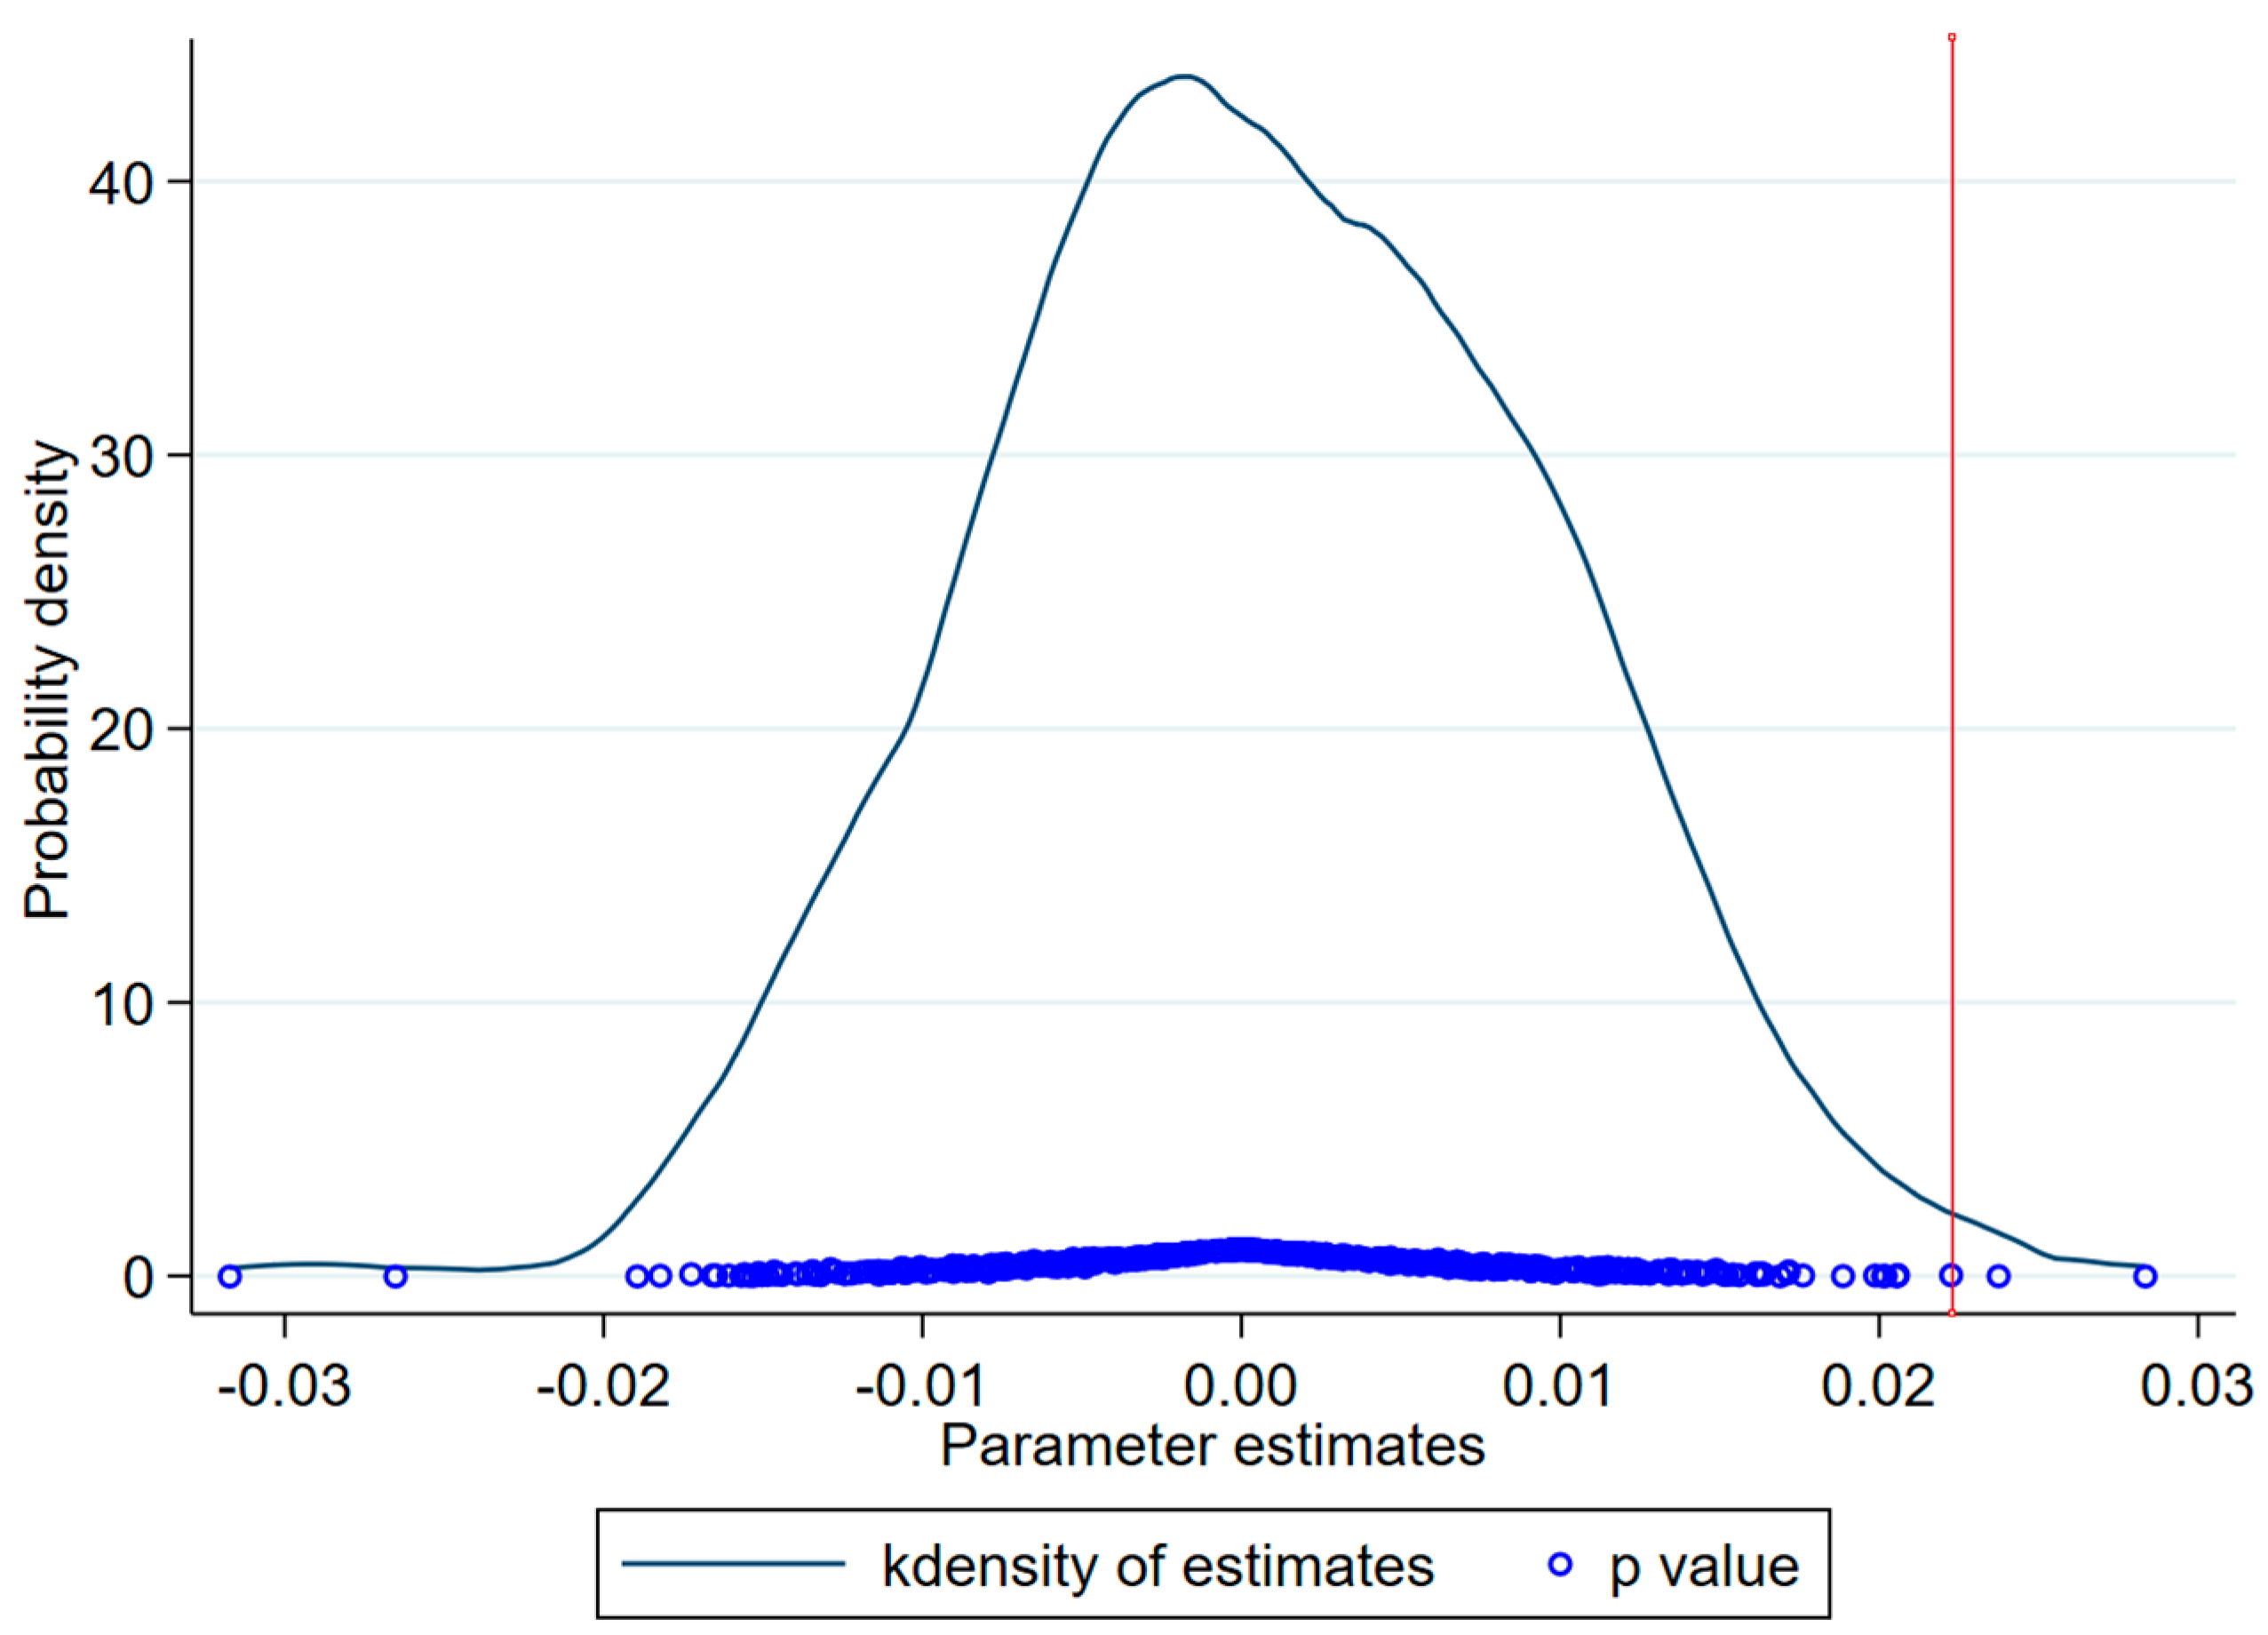
4.3.1. Placebo Test

Although the benchmark model included a series of control variables and city–year fixed effects to address potential confounders affecting the ULGUE, other unknown factors may have still interfered with the results. To further validate the reliability of the results, we randomly selected 55 cities from the pool of 281 cities, matching the actual number of pilot cities. For each selected city, a year between 2006 and 2021 was randomly chosen as the policy implementation year. This process was repeated 500 times, with an empirical regression conducted for each iteration. Figure 5 illustrates the distribution of these 500 “false” estimated results, which are centered around zero, confirming that unobservant factors did not significantly affect the benchmark result accuracy.

4.3.2. Dependent Variable Substitution

Given the close relationship between the urban input–output and city size, we adjusted the input variables (capital stock and labor) and output variables (industrial value added and pollution emissions) by dividing them by the city’s built-up area. The dependent variable, the ULGUE variable, was then recalculated based on this rescaling. Column (1) of Table 4 presents the results after this adjustment, with the NBDCPZ coefficient remaining significantly positive at the 1% level.
In the baseline regression, the green coverage rate was used to measure urban ecological benefits, and the industrial emission wastewater, sulfur dioxide, and industrial smoke (dust) were used as the undesirable outputs [14,30,71,72]. However, the carbon dioxide (CO2) impact was not considered. To address this, we employed two methods. First, following the approach of Fan et al. [70], we replaced the green coverage rate with the urban green space carbon sink to re-measure the ULGUE, with the updated results presented in Column (2) of Table 4. Second, we included CO2 emissions as an undesirable output indicator, with the results shown in Column (3) of Table 4. Column (4) of Table 4 presents the results when both methods were applied simultaneously. In all cases, the results are significantly positive.

4.3.3. Core Explanatory Variable Substitution

Given that the NBDCPZ policy was typically implemented in October, close to the year’s end, some studies set the policy execution time to the following year [76]. Column (5) of Table 4 reports the coefficient after adjusting the explanatory variable accordingly. The coefficient of the NBDCPZ variable remained significantly positive at the 1% level.

4.3.4. Testing for Anticipation Effects

A critical assumption of the DID method is that cities in the treatment group should not exhibit anticipatory behavior before the policy takes effect. To validate the DID estimates, we introduced a time dummy variable for the year prior to the policy implementation (pre_1) and its interaction term with the NBDCPZ variable. This interaction term, NBDCPZ_pre1, was then included in model (1). A NBDCPZ_pre1 coefficient significantly different from zero suggests that the residents anticipated the policy before its announcement, potentially biasing the estimates [77]. The result shown in Column (6) of Table 4 indicates that the NBDCPZ_pre1 coefficient is not significant, confirming the exogeneity of the NBDCPZ policy.

4.3.5. Inclusion of Additional Control Variables

Although our baseline regression model includes several key variables that could influence the ULGUE, omitted variable bias remains a concern. To address this, we drew on the study by Lyu et al. [30] and added more control variables: the urbanization level (URB), measured by the urban-to-total population ratio; the scientific expenditure proportion (SCI), measured by the city scientific expenditure-to-fiscal expenditure ratio; and the financial potential (FIN), measured by the logarithm of the year-end RMB deposit balances in financial institutions. Column (7) of Table 4 shows that including these controls renders a significantly positive NBDCPZ coefficient.

4.3.6. Excluding the Impact of Similar Policies

The Chinese government attaches great importance to the development of the digital industry and has implemented the “Smart City” policy to accelerate its growth. To exclude the influence of this policy on the ULGUE, we introduced a dummy variable, SC, reflecting whether a city entered the “Smart City” construction list in the regression. Additionally, the government’s focus on transitioning to green development is evident through policies such as “Low-Carbon City” (LCC) and “Carbon Emission Trading City” (CETC). Dummy variables representing membership in these categories were also included in the econometric model to control for their impacts. Columns (8)–(10) of Table 4 present the results after controlling for these policy effects. The NBDCPZ coefficients remain significantly positive at the 1% level, once again demonstrating the robustness of the benchmark results.

4.3.7. Change Regression Samples

Central cities, including municipalities, sub-provincial cities, and provincial capitals, often have higher political and economic statuses, and their big data industries were well developed before the policy was enacted. To avoid skewing the policy effect estimation, we excluded these central cities and re-ran the regression. Column (6) of Table 4 shows that the NBDCPZ coefficient remains significantly positive at the 1% level. Additionally, we previously used the urban green coverage rate to measure the ecological benefits. However, in the desertification-threatened northwest regions, long-standing government afforestation programs could skew this metric, particularly in areas such as Inner Mongolia. To account for this, we excluded observations from Inner Mongolia, and the NBDCPZ coefficient in Column (12) of Table 4 remains significantly positive, confirming the robustness of our findings.

4.3.8. The Instrumental Variable Method

The NBDCPZ list was declared by provincial and municipal local governments, and it formally took effect upon the receipt of approval from the central government, which implies that the formulation is not entirely exogenous. To address the potential endogeneity, we used the interaction between the number of post offices per square kilometer in each city in 2000 and the year as the instrumental variable (IV) and re-estimated the effect using the two-stage least squares (2SLS) method [78]. Historically, post offices facilitated information transmission, satisfying the IV relevance requirement. Moreover, it is unlikely that the number of post offices in 2000 has a direct influence on the current ULGUE, satisfying the exogeneity condition. Columns (7) and (8) of Table 4 present the results for the first and second stages of the regression. The first-stage result indicates that the IV coefficient is 0.0048 and significant at the 5% level, suggesting a positive correlation between the NBDCPZ establishment and the historical post office density. The second stage shows that the Kleibergen–Paap rk LM statistics and Cragg–Donald Wald F statistics are 3.917 and 51.322, respectively, indicating no weak-instrument or identification issues. The NBDCPZ coefficient remains positive and significant, affirming that the NBDCPZ establishment improves the ULGUE even after the endogeneity concerns are addressed.

5. Mechanism Test Regression

5.1. Enhancing Technological Innovation

Patent applications, a key output of technological innovation, are widely used to assess innovation levels [79]. Column (1) of Table 5 presents the regression results with the logarithm of the total number of patent applications in the cities as the dependent variable. The NBDCPZ coefficient is 0.2748 and significant at the 10% level, indicating that the NBDCPZ establishment has increased patent applications. Furthermore, within the existing frameworks, technological innovation can be classified into substantial innovation, which fundamentally changes organizational activities, and strategic innovation. Following previous research, we used the logarithm of the number of invention patent applications to measure the substantial innovation and the total number of utility model patent and design patent applications to measure the strategic innovation [80,81]. Columns (2)–(3) of Table 5 show that the NBDCPZ coefficients are significant at least at the 10% level, indicating that the NBDCPZ policy has improved the technological innovation of cities from both the substantial and strategic innovation perspectives, thereby validating H1.

5.2. Alleviating Resource Misallocation

Resource misallocation leads to inefficient resource utilization, causing issues such as land resource wastage, irrational industrial structures, and environment pollution, constraining the ULGUE. To measure the resource misallocation, the primary method employed in the current literature stems from Hsieh and Klenow [43], which quantifies factor market distortions by calculating the difference between the real allocation and the ideal allocation under profit maximization conditions. The measurement formula is as follows:
τ K i = 1 φ K i 1
τ L i = 1 φ L i 1
where φ K i and φ L i denote the distortion of capital (K) and labor (L) in city i, respectively; τ K i and τ L i represent the capital and labor misallocation indexes in city i (the larger the absolute value of the misallocation index, the more severe the degree of resource misallocation).
The results in Column (4) of Table 5 allow for an examination of the impact of the policy on capital misallocation, with a coefficient of −1.9268 for the NBDCPZ variable, which is significant at the 1% level. This suggests that the NBDCPZ establishment has effectively guided capital flow towards sectors with higher efficiencies, justifying H2. However, the Column (5) results tell a different story: The policy worsens labor misallocation, which aligns with the findings of Chen et al. [82] and Yang et al. [48], suggesting that digital technology can negatively impact labor markets, leading to unemployment rate increases, which may exacerbate the labor resource misallocation in the NBDCPZs in the short term.

5.3. Industrial Structure Optimization

Based on the preceding theoretical analysis, industrial structure optimization includes two aspects: rationalization and upgrading. Regarding rationalization, in the existing research, the Theil index is often employed to measure the industrial structure rationalization (RA) [83], the formula of which is as follows:
R A = i = 1 3 Y i Y ln Y i L i / Y L
where Y represents the industrial output of the city; L represents the number of employees; and i = 1, 2, and 3 correspond to the primary, secondary, and tertiary industries, respectively. The logic behind this index is that a rational industrial structure is indicated by similar efficiencies across industries and a labor proportion that aligns with the output value proportions. Consequently, the further the RA deviates from 0, the more imbalanced the industrial structure.
Regarding industrial structure upgrading, with the development of urban economics, resources gradually shift from agriculture and manufacturing to commerce and services, increasing the tertiary industry proportion. Therefore, industrial structure upgrading (UP) is measured by the ratio of the tertiary industry to the secondary industry [84], expressed as follows:
U P = Y 3 Y 2
Columns (6) and (7) in Table 5 present the results with the RA and UP as the dependent variables. Neither result is statistically significant, suggesting that the NBDCPZ establishment has not significantly facilitated the rationalization and upgrading of urban industrial structures. One possible explanation is that it takes time to achieve the dynamic optimization process of industrial structures within cities, which results in an under-optimal industrial structure in the short term.

5.4. Industrial Agglomeration Enhancement

Industrial agglomeration can be categorized into specialization agglomeration and collaborative agglomeration. Both types enhance cooperation and resource sharing among enterprises, creating economies of scale and synergies, thereby improving the ULGUE. Specialization agglomeration occurs when there is a significant increase in enterprises within a particular industry in a region, attracting a concentrated workforce. To measure the specialization agglomeration levels in the manufacturing and productive service industries, we used the number of employees in these sectors [85], calculated as follows:
L Q i j = e i j / E j e i / E
where e i j represents the number of employees in industry j in city i; E j denotes the total number of employees in industry j nationwide; e i represents the total number of employees in city i; E represents the total number of employees nationwide; and L Q i j indicates the degree of industrial specialization agglomeration of industry j in city i.
For collaborative industrial agglomeration, the modified E–G index is commonly used, as it considers both the geographic proximity and synergy between different industries [86]. This index is widely used to measure the collaborative agglomeration degree between productive service industries and manufacturing industries. The measure is as follows:
C O A G G = 1 L Q m a n L Q s e r L Q m a n + L Q s e r + L Q m a n + L Q s e r
where L Q m a n and L Q s e r denote the specialization agglomeration of the manufacturing industry and productive service industry, respectively; COAGG denotes the collaborative agglomeration degree between them.
The results in Columns (8) and (10) of Table 5 show that the NBDCPZ coefficients are positive and significant at least at the 10% level, indicating that the policy has effectively promoted the specialization agglomeration of the manufacturing industry in the NBDCPZs via the building of information-sharing platforms, allowing manufacturing enterprises convenient access to information. Additionally, the NBDCPZ establishment has also strengthened the correlation between the manufacturing industry and the productive service industry, confirming H4a and H4b.

6. Further Analysis

6.1. Heterogeneity Analysis

6.1.1. Resources

China’s vast geography has resulted in highly heterogeneous resource distributions. Resource-based cities rich in natural resources such as minerals and forests initially focused on crude, low-end industries such as extraction and processing, resulting in an over-reliance on resource-trading benefits while neglecting sustainable land use [87]. Given their dependence on natural resources, integrating big data technology into these cities is challenging in the short term [30]. Therefore, the NBDCPZ policy’s impact on improving the ULGUE in resource-based cities is expected to be limited.
To validate this hypothesis, the cities were categorized into resource-based and non-resource-based cities according to the “National Sustainable Development Plan for Resource-based Cities”. The results in Columns (1) and (2) of Table 6 show that the NBDCPZ policy has had significant positive effects on the non-resource-based cities but no clear impact on the resource-based cities, reflecting the challenges faced by resource-based cities due to severe ecological degradation and low resource utilization efficiencies. Consequently, the rapid transition from extensive resource utilization to big data industry integration is difficult to achieve in the short term, leading to an unclear improvement in the ULGUEs in these cities.

6.1.2. Types of City Clusters

A key feature of the regional development in China is the reliance on central cities to drive the growth of neighboring clusters. According to the “Fourteenth Five-Year Plan for National Economic and Social Development and the Long-Range Objectives Through the Year 2035”, city clusters are categorized into the developing and mature categories. These categories exhibit significant differences in terms of their urbanization levels, economic growth, and industrial structures. Developing clusters lag in network construction and have smaller markets and capital scales, while mature clusters have modernized their digital industries and have established high-end industrial layouts [88].
The sub-sample results, shown in Columns (3) and (4) of Table 6, indicate that the NBDCPZ policy has improved the ULGUEs only in the mature city clusters. This may be attributed to the relatively low regional development clusters, where factors such as the industrial network density, integrated factor markets, and fair land distribution have yet to mature [89], making a full realization of the advantages brought about by the big data industry difficult, such as information dissemination and technological diffusion.

6.1.3. Economic Growth Pressure

One crucial indicator for assessing local officials in China is the regional economic growth. Faced with limited promotion opportunities, local officers are pressured to meet economic growth targets, which leads to short-term gains over environmental sustainability [89]. Considering this, we utilized the ratio of the target growth rate to the actual growth rate of the previous year to measure the economic growth pressure [90], and we conducted sub-sample regressions.
The results are presented in Table 6, Columns (5) and (6). For cities experiencing higher growth pressure, the NBDCPZ coefficients are noticeably smaller. This confirms that policymakers may exhibit short-foresightedness and allocate resources irrationally when the economic growth pressure intensifies, thereby diminishing the impact of the NBDCPZ policy on improving the ULGUE.

6.1.4. Digital Infrastructure

Stable and efficient digital infrastructure is crucial for the development of the big data industry, but its impact appears to be complex. On the one hand, cities with advanced digital infrastructure tend to have more mature data markets, and the emergence of big data technology may not be as disruptive, limiting the NBDCPZ policy’s effect on the ULGUE [91]. On the other hand, cities with less developed digital infrastructure may lack the hardware support for effective policy implementation, weakening its impact as well [92].
We measured the urban digital infrastructure using the proportion of urban residents with access to broadband internet and divided the observations into three groups. Columns (7)–(9) in Table 6 present the results for each group. In cities with moderate–high levels of digital infrastructure, the NBDCPZ policy has significantly improved their ULGUEs, with the largest effects in cities with moderate levels. Conversely, the policy has not had a significant effect in cities with the lowest digital infrastructure levels, suggesting that big data technology requires a well-established digital infrastructure and a labor force familiar with internet usage. Therefore, cities with inadequate digital infrastructures may struggle to promote their ULGUEs in the short term, while those with the highest levels rely on other factors for ULGUE improvements [93], resulting in a limited policy effect.

6.1.5. Human Capital

The establishment of NBDCPZs can promote the adoption of big data technology in cities and enhance the ULGUE improvement. In this process, the policy effectiveness varies across cities with different human capital levels. On the one hand, highly skilled workers possess stronger knowledge absorption capacities, enabling them to meet the big data utilization requirements at lower costs [94]. On the other hand, the scarcity of highly skilled talent often leads to lower urban productivity, and theoretically, the marginal big data technology benefits in the corresponding areas might be greater [95]. Therefore, how the NBDCPZ policy affects the ULGUEs in cities with different human capital levels is unpredictable.
Due to the lack of education data at the prefecture level in China, the accurate measurement of human capital is challenging. However, Barros et al. [96] suggested that the number of teachers is a significant indicator of human capital. Therefore, we used the number of teachers reported in the “China City Statistical Yearbook” as a proxy for human capital and divided the sample into three groups. Columns (10)–(12) in Table 6 show that the NBDCPZ construction has significantly improved the ULGUEs in cities with moderate human capital levels, while this effect is not significant in the other groups.

6.2. Spatial Spillover Effect

The establishment of NBDCPZs has enhanced the digital technology and information services in the pilot cities, reducing the spatial and temporal distances between regions, breaking down the barriers to green technology dissemination, and promoting the cross-regional flow and allocation of resources. In earlier sections, using the conventional DID method, we compared the ULGUE differences between pilot and non-pilot cities, assuming that the NBDCPZ establishment did not affect the land-use efficiencies in nearby non-pilot cities. However, due to the non-exclusive nature of digital information, the policy’s impact may extend beyond the pilot zones, leading to spillover effects on neighboring non-pilot areas and thus contradicting the SUTVA of the DID method. Therefore, to estimate the direct and spillover effects of the NBDCPZ policy, we employed the spatial difference-in-differences (SDID) method. The econometric model is as follows:
U L G U E i t = ρ 1 W × U L G U E i t + ρ 2 N B D C P Z i t + ρ 3 W × N B D C P Z i t + ρ k C o n t r o l s i t + μ i + λ t + ε i t
where W denotes the spatial weight matrix; W × U L G U E i t denotes the spatial lag of the ULGUE variable; and W × N B D C P Z i t captures the spatial spillover effect. The ρ 3 coefficient reflects the average spillover effect of the NBDCPZ policy on neighboring areas, encompassing both the spillover effects among pilot regions and from pilot regions to non-pilot regions. However, as Chagas et al. [33] pointed out, the likelihood of these two types of spillover effects may differ. To accurately examine the spatial spillover effect of the NBDCPZ policy, we followed the methodology of Chagas et al. [33], decomposing the spatial lag term of the policy ( W × N B D C P Z i t ) into two parts:
U L G U E i t = γ 1 W × U L G U E i t + γ 2 N B D C P Z i t + γ 3 W T T × N B D C P Z i t + γ 4 W N T × N B D C P Z i t + γ k C o n t r o l s i t + μ i + λ t + ε i t
where W T T × N B D C P Z i t indicates the spillover effects among the pilot cities, and W N T × N B D C P Z i t indicates the spillover effects of the NBDCPZ policy between the pilot and non-pilot cities. Significantly positive γ 3 and γ 4 coefficients indicate that the NBDCPZ policy has had notable spatial spillover effects among pilot cities and between pilot and non-pilot cities, respectively.
Columns (1)–(3) in Table 7 present the results using first–third-order nearest-neighbor matrices, respectively. Consistent with the benchmark results, the NBDCPZ coefficients remain significantly positive, indicating that the NBDCPZ establishment has promoted the ULGUEs in the pilot cities. The W N T × N B D C P Z i t variable is only significant with the first-order spatial matrix. As the order increases, this effect diminishes, indicating a positive indirect spillover effect merely on the nearest non-pilot cities. However, this spillover effect is weak, with the W N T × N B D C P Z i t coefficient at 0.0003, which is a much smaller value than that of the NBDCPZ coefficient. This may be due to the strong administrative and market barriers in China, which limit data flow and the policy’s spillover effects [97]. The W T T × N B D C P Z coefficients are not significant, indicating no substantial mutual influence among the pilot cities.

7. Conclusions and Implications

7.1. Conclusions

Using panel data from 281 prefecture-level cities in China from 2006 to 2021, in this study, we employed the NBDCPZ policy as a quasi-natural experiment and constructed a multi-period DID model to investigate its impact on the ULGUE. The findings are as follows: (1) The NBDCPZ policy has significantly improved the ULGUE, confirmed by parallel-trend tests, placebo tests, and other robustness checks; (2) the mechanism analysis revealed that the NBDCPZ construction has improved the ULGUE through three pathways: technological innovation, resource allocation, and industrial agglomeration; (3) the heterogeneity analysis results suggest that the positive effect is more pronounced in cities with lower economic growth pressures and moderate digital infrastructure and human capital levels and that it is more significant in non-resource-based cities and mature city clusters; and (4) the NBDCPZ construction exhibits spillover effects, primarily enhancing the ULGUEs in nearby non-pilot cities; however, this spillover effect diminishes as the proximity of the pilot cities to the non-pilot cities decreases.

7.2. Policy Implications

This study provides empirical evidence for the hypothesis that NBDCPZ establishment can enhance the ULGUE. Based on this, the following targeted suggestions are proposed:
  • The development of the big data industry should be advanced and supported to enhance the ULGUE. Local governments should leverage big data technologies for efficient information processing, transforming land data into digital formats to aid in land-use management, thereby improving the rational allocation of land resources [30]. Furthermore, the government should prioritize the modernization of traditional high-energy-consumption and high-pollution industries using big data technologies. By replacing outdated industries with emerging green, high-tech sectors, the overall resource utilization efficiency can be significantly improved;
  • Big data industry policies should be tailored to local conditions, addressing the specific needs of different cities. For cities with limited digital infrastructure and human capital, the central government should provide financial support to help local governments enhance their data infrastructure and attract skilled talent [93,96]. This targeted assistance will create a solid foundation for ULGUE enhancement through big data, ensuring that the benefits of these technologies are accessible to all regions;
  • The free flow of data elements should be facilitated by removing the administrative and market barriers between cities. Governments outside pilot areas should capitalize on the non-competitive, replicable, and highly mobile nature of data elements. They should actively absorb information dissemination and technological spillovers from the big data industries in pilot cities, leveraging these advantages to improve their own ULGUEs [32,74]. This approach ensures that the positive impacts of big data technologies are widely distributed, fostering coordinated ecological development.

7.3. Limitations

This study has certain limitations. First, due to data availability constraints, we investigated the improvement in the ULGUE as a consequence of the implementation of the NBDCPZ policy at the city level and did not conduct a more specific analysis of the resource utilization by enterprises within the NBDCPZs. Second, there are variations in the positioning of the policy planning schemes for each NBDCPZ, which may lead to differences in effectiveness across different NBDCPZs. Hence, it is crucial for future research to undertake a more comprehensive comparison and analysis of the variations in the ULGUEs among different NBDCPZs, considering their actual positioning.

Author Contributions

Conceptualization, G.Z., L.C. and Z.Z.; methodology, H.X. and Z.Z.; software, C.J.; formal analysis, G.Z., C.J. and Z.Z.; resources, C.J. and Z.Z.; writing—original draft preparation, G.Z. and C.J.; writing—review and editing, G.Z. and S.D.; visualization, C.J. All authors have read and agreed to the published version of the manuscript.

Funding

This research was funded by the National Social Science Foundation of China, grant number 22VRC172; the National Social Science Foundation of China, grant number 23ATJ007; and the National Statistical Science Research Project, grant number 2023LZ009.

Data Availability Statement

The datasets used and/or analyzed in the current study are available from the corresponding author upon reasonable request. The data are not publicly available due to [our need for further research utilization and the potential for increased publication opportunities by retaining it].

Conflicts of Interest

The authors declare no conflicts of interest.

References

  1. Xie, H.; Chen, Q.; Wang, W.; He, Y. Analyzing the Green Efficiency of Arable Land Use in China. Technol. Forecast. Soc. Chang. 2018, 133, 15–28. [Google Scholar] [CrossRef]
  2. Wang, Y.; Jiang, Y.; Li, W.; Dong, S.; Gao, C. Determinants of Land Use Conflicts with the Method of Cross-Wavelet Analysis: Role of Natural Resources and Human Activities in Spatial-Temporal Evolution. J. Clean. Prod. 2023, 429, 139498. [Google Scholar] [CrossRef]
  3. Bai, C.; Xie, D.; Zhang, Y. Industrial Land Transfer and Enterprise Pollution Emissions: Evidence from China. Econ. Anal. Policy 2024, 81, 181–194. [Google Scholar] [CrossRef]
  4. Liu, Y.; Fang, F.; Li, Y. Key Issues of Land Use in China and Implications for Policy Making. Land Use Policy 2014, 40, 6–12. [Google Scholar] [CrossRef]
  5. Cheng, J.; Zhao, J.; Dai, Y.; Li, Y. Land Supply Patterns and the Chinese Low Consumption Puzzle. Struct. Chang. Econ. Dyn. 2024, 69, 232–245. [Google Scholar] [CrossRef]
  6. Zhao, Z.; Bai, Y.; Wang, G.; Chen, J.; Yu, J.; Liu, W. Land Eco-Efficiency for New-Type Urbanization in the Beijing-Tianjin-Hebei Region. Technol. Forecast. Soc. Chang. 2018, 137, 19–26. [Google Scholar] [CrossRef]
  7. Tan, S.; Hu, B.; Kuang, B.; Zhou, M. Regional Differences and Dynamic Evolution of Urban Land Green Use Efficiency within the Yangtze River Delta, China. Land Use Policy 2021, 106, 105449. [Google Scholar] [CrossRef]
  8. Kaur, H.; Garg, P. Urban Sustainability Assessment Tools: A Review. J. Clean. Prod. 2019, 210, 146–158. [Google Scholar] [CrossRef]
  9. Guastella, G.; Pareglio, S.; Sckokai, P. A Spatial Econometric Analysis of Land Use Efficiency in Large and Small Municipalities. Land Use Policy 2017, 63, 288–297. [Google Scholar] [CrossRef]
  10. Yang, L.; Ouyang, H.; Fang, K.; Ye, L.; Zhang, J. Evaluation of Regional Environmental Efficiencies in China Based on Super-Efficiency-DEA. Ecol. Indic. 2015, 51, 13–19. [Google Scholar] [CrossRef]
  11. Tao, X.; Wang, P.; Zhu, B. Provincial Green Economic Efficiency of China: A Non-Separable Input–Output SBM Approach. Appl. Energy 2016, 171, 58–66. [Google Scholar] [CrossRef]
  12. Yu, X.; Dilanchiev, A.; Bibi, S. Enhancing Labor Productivity as a Key Strategy for Fostering Green Economic Growth and Resource Efficiency. Heliyon 2024, 10, e24640. [Google Scholar] [CrossRef] [PubMed]
  13. Jiao, L.; Xu, Z.; Xu, G.; Zhao, R.; Liu, J.; Wang, W. Assessment of Urban Land Use Efficiency in China: A Perspective of Scaling Law. Habitat Int. 2020, 99, 102172. [Google Scholar] [CrossRef]
  14. Xue, D.; Yue, L.; Ahmad, F.; Draz, M.U.; Chandio, A.A.; Ahmad, M.; Amin, W. Empirical Investigation of Urban Land Use Efficiency and Influencing Factors of the Yellow River Basin Chinese Cities. Land Use Policy 2022, 117, 106117. [Google Scholar] [CrossRef]
  15. Xie, C.; Ye, L.; Zhong, N.; Wan, W. Impact of Digital Finance on Corporate Green Innovation: Exploring Role of Land Resource Misallocation in China. Resour. Policy 2024, 91, 104920. [Google Scholar] [CrossRef]
  16. Xin, Y.; Song, H.; Shen, Z.; Wang, J. Measurement of the Integration Level between the Digital Economy and Industry and Its Impact on Energy Consumption. Energy Econ. 2023, 126, 106988. [Google Scholar] [CrossRef]
  17. Li, Z.; Chen, H.; Mo, B. Can Digital Finance Promote Urban Innovation? Evidence from China. Borsa Istanb. Rev. 2023, 23, 285–296. [Google Scholar] [CrossRef]
  18. Taye, G.; Teklesilassie, T.; Teka, D.; Kassa, H. Assessment of Soil Erosion Hazard and Its Relation to Land Use Land Cover Changes: Case Study from Alage Watershed, Central Rift Valley of Ethiopia. Heliyon 2023, 9, e18648. [Google Scholar] [CrossRef] [PubMed]
  19. Li, Z.; Chen, X.; Ye, Y.; Wang, F.; Liao, K.; Wang, C. The Impact of Digital Economy on Industrial Carbon Emission Efficiency at the City Level in China: Gravity Movement Trajectories and Driving Mechanisms. Environ. Technol. Innov. 2024, 33, 103511. [Google Scholar] [CrossRef]
  20. Gao, F.; He, Z. Digital Economy, Land Resource Misallocation and Urban Carbon Emissions in Chinese Resource-Based Cities. Resour. Policy 2024, 91, 104914. [Google Scholar] [CrossRef]
  21. Liu, Y.; Cao, J.; Zhang, Q. The Product Marketing Model of the Economic Zone by the Sensor Big Data Mining Algorithm. Sustain. Comput. Inform. Syst. 2022, 36, 100820. [Google Scholar] [CrossRef]
  22. Rehman, S.U.; Khan, S.N.; Antohi, V.M.; Bashir, S.; Fareed, M.; Fortea, C.; Cristian, N.P. Open Innovation Big Data Analytics and Its Influence on Sustainable Tourism Development: A Multi-Dimensional Assessment of Economic, Policy, and Behavioral Factors. J. Open Innov. Technol. Mark. Complex. 2024, 10, 100254. [Google Scholar] [CrossRef]
  23. Wang, L.; Wu, Y.; Huang, Z.; Wang, Y. Big Data Application and Corporate Investment Decisions: Evidence from A-Share Listed Companies in China. Int. Rev. Financ. Anal. 2024, 94, 103331. [Google Scholar] [CrossRef]
  24. Gan, C.; Yu, J.; Zhao, W.; Fan, Y. Big Data Industry Development and Carbon Dioxide Emissions: A Quasi-Natural Experiment. J. Clean. Prod. 2023, 422, 138590. [Google Scholar] [CrossRef]
  25. Wang, L.; Liu, G.; Ahmad, I. Cost Optimization Model Design of Fresh Food Cold Chain System in the Context of Big Data. Big Data Res. 2024, 35, 100417. [Google Scholar] [CrossRef]
  26. Wang, W.; Zhang, H.; Sun, Z.; Wang, L.; Zhao, J.; Wu, F. Can Digital Policy Improve Corporate Sustainability? Empirical Evidence from China’s National Comprehensive Big Data Pilot Zones. Telecommun. Policy 2023, 47, 102617. [Google Scholar] [CrossRef]
  27. Wei, X.; Li, H.; Wang, Y. Does Big Data Infrastructure Development Promote New Enterprises Entry: Evidence from China. Finance Res. Lett. 2024, 60, 104828. [Google Scholar] [CrossRef]
  28. Gu, R.; Li, C.; Yang, Y.; Zhang, J. The Impact of Industrial Digital Transformation on Green Development Efficiency Considering the Threshold Effect of Regional Collaborative Innovation: Evidence from the Beijing-Tianjin-Hebei Urban Agglomeration in China. J. Clean. Prod. 2023, 420, 138345. [Google Scholar] [CrossRef]
  29. Ma, R.; Liu, H.; Li, Z.; Ma, Y.; Fu, S. Promoting Sustainable Development: Revisiting Digital Economy Agglomeration and Inclusive Green Growth through Two-Tier Stochastic Frontier Model. J. Environ. Manag. 2024, 355, 120491. [Google Scholar] [CrossRef]
  30. Lyu, Y.; Xiao, X.; Zhang, J. Does the Digital Economy Enhance Green Total Factor Productivity in China? The Evidence from a National Big Data Comprehensive Pilot Zone. Struct. Chang. Econ. Dyn. 2024, 69, 183–196. [Google Scholar] [CrossRef]
  31. Lai, A.; Li, Z.; Hu, X.; Wang, Q. Does Digital Economy Improve City-Level Eco-Efficiency in China? Econ. Anal. Policy 2024, 81, 1198–1213. [Google Scholar] [CrossRef]
  32. Chen, C.; Ye, F.; Xiao, H.; Xie, W.; Liu, B.; Wang, L. The Digital Economy, Spatial Spillovers and Forestry Green Total Factor Productivity. J. Clean. Prod. 2023, 405, 136890. [Google Scholar] [CrossRef]
  33. Chagas, A.L.S.; Azzoni, C.R.; Almeida, A.N. A Spatial Difference-in-Differences Analysis of the Impact of Sugarcane Production on Respiratory Diseases. Reg. Sci. Urban Econ. 2016, 59, 24–36. [Google Scholar] [CrossRef]
  34. Leng, A.; Wang, K.; Bai, J.; Gu, N.; Feng, R. Analyzing Sustainable Development in Chinese Cities: A Focus on Land Use Efficiency in Production-Living-Ecological Aspects. J. Clean. Prod. 2024, 448, 141461. [Google Scholar] [CrossRef]
  35. Tang, M.; Liu, Y.; Hu, F.; Wu, B. Effect of Digital Transformation on Enterprises’ Green Innovation: Empirical Evidence from Listed Companies in China. Energy Econ. 2023, 128, 107135. [Google Scholar] [CrossRef]
  36. Li, Z.; Huang, Z.; Su, Y. New Media Environment, Environmental Regulation and Corporate Green Technology Innovation: Evidence from China. Energy Econ. 2023, 119, 106545. [Google Scholar] [CrossRef]
  37. Gao, Q.; Cheng, C.; Sun, G. Big Data Application, Factor Allocation, and Green Innovation in Chinese Manufacturing Enterprises. Technol. Forecast. Soc. Chang. 2023, 192, 122567. [Google Scholar] [CrossRef]
  38. Tian, H.; Li, Y.; Zhang, Y. Digital and Intelligent Empowerment: Can Big Data Capability Drive Green Process Innovation of Manufacturing Enterprises? J. Clean. Prod. 2022, 377, 134261. [Google Scholar] [CrossRef]
  39. Gao, X. Modern Design of Rural Green Buildings Based on Big Data Technology. Cities 2023, 141, 104387. [Google Scholar] [CrossRef]
  40. Jin, T.; Liang, F.; Dong, X.; Cao, X. Research on Land Resource Management Integrated with Support Vector Machine—Based on the Perspective of Green Innovation. Resour. Policy 2023, 86, 104180. [Google Scholar] [CrossRef]
  41. Restuccia, D.; Rogerson, R. The Causes and Costs of Misallocation. J. Econ. Perspect. 2017, 31, 151–174. [Google Scholar] [CrossRef]
  42. Sun, T.; Bian, X.; Liu, J.; Wang, R.; Sriboonchitta, S. The Economic and Social Effects of Skill Mismatch in China: A DSGE Model with Skill and Firm Heterogeneity. Econ. Model. 2023, 125, 106345. [Google Scholar] [CrossRef]
  43. Hsieh, C.-T.; Klenow, P.J. Misallocation and Manufacturing TFP in China and India. Q. J. Econ. 2009, 124, 1403–1448. [Google Scholar] [CrossRef]
  44. Zhu, C.; Fan, W.; Wu, X.; Zhang, Z.; Chen, Y. Spatial Mismatch and the Attribution Analysis of Carbon Storage Demand and Supply in the Yangtze River Economic Belt, China. J. Clean. Prod. 2024, 434, 140036. [Google Scholar] [CrossRef]
  45. Han, B.; Jin, X.; Wang, J.; Yin, Y.; Liu, C.; Sun, R.; Zhou, Y. Identifying Inefficient Urban Land Redevelopment Potential for Evidence-Based Decision Making in China. Habitat Int. 2022, 128, 102661. [Google Scholar] [CrossRef]
  46. Gong, X.; Yu, J.; Luo, X. Will the Establishment of City Commercial Banks Improve Resource Allocation Efficiency?—Concurrently on Bank Risk-Taking Channels of Monetary Policy in China. Econ. Anal. Policy 2024, 81, 1513–1526. [Google Scholar] [CrossRef]
  47. Acemoglu, D.; Restrepo, P. The Race between Man and Machine: Implications of Technology for Growth, Factor Shares, and Employment. Am. Econ. Rev. 2018, 108, 1488–1542. [Google Scholar] [CrossRef]
  48. Yang, G.-Z.; Si, D.-K.; Ning, G.-J. Does Digital Transformation Reduce the Labor Income Share in Enterprises? Econ. Anal. Policy 2023, 80, 1526–1538. [Google Scholar] [CrossRef]
  49. Li, W.; Yang, X.; Yin, X. Digital Transformation and Labor Upgrading. Pac.-Basin Finance J. 2024, 83, 102280. [Google Scholar] [CrossRef]
  50. Zhou, X.; Zhang, J.; Li, J. Industrial Structural Transformation and Carbon Dioxide Emissions in China. Energy Policy 2013, 57, 43–51. [Google Scholar] [CrossRef]
  51. Yang, Y.; Jiang, G.; Zheng, Q.; Zhou, D.; Li, Y. Does the Land Use Structure Change Conform to the Evolution Law of Industrial Structure? An Empirical Study of Anhui Province, China. Land Use Policy 2019, 81, 657–667. [Google Scholar] [CrossRef]
  52. He, W.; Yang, J.; Li, X.; Sang, X.; Xie, X. Research on the Interactive Relationship and the Optimal Adaptation Degree between Land Use Benefit and Industrial Structure Evolution: A Practical Analysis of Jiangsu Province. J. Clean. Prod. 2021, 303, 127016. [Google Scholar] [CrossRef]
  53. Wang, X.; Song, J.; Duan, H.; Wang, X. Coupling between Energy Efficiency and Industrial Structure: An Urban Agglomeration Case. Energy 2021, 234, 121304. [Google Scholar] [CrossRef]
  54. Shu, H.; Xiong, P. Reallocation Planning of Urban Industrial Land for Structure Optimization and Emission Reduction: A Practical Analysis of Urban Agglomeration in China’s Yangtze River Delta. Land Use Policy 2019, 81, 604–623. [Google Scholar] [CrossRef]
  55. Krugman, P. Increasing Returns and Economic Geography. J. Polit. Econ. 1991, 99, 483–499. [Google Scholar] [CrossRef]
  56. Bishop, P.; Gripaios, P. Spatial Externalities, Relatedness and Sector Employment Growth in Great Britain. Reg. Stud. 2010, 44, 443–454. [Google Scholar] [CrossRef]
  57. Hu, J.; Zhang, H.; Irfan, M. How Does Digital Infrastructure Construction Affect Low-Carbon Development? A Multidimensional Interpretation of Evidence from China. J. Clean. Prod. 2023, 396, 136467. [Google Scholar] [CrossRef]
  58. Hou, F.; Khan, M.A.; Hayat, M.T. Empirical Linkages among Financial Development, Digital Infrastructure, Energy Transition and Natural Resources Footprints in BRICS Region. Resour. Policy 2024, 90, 104748. [Google Scholar] [CrossRef]
  59. Li, G.; Li, X.; Huo, L. Digital Economy, Spatial Spillover and Industrial Green Innovation Efficiency: Empirical Evidence from China. Heliyon 2023, 9, e12875. [Google Scholar] [CrossRef]
  60. Zhang, D.; Lin, Y.; Zhang, J.; Han, R.; Li, L. The Spatial Distribution Patterns and Influencing Factors of China’s Newborn Digital Enterprises. J. Clean. Prod. 2023, 423, 138893. [Google Scholar] [CrossRef]
  61. Park, J.-I.; Kim, J.-O. Does Industrial Land Sprawl Matter in Land Productivity? A Case Study of Industrial Parks of South Korea. J. Clean. Prod. 2022, 334, 130209. [Google Scholar] [CrossRef]
  62. Li, H.-L.; Tang, M.-J. Vertical Integration and Innovative Performance: The Effects of External Knowledge Sourcing Modes. Technovation 2010, 30, 401–410. [Google Scholar] [CrossRef]
  63. Zhang, Q.; Shen, X.; Shen, C.; Chen, Y.; Su, B.; Yin, Q.; Zhou, S. Integration of Land Ecological Consolidation and Ecosystem Product Value Realization: A Case from the Yangtze Riverside Industrial Park in Changzhou, China. J. Environ. Manag. 2024, 353, 120120. [Google Scholar] [CrossRef] [PubMed]
  64. Ellison, G.; Glaeser, E.L. The Geographic Concentration of Industry: Does Natural Advantage Explain Agglomeration? Am. Econ. Rev. 1999, 89, 311–316. [Google Scholar] [CrossRef]
  65. Yuan, H.; Liu, J.; Li, X.; Zhong, S. The Impact of Industrial Collaborative Agglomeration on Total Factor Carbon Emission Efficiency in China. Sci. Rep. 2023, 13, 12347. [Google Scholar] [CrossRef] [PubMed]
  66. Tone, K. A Slacks-Based Measure of Efficiency in Data Envelopment Analysis. Eur. J. Oper. Res. 2001, 130, 498–509. [Google Scholar] [CrossRef]
  67. Feng, Y.; Li, Y.; Nie, C. The Effect of Place-Based Policy on Urban Land Green Use Efficiency: Evidence from the Pilot Free-Trade Zone Establishment in China. Land 2023, 12, 701. [Google Scholar] [CrossRef]
  68. Zhang, Y.; Wang, T.; Ren, C.; Wang, L.; Zhang, K.; Song, R. Heterogeneous Impacts and Spillover Effects of Green Innovation Network and Environmental Regulation on Water Use Efficiency: A Spatiotemporal Perspective from 269 Cities in China. Sustain. Cities Soc. 2023, 90, 104361. [Google Scholar] [CrossRef]
  69. Zhou, C.; Wang, J.; Wu, Z. Impact of China’s Energy-Consuming Right Trading on Urban Land Green Utilization Efficiency. Land 2024, 13, 729. [Google Scholar] [CrossRef]
  70. Fan, X.; Zhou, Y.; Xie, Q. Performance Evaluation, Environmental Regulation, and Urban Land Green Use Efficiency: Evidence from China. Environ. Prog. Sustain. Energy 2023, 42, e14120. [Google Scholar] [CrossRef]
  71. Shang, H.; Jiang, L.; Pan, X.; Pan, X. Green Technology Innovation Spillover Effect and Urban Eco-Efficiency Convergence: Evidence from Chinese Cities. Energy Econ. 2022, 114, 106307. [Google Scholar] [CrossRef]
  72. Xie, H.; Chen, Q.; Lu, F.; Wu, Q.; Wang, W. Spatial-Temporal Disparities, Saving Potential and Influential Factors of Industrial Land Use Efficiency: A Case Study in Urban Agglomeration in the Middle Reaches of the Yangtze River. Land Use Policy 2018, 75, 518–529. [Google Scholar] [CrossRef]
  73. Lu, X.; Tao, X. Local Government Environmental Attention and Urban Land Green Use Efficiency in China: The Intermediary Role of Industrial Restructuring. Land 2023, 13, 21. [Google Scholar] [CrossRef]
  74. Ma, D.; Zhang, J.; An, B.; Guo, Z.; Zhang, F.; Yan, Y.; Peng, G. Research on Urban Land Green Use Efficiency and Influencing Factors Based on DEA and ESTDA Models: Taking 284 Cities in China as an Example. Ecol. Indic. 2024, 160, 111824. [Google Scholar] [CrossRef]
  75. Gao, Y.; Li, B.; Sun, W. Resource Curse on Innovation: A Perspective on Local Mining Industry Monopolies in Resource-Based Cities in China. China Econ. Rev. 2023, 81, 102036. [Google Scholar] [CrossRef]
  76. Li, S.; Zheng, X.; Liao, J.; Niu, J. Low-Carbon City Pilot Policy and Corporate Environmental Performance: Evidence from a Quasi-Natural Experiment. Int. Rev. Econ. Financ. 2024, 89, 1248–1266. [Google Scholar] [CrossRef]
  77. Baier, S.L.; Bergstrand, J.H. Do Free Trade Agreements Actually Increase Members’ International Trade? J. Int. Econ. 2007, 71, 72–95. [Google Scholar] [CrossRef]
  78. Luo, S.; Yimamu, N.; Li, Y.; Wu, H.; Irfan, M.; Hao, Y. Digitalization and Sustainable Development: How Could Digital Economy Development Improve Green Innovation in China? Bus. Strategy Environ. 2023, 32, 1847–1871. [Google Scholar] [CrossRef]
  79. Yang, S.; Wang, J.; Dong, K.; Dong, X.; Wang, K.; Fu, X. Is Artificial Intelligence Technology Innovation a Recipe for Low-Carbon Energy Transition? A Global Perspective. Energy 2024, 300, 131539. [Google Scholar] [CrossRef]
  80. Dosi, G.; Marengo, L.; Pasquali, C. How Much Should Society Fuel the Greed of Innovators? Res. Policy 2006, 35, 1110–1121. [Google Scholar] [CrossRef]
  81. Hall, B.H.; Harhoff, D. Recent Research on the Economics of Patents. Annu. Rev. Econ. 2012, 4, 541–565. [Google Scholar] [CrossRef]
  82. Chen, C.; Wang, S.; Yao, S.; Lin, Y. Does Digital Transformation Increase the Labor Income Share? From a Perspective of Resources Reallocation. Econ. Model. 2023, 128, 106474. [Google Scholar] [CrossRef]
  83. Li, T.; Li, D.; Liu, Y.; Wei, G.; Liu, C.; Wang, J. The Spatiotemporal Effects on Ecosystem Services Supply-Demand from Industrial Transformation and Upgrading: Promotion or Inhibition? Ecol. Indic. 2024, 161, 111990. [Google Scholar] [CrossRef]
  84. Bai, T.; Qi, Y.; Li, Z.; Xu, D. Digital Economy, Industrial Transformation and Upgrading, and Spatial Transfer of Carbon Emissions: The Paths for Low-Carbon Transformation of Chinese Cities. J. Environ. Manag. 2023, 344, 118528. [Google Scholar] [CrossRef] [PubMed]
  85. Zhang, X.; Yao, S.; Zheng, W.; Fang, J. On Industrial Agglomeration and Industrial Carbon Productivity—Impact Mechanism and Nonlinear Relationship. Energy 2023, 283, 129047. [Google Scholar] [CrossRef]
  86. Ellison, G.; Glaeser, E.L.; Kerr, W.R. What Causes Industry Agglomeration? Evidence from Coagglomeration Patterns. Am. Econ. Rev. 2010, 100, 1195–1213. [Google Scholar] [CrossRef]
  87. Pan, M.; Zhao, X.; Lv, K.; Rosak-Szyrocka, J.; Mentel, G.; Truskolaski, T. Internet Development and Carbon Emission-Reduction in the Era of Digitalization: Where Will Resource-Based Cities Go? Resour. Policy 2023, 81, 103345. [Google Scholar] [CrossRef]
  88. Qiao, W.; Huang, X. Assessment the Urbanization Sustainability and Its Driving Factors in Chinese Urban Agglomerations: An Urban Land Expansion—Urban Population Dynamics Perspective. J. Clean. Prod. 2024, 449, 141562. [Google Scholar] [CrossRef]
  89. Huang, J.; Wang, X.; Zhang, D.; Zhang, Z.; Yan, J.; Xia, F. Trade-Offs under Pressure? Development of Urban Green Space under Economic Growth and Governance. J. Clean. Prod. 2023, 427, 139261. [Google Scholar] [CrossRef]
  90. Yuan, L.; Li, R.; Wu, X.; He, W.; Kong, Y.; Ramsey, T.S.; Degefu, D.M. Decoupling of Economic Growth and Resources-Environmental Pressure in the Yangtze River Economic Belt, China. Ecol. Indic. 2023, 153, 110399. [Google Scholar] [CrossRef]
  91. Yang, Y.; Chen, W.; Gu, R. How Does Digital Infrastructure Affect Industrial Eco-Efficiency? Considering the Threshold Effect of Regional Collaborative Innovation. J. Clean. Prod. 2023, 427, 139248. [Google Scholar] [CrossRef]
  92. Wang, L.; Shao, J. The Energy Saving Effects of Digital Infrastructure Construction: Empirical Evidence from Chinese Industry. Energy 2024, 294, 130778. [Google Scholar] [CrossRef]
  93. Suo, X.; Zhang, L.; Guo, R.; Lin, H.; Yu, M.; Du, X. The Inverted U-Shaped Association between Digital Economy and Corporate Total Factor Productivity: A Knowledge-Based Perspective. Technol. Forecast. Soc. Chang. 2024, 203, 123364. [Google Scholar] [CrossRef]
  94. Nicolaescu, S.S.; Florea, A.; Kifor, C.V.; Fiore, U.; Cocan, N.; Receu, I.; Zanetti, P. Human Capital Evaluation in Knowledge-Based Organizations Based on Big Data Analytics. Future Gener. Comput. Syst. 2020, 111, 654–667. [Google Scholar] [CrossRef]
  95. Hamilton, R.H.; Sodeman, W.A. The Questions We Ask: Opportunities and Challenges for Using Big Data Analytics to Strategically Manage Human Capital Resources. Bus. Horiz. 2020, 63, 85–95. [Google Scholar] [CrossRef]
  96. Barros, F.; Delalibera, B.R.; Nakabashi, L.; Ribeiro, M.J. Misallocation of Talent, Teachers’ Human Capital, and Development in Brazil. J. Macroecon. 2023, 77, 103542. [Google Scholar] [CrossRef]
  97. Tang, C.; Qiu, P.; Dou, J. The Impact of Borders and Distance on Knowledge Spillovers—Evidence from Cross-Regional Scientific and Technological Collaboration. Technol. Soc. 2022, 70, 102014. [Google Scholar] [CrossRef]
Figure 1. Spatial distribution of NBDCPZ areas.
Land 13 00960 g001
Figure 2. Research framework.
Land 13 00960 g002
Figure 3. Spatial distributions of ULGUE in Chinese cities in (a) 2006, (b) 2011, (c) 2016, and (d) 2021.
Land 13 00960 g003
Figure 4. Parallel-trend test.
Land 13 00960 g004
Figure 5. Placebo test results.
Land 13 00960 g005
Table 1. ULGUE measurement indicators.
Input and OutputIndicatorsVariablesReferences
InputLandUrban construction land areaXue et al., 2022 [14]
CapitalFixed-asset investmentZhou et al., 2024 [69]
LaborEmployees in the secondary and tertiary industriesFan et al., 2023 [70]
Desired outputEconomic benefitsValue added from the secondary and tertiary industriesZhou et al., 2024 [69]
Social benefitsPer capita disposable income of urban residentsGu et al., 2023 [28]
Ecological benefitsGreen coverage rate of built-up areasTan et al., 2021; Shang et al., 2022 [7,71]
Undesired outputPollutant emissionsIndustrial wastewater dischargeXie et al., 2018 [72]
Industrial sulfur dioxide emissionsLu and Tao, 2023; Ma et al., 2024 [73,74]
Industrial smoke (dust) emissionsFeng et al., 2023; Ma et al., 2024 [67,74]
Table 2. Descriptive statistics of variables.
VariableObsMeanStd. Dev.Min.Max.
ULGUE44960.74970.12190.39241.1388
NBDCPZ44960.07430.31000.00001.0000
PGDP449611.66580.71218.843314.3869
GDP449616.36041.009514.121519.0140
INF44962.57320.39080.23284.7631
GOV44960.18390.09980.04271.0268
RES44960.02890.08570.00003.9874
DEN44960.22930.4934−1.61742.6077
Table 3. Benchmark regression results.
(1)(2)(3)
ULGUEULGUEULGUE
NBDCPZ0.0283 ***0.0258 ***0.0223 **
(0.0099)(0.0095)(0.0093)
PGDP 0.0170 **0.0582 ***
(0.0068)(0.0125)
GDP −0.0657 ***−0.0917 ***
(0.0160)(0.0176)
INF 0.0399 ***0.0370 ***
(0.0072)(0.0074)
GOV −0.1123 *−0.1172 **
(0.0591)(0.0573)
RES −0.0178
(0.0113)
DEN 0.0551 ***
0.0223 **
Constant0.7476 ***1.5426 ***1.4832 ***
(0.0007)(0.2434)(0.2356)
City FEYesYesYes
Year FEYesYesYes
Observations449644964496
R20.8250.8350.838
Note: ***, **, and * denote significance at the 1%, 5%, and 10% levels, respectively, with the standard errors clustered at the city level in parentheses.
Table 4. Robustness tests results.
(1)(2)(3)(4)(5)(6)(7)
ULGUEULGUEULGUEULGUEULGUEULGUEULGUE
NBDCPZ0.0165 *0.0192 **0.0183 **0.0185 **0.0257 **0.0228 **0.0028 **
(0.0085)(0.0088)(0.0084)(0.0085)(0.0107)(0.0095)(0.0092)
NBDCPZ_pre1 0.0044
(0.0063)
URB 0.0152
(0.0231)
SCI 0.0952
0.6446
FIN −0.0266
0.0184
Constant0.8233 ***1.7571 ***1.8587 ***2.0271 ***1.4746 ***1.4815 ***1.7180 ***
(0.1905)(0.2351)(0.2206)(0.2335) (0.2338)(0.2356)(0.3170)
ControlsYesYesYesYesYesYesYes
City FEYesYesYesYesYesYesYes
Year FEYesYesYesYesYesYesYes
Observations4496449644964496449644964496
R20.8430.8570.8650.8640.8380.8380.838
(8)(9)(10)(11)(12)(13)(14)
ULGUEULGUEULGUEULGUEULGUENBDCPZULGUE
NBDCPZ0.0223 **0.0215 **0.0224 **0.0224 **0.0231 ** 0.3434 *
(0.0093)(0.0094)(0.0093)(0.0106)(0.0093) (0.1796)
LCC−0.0026
(0.0084)
CETC 0.0175 *
(0.0103)
SC −0.0007
(0.0059)
IV 0.0048 **
(0.0024)
Constant1.4820 ***1.5177 ***1.4830 ***1.5414 ***1.4459 ***
(0.2358)(0.2358)(0.2356)(0.2410)(0.2208)
ControlsYesYesYesYesYesYesYes
City FEYesYesYesYesYesYesYes
Year FEYesYesYesYesYesYesYes
Kleibergen–Paap rk LM statistic3.917 *
Cragg–Donald Wald F statistic51.322 ***
Observations4496449644964016435244964496
R20.8380.8390.8380.8170.842
Note: ***, **, and * denote significance at the 1%, 5%, and 10% levels, respectively, with the standard errors clustered at the city level in parentheses.
Table 5. Mechanism test regression results.
(1)(2)(3)(4)(5)
InnovationSubstantial InnovationStrategic InnovationCapital MisallocationLabor Misallocation
NBDCPZ0.2748 *0.1955 ***0.2584 ***−1.9268 ***0.4740 **
(0.1492)(0.0481)(0.0579)(0.7387)(0.2076)
PGDP0.5955 ***0.5073 ***0.2368 **0.76712.1849 ***
(0.2098)(0.0844)(0.1004)(0.8419)(0.3399)
GDP−0.2998−0.03050.2072*−6.1028 ***−2.6064 ***
(0.2466)(0.0988)(0.1133)(1.1614)(0.4993)
INF0.1408−0.0043−0.04750.58930.0824
(0.0872)(0.0338)(0.0415)(0.3594)(0.1187)
GOV0.8940−0.03491.0747 ***−10.2378 ***−2.1460
(0.7562)(0.3006)(0.3227)(3.9207)(1.3812)
RES0.06870.0346−0.0472−0.11820.1721
(0.0931)(0.0442)(0.0833)(0.3102)(0.1248)
DEN−0.4961 **−0.2123 **−0.2984 ***−1.17130.0473
(0.2002)(0.0824)(0.0856)(0.7129)(0.2885)
Constant−0.2901−3.2377 ***−4.8172 ***96.1162 ***20.0705 ***
(3.1103)(1.2309)(1.3207)(15.9171)(6.4120)
City FEYesYesYesYesYes
Year FEYesYesYesYesYes
Observations44964496449644964496
R20.8550.9380.8750.8740.938
(6)(7)(8)(9)(10)
RationalizationUpgradingManufacturing AgglomerationService AgglomerationCollaborative Agglomeration
NBDCPZ−0.0268−0.03310.1123***0.00740.0784*
(0.0367)(0.0297)(0.0399)(0.0301)(0.0449)
PGDP0.00440.05970.02670.04960.0459
(0.0539)(0.0415)(0.0503)(0.0306)(0.0590)
GDP−0.5040 ***−0.2303 ***0.1549 **−0.1016 *0.0851
(0.0831)(0.0553)(0.0706)(0.0519)(0.0871)
INF0.0318−0.00430.03390.0338 **0.0524 *
(0.0269)(0.0207)(0.0265)(0.0148)(0.0281)
GOV0.34380.9260 ***0.2401 *0.19320.3194
(0.2942)(0.1559)(0.1412)(0.1563)(0.2191)
RES−0.0654−0.00220.0582−0.01760.0853
(0.0528)(0.0887)(0.0941)(0.0383)(0.0869)
DEN0.02210.0829*−0.02690.0235−0.0532
(0.0585)(0.0455)(0.0494)(0.0305)(0.0609)
Constant9.0158 ***3.2887 ***−2.1341 **1.7415 **0.2315
(1.1677)(0.7553)(0.9590)(0.7213)(1.1256)
City FEYesYesYesYesYes
Year FEYesYesYesYesYes
Observations44964496449644964496
R20.8590.7970.8240.7390.782
Note: ***, **, and * denote significance at the 1%, 5%, and 10% levels, respectively, with the standard errors clustered at the city level in parentheses.
Table 6. Heterogeneity analysis results.
(1)(2)(3)(4)(5)(6)
Resource-Based CitiesNon-Resource-Based CitiesDeveloping City ClustersMature City ClustersLow Economic Growth PressureHigh Economic Growth Pressure
NBDCPZ0.02720.0206 *0.01730.0299 ***0.0334 **0.0115
(0.0169)(0.0116)(0.0222)(0.0102)(0.0131)(0.0098)
Constant1.8293 ***1.2965 ***2.1994 ***0.7466 **1.4402 ***1.5291 ***
(0.3178)(0.3441)(0.3533)(0.3493)(0.3453)(0.2656)
ControlsYesYesYesYesYesYes
City FEYesYesYesYesYesYes
Year FEYesYesYesYesYesYes
Observations177627201376312022162199
R20.8000.8570.8200.8460.8650.841
(7)(8)(9)(10)(11)(12)
Low Digital InfrastructureMedium Digital InfrastructureHigh Digital InfrastructureLow Human CapitalMedium Human CapitalHigh Human Capital
NBDCPZ−0.00370.0540 ***0.0292 **0.01290.0316 **0.0054
(0.0097)(0.0185)(0.0136)(0.0388)(0.0159)(0.0618)
Constant1.0259 ***1.7720 ***1.2944 ***1.5816 ***1.4831 ***1.2569 ***
(0.2861)(0.3483)(0.3703)(0.4065)(0.3042)(0.5576)
ControlsYesYesYesYesYesYes
City FEYesYesYesYesYesYes
Year FEYesYesYesYesYesYes
Observations139213981398149314911487
R20.8710.8650.8780.8020.8160.803
Note: ***, **, and * denote significance at the 1%, 5%, and 10% levels, respectively, with the standard errors clustered at the city level in parentheses.
Table 7. Spatial spillover effect results.
(1)(2)(3)
KNN1KNN2KNN3
W × U L G U E 0.03880.0724 *0.1048 **
(0.0361)(0.0381)(0.0423)
W T T × N B D C P Z −0.00630.01110.0090
(0.0161)(0.0128)(0.0131)
W N T × N B D C P Z 0.0003 **−0.00020.0002
(0.0001)(0.0003)(0.0002)
NBDCPZ0.0270 **0.0161 *0.0165 *
(0.0104)(0.0091)(0.0087)
Constant1.4049 ***1.3885 ***1.3136 ***
(0.2390)(0.2396)(0.2471)
ControlsYesYesYes
City FEYesYesYes
Year FEYesYesYes
Observations4,4964,4964,496
R20.8390.8390.839
Note: ***, **, and * denote significance at the 1%, 5%, and 10% levels, respectively, with the standard errors clustered at the city level in parentheses.
Disclaimer/Publisher’s Note: The statements, opinions and data contained in all publications are solely those of the individual author(s) and contributor(s) and not of MDPI and/or the editor(s). MDPI and/or the editor(s) disclaim responsibility for any injury to people or property resulting from any ideas, methods, instructions or products referred to in the content.

