Article

An Improved Method to Identify Built-Up Areas of Urban Agglomerations in Eastern and Western China Based on Multi-Source Data Fusion

by
Xiaoyi Lu
1,
Guang Yang
1 and
Shijun Chen
2,*
1
College of Surveying and Geo-Informatics, Tongji University, Shanghai 200092, China
2
Chongming Carbon Neutral Institute, Tongji University, Shanghai 200092, China
*
Author to whom correspondence should be addressed.
Land 2024, 13(7), 974; https://doi.org/10.3390/land13070974 (registering DOI)
Submission received: 3 June 2024 / Revised: 27 June 2024 / Accepted: 30 June 2024 / Published: 2 July 2024

Abstract

:
The rapid urbanization in China has significantly contributed to the vast expansion of urban built-up areas. Precisely extracting and monitoring these areas is crucial for understanding and optimizing the developmental process and spatial attributes of smart, compact cities. However, most existing studies tend to focus narrowly on a single city or on global scale with a single dimension, often ignoring mesoscale analysis across multiple urban agglomerations. In contrast, our study employs GIS and image-processing techniques to integrate multi-source data for the identification of built-up areas. We specifically compare and analyze two representative urban agglomerations in China: the Yangtze River Delta (YRD) in the east, and the Chengdu–Chongqing (CC) region in the west. We use different methods to extract built-up areas from socio-economic factors, natural surfaces, and traffic network dimensions. Additionally, we utilize a high-precision built-up area dataset of China as a reference for verification and comparison. Our findings reveal several significant insights: (1) The multi-source data fusion approach effectively enhances the extraction of built-up areas within urban agglomerations, achieving higher accuracy than previously employed methods. (2) Our research methodology performs particularly well in the CC urban agglomeration. The average precision rate in CC is 96.03%, while the average precision rate in YRD is lower, at 80.33%. This study provides an objective and accurate assessment of the distribution characteristics and internal spatial structure of built-up areas within urban agglomerations. This method offers a new perspective for identifying and monitoring built-up areas in Chinese urban agglomerations.

1. Introduction

Currently, China is experiencing rapid urbanization growth. However, urban development is encountering increasingly prominent issues, such as disordered spatial distribution, lack of synergy between regional development, and significant pressure on natural resources and the environment [1]. Urban agglomerations in China serve as the primary form of new-type urbanization and the spatial carrier to address the new economic normal [2]. These accommodate over 80 percent of the population and contributes nearly 90 percent of the GDP. City clusters will continue to play a crucial role in high-quality development in this new era. Therefore, scientifically identifying built-up area boundaries is crucial for understanding the development patterns of urban agglomerations, diagnosing urban system problems, and achieving an efficient layout of regional functional space through scientific development planning.
The concept of an urban built-up area refers to an area within an urban administrative region that has been developed and constructed with basic municipal public facilities available. In practical terms, it represents a densely constructed surface space with both municipal public facilities and supporting public facilities simultaneously present [3,4]. When delineating the scope of urban built-up areas, factors such as natural topography, landforms, and management boundaries of grass-roots administrative units should be considered while maintaining consistency with geographical population statistics where possible [5]. The feature extraction method based on single dimension may have limitations when identifying built-up areas on city outskirts.
Domestic and foreign scholars have used different geographical spatial big data to research the boundary identification of built-up areas. These mainly include the recognition method based on social and economic statistics data, the recognition method based on remote sensing image interpretation, and the fusion recognition method combining POI and remote sensing image [6,7]. However, at present, there is still a lack of urban identification analysis combining social economy, natural conditions and traffic network. In addition, most of the existing studies have focused on a single city or on a global scale, and there is a lack of mesoscale studies for multiple urban agglomerations.
Traditional methods of urban agglomeration built-up area boundary research focus on the differentiation of urban levels, select indicators related to urban development and establish an urban indicator system through qualitative evaluation with the help of basic geographical theories such as “pole-axis” theory, “center-periphery” theory and urban hinterland theory [8,9,10,11]. With the deepening of research, other scholars determined the boundary from different angles through a combination of quantitative and qualitative methods, using POI data [12], population data [13] and land price [14]. The advantage of this method is that the indicators and data are easily available, and the disadvantage is that it is highly subjective.
With the rapid development of remote sensing technology and the updating of research methods, the traditional top–down approach using only socio-economic indicators to identify small metropolitan areas has been replaced by more advanced methods. This requires the definition of large-scale urban agglomerations and interconnected metropolitan areas based on remote sensing images [15]. Compared with traditional methods, remote sensing images provide better spatial characteristics of urban landscape and infrastructure [16], which help to characterize the scope of human activities or the physical distribution pattern of cities and towns. Recent studies have focused on extracting impervious surfaces from satellite images to represent actual urban areas because they have higher resolution and lower threshold dependence [17]. In order to obtain a more objective understanding of urban built-up area boundaries, scholars have proposed morphological analysis methods based on remote sensing interpretation, such as identifying the actual scope of urban space through information such as night light intensity [18], land vegetation coverage rate or building coverage rate [19]. Indicators such as the density of economic activities, the intensity of economic ties with the central city, land use and building density are constructed as the reference basis for dividing the boundaries of urban built-up areas.
In general, the existing research has shifted from the identification of the spatial scope to the detection of spatial pattern characteristics within urban agglomerations, and gradually shifted from single-dimensional feature analysis to the construction of multi-dimensional feature index. However, the research difficulties of multi-dimensional analysis, such as the data fusion algorithm and multi-source data unification, have not been thoroughly explored [20]. In addition, relevant research on developed urban agglomerations such as the eastern coastal areas of China is relatively abundant, while research on developing urban agglomerations in the central and western regions is still lacking for the time being. In this study, the YRD and CC city clusters have been selected for comparative analysis. The main reason for this selection is that the YRD is situated on the east coast of China, with a flat terrain and strong economic vitality. In contrast, the CC is located in the central and western inland of China, characterized by mountains and hills, and relatively insufficient economic power [21,22,23,24]. The comparison of these representative urban agglomerations can enrich existing regional economic theory analysis and provide valuable insights for promoting high-quality development of urban agglomerations in China.
The content of this study involves the continuation, extension, and integration of existing research. Firstly, it continues the research on algorithms for identifying built-up areas. Existing research methods often utilize common techniques such as improved indicators of luminous remote sensing data [5,6,18,19,25], the Density-Graph algorithm of POI data [12,15,26,27], and the traffic distance algorithm [17,28]. In this study, we apply an improved luminous remote sensing index algorithm, POI processing and analysis algorithm, and traffic network accessibility algorithm. Additionally, unique indices and a traffic obstacle algorithm are established to enhance the applicability of this research method based on the characteristics of urban agglomeration and traffic network construction in China. Secondly, it broadens the scope of research. Previous studies on identifying built-up areas have varied from initial urban centers to single-core cities [19,29,30,31], national regional urban agglomerations [17,29,32], and multiple urban agglomerations within a national region [21]. Currently, the focus of research on urban agglomerations is primarily on provincial inner core urban agglomerations such as Changsha–Zhuzhou–Xiangtan urban agglomeration [33] and Kolkata–Howrah urban agglomeration [34]. Additionally, the research extends to regional cores such as the Suzhou–Anhui urban agglomeration [35], Beijing–Tianjin–Hebei urban agglomeration [36], Chengdu–Chongqing urban agglomeration [37], etc. Furthermore, attention is given to environmental economic belt urban agglomerations around Dongting Lake [38] and urban agglomerations along the Yangtze River [39]. This study expands the scale of built-up area identification for urban agglomerations across China and addresses the lack of comparison between eastern coastal China and western inland China in existing studies. The last aspect involves integrating research methods. Previous studies have indicated that single-dimensional research methods are insufficient for comprehensively and objectively identifying built-up areas. As a result, a fusion method combining luminous remote sensing images and POI data has been widely adopted. Building on this foundation, our study further integrates the convenience index of the transportation network. This identification research is not only conducted from the two dimensions of social economy and natural surface, but also adds the dimension of traffic accessibility, which increases the rationality and comprehensiveness of the research method.
The main purpose of our research is to explore a strategy for the recognition of a built-up area with a shorter time update cycle on the premise of ensuring a certain accuracy. Our main research topics are:
(1)
Urban agglomeration built-up area identification. The built-up area is identified from three dimensions: social economy, natural coverage, and traffic accessibility.
(2)
Delineation of the evaluation of recognition results. We conduct qualitative and quantitative assessments on the reliability in terms of consistency and integrity of built-up area delineation results.
(3)
Summary of the built-up area characteristics of urban agglomerations in different regions. Using spatial analysis techniques, we conduct a comparative analysis of representative urban agglomerations in eastern and western China.
The main innovations of this study are as follows:
(1)
Quantitative and comparative analysis of the development status of the Yangtze River Delta and Chengdu–Chongqing urban agglomerations has broadened the scope of the existing research and improved the lack of scientific data support for qualitative research on urban agglomerations’ development.
(2)
Three different technical routes were adopted to determine the built-up area boundaries of the Yangtze River Delta and Chengdu–Chongqing urban agglomeration from multiple perspectives, which improved the problem that a single index could not accurately reflect the internal heterogeneity of the urban edge.
(3)
Multi-source data fusion method is used to improve the accuracy of urban agglomeration built-up area identification.

2. Materials and Methods
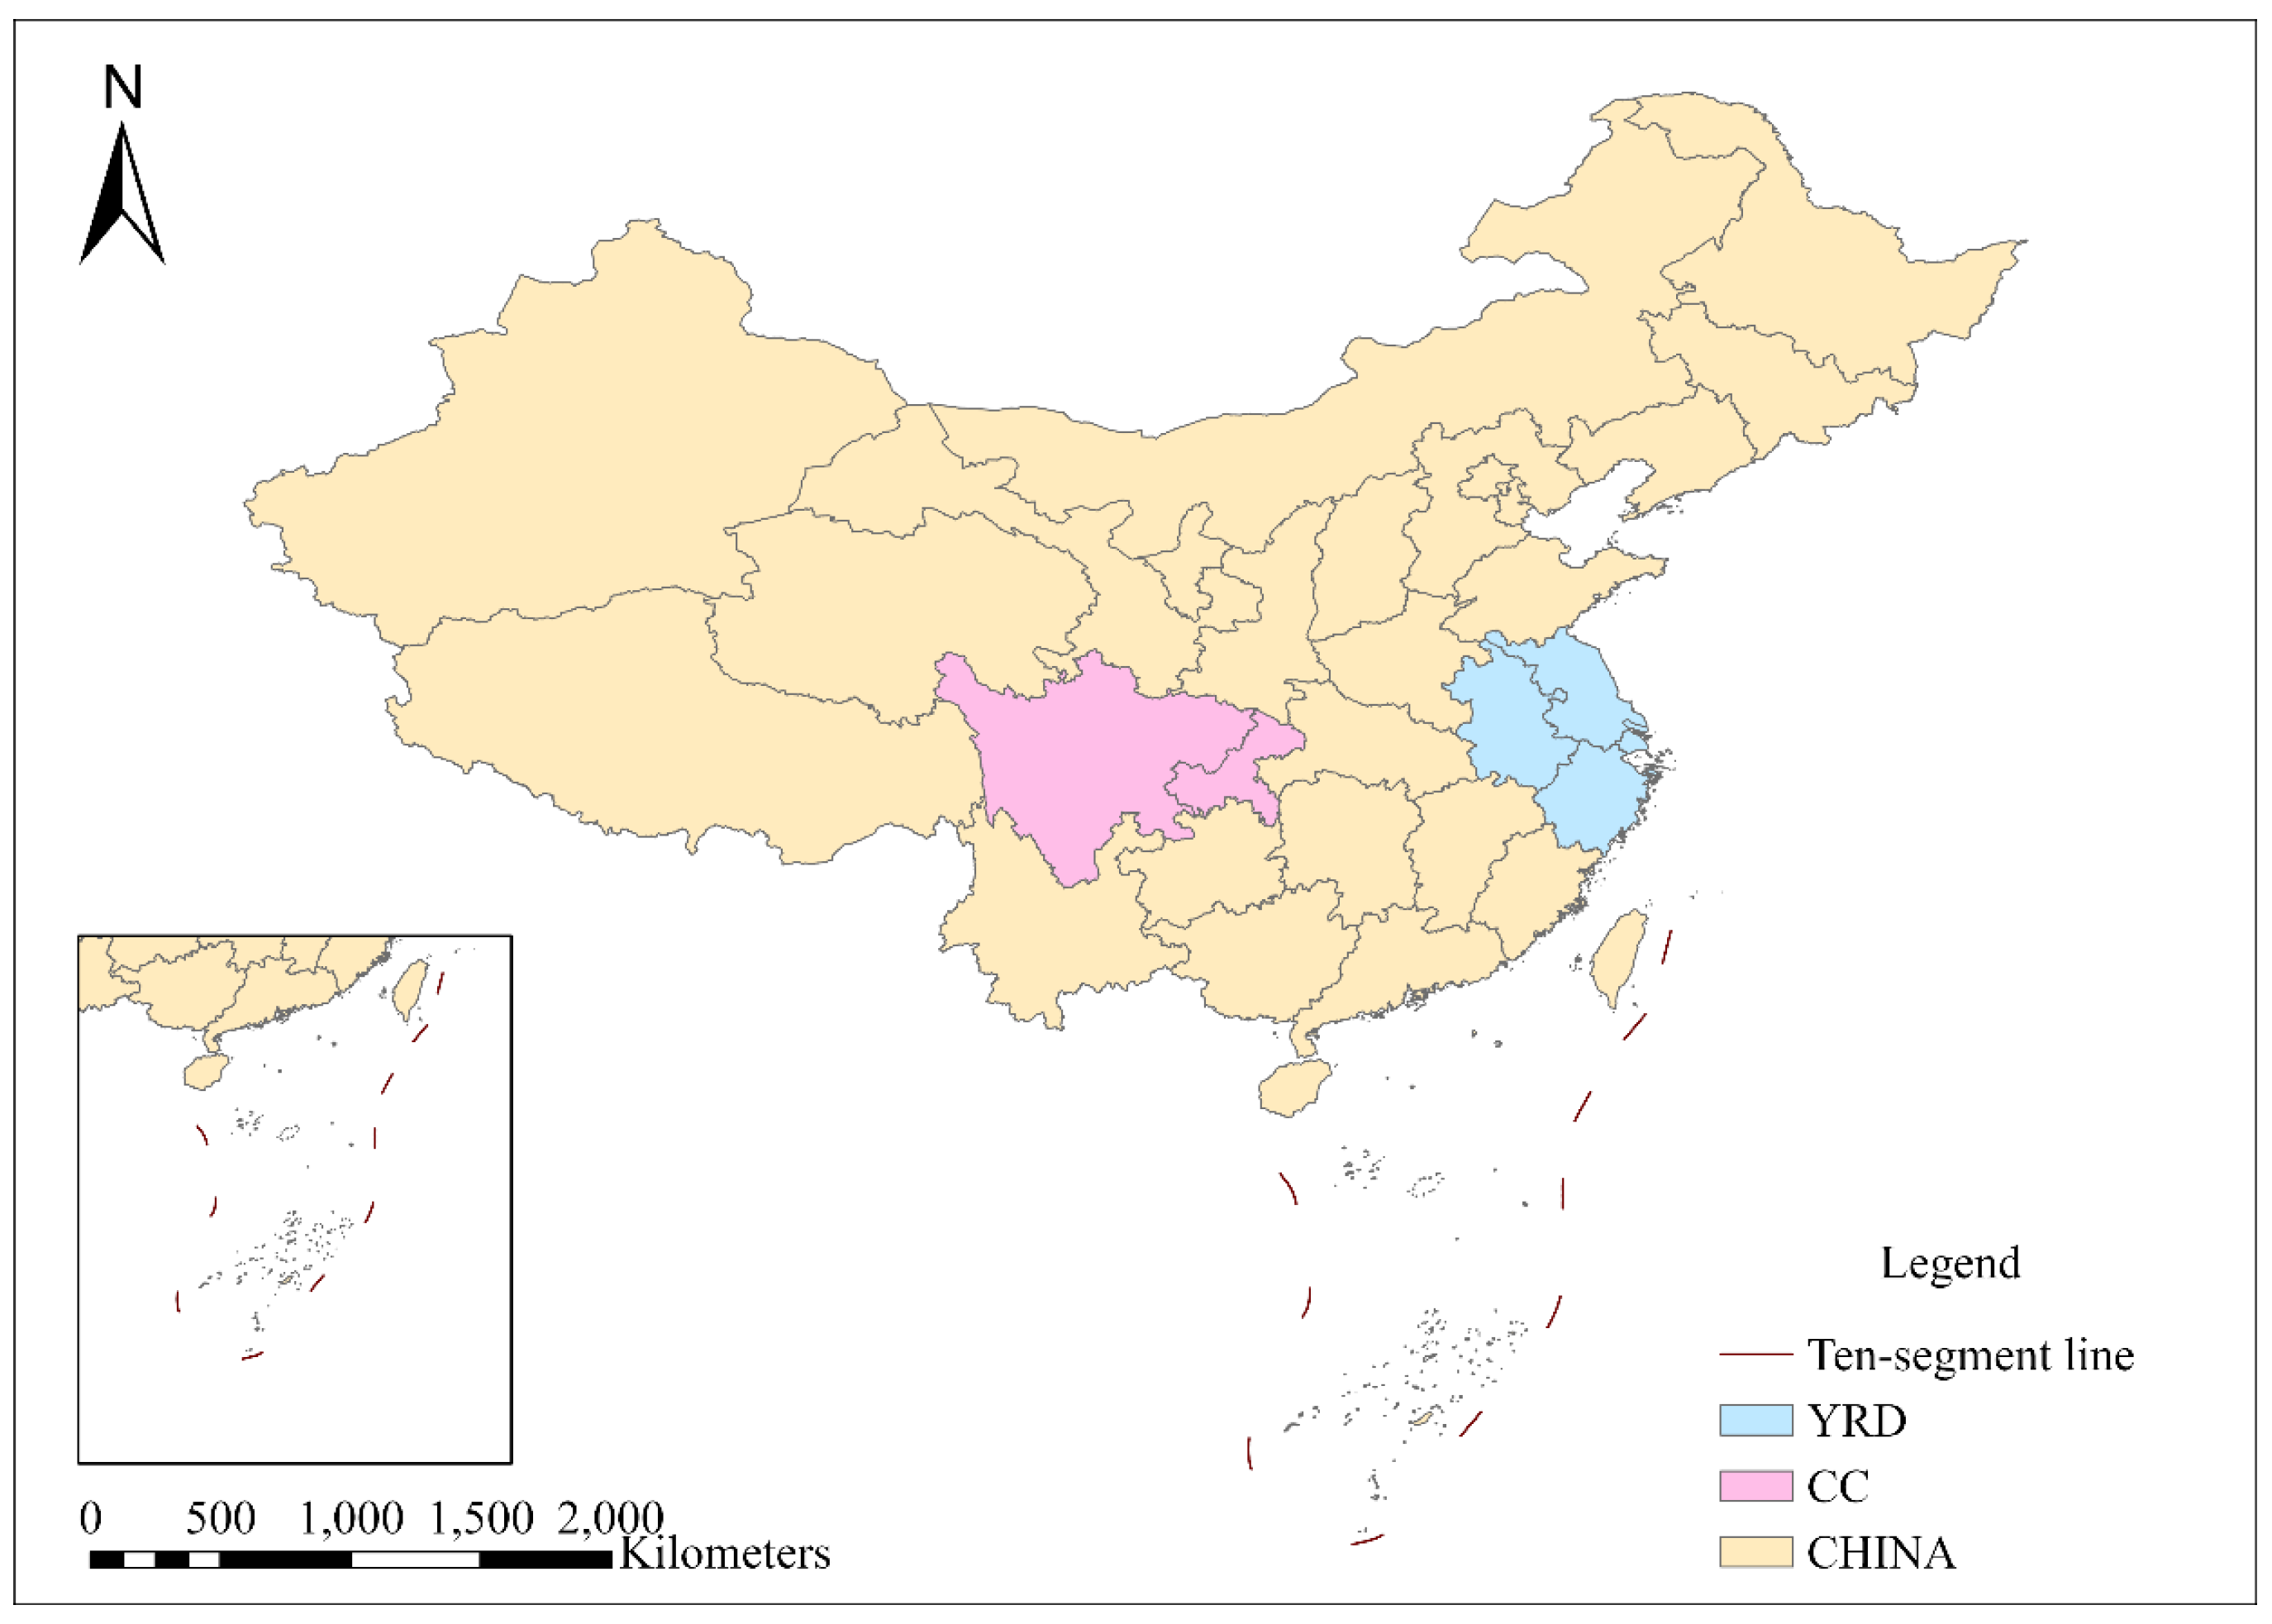
2.1. Study Area

This study focuses on the urban agglomerations with the highest population density and economic activity in China. Specifically, the study areas selected are the Yangtze River Delta (YRD) urban agglomeration and the Chengdu–Chongqing urban agglomeration (CC) (Figure 1).
According to a Chinese government report in 2023, YRD’s GDP has consistently accounted for approximately 24% of China’s GDP, demonstrating a stable development trend. Despite occupying only 4% of the land area, YRD urban agglomeration has contributed nearly a quarter of the country’s economy. CC’s GDP has reached 819.88 billion yuan, representing 6.5% of China’s GDP and 30.4% of western China’s GDP, respectively. Rapid urbanization has led to various issues such as low resource utilization rates, ecosystem degradation, and frequent natural disasters in many regions. As part of China’s 14th Five-Year Plan, there is an emphasis on reinforcing economic and population-carrying capabilities by focusing on central cities, city clusters, and other advantageous regions for economic development. The outline underscores the importance of YRD as a leading force for promoting high-quality development in China while also highlighting CC’s growth into “the fourth pole” of China’s economic growth. This illustrates their critical roles in China’s regional strategies and improving the spatial layout of the urbanization process.

2.2. Study Data

2.2.1. Land Use Data

The China Land Cover Dataset is an annual land cover dataset of China produced by Wuhan University based on 335,709 Landsat data points from the Google Earth Engine. The dataset contains yearly land improvement information in China from 1985 to 2020. Based on the Landsat data obtained, this research team constructed temporal and spatial characteristics combined with the random forest classifier to obtain classification results, and proposed a post-processing method including temporal and spatial filtering and logical reasoning to further improve the temporal and spatial consistency of CLCD. The overall accuracy of this dataset is 80%.
The greatest strength of the dataset is the 30 m of land use classification per year, which covers a continuous period of 30 years. Compared with other products such as GLC FCS30, Gobal30, FROM-GLC10, ESA10, ESRI10, CLCD has higher temporal resolution, and the current dataset is only for China.

2.2.2. Night-Time Light Data

In 2012, the Visible Infrared lmaging Radiometer Suite carried by National Polar-Orbiting Partnership System of the United States provided a new generation of night light remote sensing data. Compared with DMSP/OLS data (another mainstream night-time light data in USA), it has many advantages, such as high image resolution (about 500 m), eliminating the oversaturation phenomenon of light, and comparability of data at different times, which further expands the research and application field of night-time light remote sensing. The 2020 NPP-VIIRS monthly composite data used in this study were downloaded from National Oceanic and Atmospheric Administration’s National Geophysical Data Center “https://www.ngdc.noaa.gov (accessed on 20 December 2023)”.

2.2.3. LST and NDVI Data

The Moderate-resolution Imaging Spectroradiometer (MODIS) is a primary sensor aboard the Terra and Aqua series of satellites. MODIS provided continuous spatial–temporal LST and NDVI datasets for this study. MOD11A2 eight days synthesized LST Day-and-Night data with a 1 km resolution and Normalized Difference Vegetation Index (NDVI) band data were acquired from the United States Geological Survey “https://earthexplorer.usgs.gov/ (accessed on 25 January 2024)”. To maintain the stability of the data, we calculated the 2020 annual weighted mean instead of emphasizing extreme values.

2.2.4. Road Network and POI Data
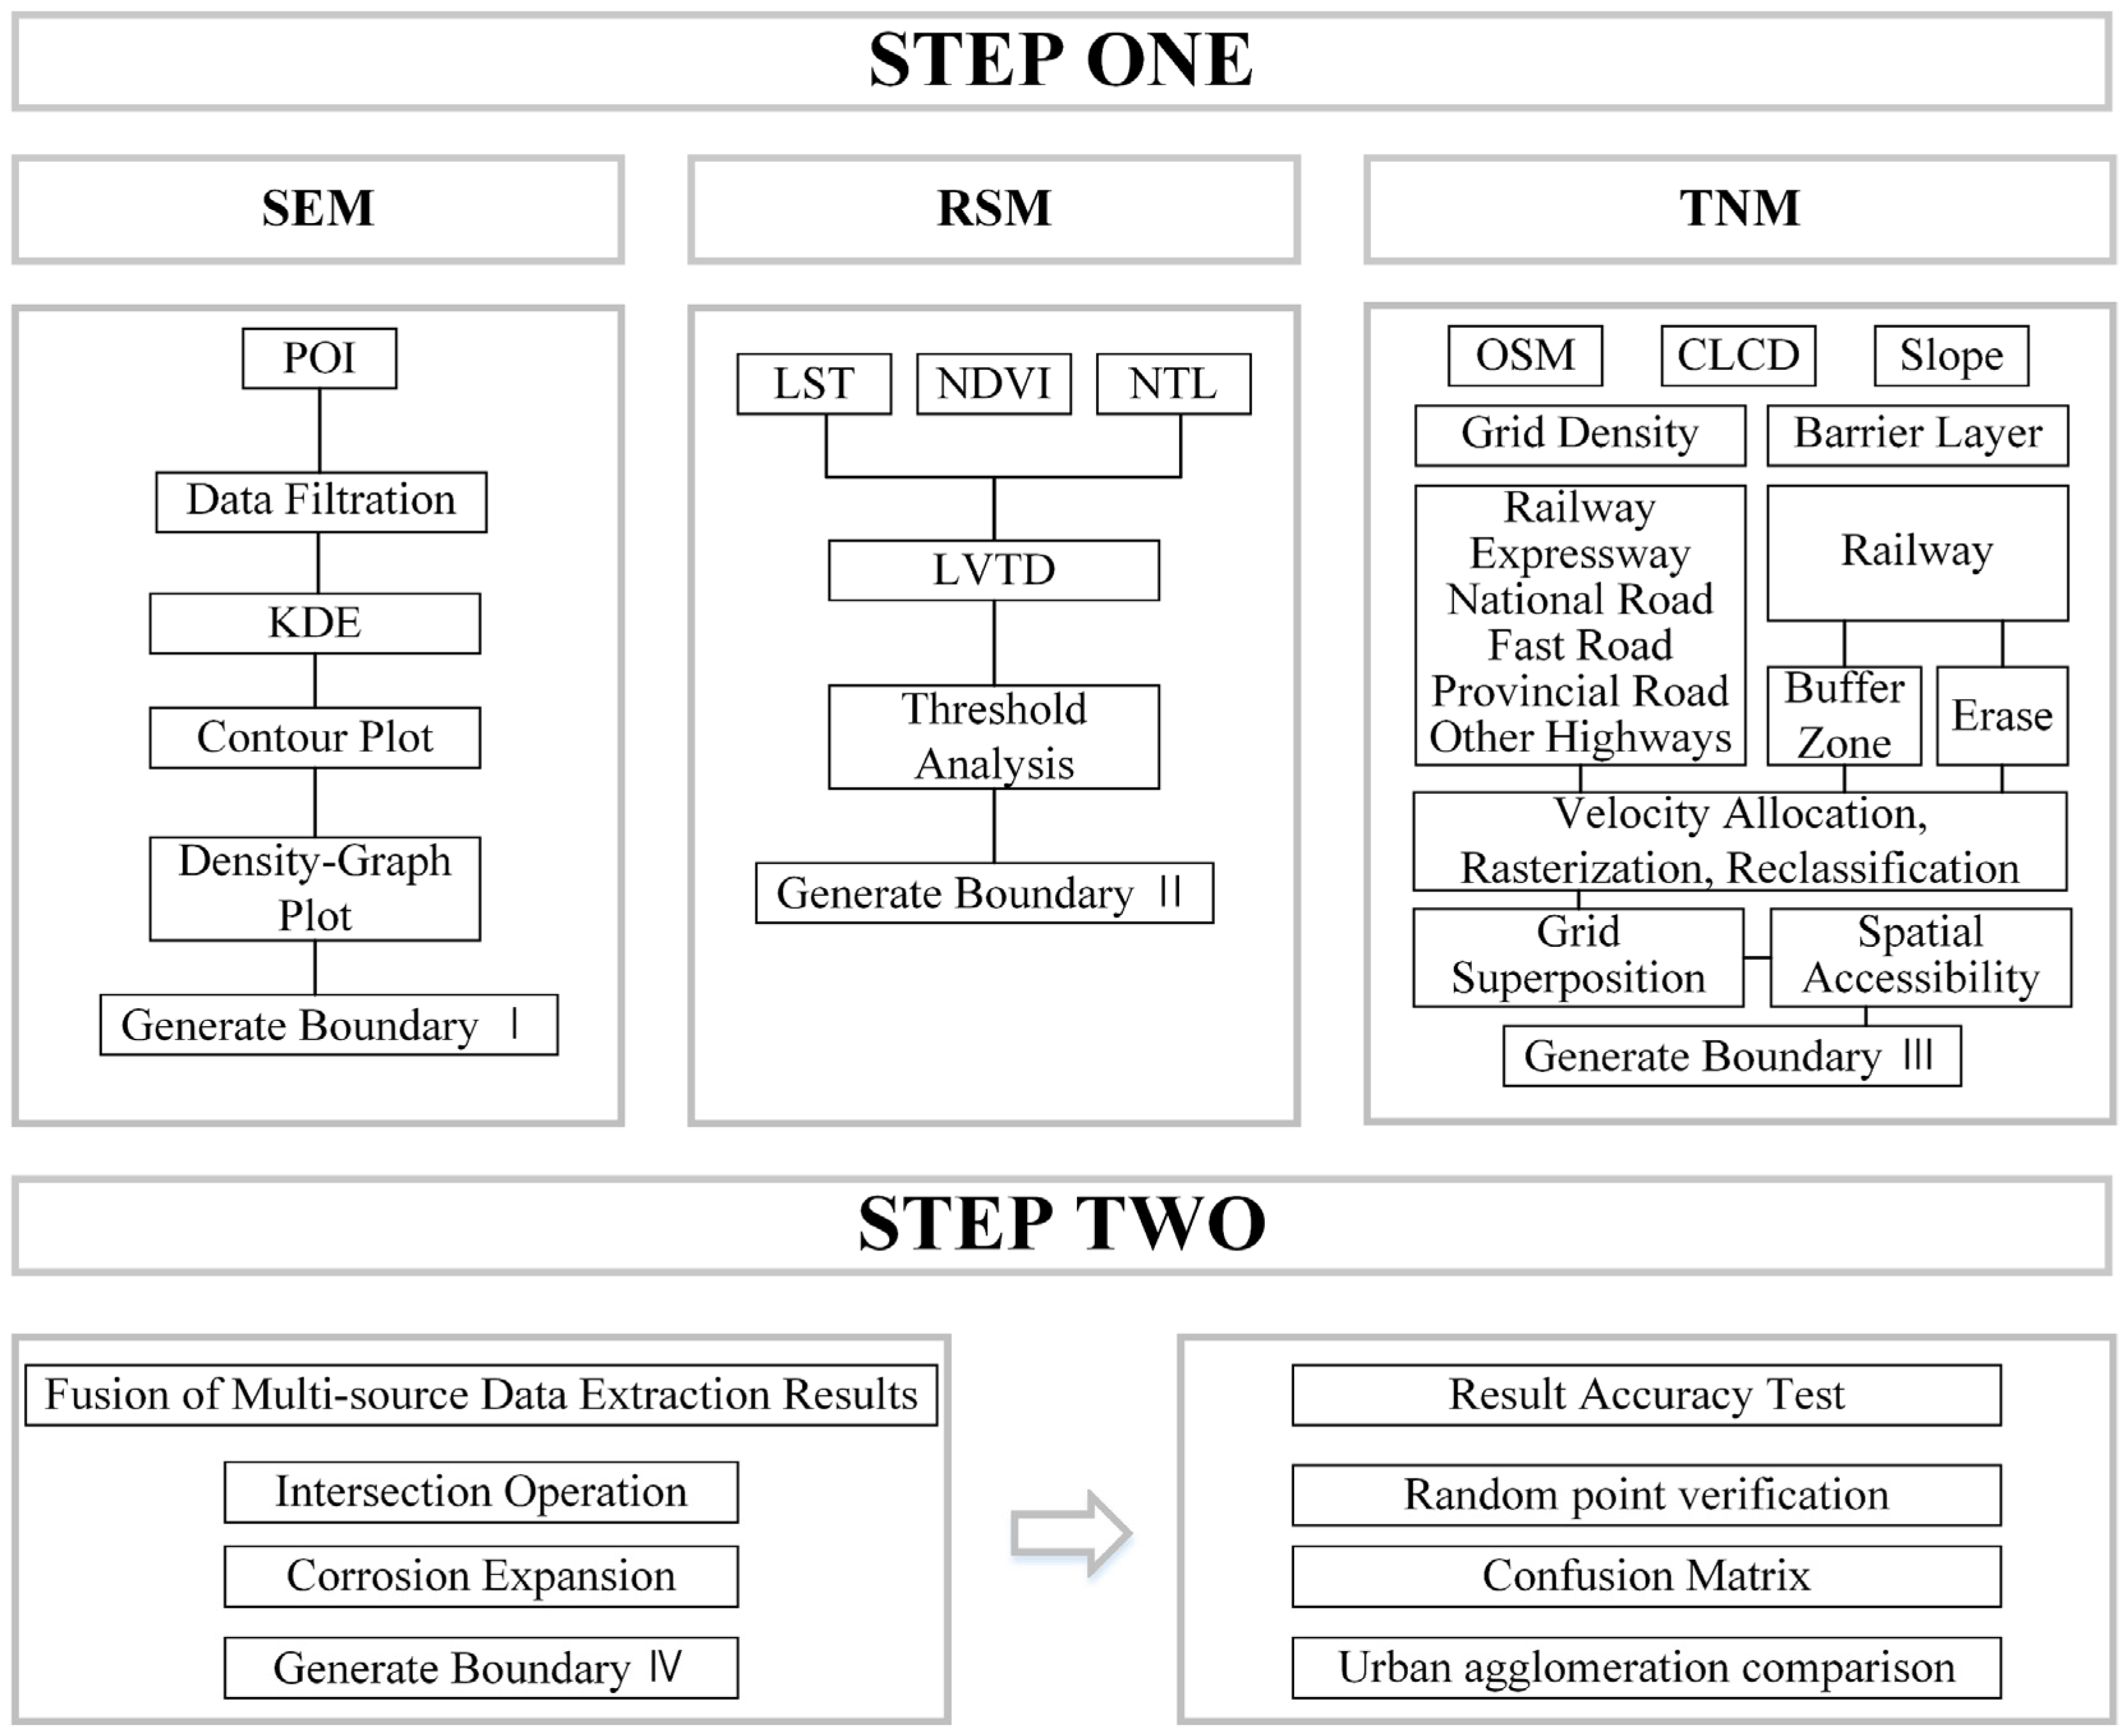
This study collected all types of POI data of the Yangtze River Delta and Chengdu–Chongqing urban agglomeration in 2020 based on the AmAP platform. Each data point contains attributes such as name, address, telephone number, type, latitude and longitude, city, county, township, and postal number. Since the original POI data types are miscellaneous and the classification criteria are not clear, there is a phenomenon of overlapping among various data points. Through reclassification analysis, 49,908 pieces of data from the Yangtze River Delta city cluster and 180,000 pieces of data from the Chengdu–Chongqing city cluster were obtained. In addition, the land road network data were obtained from OSM maps “https://download.geofabrik.de/asia.html (accessed on 10 January 2024)”. OSM is currently the most extensive collaborative and publicly licensed collection of geospatial data, widely used as an alternative or supplement to authoritative data [40]. Based on the attribute information of the road network data, we extracted the high-speed rail, general rail, expressway, national highway, provincial highway, and other roads of each city group.

2.3. Method

This study used spatiotemporal big data, including POI, NDVI, luminous remote sensing, OSM data, etc., to extract the built-up areas of urban agglomerations. This research scheme is divided into two parts (Figure 2). The first part is to extract the built-up area boundary from three dimensions, and the second part is to fuse the results according to the fusion rules and complete the accuracy verification.

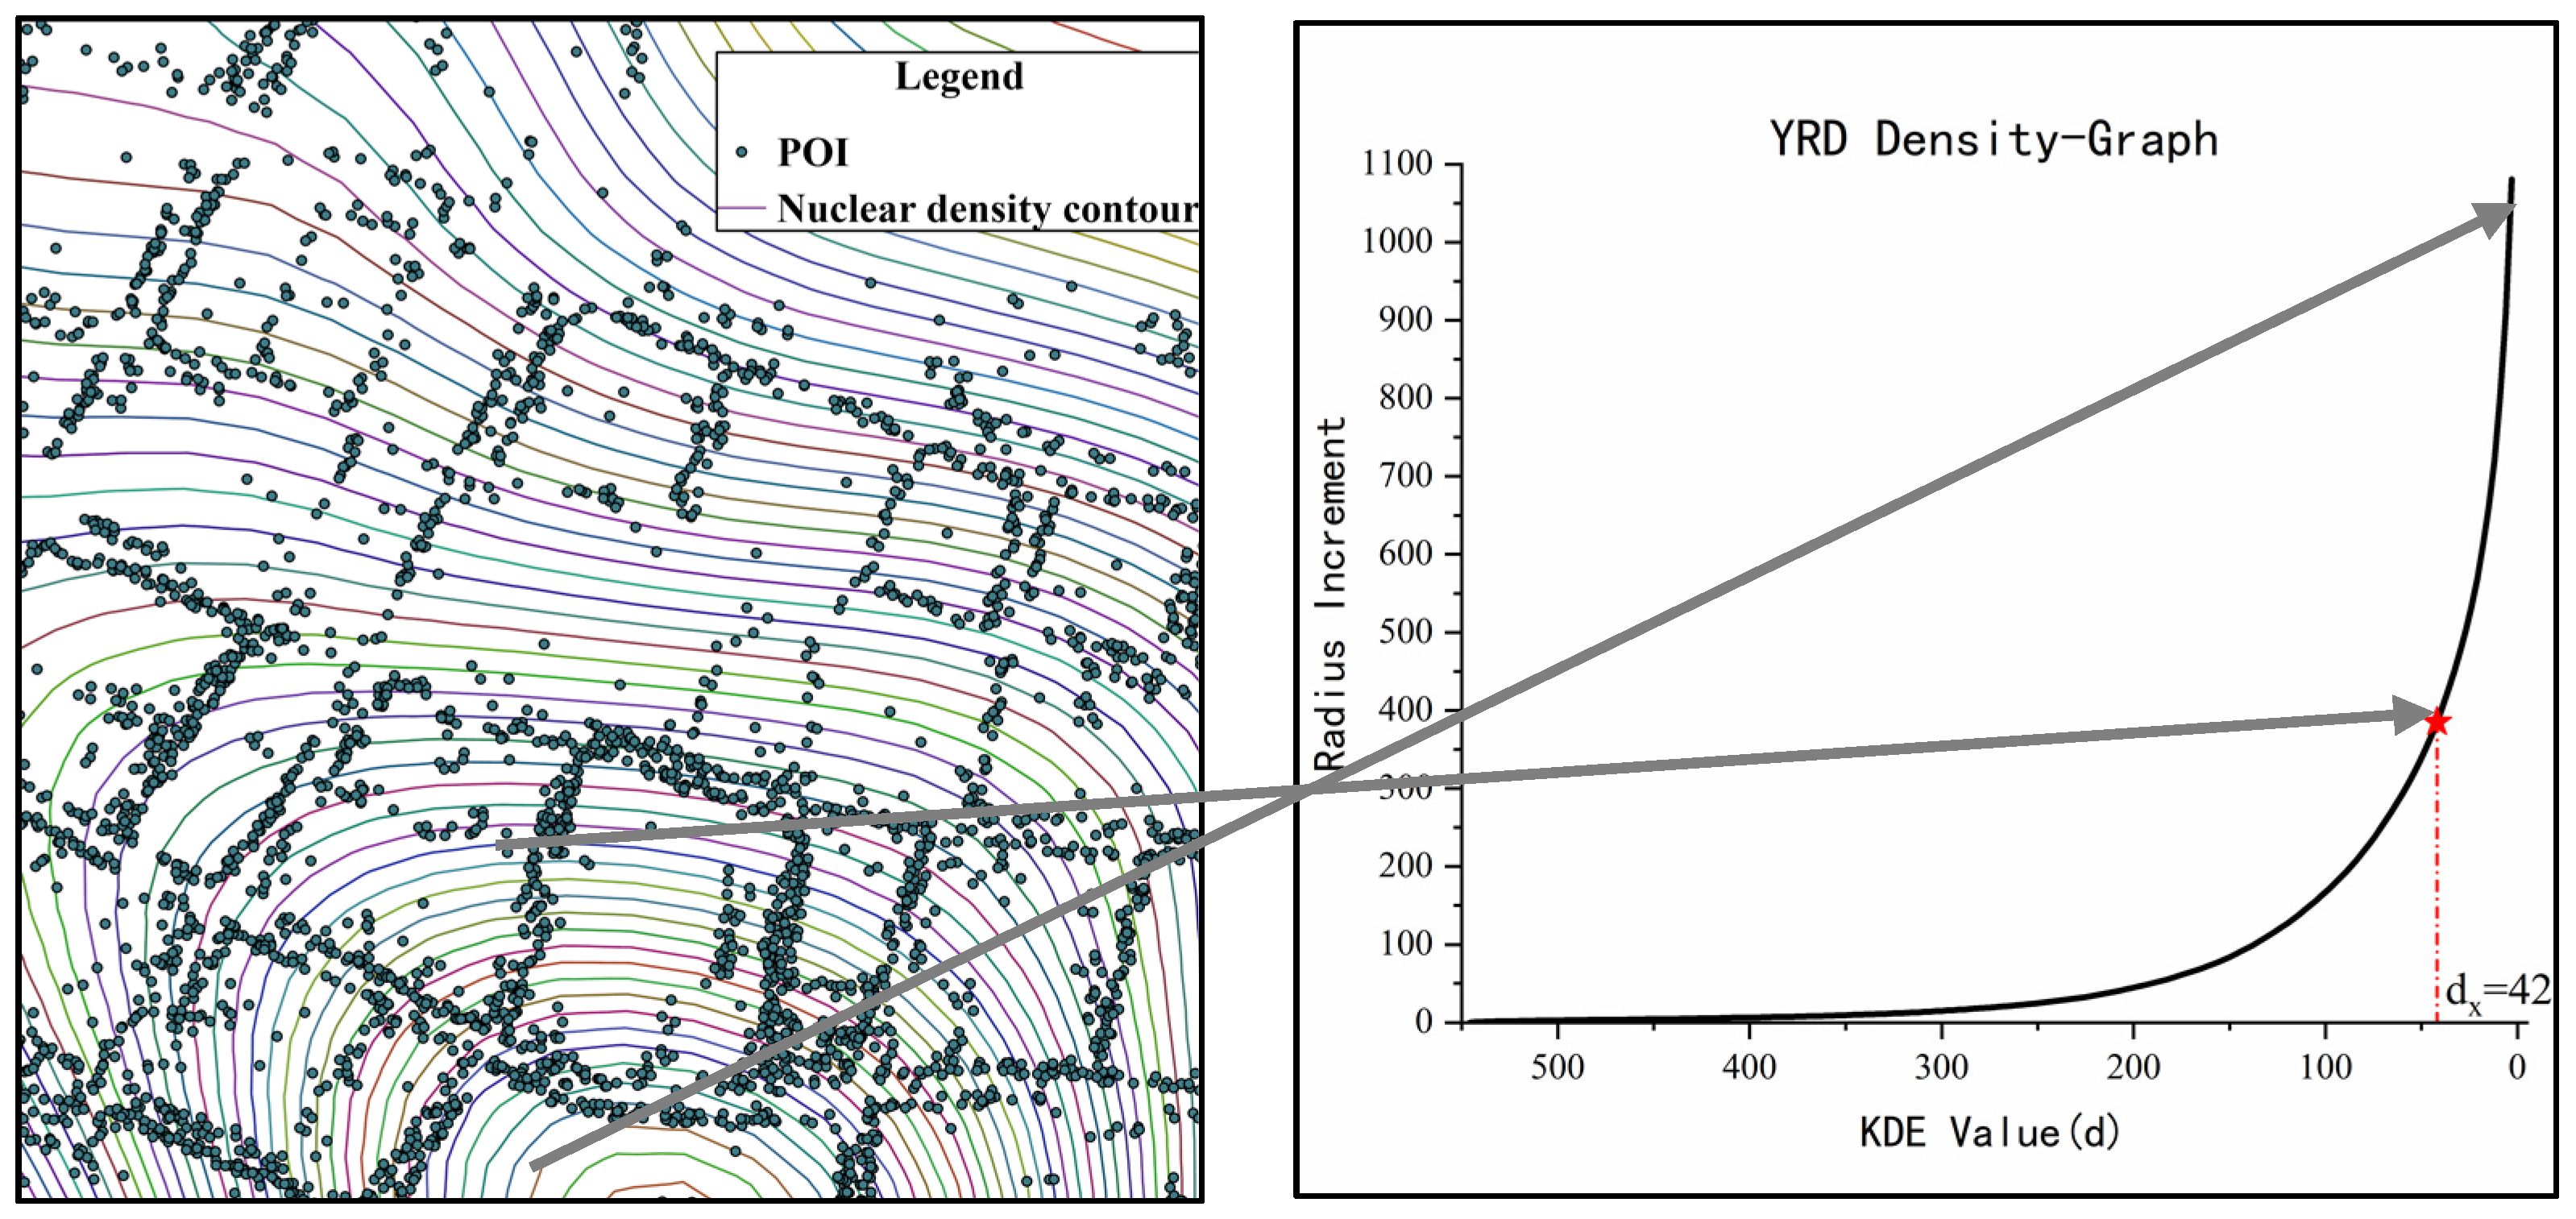
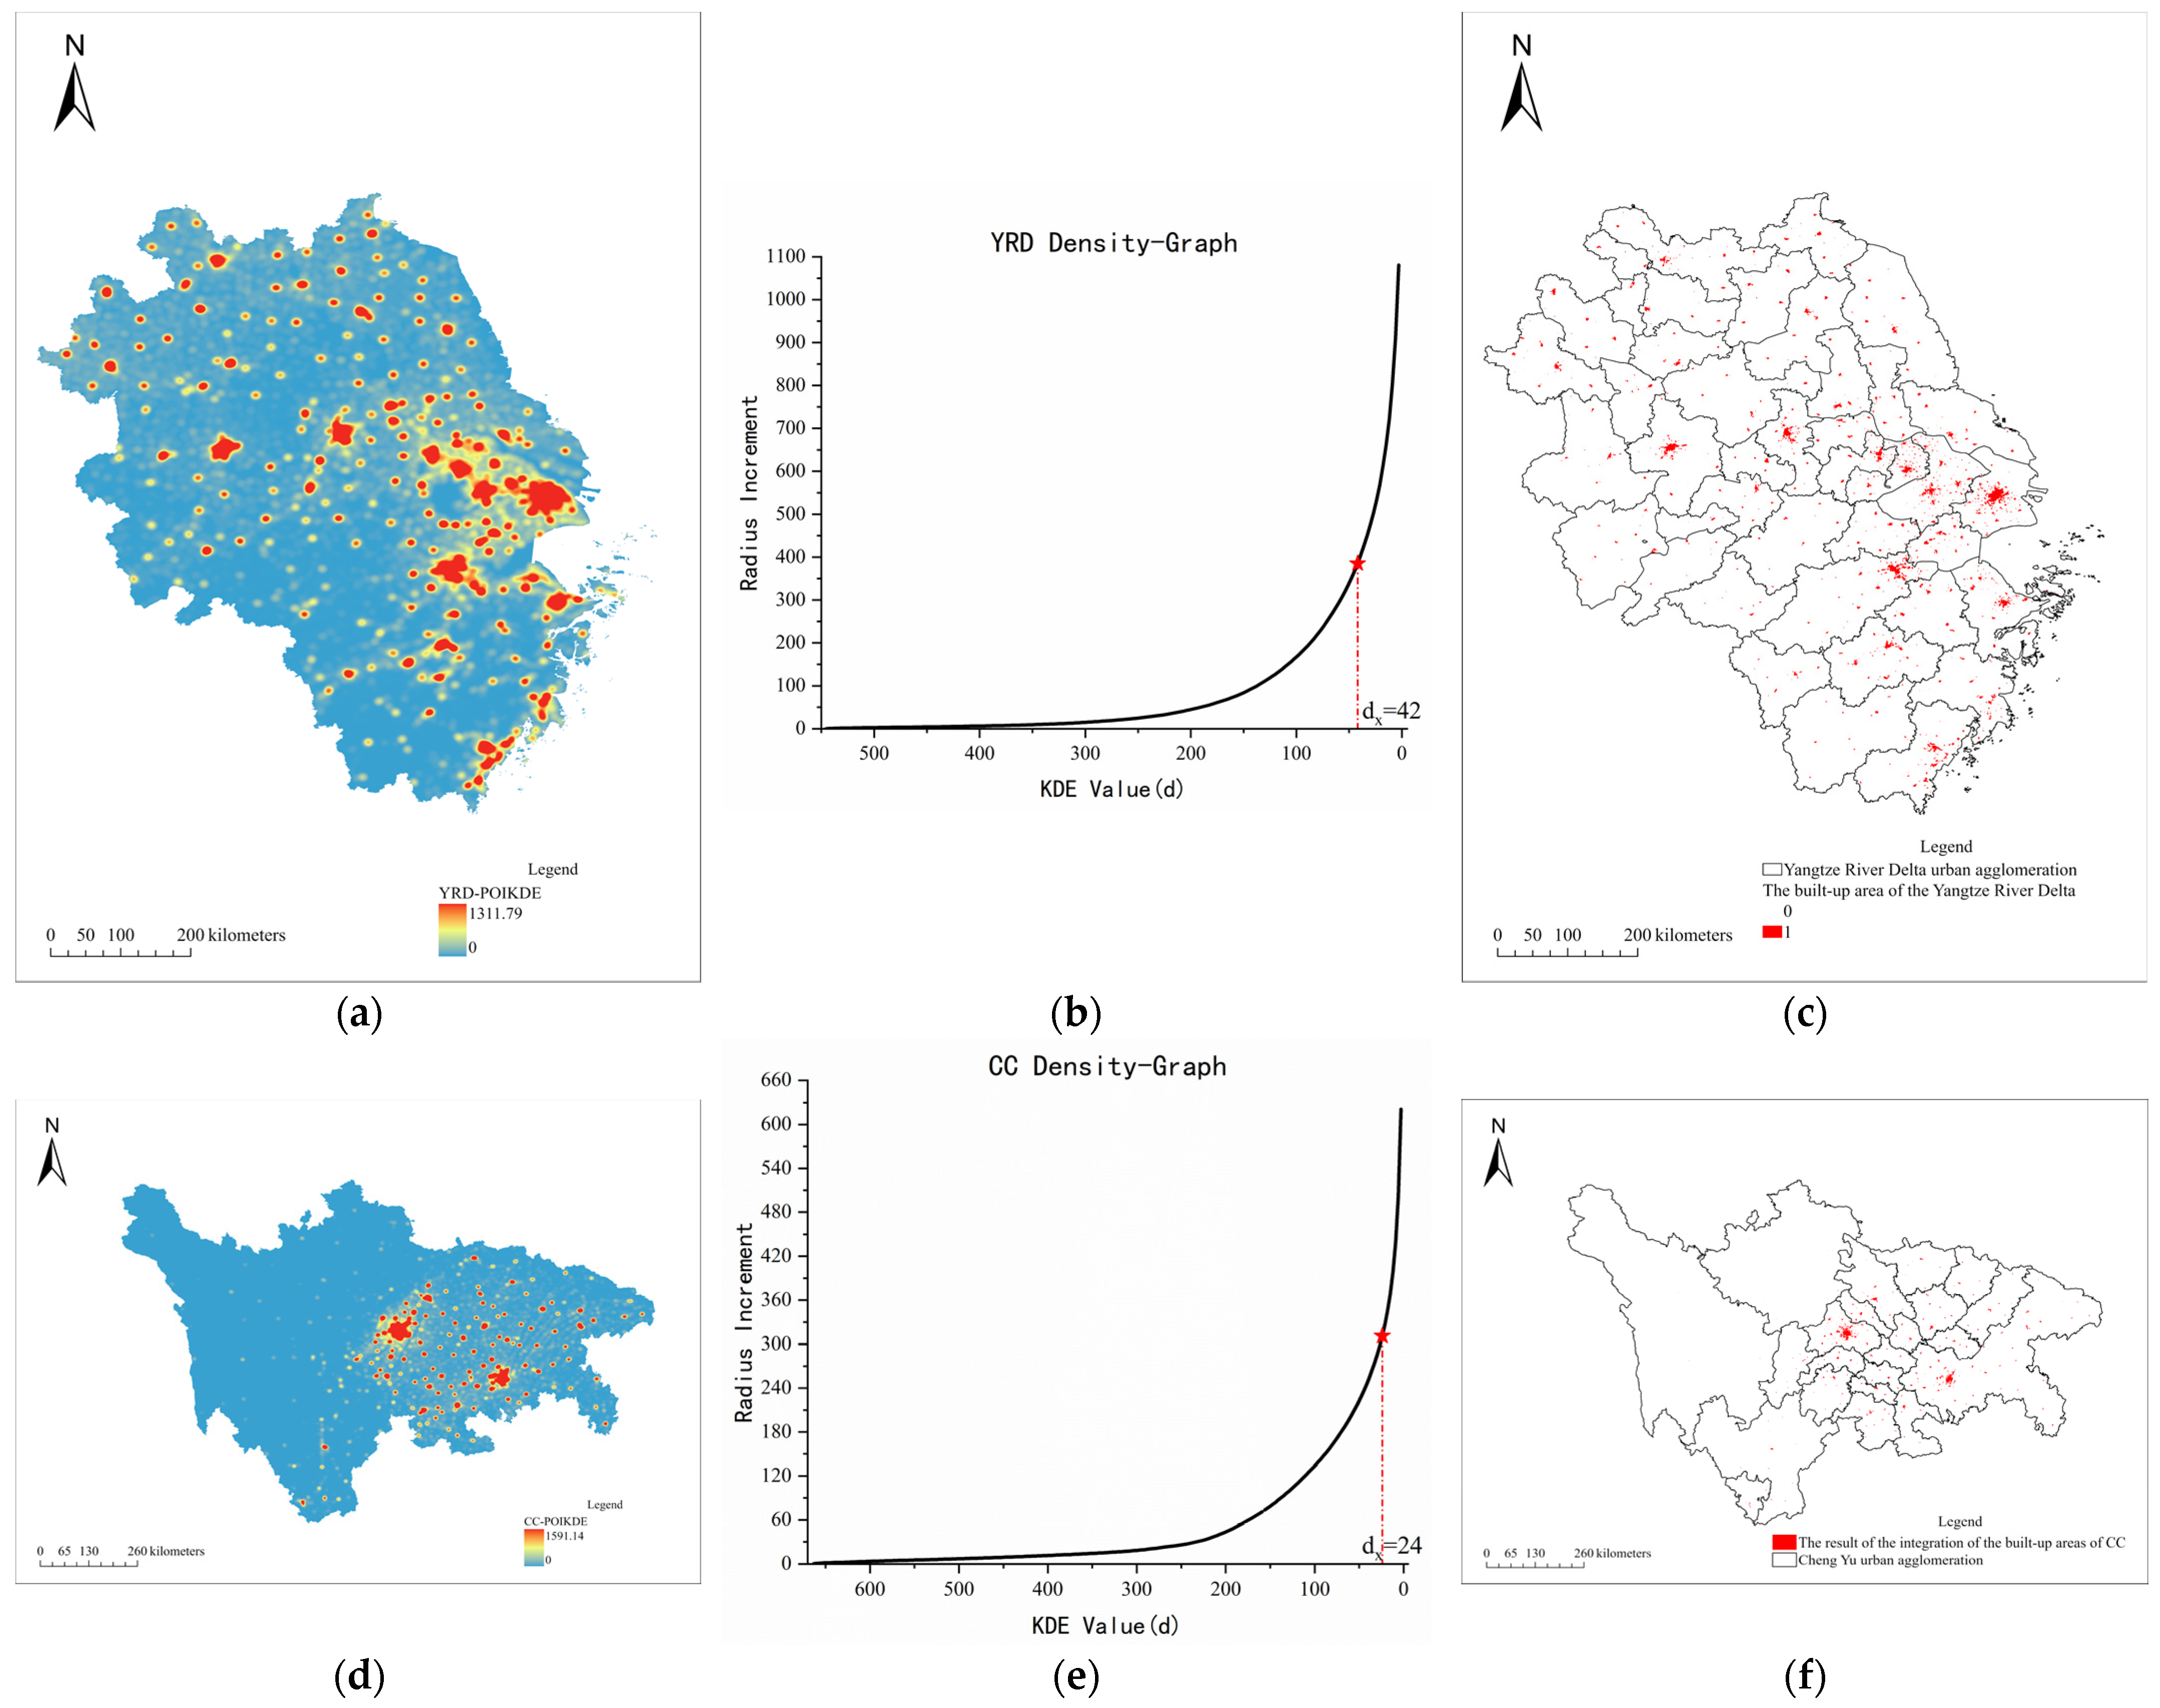
2.3.1. Recognition Method Based on POI (POIM)

Due to aggregation effect and scale effect, all kinds of POI tend to gather in cities, making the density of POI in cities significantly higher than that in suburbs and rural areas, and the change rate of POI density is the largest at the junction of cities and rural areas.
Kernel density estimation (KED) was used to establish the probability density of POI [41]. KED is one of the nonparametric test methods used to predict unknown density functions in probability theory. The formula is as follows:
POI i = i = 1 n 1 n h k ( d i s h )
In the formula, h is the bandwidth; n is the number of element points that are less than or equal to the distance from the location; and k is a spatial weight function.
Considering that POI data meet the requirements of this method in terms of data type, data amount and the proportion of various POI, this study chooses the Densi-Graph method to extract the built-up area of toponymy address POI data. The process is shown in Figure 3. The Densi-Graph curve is drawn with the core density value d as the horizontal axis and the theoretical radius increment S d 1 / 2 of the closed curve as the vertical axis. When the growth rate of the curve is greater than the preset threshold, the corresponding nuclear density value is the critical value of the urban built-up area boundary, and the contour line of nuclear density is determined as the urban built-up area boundary.

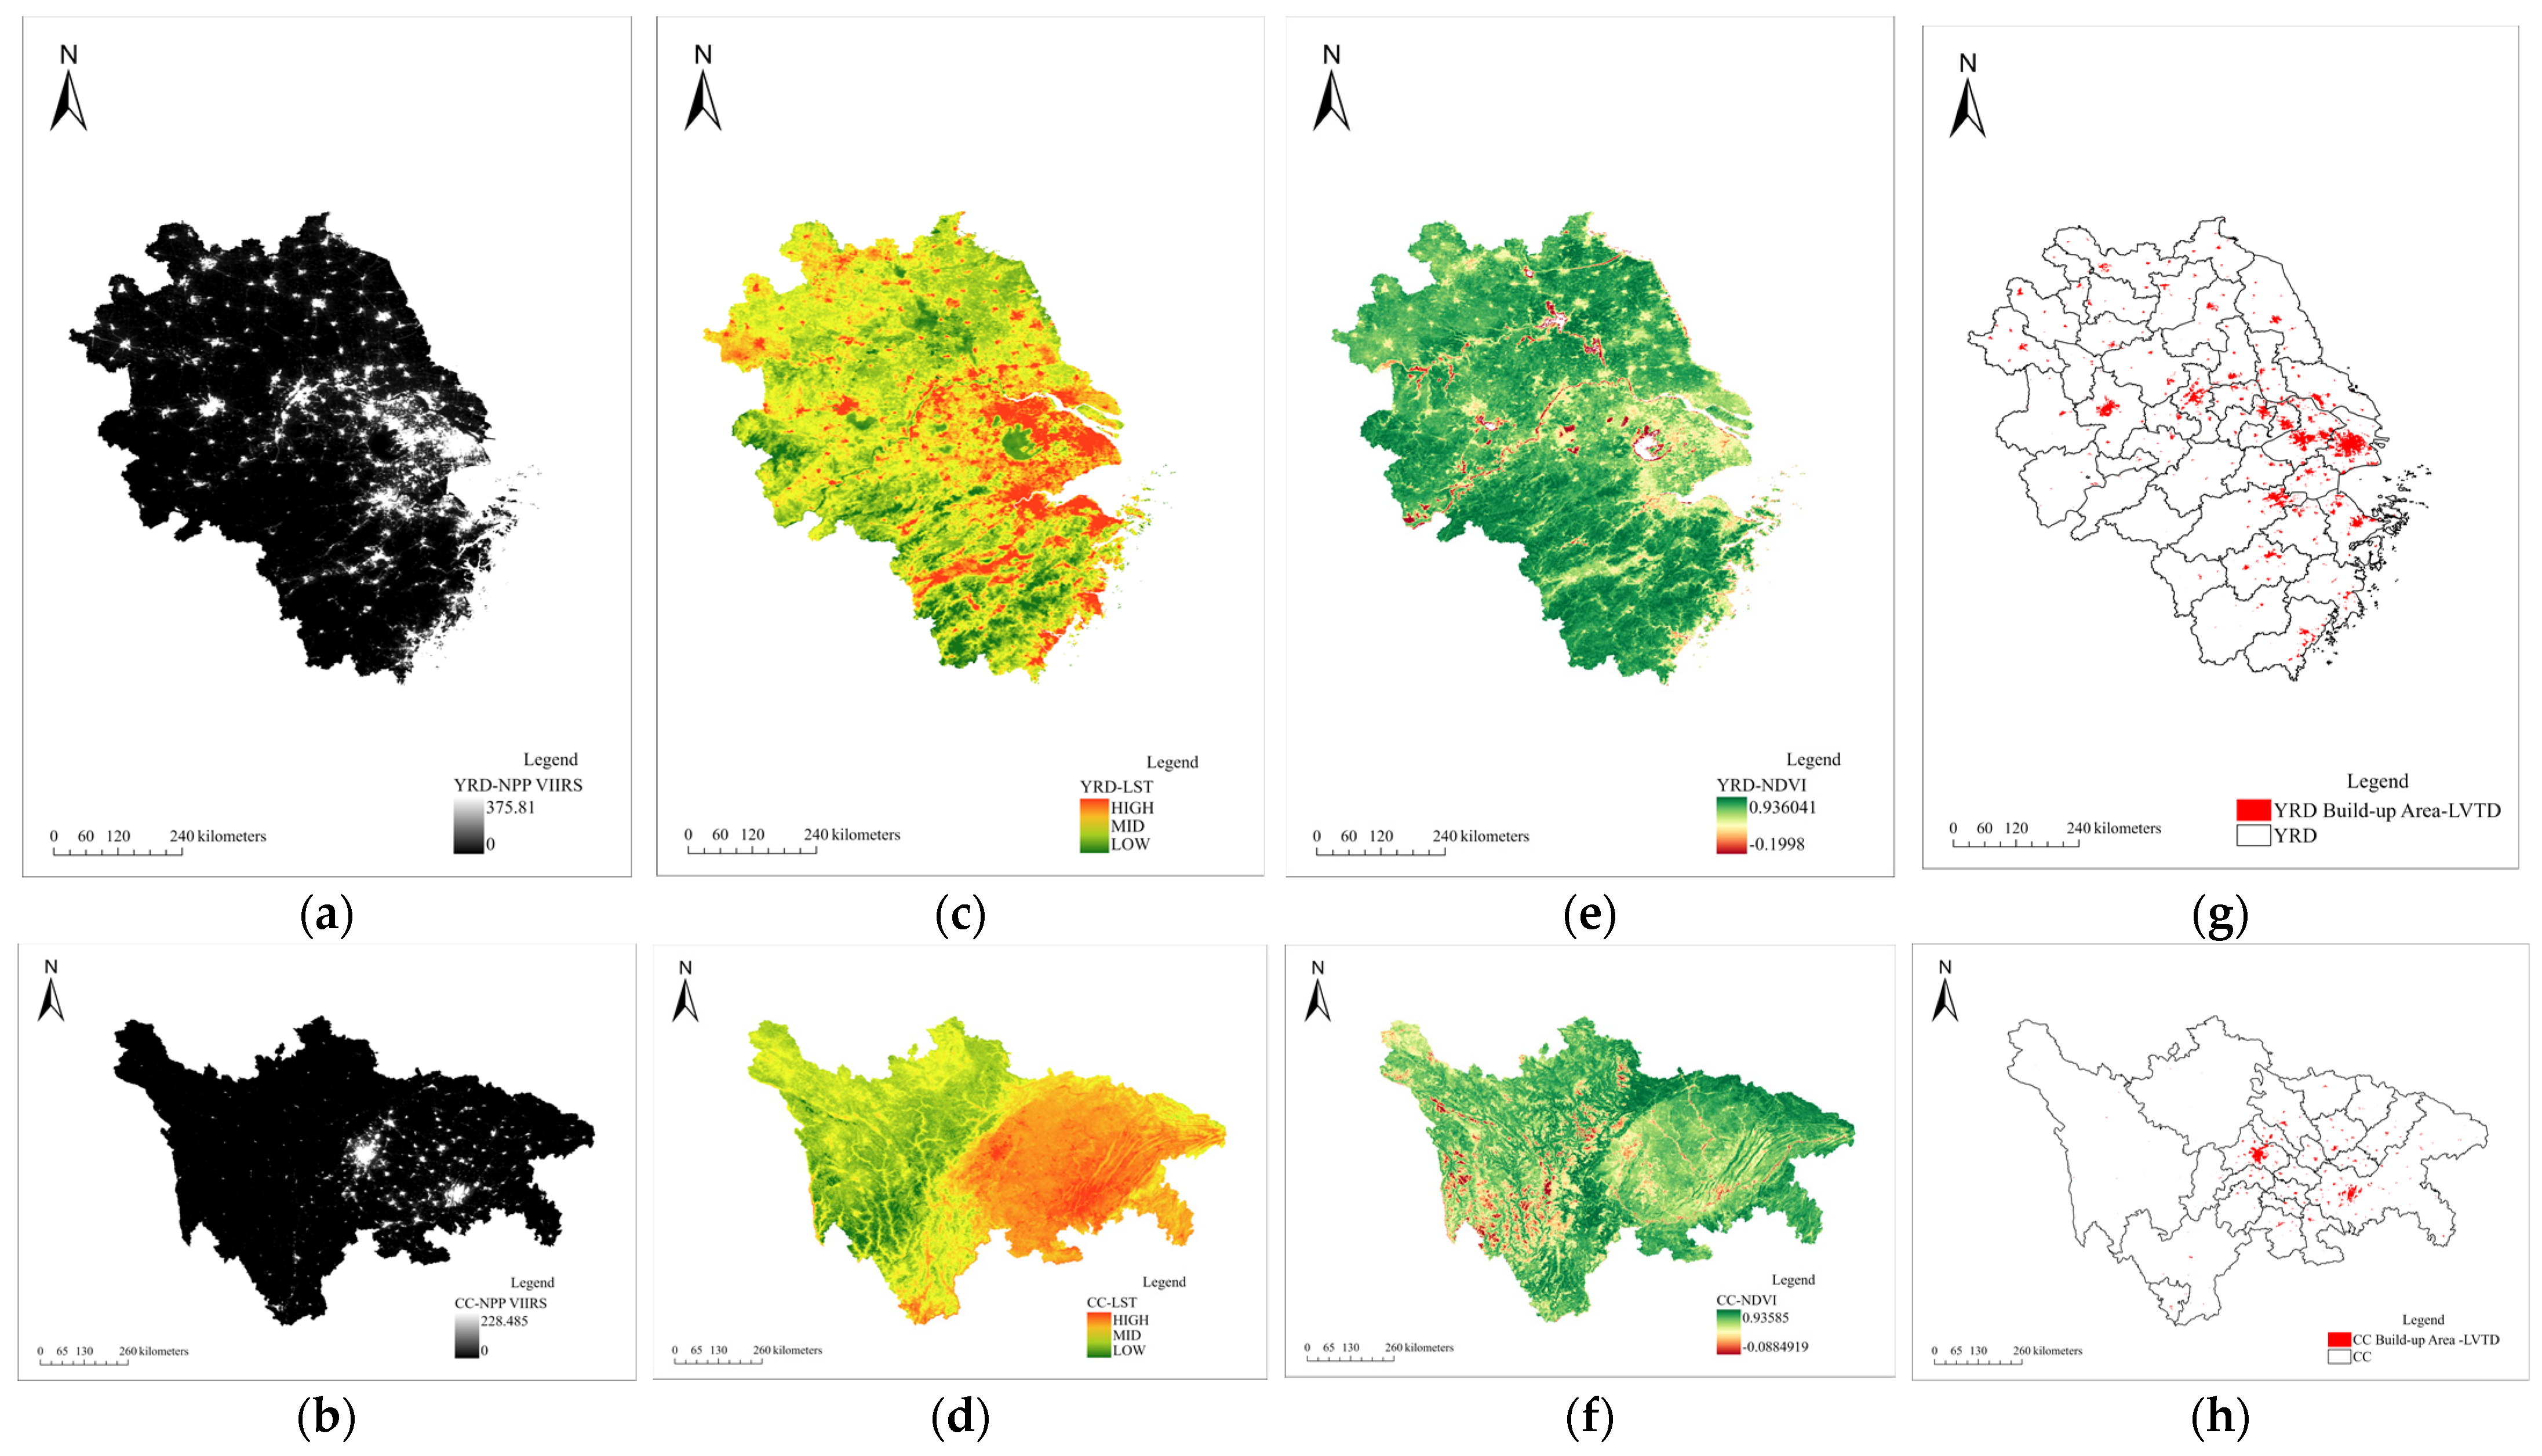
2.3.2. Recognition Method Based on Remote Sensing Data (RSM)

In this study, an NTL-based (Night-time light) city index was selected to extract the built-up area boundary, which uses MODIS Land surface temperature (LST) and Normalized Vegetation Index (NDVI) images to adjust and compensate for the desaturation of NTL images obtained from the corresponding urban areas. The ratio between LST and NDVI has been shown to be an appropriate comprehensive measure of LST-NDVI feature spatial patterns and has been used to distinguish different land cover types.
It is a common observation that the closer an area is to the city center, the higher the LST is due to high population density, levels of human activity and the number of artificial structures. Vegetation cover decreases with the increase in impervious surface construction and urban population growth. Therefore, in this study, the ratio between LST and NDVI is combined with NTL data to construct the new city index LVTD. Considering that the ratio of LST and NDVI tends to have infinite values when the NDVI of some land cover types approaches zero, the inverse tangent of LST/NDVI is combined with the NTL data. Therefore, the proposed LVTD is expressed as follows:
LVTD = arctan ( LST NDVI ) π 2 × NTL
LST nor = LST LST min LST max LS T min
According to the LVTD index, the built-up area boundary is extracted using the global fixed threshold. In the global fixed threshold method, a specified threshold for the NTL data is determined for the entire study area, which is set to minimize the difference between the extracted urban area and the reference data.

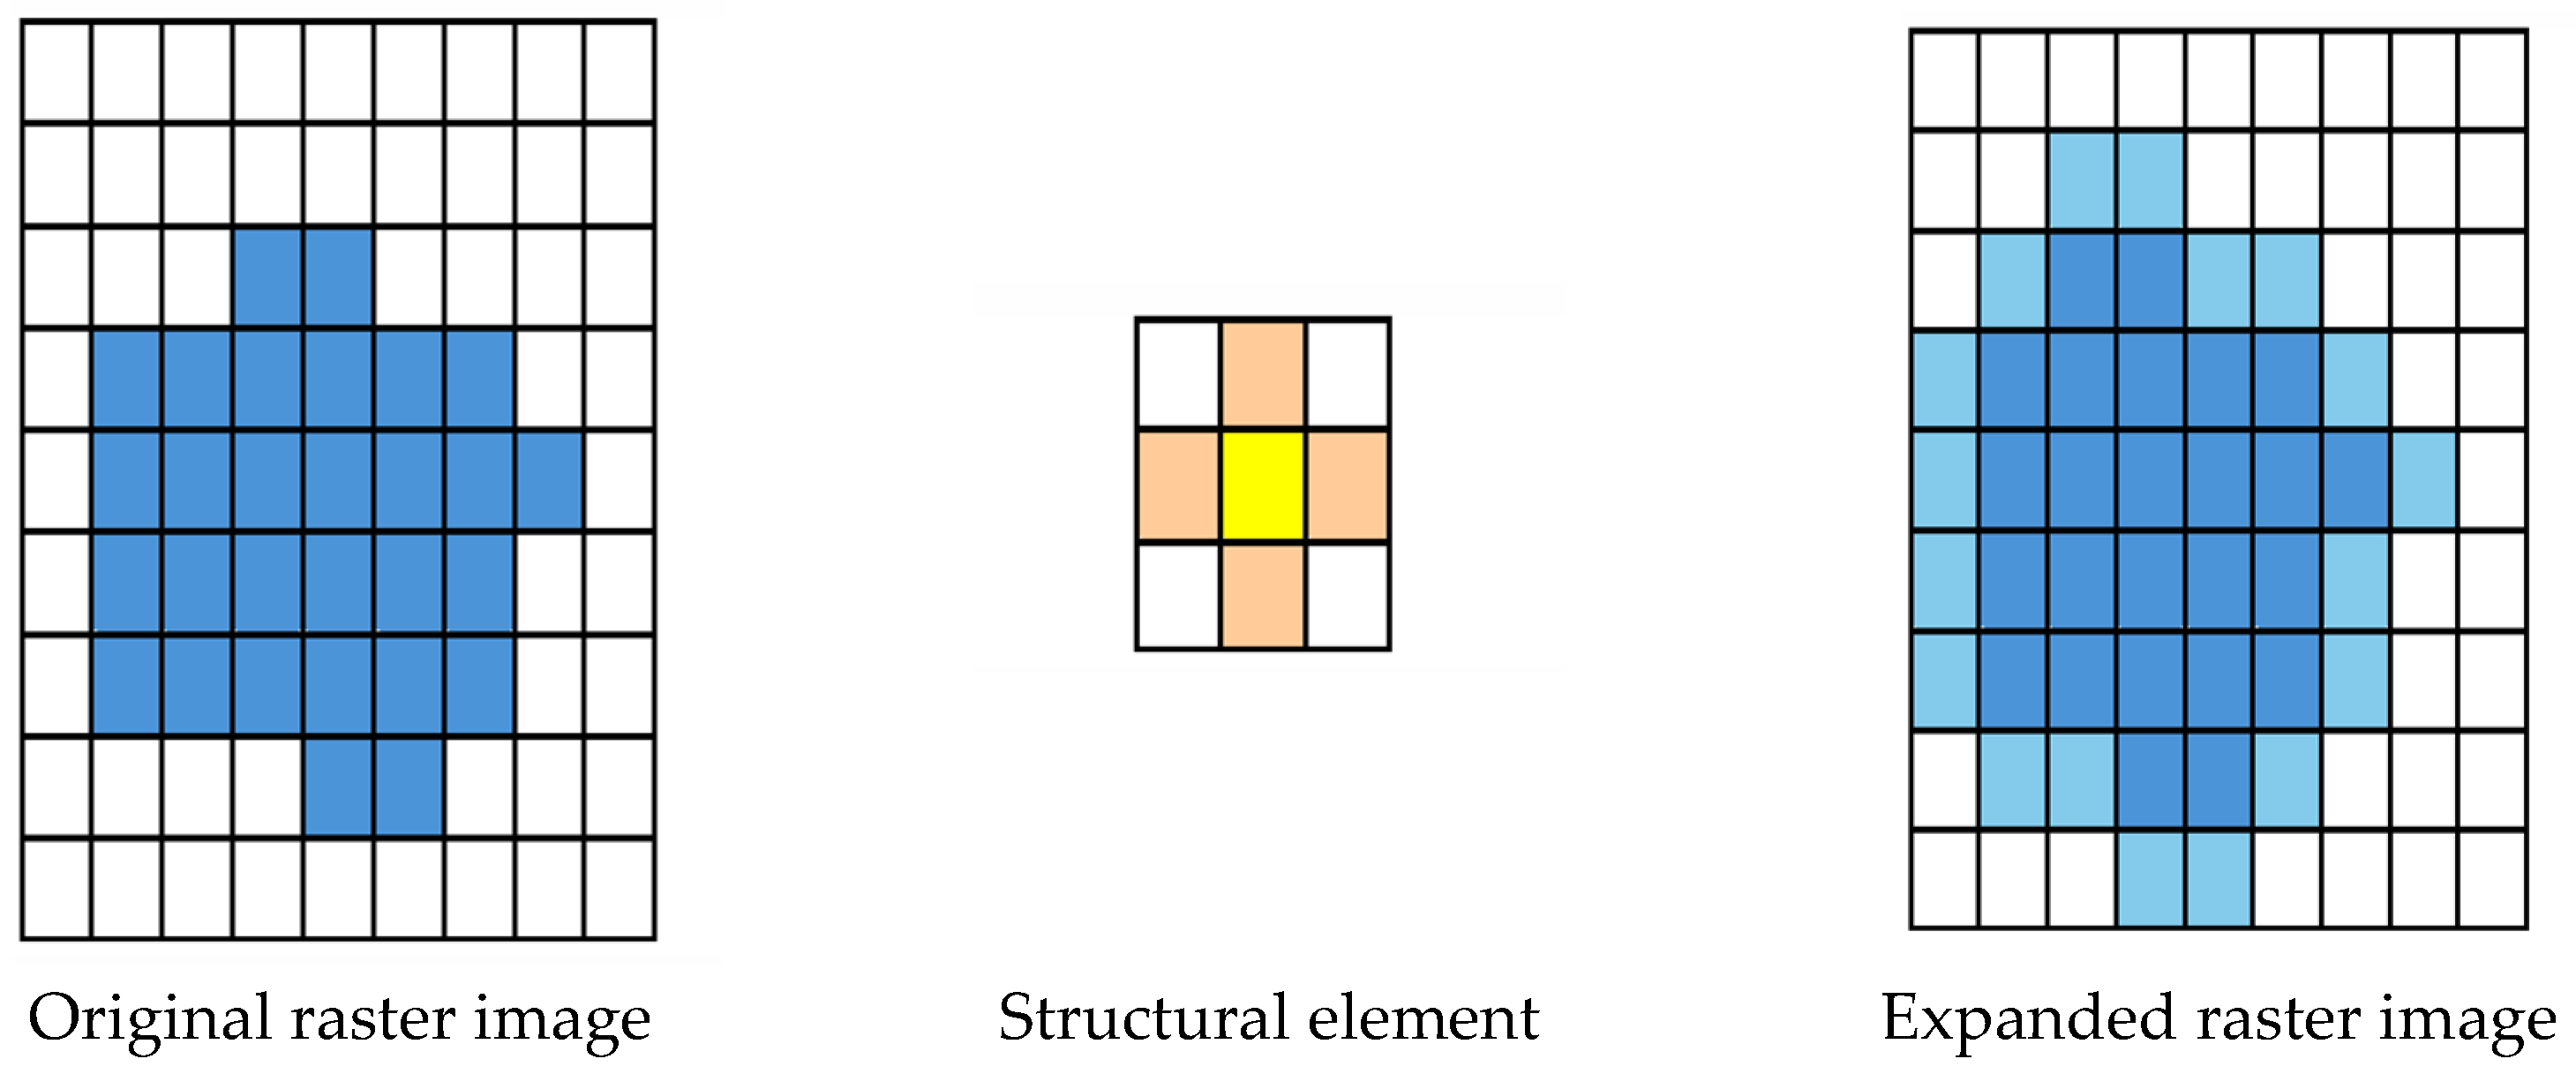
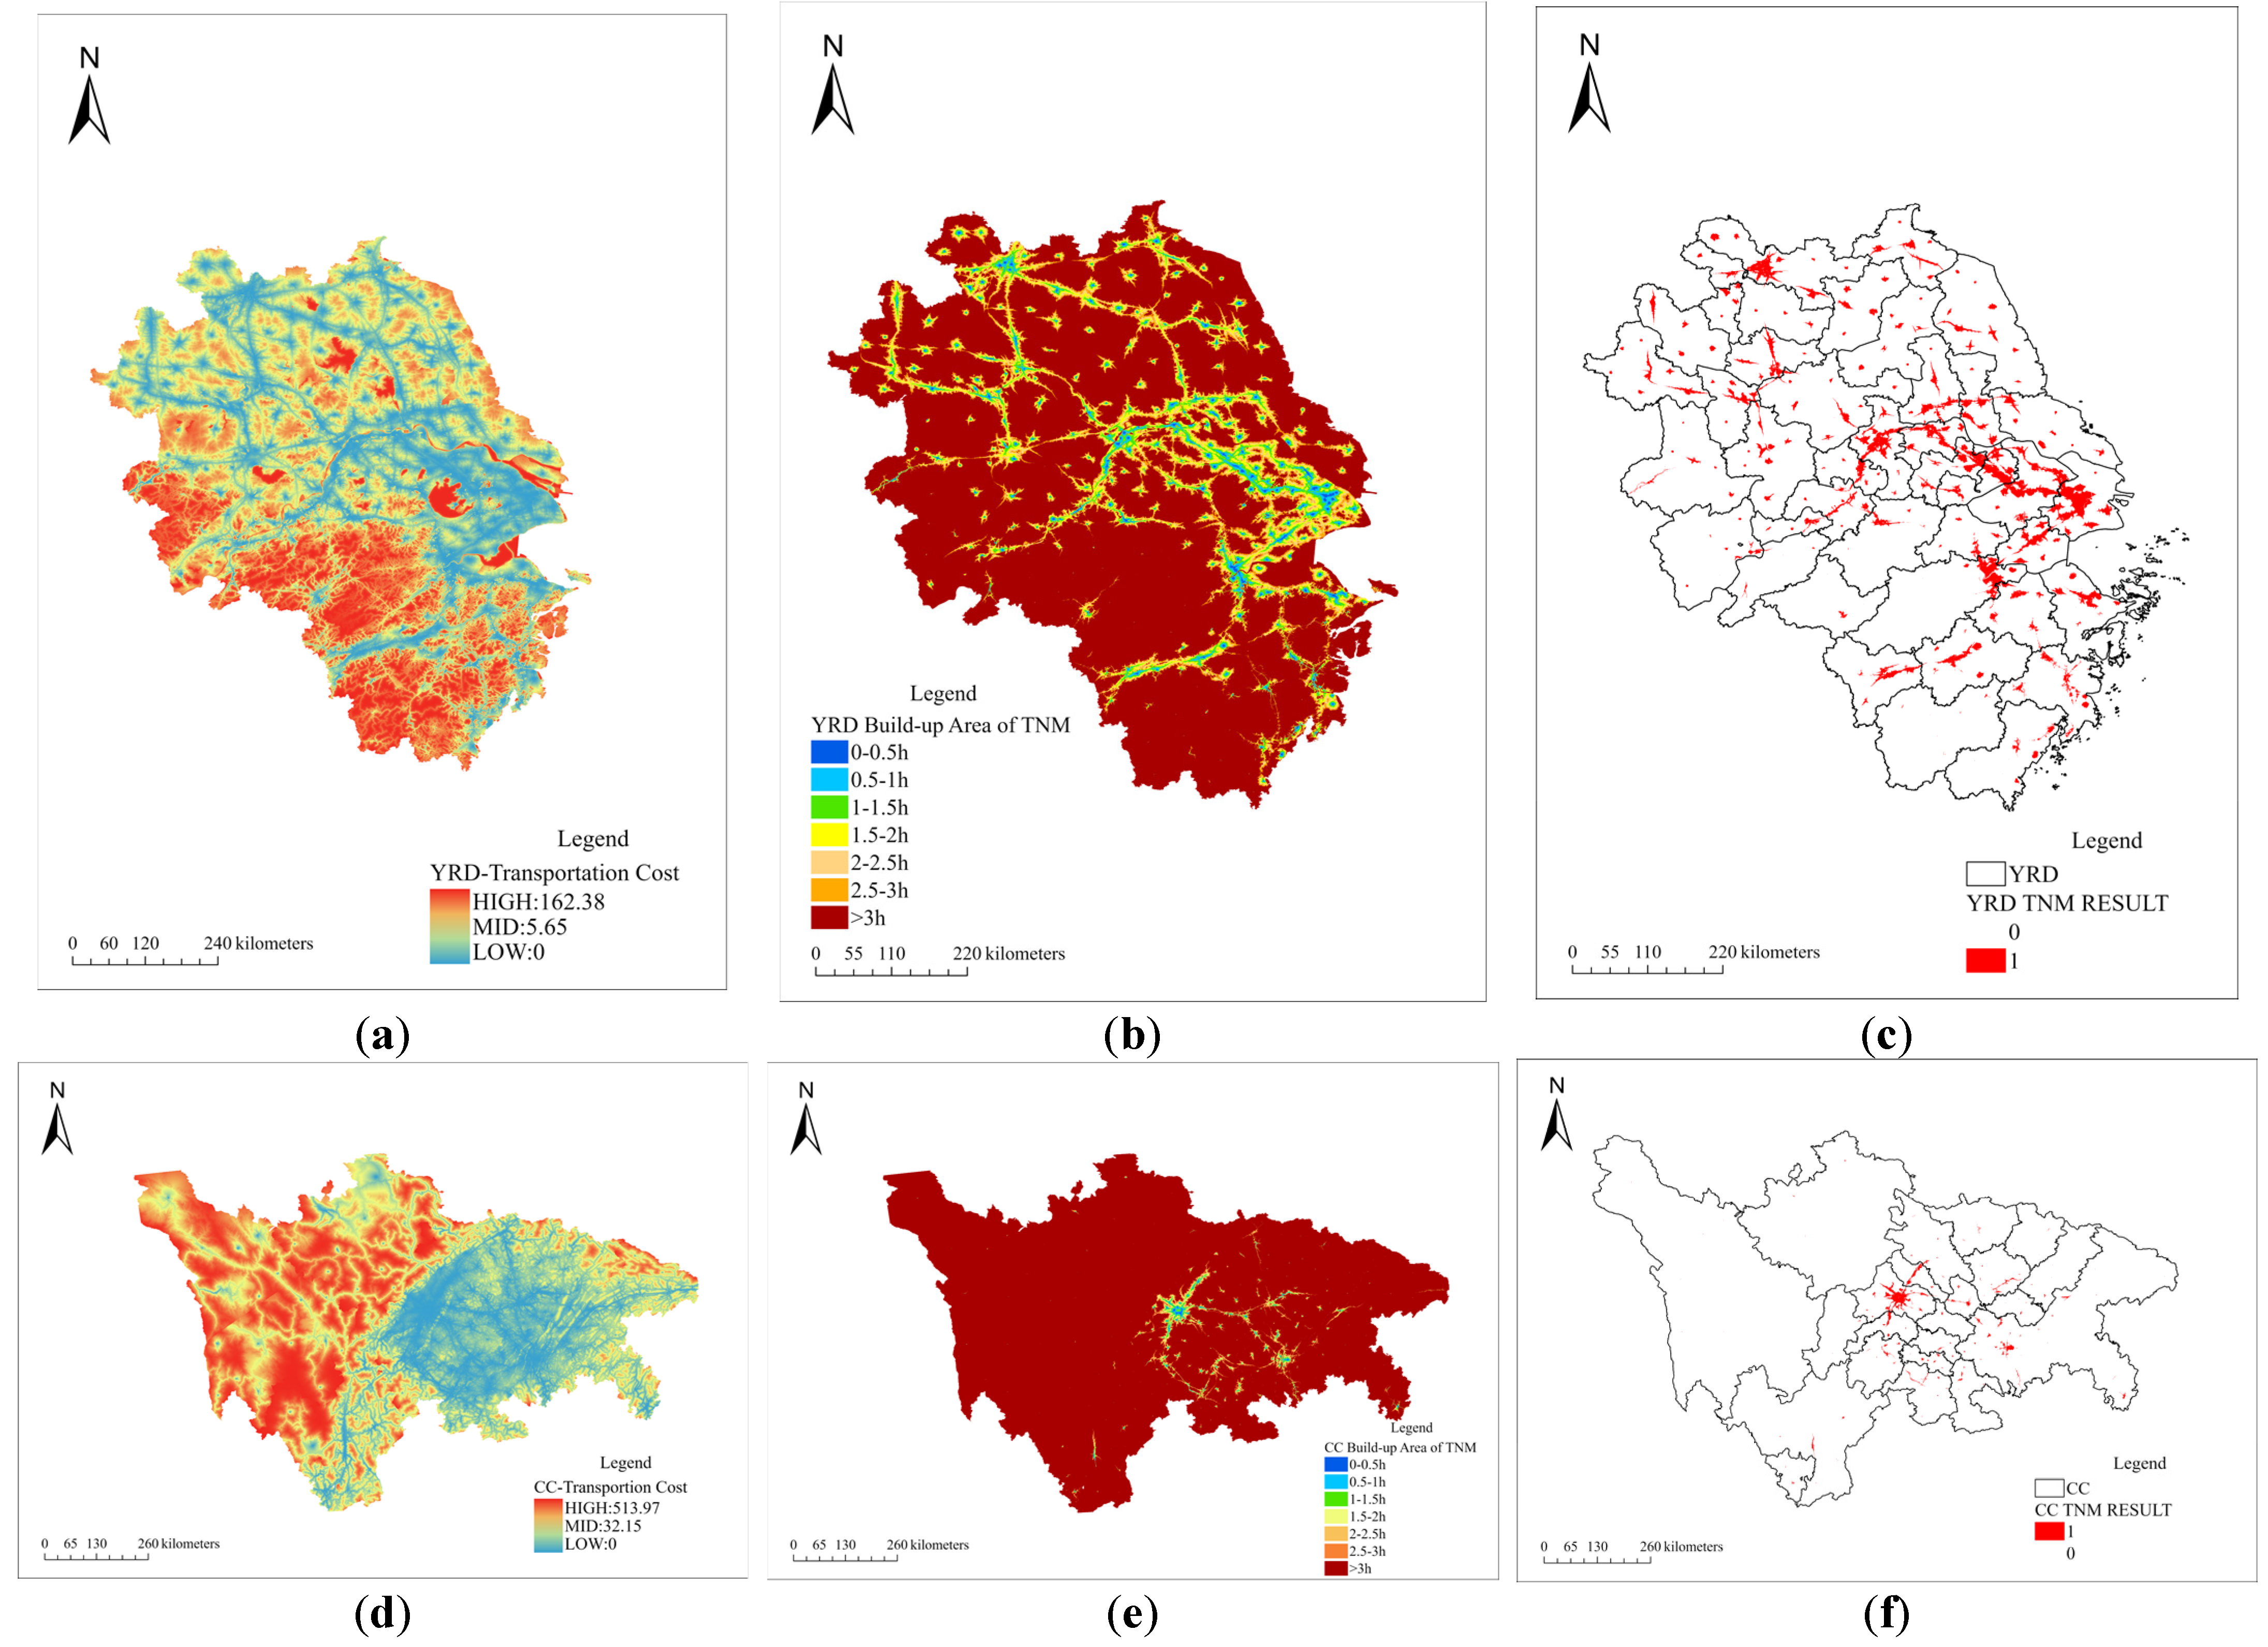
2.3.3. Recognition Method Based on Traffic Road (TRM)

In this study, the cost-distance algorithm is used to measure the reachability of surface space in terms of time cost. The transportation network of urban agglomeration mainly includes railways, highways, expressways, national highways, provincial highways and other roads. Given the closed nature of the railway, it is necessary to “wrap” them, which includes enclosing the said road layer by building barrier layers on both sides of the line. Specifically, the grid speed value within the 500 m buffer of the railway is defined as 1 km/h, which indicates that the closed road cannot be passed directly. In addition, on both sides of the enclosed railway, high speed values are provided. In order to obtain a closed layer with open entrances and exits, this study adopted a railway station buffer to “erase” the closed road buffer, which indicates that the line can only be connected to the outside world through the entrance and exit of the railway station. Then, according to the existing research, the traffic speed is assigned to the traffic network layer, which is shown in Table 1). Each city in the study area is loaded as a target node and the minimum cumulative cost distance from each grid to the nearest target is calculated, which represents the spatial accessibility within the urban agglomeration. Finally, the corresponding urban built-up area is extracted based on the isochronous map.

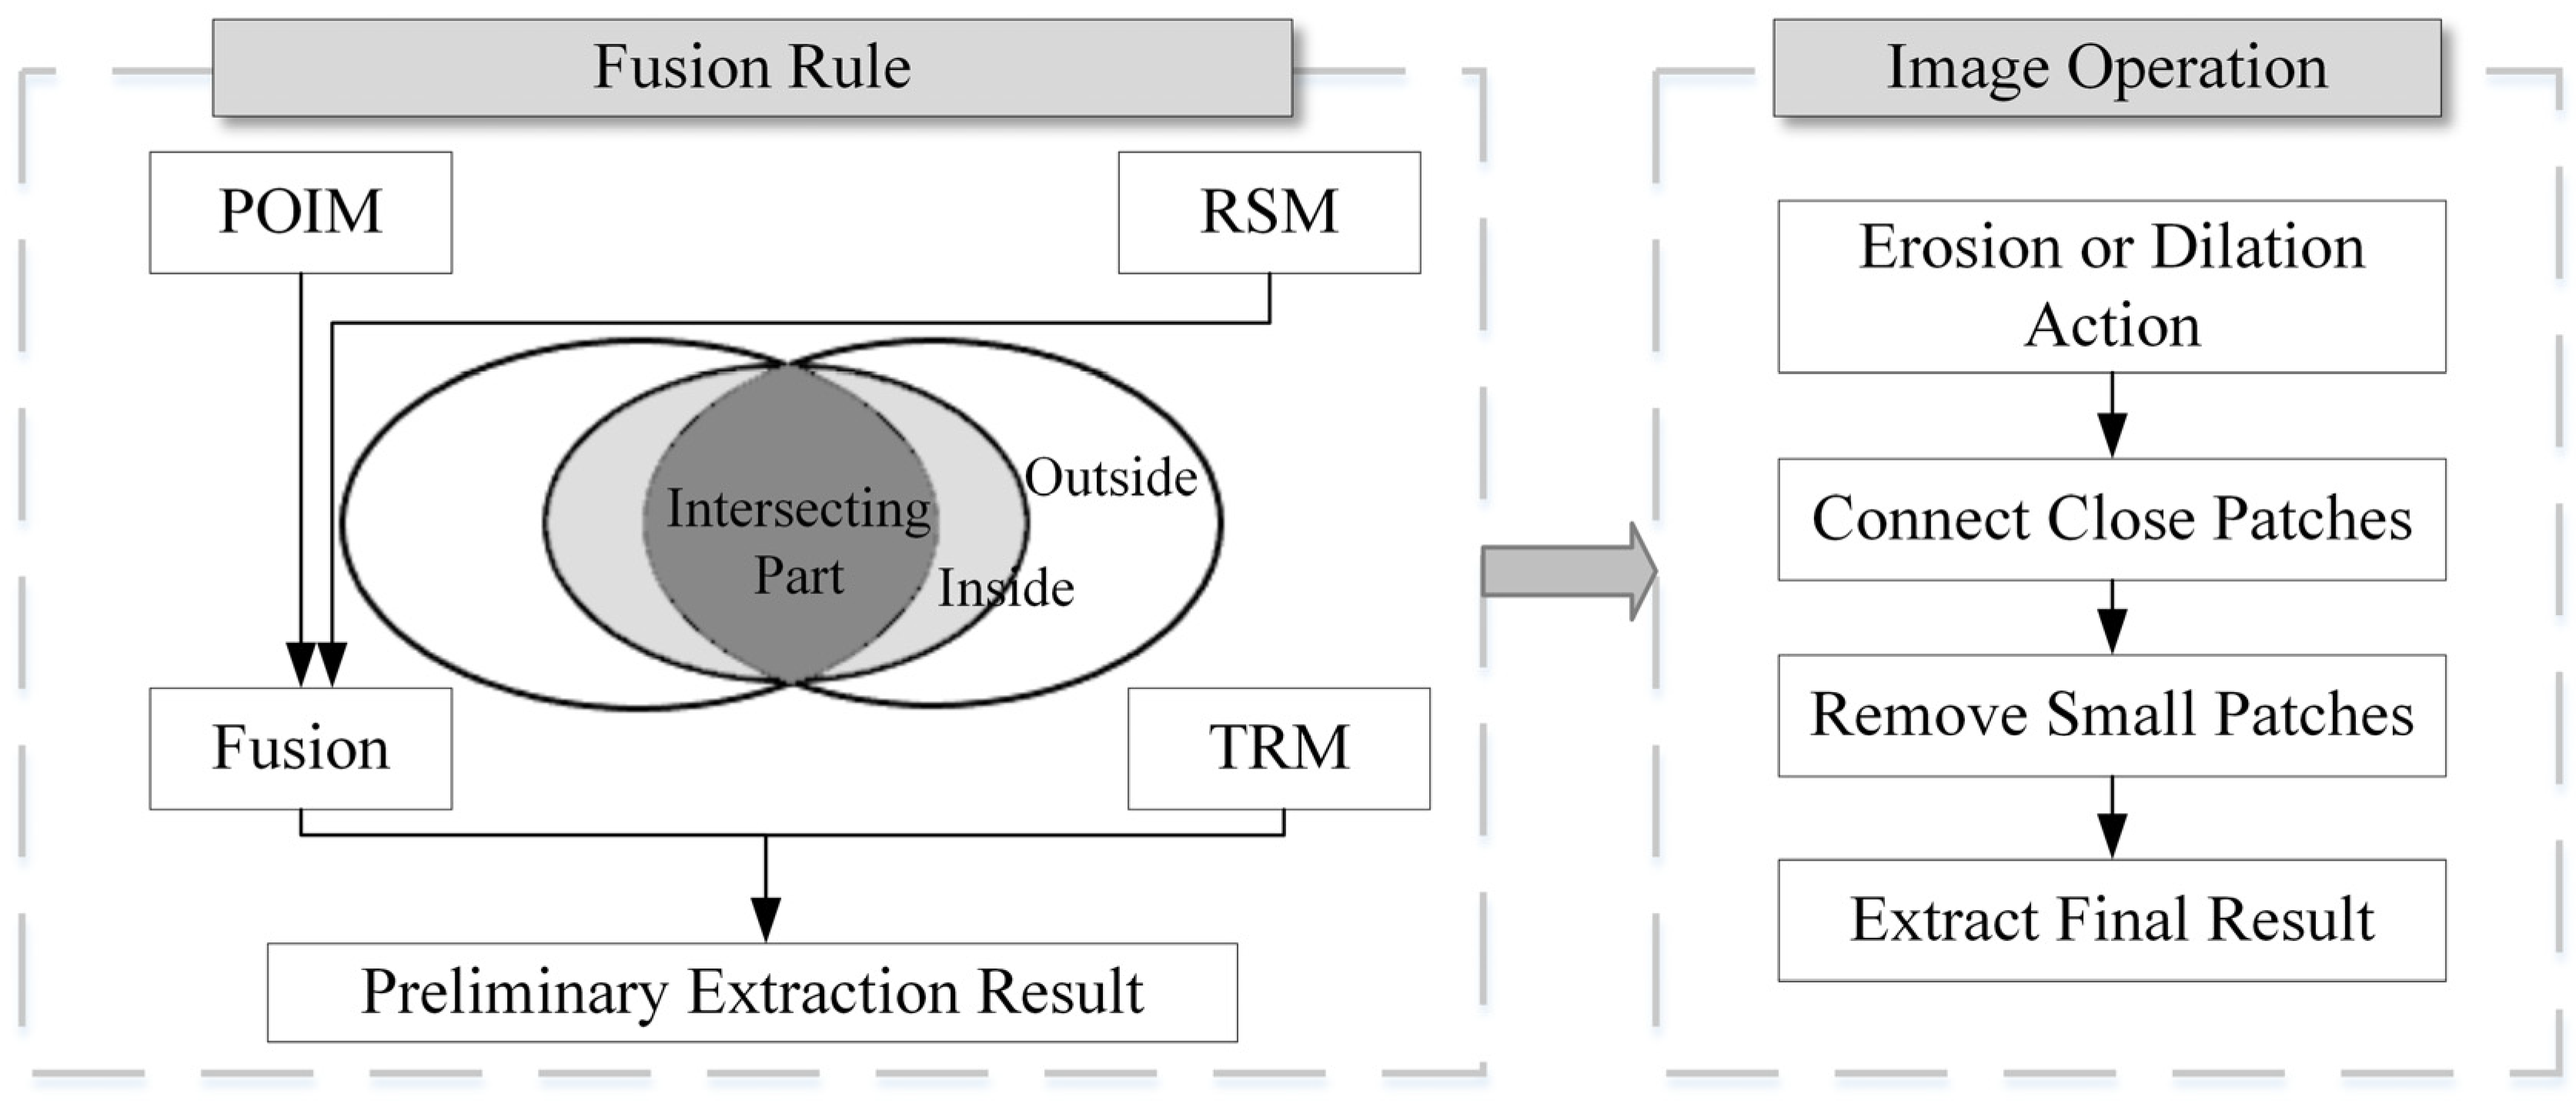
2.3.4. Fusion Method of Multi-Source Data Extraction Results

The built-up area boundary extracted from POI data, night light data, and traffic data is superimposed. The built-up area extracted from POI data is fragmented, but the boundary is smooth and rich in detail. The built-up area extracted by night light data has good integrity, but the boundary shows an obvious zigzag shape due to the limitation of resolution. The built-up area data extracted from traffic data has good coherence, generally showing linear distribution, and the boundary is tortuous and complicated. In this study, the mathematical morphology method is used to combine the extraction results of the three kinds of data, combine the advantages of the three methods, make up for the shortcomings, and get a more accurate built-up area. The fusion and validation rules are shown in Figure 4.
The raster images obtained by three methods are overlaid using the principle of Formula (4). Among them, S i represents the extracted raster image of the built-up area.
S fusion = S POIM + S RSM + S TRM 3
Subsequently, local adjustments and improvements were made using morphological algorithms, mainly including boundary expansion, intersection merging, and the removal of smaller patches. In order to facilitate the connection of closely spaced built-up patches, this study used the dilate algorithm and set a cross shape with structural elements of 3 * 3. The inflation algorithm follows Formula (5), and its main idea is to drag the structural element to move in the image domain X. At each position, when the center point of structural element B is shifted to a point (x, y) on image X, if the pixel of the structural element intersects with at least one pixel of the target object, the (x, y) pixel points are retained to achieve the effect of expanding the boundary outward (Figure 5).
S = X B = { x , y | B x y X φ }
An example of the crossover and merge algorithms is shown in Figure 6. The results of the three methods are combined pairwise, and then intersected and merged with the results of the third method. This algorithm can effectively optimize the structure of built-up areas, retain details, and remove surrounding pseudo-built-up areas.

2.3.5. Accuracy Test Method

In this study, China’s urban built-up area data (http://www.resdc.cn accessed on 30 January 2024) produced by high-precision data sources and high-precision data products were used as the test reference data.
Overall accuracy (OA) is the percentage of the number of all random points successfully verified. The Kappa coefficient of consistency test can be used to measure the accuracy of classification.
Spatial consistency is assessed by comparing the classification results for a particular location with the corresponding points of the reference data. In this study, the representative Kappa coefficient and overall accuracy (OA) were selected as evaluation indexes of confusion matrix to evaluate accuracy. Kappa coefficient and OA are calculated as follows:
Δ = ( TP + FP ) ( TP + FN ) + ( TN + FP ) ( TN + FN )
KAPPA = N ( TN + FP ) N 2 Δ
OA = ( TN + TP ) N
In the formula, TP is the number of points in the correct built-up area part of the extraction result, FP is the number of points in the wrong part of the extraction result, FN is the number of points in the missing pixel extraction result, and TN is the number of points in the non-built-up area part of the extraction result.

3. Results

3.1. Identification Result

The results of the POIM are presented in Figure 7. The built-up area of YRD is 8012.73 km 2 , while the built-up area of CC is 3035.85 km 2 . Based on an analysis of the built-up area boundaries of prefecture-level cities in China, a growth rate of 5% has been determined as the allowable value for the Density-Graph curve. As depicted in the figure, YRD reached a critical point when the nuclear density value was 42, whereas CC reached a critical point at a nuclear density value of 24. In YRD, due to a higher concentration of points of interest around Shanghai, the identification results indicate that the built-up area is more connected. Conversely, the built-up areas in CC are mostly scattered.
The RSM results are shown in Figure 8. The built-up area of YRD is 11,592.07 km 2 , and the built-up area of CC is 4755.95 km 2 . We can find that the extraction results of built-up areas have a strong correlation with NPP-VIIRS data. At the same time, natural land cover also affects the actual distribution of built-up areas, especially in CC.
The TRM results are depicted in Figure 9, showing that the built-up area of YRD is 19,353.18 km 2 and that of CC is 3903.62 km 2 . The transportation road infrastructure in YRD is well developed, providing accessibility to the transportation network, with a median travel time cost of 5.65 h for the entire region. In contrast, the transportation road infrastructure in CC is primarily concentrated in the Chengdu–Chongqing economic circle and it is still undergoing gradual improvements to its transportation network. The median travel time cost for this area is 32.15 h. The extended travel time within the CC can be mainly attributed to the complex landform in western Sichuan province.

3.2. Fusion Result

In this study, an image morphology algorithm combined with a rational intersection algorithm was utilized for multi-source fusion (Figure 10). Following integration, the built-up area in YRD is 17,560.15 km 2 and the area in CC is 4224.07 km 2 . The comparison between high-precision verification set and fusion results shows that the distribution of built-up areas is basically consistent. However, in the surrounding regions of economically developed cities such as Shanghai and Chongqing, the identified built-up area results exceed those of the verification set.
We employed the method of randomly sampling points within the region to validate the accuracy. In order to ensure the comprehensiveness and reliability of the experiment, 3000 and 10,000 random points were used, respectively. The average value was obtained through multiple samples and the results are presented in Table 2 and Table 3. The data indicate that in CC, the correct extraction rate of the four methods can exceed 95% at 3000 random points. Additionally, the correct extraction rate of RSM and fusion method can surpass 90% at 10,000 random points. In contrast, the correct extraction rate in YRD at 3000 random points is over 91% for all methods except TRM. However, only the fusion method achieves a correct extraction rate of more than 80% at 10,000 random points. Overall, the correct extraction rate of the fusion method is higher than that of any single method.
When comparing three single-dimension methods, it is evident that RSM has the highest correct extraction rate while TRM has the lowest. The results demonstrate that in this study, all four extraction methods performed better in CC compared to YRD.
This study addresses classification issues in data science, emphasizing the importance of evaluating the performance of the research model. Therefore, accuracy (OA), precision (P), recall rate (R), F1 score, and Kappa coefficient are selected as measures to assess the effectiveness of the model. Expect for the R-value, a higher value for each index indicates more accurate extraction results. The P-value represents the accuracy rate, while the R-value represents the recall rate; these two values are often contradictory, with F1 representing a balance between them. According to the findings presented in Table 4 and Table 5, the extraction method utilized in this study can take both recall and precision into account. The average overall accuracy (OA) of the first three methods is, respectively, 86.08%, 90.12% and 80.96%, and the average Kappa coefficient is, respectively, 0.5646, 0.7132 and 0.4112. After data fusion, the average overall accuracy (OA) is 91.35%, and the average Kappa coefficient is 0.7501. The performance effect of this research method in CC is better than that in YRD. The average precision rate in CC is 96.03%, and the average recall rate is 82.03%. The average precision rate in YRD is 80.33%, and the average recall rate is 70.80%. The F1-value reaches 0.89 in CC and 0.77 in YRD. It is evident that combining three dimensions through the fusion method yields superior extraction effects on various measurement indicators compared to the single dimension method. Notably, in CC, the Kappa coefficient of the fusion method exceeds 0.85, indicating nearly complete consistency in extraction results, while in YRD, it exceeds 0.61, signifying highly consistent extraction results.

4. Discussion

4.1. Comparison with Previous Studies

This study employs a multi-source data fusion method to identify the built-up areas of representative urban agglomerations in eastern and western China. After analyzing the advantages and disadvantages of various data types and methods, GIS and image-processing technology are utilized for data fusion. Random point verification further confirms that the data fusion method is more accurate than the single-dimension method and more effective in identifying urban agglomeration. The results of this study align with previous research findings. Wang et al. [42] discovered that the average Kappa coefficient of the results of multi-method fusion can reach 0.7394, which accurately reflects the geographical scope of the three major urban agglomerations in China. He et al. [43] found that fusing multi-source big data can help accurately evaluate polycentric spatial structure within urban agglomeration.
Compared to prior studies, this research takes into account triple attributes of the built-up area, including land cover, land use, and convenient transportation, forming a multi-source data fusion identification method. By combining the advantages of these three methods, it compensates for shortcomings while considering integrity and extracting details to obtain a more accurate built-up area scope. The boundary of built-up area for YRD and CC is determined from multiple angles, addressing issues where a single index cannot accurately reflect internal heterogeneity at an urban edge. According to the experimental results, we can find that the built-up area extracted in this study is highly consistent with the area shown in the Chinese urban built-up area dataset, but the built-up area extracted in the experiment has higher adhesion and closer spatial connection. In the comparison of various methods, it is found that the accuracy of built-up area extracted by RSM and POIM is higher than TRM. Therefore, combined with the theoretical model and practical exploration, the built-up area has a strong correlation with social and economic factors such as POI and population activities, and the influence of intra-city traffic road network on the built-up area is limited.
In terms of verification accuracy, there is a certain difference in the accuracy between CC and YRD. The difference falls within a reasonable range. According to existing studies, Li Fei et al. [27] utilized the fusion of NTL and POI data to achieve an 81% accuracy rate in the built-up area of Nanjing. Zhu Ling et al. [44] compared the built-up area of Southern Jiangsu urban agglomeration extracted by different smoothing methods and threshold methods with luminous remote sensing data, finding that the average overall accuracy of the different smoothing method and the threshold method was 84.36% and 84.40%, respectively. It was observed that the overall accuracy of the Yangtze River Delta region does not exceed 85%. Wang Han et al. [37], on the other hand, used integrated luminous remote sensing data to identify built-up areas in Chengdu–Chongqing, with an average overall accuracy of 92.9%, indicating that the overall accuracy of Chengdu–Chongqing area can reach more than 90%.
Furthermore, Wang et al. [42] employed glow-in-the-dark remote sensing and POI data fusion methods to extract built-up areas from Beijing–Tianjin–Hebei, Yangtze River Delta, and Guangdong–Hong Kong–Macao Greater Bay Area city clusters, resulting in overall accuracies of 90.11%, 81.4%, and 84.52%, respectively. There is evidence suggesting that the identification accuracy of the built-up area within Yangtze River Delta urban agglomerations is lower than that of other urban agglomerations. We aim to understand this issue by analyzing both advantages and disadvantages associated with research methods. The POIM and RSM use index values corresponding to the sudden increase in urban cluster areas as segmentation thresholds for extraction models. Such an extraction model is more suitable for monocentric urban areas. However, its applicability to polycentric urban areas is doubtful since the results are likely to be larger than the actual urban clusters [45]. Given high levels of integration within Yangtze River Delta urban agglomerations along with significant multi-center development trends, the definition of such urban agglomerations should be carried out in a comprehensive and integrated way, and comprehensive simulation should be further strengthened, combining social, economic and natural indicators with the advantages of gravity models.

4.2. Contributions to the Urban Agglomerations in China

4.2.1. Planning Suggestions for the CC Urban Agglomeration

Based on the research findings, it is evident that the distribution of built-up areas in the Chengdu–Chongqing urban agglomeration follows a peripheral expansion pattern around the dual-core cities. In order to ensure sustainable development of the urban agglomeration, it is imperative to prevent haphazard expansion of core cities and avoid wastage of resources. Governments should strive for unified planning and industrial layout, consciously adjust existing industrial structures, and promote complementary functions between core cities and neighboring cities within the urban agglomeration. Additionally, there is a need for improvement in transportation infrastructure within the Chengdu–Chongqing region. Compared with economically developed urban clusters such as the Yangtze River Delta and Pearl River Delta, the construction of the one-hour commuting circle between and within the Chengdu–Chongqing region is still in an underdeveloped stage. To enhance internal connectivity within the urban agglomeration, future planning efforts should focus on establishing Chongqing and Chengdu as dual cores with a well-designed transportation layout that includes intercity and urban networks to facilitate smooth passenger and freight transportation channels.

4.2.2. Planning Suggestions for the YRD Urban Agglomeration

We can see that the built-up areas in the YRD are distributed with multiple cores, strong in the east and weak in the west based on the research results. This indicates that the Yangtze River Delta urban agglomeration has already achieved world-class status. Therefore, further planning for the YRD should focus on enhancing the urban level and core competitiveness, with a specific emphasis on constructing “five centers” of international economy, finance, trade, shipping, and technological innovation. The aim is to play a leading role in economic development, shared development, open and coordinated development, as well as innovative development. This will ultimately enhance Shanghai’s comprehensive strength as the core of the urban agglomeration and lead integrated development across the entire YRD region.
In conjunction with the “Outline of the Yangtze River Delta Regional Integration Development Plan”, there are numerous measures that can be optimized for improving the YRD urban agglomeration. The formation of a “One-Hour Urban Agglomeration” within this region has made transportation relatively convenient. However, addressing shortcomings such as leading cities that have abundant advantageous resources but large population bases, while developing cities have relatively sufficient per capita ownership but lack advantageous resources requires further strengthening professional talent flow within the region and promoting balanced resource distribution. Furthermore, regional integration development necessitates clear industrial division of labor among cities at all levels to achieve common development and prosperity throughout all member entities in this region. It is suggested to take innovation as a new development engine, such as giving full play to the vitality of innovation and development of cities in Zhejiang, and using rapidly developing big data, cloud computing and other technologies.
In general, the YRD urban agglomeration should be “leading the development, making up for the shortcomings,” with “interconnection, and comprehensive integration” as the goal.

4.2.3. Contributions to the Overall Planning in China

This article explores methods for improving the identification of built-up areas from three dimensions: socio-economic, natural surface, and transportation network. These dimensions correspond precisely to the development of industrial clusters, human activities, and transportation planning in urban agglomerations. This inspires us to consider the development of Chinese urban agglomerations [46,47,48].
Firstly, the development of urban agglomerations in China should be based on the characteristics of each region and carry out sustainable spatial planning strategies tailored to local conditions. Attention should be paid to the rational layout of different land uses in urban agglomerations. Furthermore, it is important to optimize the “Ecological–Production–Living” space of urban agglomerations, achieve clear mountains and clear waters in their ecological space, create intensive and efficient production spaces, as well as livable and comfortable living spaces. Ultimately, our goal is to build urban agglomerations into key and exemplary areas for high-quality economic and social development while also prioritizing high-level ecological environment protection.
Secondly, this study found that the status and form of urban transportation networks significantly affect the spatial effects of high-quality economic development in urban agglomerations with certain differences among them. Therefore, based on current intercity passenger flow and logistics situations within various urban agglomerations, we need to focus on achieving comprehensive coverage of intercity transportation networks; strengthen multi-point layout; prioritize connections within urban transportation systems; integrate station cities; and promote a low-carbon and efficient green distribution model.

4.3. Limits and Prospects

The development of and change in the built-up areas of urban agglomerations in China have attracted extensive attention from scholars at home and abroad. It is believed that the local spatial dynamics of eastern China tend to be stable, while the local spatial dynamics of central and western China are beginning to increase [39,49]. In this study, we utilize multi-source open spatiotemporal data to investigate the built-up areas of representative urban agglomerations in both eastern and western China. This broadens the scope of the original research and addresses a gap in relevant research on urban agglomerations in central and western China. However, there are two major limitations in this study. Firstly, factors such as GDP, POI density, population density, and night lighting vary significantly among urban agglomerations. This may lead to a one-size-fits-all problem in threshold analysis of built-up areas around megacities or regional core cities [50,51,52]. Therefore, it is necessary to further verify whether this method is applicable to urban agglomerations with large differences in development levels. Additionally, further improvements are needed for the classification and extraction of various threshold indicators. Secondly, there is also a need to enhance data quality and ensure accuracy, timeliness, and sustainability of data. For example, through the use of unmanned aerial vehicles (UAVs), autonomous vehicles, and other equipment for measuring urban ground construction, multi-angle high-dynamic imaging technology can play a practical role in detailed update monitoring of urban agglomeration.

5. Conclusions

We aim to explore a method for extracting the built-up area of urban agglomerations based on multi-source data and constructing a rule that can integrate multi-source data reasonably considering the characteristics of the built-up area. The Density Graph analysis of POI was utilized to extract the built-up area based on socio-economic levels, resulting in an overall accuracy rate (OA) of 91.27% in the Chengdu–Chongqing region and 80.90% in the Yangtze River Delta region. Additionally, by using NPP-VIIRS luminous remote sensing data combined with LST and NDVI index, we constructed a unique LVTD coefficient and analyzed thresholds by combining urban statistical yearbooks. Taking into consideration population distribution, land cover, and human activities, we achieved an overall accuracy (OA) of 95.50% in the Chengdu–Chongqing region and 84.74% in the Yangtze River Delta region. Furthermore, utilizing network data from OSM and railway station data in China, we calculated minimum cumulative time costs using raster analysis algorithms to extract built-up areas according to accessibility values while considering accessibility and connectivity factors. This approach resulted in an overall accuracy rate (OA) of 88.51% in the Chengdu–Chongqing area and 73.42% in the Yangtze River Delta area. Through numerous experiments, adjustments were made to further explore methods for fusing multi-source data. By verifying algorithm accuracy on high-precision datasets, our fused method achieved an overall accuracy of 91.35% with a Kappa coefficient of 0.75. This precision result is higher than the overall accuracy of 85.34% and the Kappa coefficient of 0.7394 of the built-up areas of the three major urban agglomerations studied by Wang et al. [42].
The method proposed in this paper partially addresses the limitation of using a single data source for built-up area extraction. It is particularly suitable for urban agglomeration scenarios that demand high extraction accuracy and scientific rigor. The method relies on heavy remote sensing imagery, requires access to recent luminous remote sensing data, depends on fast updates of POI data, and necessitates high openness of traffic network data to ensure the timeliness of built-up area extraction [53,54,55]. The fusion extraction rule established in this paper offers a more comprehensive approach to extracting built-up areas, allowing for a more holistic reflection of regional construction, development, and public facilities [56]. However, as this approach is predicated upon the distribution of economic population, characteristics of land cover, and features of the traffic network to identify built-up areas, it not only boosts accuracy but also brings forth challenges pertaining to low efficiency in extraction. According to the prevailing method model, it is arduous to fully achieve the tight connection and vigorous interaction between cities and towns in urban agglomerations. Such a connection is not merely reflected in the economy, land utilization and transportation, but also in numerous aspects such as history, society and culture [57,58]. Moreover, factors like GDP, population density, and night lighting vary significantly among cities, which might influence the precise matching of data and the detailed manifestation of various data features after fusion. As a result, subsequent studies are indispensable to further validate whether the proposed method is applicable to urban agglomerations at different development levels. Additionally, there might be insufficient index analysis for urban agglomerations in various stages of development, which could have an impact on the applicability of this method in highly developed urban agglomerations. Future research should center on fine-tuning integration regulations and conducting application studies in urban agglomerations of different scales to further enrich the theory and methodology of urban built-up area extraction [59,60].

Author Contributions

Conceptualization, G.Y. and S.C.; methodology, X.L., G.Y. and S.C.; software, X.L.; validation, X.L.; formal analysis, X.L.; investigation, X.L.; resources, X.L., G.Y. and S.C.; data curation, X.L.; writing—original draft preparation, X.L.; writing—review and editing, X.L., G.Y. and S.C.; visualization, X.L.; supervision, G.Y. and S.C.; project administration, S.C. All authors have read and agreed to the published version of the manuscript.

Funding

This research received no external funding.

Data Availability Statement

All supporting data are cited within the Section 2 Materials and Methods.

Conflicts of Interest

The authors declare no conflict of interest.

References

  1. Tan, M.; Lu, C. Distribution of China City Size Expressed by Urban Built-up Area. Acta Geogr. Sin. 2003, 58, 285–293. [Google Scholar]
  2. Fang, C. Progress and the future direction of research into urban agglomeration in China. Acta Geogr. Sin. 2014, 69, 1130–1144. [Google Scholar]
  3. Tan, M.; Li, X.; Lu, C. Analysis of the driving force of urban land expansion in China. Econ. Geogr. 2003, 23, 5. [Google Scholar] [CrossRef]
  4. Fang, C. The Basic Law of the Formation and Expansion in Urban Agglomerations. Geogr. Sci. 2019, 29, 1699–1712. [Google Scholar] [CrossRef]
  5. Mei, Z. Research on the delineation method of built-up area under territorial spatial planning. In Urban Planning Society of China. People’s City, Planning Empowerment—Proceedings of China Urban Planning Annual Conference; Urban Planning Society of China: Beijing, China, 2022; Volume 2023, p. 8. [Google Scholar]
  6. Shi, K.; Huang, C.; Yu, B.; Yin, B.; Huang, Y.; Wu, J. Evaluation of NPP-VIIRS Night-Time Light Composite Data for Extracting Built-up Urban Areas. Remote Sens. 2014, 5, 358–366. [Google Scholar] [CrossRef]
  7. Hu, T.; Huang, X.; Li, D.; Jin, S.; Yan, Q. Comprehensive evaluation of the urban built-up areas mapping ability from Luojia 1-01 nighttime light imagery over China. Acta Geod. Cartogr. Sin. 2023, 52, 432–442. [Google Scholar]
  8. Ascher, C.S.; Geddes, P. The Outlook Tower Association, E. Cities in Evolution. Land Econ. 1951, 27, 83–84. [Google Scholar] [CrossRef]
  9. O’Neill, P. Global city-regions: Trends, theory, policy. Area 2003, 35, 326–327. [Google Scholar] [CrossRef]
  10. Yu, Q.; Li, M.; Li, Q.; Wang, Y.; Chen, W. Economic agglomeration and emissions reduction: Does high agglomeration in China’s urban clusters lead to higher carbon intensity? Urban Clim. 2022, 43, 101174. [Google Scholar] [CrossRef]
  11. Denis, P.-Y. Hall, Peter (1984) The World Cities. London, Weidenfeld and Nicolson, Third Edition, 276 P. Cahiers Géographie Québec 2012, 29, 441. [Google Scholar] [CrossRef]
  12. Ning, Y.-M. Definition of Chinese Metropolitan Areas and Large Urban Agglomerations: Role of Large Urban Agglomerations in Regional Development. Sci. Geogr. Sin. 2011, 31, 257–263. [Google Scholar]
  13. Xu, Z.; Gao, X. A novel method for identifying the boundary of urban built-up areas with POI data. Acta Geogr. Sin. 2016, 71, 928–939. [Google Scholar]
  14. Bode, E. Delineating metropolitan areas using land prices. Reg. Sci. 2010, 48, 131–163. [Google Scholar] [CrossRef]
  15. Li, K.; Niu, X. Delineation of the Shanghai Megacity Region of China from a Commuting Perspective: Study Based on Cell Phone Network Data in the Yangtze River Delta. Urban Plan. Dev. 2021, 147, 04021022. [Google Scholar] [CrossRef]
  16. Bosker, M.; Park, J.; Roberts, M. Definition matters. Metropolitan areas and agglomeration economies in a large-developing country. Urban Econ. 2021, 125, 103275. [Google Scholar] [CrossRef]
  17. Zhen, F.; Cao, Y.; Qin, X.; Wang, B. Delineation of an urban agglomeration boundary based on Sina Weibo microblog ‘check-in’ data: A case study of the Yangtze River Delta. Cities 2017, 60, 180–191. [Google Scholar]
  18. Chen, J.; Zhuo, L.; Shi, P.; Toshiaki, I. The Study on Urbanization Process in China Based on DMSP/OLS Data: Development of a Light Index for Urbanization Level Estimation. J. Remote Sens. 2003, 3, 168–175. [Google Scholar]
  19. Mu, F.; Zhang, Z.; Chi, Y.; Liu, B.; Zhou, Q. Dynamic Monitoring of Built-up Area in Beijing during 1973–2005 Based on Multi-original Remote Sensed Images. J. Remote Sens. 2007, 2, 257–268. [Google Scholar]
  20. Lou, G.; Chen, Q.; He, K.; Zhou, Y.; Shi, Z. Using Nighttime Light Data and POI Big Data to Detect the Urban Centers of Hangzhou. Remote Sens. 2019, 11, 1821. [Google Scholar] [CrossRef]
  21. Liu, X.; Zhang, P.; Shi, X. Industrial Agglomeration, Technological Innovation and High-quality Economic Development: Empirical Research based on China’s Five Major Urban Agglomerations. Reform 2022, 4, 68–87. [Google Scholar]
  22. Fang, C.; Zhou, C.; Wang, Z. Sustainable development strategy and priorities of spatially differentiated development of urban agglomerations along the Yangtze River Economic Belt. Prog. Geogr. 2015, 34, 1398–1408. [Google Scholar]
  23. Song, J.; Fang, C.; Song, D. Spatial Structure Stability of Urban Agglomerations in China. Acta Geogr. Sin. 2006, 61, 1311–1325. [Google Scholar]
  24. Yao, Z.; Tu, J.; Niu, H.; Ha, L.; Li, J. The Research on Urban Agglomeration Spatial Structure of Cheng-Yu Economic Zone. Econ. Geogr. 2017, 37, 82–89. [Google Scholar]
  25. Hu, S.; Tong, L.; Amy, E.F.; Liu, Y. Urban boundary extraction and sprawl analysis using Landsat images: A case study in Wuhan, China. Habitat Int. 2015, 47, 183–195. [Google Scholar] [CrossRef]
  26. Zhao, W.; Li, Q.; Li, B. Extracting hierarchical landmarks from urban POI data. J. Remote Sens. 2011, 15, 973–988. [Google Scholar]
  27. Li, F.; Yan, Q.; Zou, Y.; Liu, B. Extraction Accuracy of Urban Built-up Area Based on Nighttime Light Data and POI: A Case Study of Luojia 1-01 and NPP/VIIRS Nighttime Light Images. Geomat. Inf. Sci. Wuhan Univ. 2021, 46, 825–835. [Google Scholar]
  28. Luqman, M.; Rayner, P.J.; Gurney, K.R. Combining Measurements of Built-up Area, Nighttime Light, and Travel Time Distance for Detecting Changes in Urban Boundaries: Introducing the BUNTUS Algorithm. Remote Sens. 2019, 11, 2969. [Google Scholar] [CrossRef]
  29. Meng, Y.; Zhou, S.; Nie, Y.; Zeng, H.; Yu, J. Spatial Delimitation of the Urban-Rural Fringe Based on POI and Nighttime Light Data: A Case Study of Wuhan City. Geomat. Inf. Sci. Wuhan Univ. 2023. [Google Scholar] [CrossRef]
  30. Song, Y.; Jiao, L.; Liu, K.; Xu, G. Analysis of the Factors Affecting the Degree of Urban Expansion: Taking Wuhan City as an Example. Geomat. Inf. Sci. Wuhan Univ. 2021, 46, 417–426. [Google Scholar]
  31. Lin, M.; Shi, Y.; Chen, Y.; Yu, D.; He, Q.; Wang, L. A study on spatial-temporal features of construction land expansion in Changsha urban area. Geogr. Res. 2007, 26, 265–275. [Google Scholar]
  32. Yin, X.; Wei, H.; Li, Y. Identification and spatio-temporal variation of county towns’ built-up area of China based on impervious surface dataset. Geogr. Res. 2023, 42, 1492–1505. [Google Scholar]
  33. Tang, C.; Chen, J.; Xie, Y.; Tang, J.; Zhou, C. Integrated Identification and Spatial Differentiation Mechanism of Urban Built-up Area in Changsha-Zhuzhou-Xiangtan Urban Agglomeration Based on the Multi-source Big Data. Econ. Geogr. 2024, 44, 66–76. [Google Scholar]
  34. Santra, A.; Mitra, S.S.; Sinha, S.; Routh, S. Performance testing of selected spectral indices in automated extraction of impervious built-up surface features using Resourcesat LISS-III image. Arab. J. Geosci. 2020, 13, 1229. [Google Scholar] [CrossRef]
  35. Zhu, Y.; Yao, S. The research of urban special evolution of SuWan belt along the Changjiang River. Econ. Geogr. 1999, 19, 6. [Google Scholar]
  36. Chen, X.; Peng, J.; Liu, Y.; Chen, Y.; Li, T. Measuring spatial expansion and correlations of cities in Beijing-Tianjin-Hebei Urban Agglomeration using DMSP/OLS nighttime light data. Geogr. Res. 2018, 37, 898–909. [Google Scholar]
  37. Wang, H.; Hu, Z.; Li, F.; Zhou, Y. Research on the Spatial-Temporal Process of Urbanization in Chengdu-Chongqing Region based on Nighttime Light from 2000 to 2018. Remote Sens. Technol. Appl. 2022, 37, 897–907. [Google Scholar]
  38. Li, Q.; Zheng, B.; Xiong, Y. Spatio-Temporal Expansion of the Dongting Lake Eco-economic Zone Urban Agglomeration Based on Nighttime Light Remote Sensing Data. Econ. Geogr. 2021, 41, 92–102. [Google Scholar]
  39. Hong, J.; Li, X.; Wei, X.; Jiang, D.; Song, S. Spatial and Temporal Pattern of Urban Built-up Areas in the Yangtze River Economic Belt Based on Data Fusion. Resour. Environ. Yangtze Basin 2021, 30, 2325–2335. [Google Scholar]
  40. Zhao, P.; Jia, T.; Qin, K.; Shan, J.; Jiao, C. Statistical Analysis on the Evolution of OpenStreetMap Road Networks in Beijing. Phys. A Stat. Mech. Its Appl. 2015, 420, 59–72. [Google Scholar] [CrossRef]
  41. Yu, W.; Ai, T. The Visualization and Analysis of POI Features under Network Space Supported by Kernel Density Estimation. Acta Geod. Cartogr. Sin. 2015, 44, 82–90. [Google Scholar]
  42. Wang, G.; Wang, Y.; Li, Y.; Chen, T. Identification of Urban Clusters Based on Multisource Data—An Example of Three Major Urban Agglomerations in China. Land 2023, 12, 1058. [Google Scholar] [CrossRef]
  43. He, X.; Cao, T.; Zhou, C. Evaluation of Polycentric Spatial Structure in the Urban Agglomeration of the Pearl River Delta (PRD) Based on Multi-Source Big Data Fusion. Remote Sens. 2021, 13, 3639. [Google Scholar] [CrossRef]
  44. Zhu, L.; Wang, Y. Built-up Areas Extraction Method of Urban Agglomeration in Southern Jiangsu Based on Nighttime Light Remote Sensing Image. Geospat. Inf. 2023, 21, 44–48. [Google Scholar]
  45. Liu, X.; Ning, X.; Wang, H.; Wang, C.; Zhang, H.; Meng, J. A Rapid and Automated Urban Boundary Extraction Method Based on Nighttime Light Data in China. Remote Sens. 2019, 11, 1126. [Google Scholar] [CrossRef]
  46. Zhou, Y.; Xie, B.; Zhao, H.; Chen, Y.; Pei, T.; Liu, S. Study on Spatial-temporal Pattern and Dynamic Evolution of City Scale at County Level in China Based on Night-time Light Data. Resour. Environ. Yangtze Basin 2019, 28, 250–260. [Google Scholar]
  47. Guan, D.; Yang, W.; Zhou, L.; Deng, Z.; Fan, X. Spatio-temporal characteristics and evolutionary trends of urban sprawl based on measuring the multi-dimensional indicators in the Yangtze River Basin, China. Geogr. Res. 2023, 42, 2940–2964. [Google Scholar]
  48. Ao, Y.; Wu, B.-L.; Bai, Z.-D.; Wang, X.F.; Chen, Z.X. Temporal-spatial Changes of Urban Built-up Area Expansion in Guangdong-Hong Kong-Macao Greater Bay Area, China Based on NPP-VIIRS-like Night Light Data. J. Earth Sci. Environ. 2022, 44, 513–523. [Google Scholar]
  49. GB/T 50280-98; Standard for Basic Terms of Urban Planning. Ministry of Construction of the People’s Republic of China. China Architecture & Building Press: Beijing, China, 1998.
  50. Zhang, Y.; Zheng, F.; Liu, Y.; Liu, Y.; Hu, H.; Xu, P. Extracting Urban Built-up Area Based on Impervious Surface Area and POI Data. Sci. Geogr. Sin. 2022, 42, 506–514. [Google Scholar]
  51. Tan, Y.; Xiong, S.; Li, Y. Automatic extraction of built-up areas from panchromatic and multispectral remote sensing images using double stream deep convolutional neural networks. IEEE J. Sel. Top. Appl. Earth Obs. Remote Sens. 2018, 11, 3988–4004. [Google Scholar] [CrossRef]
  52. Fang, C.; Zhang, G.; Xue, D. High-quality development of urban agglomerations in China and construction of science and technology collaborative innovation community. Acta Geogr. Sin. 2021, 76, 2898–2908. [Google Scholar]
  53. Lin, J.; Wu, K.; Yang, S. Spatial linkage networks and patterns of urban economic efficiency in the perspective of scaling law: A case study of Yangtze River Delta Urban Agglomeration. Acta Geogr. Sin. 2024, 79, 1391–1411. [Google Scholar]
  54. Fang, C. China’s Urban Agglomeration and Metropolitan Area Construction Under the New Development Pattern. Econ. Geogr. 2021, 41, 1–7. [Google Scholar]
  55. Pan, J.; Hu, Y. Measurement of the Efficiency of Coordinated Development of the Four Modernizations for Urban Agglomerations in China. China Popul. Resour. Environ. 2015, 25, 100–107. [Google Scholar]
  56. Feng, Z.; You, S.; You, Z. Spatial identification and structural characteristics of Chinese urban agglomerations based on traffic big data network. Geogr. Res. 2023, 42, 1729–1742. [Google Scholar]
  57. Bouzekri, S.; Lasbet, A.A.; Lachehab, A. A New Spectral Index for Extraction of Built-Up Area Using Landsat-8 Data. J. Indian Soc. Remote Sens. 2015, 43, 867–873. [Google Scholar] [CrossRef]
  58. Shahfahad Mourya, M.; Kumari, B.; Tayyab, M.; Paarcha, A.; Asif; Rahman, A. Indices based assessment of built-up density and urban expansion of fast growing Surat city using multi-temporal Landsat data sets. GeoJournal 2021, 86, 1607–1623. [Google Scholar] [CrossRef]
  59. Yin, D.; Yu, Q.; Shi, Y. Spatial Aggregation Within the Population and the Upgrading of Traditional Industries in the Great Lakes Megalopolis. J. Beijing Adm. Coll. 2022, 89–99. [Google Scholar]
  60. Fafchamps, M.; Shilpi, F. The evolution of built-up areas in Ghana since 1975. PLoS ONE 2021, 16, e0250847. [Google Scholar] [CrossRef] [PubMed]
Figure 1. Yangtze River Delta (YRD) urban agglomeration, Chengdu–Chongqing (CC) urban agglomeration, China.
Land 13 00974 g001
Figure 2. Research technology route.
Land 13 00974 g002
Figure 3. Kernel density estimation analysis and the process of plotting the Densi-Graph curve.
Land 13 00974 g003
Figure 4. Multi-source data fusion and validation rules.
Land 13 00974 g004
Figure 5. This figure describes the principle of the dilate algorithm used in this study.
Land 13 00974 g005
Figure 6. (a,b) The rules of intersection and merging algorithms.
Land 13 00974 g006
Figure 7. (a) Description of YRD nuclear density analysis result; (b) description of YRD Density-Graph curves and threshold point; (c) description of YRD extraction results using RSM method; (d) description of result of CC nuclear density analysis; (e) description of CC Density-Graph Curves and thresholds; (f) description of CC extraction results using RSM method.
Land 13 00974 g007
Figure 8. This is a set of figures. (a,b) Description of NPP-VIIRS data of night light index in two urban agglomerations; (c,d) description of LST data of land surface temperature in two urban agglomerations; (e,f) description of NDVI vegetation coverage in two urban agglomerations; (g,h) description of the built-up area results of two urban agglomerations extracted by RSM.
Land 13 00974 g008
Figure 9. This is a set of figures. (a,b) Description of traffic accessibility distribution map of two urban agglomerations; (c,d) distribution of traffic passage time in two urban agglomerations; (e,f) description of the results of urban built-up areas extracted by TRM in two urban agglomerations.
Land 13 00974 g009
Figure 10. (a,b) Description of the overlay effect of fusion experimental results and high-precision datasets.
Land 13 00974 g010
Table 1. Unit travel speed and cost of different modes of transport.
Road Network TypeSpeed (km/h)Speed Cost (min)Barrier
Railway3000.2Station
Highroad1200.5/
National road, express road800.75
Provincial road601
Township road, county road401.5
Other roads302
Table 2. Results of random point verification in CC.
TypePOIMRSMTRMFusion
TN278492.80%277692.53%276792.23%277692.53%
TP1183.93%1665.53%842.80%1755.83%
FN943.13%461.53%1284.27%371.23%
FP40.13%120.40%210.70%120.40%
TN695669.56%693569.35%693569.35%693269.32%
TP162516.25%235823.58%126312.63%247024.70%
FN140514.05%6726.72%176717.67%5605.60%
FP140.14%350.35%350.35%380.38%
Table 3. Results of random point verification in YRD.
TypePOIMRSMTRMFusion
TN256585.50%254984.97%248382.77%250483.47%
TP1755.83%2377.90%1846.13%2739.10%
FN130.43%290.97%953.17%742.47%
FP2478.23%1856.17%2387.93%1494.97%
TN478747.87%475447.54%474647.46%468046.80%
TP225922.59%290629.06%104810.48%336333.63%
FN292029.20%227322.73%413141.31%181618.16%
FP340.34%670.67%750.75%1411.41%
Table 4. Accuracy set of random point verification in CC.
POIMRSMTRMFusion
300010,000300010,000300010,000300010,000
OA96.7333%85.8100%98.0667%92.9300%95.0333%81.9800%98.3667%94.0200%
P96.7213%99.1458%93.2584%98.5374%80.0000%97.3035%93.5829%98.4848%
R55.6604%53.6304%78.3019%77.8218%39.6226%41.6832%82.5472%81.5182%
F10.70660.69610.85130.86960.53000.58360.87720.8920
Kappa0.69060.61400.84100.82200.50690.49120.86850.8512
Table 5. Accuracy set of random point verification in YRD.
POIMRSMTRMFusion
300010,000300010,000300010,000300010,000
OA91.3333%70.4600%92.8667%76.6000%88.9000%57.9400%92.5667%80.4300%
P41.4692%98.5172%56.1611%97.7464%43.6019%93.3215%64.6919%95.9760%
R93.0851%43.6185%89.0977%56.1112%65.9498%20.2356%78.6744%64.9353%
F10.57380.60470.68900.71300.52500.33260.71000.7746
Kappa0.53330.42040.65100.53870.46510.18150.66780.6127
Disclaimer/Publisher’s Note: The statements, opinions and data contained in all publications are solely those of the individual author(s) and contributor(s) and not of MDPI and/or the editor(s). MDPI and/or the editor(s) disclaim responsibility for any injury to people or property resulting from any ideas, methods, instructions or products referred to in the content.

