Abstract
Assessing the spatiotemporal evolution characteristics of habitat quality, human footprint, and coupling coordination between two systems in continuous cycles and on national scales is of great significance to maintaining biodiversity and sustainable development. This study took China as an example, based on land-use data from 2000 to 2020, using the Integrated Valuation of Ecosystem Services and Tradeoffs—Habitat Quality (InVEST-HQ) model and the human footprint framework, coupling trend analysis methods such as Theil–Sen Median Analysis, Mann–Kendall Test, and Grid Transition Matrix (GTM) Method and combining the four-quadrant model and the coupling coordination degree model (CCDM) to reveal the spatiotemporal evolution characteristics of habitat quality, human footprint, and CCDM in China for 21 consecutive years and the response relationship between the two systems of habitat quality and human footprint. The results show that the land cover change area from 2000 to 2020 accounted for 4.2% of the total area. Both habitat quality and human footprints exhibit apparent spatial heterogeneity along the “Hu Line” and generally fall into two evolutionary stages: “degradation–improvement”. The proportions of degradation and improvement were 14.37% and 8.36%, respectively, and the mutation point was in the year 2013; the average human footprint increased by 16.75%, and the increased and decreased area proportions were 63.40% and 21.53%, respectively. The mutation occurred in 2014. The right side of the “Hu Line” primarily hosts areas with high values of the coordinated coupling index of human footprints and habitat quality systems. The four quadrants generally have the following characteristics: “quadrant IV on the right is dominant, quadrants II and III on the left are dominant, and quadrant I is located in the transition zone of the ‘Hu Line’”. The coupling coordination degree (CCD) and human footprints have a weak, nonlinear “inverted U-shaped” relationship. This study provides compelling evidence for the spatiotemporal evolution and coupling relationship between habitat quality and human footprint in China, provides scientific decision-making support for biodiversity protection and sustainable economic development, and maintains the bottom line of ecological security for a beautiful China.
1. Introduction
Biodiversity is the basis for human survival and development, and the guarantee for sustainable economic development [1,2]. Habitat quality, as an adequate reflection of the level of biodiversity, has an essential impact on human well-being [1], sustainable development [3], ecological security [4], and other fields. In recent decades, human activities such as intensified global climate change and continuous population as well as economic growth have increased the demand for land resources, leading to habitat conversion and loss [4,5,6]. From the perspective of global environmental protection strategies, both “The Aichi Biodiversity Targets” (The Aichi Targets) proposed by COP10 in 2010 [7] and “The Kunming-Montreal Global Biodiversity Framework” formed by COP15 in 2021 aim to maximize the protection of the Earth’s variety of biological resources [8,9]. The United Nations Sustainable Development Goal 15 (SDG 15) also proposes to commit to curbing the loss of biological diversity [10]. In this context, a comprehensive understanding of the spatiotemporal evolution characteristics and coupling connections between habitat quality and human activities is of great significance to the country in formulating biodiversity protection and ecological security policies.
At present, in terms of research methods, the assessment of habitat quality mainly forms the research paradigm of “spatial and temporal changes, factor analysis, and recommended policies”. The Integrated Valuation of Ecosystem Services and Tradeoffs—Habitat Quality (InVEST-HQ) model, based on land use/cover, has become the most mature and frequently used model for assessing habitat quality [11,12,13]. In the regional dimension, research mainly focuses on global nature reserves [14], regions [15], river basins [16], provinces [17], cities [18], districts, and counties [19], and other scales. In addition, in terms of the time dimension, most studies conduct analyses in stages of 5 or 10 years.
To explore the response relationship between habitat quality and human activities, research is mainly conducted based on indicators such as land use [20,21], urbanization level [6], ecological footprint [22], and human activity intensity (night-time light index) [17], these traditional indicators of human activities are relatively simplistic and costly. Previous indicators rarely consider the temporal dynamics of human activities [23,24], which limits the support provided to decision makers at the macro scale and makes it difficult to be widely used. Due to the complex evolution of human activities over the past 20 years, it has had a significant impact on biodiversity systems [25]. It is difficult to reflect the complex pressure of humans on ecosystems based on a single pressure (population density [26] or night light index [27]). However, Human Footprint, as a comprehensive method for analyzing the human disturbance intensity, can reflect the pressure caused by ecological processes and natural landscape changes on the ecological environment and has been widely used in the fields of biodiversity and ecological protection in countries around the world [28,29]. In addition, due to rapid urbanization and population growth, mapping the human footprint at a relatively coarse temporal resolution is insufficient, especially in the face of rapidly changing environments. Therefore, recording the human footprint consistently in space and time is very important for assessing human-induced changes and promoting sustainable development. The human footprint index method proposed by Sanderson superimposes an influence assessment by selecting typical human activities. Many scholars have optimized it based on its framework and applied it to research into human activities and ecosystem services [30,31], habitat quality [5], ecological networks [32], and environmental quality [33]. The human footprint index can effectively represent human activities in a region, especially by incorporating factors such as the built environment and population density, which can reduce some underestimated human pressures [34].
Overall, there are still several problems in research on the spatiotemporal evolution of habitat quality and human activities. First, there is a lack of national-scale, long-term habitat quality assessment. Due to the rapid urbanization and population increase processes, it is not sufficient to study habitat quality and human footprints with relatively coarse time resolutions (e.g., five or ten years), making it challenging to capture the continuity characteristics of changes and identify mutation years. Second, when studying coupling relationships, the traditional coordination coupling degree model will be simplified, making it challenging to reflect the continuous and complex change processes as well as trends between human activities and habitat quality; therefore, it is essential to carry out continuous long-term, national-scale spatial, and temporal evolution trends and couplings of habitat quality and human activities to promote sustainable development.
Currently, China has entered a stage of comprehensively promoting the construction of a beautiful China, in which biodiversity and ecological security are essential components [35]. There is an urgent need to coordinate the relationship between regional habitat quality and human activities. In this context, how to coordinate the relationship between habitat quality and formulating effective zoning protection measures while ensuring the state of the economy has become a significant challenge for Chinese government policymakers; therefore, this study takes China as the research area and aims to systematically evaluate the coupling relationship between habitat quality and human footprint from 2000 to 2020 using pixel-scale trend statistical methods based on long-term land-use data and based on the four-quadrant model, revealing the interaction between two systems. This study mainly explores the following questions: (1) What are the spatiotemporal distribution characteristics and evolution patterns of habitat quality and human footprints in China for 21 consecutive years? (2) What are the spatiotemporal transfer characteristics of the coupling coordination degree of habitat quality and human footprints? (3) What is the relationship between the coupling coordination degree of habitat quality and human footprint and the response of human footprint? The research aims to provide theoretical data and policy support for national ecological security and coordinated economic development.
2. Materials and Methods
2.1. The Study Area
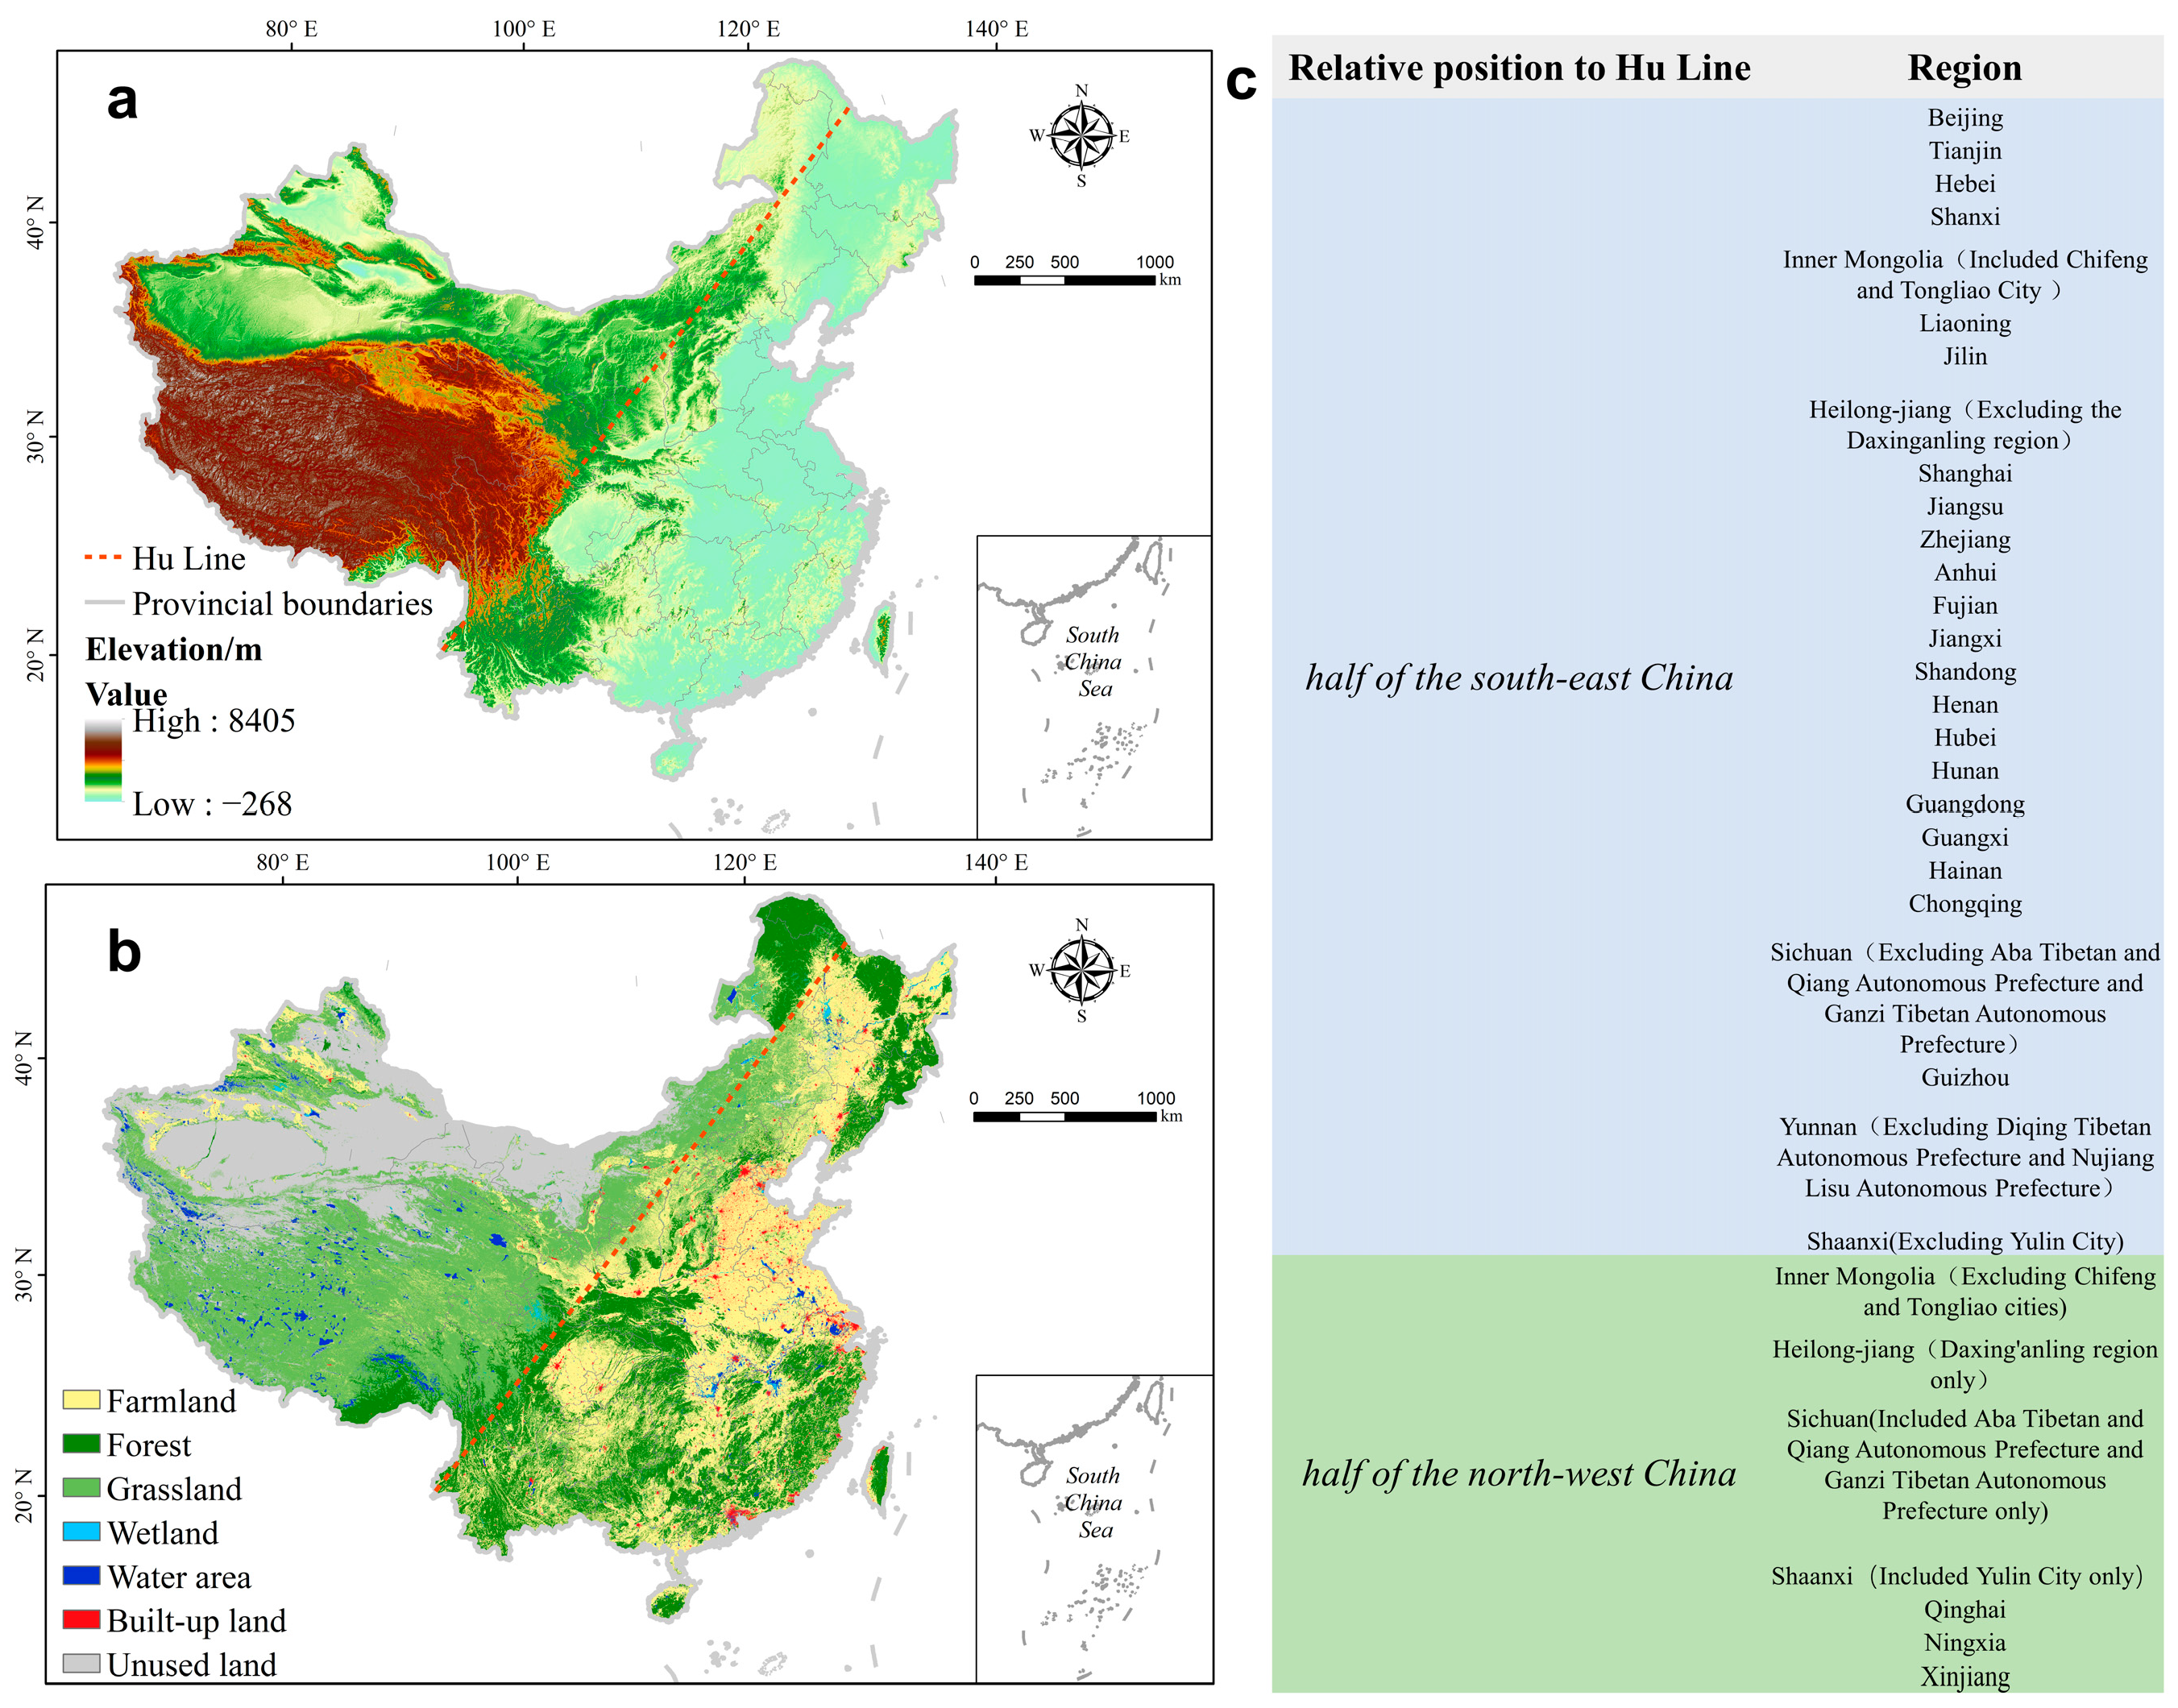
China’s topography shows the distribution characteristics of “high in the west and low in the east” (Figure 1a). The main human activities are mainly concentrated on the southeast side of the “Hu Line”. About 43% of the land on the southeast side of the “Hu Line” hosts 94% of the country’s population and 96% of its GDP [36]. In terms of land use, it is mainly farmland and construction land. At the same time, the southwest side of the “Hu Line” is mainly unused land and grassland (Figure 1b). China is composed of 31 provinces (autonomous regions and municipalities). The provinces with high economic intensity and extensive human activities are mainly distributed on the southeast side of the “Hu Line”, and the remaining provinces are distributed on the northwest side of the “Hu Line” (Figure 1c). Due to limited data, Taiwan Province, Hong Kong Special Administrative Region, and Macao Special Administrative Region were not included in subsequent provincial-scale studies.

Figure 1.
Overview map of the study area ((a): digital elevation map; (b): land-use map; and (c): introduction to the administrative regions distributed on both sides of the Hu Line).
2.2. Data Sources and Preprocessing
2.2.1. Land-Use Data
In order to conduct long-term habitat quality analysis, we obtained land-use data from the European Space Agency (European Space Agency-Climate Change Initiative, ESA-CCI, datasets) in United Kingdom, which can be obtained from https://www.esa-landcover-cci.org, accessed on 5 February 2024. This dataset describes land cover into 22 categories defined using the Land Cover Classification System (LCCS) of the Food and Agriculture Organization of the United Nations (UN FAO), with a time scale of 1992–2020. The spatial resolution is 300 m × 300 m, with an overall classification accuracy of 71% in China [37]. The format is NetCDF4. We used the spatial analysis tool of QGIS 3.34.3-Prizren to obtain China’s land-use data from 2000 to 2020 (Figure S1). In recent years, these data have been widely used in land-use [38], habitat quality, and ecology system services [39], and another research is underway. To match subsequent human footprints, we resample it to 1000 m × 1000 m. In subsequent calculations, we reclassified the land-use data into seven LULC types: farmland, forestland, grassland, wetland, water, construction land, and unused land. The specific classification rules are shown in Table S1 in the attached material.
2.2.2. Human Footprint Data
In order to study the coupling coordination between human footprint and habitat quality in China, we used global human footprint data provided by the Urban Environmental Monitoring and Modeling (UEMM) team of China Agricultural University, which can be obtained from https://figshare.com/articles/figure/An_annual_global_terrestrial_Human_Footprint_dataset_from_2000_to_2018/16571064 (accessed on 10 February 2024), consistent with the internationally developed data developed by Venter, Kennedy, Williams, and others, with correlations reaching 0.72, 0.66, and 0.93 [34]. The time scale is 2000–2020, and the spatial scale is 1 km × 1 km, and finally, QGIS 3.34.3-Prizren software spatial analysis was used to obtain the human footprint dataset from 2000 to 2020 (Figure S2).
2.3. Evaluation Analysis Module
2.3.1. InVEST-HQ Model
This paper uses the habitat quality (HQ) [11] in the InVEST model to evaluate China’s habitat quality. It is a comprehensive index that evaluates the habitat suitability of land-use types and the degree of habitat degradation. It is used to reflect the provision of biodiversity services. This study defines urban land, rural residential areas, main traffic arteries, and cultivated land as habitat threat sources. The model has been widely used in the multiscale assessments of global and natural reserves [14,16]. See the attachment for specific parameters (Table S2) and habitat quality in China from 2000 to 2020 (Figure S3).
In the formula, Qxj is the habitat quality index of the j-th ecosystem and type k is the half-saturation constant, which is determined by the user based on the data resolution used. The Dxj habitat quality index is a dimensionless comprehensive index that evaluates the habitat suitability and habitat degradation of land-use types. The calculation formula is as follows:
In the formula, R is the number of stress factors; Yr is the total number of grid cells of stress factors; ωr is the weight; ry is the number of stress factors on the grid unit; βx is the accessibility level of grid x (such as a strict protection zone, for which the value is 1; if it is harvest-type protection, the value is 0; and the intermediate protection level can be assigned a value between 0 and 1); Sjr represents the sensitivity of habitat quality of each land use type to threat factors, and the value range is 0–1; and irxy is the stress factor. The influence distance can be calculated according to linear and exponential decay.
In the formula, dxy is the linear distance between grid x and y; drmax is the maximum action distance of the threat factor r. The main parameters that need to be input in this module include a land-use map (Figure S1), regional main habitat stress factors, the sensitivity of land-use types to threat sources, stress source factor weights, influence distance parameters, etc. (Tables S2 and S3).
2.3.2. Mapping of Human Footprints in China
This dataset adopts eight variables reflecting human pressures within the framework, and the classic human footprint method developed by Sanderson and Venter [23,29]; the model framework and method of human footprint used can be found in previous studies [34,40], and it is normalized for subsequent research.
2.4. Dual System Coupling Analysis Module
2.4.1. Four-Quadrant Analysis Model
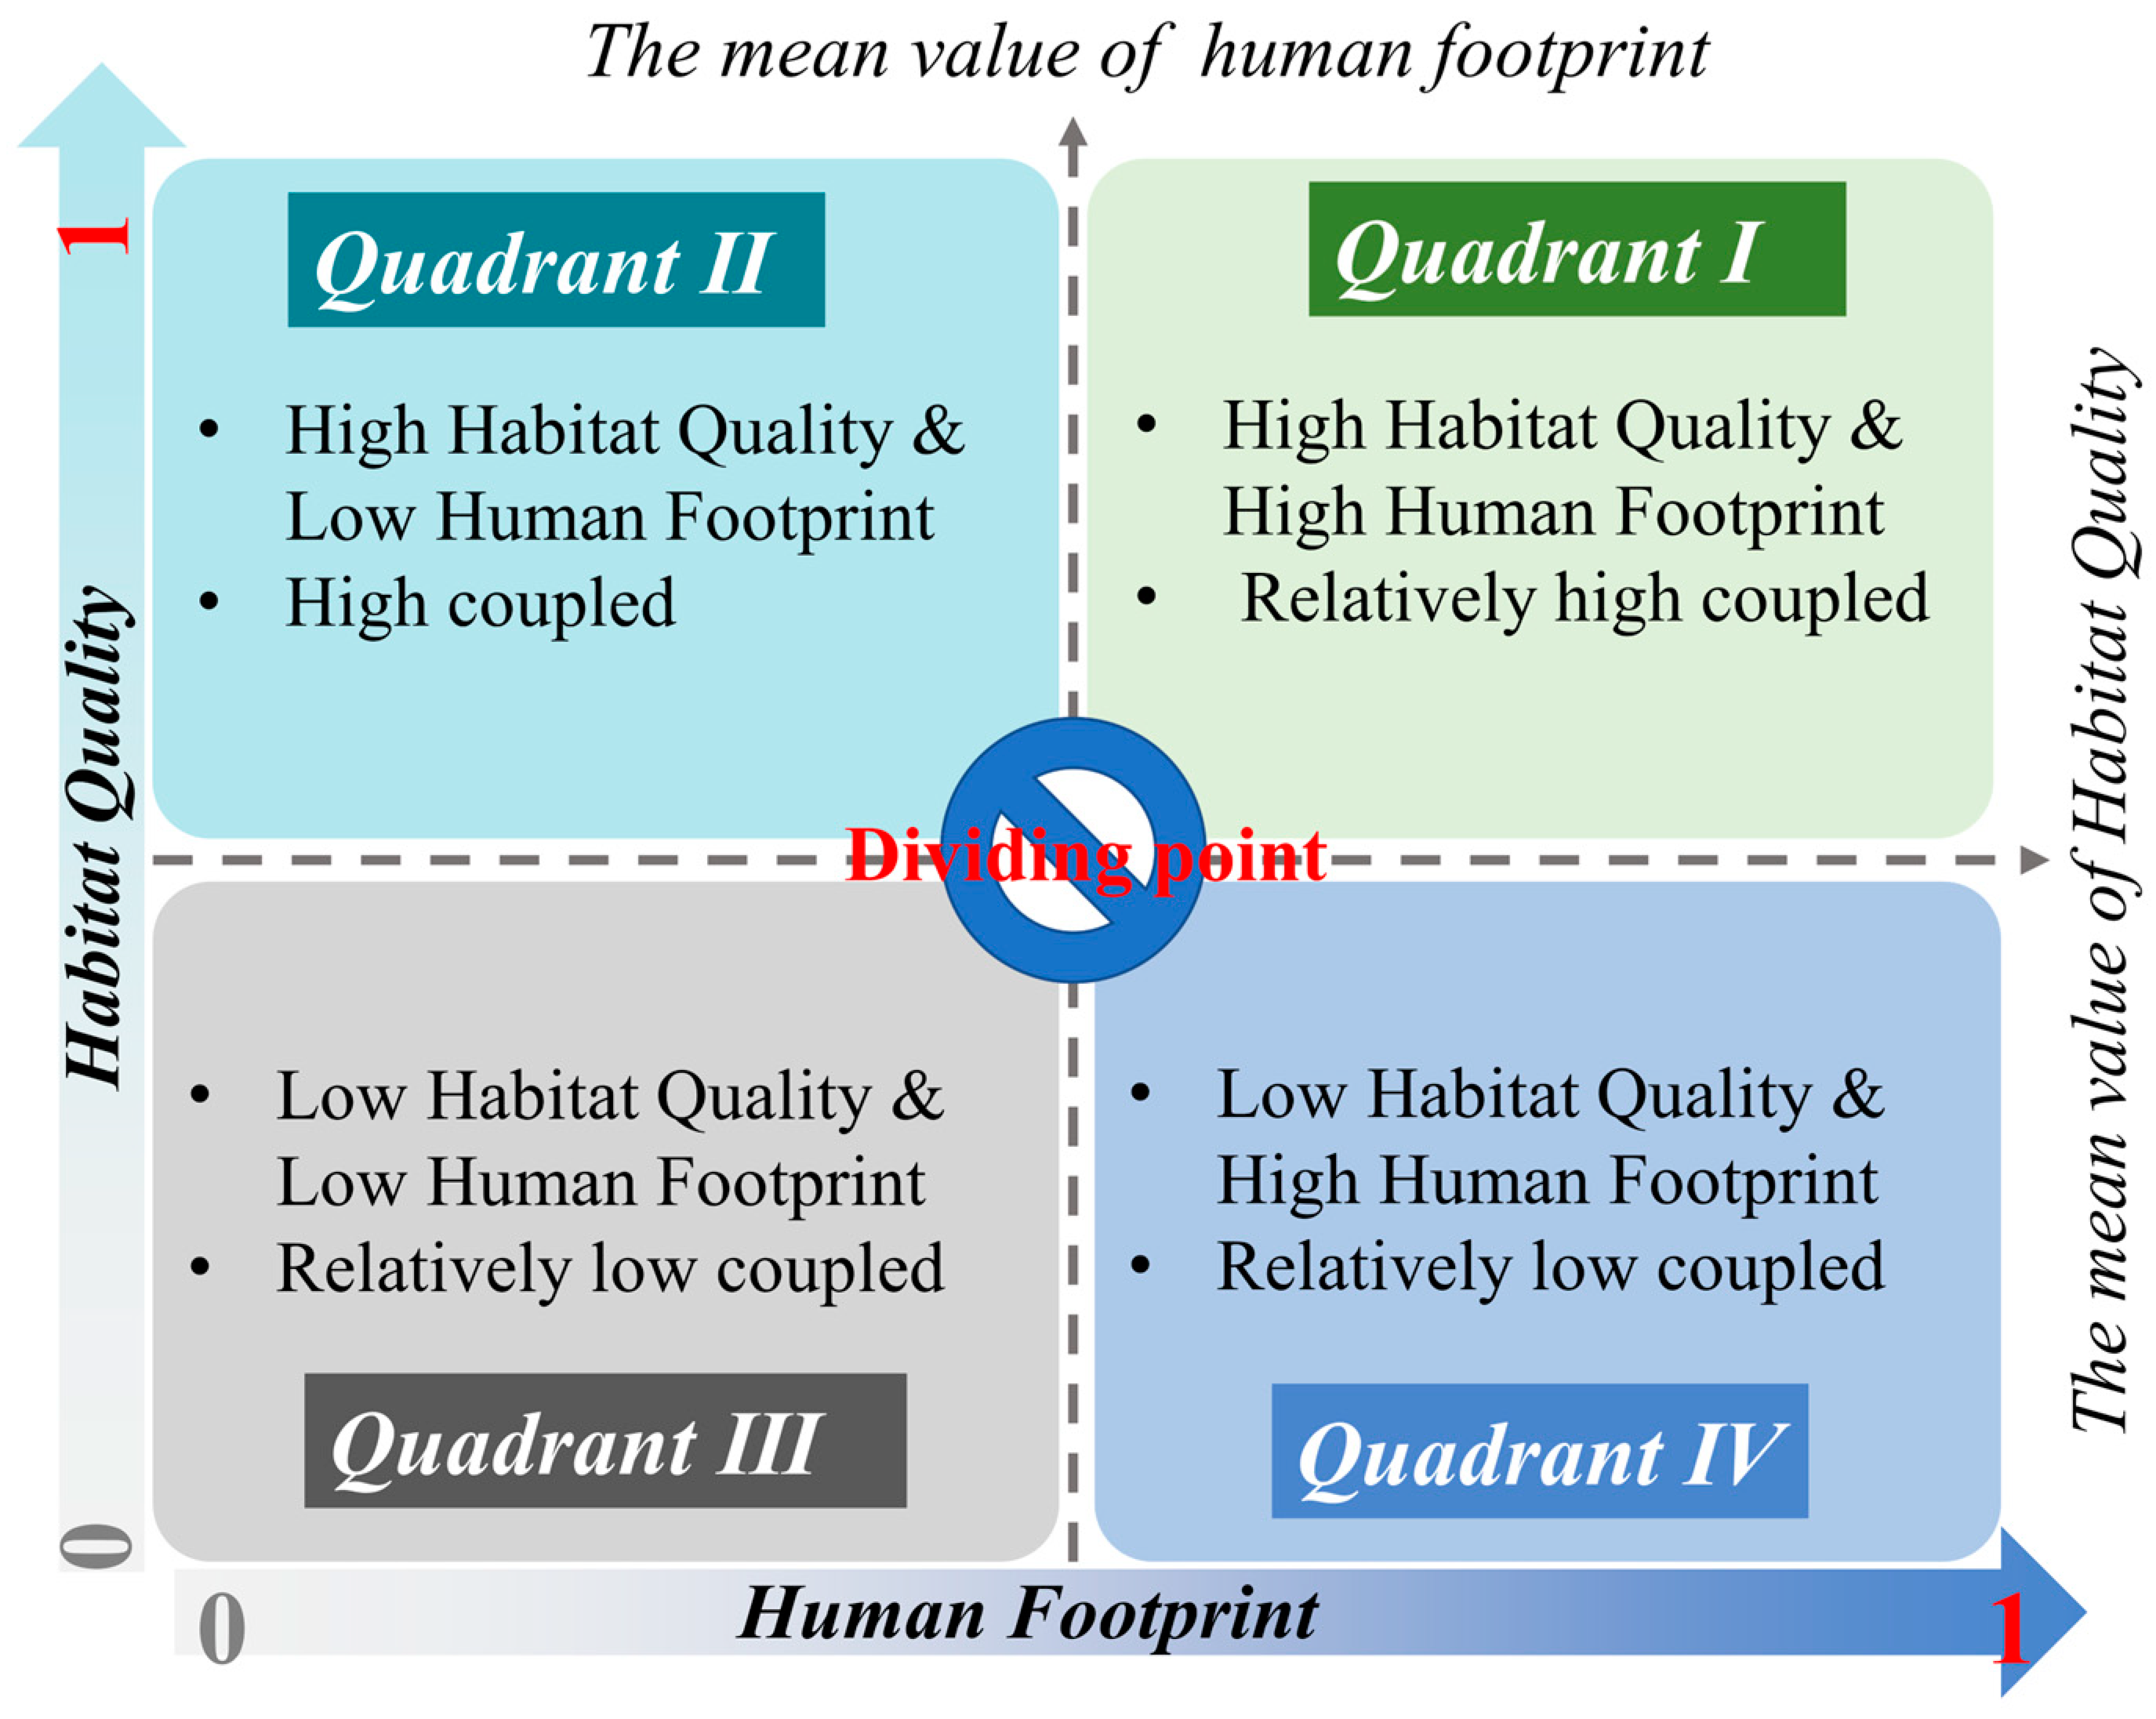
The four-quadrant model defines the coupling state of two indicators, and the interaction between the two indicators can be revealed through the coupling state. In recent years, the four-quadrant model has also been widely used in current research on human activities and ecosystem services [41,42]. We use four quadrants to measure the coupling status between human activities and habitat quality in China. This study used human footprints and habitat quality as the X axis and Y axis, respectively. The average value of the two was used as the threshold with which to divide high and low values and construct four quadrants (Figure 2). For example, quadrant I is an area with a high human footprint and high habitat quality, indicating relatively high coupling between the two systems. Quadrant III has a low human footprint and low habitat quality, indicating relatively low coupling between human activities and habitat quality.

Figure 2.
Conceptual diagram of a four-quadrant model of the coupled relationship between habitat quality and the human footprint.
2.4.2. The Modified Coupling Coordination Degree Model
This study uses a coupling coordination degree (CCD) model to quantify the relationship between the human footprint and habitat quality. The coupling degree model aims to measure the degree of interaction between two systems, and the expression is as follows [43]:
In the formula, C is the system coupling degree, C ∈ [0, 1], and α and β are the contribution shares of the habitat quality system and the human footprint system, respectively. In this article, because the values of α and β do not affect the changes in the two subsystems, they are of the same importance, and both take a value of 0.5 [44]; HF is the human footprint index; and HQ is habitat quality. The higher the degree of coupling, the higher the level of interaction between the two systems, and vice versa.
However, the coupling degree only reflects the correlation level between the two systems but cannot reflect their actual development status. Low values in both systems may result in high coupling, but high coupling values and high levels of coupling have different meanings; therefore, we use the coupling coordination degree (CCD) to measure the degree of coordination between the human footprint and habitat quality. We optimize C, which has been widely used in research on the collaborative coupling of the economy and environment, habitat quality, urbanization, and other systems [6]. The specific formula is as follows:
In the formula, T represents the comprehensive development level of the habitat quality system and the human footprint system, and CCD ∈ [0, 1]. The closer the CCD is to 1, the better the coupling coordination level.
2.5. Spatiotemporal Change Analysis Module
2.5.1. Grid Transition Matrix (GTM) Method
The grid transfer matrix (GTM) method can quantitatively describe the system and transfer states between a particular grid unit type in a particular time sequence unit. It can more comprehensively reflect the attribute transfer direction and structural characteristics represented by the grid [45], and it is widely used in the analysis of spatial and temporal changes in land use in multiple scenarios [46,47]. This study applies it to the spatial transfer analysis of the coupling degree of land use and human footprints. The formula is as follows:
In the formula, LGTM represents the land use or CCD grid transfer path from year i to year j; Li and Lj are divided into the state distribution of land use or CCD in years i and j, respectively; and 100 is a constant.
2.5.2. Theil–Sen Median Analysis
The Theil–Sen median method, also known as the Sen slope estimation, is suitable for the trend analysis of long-term series data. It is mainly used to analyze the change trend and amplitude of elements. It is widely used in astronomy [48], hydrology research, ecosystem trend identification, and another research [49,50]. This study used the method to analyze the spatiotemporal changes in habitat quality, human footprint, and CCD of the two systems at a pixel scale in China from 2000 to 2020. The formula is as follows:
where Xi and Xj are the values of moment i and moment j in the time series data, respectively; n represents the length of the time series; and Sslope represents the trend of the data, which indicates an increasing trend when Sslope > 0 and a decreasing trend when Sslope < 0.
2.5.3. Mann–Kendall Test
The Mann–Kendall test method is a robust nonparametric statistical trend calculation method [51,52,53]. It does not require that the measured values obey a normal distribution. It can be combined with the Theil–Sen median and is suitable for HQ, HF, CCD, and other sequences. The formula is as follows:
Assuming that x1, x2, …, xn are time series variables, construct statistic S:
In the formula, sgn( ) is a symbolic function, and the calculation formula is as follows:
We use the test statistic, Z, to test the trend changes in HQ, HF, and CCD. The calculation method is as follows:
In the formula, S obeys the normal distribution, and Var(S) is the variance. In a two-sided test, at a given significance level, the critical value is ±1.96. When |Z| is greater than 1.96, it means that the trend has passed the significance test with a reliability of 95%.
2.5.4. Nonlinear Analysis Module
In order to explore the change process of the coupling level between habitat quality and human footprints with the intensity of human activities, the change curve between the two indicators was simulated with the help of the curve estimation function of the SPSS Statistic 24 software platform. Use the normalized CCD as the dependent variable and the normalized human footprint index as the explanatory variable. Considering the existence of zero values in the dependent variable, we used five models: linear, quadratic, cubic, logarithmic, and exponential. Fit the two indicators and select the model with the best fitting effect (R2) to explain the relationship between human footprints and the CCD.
3. Results
3.1. The Spatiotemporal Evolution of HQ and Human Footprints from 2000 to 2020
3.1.1. Spatiotemporal Changes in Land Use
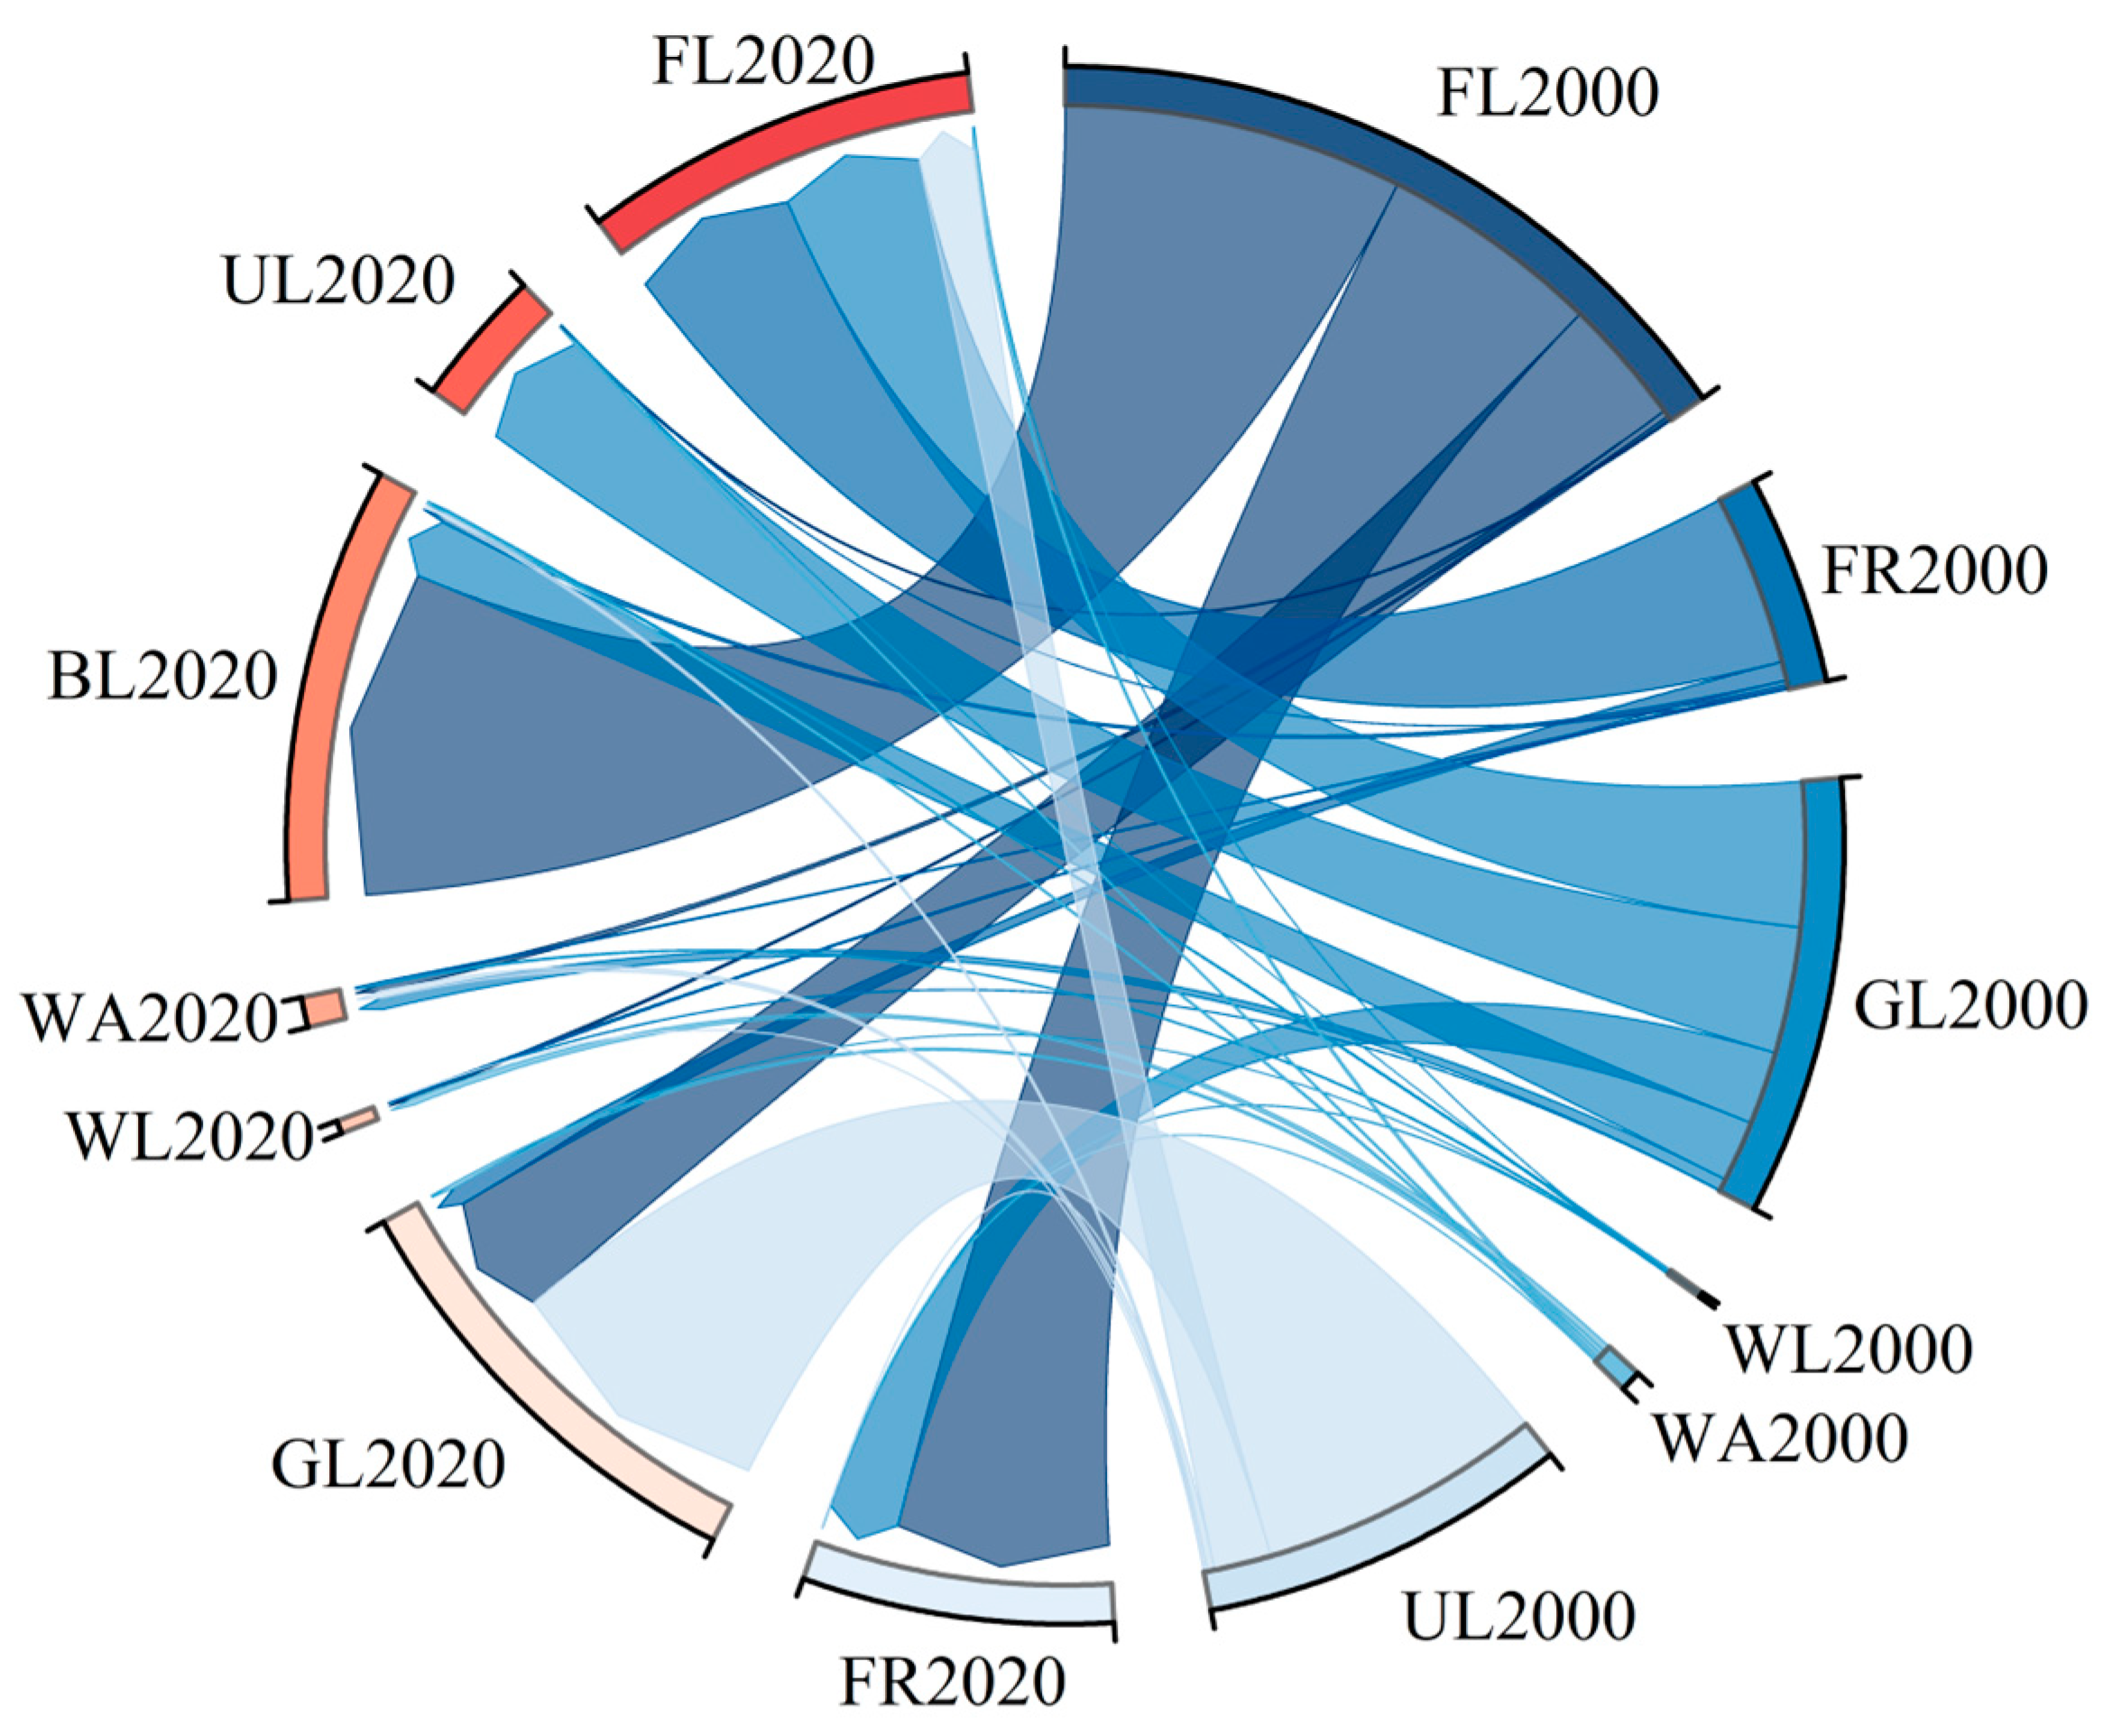
Figure 3 shows the interconversion of seven land-use types in China from 2000 to 2020. In terms of proportion, they are mainly grassland, cultivated land, and forest land, with average proportions of 29.9%, 29.1%, and 20.3%, respectively, and construction land accounts for about 1.0%. Judging from trend changes, cultivated land, and unused land were in a continuous downward trend, decreasing by 0.8% and 0.6%, respectively. Construction land and forest land are on an increasing trend, increasing by 1% and 0.3%, respectively. In terms of transformed land types, in the past 21 years, China’s total area of land cover change was 4.06 × 10⁵ km2, accounting for 4.2% of the total land area. The top three conversion types were “cultivated land–construction land”, “unused land–grassland”, and “cultivated land–woodland”. It should be noted that this is affected by the “returning farmland to forest” policy, and construction land does not change during the urbanization process. Converted to any land use, the specific land transfer area matrix is shown in Table S4.

Figure 3.
Use conversion map from 2000 to 2020 (FL: farmland, FR: forest, GL: grassland, WL: wetland, WA: water area, BL: built-up land, UL: unused land, unit: km2).
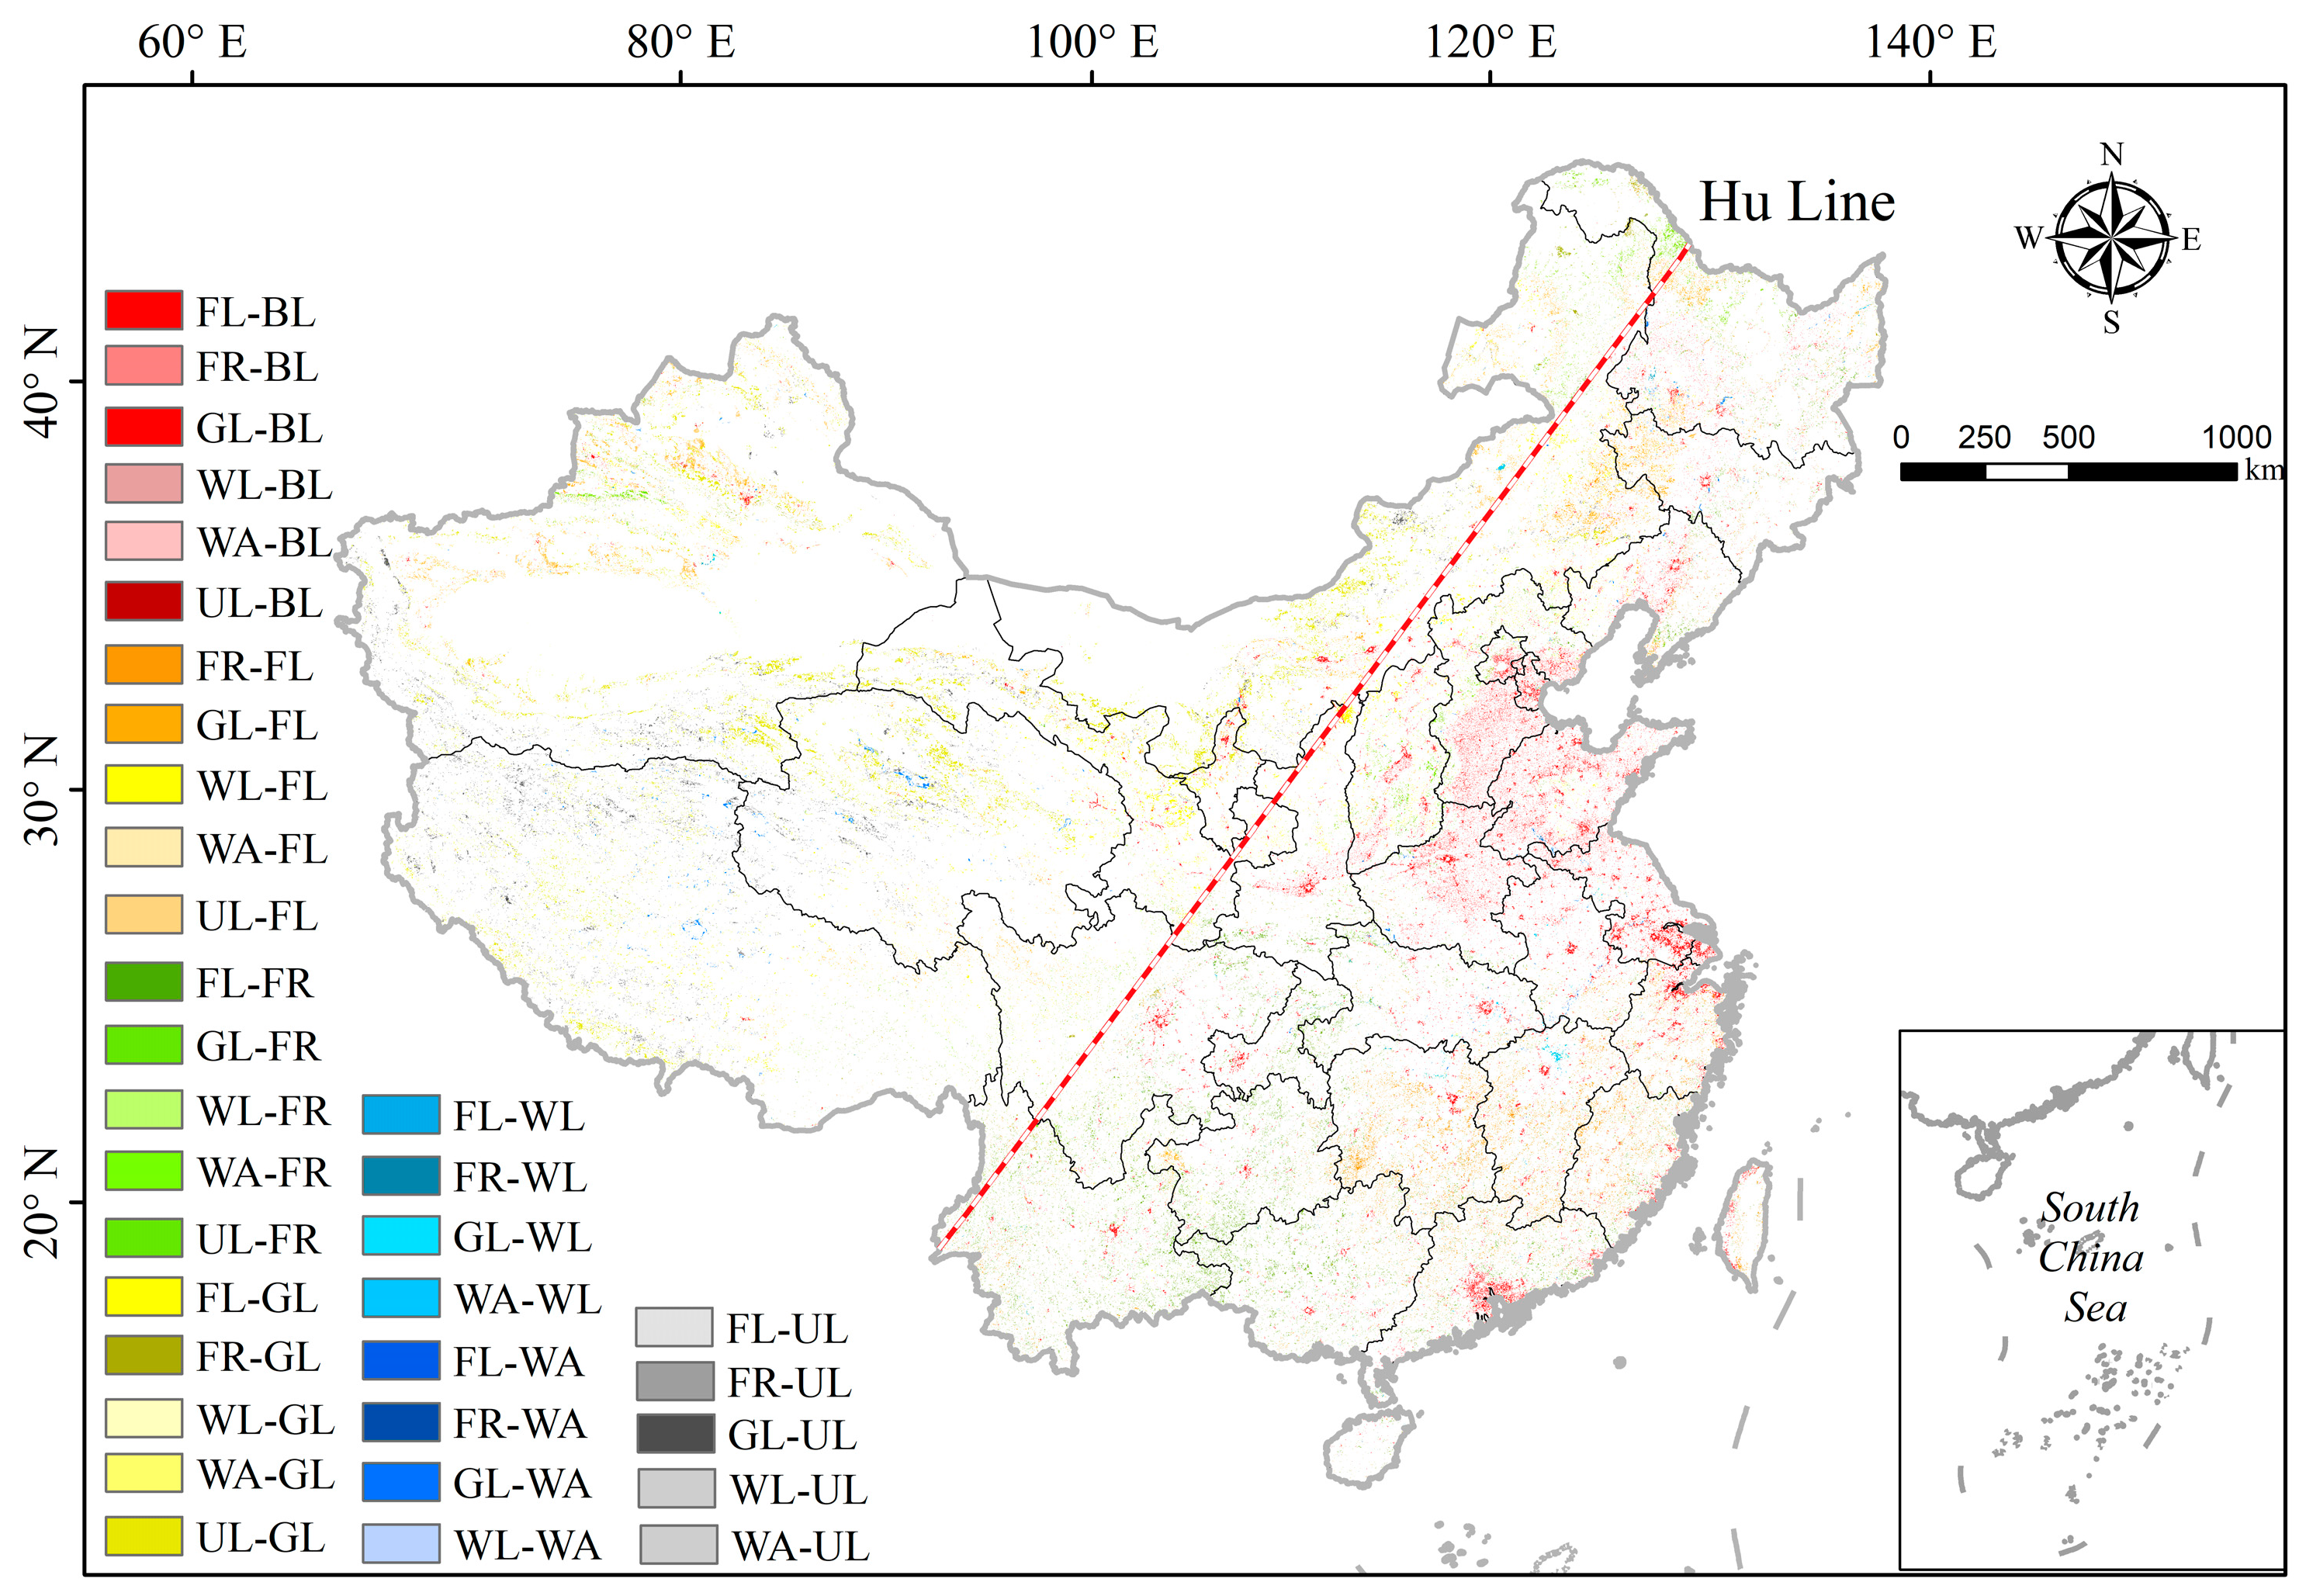
From a spatial transfer matrix perspective, land use shows prominent “Hu Line” spatial differentiation characteristics. Specifically, on the right side of the “Hu Line”, the land-use type transfer is mainly from “cultivated land and other ecological land to construction land” (Figure 4), which is consistent with urbanization in Beijing–Tianjin–Hebei, the Yangtze River Delta, and the Greater Bay Area. The process is inseparable. In addition, this type of transfer is also prominent in the central and western core cities of Xi’an, Zhengzhou, and Zhengzhou. On the left side of the “Hu Line”, the primary conversions are unused land–grassland, cultivated land–grassland, etc. This is closely related to policies such as returning farmland to grassland in the western region.

Figure 4.
Spatial transfer map of land use in China from 2000 to 2020 (unit: km2).
3.1.2. Spatiotemporal Changes in Habitat Quality
During the study period, the grid-scale analysis of habitat quality (Figure 5a) revealed that the average habitat quality on the left side of the “Hu Line” was higher than that on the right side. Judging from the 21-year average, very high values (>0.80) and high values (0.60–0.80) are concentrated in the Tibetan Plateau, Loess Plateau, southwest, southeast, northeast, and other regions. The HQ is of intermediate (0.4–0.6) quality and is in northern China, southern China, etc. The average HQ values are low (0.20–0.40) and extremely low (<0.2), mainly in the northwest region, the Yellow and Bohai Plains, eastern Sichuan, and other places; however, the reasons for this phenomenon are different. In the northwest region, this is due to its dry climate, caused by sparse vegetation, while the low HQ in places such as the Yellow and Bohai Plains is caused by the expansion of urban agglomerations in recent years.

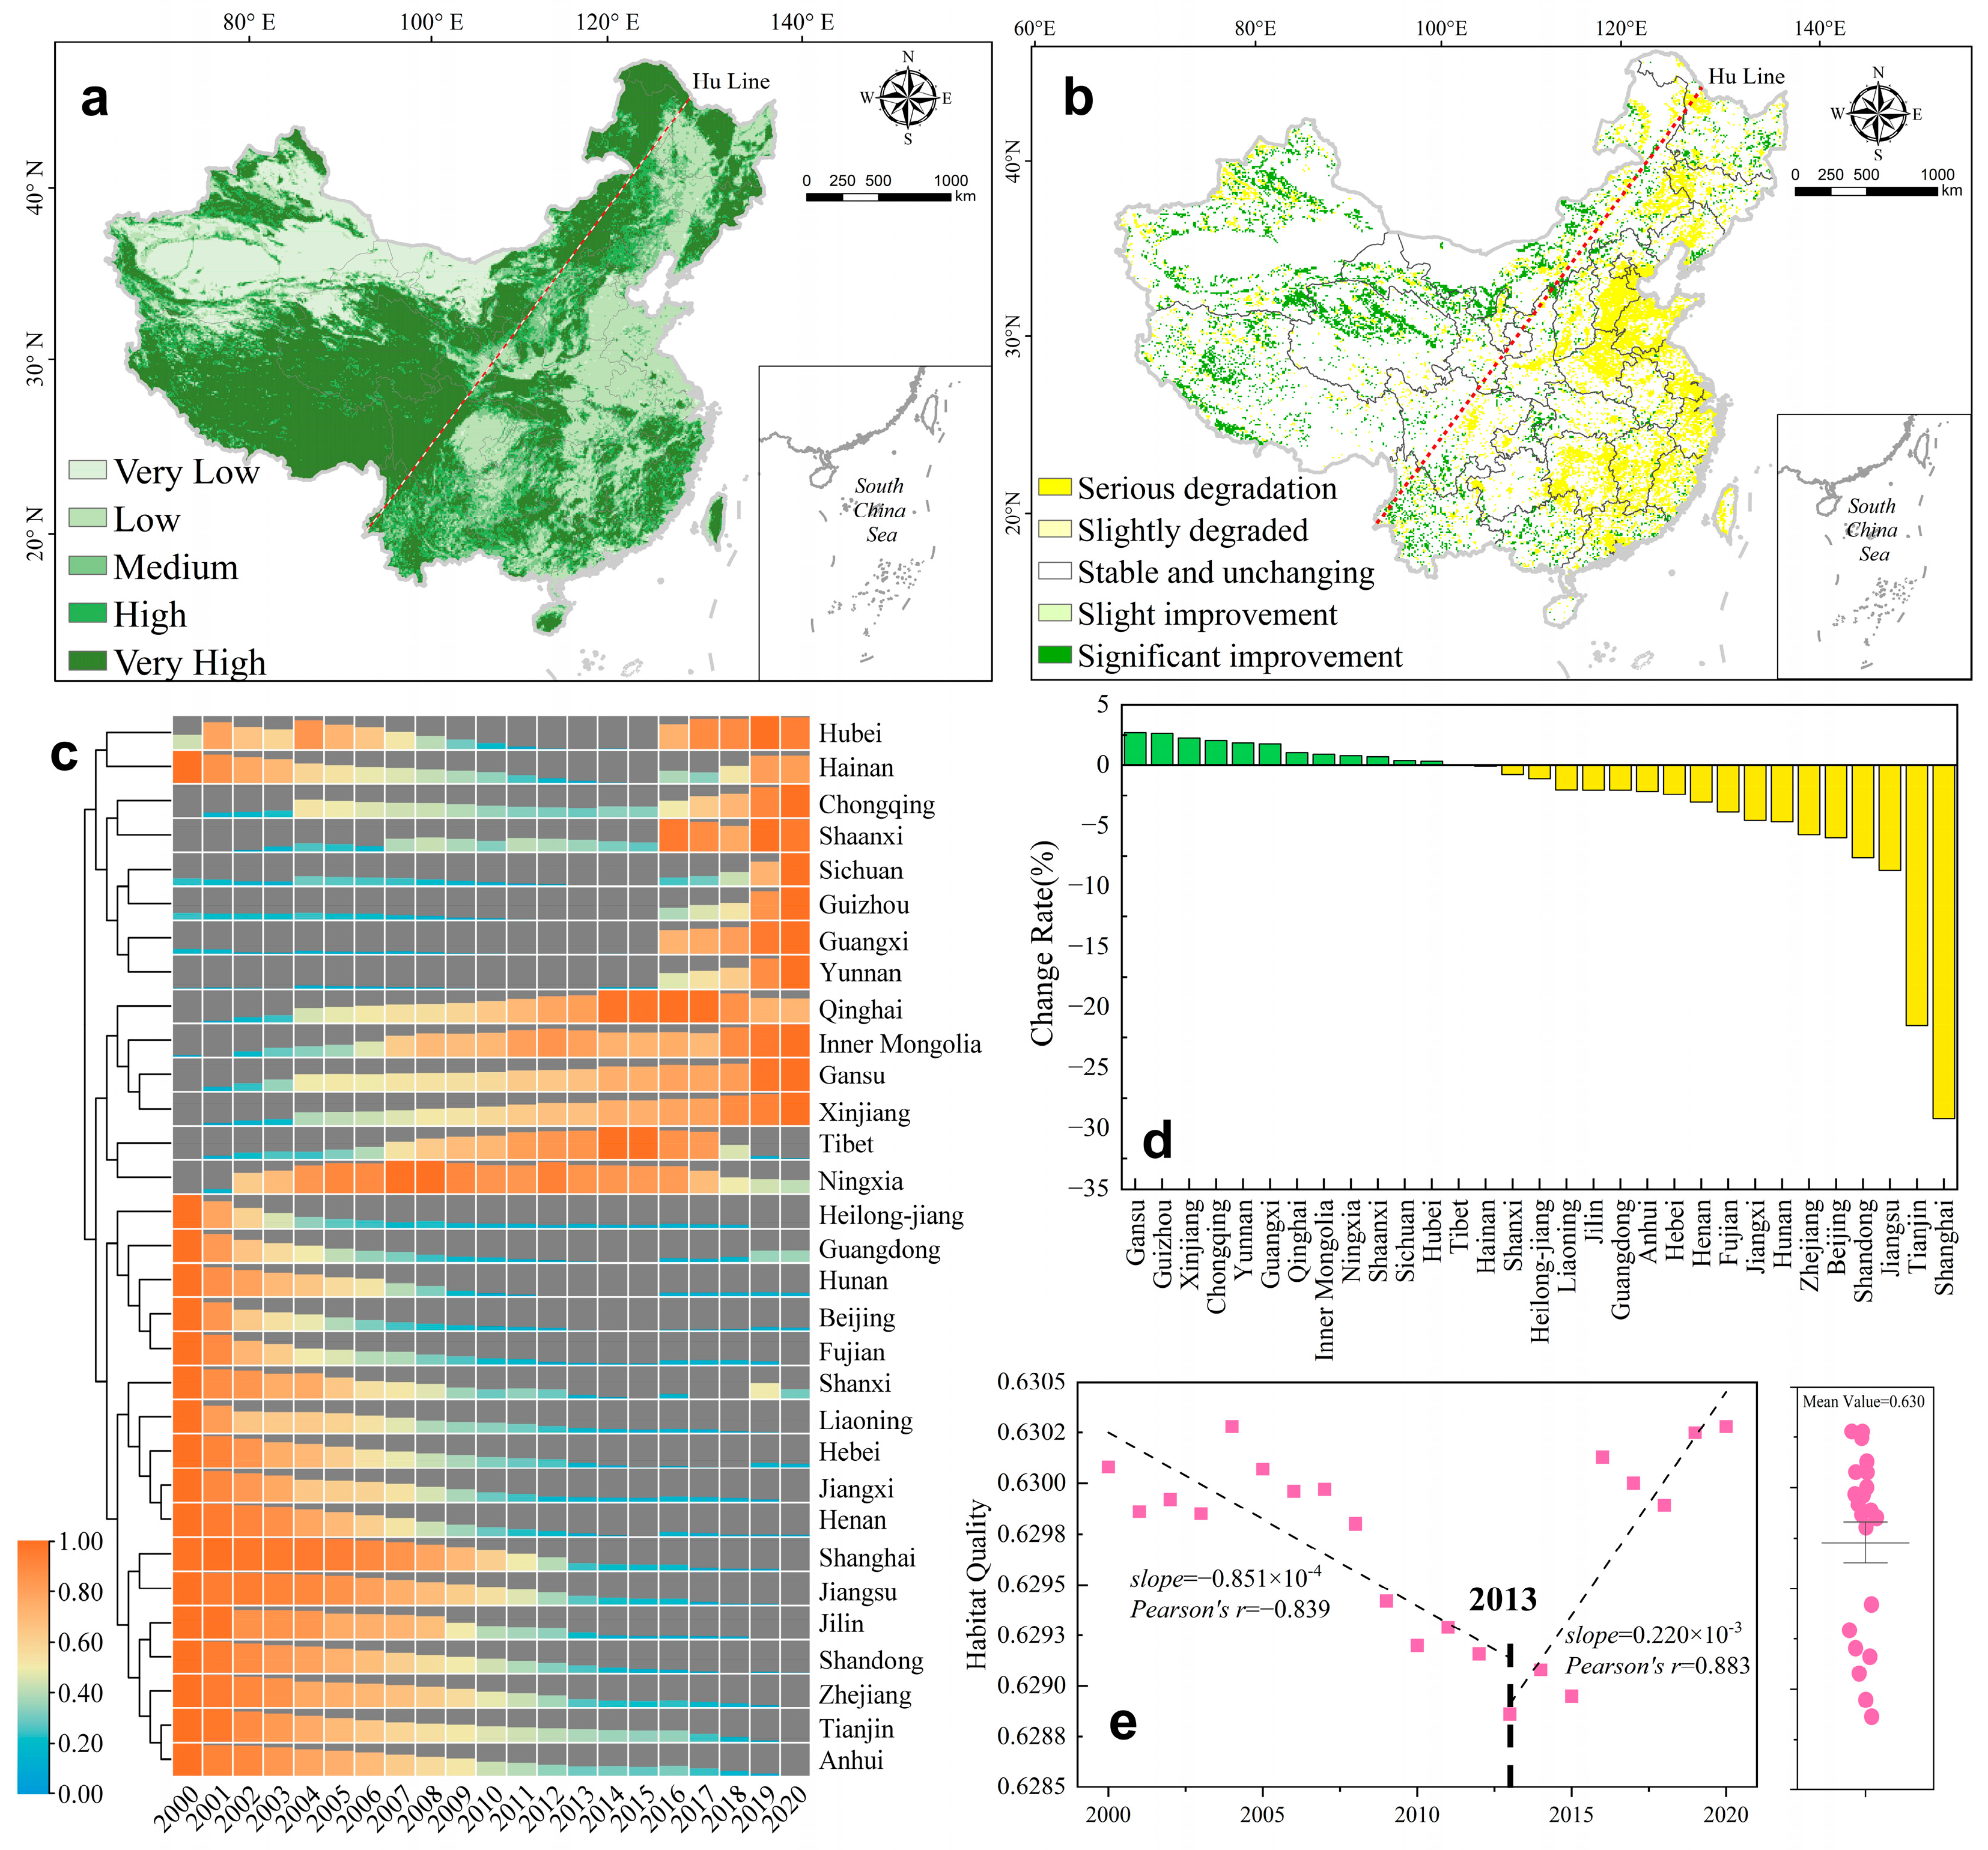
Figure 5.
The spatial distribution of mean habitat quality in China from 2000 to 2020 (a); Sen-MK trend change map from 2000 to 2020 (b); habitat quality change heat map (c); change rate of 31 provinces (d); and the country change trend (e).
From the perspective of provincial trend changes, it is manifested as apparent spatial heterogeneity in the change trends on both sides of the “Hu Line”. It shows a state of degradation in the southeast, with severe and slight degradation accounting for 14.12% and 0.25%, respectively. They are mainly distributed in southeast coastal agglomerations such as the Greater Bay Area, the Yangtze River Delta, Beijing–Tianjin–Hebei, the Shandong Peninsula, and other highly urbanized areas. The northwest regions showed improvement, with the proportions of significantly improved and slightly improved areas accounting for 8.12% and 0.24%, respectively (Figure 5b), mainly distributed in Tibet, Qinghai, the Gansu Hexi Corridor, and northern Xinjiang. In addition, we also found that the HQ change patterns are different in different regions. China’s 31 provinces can be mainly divided into three typical patterns, namely continuous degradation, continuous improvement, and first degradation, then improvement (Figure 5c). The two provinces with the most severe continuous degradation are Shanghai and Tianjin, with degradation rates of 29.20% and 21.47%, respectively. Other provinces, such as Shandong, Beijing, and Zhejiang, all have degradation rates of 5%–10%. This may be attributed to the intensification of human activities in the region. The provinces that continue to improve include Xinjiang, Gansu, Inner Mongolia, Qinghai, Yunnan, Sichuan, etc. The two provinces with the best improvement are Gansu and Guizhou, with improvement rates of 2.70% and 2.64%, respectively (Figure 5d). On a national scale, the multiyear average value of China’s HQ is 0.630, which can be divided into two evolutionary stages: “first degradation, then improvement”, with the mutation point in 2013 (Figure 5e).
3.1.3. Spatiotemporal Changes in Human Footprints
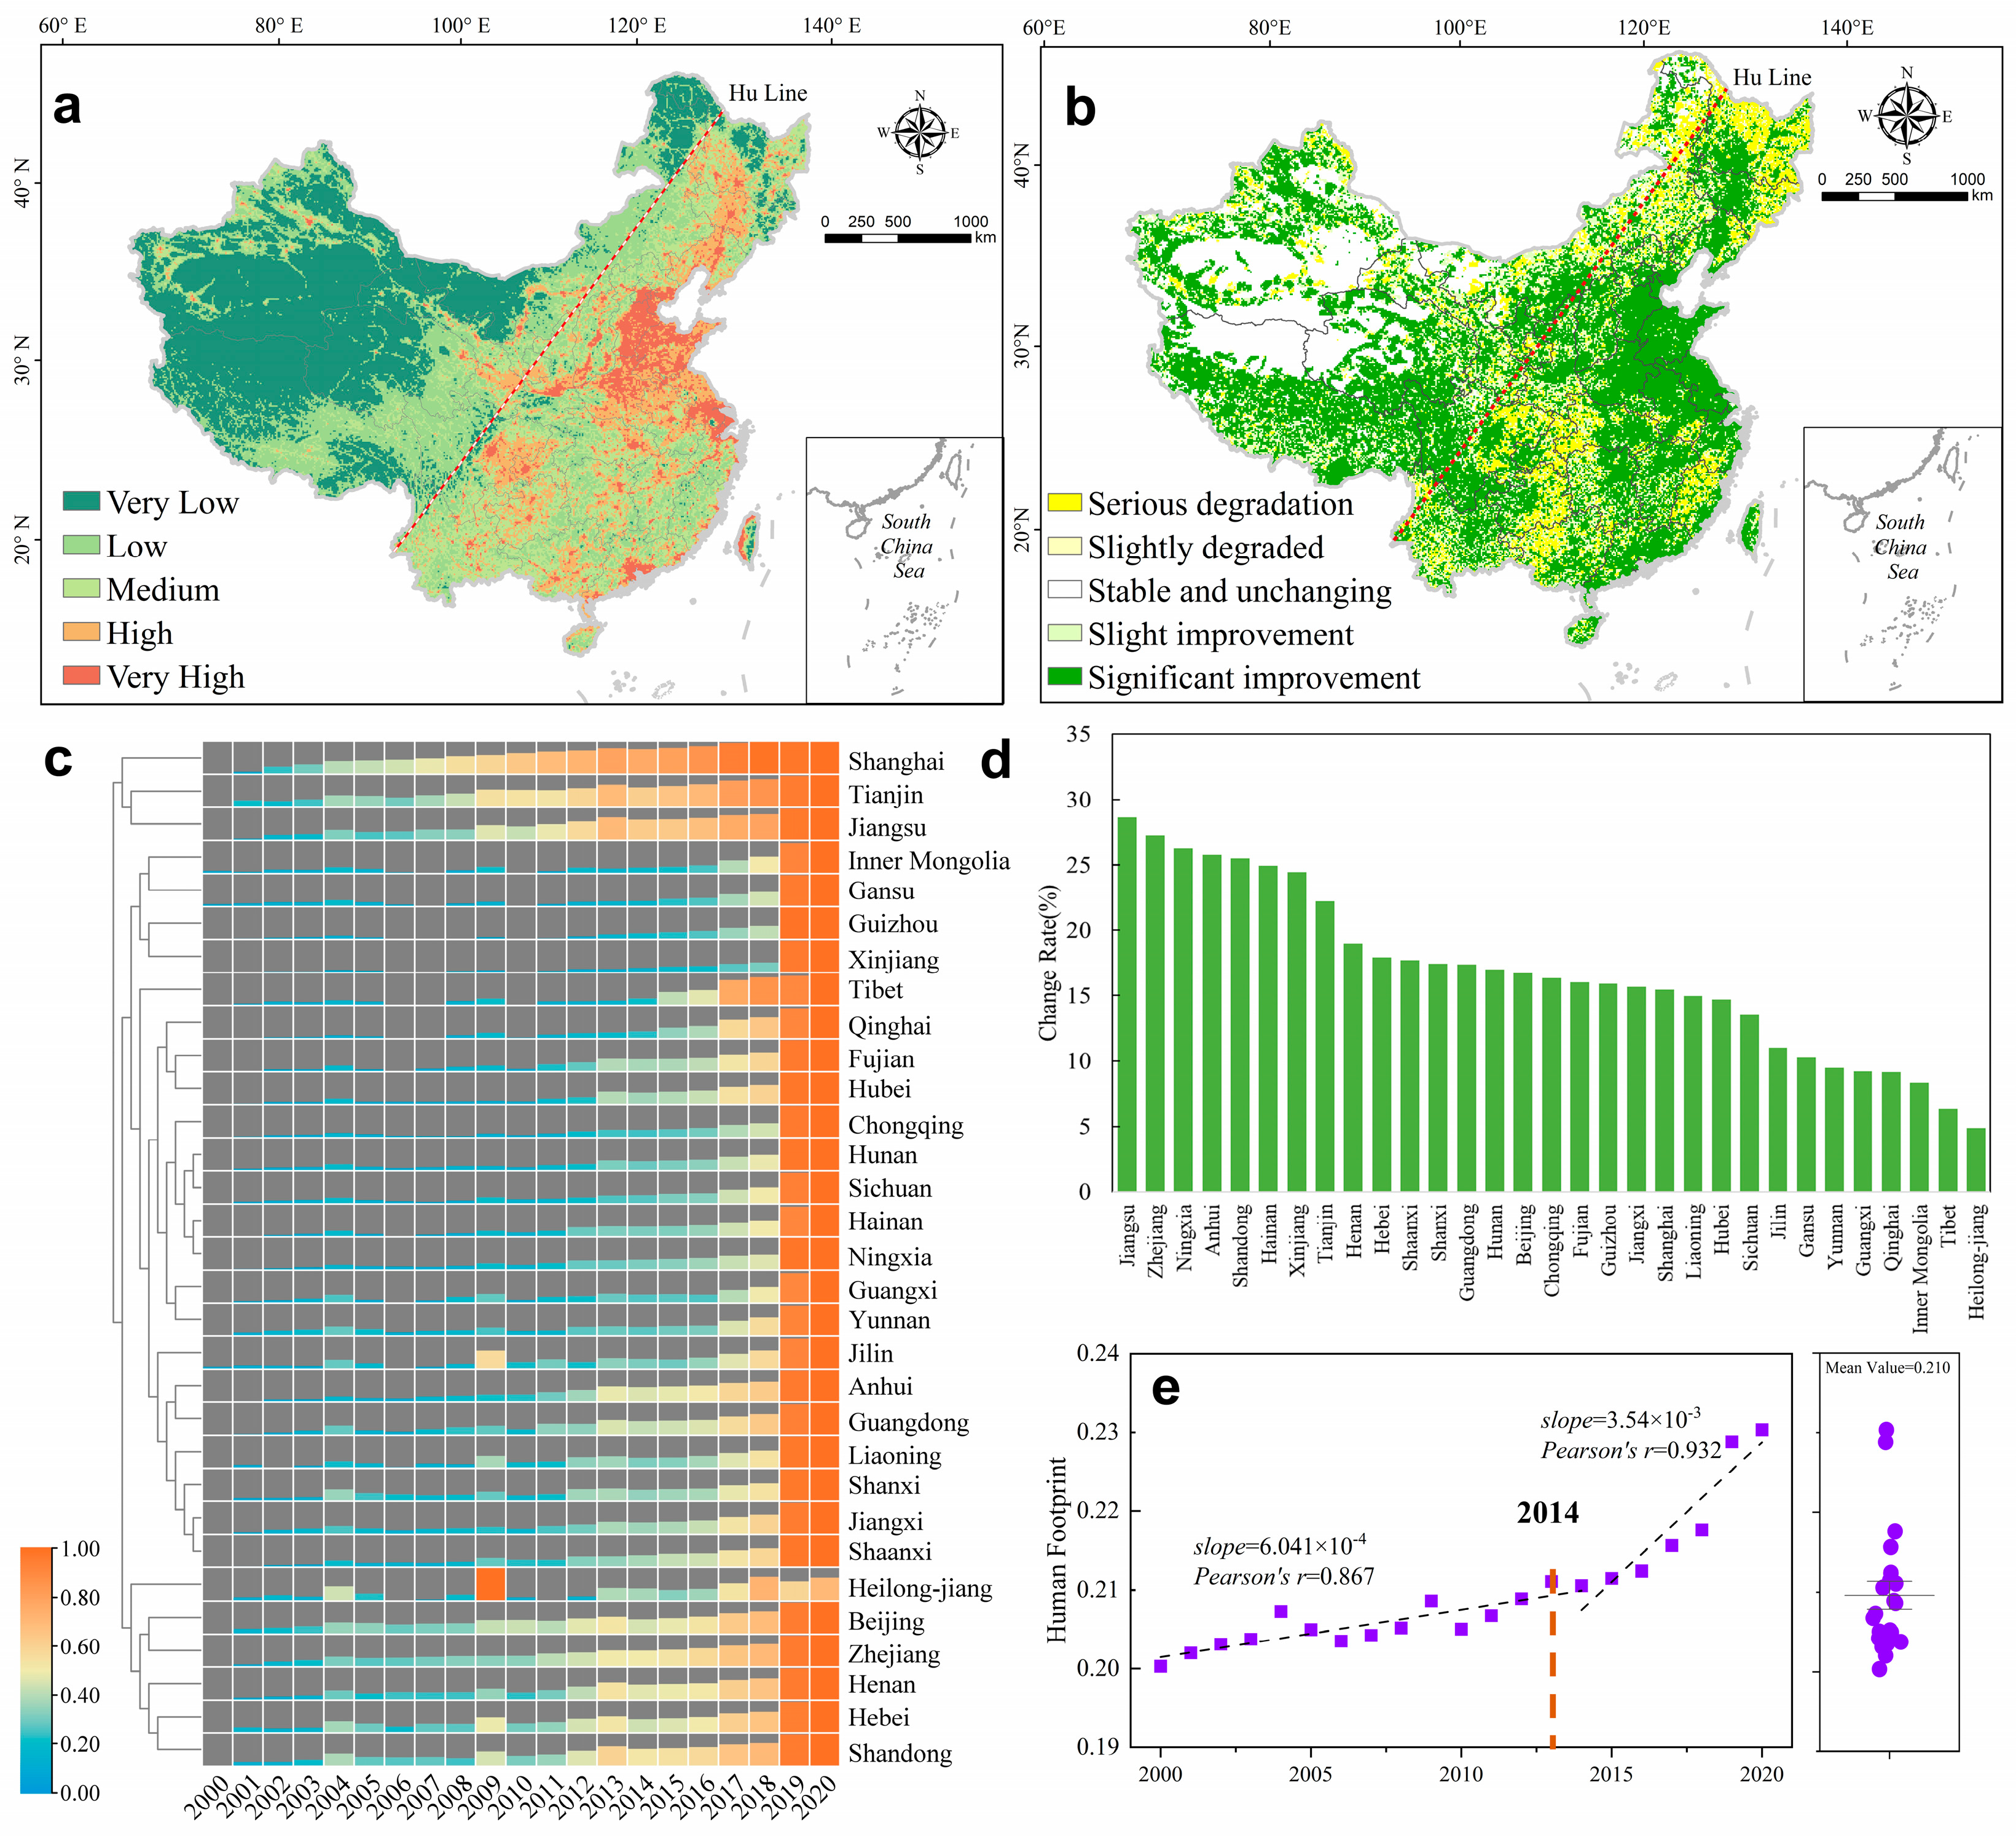
It can be seen from the grid-scale distribution of the average human footprint from 2000 to 2020 (Figure 6a) that China’s human footprint index presents a distinct distribution state on both sides of the “Hu Line”. The 21-year average shows that very high values and high human footprints are almost all concentrated on the right side of the “Hu Line”, mainly in the Beijing–Tianjin–Hebei, Yangtze River Delta, Guangdong–Hong Kong–Macao Greater Bay Area, Chengdu–Chongqing, Shandong, Henan, and other regions. On the west side of the “Hu Line”, most of them have very low human footprints, and high human footprints only exist in the core area of the Lanxi urban agglomeration and the Hubao–Ewu urban agglomeration (the bend of the Yellow River).
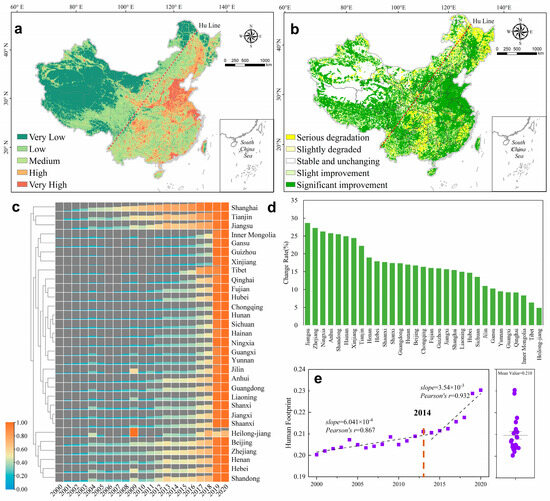
Figure 6.
Spatial distribution of the mean human footprint in China from 2000 to 2020 (a); Sen-MK trend change map (b); provincial-scale human footprint change heat map (c); change rate (d); and national change trend (e).
From the perspective of provincial-scale trends, we found that human footprints along both sides of the “Hu Line” have relatively substantial changes, showing significant spatial differentiation characteristics of “high in the southeast and low in the northwest”. The area proportion of the changed human footprint reached 84.93%, of which the increased and decreased area proportions were 63.40% and 21.53%, respectively. The increased area was approximately three times the decreased area (Figure 6b). Places with a significant increase in human footprints are mainly distributed in the Beijing–Tianjin–Hebei region, Shandong, Henan, the Yangtze River Delta, and the Greater Bay Area; however, we cannot ignore that, in the past 21 years, areas with excellent habitat quality, such as the Qinghai–Tibet Plateau as well as western and northeastern Sichuan, have shown a significant improvement trend in their human footprints. In addition, human footprints show varying degrees of “increasing” patterns (Figure 6c). Nationally, the average human footprint index from 2000 to 2021 was 0.210, with an average increase of 16.75%. The mutation point was in 2014 (Figure 6e). Specifically, from a provincial perspective, the most significant increase was in Jiangsu Province, which was 28.64%. The smallest increase was in Heilongjiang Province, which was 4.85% (Figure 6d).
3.2. Coupling Relationship between Human Footprint and Habitat Quality
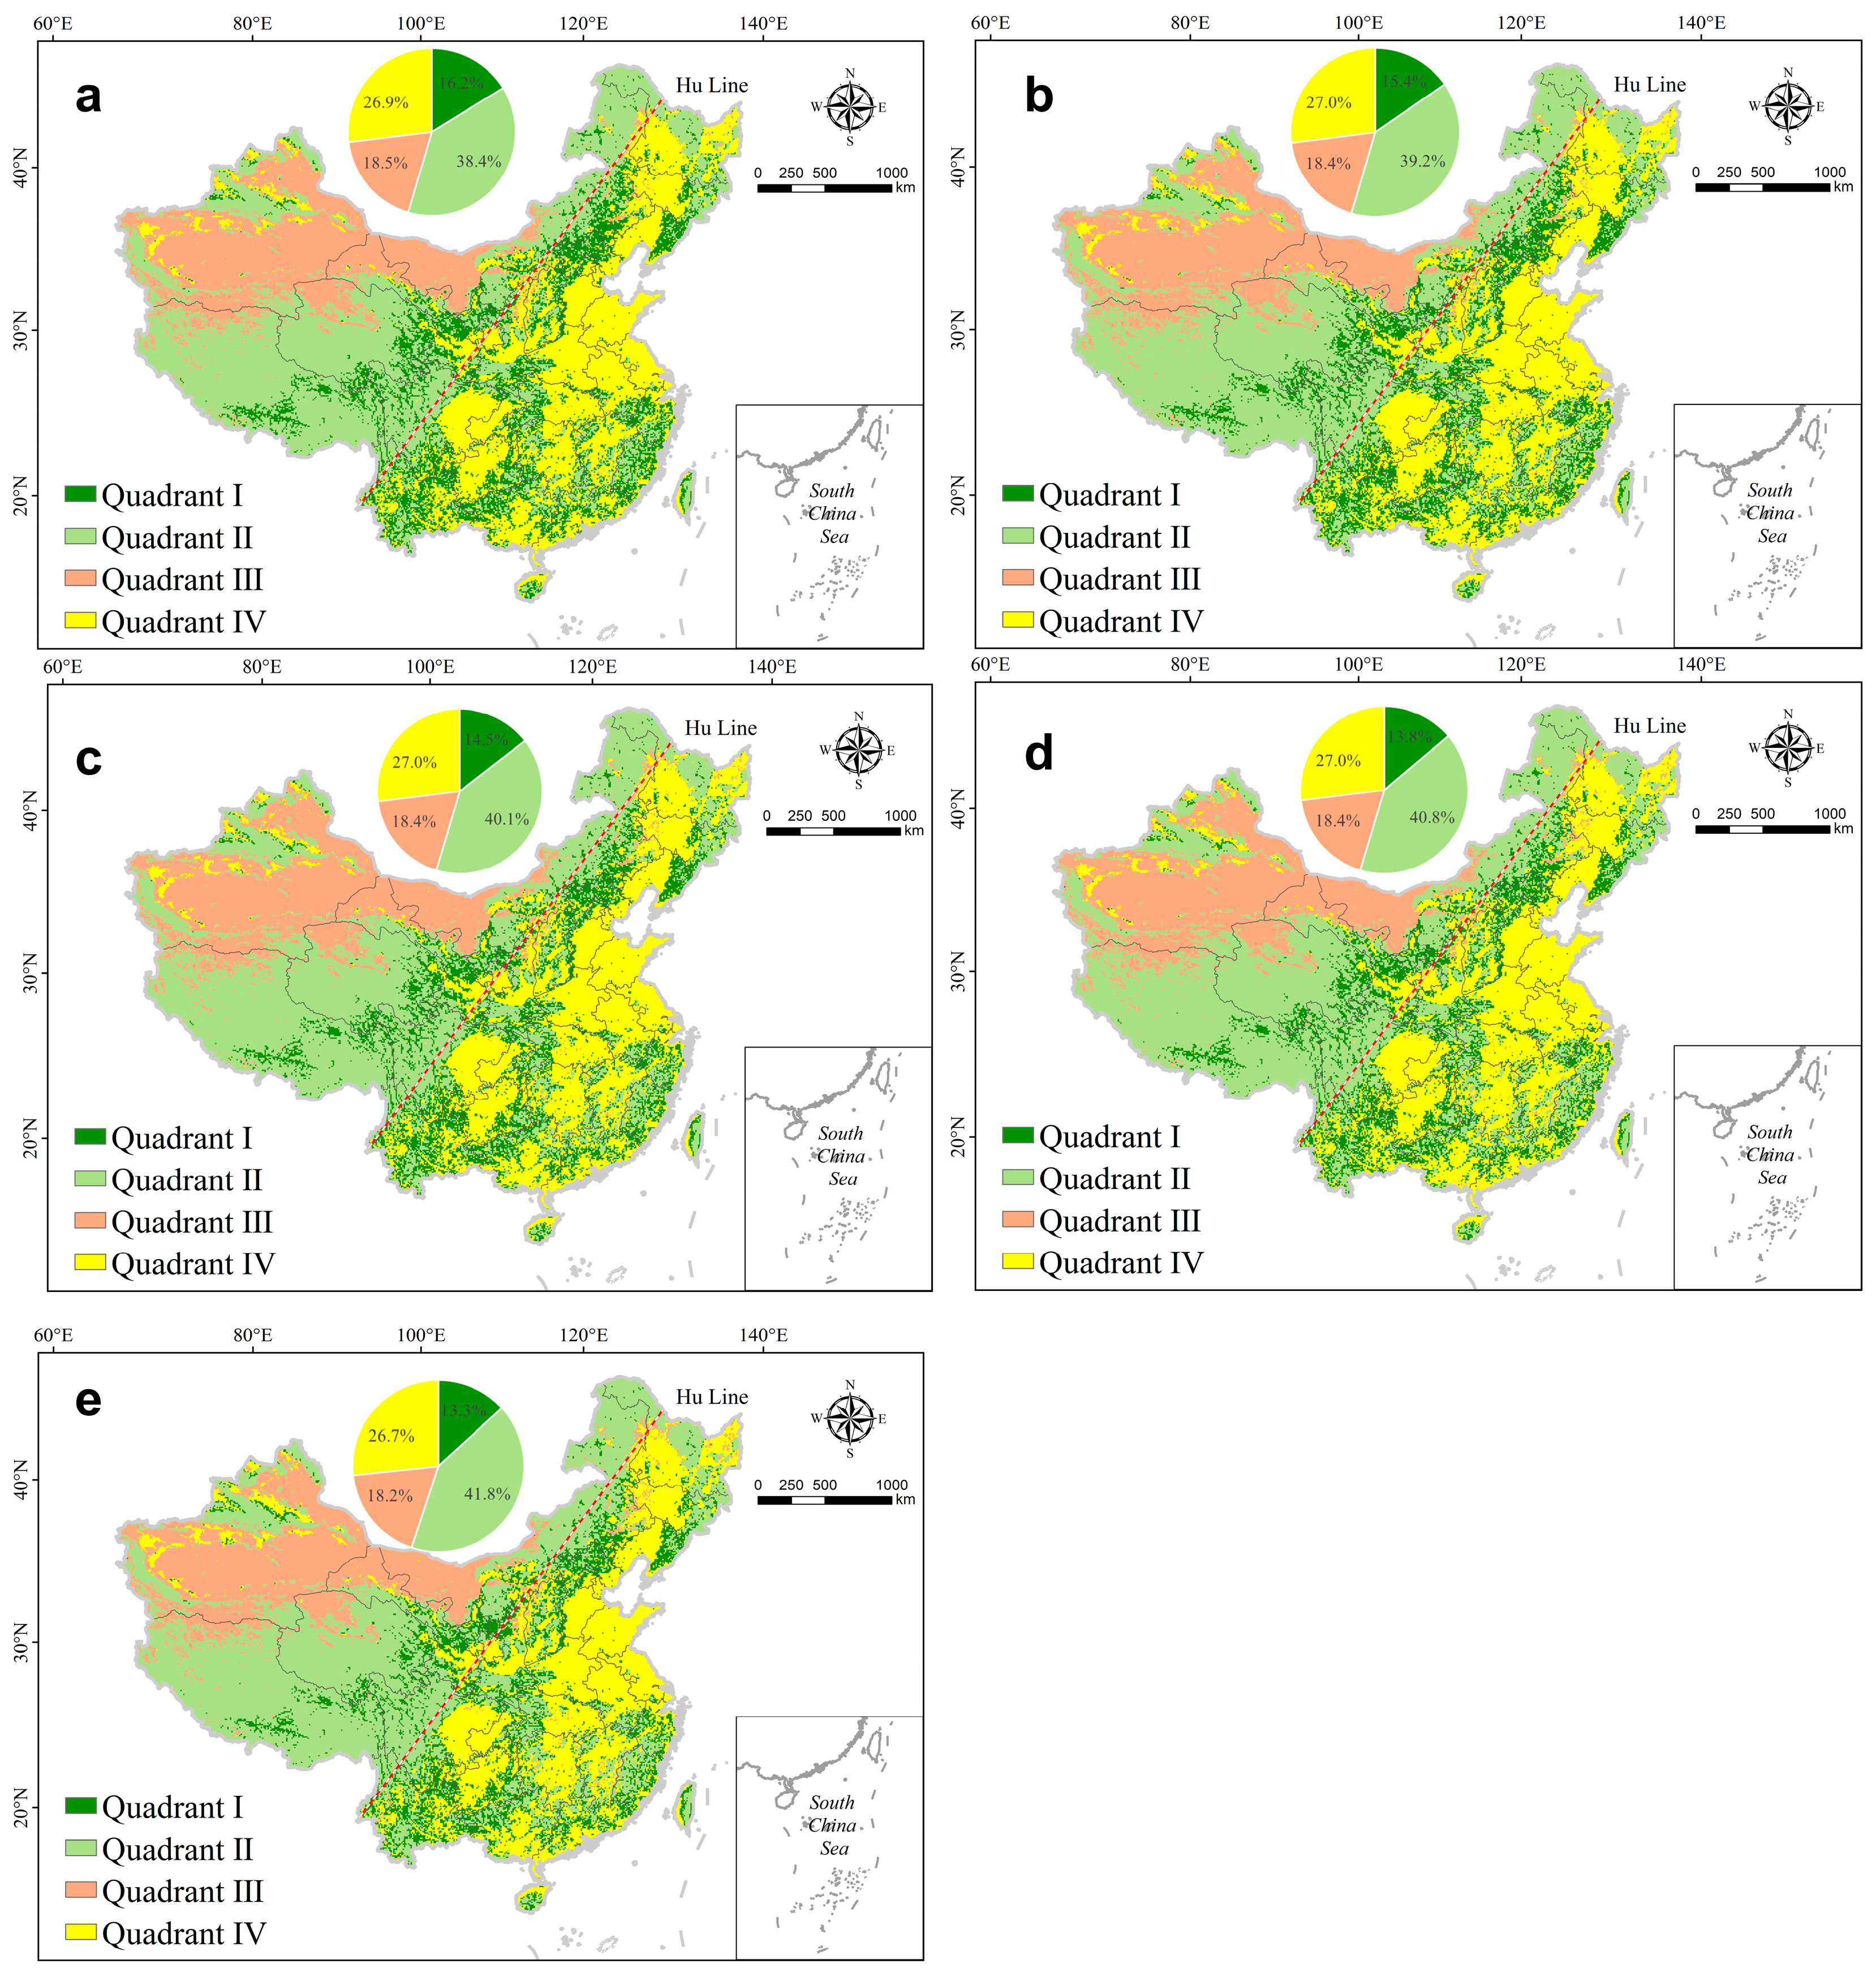
There are apparent spatial differences between the two sides of the “Hu Line” in the four quadrants of the habitat quality and human footprint systems from 2000 to 2020. It shows the characteristics of “quadrant IV on the right is dominant, quadrants II and III on the left are dominant, quadrant I is located in the transition zone of the ‘Hu Line’, “and quadrant III is mainly distributed in the northwest desert (Figure 7). The area ratio shows that “II and IV are dominant, and III and I are supplementary”. From the perspective of trend changes, there is a change in “quadrant II continues to increase, quadrant I continues to decrease, and quadrants III and IV remain basically stable”. Quadrant II accounts for 41.8% in 2020, an increase of 3.4% compared to 2000; quadrant I increased from 2000 to 2020. It decreased from 16.2% in 2020 to 13.3% in 2020; and quadrants III and IV remained at around 18.4% and 27.0%, respectively. This indicates that the spatial distribution in quadrants III and IV is more stable than in quadrants I and II. This suggests that, over the long-term evolution process, regions such as the Northwest (low habitat quality and low human footprint) and the Yangtze River Delta, Beijing–Tianjin–Hebei, and the Greater Bay Area (low habitat quality and high human footprint) exhibit higher stability.
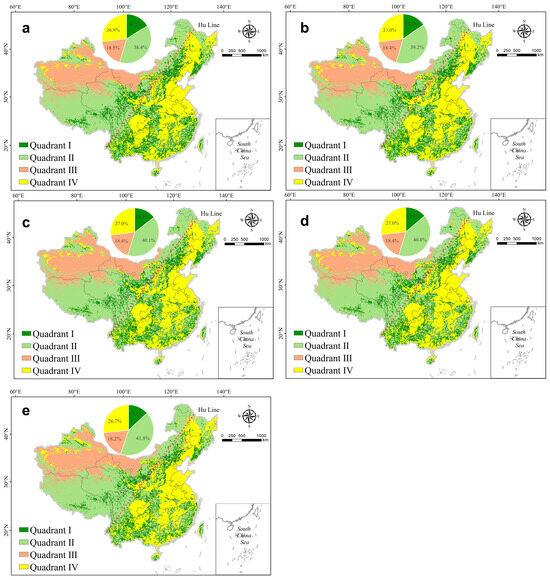
Figure 7.
Spatial distribution and proportion of the four quadrants between the human footprint and HQ from 2000 to 2020 ((a): 2000; (b): 2005; (c): 2010; (d): 2015; and (e): 2020).
In order to further reveal the intrinsic mechanism of the four-quadrant spatial transfer of HQ and HF, we used the GTM method to conduct a four-quadrant spatial transfer analysis. The four-quadrant transfer area accounts for 7.7%, mainly located in the “Hu Line” transition zone and the southeastern region (Figure 8a). From the transfer perspective, quadrant II has the largest transfer share, accounting for 56.5%; quadrant I has transferred 18.0%, and quadrants IV and III have transferred in proportions of 14.1% and 11.5%, respectively. Specifically, the primary transfer type is “I to II”, accounting for 46.5%, which is more than four times that of other transfer types (Figure 8b). It is mainly distributed in areas with relatively good habitat quality, such as eastern Tibet and eastern Qinghai. Regions such as western Sichuan, eastern Inner Mongolia, and the Qinling Mountains in Shaanxi are inseparable from local biodiversity protection and other work [54].
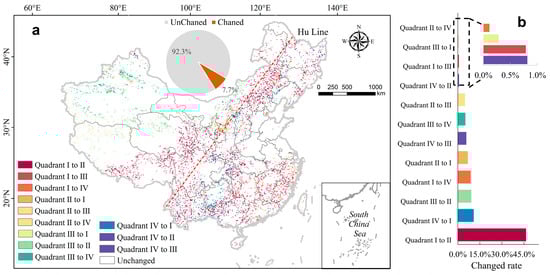
Figure 8.
Spatial distribution of transformations in quadrant levels in China from 2000 to 2020, the proportion of quadrant transferred and untransformed areas (a), and proportions of 12 different transferred areas (b).
3.3. Coupling Degree between Human Footprint and Habitat Quality
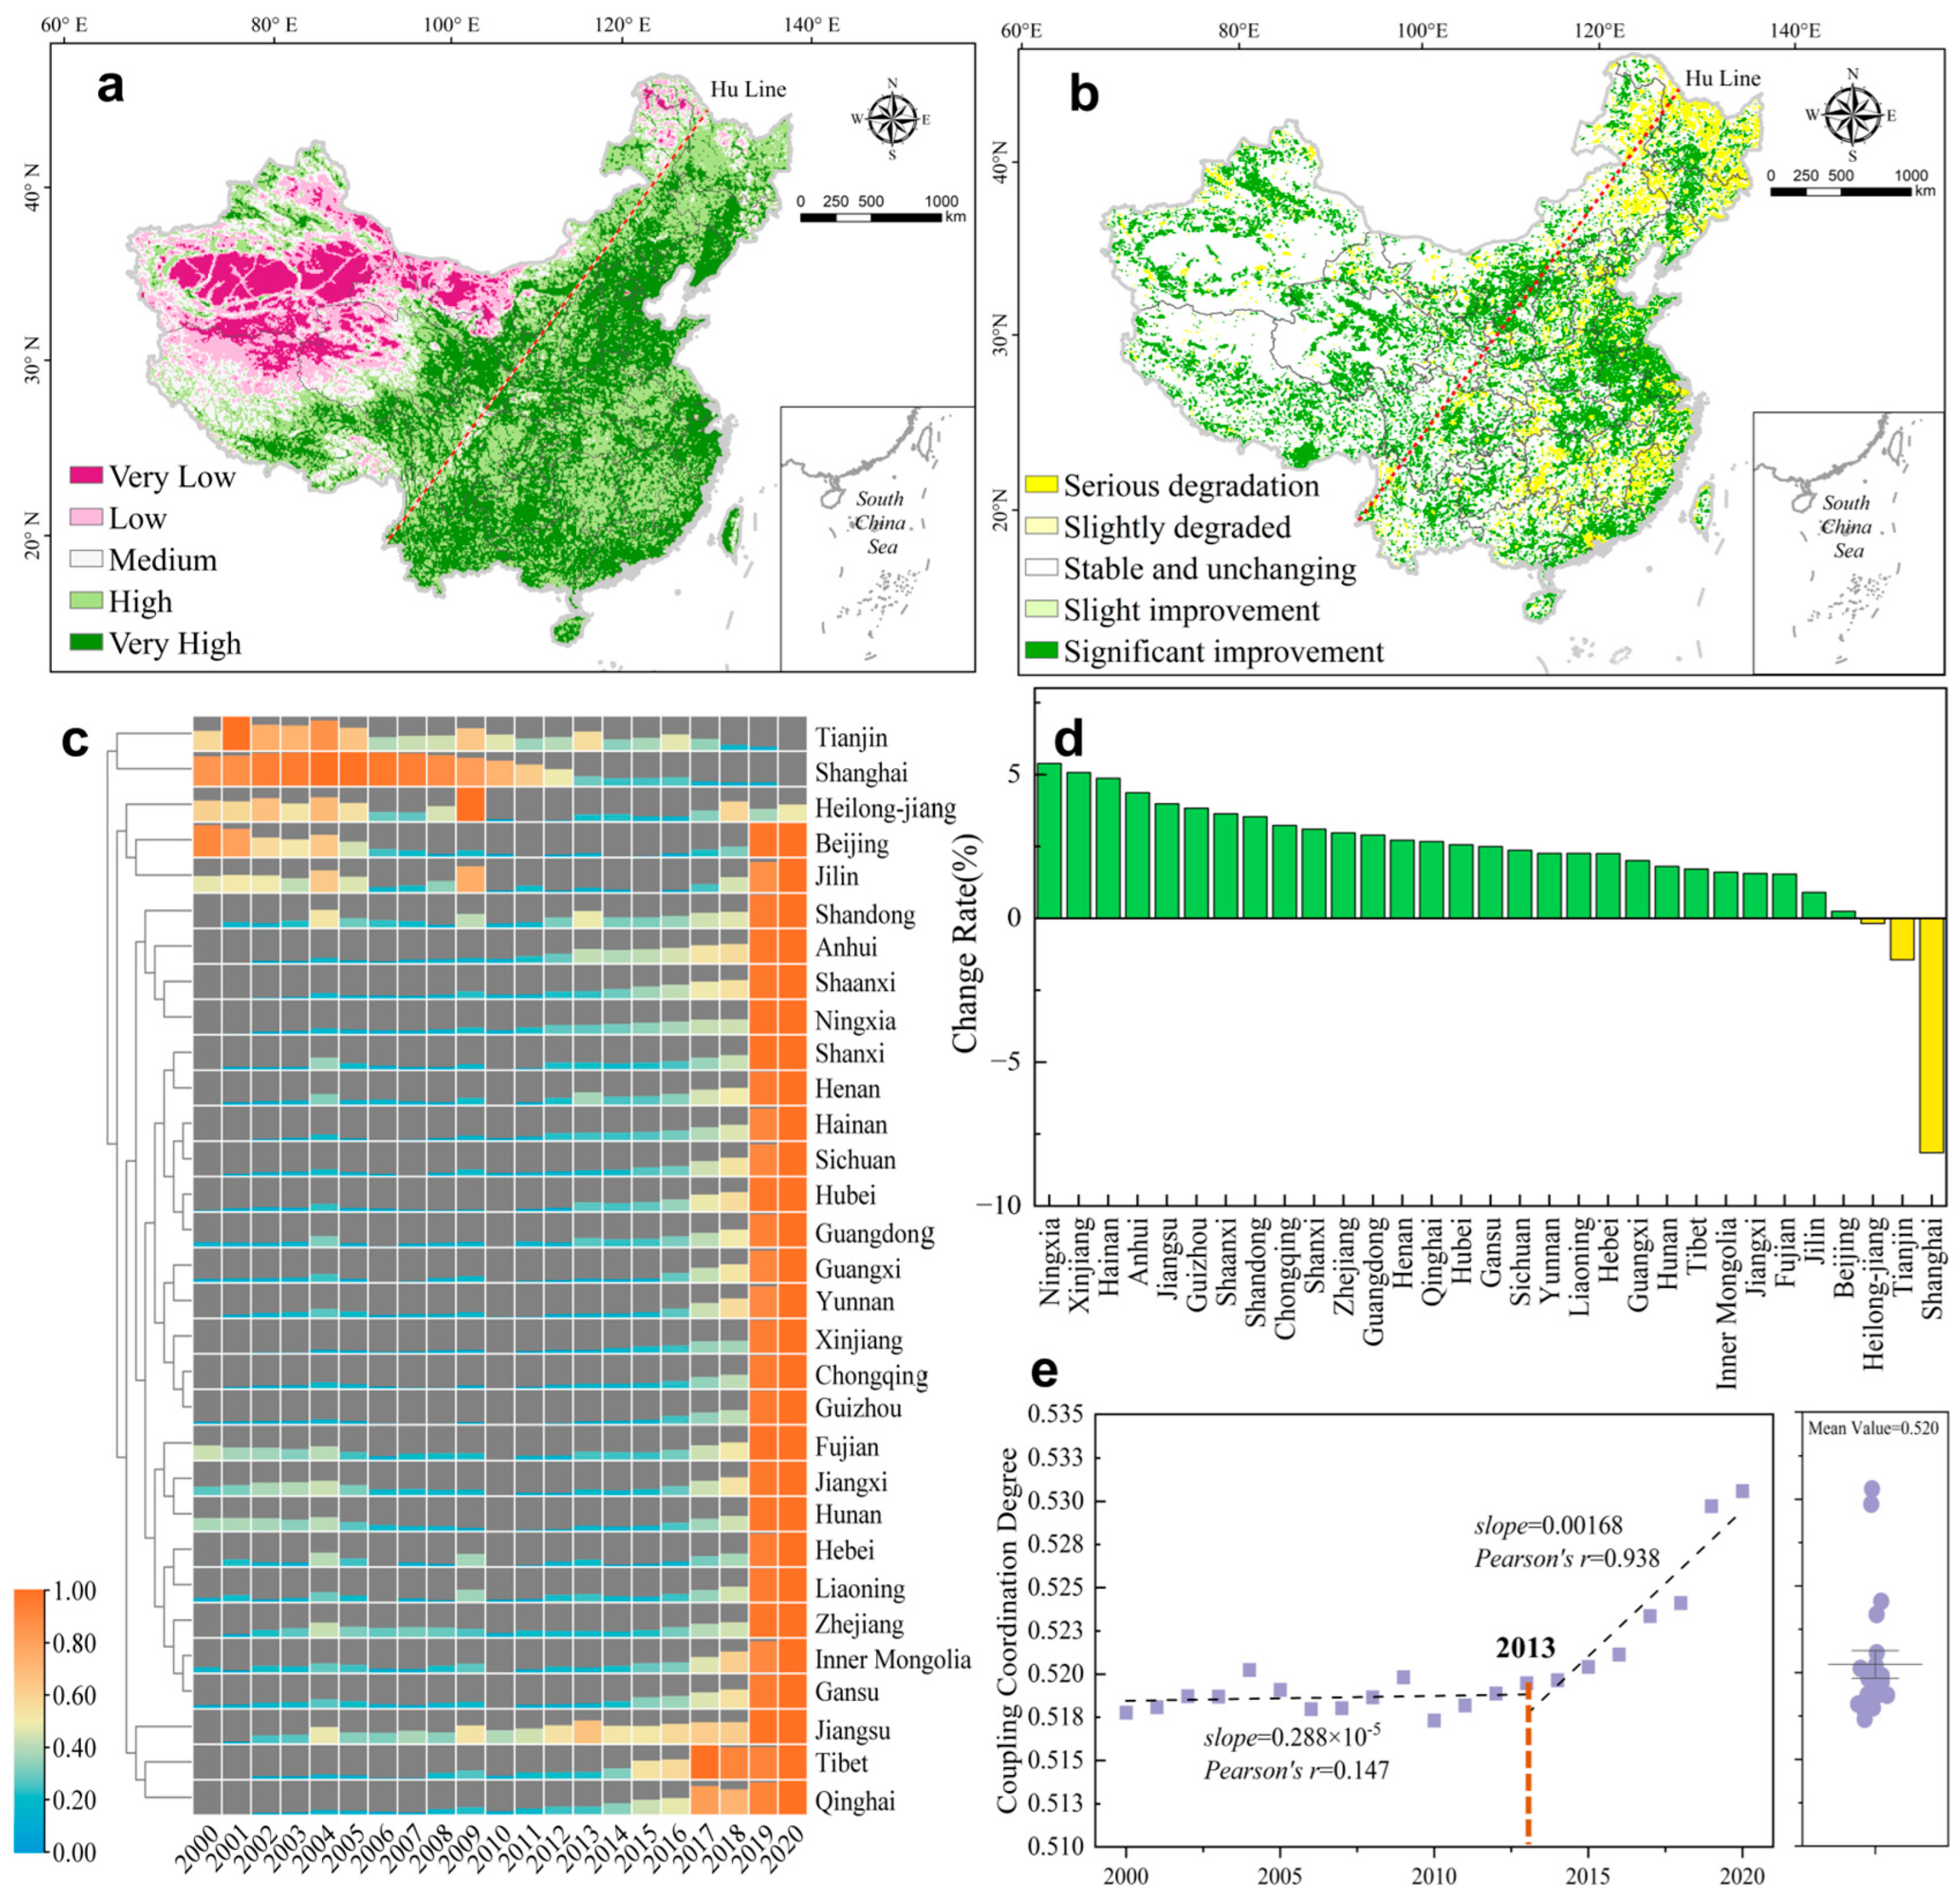
In order to study the evolution of the coupling degree (CCD) of the two systems of human footprint and habitat quality in China over the past 21 years, we used the natural breakpoint method to divide the normalized coupling index into five levels, including very low, low, medium, high, and very high (Figure 9a). We found that most of the areas with very high coupling degrees (0.64–0.87) and high values (0.53–0.63) are distributed on the right side of the “Hu Line”. Only some low values exist along the northeastern border. From the perspective of trend changes, on the left side of the “Hu Line”, most coupling degrees show a significant improvement or improvement. In contrast, on the right side of the “Hu Line”, the northeastern region and the southeastern coastal areas show a trend of degradation or significant degradation (Figure 9b). On a provincial scale, except for Shanghai and Tianjin, the coupling degree of human–land relations in most provinces is generally fluctuating or continuously improving (Figure 9c). The top two improvements are in the northwest region, Ningxia (5.4%) and Xinjiang (5.1%); the most significant improvement was in Ningxia (5.4%). The two regions with the most significant degradation were the two megacities in the east, Shanghai (−8.1%) and Tianjin (1.4%) (Figure 9d).
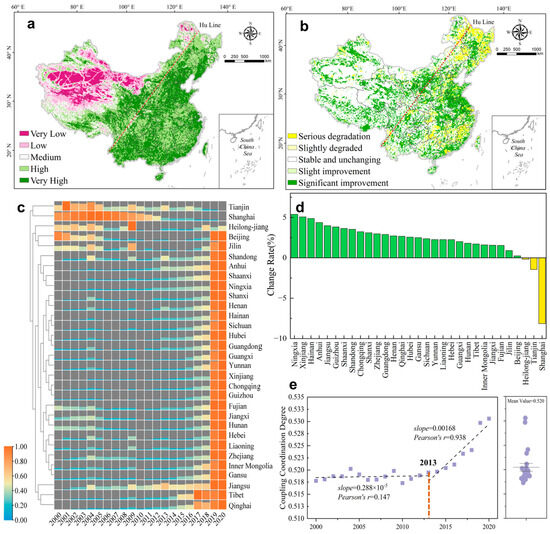
Figure 9.
Spatial distribution of the average coupling degree between human footprint and habitat quality in China from 2000 to 2020 (a); Sen-MK trend change map from 2000 to 2020 (b); heat map of coupling index changes in 31 provinces (c); change rate (d); and national trends (e).
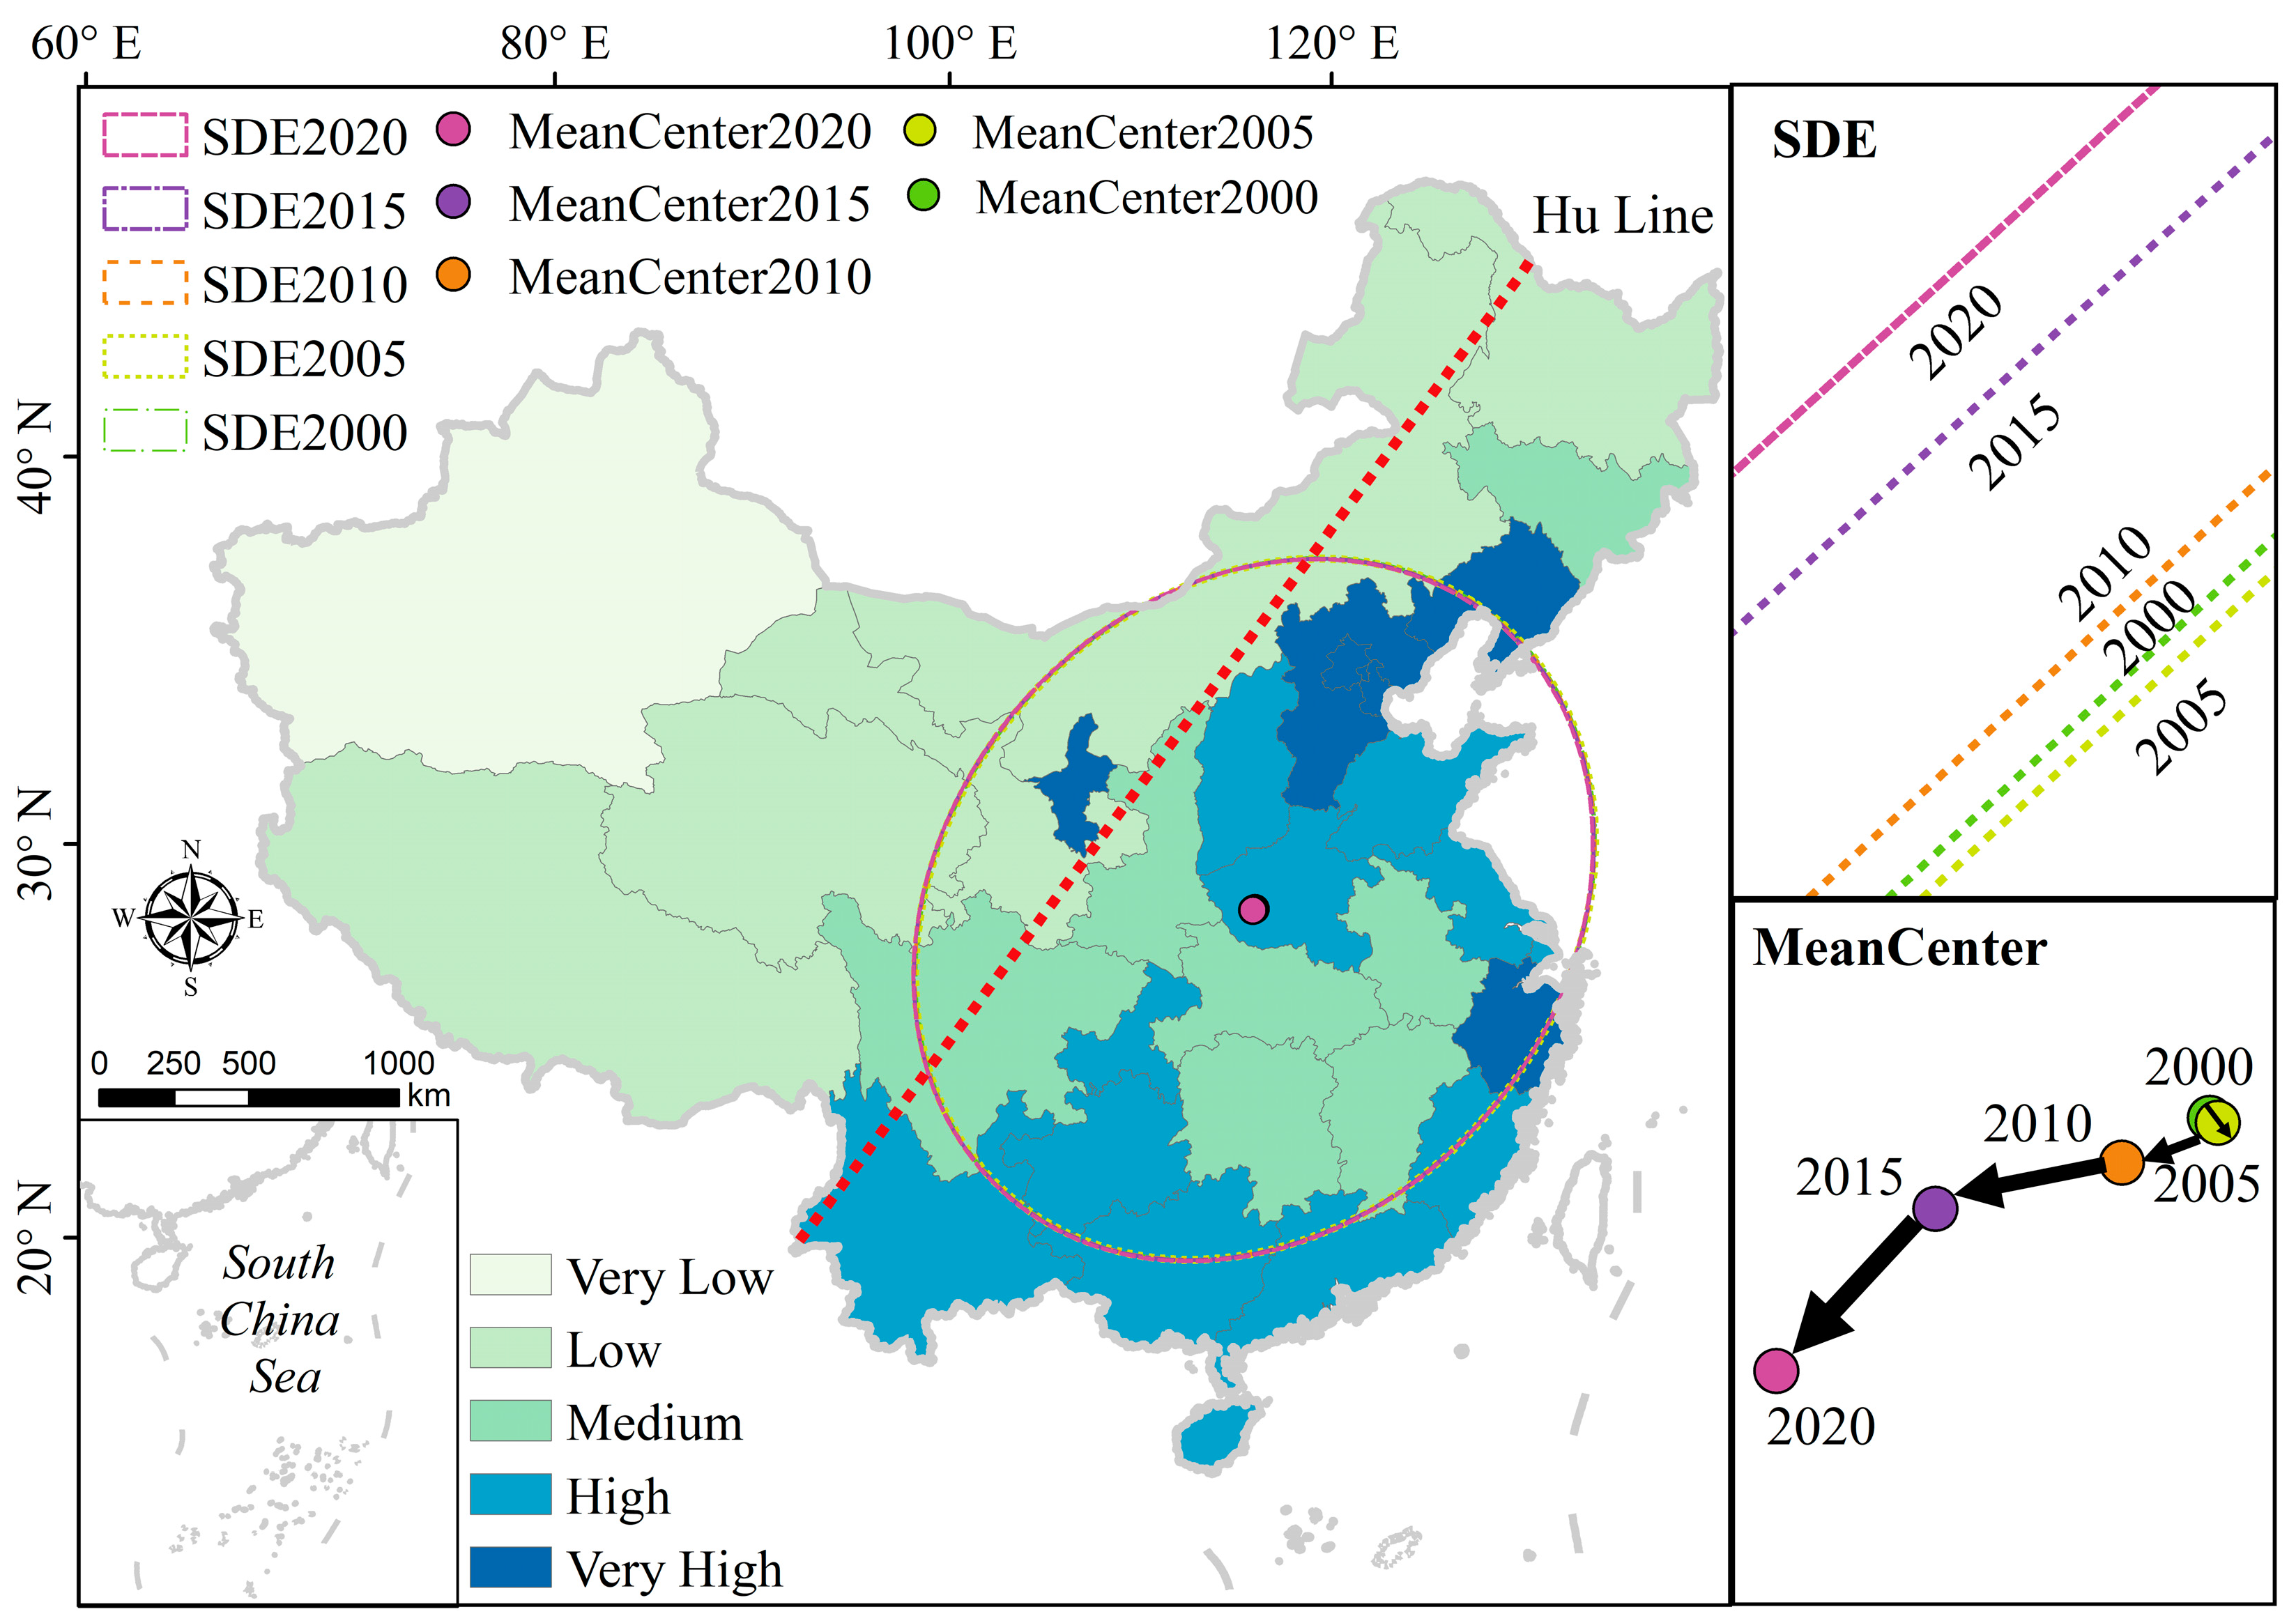
From a national-scale perspective, the 21-year average value of the coupling degree between China’s habitat quality and human footprint is 0.52. The provinces along the coastline on the right side of the “Hu Line” are all greater than the national average (Figure 10). Before 2013, the fluctuations showed a slow improvement state (slope = 0.288 × 10⁻⁵), and, after 2013, they showed a rapid improvement stage (slope = 0.00168) (Figure 9e). In addition, we also found that the center of gravity trajectory of CCD is in Henan Province, showing a migration direction from “northeast to southwest”, which is consistent with the migration trajectory of the center of gravity of the population and economy.
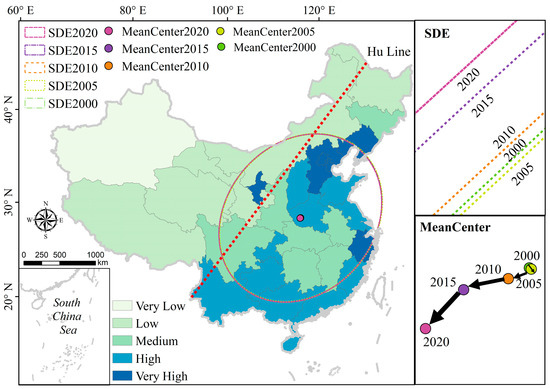
Figure 10.
Mean distribution, standard ellipse, and center of gravity migration of the coupling degree between human footprint and habitat quality in China from 2000 to 2020.
3.4. Fitting Analysis of the Relationship between Human Footprints and Coupling Index
This study is based on four linear, quadratic, cubic, and exponential models with which to study the fitting effect of the coupling degree and human footprints (Table 1). Research shows that all four fitting models have passed the significance test (Sig. > 0) in the past 20 years. Judging from the fitting decisive coefficient R2 from 2000 to 2020, the cubic model is shown to have a better fit (its mean R2 is 0.830), the quadratic model is second (its mean R2 is about 0.724), and the linear model is the worst (its mean R2 is 0.484). In addition, we found that, before 2015, the R2 of all models showed a downward trend, and, after 2015, the R2 showed an upward trend.

Table 1.
Nonlinear fitting of habitat quality and human footprint coupling degree and human footprint from 2000 to 2020.
We found that the cubic model may be overfitted by comparing the fitting curves of the quadratic model and the cubic model from 2000 to 2020 (Figure S4). Judging from the data scatter density distribution, most of the data are distributed on the left side of HF < 0.6, and the “CCD-HF” curve shows a trend of “first rising and then falling”. In addition, the cubic model has two inflection points (HF < 0.6 and HF > 0.6). After the first inflection point (HF < 0.6), the cubic model shows an apparent downward trend, which is inconsistent with the trend of the overall curve. Second, after the second inflection point (HF > 0.6), we see that the overall curve density decreases; however, the outlier clusters formed by the higher values of some HFs lead to the formation of a cubic curve fitting to a certain extent. On the contrary, the quadratic model is first consistent with the scatter density path. More interestingly, when HF < 0.6, the quadratic model is almost located at 50% of all scatter paths, which shows that the quadratic model can better fit.
4. Discussion
4.1. Nonlinear Response Relationship between Coordination Coupling Degree and Human Footprint
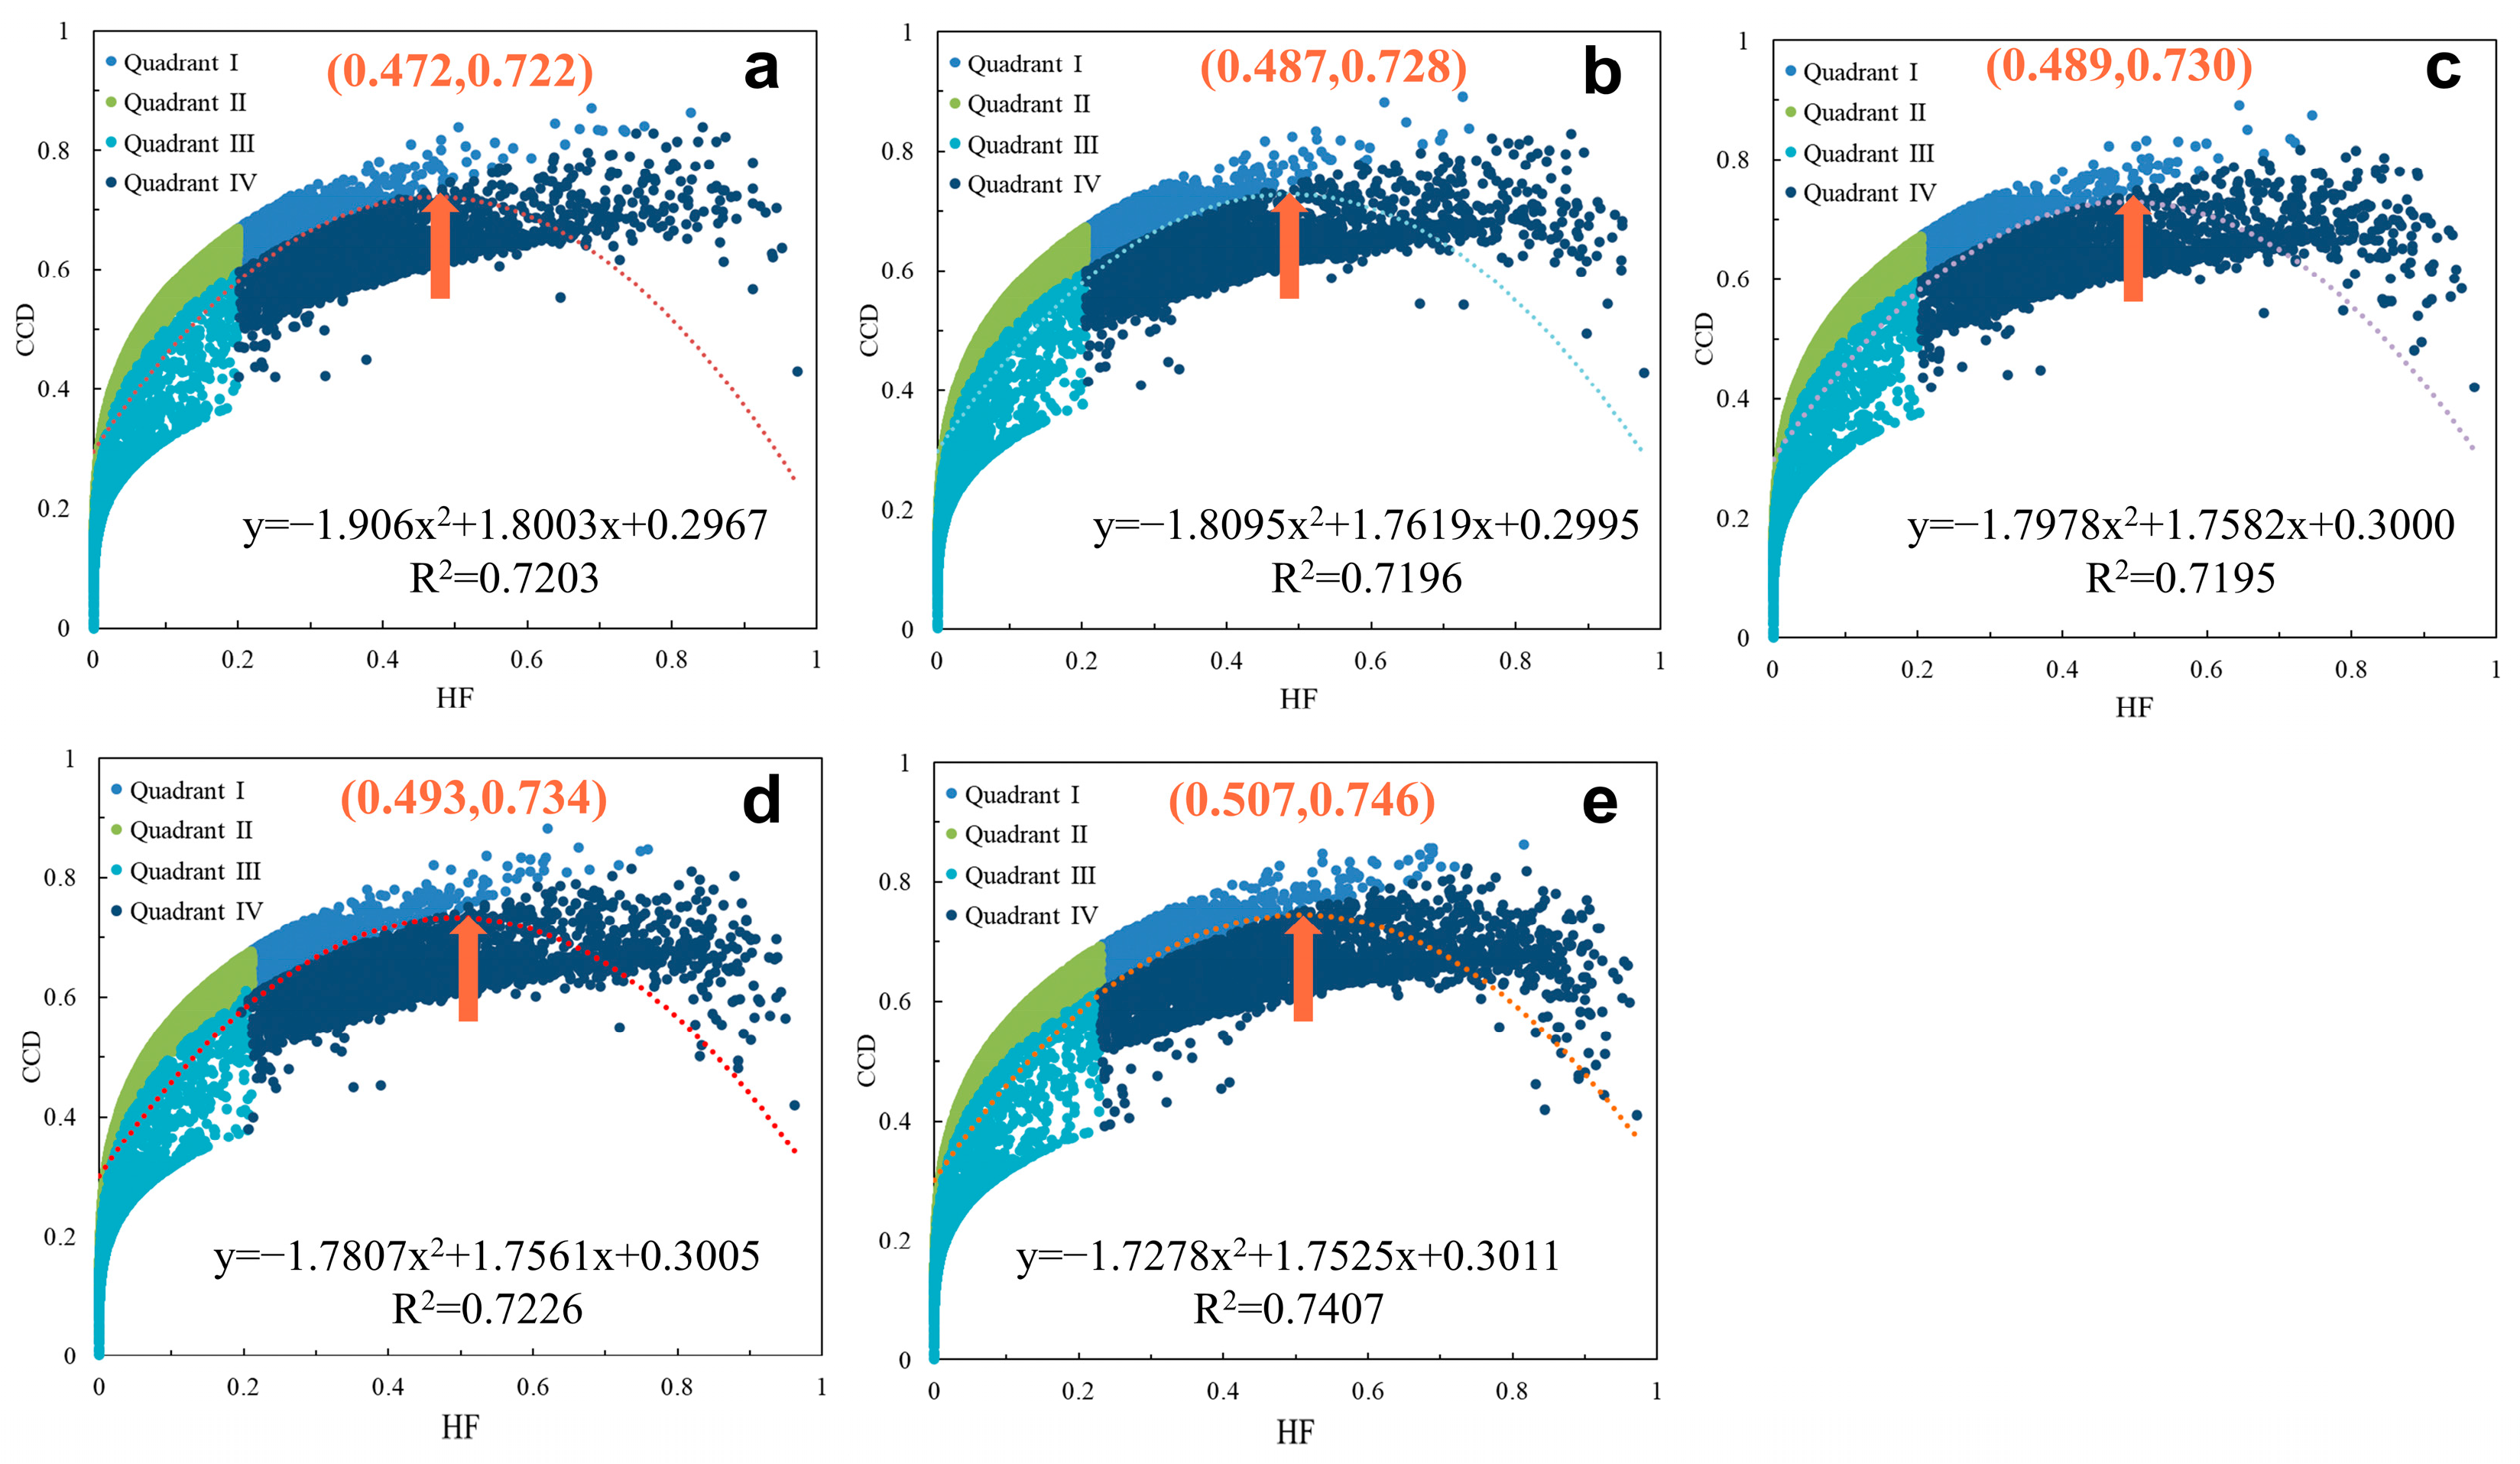
The quadratic model shows that, from 2000 to 2020, the CCD and human footprints showed a “weak inverted U-shape”. The overall CCD trend peaked with the increase in HF, then entered a short plateau period, and then slowly declined (Figure 11). This shows a complex relationship of synergy or trade-off between the CCD and HF. This relationship is nonlinear. To a certain extent, the CCD-HF curve is like the EKC curve. The coupling of other types of ecological environment quality index and human activities has also been found, such as RESI–GDP per capita [55], ESV–urbanization [56], and green development index–environmental footprint [57].
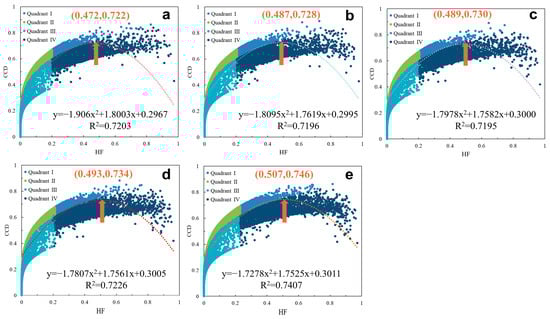
Figure 11.
Coupling the exponential fitting curve and inflection point distribution of China’s quadratic model from 2000 to 2020 ((a): 2000; (b): 2005; (c): 2010; (d): 2015; and (e): 2020).
In addition, the CCD peak position in different years has shifted to the right, from (0.472, 0.721) in 2000 to (0.507, 0.746) in 2020. We found that, before the coupling level reached the stagnation point, the coupling positions of CCD and HF evolved from quadrants II and III to quadrants IV and I. After the stagnation point, the coupling positions of CCD and HF both fell into the high coupling degree and high human footprint; however, this evolutionary characteristic is accompanied by the apparent spatial heterogeneity of habitat quality, such as north and south in addition to east and west, and studies in other regions have also confirmed this view [14,58,59]. Considering the sudden changes in the trends of HF and the CCD in 2013, China has since entered a period of ecological civilization construction, and the country advocates for the sustainable development of the environment and economy [60]. In 2015, China implemented the “China Biotechnology “Diversity Conservation Strategy and Action Plan” and has delineated 35 priority areas for biodiversity conservation, including the Greater Khingan Mountains, Sanjiang Plains, Qilian Mountains, Qin Ling District, and Yellow and Bohai Sea Protection Areas [61]. For example, Zhejiang Province, Fujian Province, Jiangxi Province, Guangdong Province, etc., have achieved improvements in both human footprint and habitat quality through ecological product value realization and other channels [62].
4.2. Expand the Potential Application Scenarios of the “Hu Line”
In 1935, Huanyong Hu proposed an NE–SW population dividing line (Hu Line) from Heihe to Tengchong [63], which reflected China’s population distribution pattern of “dense in the east and sparse in the west”. At the same time, it is also a population line that reflects the natural ecology. It is a vital reference line for the environment, economic development level, differences in social conditions, and urbanization level, and it has unusual stubbornness and stability [64]. In recent years, it has been widely used in the coupling research of urbanization [65], land use [66,67], ecosystems [68], single-system spatiotemporal distribution, and land–urbanization–ecosystem complex systems [69]. This study used the “Hu Line” as a reference line and discovered an interesting phenomenon: the space–time adjoint problem of the CCD. From a spatial scale perspective, the CCD also shows significant “spatial heterogeneity” due to habitat quality and the spatial distribution characteristics of human footprints. Looking at time scales, the significant changes in the CCD were almost accompanied by changes in habitat quality and human footprint around 2013. This is due to the large area of unused land being converted into other land in 2013. On the southeast side of the “Hu Line”, unused land was converted into reduced land due to the continuous increase in the human footprint; on the northwest side of the “Hu Line”, due to human activities such as grazing, unused land was converted into grassland; however, intact land, including wilderness areas, serves as a buffer against species loss and is necessary to maintain biodiversity [70]. Specific to China, the country’s wilderness is mainly distributed on the northwest side of the “Hu Line”. From 2015 to 2020, China’s wilderness area decreased by 2.74%, and the center of gravity moved 893.5 km southwest [71]. This is consistent with the movement direction of the CCD.
4.3. Relevant Policy Recommendations
The increase in the human footprint is an inevitable trend; simply reducing the human footprint can improve regional habitat quality to a certain extent. We should implement policies in different regions, focusing on protecting hot spots where the current coordination between habitat quality and human footprint is poor, and regard these as priority areas for protection. We propose to use the “Hu Line” as the boundary with which to divide the area into three biodiversity protection areas.
First, in the southeastern area of the “Hu Line”, human footprints in these areas show a “high proportion and an increasing trend”. The first type is responsible for the country’s economic security functions, such as the Beijing–Tianjin–Hebei region, the Yangtze River Delta, and other highly developed economic regions. Factors such as the expansion of construction land in these regions have increased the human footprint, leading to the fragmentation of habitat patterns and serious threats to biodiversity [72,73,74]. In the future, ecological landscape land should be rationally planned so as to improve the regional coordination. The other types of areas are responsible for the country’s food security function, such as the northeast region [75], Dongting Lake Basin [76], and Poyang Lake Basin [77]. Food production has grown steadily in these regions, but land degradation as well as reduced biodiversity are also present. For other issues, it is necessary to accelerate the construction of a richer ecological security pattern, such as a protection system composed of mountain forests, grassland, and other communities around agricultural areas and ecological corridors composed of roads, railways, and rivers connecting agricultural areas. In addition, cross-regional ecological compensation in major grain-producing areas must be promoted.
Second, in the “Hu Line” transition zone area, from the northeast to the southwest, many ecologically fragile areas as well as key ecological functional areas are distributed along the line. Due to sudden changes in habitat quality and human footprint, the changes between the four quadrants of HQ and HF are also relatively substantial. In the future, it is necessary to focus on promoting the coordinated development of HQ and HF in the transition zone, relying on paramount ecological protection and restoration projects in addition to significant urban areas (such as the Harbin–Changchun City Group, the Chengdu–Chongqing City Group, the Guanzhong City Group, etc.), as well as constructing a development spatial pattern for the coordinated development of ecological security and a green economy in the transition zone.
Third, in the northwest area of the “Hu Line”, these areas are characterized by arid climates [78], low human footprint, and high habitat quality”. These areas are mainly responsible for national ecological security functions. Areas with a high biodiversity value bear giant human footprint, such as the Qinghai–Tibet Plateau [79], the Hexi Corridor [80], northern Xinjiang, etc. It is necessary to first build a nature reserve system with national parks as the main body, such as Sanjiangyuan, Qilian Mountains, Giant Panda, and other national parks. Secondly, an ecological security pattern should be built with “watersheds as the main body, core ecological functional areas as the basis, and key ecological value points as the auxiliary”. In addition, attention needs to be paid to the impact of human digital footprints on biodiversity [81].
5. Conclusions
This study created a model that combines “assessment analysis, spatiotemporal evolution, system coupling, and nonlinear analysis” to look at how China’s habitat quality and human footprint changed over time and how these changes affected the coupling between 2000 and 2020. The research results provide a data foundation and theoretical support for China to maintain ecological security and coordinately promote economic development. They also provide a scientific basis for maintaining a baseline of ecological security while building a beautiful China. The conclusions are as below:
- (1)
- From a static perspective, from 2000 to 2020, China’s habitat quality and human footprint showed apparent “Hu Line” spatial heterogeneity. From the perspective of habitat quality, very high values are mainly distributed on the left side of the “Hu Line”, such as the Qinghai–Tibet Plateau and the Yellow River Basin. From the perspective of human footprints, very high values are mainly distributed on the right side of the “Hu Line”, such as the Beijing–Tianjin–Hebei, Changchun Triangle, Greater Bay Area, and other urban agglomerations.
- (2)
- From a dynamic perspective, from 2000 to 2020, habitat quality was divided into two evolutionary stages, “degradation–improvement”, with the mutation point in 2013, and the human footprint increasing by 16.75% on average, with the mutation point in 2014. The areas with increased human footprint are mainly distributed in the eastern coastal urban agglomerations; however, the human footprint in areas with excellent habitat quality, such as the Qinghai–Tibet Plateau as well as western and northeastern Sichuan, has shown a significant increase trend.
- (3)
- The areas with high values of the coordinated coupling index of human footprint and habitat quality systems are mainly distributed on the right side of the “Hu Line”. On the left side of the “Hu Line”, the coupling degree is mostly improved, and on the right side of the “Hu Line”, the northeastern region and the southeastern coastal areas show a degradation trend.
- (4)
- Based on the four-quadrant analysis model, the coupling relationship between human footprint and habitat quality in China was obtained. Specifically, with the “Hu line” as the dividing line, there are significant spatial differences in the types of four-quadrant distribution. On the east side of the “Hu Line”, the coupling relationship between China’s human footprint and habitat quality is in Quadrant IV; on the west side of the “Hu Line”, the coupling relationship between the two systems is mainly in Quadrants II and III.
- (5)
- The trend changes in the four quadrants of the HQ&HF system indicate that “quadrant II continues to increase, quadrant I continues to decrease, and quadrants III and IV remain relatively stable”. The area of quadrant II increased by 3.4% in 2000, while quadrant I decreased by 2.9%. From the perspective of spatial transfer mechanisms among the four quadrants, the transferred area accounts for 7.7% of the total area, predominantly located in the southeastern part of the “Hu Line”. The primary transfer type is from “quadrant I to II”, which constitutes 46.5% of the total transfers, a figure more than four times higher than that of other transfer types. The CCD and human footprints present a weak “inverted U-shaped” nonlinear relationship.
Supplementary Materials
The following supporting information can be downloaded at: https://www.mdpi.com/article/10.3390/land13070980/s1. Table S1: Original ESA-CCI land-use data code meanings and their reclassification codes and types. Table S2: Habitat suitability and sensitivity of habitats to threats. Table S3: The weight and the maximum influence distance of the threat source. Table S4: Land-use transfer matrix from 2000 to 2020 (unit: km2). Figure S1: The land-use/cover data from 2000 to 2020 in China. Figure S2: Distribution of human footprints in China from 2000 to 2020. Figure S3: Distribution of habitat quality in China from 2000 to 2020. Figure S4: Scatter fitting plots of the quadratic model and cubic model of the CCD and HF.
Author Contributions
Q.X.: conceptualization, methodology, and writing—original draft and writing—review &and editing; L.L.: software, visualization, and data curation; Y.Z.: software and writing—original draft; C.Q.: resources and funding acquisition. All authors have read and agreed to the published version of the manuscript.
Funding
This study was supported by the China Postdoctoral Science Foundation (NO: 2023M742426); the National Key Research and Development Project of China (NO: 2022YFF1301205); the National Ecological Environment Survey and Assessment of Ministry of Ecology and Environment of China (NO: 22110499001001); and the National Ecological Environment Monitoring Management and Information Release of Ministry Ecology and Environment of China (NO: 22111101004003).
Data Availability Statement
Data can be made available by contacting authors.
Acknowledgments
We are very grateful to TBtools-II (Version No.2.007) for its help in drawing the heat map in this study.
Conflicts of Interest
The authors declare that they have no known conflicting financial interests that could have appeared to influence the work reported in this paper.
References
- Naeem, S.; Chazdon, R.; Duffy, J.E.; Prager, C.; Worm, B. Biodiversity and Human Well-Being: An Essential Link for Sustainable Development. Proc. R. Soc. B Biol. Sci. 2016, 283, 20162091. [Google Scholar] [CrossRef] [PubMed]
- Otero, I.; Farrell, K.N.; Pueyo, S.; Kallis, G.; Kehoe, L.; Haberl, H.; Plutzar, C.; Hobson, P.; García-Márquez, J.; Rodríguez-Labajos, B.; et al. Biodiversity Policy beyond Economic Growth. Conserv. Lett. 2020, 13, e12713. [Google Scholar] [CrossRef] [PubMed]
- Blicharska, M.; Smithers, R.J.; Mikusiński, G.; Rönnbäck, P.; Harrison, P.A.; Nilsson, M.; Sutherland, W.J. Biodiversity’s Contributions to Sustainable Development. Nat. Sustain. 2019, 2, 1083–1093. [Google Scholar] [CrossRef]
- Lin, L.; Wei, X.; Luo, P.; Wang, S.; Kong, D.; Yang, J. Ecological Security Patterns at Different Spatial Scales on the Loess Plateau. Remote Sens. 2023, 15, 1011. [Google Scholar] [CrossRef]
- Wei, Q.; Abudureheman, M.; Halike, A.; Yao, K.; Yao, L.; Tang, H.; Tuheti, B. Temporal and Spatial Variation Analysis of Habitat Quality on the PLUS-InVEST Model for Ebinur Lake Basin, China. Ecol. Indic. 2022, 145, 109632. [Google Scholar] [CrossRef]
- Tang, F.; Wang, L.; Guo, Y.; Fu, M.; Huang, N.; Duan, W.; Luo, M.; Zhang, J.; Li, W.; Song, W. Spatio-Temporal Variation and Coupling Coordination Relationship between Urbanisation and Habitat Quality in the Grand Canal, China. Land Use Policy 2022, 117, 106119. [Google Scholar] [CrossRef]
- Buchanan, G.M.; Butchart, S.H.M.; Chandler, G.; Gregory, R.D. Assessment of National-Level Progress towards Elements of the Aichi Biodiversity Targets. Ecol. Indic. 2020, 116, 106497. [Google Scholar] [CrossRef]
- Wrobel, V.; Millette, K.; Radulovici, A. COP15. Science 2023, 8, 10. [Google Scholar]
- Xu, H.; Cao, Y.; Yu, D.; Cao, M.; He, Y.; Gill, M.; Pereira, H.M. Ensuring Effective Implementation of the Post-2020 Global Biodiversity Targets. Nat. Ecol. Evol. 2021, 5, 411–418. [Google Scholar] [CrossRef]
- Bandari, R.; Moallemi, E.A.; Lester, R.E.; Downie, D.; Bryan, B.A. Prioritising Sustainable Development Goals, Characterising Interactions, and Identifying Solutions for Local Sustainability. Environ. Sci. Policy 2022, 127, 325–336. [Google Scholar] [CrossRef]
- Sharp, R.; Douglass, J.; Wolny, S.; Arkema, K.; Bernhardt, J.; Bierbower, W.; Chaumont, N.; Denu, D.; Fisher, D.; Glowinski, K.; et al. InVEST 3.9.0 User’s Guide; The Natural Capital Project, Stanford University, University of Minnesota, The Nature Conservancy, and World Wildlife Fund: Minneapolis, MN, USA, 2020. [Google Scholar]
- Yohannes, H.; Soromessa, T.; Argaw, M.; Dewan, A. Spatio-Temporal Changes in Habitat Quality and Linkage with Landscape Characteristics in the Beressa Watershed, Blue Nile Basin of Ethiopian Highlands. J. Environ. Manag. 2021, 281, 111885. [Google Scholar] [CrossRef]
- Aznarez, C.; Svenning, J.-C.; Taveira, G.; Baró, F.; Pascual, U. Wildness and Habitat Quality Drive Spatial Patterns of Urban Biodiversity. Landsc. Urban Plan. 2022, 228, 104570. [Google Scholar] [CrossRef]
- Yang, L.; Pan, S.; Chen, W.; Zeng, J.; Xu, H.; Gu, T. Spatially Non-Stationary Response of Habitat Quality to Land Use Activities in World’s Protected Areas over 20 Years. J. Clean. Prod. 2023, 419, 138245. [Google Scholar] [CrossRef]
- Wu, Y.; Wang, J.; Gou, A. Research on the Evolution Characteristics, Driving Mechanisms and Multi-Scenario Simulation of Habitat Quality in the Guangdong-Hong Kong-Macao Greater Bay Based on Multi-Model Coupling. Sci. Total Environ. 2024, 924, 171263. [Google Scholar] [CrossRef]
- Ji, X.; Sun, Y.; Guo, W.; Zhao, C.; Li, K. Land Use and Habitat Quality Change in the Yellow River Basin: A Perspective with Different CMIP6-Based Scenarios and Multiple Scales. J. Environ. Manag. 2023, 345, 118729. [Google Scholar] [CrossRef] [PubMed]
- Zhao, Y.; Qu, Z.; Zhang, Y.; Ao, Y.; Han, L.; Kang, S.; Sun, Y. Effects of Human Activity Intensity on Habitat Quality Based on Nighttime Light Remote Sensing: A Case Study of Northern Shaanxi, China. Sci. Total Environ. 2022, 851, 158037. [Google Scholar] [CrossRef]
- Dong, J.; Zhang, Z.; Liu, B.; Zhang, X.; Zhang, W.; Chen, L. Spatiotemporal Variations and Driving Factors of Habitat Quality in the Loess Hilly Area of the Yellow River Basin: A Case Study of Lanzhou City, China. J. Arid Land 2022, 14, 637–652. [Google Scholar] [CrossRef]
- Chen, L.; Wei, Q.; Fu, Q.; Feng, D. Spatiotemporal Evolution Analysis of Habitat Quality under High-Speed Urbanization: A Case Study of Urban Core Area of China Lin-Gang Free Trade Zone (2002–2019). Land 2021, 10, 167. [Google Scholar] [CrossRef]
- Chen, X.; Yu, L.; Cao, Y.; Xu, Y.; Zhao, Z.; Zhuang, Y.; Liu, X.; Du, Z.; Liu, T.; Yang, B.; et al. Habitat Quality Dynamics in China’s First Group of National Parks in Recent Four Decades: Evidence from Land Use and Land Cover Changes. J. Environ. Manag. 2023, 325, 116505. [Google Scholar] [CrossRef]
- Yang, Y. Evolution of Habitat Quality and Association with Land-Use Changes in Mountainous Areas: A Case Study of the Taihang Mountains in Hebei Province, China. Ecol. Indic. 2021, 129, 107967. [Google Scholar] [CrossRef]
- Wu, J.; Bai, Z. Spatial and Temporal Changes of the Ecological Footprint of China’s Resource-Based Cities in the Process of Urbanization. Resour. Policy 2022, 75, 102491. [Google Scholar] [CrossRef]
- Venter, O.; Sanderson, E.W.; Magrach, A.; Allan, J.R.; Beher, J.; Jones, K.R.; Possingham, H.P.; Laurance, W.F.; Wood, P.; Fekete, B.M.; et al. Global Terrestrial Human Footprint Maps for 1993 and 2009. Sci. Data 2016, 3, 160067. [Google Scholar] [CrossRef] [PubMed]
- Williams, B.A.; Venter, O.; Allan, J.R.; Atkinson, S.C.; Rehbein, J.A.; Ward, M.; Di Marco, M.; Grantham, H.S.; Ervin, J.; Goetz, S.J.; et al. Change in Terrestrial Human Footprint Drives Continued Loss of Intact Ecosystems. One Earth 2020, 3, 371–382. [Google Scholar] [CrossRef]
- Pecl, G.T.; Araújo, M.B.; Bell, J.D.; Blanchard, J.; Bonebrake, T.C.; Chen, I.-C.; Clark, T.D.; Colwell, R.K.; Danielsen, F.; Evengård, B.; et al. Biodiversity Redistribution under Climate Change: Impacts on Ecosystems and Human Well-Being. Science 2017, 355, eaai9214. [Google Scholar] [CrossRef] [PubMed]
- Wang, L.; Wang, S.; Zhou, Y.; Liu, W.; Hou, Y.; Zhu, J.; Wang, F. Mapping Population Density in China between 1990 and 2010 Using Remote Sensing. Remote Sens. Environ. 2018, 210, 269–281. [Google Scholar] [CrossRef]
- Zhang, L.; Ren, Z.; Chen, B.; Gong, P.; Xu, B.; Fu, H. A Prolonged Artificial Nighttime-Light Dataset of China (1984–2020). Sci. Data 2024, 11, 414. [Google Scholar] [CrossRef] [PubMed]
- Sanderson, E.W.; Jaiteh, M.; Levy, M.A.; Redford, K.H.; Wannebo, A.V.; Woolmer, G. The Human Footprint and the Last of the Wild: The Human Footprint Is a Global Map of Human Influence on the Land Surface, Which Suggests That Human Beings Are Stewards of Nature, Whether We like It or Not. BioScience 2002, 52, 891–904. [Google Scholar] [CrossRef]
- Venter, O.; Sanderson, E.W.; Magrach, A.; Allan, J.R.; Beher, J.; Jones, K.R.; Possingham, H.P.; Laurance, W.F.; Wood, P.; Fekete, B.M.; et al. Sixteen Years of Change in the Global Terrestrial Human Footprint and Implications for Biodiversity Conservation. Nat. Commun. 2016, 7, 12558. [Google Scholar] [CrossRef]
- Qi, Y.; Lian, X.; Wang, H.; Zhang, J.; Yang, R. Dynamic Mechanism between Human Activities and Ecosystem Services: A Case Study of Qinghai Lake Watershed, China. Ecol. Indic. 2020, 117, 106528. [Google Scholar] [CrossRef]
- Correa Ayram, C.A.; Etter, A.; Díaz-Timoté, J.; Rodríguez Buriticá, S.; Ramírez, W.; Corzo, G. Spatiotemporal Evaluation of the Human Footprint in Colombia: Four Decades of Anthropic Impact in Highly Biodiverse Ecosystems. Ecol. Indic. 2020, 117, 106630. [Google Scholar] [CrossRef]
- Su, J.; Yin, H.; Kong, F. Ecological Networks in Response to Climate Change and the Human Footprint in the Yangtze River Delta Urban Agglomeration, China. Landsc. Ecol. 2021, 36, 2095–2112. [Google Scholar] [CrossRef]
- Yu, T.; Abulizi, A.; Xu, Z.; Jiang, J.; Akbar, A.; Ou, B.; Xu, F. Evolution of Environmental Quality and Its Response to Human Disturbances of the Urban Agglomeration in the Northern Slope of the Tianshan Mountains. Ecol. Indic. 2023, 153, 110481. [Google Scholar] [CrossRef]
- Mu, H.; Li, X.; Wen, Y.; Huang, J.; Du, P.; Su, W.; Miao, S.; Geng, M. A Global Record of Annual Terrestrial Human Footprint Dataset from 2000 to 2018. Sci. Data 2022, 9, 176. [Google Scholar] [CrossRef] [PubMed]
- Qin, C.; Xue, Q.; Zhang, J.; Lu, L.; Xiong, S.; Xiao, Y.; Zhang, X.; Wang, J. A Beautiful China Initiative Towards the Harmony between Humanity and the Nature. Front. Environ. Sci. Eng. 2024, 18, 71. [Google Scholar] [CrossRef]
- Lou, H.; Shi, X.; Ren, X.; Yang, S.; Cai, M.; Pan, Z.; Zhu, Y.; Feng, D.; Zhou, B. Limited Terrestrial Carbon Sinks and Increasing Carbon Emissions from the Hu Line Spatial Pattern Perspective in China. Ecol. Indic. 2024, 162, 112035. [Google Scholar] [CrossRef]
- Yang, Y.; Xiao, P.; Feng, X.; Li, H. Accuracy Assessment of Seven Global Land Cover Datasets over China. ISPRS J. Photogramm. Remote Sens. 2017, 125, 156–173. [Google Scholar] [CrossRef]
- He, Y.; Liang, Y.; Liu, L.; Yin, Z.; Huang, J. Loss of Green Landscapes Due to Urban Expansion in China. Resour. Conserv. Recycl. 2023, 199, 107228. [Google Scholar] [CrossRef]
- Yang, R.; Ren, F.; Xu, W.; Ma, X.; Zhang, H.; He, W. China’s Ecosystem Service Value in 1992–2018: Pattern and Anthropogenic Driving Factors Detection Using Bayesian Spatiotemporal Hierarchy Model. J. Environ. Manag. 2022, 302, 114089. [Google Scholar] [CrossRef]
- Theobald, D.M.; Kennedy, C.; Chen, B.; Oakleaf, J.; Baruch-Mordo, S.; Kiesecker, J. Earth Transformed: Detailed Mapping of Global Human Modification from 1990 to 2017. Earth Syst. Sci. Data 2020, 12, 1953–1972. [Google Scholar] [CrossRef]
- Liao, Z.; Su, K.; Jiang, X.; Wang, J.; You, Y.; Wang, L.; Chang, S.; Wei, C.; Zhang, Y.; Li, C. Spatiotemporal Variation and Coupling of Grazing Intensity and Ecosystem Based on Four Quadrant Model on the Inner Mongolia. Ecol. Indic. 2023, 152, 110379. [Google Scholar] [CrossRef]
- Sun, Y.; Liu, S.; Shi, F.; An, Y.; Li, M.; Liu, Y. Spatio-Temporal Variations and Coupling of Human Activity Intensity and Ecosystem Services Based on the Four-Quadrant Model on the Qinghai-Tibet Plateau. Sci. Total Environ. 2020, 743, 140721. [Google Scholar] [CrossRef]
- Zheng, Z.; Wu, Z.; Chen, Y.; Yang, Z.; Marinello, F. Exploration of Eco-Environment and Urbanization Changes in Coastal Zones: A Case Study in China over the Past 20 Years. Ecol. Indic. 2020, 119, 106847. [Google Scholar] [CrossRef]
- Li, Y.; Li, Y.; Zhou, Y.; Shi, Y.; Zhu, X. Investigation of a Coupling Model of Coordination between Urbanization and the Environment. J. Environ. Manag. 2012, 98, 127–133. [Google Scholar] [CrossRef]
- Chang, X.; Xing, Y.; Wang, J.; Yang, H.; Gong, W. Effects of Land Use and Cover Change (LUCC) on Terrestrial Carbon Stocks in China between 2000 and 2018. Resour. Conserv. Recycl. 2022, 182, 106333. [Google Scholar] [CrossRef]
- Lyu, J.; Fu, X.; Lu, C.; Zhang, Y.; Luo, P.; Guo, P.; Huo, A.; Zhou, M. Quantitative Assessment of Spatiotemporal Dynamics in Vegetation NPP, NEP and Carbon Sink Capacity in the Weihe River Basin from 2001 to 2020. J. Clean. Prod. 2023, 428, 139384. [Google Scholar] [CrossRef]
- Yang, D.; Luan, W.; Li, Y.; Zhang, Z.; Tian, C. Multi-Scenario Simulation of Land Use and Land Cover Based on Shared Socioeconomic Pathways: The Case of Coastal Special Economic Zones in China. J. Environ. Manag. 2023, 335, 117536. [Google Scholar] [CrossRef]
- Akritas, M.G.; Murphy, S.A.; Lavalley, M.P. The Theil-Sen Estimator with Doubly Censored Data and Applications to Astronomy. J. Am. Stat. Assoc. 1995, 90, 170–177. [Google Scholar] [CrossRef]
- Gao, X.; Zhang, H.; Huang, L.; Fan, J.; Liu, X.; Cao, W.; Liu, H.; Liu, G. Where, When, and How Much Should We Pay for Wind Erosion Prevention Services of the Largest Chinese Grassland Reserve? Environ. Sci. Technol. 2024, 58, 2615–2626. [Google Scholar] [CrossRef]
- Wan, H.; Xie, Y.; Li, B.; Cai, Y.; Yang, Z. An Integrated Method to Identify and Evaluate the Impact of Hydropower Development on Terrestrial Ecosystem. Environ. Impact Assess. Rev. 2023, 99, 107042. [Google Scholar] [CrossRef]
- Wu, Y.; Yang, J.; Li, S.; Guo, C.; Yang, X.; Xu, Y.; Yue, F.; Peng, H.; Chen, Y.; Gu, L.; et al. NDVI-Based Vegetation Dynamics and Their Responses to Climate Change and Human Activities from 2000 to 2020 in Miaoling Karst Mountain Area, SW China. Land 2023, 12, 1267. [Google Scholar] [CrossRef]
- Sen, P.K. Estimates of the Regression Coefficient Based on Kendall’s Tau. J. Am. Stat. Assoc. 1968, 63, 1379–1389. [Google Scholar] [CrossRef]
- Theil, H. A Rank-Invariant Method of Linear and Polynomial Regression Analysis. In Henri Theil’s Contributions to Economics and Econometrics: Econometric Theory and Methodology; Raj, B., Koerts, J., Eds.; Advanced Studies in Theoretical and Applied Econometrics; Springer: Dordrecht, The Netherlands, 1992; pp. 345–381. ISBN 978-94-011-2546-8. [Google Scholar]
- Mao, C.; Ren, Q.; He, C.; Qi, T. Assessing Direct and Indirect Impacts of Human Activities on Natural Habitats in the Qinghai-Tibet Plateau from 2000 to 2020. Ecol. Indic. 2023, 157, 111217. [Google Scholar] [CrossRef]
- Fang, X.; Gao, S. An Empirical Study on Relationship between Island Ecological Environment and Socio-Economic Development from Perspective of Environmental Kuznets Curve (EKC). Ocean Coast. Manag. 2023, 244, 106819. [Google Scholar] [CrossRef]
- Hu, Z.; Gong, J.; Li, J.; Li, R.; Zhang, Z.; Zhong, F.; Wen, C. Valuing the Coordinated Development of Urbanization and Ecosystem Service Value in Border Counties. J. Clean. Prod. 2023, 415, 137799. [Google Scholar] [CrossRef]
- Chen, Y.; Yang, L.; Peng, H.; Zhang, X.; Zhang, S.; Lu, H.; Yao, L.; Xia, J. Relevance Evaluation and Spatial Differentiation Analysis between Green Development and Environmental Footprint in China’s Three Typical Mega-Urban Agglomerations. J. Clean. Prod. 2024, 436, 140644. [Google Scholar] [CrossRef]
- An, Q.; Yuan, X.; Zhang, X.; Yang, Y.; Chen, J.; An, J. Spatio-Temporal Interaction and Constraint Effects between Ecosystem Services and Human Activity Intensity in Shaanxi Province, China. Ecol. Indic. 2024, 160, 111937. [Google Scholar] [CrossRef]
- Yang, L.; Xu, H.; Pan, S.; Chen, W.; Zeng, J. Identifying the Impact of Global Human Activities Expansion on Natural Habitats. J. Clean. Prod. 2024, 434, 140247. [Google Scholar] [CrossRef]
- Xie, M.; Duan, H.; Kang, P.; Qiao, Q.; Bai, L. Toward an Ecological Civilization: China’s Progress as Documented by the Second National General Survey of Pollution Sources. Engineering 2021, 7, 1336–1341. [Google Scholar] [CrossRef]
- Wang, W.; Feng, C.; Liu, F.; Li, J. Biodiversity Conservation in China: A Review of Recent Studies and Practices. Environ. Sci. Ecotechnology 2020, 2, 100025. [Google Scholar] [CrossRef]
- Yushanjiang, A.; Zhou, W.; Wang, J.; Wang, J. Impact of Urbanization on Regional Ecosystem Services—A Case Study in Guangdong-Hong Kong-Macao Greater Bay Area. Ecol. Indic. 2024, 159, 111633. [Google Scholar] [CrossRef]
- Hu, H.Y. The Distribution of Population in China, with Statistics and Maps. Acta Geogr. Sin. 1935, 2, 33–74. [Google Scholar]
- Chen, M.; Gong, Y.; Li, Y.; Lu, D.; Zhang, H. Population Distribution and Urbanization on Both Sides of the Hu Huanyong Line: Answering the Premier’s Question. J. Geogr. Sci. 2016, 26, 1593–1610. [Google Scholar] [CrossRef]
- Zhang, B.; Zhang, J.; Miao, C. Urbanization Level in Chinese Counties: Imbalance Pattern and Driving Force. Remote Sens. 2022, 14, 2268. [Google Scholar] [CrossRef]
- Kong, X.; Fu, M.; Zhao, X.; Wang, J.; Jiang, P. Ecological Effects of Land-Use Change on Two Sides of the Hu Huanyong Line in China. Land Use Policy 2022, 113, 105895. [Google Scholar] [CrossRef]
- Jiang, H.; Guo, H.; Sun, Z.; Xing, Q.; Zhang, H.; Ma, Y.; Li, S. Projections of Urban Built-up Area Expansion and Urbanization Sustainability in China’s Cities through 2030. J. Clean. Prod. 2022, 367, 133086. [Google Scholar] [CrossRef]
- Liu, R.; Dong, X.; Wang, X.; Zhang, P.; Liu, M.; Zhang, Y. Relationship and Driving Factors between Urbanization and Natural Ecosystem Health in China. Ecol. Indic. 2023, 147, 109972. [Google Scholar] [CrossRef]
- Wu, K.; Wang, D.; Lu, H.; Liu, G. Temporal and Spatial Heterogeneity of Land Use, Urbanization, and Ecosystem Service Value in China: A National-Scale Analysis. J. Clean. Prod. 2023, 418, 137911. [Google Scholar] [CrossRef]
- Di Marco, M.; Ferrier, S.; Harwood, T.D.; Hoskins, A.J.; Watson, J.E.M. Wilderness Areas Halve the Extinction Risk of Terrestrial Biodiversity. Nature 2019, 573, 582–585. [Google Scholar] [CrossRef]
- Ma, L.; Pan, J. Spatial Identification and Priority Conservation Areas Determination of Wilderness in China. J. Clean. Prod. 2024, 451, 142069. [Google Scholar] [CrossRef]
- Xu, M.; Niu, L.; Wang, X.; Zhang, Z. Evolution of Farmland Landscape Fragmentation and Its Driving Factors in the Beijing-Tianjin-Hebei Region. J. Clean. Prod. 2023, 418, 138031. [Google Scholar] [CrossRef]
- Chen, S.; Liu, X. Spatio-Temporal Variations of Habitat Quality and Its Driving Factors in the Yangtze River Delta Region of China. Glob. Ecol. Conserv. 2024, 52, e02978. [Google Scholar] [CrossRef]
- Yang, K.; Han, Q.; Vries, B. de Urbanization Effects on the Food-Water-Energy Nexus within Ecosystem Services: A Case Study of the Beijing-Tianjin-Hebei Urban Agglomeration in China. Ecol. Indic. 2024, 160, 111845. [Google Scholar] [CrossRef]
- Luo, Y.; Fang, S.; Wu, H.; Zhou, X.; He, Z.; Gao, L. Spatial and Temporal Evolution of Habitat Quality and Its Shrinkage Effect in Shrinking Cities: Evidence from Northeast China. Ecol. Indic. 2024, 161, 111919. [Google Scholar] [CrossRef]
- Yuan, L.; Geng, M.; Li, F.; Xie, Y.; Tian, T.; Chen, Q. Spatiotemporal Characteristics and Drivers of Ecosystem Service Interactions in the Dongting Lake Basin. Sci. Total Environ. 2024, 926, 172012. [Google Scholar] [CrossRef]
- Zhang, X.; Wan, W.; Fan, H.; Dong, X.; Lv, T. Temporal and Spatial Responses of Landscape Patterns to Habitat Quality Changes in the Poyang Lake Region, China. J. Nat. Conserv. 2024, 77, 126546. [Google Scholar] [CrossRef]
- Wang, X.; Luo, P.; Zheng, Y.; Duan, W.; Wang, S.; Zhu, W.; Zhang, Y.; Nover, D. Drought Disasters in China from 1991 to 2018: Analysis of Spatiotemporal Trends and Characteristics. Remote Sens. 2023, 15, 1708. [Google Scholar] [CrossRef]
- Ji, J.; Yu, Y.; Zhang, Z.; Hua, T.; Zhu, Y.; Zhao, H. Notable Conservation Gaps for Biodiversity, Ecosystem Services and Climate Change Adaptation on the Tibetan Plateau, China. Sci. Total Environ. 2023, 895, 165032. [Google Scholar] [CrossRef]
- Li, X.; Zhang, X.; Feng, H.; Li, Y.; Yu, J.; Liu, Y.; Du, H. Dynamic Evolution and Simulation of Habitat Quality in Arid Regions: A Case Study of the Hexi Region, China. Ecol. Model. 2024, 493, 110726. [Google Scholar] [CrossRef]
- Yi, J.; Du, Y.; Liang, F.; Tu, W.; Qi, W.; Ge, Y. Mapping Human’s Digital Footprints on the Tibetan Plateau from Multi-Source Geospatial Big Data. Sci. Total Environ. 2020, 711, 134540. [Google Scholar] [CrossRef]

Disclaimer/Publisher’s Note: The statements, opinions and data contained in all publications are solely those of the individual author(s) and contributor(s) and not of MDPI and/or the editor(s). MDPI and/or the editor(s) disclaim responsibility for any injury to people or property resulting from any ideas, methods, instructions or products referred to in the content. |
© 2024 by the authors. Licensee MDPI, Basel, Switzerland. This article is an open access article distributed under the terms and conditions of the Creative Commons Attribution (CC BY) license (https://creativecommons.org/licenses/by/4.0/).