Abstract
This study uses the Aswan Governorate model in southern Upper Egypt to determine the spatial suitability of sustainable urban development in the Egyptian deserts, ensure resource sustainability, and contribute to environmentally sustainable urban and economic growth in line with Egypt’s Vision 2030. To achieve these goals, a GIS-based multicriteria decision-making (GIS-MCDM) approach was used, through an innovative approach for integrating three main indicators: the risk index, environmental sensitivity, and economic resources. These indicators were divided into twenty-four criteria, and their weight was determined according to preference through the analytic hierarchy process (AHP). This study serves developmental, national, and expected regional and local development efforts for developing desert regions in the Aswan Governorate, which exceed 80% of the governorate’s area and represent the future of sustainable urban development. This study found three spatial suitability categories, with the largest between 50 and 70% suitability. The first category, with suitability greater than 70%, covers 27.2% of the Aswan Governorate in the north, on both sides of the Nile. Areas with medium spatial suitability, ranging from 50% to 70%, constitute the second category, accounting for 40.3% of the Aswan Governorate, with a concentration in the central regions. The third category includes areas with low spatial suitability, at less than 50%, which make up 32.5% of the governorate.
1. Introduction
The spatial distribution of the population in Egypt is significantly variable, with over 97% of the total population concentrated in a small area that accounts for no more than 8% of the country’s total area of 1 million km2 [1]. According to statistics for 2022, the uninhabited Egyptian desert area covers approximately 93% of the country, and only 3% of Egypt’s 100 million people live there [2]. Over the past two decades, the population has increased by approximately 36.10 million, from 63.90 million in 2000 to 100 million in 2022, with an annual growth rate of 2.4% and an average yearly rise of 1.9 million [2]. However, this growth has not resulted in a suitable expansion of urban space. Instead, it has caused significant spatial erosion due to the ongoing construction of cities and villages on the surrounding agricultural lands, which span an area of 10.2 million acres [3]. Furthermore, the population density in the inhabited areas has increased to 985 people/km2, surpassing that in Africa at 534 people/km2 and globally at 532 people/km2. This population spatial imbalance threatens and drains most of Egypt’s economic resources, so exiting the narrow valley and the delta and moving people into Egypt’s desert is now inevitable [4].
The uninhabited Egyptian deserts consist of three ecological units, namely the western desert, the eastern desert, and the Sinai Peninsula. Despite all successive development efforts made by the Egyptian government to develop these deserts over the past thirty years [5], these efforts did not result in population spread from the narrow valley to the wide deserts. Geographical information system (GIS) technology, commonly known as a system to support decision-making, plays an important role in analyzing decision problems by combining spatial reference data in the problem-solving environment [6]. The multicriteria decision-making (MCDM) approach is an important tool in the analysis of complicated decision problems, which often require non-comparable criteria or data [7,8].
Analyzing spatial suitability is considered one of the most useful applications in the geographical information system for urban planning [9]. It follows a systematic and scientific method in choosing the appropriate sites that depend on a variety of criteria, whether they are factors that contribute to selection or restrictions preventing this choice, to determine the most appropriate place for the studied phenomenon.
The GIS-based multicriteria decision-making (GIS-MCDM) approach can be defined as a process of integrating and transforming geographic data (input map criteria) and value judgments (decision makers’ preferences and uncertainties) into an overall assessment of the decision alternatives [8]. Due to its applicability to solving complex spatial problems, the GIS-MCDM approach has been applied in the decision-making process for many land-use allocation problems.
The analysis of spatial suitability in the context of geographic information systems (GIS) supports decision-making on whether a specific area is suitable for a specific use [10], and the basic hypothesis for analyzing the extent of the spatial suitability with the GIS is that each aspect of the urban region has either appropriate or inappropriate features, and as per specific criteria, suitability is determined through systemic multiple-factor analysis for the different natural and human aspects [9,11].
Spatial suitability analysis is a method used in various contexts [12,13], including determining the suitability of land and housing from an ecological perspective [14], assessing geological suitability [15], evaluating land suitability for agricultural activities [16], conducting environmental impact assessments [17], selecting optimal locations for public and private sector facilities [18,19], supporting regional planning [20,21], and guiding urban planning [22,23].
To assess the suitability of Egyptian deserts for urban development in the Aswan Governorate, a GIS-based multicriteria decision-making (GIS-MCDM) approach was employed. This approach utilizes the analytic hierarchy process (AHP), a method developed by Saaty [24], which is a structured technique for analyzing complex decision-making processes. The AHP allows for the evaluation of individual criteria through quantitative analysis. It has been widely used in various decision-making scenarios [25,26]. The analytic hierarchy process (AHP) is widely recognized as the predominant method in the field of multicriteria decision-making (MCDM) [27,28].
Most of the research to date has been on urban growth in Egypt, namely in the Sinai region and the Red Sea coasts. These studies have utilized GIS-MCDM with the AHP methodology. Notable examples of such studies are [5,29,30,31]. Meanwhile, the eastern and western deserts have not been thoroughly investigated for their suitability for urban expansion, despite their significant political, economic, and developmental significance.
Several authors have also applied the GIS-MCDM approach and the AHP in other locations, including the following: the study of Jafar and Can [32] on the assessment of the suitability of sustainable urban growth for Abuja, the study of Mehl et al. [33] on the analysis of land suitability for the preparation of the urban plan, the study of Can et al. [34] on the use of GIS to develop a sustainable urban growth area, the study of Jaroslav et al. [35] on the assessment of the suitability of land for the Olomouk area of the Czech Republic, the study of Santosh et al. [36] on analyzing site suitability for urban development using multiple means of GIS assessment technology, the study of Akbulut et al. [37] on the assessment of the suitability of the GIS-AHP method for sustainable urban and environmental planning, study of Huiping et al. [38] on the analysis of the extent of suitability of urban residential land in Beijing, the study of Maher et al. [39] on the analysis of land’s suitability for urban growth in Seremban, Malaysia, the study of Ronja et al. [40] on the analysis of multicriteria decision-making to assess lands’ suitability for potential agricultural land use in the Healy region of central Vietnam, the study of Abdelkarim et al. [41] on the assessment of the risk of floods on the North Train Route (Qrayat region, Kingdom of Saudi Arabia), the study of Abdul Karim and Awawdah [42] on evaluating the quality of life in Braidah (Kingdom of Saudi Arabia), the study of Abdelkarim [43] on improving urban planning of green areas in the Dammam urban region, the study of Ajjur and Mogheir [44] on flood hazard mapping using a multicriteria decision analysis and GIS (case study of Gaza Governorate, Palestine), the study of Gourav et al. [45] on flood hazard zonation of the Bhagirathi river basin using multicriteria decision analysis in Uttarakhand, India, the study of Vanolya and Jelokhani-Niaraki [46] on the use of subjective–objective weights in GIS-based multicriteria decision analysis for flood hazard assessment (a case study in Mazandaran, Iran), the study of Rahman and Szabó [47] on sustainable urban land-use optimization using a GIS-based multicriteria decision-making (GIS-MCDM) approach in Rajshahi City (Bangladesh), and the study of Otokiti et al. [48] on multicriteria decision analysis and GIS mapping of flood vulnerability in the core of Lagos State, Nigeria.
The paper presents two main issues: firstly, the inefficient utilization of economic resources and possibilities in the eastern and western deserts, which account for over 80% of the Aswan Governorate’s total area. Secondly, the unequal distribution of these resources, which is based on population densities within the governorate. As an illustration, the northern sector encompasses only 27% of the total land of the governorate, although it is home to 99.3% of the inhabitants. In contrast, the southern sector of the governorate, which covers 73% of the area and contains valuable mining, tourism, and agricultural resources, is home to only 1% of the population. This situation calls for the development of a new map to ensure sustainable urban growth in the Aswan Governorate. The research area, specifically the southern region of Nasser Lake, demonstrates a significant level of environmental sensitivity and susceptibility, resulting in swift consequences when the ecosystem undergoes alterations. Due to its extremely remote location, the Aswan Governorate has not yet had any urban development plans implemented. The Aswan Governorate faces a diverse range of environmental factors and natural hazards that affect urban development activities. As per the 2019 Human Development Report of Egypt, the Aswan Governorate exhibits elevated levels of poverty and unemployment, placing it sixteenth among all governorates in the country. This implies that the government is incapable of effectively harnessing the riches of the Aswan Governorate and lacks a coherent strategy for development.
The objective of this study is twofold. Firstly, it aims to improve the model used to understand the distribution of urban centers, economic activities, and population in the eastern and western deserts on both sides of the Nile River. This will help optimize the utilization of untapped economic resources in these areas. Secondly, the study aims to identify a spatial suitability index for sustainable urban development in the Aswan Governorate. It will focus on identifying the factors that promote development and examining the main constraints and determinants that hinder the proposed development. The objective is to assess the capacity of the study area and implement control mechanisms for physical development that guarantee environmental safety and reduce strain on current urban clusters and agricultural land. This will be achieved by suggesting new areas and activities that align with the Arab Republic of Egypt’s 2030 development plan.
This study set out to answer the following research questions: (1) Is there a distinct variation in the distribution of people, resources, and density within the research area? (2) Does the absence of a comprehensive understanding of development result in the insufficient utilization of the many and varied resources in the Aswan Governorate? (3) Is it advisable to progressively transition the primary focus of sustainable urban development in the Aswan Governorate from the East to the West Nile? (4) Is the land validity model, which was suggested for sustainable urban development in the deserts of the Aswan Governorate, applicable to other Egyptian deserts? (5) Does sustainable urban growth in Lake Nasser adhere to the urban density pattern observed in the Nile Valley?
The study’s hypotheses were as follows: (1) The allocation of natural and economic resources in the northern and southern regions of the Aswan Governorate is fair and just. (2) The Aswan Governorate is ill-equipped to handle a substantial advancement in urban development across many areas. (3) The studied area is characterized by its high environmental sensitivity and vulnerability, necessitating the use of protective measures when engaging in dense urban growth. (4) The research area has a low density of urban development.
2. Materials and Methods
2.1. Study Area
According to Egyptian General Survey Authority, the governorate of Aswan, located in the far south of Egypt, is adjacent to the governorate of Luxor to the north, the Red Sea governorate to the east, AlWadi AlGadid governorate to the west, and Sudan to the south. It is situated at around 880 km from Cairo. The Aswan Governorate spans from 22° N latitude at the Egyptian–Sudanese borders to 25°20′ N latitude at the administrative border between the governorates of Aswan and Luxor. The governorate spans from a longitude of 31°10′ E to the west, at the administrative boundary between the governorates of Aswan and AlWadi AlGadid, to a longitude of 33°30′ E to the east, at the administrative borders between the governorates of Aswan and the Red Sea (Figure 1). The area of the Aswan Governorate is approximately 62,726 km2, divided into 16 administrative units, of which 10 administrative units represent governorate centers and departments and 6 administrative units have a desert Dhahir for each center. The governorate’s desert area accounts for around 49,254 km2, or around 80.85% of the governorate’s area. According to the 2017 Egyptian census, the Aswan Governorate has a population of 1,473,975, representing approximately 1.6% of Egypt’s population.
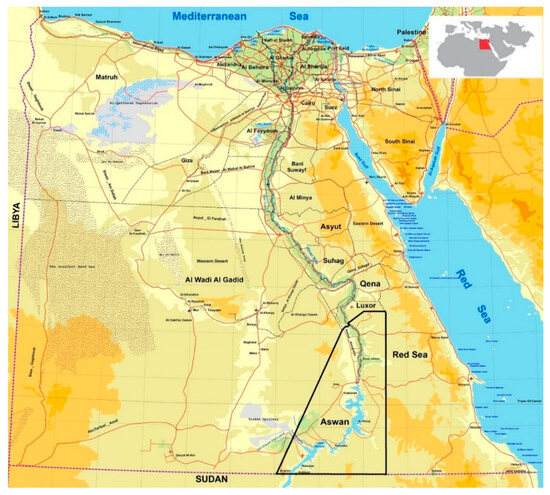
Figure 1.
The Aswan Governorate site (Source: Egyptian General Survey Authority).
2.2. Input Data for GIS-Based Multicriteria Decision-Making (GIS-MCDM) Approach
In order to analyze the spatial suitability index in the Aswan Governorate, data from various sources were collected. The data were then standardized and projected to ensure compatibility within the GIS. Table 1 displays the spatial data used in this study, including the input data, categories, spatial accuracy, and sources.

Table 1.
Data sources and spatial accuracy used in this study.
2.3. Methodology
Figure 2 illustrates this study methodological design, and Figure 3 depicts its procedures and stages. The maps of the final spatial suitability index of urban development in the Aswan Governorate illustrate the stages of this study as follows:
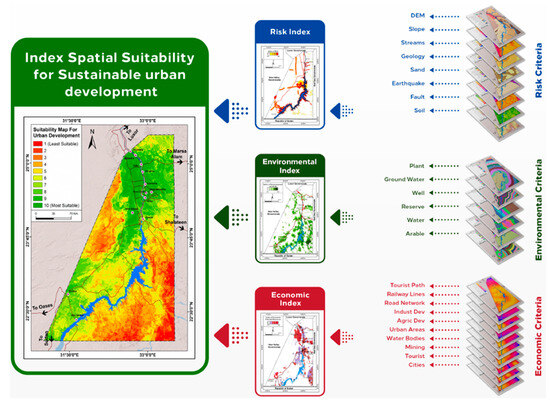
Figure 2.
Design idea of the study methodology.
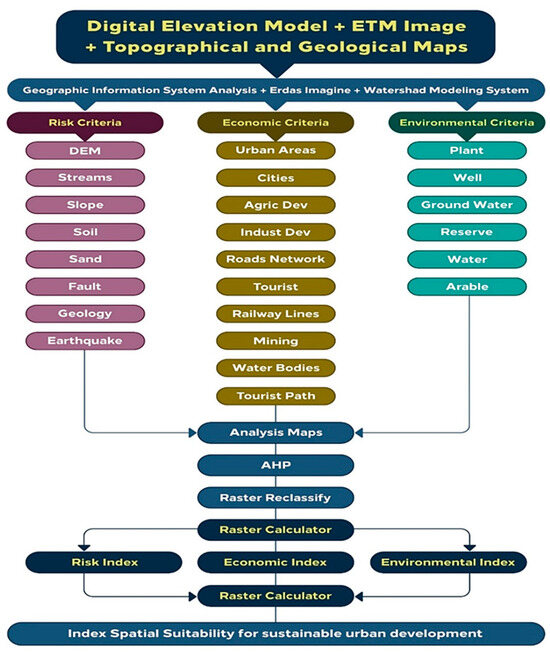
Figure 3.
Study procedures and stages.
2.3.1. Criteria Setting
The initial phase of the MCDM approach is concerned with how to combine information from several criteria for decision-making purposes [49]. Based on the above-mentioned objective, criteria were identified that affect the determination of the spatial suitability index for urban development in the Aswan Governorate, and criteria were selected for the MCDM approach based on the local and global literature and interviews [50] by drawing on three main indicators: the risk index, environmental sensitivity, and economic resources, which were then divided into twenty-four criteria and weighed according to preference in the analytic hierarchy process (AHP). These criteria are as follows: risk index standards are represented in earth surface levels, earth surface slope, valleys, geological formations, soil, faults, dunes, and earthquakes, while environmental sensitivity index criteria are represented in vegetation density, ground wells, groundwater, nature reserves, surface water pollution, and cultivable lands. Economic resource index criteria are represented in urban agglomerations, major cities, roads, railways, water bodies, agricultural development zones, industrial development zones, touristic zones, mining zones, and safari trails.
2.3.2. Data Reclassification
During this phase, the balancing and comparison process was conducted by reclassifying the influential variable’s values. This entailed substituting the inserted layer values with new ones that aligned with the analysis procedures. Ten categories for each distance map were identified based on the degree of suitability of each criterion. Those categories from 1 to 10 were classified, where the criteria closest to the standard had the highest suitability value (10) and those farthest from the standard had the lowest suitability value (1). The reclassification process was conducted within the GIS environment. The criteria were classified using literary studies and expert judgments gathered from interviews. Thus, several interviews were conducted with developers and contractors, urban planners and researchers, engineers, and members of the local authority including the Office of the Governor of Aswan, the development of Lake Nasser, and representatives of the Ministry of Housing.
Concerning the topographic criterion, levels are regarded as a limitation that influences urban development. Urban areas are typically established in regions with lower elevations, away from severe mountainous terrain that is challenging to reach or supply services [12]. The categories that are deemed most appropriate are those that are least hazardous, falling within the eighth and ninth categories, with an elevation of less than 205 m above sea level. Urban areas are typically characterized by their location in flat terrain with gentle slopes, avoiding areas with steep slopes that would make it challenging to build urban infrastructure. The most appropriate categories are those that are deemed to be the least hazardous, represented by a slope of less than 0.6 degrees. The slope map reveals that locations with slopes over 20% are unsuitable for urban expansion, as confirmed by urban planning experts [51,52,53].
Urban areas are commonly located away from valleys’ routes and mouths to avoid flash floods caused by torrents and floods [54]. The least risky categories, those with a radius of over 29.3 km around the valleys, are considered the most suitable. Geologically coherent regions separate urban areas from fragmented and rugged areas. The categories that are considered the most suitable are the least hazardous. The ninth and tenth categories represent these groups. Due to their distinctive features, urban areas are typically situated a considerable distance from dunes. The tenth category, characterized by the absence of dunes, is considered the least harmful due to frequent movement and poor soil.
Urban areas are in isolated regions, and earthquakes play a crucial role in determining appropriate locations for urban development [55]. When considering the possible impacts of earthquakes, particularly those of high intensity, the most suitable classification is for earthquakes with a magnitude below 3 degrees. In terms of fault criteria, proximity to faults increases the likelihood of landslides, and arid areas are particularly susceptible to landslides compared to other forms of land cover. The studies conducted by Kanwal et al. [56], Ahmed [57], and Achour et al. [58] have identified the least dangerous categories for urban development. These categories are characterized by more than 80 km of faults and the presence of soil as a controlling constraint. The most suitable categories are Nubian stone rocks and cohesive sandy gravel soil.
When considering the density of vegetation cover, urban areas are defined as regions that are far away from any vegetation. The most suitable categories are those with a distance from vegetation cover greater than 131.8 km. Naghibi et al. [59] describe groundwater as a crucial natural resource, found in the pores and fissures of rocks and sediments below the Earth’s surface. The tenth category, with poor aquifers and a concentration of about 70.5% on both sides of the Nile River, represents the least sensitive and most suitable category. The wells’ locations are a limiting factor that governs the progress of urban development. Urban areas are defined as locations located at a considerable distance from wells. The ninth and tenth categories, which are the least sensitive, are regarded as the ideals for urban areas. Distances from the wells exceeding 185.3 km represent these categories.
Natural reserves act as a regulatory mechanism for urban growth by demarcating metropolitan areas apart from these reserves. The optimal categories are those that are located more than 246.2 km from the reserves. Surface water contamination is a limiting factor in urban development, as metropolitan centers are typically located at a considerable distance from sources of pollution. The categories that are deemed most appropriate are those that are least susceptible since their distance from surface water exceeds 97.1 km. Tan et al. [60] acknowledge arable land as a significant component influencing sustainable urban, social, and economic development. Arable land is a limiting factor in urban development, as metropolitan centers are typically located at a considerable distance from areas suitable for cultivation. The most appropriate categories are those located at a distance greater than 191.6 km from arable land. Urban areas are designated close to industrial growth zones as a contributing element. The most appropriate categories are determined based on their proximity to industrial growth regions, with a maximum distance of 34.6 km.
According to Kanwal et al. [56], the road network criterion regards road networks as a fundamental aspect of land use and a benchmark in urban development. Infrastructure plays a role in improving accessibility and connectivity between neighboring cities, thereby creating social and economic opportunities for sustainable urban expansion [61]. The optimal categories are those in which the road network’s circumference is less than 17 km. Railways play an important role in urban development by reducing the travel time between cities and facilitating the integration of urban regions [62]. To optimize transportation efficiency, urban areas are strategically placed close to train lines. Typically, the ninth and tenth categories, within a radius of 58.3 km from the railway, are the optimal locations. Mining areas undeniably contribute to urban development by facilitating the identification of new urban areas. Proximity to mining locations is a contributing factor. The ninth and tenth categories are the most appropriate options, given that the distance from the mining regions is within a radius of 16.8 km. The reclassification process was executed using the Arc GIS software 10.8.1, with the results shown in Table 2.
Table 2.
Classification categories of criteria influencing the spatial suitability index for sustainable urban development in the Aswan Governorate.
2.3.3. Distribution of Relative Weights to Criteria
One important part of this analysis is figuring out how to weight the study’s criteria. There are several ways to do this, such as the AHP method [63], the entropy method [64], the analytic network process [65], and the Delphi method [66]. The analytic hierarchy process (AHP) is the most popular and widely used method for making decisions around the world. It is a structured way to derive weighted factors that break down decision-making into a few easy steps and even compare methods for evaluating the site’s spatial information in GIS [67,68,69]. Table 3 gives an example.
Table 3.
The analytic hierarchy process (AHP) using the Thomas Saaty method.
The hierarchical analysis proceeded through successive stages of developing a matrix of bilateral comparisons between the study criteria with values ranging from 1 to 9, as illustrated in the previous Table 3. The diameter of each matrix must be accurate as it represents the criteria. The values above the diameter correspond to the inverse values below it. Once the digital trade-off is complete, we collect the columns, divide each value by the total, and then collect rows in the matrix of comparisons to determine the relative weight.
Phase I: Setting preference values between criteria according to Thomas’ table
The analytic hierarchy process (AHP) bases its preferences on even comparisons, which evaluate each element against all other elements at a specific hierarchical level. The element in question is a specific object, such as a decision variable or evaluation criterion, and the benchmark for comparisons is a higher element in the hierarchy analysis.
This preference matrix has the above features because it compares all elements at a certain hierarchical level in relation to a specific phenomenon (trait, criteria). Equation (1) indicates that we are working with a matrix consisting of n elements, with n representing the total number of elements compared. Equation (2) is an expression of the preference principle, which states that two elements are identical when compared to each other and not different. Number 1 expresses no difference in preferences; therefore, all element values on the matrix’s diameter equal 1, placing the preference value in the subsequent matrix (Table 4, Table 5 and Table 6).
Table 4.
Preference values between risk index criteria using the AHP.
Table 5.
Preference values between environmental sensitivity index criteria using the AHP.
Table 6.
Preference values between economic resources index criteria using the AHP.
Phase II: Percentage of preference values for all criteria according to the total columns
- a.
- Percentage of preference values
The percentage of preference value shall be between two criteria, one row and one column of the equation:
where : percentage of preference value between two criteria, one row and one column, ajk: value of the preference between two criteria, one row and one column, and : total of the column criterion. The percentages of all criteria calculated are recorded in the following Table 7, Table 8 and Table 9.
Table 7.
Percentage of preference values for risk index criteria using the AHP.
Table 8.
Percentage of preference values for environmental sensitivity index criteria using the AHP.
Table 9.
Percentage of preference values for economic resources index criteria using the AHP.
- b.
- Relative weight values
We determined the relative weight value of each criterion of the rows of the following equation [70]:
where : relative weight value for grade criterion, : total percentage of preference for a class criterion, and m: final value of the total for all rows, The weight values of all criteria calculated are recorded in the following Table 10, Table 11 and Table 12.
Table 10.
Risk index weight ratios using the AHP.
Table 11.
Environmental sensitivity index weight ratios using the AHP.
Table 12.
Economic resources index weight ratios using the AHP.
Phase III: Consistency Verification
First, the stability index is calculated from the following equation [71]:
where ʎMax is the underlying root of the average binary comparison matrix, n is the number of benchmarks, the constant index of risk index benchmarks is 0.04, the environmental sensitivity criterion is 0.02, and the economic criterion is 0.04. The closer the output is to zero, the more confidence there is of the constant index, and the further it is away from zero, the more contradiction there is of the index.
Second, we calculate the ratio of consistency mathematically:
where R is a random constant indicator by the number of criteria, which has to be valued from the following Table 13.
Table 13.
Random stability index values.
The random stabilization index value of the risk index criteria was around 1.4 since the number of criteria was 8. Therefore, the stabilization ratio equaled 0.03, which was equivalent to 3% or 0.04/1.4. For the ESI criteria, which totaled 6 and had a constant ratio of 0.02, it was approximately 1.25. Similarly, for the ERI criteria, which totaled 10 and had a constant ratio of 0.03, it was approximately 1.49. The constant ratio must fall within the range of 0.1 to 10%, and any deviation beyond this indicates a contradiction.
2.3.4. Spatial Suitability Model and Model Builder
Following the completion of processing and preparing the variables in the necessary formulas, the layers of variables were gathered (algebraic addition for maps) and multiplied by their weight using a raster calculator in the ArcGIS program environment, with us implementing the weighted matching method. The calculation consists of (a) multiplying the normalized values of each criterion layer (raster maps) by their respective weights; (b) summing the resulting values of raster pixels; and (c) rounding the obtained values to have only integer ones. A new layer was created, known as the suitability model, which identifies the optimal locations for establishing new urban areas in Aswan City. The final stage entails creating a model builder within the ArcGIS environment. The model builder is used in the ArcGIS geographic information system environment to create, modify, and manage tool models [12,13,42].
Tool models are thought of as a logical sequence of a set of tools that enable specific processing to create a model. The Arc Catalog program was used to create a model builder for multicriteria analysis, which aimed to identify the most suitable areas for urban development in Aswan City. The Euclidian distance was added to generate maps of proximity and distance from various standards and slopes, to create a map of the Earth’s surface inclinations. The extract-by-mask method was used to extract distance maps from the borders of the study area. The reclassify method was used to reclassify the distance maps and identify the spatial suitability categories for each criterion. Afterwards, the Raster Calculator was utilized to gather maps of the spatial suitability categories for all criteria, considering the weights assigned to each criterion. Then these maps were connected to the model builder using the existing Connect feature, and the model builder was executed using Run.
3. Results
3.1. Analysis of the Spatial Suitability Index Map for Sustainable Urban Development in the Aswan Governorate
3.1.1. Spatial Suitability of Risk Index Criteria
From the analysis of spatial suitability maps for risk indicator criteria, Table 14 and Figure 4, Figure 5, Figure 6 and Figure 7 were produced, which were used to determine the spatial suitability index for sustainable urban development in the Aswan Governorate; this indicator contains eight risk sub-indicators: levels, slope, valleys, geological formations, soil, faults, sand dunes, and earthquakes.
Table 14.
Spatial suitability of risk index criteria.
Table 14.
Spatial suitability of risk index criteria.
| Criteria | Low-Fit Areas | High-Fit Areas | |||||
|---|---|---|---|---|---|---|---|
| Category | Area (km2) | % | Category | Area (km2) | % | ||
| 1 | Levels | <411 m | 4624.6 | 7.4 | >205 m | 19,248.2 | 30.8 |
| 2 | Slope | <3.3° | 437.5 | 0.7 | >0.6° | 40,058.8 | 64.1 |
| 3 | Valleys | >3.7 km | 39,058.9 | 62.5 | <29.3 km | 687.4 | 1.1 |
| 4 | Geological Formations | Al-Qaida Rocks—The Rocks | 6061.9 | 9.7 | Modern Nile—Sandstone | 42,871.1 | 68.6 |
| 5 | Soil | Rock—Shelves | 5811.9 | 9.3 | Nubian Stone—Gravel Sand | 38,808.9 | 62.1 |
| 6 | Faults | >20 km | 34,246.9 | 54.8 | <80 km | 1874.8 | 3 |
| 7 | Sand Dunes | Dunes | 17,998.4 | 28.8 | Without dunes | 44,495.9 | 71.2 |
| 8 | Earthquakes | <6 degrees | 437.5 | 0.7 | >3 degrees | 2624.8 | 4.2 |
In terms of the spatial suitability of the levels, the most suitable categories are the least hazardous, namely, categories VIII and IX, where the level is less than 205 m above sea level. Concentrated on both sides of the Nile River, these occupy approximately 30.8% of the governorate area. The most suitable categories for the slopes are the least hazardous, which are categories VIII and IX, where the slope is less than 0.6 degrees. Concentrated on the west side of the Nile River, these occupy approximately 64.1% of the governorate area. Regarding the spatial suitability of valleys, categories IX and X are the least hazardous, with a distance around the valleys exceeding 29.3 km. Concentrated on the west side of the river, these valleys occupy approximately 1.1% of the provincial area. In terms of geological formations’ spatial suitability, the most suitable categories are the least hazardous. The New Nile and sandstone, comprising categories IX and X, occupy approximately 68.6% of the governorate area. The most suitable category for sand dunes is the least hazardous, that is, the tenth class, which is free of sand dunes. In terms of the spatial suitability of earthquakes, the highest category is the least hazardous, which is the tenth category, with an earthquake of fewer than 3 degrees. The representation of this category is concentrated in the southern districts, with an area of around 4.2% of the governorate area, according to Figure 4, Figure 5 and Figure 6.

Figure 4.
Risk index criteria Part I include (A) slope, (B) levels, (C) geological formations, and (D) valleys.
Figure 4.
Risk index criteria Part I include (A) slope, (B) levels, (C) geological formations, and (D) valleys.


Figure 5.
Risk index criteria Part II include (A) earthquakes, (B) sand dunes, (C) soil, and (D) faults.
Figure 5.
Risk index criteria Part II include (A) earthquakes, (B) sand dunes, (C) soil, and (D) faults.


Figure 6.
An imbalance between fisheries wealth and natural challenges in Lake Nasser: (a) fish in Lake Nasser, (b) crocodiles in Lake Nasser.
Figure 6.
An imbalance between fisheries wealth and natural challenges in Lake Nasser: (a) fish in Lake Nasser, (b) crocodiles in Lake Nasser.

As for the spatial suitability of faults, the most suitable categories are the least hazardous, which are categories IX and X, where the distance from cracks exceeds 80 km. These categories are concentrated on the west side of the river and have an area of around 3% of the governorate area. The highest soil categories are the lowest risk categories, namely categories IX and X, where Nubian stone rocks and coherent gravel sand soil are concentrated along the Nile River and represent around 62.1% of the governorate area.
3.1.2. Spatial Suitability of Environmental Sensitivity Index Criteria
The environmental sensitivity index criteria (Table 15) and Figure 7, Figure 8 and Figure 9 were used to find the best places for urban development in the Aswan Governorate. This indicator is made up of six sub-indicators of environmental sensitivity: the amount of vegetation, underground wells, groundwater, natural reserves, surface water, and arable lands.
Table 15.
Spatial suitability of environmental sensitivity index criteria.
Table 15.
Spatial suitability of environmental sensitivity index criteria.
| Criteria | Low-Fit Areas | High-Fit Areas | |||||
|---|---|---|---|---|---|---|---|
| Category | Area km2 | % | Category | Area km2 | % | ||
| 1 | Vegetation | >32.9 km | 24,435.3 | 39.1 | <131.8 km | 1499.9 | 2.4 |
| 2 | Underground Wells | >46.3 km | 23,747.8 | 38 | <185.3 km | 4124.6 | 6.6 |
| 3 | Groundwater | Rich aquifers | 1999.8 | 3.2 | Poor aquifers | 44,058.5 | 70.5 |
| 4 | Nature Reserves | >61.1 km | 17,873.4 | 28.6 | <246.2 km | 5062 | 8.1 |
| 5 | Surface Water | >21.6 km | 25,560.2 | 40.6 | <97.1 km | 749.9 | 1.2 |
| 6 | Arable Land | >47.9 km | 27,342.5 | 43.8 | <191.6 km | 2687.3 | 4.3 |
The most suitable categories for vegetation are the least sensitive, categories IX and X, where the distance from vegetation exceeds 131.8 km. The concentration occurs in southeastern destinations, occupying approximately 2.4% of the governorate’s total area. In terms of the spatial suitability of groundwater, the tenth category exhibits the least sensitivity, with poor aquifers concentrated on both sides of the Nile River, encompassing an area of approximately 70.5% of the governorate. The most suitable categories for underground wells are the least sensitive, categories IX and X, where the distance from wells exceeds 185.3 km. Concentrated in the north, these categories occupy approximately 6.6% of the governorate area. When it comes to the spatial suitability of natural reserves, the least sensitive categories—categories IX and X—are the most suitable, with a distance from the reserves exceeding 246.2 km. These occupy approximately 8.1% of the governorate area, concentrated in the south of Lake Nasser (Figure 8, Figure 9 and Figure 10).
As for the spatial suitability of surface water, the most suitable categories are the least sensitive, the ninth and tenth categories, where the distance from surface water is more than 97.1 km. These are concentrated in the southeast and have an area of around 1.2% of the governorate area. Concerning the spatial suitability of arable lands, the most suitable categories are the least sensitive, categories IX and X, where the distance from arable lands exceeds 191.6 km. Concentrated on the northern sides of the Nile River, these occupy approximately 4.3% of the governorate area.

Figure 7.
Environmental sensitivity index criteria Part I include (A) groundwater, (B) vegetation, (C) nature reserves, and (D) underground wells.
Figure 7.
Environmental sensitivity index criteria Part I include (A) groundwater, (B) vegetation, (C) nature reserves, and (D) underground wells.


Figure 8.
Environmental sensitivity index criteria Part II include (A) arable land and (B) surface water.
Figure 8.
Environmental sensitivity index criteria Part II include (A) arable land and (B) surface water.


Figure 9.
Environmental sensitivity: (a) natural appearance of the Nile River, Lake Nasser, and urbanization, (b) natural appearance of the Nile River and Western Desert.
Figure 9.
Environmental sensitivity: (a) natural appearance of the Nile River, Lake Nasser, and urbanization, (b) natural appearance of the Nile River and Western Desert.

3.1.3. Spatial Suitability of Economic Resource Indicator Criteria
From the analysis of spatial suitability maps carried out to identify the criteria of the economic resources index (Table 16 and Figure 10, Figure 11, Figure 12, Figure 13, Figure 14 and Figure 15), which were used to identify the best areas for urban development in the Aswan Governorate, we determined that this indicator contains 10 sub-indicators of economic resources: urban areas, major cities, roads, railways, water bodies, agricultural development areas, industrial development areas, mining areas, tourist areas, and safari routes.
Table 16.
Spatial suitability of economic resources index criteria.
Table 16.
Spatial suitability of economic resources index criteria.
| Criteria | Low-Fit Areas | High-Fit Areas | |||||
|---|---|---|---|---|---|---|---|
| Category | Area (km2) | % | Category | Area (km2) | % | ||
| 1 | Urban areas | <154.3 km | 1374.9 | 2.2 | >38.6 km | 24,935.2 | 39.9 |
| 2 | Major cities | <159.7 km | 2624.8 | 4.2 | >39.9 km | 20,998.1 | 33.6 |
| 3 | Road | <68.1 km | 749.9 | 1.2 | >17 km | 35,934.2 | 57.5 |
| 4 | Railway | <233 km | 2562.3 | 4.1 | >58.3 km | 22,122.9 | 35.4 |
| 5 | Water bodies | <79.1 km | 749.9 | 1.2 | >21.6 km | 25,560.2 | 40.9 |
| 6 | Agric. dev. areas | <36.4 km | 749.9 | 1.2 | >21.6 km | 37,871.5 | 60.6 |
| 7 | Industry dev. areas | <138.4 km | 1812.3 | 2.9 | >34.6 km | 33,184.5 | 53.1 |
| 8 | Tourist areas | <71.4 km | 874.9 | 1.4 | >17.9 km | 22,560.4 | 36.1 |
| 9 | Mining areas | <67 km | 1812.3 | 2.9 | >16.8 km | 18,185.8 | 29.1 |
| 10 | Safari routes | <133.9 km | 1437.4 | 2.3 | >33.5 km | 39,183.9 | 62.7 |
The high spatial suitability of urban areas is concentrated in the north of the governorate around the river and scattered in the southwest, with an area of around 39.9% of the governorate’s area, while the low suitability of urban areas is concentrated in the southeast, with an area of around 2.2% of the governorate area. The spatial suitability of high-agricultural-development areas is concentrated along the Nile River zones, with an area of around 60.6% of the governorate, while low-convenience categories are concentrated in the agricultural areas of the southeast.

Figure 10.
Some of the most important mineral resources in the desert of the Aswan Governorate: (a) sand quarries, (b) stone quarries, (c) granite quarries, (d) phosphate quarries.
Figure 10.
Some of the most important mineral resources in the desert of the Aswan Governorate: (a) sand quarries, (b) stone quarries, (c) granite quarries, (d) phosphate quarries.


Figure 11.
Economic resources index criteria Part I include (A) agricultural development areas, (B) urban areas, (C) roads, and (D) industrial development areas.
Figure 11.
Economic resources index criteria Part I include (A) agricultural development areas, (B) urban areas, (C) roads, and (D) industrial development areas.

The center and north contain the most suitable spatial categories for industrial development areas. High-spatial-suitability categories of road networks are concentrated in the center and north on both sides of the Nile River. With an area of around 57.5% of the district area, the same concentration applies to the high spatial suitability of major cities and tourist areas, mining areas, water bodies, railways, and safari routes.

Figure 12.
Some of the tourism development in the Aswan Governorate: (a) Abu Simbel temple, (b) Philae temple, (c) Gharb Seheyl village.
Figure 12.
Some of the tourism development in the Aswan Governorate: (a) Abu Simbel temple, (b) Philae temple, (c) Gharb Seheyl village.


Figure 13.
Some of the state’s efforts in urban and agricultural development in the Aswan Governorate: (a) the project of reclamation and cultivation of 485,000 acres in Toshka; (b,c) the main canal of the project.
Figure 13.
Some of the state’s efforts in urban and agricultural development in the Aswan Governorate: (a) the project of reclamation and cultivation of 485,000 acres in Toshka; (b,c) the main canal of the project.


Figure 14.
Economic resources index criteria Part II include (A) tourist areas, (B) cities, (C) water bodies, and (D) mining areas.
Figure 14.
Economic resources index criteria Part II include (A) tourist areas, (B) cities, (C) water bodies, and (D) mining areas.


Figure 15.
Economic resources index criteria Part III include (A) safari routes and (B) railway.
Figure 15.
Economic resources index criteria Part III include (A) safari routes and (B) railway.

3.2. Analysis of the Spatial Suitability Index Map for Sustainable Urban Development in the Aswan Governorate
3.2.1. Results of the Analysis of the Risk Index Map in the Aswan Governorate
The results of the analysis of the risk index map in the Aswan Governorate (Figure 16 and Table 17) revealed that there are three categories of relevance, as follows:
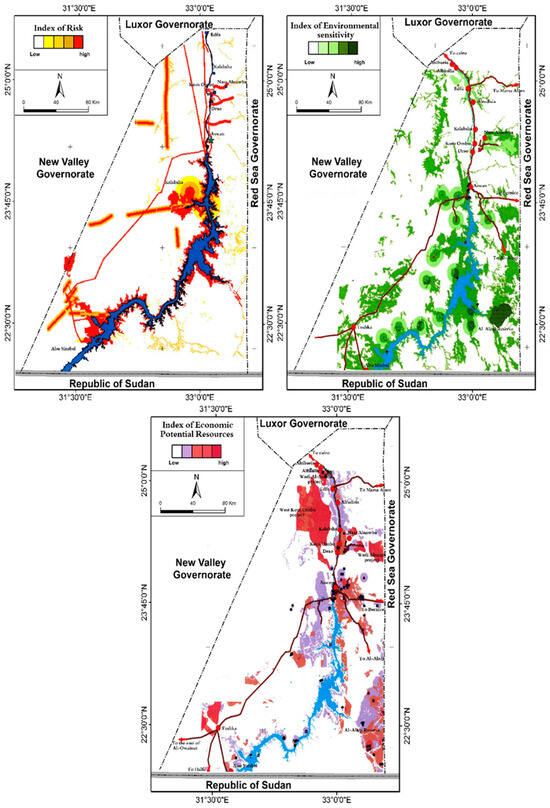
Figure 16.
Indicators of risk, environmental sensitivity, and economic resources for sustainable urban development of the Aswan Governorate.
Table 17.
Relative degrees of suitability of the risk indexes of the Aswan Governorate in 2022.
Low-risk areas, with a risk of less than 53%, comprise approximately 25.6% of the Aswan Governorate’s total land area. These areas are concentrated north of Aswan on both sides of the Nile River. They are also concentrated in a scattered form along the west side of the Nile River, followed by areas with a medium risk of between 53% and 65%, representing around 45.6% of the total land area in the Aswan Governorate. Then, high-risk areas, with a risk of more than 65%, make up approximately 28.8% of the total land area in the Aswan Governorate. These areas are concentrated in the southeastern and western parts of the Aswan Governorate.
3.2.2. Results of the Analysis of the Map of the Environmental Sensitivity Index in the Aswan Governorate
The results of the analysis of the map of the environmental sensitivity index in the Aswan Governorate (Figure 17 and Table 18) revealed that there are three categories of relevance, as follows:
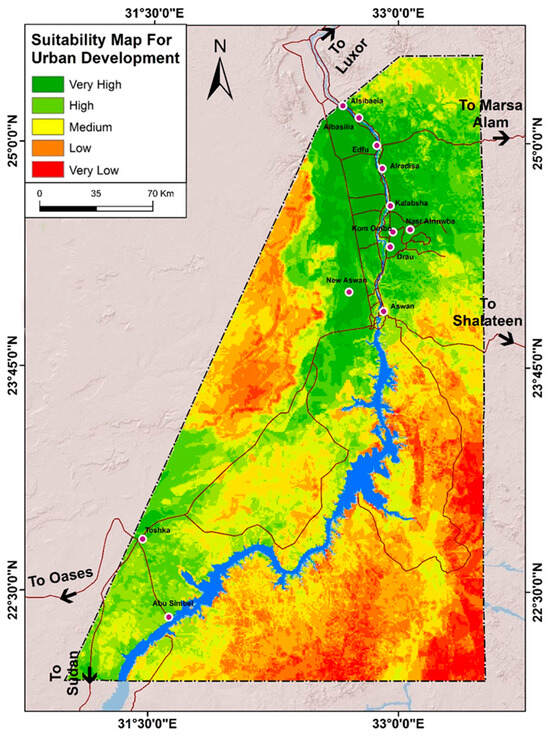
Figure 17.
Degrees of sustainable urban development of the Aswan Governorate.
Table 18.
Relative degrees of suitability of the environmental sensitivity indexes of the Aswan Governorate.
Areas with low sensitivity of less than 30% comprise around 34.3% of the total land area of the Aswan Governorate, concentrated in the north and west of the Aswan Governorate, while areas with a medium sensitivity range from 30% to 60% and comprise around 51.2% of the total land area in the Aswan Governorate. These areas are concentrated on both sides of the Nile River around areas of high sensitivity (more than 60%), which comprise around 14.5% of the total land area in the Aswan Governorate, concentrated on both sides of Nasser Lake.
3.2.3. Results of the Analysis of the Map of the Economic Resources Suitability Index in the Aswan Governorate
The results of the analysis of the map of the economic resources suitability index in the Aswan Governorate (Figure 16 and Table 19) revealed that there are three categories of suitability, as follows:
Table 19.
Relative degrees of suitability of the economic resources index of the Aswan Governorate.
The area of low-suitability economic resources (less than 62%) comprises around 16.2% of the total land area of the Aswan Governorate. These areas are concentrated in the southeastern and western parts of the Aswan Governorate, while the area of medium-suited economic resources (62–85%) comprises around 54.5% of the total land area of the Aswan Governorate. These areas are concentrated around high-fit areas on both sides of the Nile River and are particularly concentrated on the western outskirts of the river, while high-fit and convenient economic resource areas of over 85% comprise around 29.3% of the governorate’s total land area, concentrated in the northern outskirts on both sides of the Nile River and scattered around the city of Abu Simble in the south.
3.3. Results of the Analysis of the Final Spatial Suitability Index Map for Sustainable Urban Development in the Aswan Governorate
The results of the final spatial suitability index map to identify areas of spatial suitability for urban development in the Aswan Governorate (Figure 17 and Figure 18 and Table 20) revealed that there are three categories of suitability, as follows:
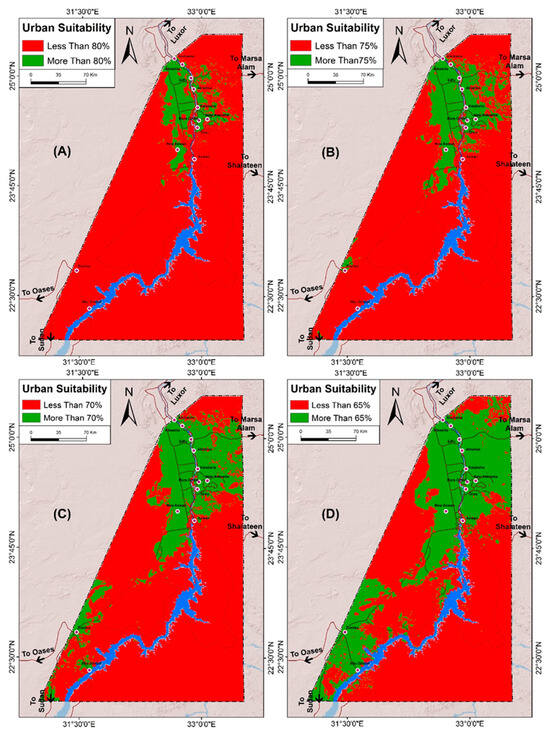
Figure 18.
Spatial suitability index for sustainable urban development includes the following: (A) less than 80%/greater than 80%, (B) less than 75%/greater than 75%, (C) less than 70%/greater than 70%, and (D) less than 65%/greater than 65% of the Aswan Governorate.
Table 20.
Relative importance of the final spatial suitability index map for sustainable urban development of the Aswan Governorate.
Areas of low spatial relevance (less than 50%) comprise around 32.5% of the total land area of the Aswan Governorate. These areas are concentrated in the southeastern and western parts of the governorate, while areas of medium spatial relevance (ranging from 50% to 70%) comprise around 40.3% of the total land area of the Aswan Governorate. These areas are concentrated in the central governorates, on both sides of the Nile River and Lake Nasser. Meanwhile, areas of high spatial relevance (more than 70%) comprise around 27.2% of the total land area of the Aswan Governorate. These areas are concentrated in the northern districts on both sides of the Nile River and are scattered around the cities of Tushki and Abu Simbel.
4. Discussion
Spatial planning for sustainable urban development is always associated with different types of decision-making problems and strategies, and integrating interrelated and often conflicting factors or criteria into decision-making is not always an easy task [32]. Assessing spatial suitability for sustainable urban development involves a comprehensive analysis that requires a combination of several effective long-term factors [72]. There is a growing trend of integrating MCDM and GIS into spatial decisions related to sustainable urban development [73]. Numerous researchers have discussed various models of sustainable urban development in various countries [42]. Most of these studies have found that focusing solely on economic development may lead to ignorance or negatively impact society and the environment [32].
This study utilized GIS-based multicriteria decision-making (GIS-MCDM) approach to create a map of sustainable urban development in the Egyptian deserts, spe-cifically focusing on the Aswan Governorate model. GIS-MCDM is a method for evaluating mul-tiple criteria that may conflict. The decision-making process in GIS-MCDM typically involves four stages: problem identification, establishing decision-maker preferences, evaluating alternatives, and identifying the most favorable options [74,75]. Including geographic in-formation in spatial problems makes a substantial impact, and spatial options prove to be very efficient for decision makers.
This study included twenty-four criteria that encompassed both development restrictions and their corresponding incentives. Specifically, the criteria focused on risk constraints. The land surface features include topographic variations such as valleys, geological formations, and soil types. Additionally, there are faults and dunes present in the area. The region is also prone to earthquakes and subject to environmental sensitivity regulations. The criteria used for representation included vegetation density, ground wells, groundwater, natural reserves, and surface water pollution. The criteria used to stimulate economic potential included urban agglomerations, major cities, road networks, railways, water bodies, agricultural development areas, industrial development areas, tourist areas, mining areas, and safari tracks.
This study utilized the hierarchical analysis method (AHP) in two distinct ways within the GIS environment. The first involved determining the weights associated with the layers of the properties map. These weights were then combined with the layers of the properties map using a weighted suitability model. This approach is particularly useful for problems with many alternatives, where binary comparison is not feasible. The second way AHP was used was to aggregate the priorities at all levels of the hierarchical structure, including the level representing the alternatives. In this case, there were a relatively small number of alternatives that could be evaluated.
The map of sustainable urban development in the Aswan Governorate reveals a significant level of environmental sensitivity and fragility in the study area. The ecosystem is highly susceptible to change, and several environmental factors pose challenges to future urban development. These findings align with previous studies conducted by Jaafar and Can [32] and Jaroslav et al. [35]. The state’s failure to effectively utilize the resources in the Aswan Governorate, along with the lack of a coherent development strategy, has led to an uneven distribution of the population. This observation aligns with findings from other studies, such as the research conducted by Jaafar and Can [32]. In Mehul et al.’s study [33], it was found that over 99% of the population in the Aswan Governorate is concentrated in the Old Valley, which covers an area of 1300 km2. This area represents only 2.8% of the entire area of the governorate. In contrast, only 1% of the population resides in Lake Nasser, which covers 97.2% of the governorate’s area. The Old Valley encompasses around 97.6% of the 271,057-acre urban centers, whereas Lake Nasser comprises around 2.4% of the urban centers in the governorate. The significant population and urban size in the Old Valley area are associated with most of the agricultural land. Lake Nasser accounts for only 10% of the total agricultural land, while the remaining 90%, equivalent to 280,000 acres, is represented by other areas.
By analyzing three development indicators—risk, environmental sensitivity, and economic resources—it was determined that there are three categories of spatial suitability for sustainable urban development, with between 50 and 70% suitability the greatest. The first category represents areas with very high suitability, exceeding 70%. This category covers approximately 27.2% of the Aswan Governorate and is concentrated in the northern regions on both sides of the Nile River, as well as scattered around the cities of Toshka and Abu Simbel. The second category, with a suitability ranging between 50% and 70%, is mainly located in the central regions on both sides of the Nile River and Lake Nasser, covering about 40.3% of the governorate. The third category comprises areas with low suitability for sustainable urban development, accounting for approximately 32.5% of the governorate. These areas, concentrated in the southeastern and western regions, have a suitability level below 50%. It is recommended that areas with a suitability percentage of 70% or higher be prioritized for sustainable urban development in the Aswan Governorate.
Egypt is facing the inevitable need to develop its desert areas, particularly in the Aswan Governorate. This is because only 19.15% of the governorate’s total area is suitable for human habitation, while more than 80% is comprised of desert regions. A study has shown that there are various natural and human hazards in the Aswan Governorate, rendering the land unsuitable for urban development. This indicates that the region is not yet prepared for significant advancements in various aspects of development.
One significant drawback of GIS-based multicriteria decision-making (GIS-MCDM) is the need for achieving equilibrium among social, economic, and environmental development [35]. However, accomplishing all the goals of GIS-based multicriteria decision-making (GIS-MCDM) is a challenging problem due to the persistent lack of resources, which are insufficient to support all analytic operations [34]. Furthermore, when com-pared to commonly used methods like FUZZY, TOPSIS, MIVES, and COPRAS, there is no compelling rationale for selecting the AHP method. This is due to its lack of consideration of problem characteristics, such as differing weighting opinions, the choice between com-pensation and non-compensation for criteria, and overall rationale. All GIS-MCDM methods al-low for the development of assessments that consider various dimensions of sustainability and intersect differently based on decision makers’ preferences. Most methods also allow for the use of different units of measurement across standards, making it easier to quantitatively measure different aspects. However, the analytic hierarchy process (AHP) method is the most widely used method for multi-standard decision-making, as demonstrated by previous studies [27,28] referenced in this study.
Stakeholder participation is rarely observed during all stages of the evaluation. Instead, it is typically limited to the stages involving the determination of weights. To achieve more accurate and reliable results in this study, a standard strategy was employed, which included expert opinions, statistical data, and field surveys. The criteria were classified based on a combination of literary studies and expert evaluations, which were gathered through interviews. Hence, numerous interviews were carried out with real estate developers, contractors, urban planning professionals, researchers, engineers, and officials from various organizations like the Aswan Governorate General Office, Lake Nasser Development, and representatives from the Ministry of Housing.
The absence of consistent statistical data for certain criteria resulted in the exclusion of those criteria. Additionally, this study is limited by the unavailability of spatial data layers for factors such as the communication network, sewage network, and official land and housing prices. However, these factors were not of significant importance in this study as we employed a desert development model that prioritizes environmental and natural standards.
Another constraint of multicriteria GIS methods is the need to reconcile the varying scale levels of the standards employed, which can impact the outcomes and information management processes at different levels. This issue has been addressed in the GIS environment through the utilization of classification routines to standardize maps by balancing and comparing processes. This involves reclassifying the values of influential variables, thereby replacing them. The input layer cells have been assigned new values that align with the analysis procedures. For each distance map and criterion, ten categories have been identified. These categories are ranked from 1 to 10, with the highest suitability value (10) assigned to the category closest to the standard distance, and the lowest spatial suitability value assigned to the category farthest from the criterion.
This study is the first to use the hierarchical analysis (AHP) method to identify the important weights of indicators in GIS-based multicriteria decision-making (GIS-MCDM) for urban development in the Egyptian deserts. The study focuses on three specific indicators and highlights the advantages of the approach. The implementation described by Hafezalkotob, et al. [76] and Rahimi et al. [74] is quick and straightforward. It offers a user-friendly environment for comprehending intricate matters. This tool can be utilized by officials and authorities in developing nations to minimize both time and expenses [77]. Additionally, it can manage and establish connections between vast quantities of intricate geographic data [78]. Boggia et al. conducted a study that demonstrated the effectiveness of using applied analytic hierarchy process (AHP) methodologies for weighing criteria and prioritizing options [79]. This approach is widely recognized and utilized in several fields. This methodology is valuable for examining issues that possess spatial characteristics and can assist planners and decision makers in making intricate decisions [80], as well as facilitating the implementation of AHP methodologies. When conducting site selection studies, it is important to evaluate the significance of each factor and incorporate subjective judgments into the decision-making process [74]. This strategy can also benefit from expert input [81].
The key aspect of this study is its comprehensive approach to mapping sustainable urban development. Unlike previous studies that have focused on specific criteria, this study has utilized a GIS-based multicriteria decision-making (GIS-MCDM) approach to incorporate a wide range of criteria for guiding urban development. Notably, there is no existing study in the Arab Library that has integrated three crucial indicators the risk in-dex, the environmental sensitivity index, and the economic resources index—in assessing the spatial suitability of sustainable urban development. The utilization of multicriteria decision-making inside a GIS framework has enhanced the efficiency and precision of the outcomes while facilitating the integration of the results in overlay analyses. Furthermore, the findings demonstrate the efficacy and suitability of this approach in addressing complex spatial decision problems involving several criteria. Therefore, the methodology employed in this research can aid in the intricate task of evaluating sustainability in regions that share similar natural and geographical characteristics.
One additional advantage of this study on a national and planning scale is that during the last thirty years, the Egyptian government has successfully developed over 24 newly constructed cities, with an additional 7 cities currently being created in the Egyptian deserts, and we assessed the suitability of the land in the Egyptian deserts for urban development. The findings of this study may thus have a significant impact on the types of services that cities offer to their residents. Lastly, the potential offered by the integrated and comprehensive methodology used in this research is of great importance to political and planning decision makers in Egypt.
5. Conclusions
Multicriteria GIS-based spatial suitability assessment is a valuable tool for monitoring and establishing sustainable urban development. However, one of the main limitations of spatial suitability assessment methods for urban sustainability is their narrow focus on a limited number of potential suitability criteria used to create maps for sustainable urban development. In this study, it was necessary to incorporate additional sustainability criteria, such as socio-economic factors and environmental considerations, which have not been adequately included in previous methods. In recent years, there has been a growing focus on spatial planning for urban development and environmental protection. To address these concerns, we utilized a method called GIS-based multicriteria decision-making (GIS-MCDM). The weights for the criteria were determined using the analytic hierarchy process (AHP), which allows for preference-based decision-making.
The current study highlights the need to focus on the significance of sustainability dimensions at a local level in Egyptian desert areas. This involves identifying indicators for urban development and assessing urban sustainability. This study concludes that the Aswan Governorate is particularly important due to its high environmental sensitivity resulting from the fragile desert environment. The governorate is also susceptible to rapid changes due to its location in a desert range. Therefore, it is crucial to consider the ecological balance of natural and vital systems when formulating policies and plans. The development of the desert in the Aswan Governorate is an essential requirement that cannot be overlooked. This is because only 19.15% of the governorate’s area is inhabited, while more than 80% is desert. However, the region is not yet prepared for development in various aspects, given its high environmental sensitivity and fragility. The ecosystem is prone to rapid changes, which can have significant impacts. Additionally, certain environmental factors pose challenges to future urban development processes.
Based on these findings, this study suggests promptly creating a comprehensive map of the various uses of state-owned lands in the Aswan Governorate. This map should specifically identify lands suitable for urban development, as determined by this study’s results. It is recommended that the governorate and its relevant authorities have full control and authority over these lands, allowing them to be utilized for development and investment following the applicable regulations. Additionally, there is a need to establish a new urban spatial economic pattern that aligns with the development of the Lake Nasser shores, taking into consideration the distance from the current density pattern. This study suggests implementing the small multi-sectoral development model, which involves shifting the focus of development from the eastern side of the Nile to the western side. This would be achieved by connecting the western desert sector to the new road network. The aim is to enhance the region’s capacity to accommodate significant population growth at the national level. To achieve this, a new population distribution map at the governorate level would be developed. Given that a spatial suitability of 70% or higher is recommended for sustainable urban development in the Aswan Governorate, the implementation of priority projects that support and achieve the goals of the future vision should strengthen the functional links between targeted village complexes and proposed local urban growth centers. These projects will restrict random extension and promote sustainable urban development in specific areas.
This study is the first to utilize GIS-based multicriteria decision-making (GIS-MCDM) approach in analyzing urban development in the Egyptian deserts. We conducted a comprehensive review of the existing literature and references to support the findings. The results of this study have the potential to be applied in various ways, which have not been explored previously due to the limited availability of spatiotemporal data over long historical periods. It is worth noting that the methodology, methods, and research tools used in this study are like those employed in studies conducted outside the Arab Republic of Egypt. However, there is a notable variation in the techniques and approaches used to generate spatial suitability maps. Some of the approaches used in this field include frequency rates, fuzzy logic, artificial neural networks, multicriteria analysis, hierarchy analysis, decision trees, and multivariate regression lines. AHP analysis enables the performance of sensitivity analyses, which can aid in the selection of choice criteria by accommodating standards with varying scales and facilitating statistical analyses. Therefore, the method was utilized in this study.
The methodology presented in this study offers policymakers and planners a chance to create development plans and policies. Our approach, which utilizes multicriteria decision rules based on AHP methods in the GIS environment, has several advantages. It provides a model for evaluating urban sustainability and can be applied to other areas with similar environmental and geographical conditions. Given the inclination towards amalgamation in future studies, the CA-Markov cellular automatology model will be used in conjunction with the GIS-based multicriteria decision-making (GIS-MCDM) and the analytical hierarchy process (AHP) to enhance our understanding of growth dynamics in urban development areas. This approach aims to effectively monitor and predict changes in land use, which is crucial for sustainable urban development.
Author Contributions
Conceptualization, A.A. (Ashraf Abdelkarim) and M.H.H.A.; Methodology, A.A. (Ashraf Abdelkarim) and A.R.; Software, A.A. (Ashraf Abdelkarim), M.A. and G.A.; Validation, G.A.; Formal analysis, K.E.; Investigation, M.A.; Resources, K.E., S.A., A.A. (Ali Aldersoni) and A.A. (Amer Aldamaty); Data curation, S.A.; Writing—original draft, A.A. (Ashraf Abdelkarim) and A.R.; Writing—review & editing, M.H.H.A.; Visualization, A.A. (Amer Aldamaty); Supervision, A.A. (Ali Aldersoni); Project administration, M.H.H.A.; Funding acquisition, A.A. (Ali Aldersoni). All authors have read and agreed to the published version of the manuscript.
Funding
This research was funded by the Deanship of Scientific Research at the University of Ha’il, Saudi Arabia, under the project number: RG-23 043.
Data Availability Statement
The original contributions presented in the study are included in the article, further inquiries can be directed to the corresponding authors.
Acknowledgments
The authors would like to express their sincere gratitude to the Deanship of Scientific Research at the University of Ha’il for providing the necessary support to conduct this research.
Conflicts of Interest
The authors declare no conflict of interest.
References
- El-Saharty, S.; Nassar, H.; Shawky, S.; El Shalakani, A.; Hamza, M.; Zhazng, Y.; Zeitoun, N. Achieving the Demographic Dividend in the Arab Republic of Egypt: Choice, Not Destiny; The World Bank: Washington, DC, USA, 2022; pp. 1–223. [Google Scholar]
- Oliveau, S.; Doignon, Y.; Blöss-Widmer, I. Population distribution: Follow the Nile. In An Atlas of Contemporary Egypt; CNRS Éditions: Paris, France, 2023; pp. 56–57. [Google Scholar] [CrossRef]
- Satoh, M.; Aboulroos, S. Irrigated Agriculture in Egypt: Past, Present and Future; Springer: Cham, Switzerland, 2017; pp. 1–290. [Google Scholar] [CrossRef]
- Central Agency for Public Mobilization and Statistics (CAPMAS). Egypt in Figures; CAPMAS: Cairo, Egypt, 2023; pp. 123–205. [Google Scholar]
- Wahid, A.; Madden, M.; Khalafa, F.; Fathy, I. Land Suitability Scenarios for Arid Coastal Plains using GIS Modeling: Southwestern Sinai Coastal Plains, Egypt. J. Urban Environ. Eng. 2009, 3, 73–83. [Google Scholar] [CrossRef]
- Cowen, D. GIS versus CAD versus DBMS: What are the differences. Photogramm. Eng. Remote Sens. 1988, 54, 1551–1555. [Google Scholar]
- Malczewski, J. A GIS-based approach to multiple criteria group decision-making. Int. J. Geogr. Inf. Syst. 1996, 10, 955–971. [Google Scholar] [CrossRef]
- Malczewski, J. GIS-based multicriteria decision analysis: A survey of the literature. Int. J. Geogr. Inf. Sci. 2006, 20, 703–726. [Google Scholar] [CrossRef]
- Collins, G.; Steiner, R.; Rushman, J. Land-use suitability analysis in the United States: Historical development and promising technological achievements. Environ. Manag. 2001, 28, 611–621. [Google Scholar] [CrossRef] [PubMed]
- Jankowski, P.; Richard, L. Integration of GIS-based suitability analysis and multicriteria evaluation in a spatial decision support system for route selection. Environ. Plan. B Urban Anal. City Sci. 1994, 21, 326–339. [Google Scholar] [CrossRef]
- James, P. Urban Sustainability in Theory and Practice: Circles of Sustainability; Routledge Press: London, UK, 2015; pp. 1–25. [Google Scholar]
- Abd El Karim, A.; Alogayell, H.M.; Alkadi, I.I.; Youssef, I. Mapping of GIS-Land Use Suitability in the Rural–Urban Continuum between Ar Riyadh and Al Kharj Cities, KSA Based on the Integrating GIS Multi Criteria Decision Analysis and Analytic Hierarchy Process. Environments 2020, 7, 75. [Google Scholar] [CrossRef]
- Abdelkarim, A.; Alogayell, H.; Alkadi, I.; Youssef, I. Spatial–temporal prediction model for land cover of the rural–urban continuum axis between Ar-Riyadh and Al-Kharj cities in KSA in the year of 2030 using the integration of CA–Markov model, GIS-MCA, and AHP. Appl. Geomat. 2022, 14, 501–525. [Google Scholar] [CrossRef]
- Subasinghe, S.; Estoque, R.; Murayama, Y. Spatiotemporal Analysis of Urban Growth Using GIS and Remote Sensing: A Case Study of the Colombo Metropolitan Area, Sri Lanka. ISPRS Int. J. Geo-Inf. 2016, 5, 197. [Google Scholar] [CrossRef]
- Deng, F.; Pu, J.; Huang, Y.; Han, Q. 3D geological suitability evaluation for underground space based on the AHP-cloud model. Undergr. Space 2023, 8, 109–122. [Google Scholar] [CrossRef]
- Ozsahin, E.; Ozdes, M. Agricultural land suitability assessment for agricultural productivity based on GIS modeling and multi-criteria decision analysis: The case of Tekirdağ province. Environ. Monit. Assess. 2022, 194, 1–19. [Google Scholar] [CrossRef]
- Kabir, Z.; Khan, I. Environmental impact assessment of waste to energy projects in developing countries: General guidelines in the context of Bangladesh. Sustain. Energy Technol. Assess. 2020, 37, 100619. [Google Scholar] [CrossRef]
- Church, R. Geographical information systems and location science. Comput. Oper. Res. 2002, 29, 541–562. [Google Scholar] [CrossRef]
- Banias, G.; Achillas, C.; Vlachokostas, C.; Moussiopoulos, N.; Tarsenis, S. Assessing multiple criteria for the optimal location of a construction and demolition waste management facility. Build. Environ. 2010, 45, 2317–2326. [Google Scholar] [CrossRef]
- Nour, A. The Potential of GIS Tools in Strategic Urban Planning Process; as an Approach for Sustainable Development in Egypt. J. Sustain. Dev. 2011, 4, 284–298. [Google Scholar] [CrossRef][Green Version]
- Li, L.; Zhu, G.; Wu, D.; Xu, H.; Ma, P.; Liu, J.; Li, Z.; He, Y.; Li, C.; Wu, P. Land suitability assessment for supporting transport planning based on carrying capacity and construction demand. PLoS ONE 2021, 16, e0246374. [Google Scholar] [CrossRef]
- Wu, W.; Yuan, Y.; Huang, C.; Dong, W.; Fu, Z. Urban Green Land Ecological Suitability Assessment Based on GIS in Arid Areas: Beitun City, Xinjiang, as an Example. Pol. J. Environ. Stud. 2021, 30, 5871–5883. [Google Scholar] [CrossRef]
- Rahman, M.; Islam, M.; Neema, M. GIS-based compactness measurement of urban form at neighborhood scale: The case of Dhaka, Bangladesh. J. Urban Manag. 2022, 11, 6–22. [Google Scholar] [CrossRef]
- Saaty, T. A scaling method for priorities in hierarchical structures. J. Math. Psychol. 1977, 15, 234–281. [Google Scholar] [CrossRef]
- Vaidya, O.; Kumar, S. Analytic hierarchy process: An overview of applications. Eur. J. Oper. Res. 2006, 169, 1–29. [Google Scholar] [CrossRef]
- Saidi, S.; Hosni, S.; Mannai, H.; Jelassi, F.; Bouri, S.; Anselme, B. GIS-based multi-criteria analysis and vulnerability method for the potential groundwater recharge delineation, case study of Manouba phreatic aquifer, NE Tunisia. Environ. Earth Sci. 2017, 76, 511. [Google Scholar] [CrossRef]
- Rozos, D.; Bathrellos, G.; Skillodimou, H. Comparison of the implementation of rock engineering system and analytic hierarchy process methods, upon landslide susceptibility mapping, using GIS: A case study from the Eastern Achaia County of Peloponnesus, Greece. Environ. Earth Sci. 2011, 63, 49–63. [Google Scholar] [CrossRef]
- Pourghasemi, H.; Pradhan, B.; Gokceoglu, C. Application of fuzzy logic and analytical hierarchy process (AHP) to landslide susceptibility mapping at Haraz watershed, Iran. Nat. Hazards 2012, 63, 965–996. [Google Scholar] [CrossRef]
- El Sayed, M. Land Suitability Analysis as Multi-Criteria Decision Making to Support the Egyptian Urban Development. Proc. Sci. Technol. 2018, 1, 1–11. [Google Scholar] [CrossRef]
- Effat, A.; Hegazy, N. A Multidisciplinary Approach to Mapping Potential Urban Development Zones in Sinai Peninsula, Egypt Using Remote Sensing and GIS. J. Geogr. Inf. Syst. 2013, 5, 567–583. [Google Scholar] [CrossRef]
- El Menshawy, A.; Aly, S.S.; Salman, A.M. Sustainable upgrading of informal settlements in the developing world, case study: Ezzbet Abd El Meniem Riyadh, Alexandria, Egypt. Procedia Eng. 2011, 21, 168–177. [Google Scholar] [CrossRef]
- Jaafar, A.; Can, K. Evaluating suitability for sustainable urban growth of Abuja by using MCE and GIS. Int. J. Adv. Appl. Sci. 2019, 6, 68–76. [Google Scholar] [CrossRef]
- Mehul, D.; Rajansinh, Z.; Manthan, B.; Shashikant, K. Land suitability Analysis for Urban Plan Preparation Using Remote Sensing and GIS A Case of Anand-Vidyanagar-Karamsad Development Plan. In Proceedings of the International Conference on “Research and Innovations in Science, Engineering & Technology” ICRISET-2017, Oxford, UK, 17–19 February 2017; pp. 1–5. Available online: https://easychair.org/publications/preprint/DPhQ (accessed on 5 January 2023).
- Can, K.; Nuhcan, A. Using GIS for Developing Sustainable Urban Growth Case Kyrenia Region. Int. Arch. the Photogramm. Remote Sens. Spat. Inf. Sci. 2018, XLII-3/W4, 263–268. [Google Scholar] [CrossRef]
- Jaroslav, B.; Marketa, S.; Alena, V. Land suitability assessment of the Olomouc region: An application of an Urban Planner model. J. Maps 2018, 14, 73–80. [Google Scholar] [CrossRef]
- Santosh, C.; Krishnaiah, C.; Preaveen, G. Site suitability analysis for urban development using GIS based multicriteria evaluation technique: A case study in Chikodi Taluk, Belagavi District, Karnataka, India. In Proceedings of the 9th IGRSM International Conference and Exhibition on Geospatial & Remote Sensing (IGRSM 2018), Kuala Lumpur, Malaysia, 24–25 April 2018; Volume 169, pp. 1–10. [Google Scholar] [CrossRef]
- Akbulut, A.; Ozcevik, O.; Carton, L. Evaluating Suitability of a GIS–AHP combined method for sustainable urban and environmental planning in Beykoz District, Istanbul. Int. J. Sus. Dev. Plan. 2018, 13, 1103–1115. [Google Scholar] [CrossRef]
- Huiping, H.; Qiangzi, L.; Yuan, Z. Urban Residential Land Suitability Analysis Combining Remote Sensing and Social Sensing Data: A Case Study in Beijing, China. Sustainability 2019, 11, 2255. [Google Scholar] [CrossRef]
- Maher, A.; Sbrina, A.; Mohammed, F.; Zulfa, H. Land suitability analysis of urban growth in Seremban Malaysia, using GIS based Analytical Hierarchy Process. Procedia Eng. 2017, 198, 1128–1136. [Google Scholar] [CrossRef]
- Ronja, H.; Tung, G.; Martin, K.; Daniel, W.; Chau, T. Multi-Criteria Decision Analysis for the Land Evaluation of Potential Agricultural Land Use Types in a Hilly Area of Central Vietnam. Land 2019, 8, 90. [Google Scholar] [CrossRef]
- Abdelkarim, A.; Al-Alola, S.; Alogayell, H.; Mohamed, S.; Alkadi, I.; Youssef, I. Integration of GIS-Based Multicriteria Decision Analysis and Analytic Hierarchy Process to Assess Flood Hazard on the Al-Shamal Train Pathway in Al-Qurayyat Region, Kingdom of Saudi Arabia. Water 2020, 12, 1702. [Google Scholar] [CrossRef]
- Abdelkarim, A.; Awawdeh, M. Integrating GIS Accessibility and Location-Allocation Models with Multicriteria Decision Analysis for Evaluating Quality of Life in Buraidah City, KSA. Sustainability 2020, 12, 1412. [Google Scholar] [CrossRef]
- Abdelkarim, A. Improving the Urban Planning of the Green Zones in Al-Dammam Metropolitan Area, KSA, Using Integrated GIS location-allocation and Accessibility Models. Geosfera Indones. 2020, 5, 1–46. [Google Scholar] [CrossRef]
- Ajjur, S.; Mogheir, Y. Flood hazard mapping using a multi-criteria decision analysis and GIS (case study Gaza Governorate, Palestine). Arab. J. Geosci. 2020, 13, 44. [Google Scholar] [CrossRef]
- Gourav, P.; Kumar, R.; Gupta, A.; Arif, M. Flood Hazard Zonation of Bhagirathi River Basin using Multi-Criteria Decision-Analysis in Uttarakhand, India. Int. J. Emerg. Technol. 2020, 11, 62–71. [Google Scholar]
- Vanolya, M.; Jelokhani-Niaraki, M. The use of subjective–objective weights in GIS-based multi-criteria decision analysis for flood hazard assessment: A case study in Mazandaran, Iran. GeoJournal 2021, 86, 379–398. [Google Scholar] [CrossRef]
- Rahman, M.; Szabó, G. Sustainable Urban Land-Use Optimization Using GIS-Based Multicriteria Decision-Making (GIS-MCDM) Approach. ISPRS Int. 2022, 11, 313. [Google Scholar] [CrossRef]
- Otokiti, K.; Akinola, O.; Oriri, O. Multi-Criteria Decision Analysis and GIS Mapping of Flood Vulnerability in the Core of Lagos State Nigeria. Ethiop. J. Environ. Stud. Manag. 2022, 15, 184–200. Available online: https://ejesm.org/doi/v15i2.5 (accessed on 5 January 2023).
- Abudeif, A.; Abdel Moneim, A.; Farrag, A. Multi criteria decision analysis based on analytic hierarchy process in GIS environment for siting nuclear power plant in Egypt. Ann. Nucl. Energy 2015, 75, 682–692. [Google Scholar] [CrossRef]
- López, T.; Yarnal, B. Putting adaptive capacity into the context of people’s lives: A case study of two flood-prone communities in Puerto Rico. Nat. Hazards 2010, 52, 277–297. [Google Scholar] [CrossRef]
- Bhagat, J.; Devadas, V. Planning for a sustainable compact city: A way forward. WIT Trans. Ecol. Environ. 2020, 241, 113–122. [Google Scholar] [CrossRef]
- Bibri, S.; Krogstie, J.; Karrholm, M. Compact city planning, and development: Emerging practices and strategies for achieving the goals of sustainability. Dev. Built Environ. 2020, 4, 1–20. [Google Scholar] [CrossRef]
- AlFanatseh, A. Land suitability analysis of urban development in the Aqaba area, Jordan, using a GIS-based analytic hierarchy process. GeoJournal 2021, 87, 4143–4159. [Google Scholar] [CrossRef]
- Abdel Karim, A.; Gaber, D.; Youssef, M.; Pradhan, B. Flood Hazard Assessment of the Urban Area of Tabuk City, Kingdom of Saudi Arabia by Integrating Spatial-Based Hydrologic and Hydrodynamic Modeling. Sensors 2019, 19, 1024. [Google Scholar] [CrossRef] [PubMed]
- Xu, C.; Xu, X.; Dai, F.; Xiao, J.; Tan, X.; Yuan, X. Landslide hazard mapping using GIS and weight of evidence model in Qingshui rive rwatershed of 2008 Wenchuan earthquake struck region. J. Earth Sci. 2012, 23, 97–120. [Google Scholar] [CrossRef]
- Kanwal, S.; Atifa, S.; Shafiq, M. GIS based landslide susceptibility mapping of northern areas of Pakistan, a case study of Shigar and Shyok Basins. Geomat. Nat. Hazards Risk 2017, 8, 348–366. [Google Scholar] [CrossRef]
- Achour, Y.; Boumezbeur, A.; Hadji, R.; Chouabbi, A.; Cavaleiro, V.; Bendaoud, E. Landslide susceptibility mapping using analytic hierarchy process and information value methods along a highway road section in Constantine, Algeria. Arab. J. Geosci. 2017, 10, 1–16. [Google Scholar] [CrossRef]
- Ahmed, B. Landslide susceptibility mapping using multi-criteria evaluation techniques in Chittagong Metropolitan Area, Bangladesh. Landslides 2015, 12, 1077–1095. [Google Scholar] [CrossRef]
- Naghibi, A.; Pourghasemi, R.; Pourtaghi, S.; Rezaei, A. Groundwater Qanat Potential Mapping Using Frequency Ratio and Shannon’s Entropy Models in the Moghan Watershed, Iran. Earth Sci. Inform. 2015, 8, 171–186. [Google Scholar] [CrossRef]
- Tan, M.; Li, X.; Lu, C. Urban land expansion and arable land loss of the major cities in China in the 1990s, Science in China. Ser. D Earth Sci. 2005, 48, 1492–1500. [Google Scholar] [CrossRef]
- Sapena, M.; Ruiz, L.Á. Analysis of land use/land cover spatiotemporal metrics and population dynamics for urban growth characterization. Comput. Environ. Urban Syst. 2019, 73, 27–39. [Google Scholar] [CrossRef]
- Yin, M.; Bertolini, L.; Duan, J. The Effects of the High Speed Railway on Urban Development: International Experience and Potential Implications for China. Prog. Plan. 2015, 98, 1–52. [Google Scholar] [CrossRef]
- Saaty, W. The analytic hierarchy process—What it is and how it is used. Math. Model. 1987, 9, 161–176. [Google Scholar] [CrossRef]
- Diakoulaki, D.; Mavrotas, G.; Papayannakis, L. Determining objective weights in multiple cri-teria problems: The critic method. Comput. Oper. Res. 1995, 22, 763–770. [Google Scholar] [CrossRef]
- Kadoic, N. Characteristics of the Analytic Network Process, a Multi-Criteria Decision-Making Method. Croat. Oper. Res. Rev. 2018, 9, 235–244. [Google Scholar] [CrossRef]
- Olsen, A.; Wolcott, D.; Haines, T.; Janke, K.; McLaughlin, E. How to use the Delphi method to aid in decision making and build consensus in pharmacy education. Curr. Pharm. Teach. Learn. 2021, 13, 1376–1385. [Google Scholar] [CrossRef]
- Mahdy, M.; Bahaj, S. Multi criteria decision analysis for offshore wind energy potential in Egypt. Renew. Energy 2018, 118, 278–289. [Google Scholar] [CrossRef]
- Oluleye, B.; Ogunleye, B.; Oyetunji, K. Evaluation of the critical success factors for sustainable housing delivery: Analytic hierarchy process approach. J. Eng. Des. Technol. 2020, 19, 1044–1062. [Google Scholar] [CrossRef]
- Oluleye, B.; Oyetunji, K.; Olukolajo, A.; Chan, W. Integrating building information modelling for improving facility management operations: A fuzzy synthetic evaluation of the critical success factors. J. Facil. Manag. 2021, 21, 201–220. [Google Scholar] [CrossRef]
- Nguyen, T.; Bleys, B. Applying Analytic Hierarchy Process to Adaptation to Saltwater Intrusion in Vietnam. Sustainability 2021, 13, 2311. [Google Scholar] [CrossRef]
- Saaty, L. How to make a decision: The analytic hierarchy process. Eur. J. Oper. Res. 1990, 48, 9–26. [Google Scholar] [CrossRef]
- Foroozesh, F.; Monavari, S.; Salmanmahiny, A.; Robati, M.; Rahimi, R. Assessment of sustainable urban development based on a hybrid decision-making approach: Group fuzzy BWM, AHP, and TOPSIS–GIS. Sustain. Cities Soc. 2022, 76, 103402. [Google Scholar] [CrossRef]
- Branch, S.; Yusuff, R.; Afshari, A. A review of spatial multi criteria decision making. In Proceedings of the 6th SASTech Khavaran Institute of Higher Education, Kuala Lumpur, Malaysia, 24–25 March 2012; pp. 1–9. [Google Scholar]
- Rahimi, S.; Hafezalkotob, A.; Monavari, S.; Hafezalkotob, A.; Rahimi, R. Sustainable landfill site selection for municipal solid waste based on a hybrid decision-making approach: Fuzzy group BWM-MULTIMOORA-GIS. J. Clean. Prod. 2020, 248, 119186. [Google Scholar] [CrossRef]
- Ramya, S.; Devadas, V. Integration of GIS, AHP and TOPSIS in evaluating suitable locations for industrial development: A case of Tehri Garhwal district, Uttarakhand, India. J. Clean. Prod. 2019, 238, 117872. [Google Scholar] [CrossRef]
- Hafezalkotob, A.; Hafezalkotob, A.; Liao, H.; Herrera, F. Interval MULTIMOORA method integrating interval Borda rule and interval best–worstmethod- based weighting model: Case study on hybrid vehicle engine selection. IEEE Trans. Cybern. 2019, 50, 1157–1169. [Google Scholar] [CrossRef] [PubMed]
- Pasalari, H.; Nodehi, N.; Mahvi, H.; Yaghmaeian, K.; Charrahi, Z. Landfill site selection using a hybrid system of AHP-Fuzzy in GIS environment: A case study in Shiraz city, Iran. MethodsX 2019, 6, 1454–1466. [Google Scholar] [CrossRef]
- Moeinaddini, M.; Khorasani, N.; Danehkar, A.; Darvishsefat, A. Siting MSW landfill using weighted linear combination and analytical hierarchy process (AHP) methodology in GIS environment (case study: Karaj). Waste Manag. 2010, 30, 912–920. [Google Scholar] [CrossRef]
- Boggia, A.; Massei, G.; Pace, E.; Rocchi, L.; Paolotti, L.; Attard, M. Spatial multicriteria analysis for sustainability assessment: A new model for decision making. Land Use Policy 2018, 71, 281–292. [Google Scholar] [CrossRef]
- Alzouby, M.; Nusair, A.; Taha, M. GIS based multi criteria decision analysis for analyzing accessibility of the disabled in the Greater Irbid Municipality Area, Irbid, Jordan. Alex. Eng. J. 2019, 58, 689–698. [Google Scholar] [CrossRef]
- Manupati, V.K.; Ramkumar, M.; Samanta, D. A multi-criteria decision making approach for the urban renewal in Southern India. Sustain. Cities Soc. 2018, 42, 471–481. [Google Scholar] [CrossRef]


Disclaimer/Publisher’s Note: The statements, opinions and data contained in all publications are solely those of the individual author(s) and contributor(s) and not of MDPI and/or the editor(s). MDPI and/or the editor(s) disclaim responsibility for any injury to people or property resulting from any ideas, methods, instructions or products referred to in the content. |
© 2024 by the authors. Licensee MDPI, Basel, Switzerland. This article is an open access article distributed under the terms and conditions of the Creative Commons Attribution (CC BY) license (https://creativecommons.org/licenses/by/4.0/).