Abstract
Urban vitality, intricately connected to urban morphology, has long been a cornerstone of urban planning and design. The accelerated pace of urbanization has created abundant living and working spaces, but it has also brought about a series of issues such as traffic congestion, environmental pollution, insufficient public spaces, and uneven urban development, leading to a decline in urban vitality. The spatial distribution patterns of urban vitality and their influencing factors are diverse and vary across different cities, necessitating a multidimensional exploration of the relationship between urban vitality and the built environment. Utilizing the central urban area of Beijing as a case study, this research leverages multi-source urban spatial data to delineate the spatial characteristics of social, economic, cultural, and comprehensive vitality. Furthermore, a comprehensive set of built-environment indicators is developed across five dimensions to analyze their correlation with urban vitality. The results indicate: (1) There is a significant spatial clustering of various vitality types in Beijing, with a pronounced correlation between high-density population aggregation and vigorous economic activities. (2) Subdistricts exhibiting high social vitality display an “n”-shaped distribution around the Second Ring Road. In contrast, those with high economic vitality are concentrated along Chang’an Street and various district commercial centers. High cultural vitality subdistricts are distributed in a northwest–southeast trajectory from the Fourth Ring Road to the Second Ring Road, and subdistricts with high comprehensive vitality exhibit a concentric distribution radiating outwards from the center. (3) Social vitality is most closely related to comprehensive vitality, and the various vitality types in Beijing’s central urban area develop relatively evenly. (4) The built environment significantly affects all types of urban vitality. Factors such as floor area ratio, POI density, POI mixing degree, and intersection density are fundamental to enhancing urban vitality, whereas the greening rate somewhat inhibits it. (5) Future spatial planning should utilize the radiating effect of high-vitality subdistricts to optimize population distribution, enhance POI mixing, increase metro station density, and strengthen critical urban structures for synergistic economic and cultural development. This study provides a foundation and promotion strategies for optimizing the layout and enhancing vitality at the subdistrict scale within Beijing’s central urban area.
1. Introduction
As urbanization accelerates, the rapid increase in population in urban centers has significantly altered urban spatial structures. Concurrently, the disorderly expansion of cities has led to numerous urban issues, such as environmental pollution, traffic congestion, and imbalances in public service provision. These issues have collectively contributed to a decline in urban spatial vitality [1,2]. China, having transitioned from an industrial to a post-industrial society, is now shifting towards high-quality development [3]. Under the pressure of intensified land use in urban centers, China has undertaken extensive renewal of traditional neighborhoods, old communities, and urban villages, significantly impacting the integrity and sustainability of current urban systems [4]. With the growing demand for an improved quality of life, enhancing urban livability has become a key objective in contemporary urban planning [5,6]. Urban vitality is closely linked to spatial quality and it directly influences livability [7]. High urban vitality indicates greater attractiveness, which can draw talent and capital, thereby increasing competitiveness and providing more benefits and opportunities for residents [8]. Urban vitality also serves as an effective measure of spatial quality and distribution characteristics [9,10,11]. However, due to the diverse structures and functions of different cities, the relationship between urban vitality and the built environment lacks a unified pattern. Therefore, in-depth research and exploration into enhancing urban spatial vitality are crucial for achieving sustainable urban development, improving residents’ quality of life, and strengthening overall urban competitiveness.
Since the 1960s, scholarly interest in urban vitality has steadily grown [12]. Originating from Jane Jacobs, the concept underscores the vibrancy infused into cities through pedestrian activities on streets, social interactions among urban dwellers, and the dynamic interplay between people and places, particularly evident in the bustling public life of streets, squares, and parks [13]. Kevin Lynch defines urban vitality as a dimension of urban form that sustains human life needs and social functions, embracing the continuity, safety, and stability of the entire ecosystem [14]. Maas conceptualizes urban vitality as a reflection of urban spatial quality, encompassing the continual presence of people in streets and public spaces, their diverse activities and opportunities, and the material environments that facilitate such engagements [15]. Montgomery posits that vibrant human activities are pivotal in nurturing urban vitality, with successful urban locales often boasting vibrant public spaces conducive to a myriad of human endeavors [2]. Yang et al. suggest that urban vitality manifests in spaces’ capacity to attract a variety of human activities [16]. The 2024 Beijing Municipal Government Work Report proposed the development goal of strengthening urban fine governance and enhancing urban vitality by scientifically harnessing the laws of development in mega-cities. Despite nuances in scholars’ definitions, urban vitality consistently emerges as a vital ingredient in fostering high-quality urban living, with the built environment playing a pivotal role in shaping this vitality. Consequently, investigating the nexus between urban vitality and the built environment holds paramount significance, offering critical insights into the spatial dynamics and challenges of contemporary urban development, and providing foundational support for urban design and management endeavors aimed at enhancing vitality.
Assessing urban vitality has long been a significant challenge, with past approaches primarily focusing on two dimensions: human activity intensity and built environment indicators [17,18,19]. Regarding human activity intensity, Jane Jacobs pioneered field research methods to measure and validate the degree of population aggregation in urban areas [9,13]. In terms of built environment indicators, Jacobs argued that diverse urban areas should exhibit high functional mix, small-scale streets, a mix of old and new buildings, and high pedestrian flow density [13]. Similar viewpoints include Jan Gehl’s emphasis on the integrated, cohesive, and open characteristics of urban built environments [20], and Montgomery’s assertion that appropriate density, human-scale dimensions, and the presence of public spaces and parks are vital guarantees of urban vitality [2,21]. The urban built environment serves as a tangible manifestation of the region’s social, economic, and cultural development levels [22], and its diverse connotations have spurred the development of various urban vitality assessment methods, which can be broadly categorized as field research [23,24] and big data analytics [25,26,27,28,29,30,31,32,33,34]. At the city scale, field research often faces challenges such as data collection difficulties and heterogeneity. Currently, many studies rely on Internet Points of Interest (POI) provided by various online platforms to reflect the distribution characteristics of different types of venue and regional urban vitality [35,36]. However, due to their lack of timeliness and objectivity, POI data often provide a one-sided view of urban vitality and may not accurately represent actual human activity levels [26]. The utilization of multiple data sources effectively integrates the advantages of traditional research and modern technological methods, enhancing the comprehensiveness and accuracy of evaluation, and has become the prevailing trend in urban vitality assessment [37]. Combining satellite remote sensing, social media, and traffic flow data for comprehensive evaluation not only provides dynamic information with strong temporal continuity and wide coverage but also fully reflects the multidimensional characteristics of urban vitality, thus facilitating a deeper understanding of the complex relationship between urban vitality and urban development.
In recent years, scholars such as Si et al. and Liu et al. have undertaken a nuanced classification of urban vitality, delineating it into three principal dimensions: social vitality, economic vitality, and cultural vitality [34,38,39]. This classification underscores social vitality as the linchpin, economic vitality as the foundational element, and cultural vitality as the intrinsic quality inherent in urban vigor. Such conceptual refinement reflects a broader trend towards acknowledging the multifaceted nature of urban dynamism. Notably, recent investigations into the vitality of critical Chinese metropolitan centers like Shanghai and Chengdu have adopted this tripartite framework to develop comprehensive indicator systems, integrating diverse built environment factors [33,40]. With the advent of big data technology, a plethora of Location-Based Services (LBS) data types have been integrated into studies on urban vitality, facilitating the visualization of population distribution dynamics. These datasets encompass heat map data [25,26,27,28,29], social media check-in data [30,31], mobile phone signaling data [32], and taxi arrival data, among others [33], offering insights into the social vibrancy of diverse urban demographics across varying temporal contexts. The concentrated presence of small-scale dining establishments is recognized as an indicator of vibrant urban locales, reflecting the daytime economic vigor of urban centers [41,42]. Moreover, nocturnal light emissions captured via satellite imagery serve as a surrogate for GDP in specific contexts, capturing the economic vitality of regions with predictive accuracy scaling with spatial resolution [43,44]. Furthermore, the spatial dispersion of urban cultural amenities such as libraries, museums, and art galleries serves as an objective manifestation of cultural vibrancy within urban landscapes [33,34].
The urban built environment is considered a key factor influencing urban vitality. Cervero R. et al. proposed a “3D” model consisting of density, diversity, and design dimensions to assess the relationship between the built environment and transportation [45]. Building upon this, Ewing R. et al. added dimensions of public transportation accessibility and availability [46], although there is some controversy regarding the specific selection of factors [33]. Gomez-Varo et al. constructed a multidimensional index system, including density, functional diversity, social opportunities, architectural diversity, accessibility, and boundary vacuum to evaluate the vitality of a low-income area in Barcelona and provide recommendations for public policy improvements [47]. Li X. et al. explored factors contributing to or inhibiting urban vitality in Wuhan from six aspects: facilities and land use, neighborhood attributes, urban form, location, landscape, and accessibility [12]. Xia, C. et al. validated the impact of three-dimensional measures such as walkability and comfort in the built environment on urban vitality, in contrast with two-dimensional measures like accessibility, proximity, and mixture across 15 major cities in China [48]. Most scholars have evaluated the influence of these indicators on urban vitality using linear methods such as analytic hierarchy process, principal component analysis, and grey relational analysis, which may not fully capture the complex relationships between urban vitality and urban elements [11]. Exploring the spatial heterogeneity of different urban built environment indicators’ effects on urban vitality is crucial as it helps urban planners and decision-makers understand how various environmental factors manifest different impacts in different areas. Analyzing this spatial heterogeneity can identify which environmental features exhibit more significant effects in promoting or inhibiting urban vitality, thereby enabling more refined and targeted urban planning.
As fundamental administrative units, the quality of the living environment in subdistricts directly affects residents’ quality of life and the overall urban living environment [38]. Therefore, this study selects the subdistricts in Beijing’s central urban area as the primary research unit, as they can finely capture urban dynamics and human activity characteristics. We employ population heat map data, nighttime light data, and the density of cultural facilities’ POIs to represent social, economic, and cultural vitality, respectively. Additionally, we construct a comprehensive index system of the urban built environment, including land use intensity, service outlets, blue–green spaces, accessibility, and location to analyze their impact mechanisms using the Geographic Weighted Regression (GWR) model. The research aims to comprehensively investigate the relationship between the built environment and urban vitality in mega-cities in China from the perspective of urban structure and landscape. The objectives of the study are: (1) to scientifically analyze the spatial distribution patterns of urban vitality in Beijing’s central area and the relationships between different types of vitality, (2) to explore the mechanisms of how the urban built environment affects urban vitality at the neighborhood scale, and (3) proposing strategies for sustainably enhancing urban vitality in Beijing’s central area.
2. Study Area and Data Sources
2.1. Study Area
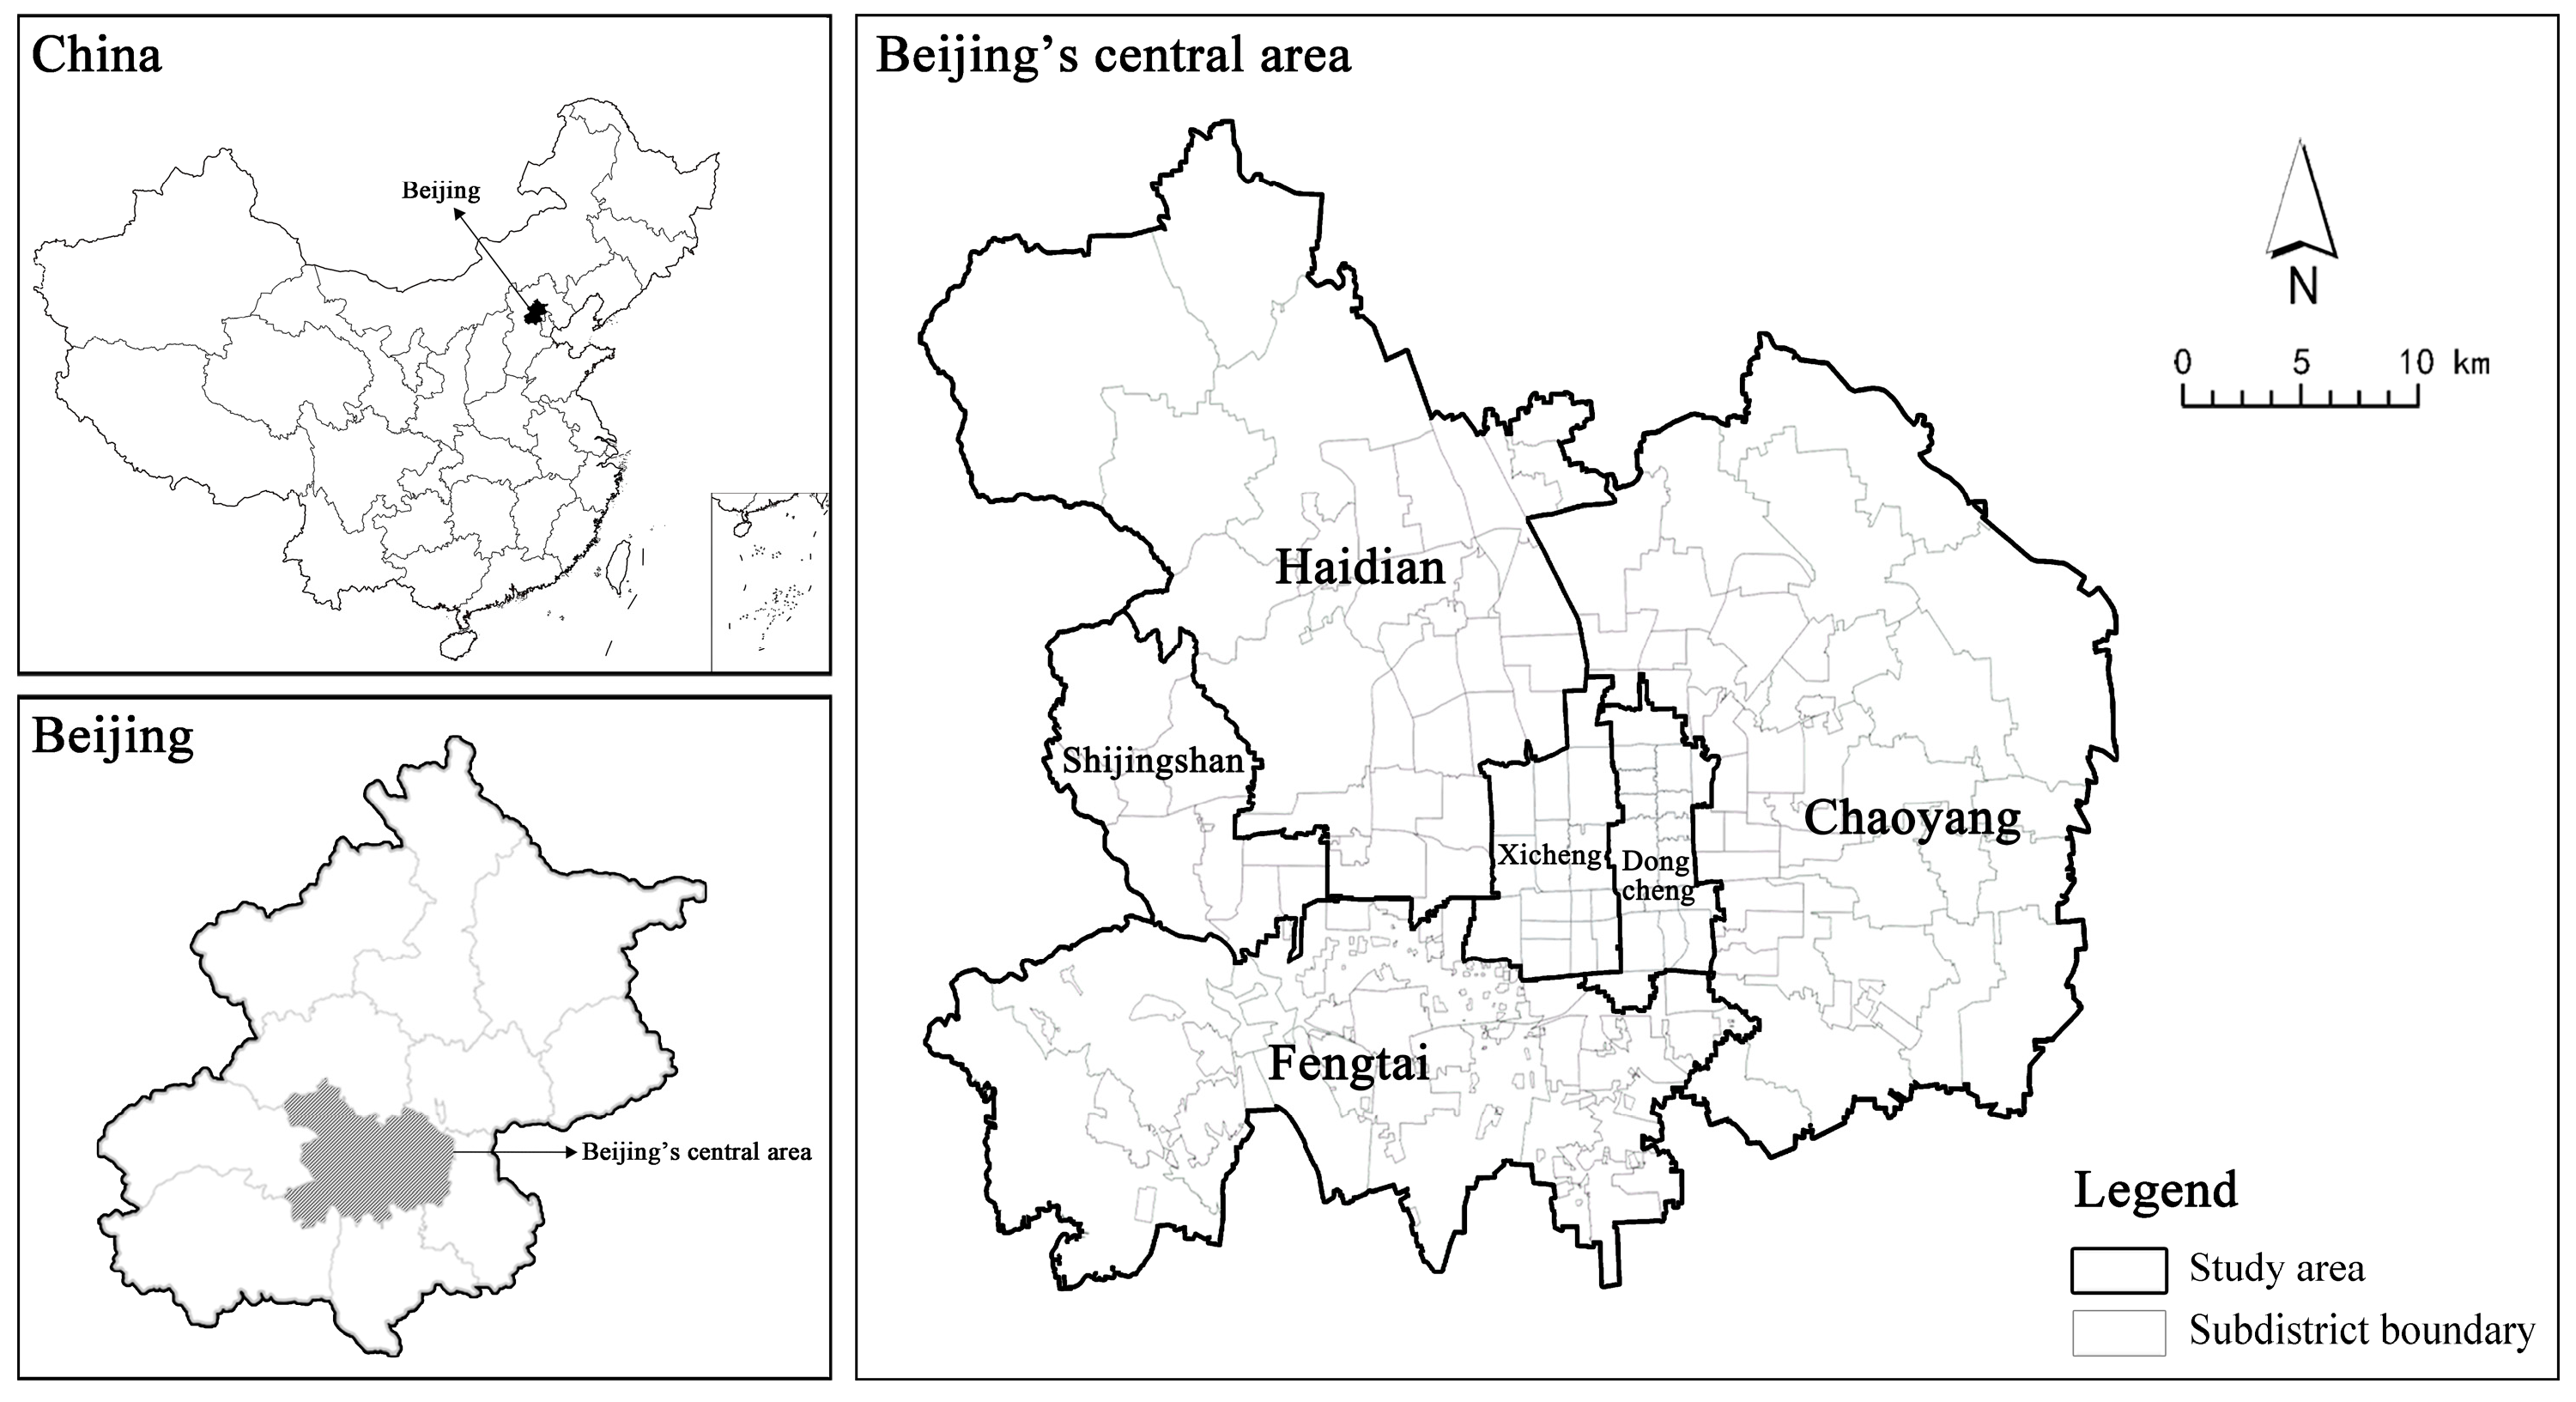
This study focuses on Beijing’s central area, comprising six administrative districts: Dongcheng, Xicheng, Chaoyang, Haidian, Fengtai, and Shijingshan (excluding Beijing Capital International Airport). Covering approximately 1378 km2, this area has a permanent population of 10.93 million, accounting for 50.2% of Beijing’s total population according to the Seventh National Population Census. As outlined in the Beijing Urban Master Plan 2016–2035 (Master Plan), Beijing’s central area serves as the concentrated hub for the national political, cultural, international communication, and scientific and technological innovation centers. It is pivotal to the goal of creating a world-class, harmonious, and livable city (Figure 1).
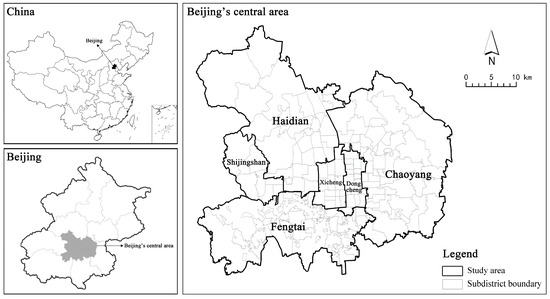
Figure 1.
Location of the study area.
Subdistricts and townships are the fundamental administrative units in China’s hierarchy, providing a detailed perspective on urban governance and development. To address grassroots governance in urban–rural integration areas, Beijing has established regional offices within its administrative divisions. These offices manage urban affairs and facilitate the transition of highly urbanized townships to subdistrict offices [49]. Research at this level allows for a detailed observation of the impacts and challenges of urban policies, especially in densely populated and rapidly urbanizing central areas, offering precise and practical support for urban planning and governance.
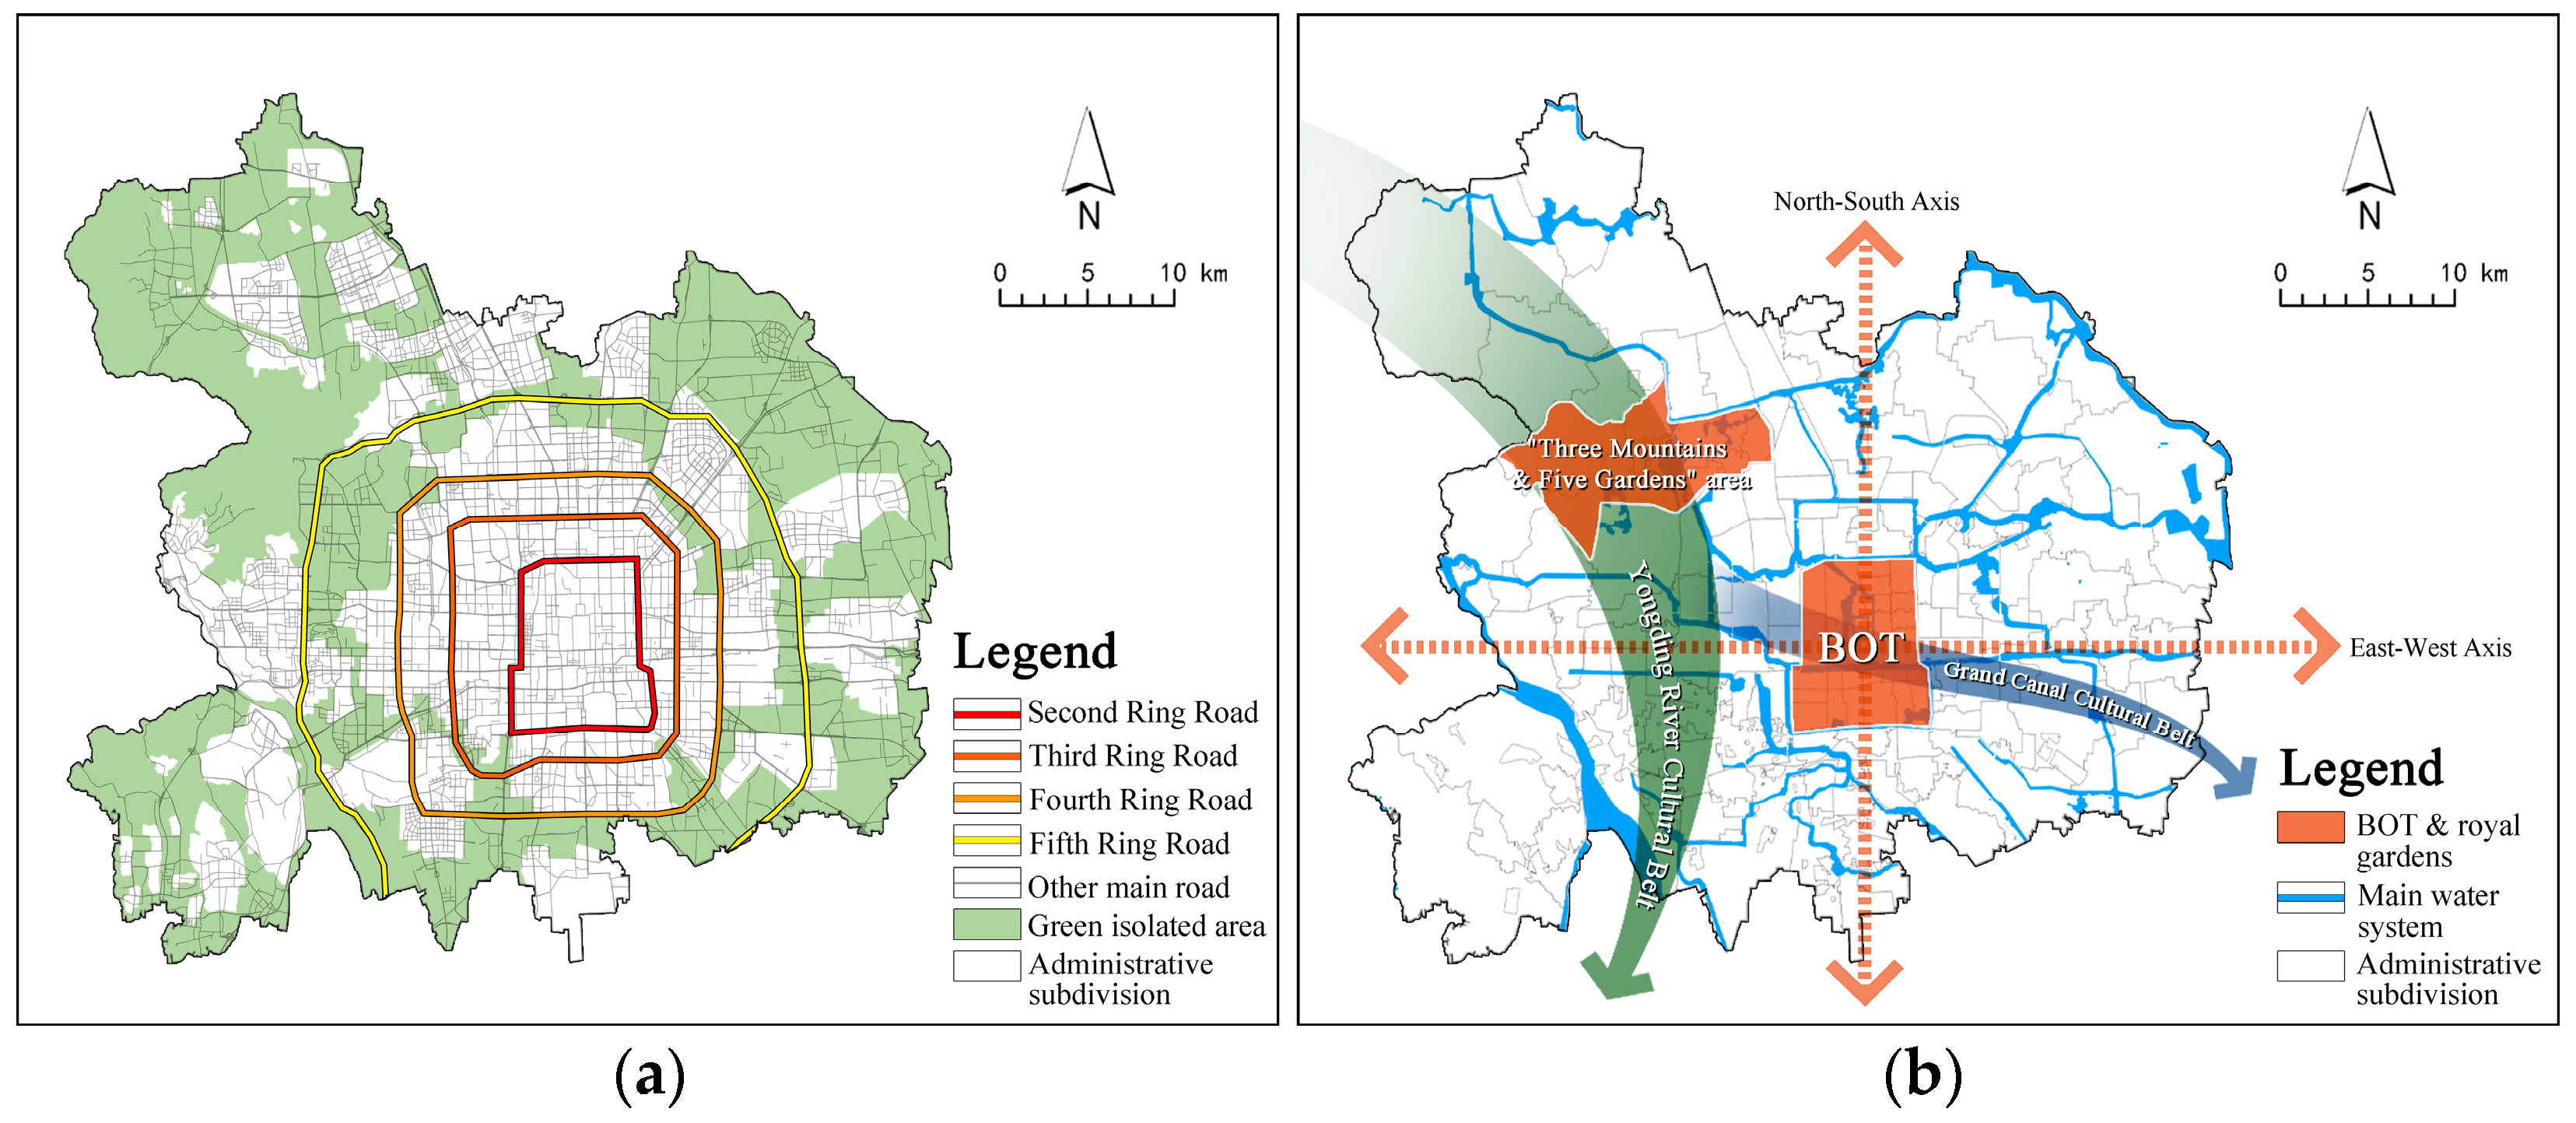
With the recent issuance of the Beijing Garden City Special Plan (2023–2035), Beijing Municipality will further enhance the urban built environment based on vital urban structures such as the north–south central axis and the “Three Mountains and Five Gardens” area. Urban structure significantly shapes the spatial pattern of the built environment. In Beijing’s central urban area, key elements include urban axes, major transportation systems, and natural blue–green substrates [50]. The north–south central axis stretches from the Yanshan Mountains to Beijing Daxing International Airport, while the east–west axis extends from Tiananmen Square to the Chaobai River. The transportation network is supported by five ring roads surrounding Beijing Old Town (BOT). The blue–green system is characterized by the interconnected Beiyun River and Yongding River water systems, linked by natural and artificial waterways. Additionally, the urban park belt within and beyond the Fifth Ring Road, along with the suburban park belt, forms a continuous green buffer zone (Figure 2).

Figure 2.
(a) Urban transport and green space structure; (b) urban rivers, axes, and cultural belts.
Based on the “Master Plan”, this study examines 100 subdistricts, 31 regions, and 2 towns within the Beijing’s central area as research units. The goal is to explore the spatial patterns of its diverse vitality and identify the influencing factors. By doing so, this study aims to offer direct references and insights for enhancing urban grassroots governance.
2.2. Data Sources
The measurement of Urban Social Vitality (SV) is sourced from Baidu Heatmap data for Beijing’s central area. To avoid disruptions from holidays and other special occasions on social vitality, this study chose two typical dates for measuring social vitality. These dates were carefully selected to ensure they represented regular days without any significant external influences that could skew the data. By doing so, the study aimed to obtain a more accurate and consistent measure of social vitality, providing a clearer picture of everyday social interactions and activities. Data were collected on 23 January 2022 (weekend) and 24 January 2022 (weekday) at hourly intervals from 7:00 to 21:00. To characterize SV, we computed the average heat density values from 30 time points.
Urban Economic Vitality (EV) was assessed using night-time light data from the LJ1-01 high-resolution remote sensing imagery of Beijing (http://www.lmars.whu.edu.cn, accessed on 5 May 2022) [51]. The imagery was resampled using the nearest neighbor method, and the data from each sampled grid within the research units were aggregated to represent EV.
Urban Cultural Vitality (CV) was evaluated using data from the Amap online map (https://lbs.amap.com/, accessed on Amap Software Co., Ltd). These data include venues such as museums, exhibition centers, libraries, concert halls, theaters, and art galleries, which are considered essential cultural elements. The density of POI was used to assess CV [52].
Given the spatial characteristics of Beijing’s central urban area, the study selected a built environment indicator system, detailed in Table 1. Building vector data, diverse POI data, including bus stops, metro stations, and urban centers, as well as road network data, were acquired from Amap. Blue–green space data were derived from the GLC_FCS30 product (https://data.casearth.cn, accessed on Aerospace Information Research Institute, Chinese Academy of Sciences), which provided 30 m resolution land use and land cover data.

Table 1.
Built environment variables in Beijing’s central area.
3. Methods
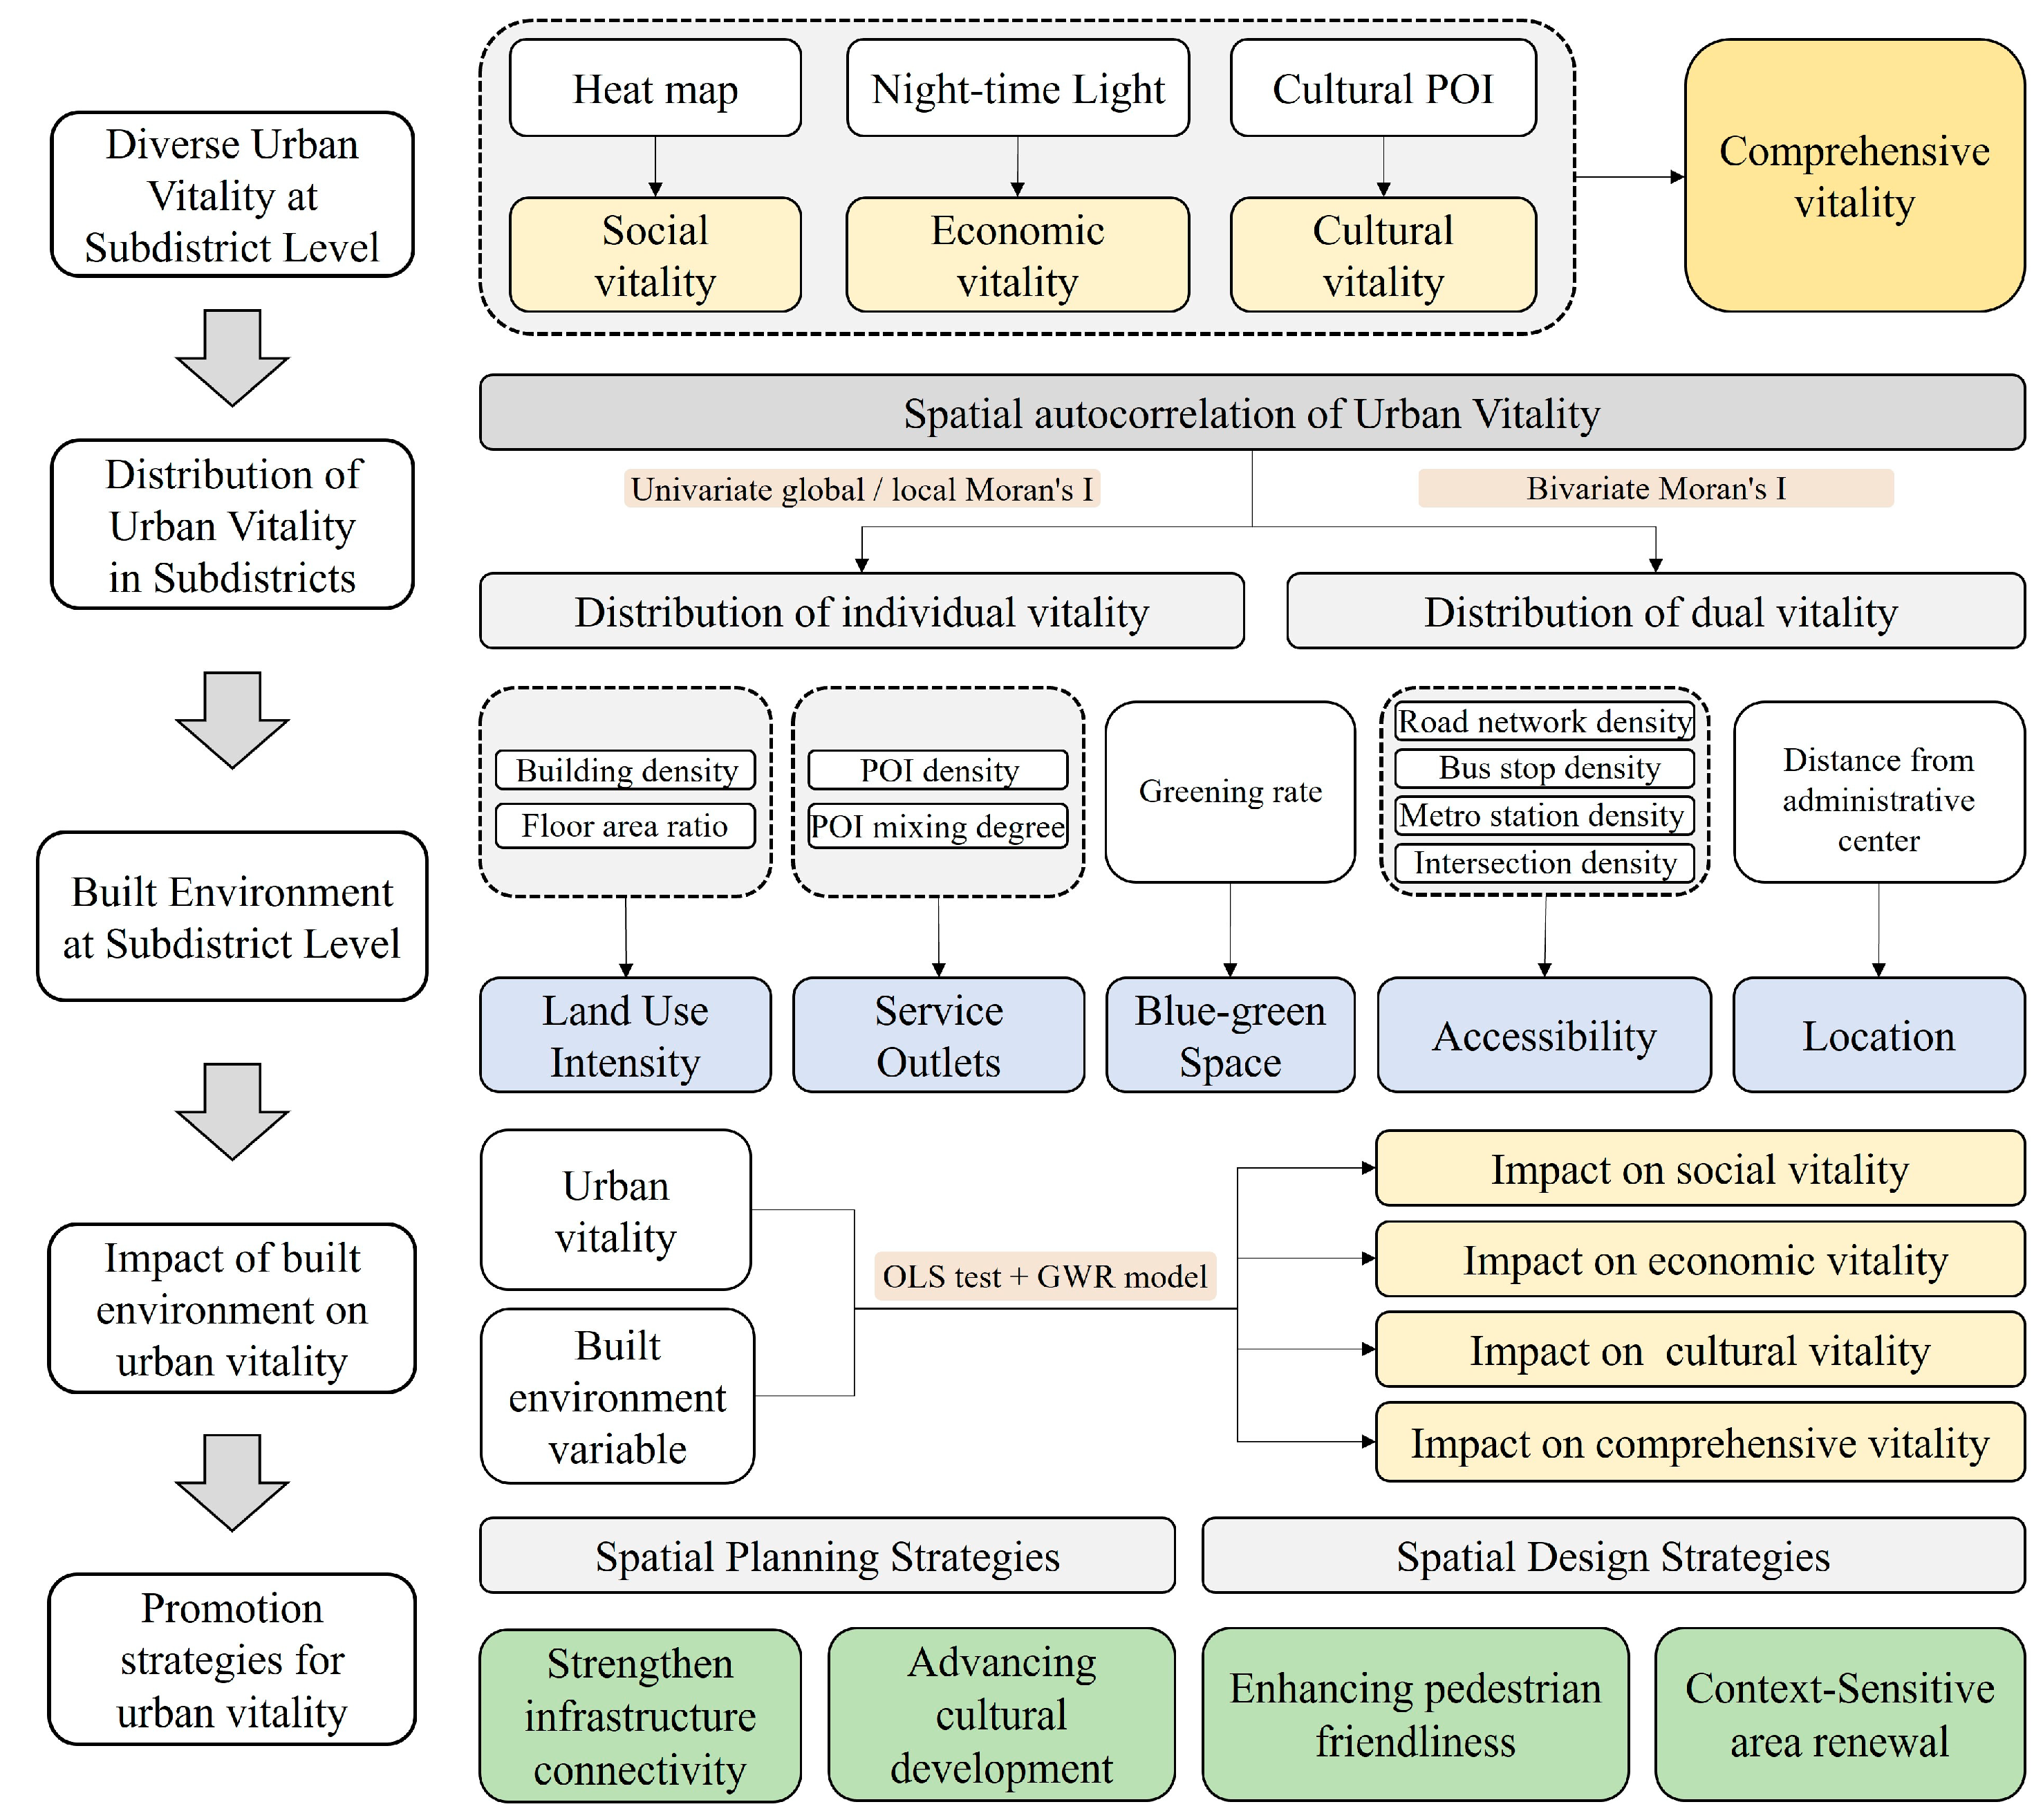
By exploring the spatial distribution of different types of urban vitality and their correlation with the built environment, a technical roadmap encompassing data representation, indicator construction, and quantitative evaluation was constructed (Figure 3). Firstly, the SV, EV, and CV of Beijing’s central area were characterized separately and, after normalizing the three types of vitality, their average represented comprehensive vitality (COV). Secondly, the spatial distribution characteristics of individual vitality and their spatial correlations with COV were examined. Thirdly, a built environment indicator system was constructed, comprising ten indicators across five dimensions, including land use intensity, service outlets, blue–green spaces, accessibility, and location. Subsequently, the relationship between different urban area vitality and various factors of the built environment were analyzed. Finally, promotion strategies at the urban spatial pattern level were proposed through comparison with existing studies.
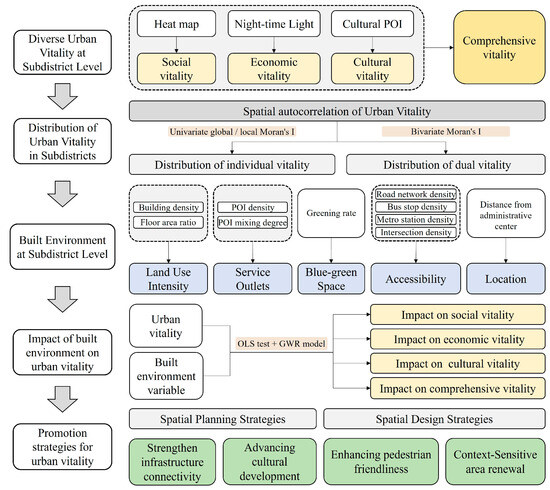
Figure 3.
Conceptual framework of the study.
3.1. Spatial Autocorrelation
Spatial autocorrelation was employed to uncover whether a notable interdependence existed between a geospatial unit and an attribute of its neighboring spatial units [54]. The study utilized Moran’s I to gauge its spatial autocorrelation.
(1) Univariate global autocorrelation. To ascertain the presence of spatial global dependence among different vitality types within the study area, the global Moran index test was conducted, with the calculation formula as follows:
where: n is the number of spatial units in the study area; and are the observed values of an attribute of spatial units i and j; is the spatial weight matrix established on the basis of the adjacent relationship of spatial units i and j; is the variance of; Z is the normal standardized statistic of Moran’s I; E(I) is the expectation of Moran’s I; Var(I) is the variance of Moran’s I.
(2) Univariate local autocorrelation was conducted to determine the presence of local spatial agglomeration or differentiation of different vitality types within the study area. The calculation formula is as follows:
(3) Bivariate spatial autocorrelation assesses the degree of correlation between the value of a positional variable and other variables by utilizing the weighted average of all adjacent positions. This method enables the exploration of spatial correlation between different vitality types [54]. The calculation formula is as follows:
where: is the observed value of attribute l of space unit i; is the observed value of attribute m of spatial unit j; and are the variance of the observed value of attribute l and m, respectively.
Furthermore, to emphasize the spatial characteristics of individual vitality and composite vitality at the urban street scale, as well as the spatial correlation between individual vitality measures, we utilized LISA (Local Indicators of Spatial Association) cluster maps for visualization. LISA cluster maps are particularly useful for identifying clusters of high or low values, revealing patterns of spatial association or disassociation. By employing LISA cluster maps, we could visually dissect the intricate spatial dynamics of urban vitality. These maps allowed us to pinpoint specific areas within the urban fabric where vitality metrics were exceptionally high or low, thus highlighting zones of potential intervention or further study.
3.2. Geographically Weighted Regression
Due to sample size limitations and the presence of multicollinearity among variables, the OLS model may compromise the accuracy of regression results. Additionally, it fails to detect spatial heterogeneity issues at the local level. Therefore, by screening the respective variable factors and selecting those with probabilities < 0.05 or robust probabilities < 0.05 in the OLS model analysis, and with variance inflation factors (VIF) < 10, variables were chosen to construct the GWR model. This model was utilized to analyze the strength of associations between different urban regions and vitality with their respective variable factors. Extending upon the linear regression model, the GWR model adapts the regression equation to local spatial elements, providing a better reflection of how independent variables influence dependent variables as spatial locations vary [55]. Its calculation formula is as follows:
where: is the value of the k-th independent variable at the i-th point; is the residual; is the spatial coordinate of the i-th sample point; is the continuous function the value at point i. This study employed the Akaike Information Criterion (AIC), a widely recognized statistical tool known for its high degree of fit, to select the optimal bandwidth parameter. The AIC is particularly valued for its ability to balance model complexity and goodness of fit, thus preventing overfitting. By using AIC, the study aimed to achieve a balance between model variance and bias. This method ensures that the chosen bandwidth parameter is neither too large, which could lead to an overly simplistic model that misses important patterns in the data, nor too small, which could result in an overly complex model that captures noise rather than the underlying trend. The application of AIC in this context helps to identify the most appropriate model that generalizes well to new data, ensuring both robustness and reliability in the study’s findings.
4. Results
4.1. Spatial Characteristics of Vitality in Beijing’s Central Area
4.1.1. Single versus Integrated Vitality Spatial Characteristics
Figure 4 illustrates the spatial distribution of SV, EV, CV, and COV at the subdistrict scale in Beijing’s central area. Subdistricts with high SV exhibit an “n”-shaped distribution along the Second Ring Road. In contrast, those with high EVs are concentrated along Chang’an Avenue and various commercial centers in each district—subdistricts with high CV form a belt-like distribution from the northwest to the southeast. Specifically, Chongwenmen, Chaoyangmen, and Hujialou are the top three subdistricts with the highest SV in the core area, hosting significant urban nodes such as Beijing Railway Station, the Central Business District (CBD), and embassy areas. Jianwai and Jianguomen Subdistricts, located in the eastern part of Chang’an Avenue, have the highest EV. In contrast, Yayuncun and Jinrongjie Subdistricts are the high EV centers in the northern and western parts of the city, respectively. Unlike SV, EV does not uniformly decrease from the center outward but instead exhibits five areas of high EV aggregation between the Second Ring Road and the Fourth Ring Road. The region with the highest CV forms a strip along the eastern side of the central axis, from the Jianguomen Subdistrict in the north to the Dashilar and Qianmen Subdistricts in the south. This area encompasses 17 historical and cultural blocks designated in the regulatory plan of the core area of the capital, reflecting a relatively high coverage of cultural facilities. The western region of the city, with a relatively high CV, connects the “Three Mountains and Five Gardens” area and two cultural cores. Jiuxianqiao Subdistrict in the northeast and Yongdinglu Subdistrict in the west are isolated areas with high CV, with the former being the location of the famous 798 Art Zone.
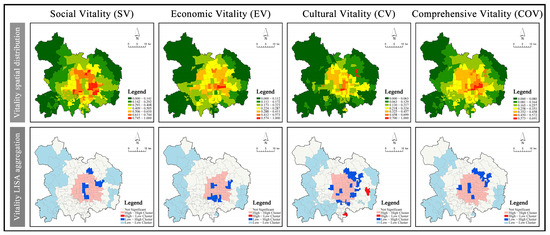
Figure 4.
Vitality spatial distribution and LISA aggregation.
The overall distribution of COV in the subdistricts is similar to that of SV. Apart from the subdistricts in the city center, such as Xichanganjie, Shichahai, and Tiantan Subdistricts, which exhibit low vitality due to political and historical remnants, extensive green spaces, and water bodies, the distribution of COV also shows a concentric layout decreasing from the center outward. The areas with the highest COV in the city are located from the central axis to the east along the “East Chang’an Avenue—Tonghui River” corridor, with Jianwai Subdistrict having the highest COV. The higher vitality concentric zones are generally delineated by the Third Ring Road to the west, the Fourth Ring Road to the north and east, and the Second Ring Road to the south, roughly corresponding to the boundaries of the core area of the capital designated in the “Master Plan”. The mid-range COV areas exhibit multiple finger-like extensions outward, mainly along the extensions of East and West Chang’an Avenue, the southern extension of the central axis, and the northwest extension along the Airport Expressway. The areas with lower COV are primarily located in the green isolation zones where the suburban park belt is situated according to the “Master Plan”.
Using Local Indicators of Spatial Association (LISA) cluster maps, we can discern the clustering patterns of various types of vitality in Beijing’s central area. These maps specifically highlight the distribution of Low–High (LH) and High–Low (HL) clusters, which visually represent the heterogeneous distribution of subdistrict vitality.
For SV, an LH cluster formed along the central axis within the Second Ring Road. This area includes the highest national administrative organs and significant historical and cultural landmarks, such as Shichahai, Beihai, Zhongnanhai, and Tiantan. Additionally, historical cultural districts like Nanluoguxiang and Dashilar are situated here. Two other LH clusters are located near the northeast Fourth Ring Road, encompassing large green spaces within the subdistricts, known as the “green isolated area”. In terms of EV, the absence of a well-developed economic radiation relationship in the eastern and southern directions has resulted in the formation of LH clusters in these areas. The LH clusters near the BOT are primarily due to the lower nighttime lighting data from traditional residential areas. Regarding CV, LH clusters are more dispersed. Within the Third Ring Road and its interior, there are several LH clusters of CV. The largest of these is centered around the “Datun–Wangjing” Subdistrict in the northwest.
Notably, there are two HL clusters in the CV: the Sanjianfang Regional Office in the east, which hosts the Communication University of China, an essential cultural industry area in Chaoyang District, and the Donggaodi Subdistrict in the south, marking the southern endpoint of the central axis. The Donggaodi Subdistrict also has the highest building density in Fengtai District, featuring relatively complete cultural facilities. Combining SV, EV, and CV data, a large-scale LH cluster emerged in the northeastern part of the mid-range COV area. This indicates significant differences in COV within and outside the northeastern Fourth Ring Road, suggesting a key area for future vitality enhancement efforts. A comprehensive global spatial autocorrelation analysis of urban vitality in Beijing’s central area reveals significant spatial dependency across all forms of vitality, as evidenced by the Z score (Table 2). Notably, the spatial clustering of COV surpasses that of the three individual types of vitality, while SC demonstrates slightly higher spatial clustering than both CV and EV.
Table 2.
Global spatial autocorrelation results of urban vitality.
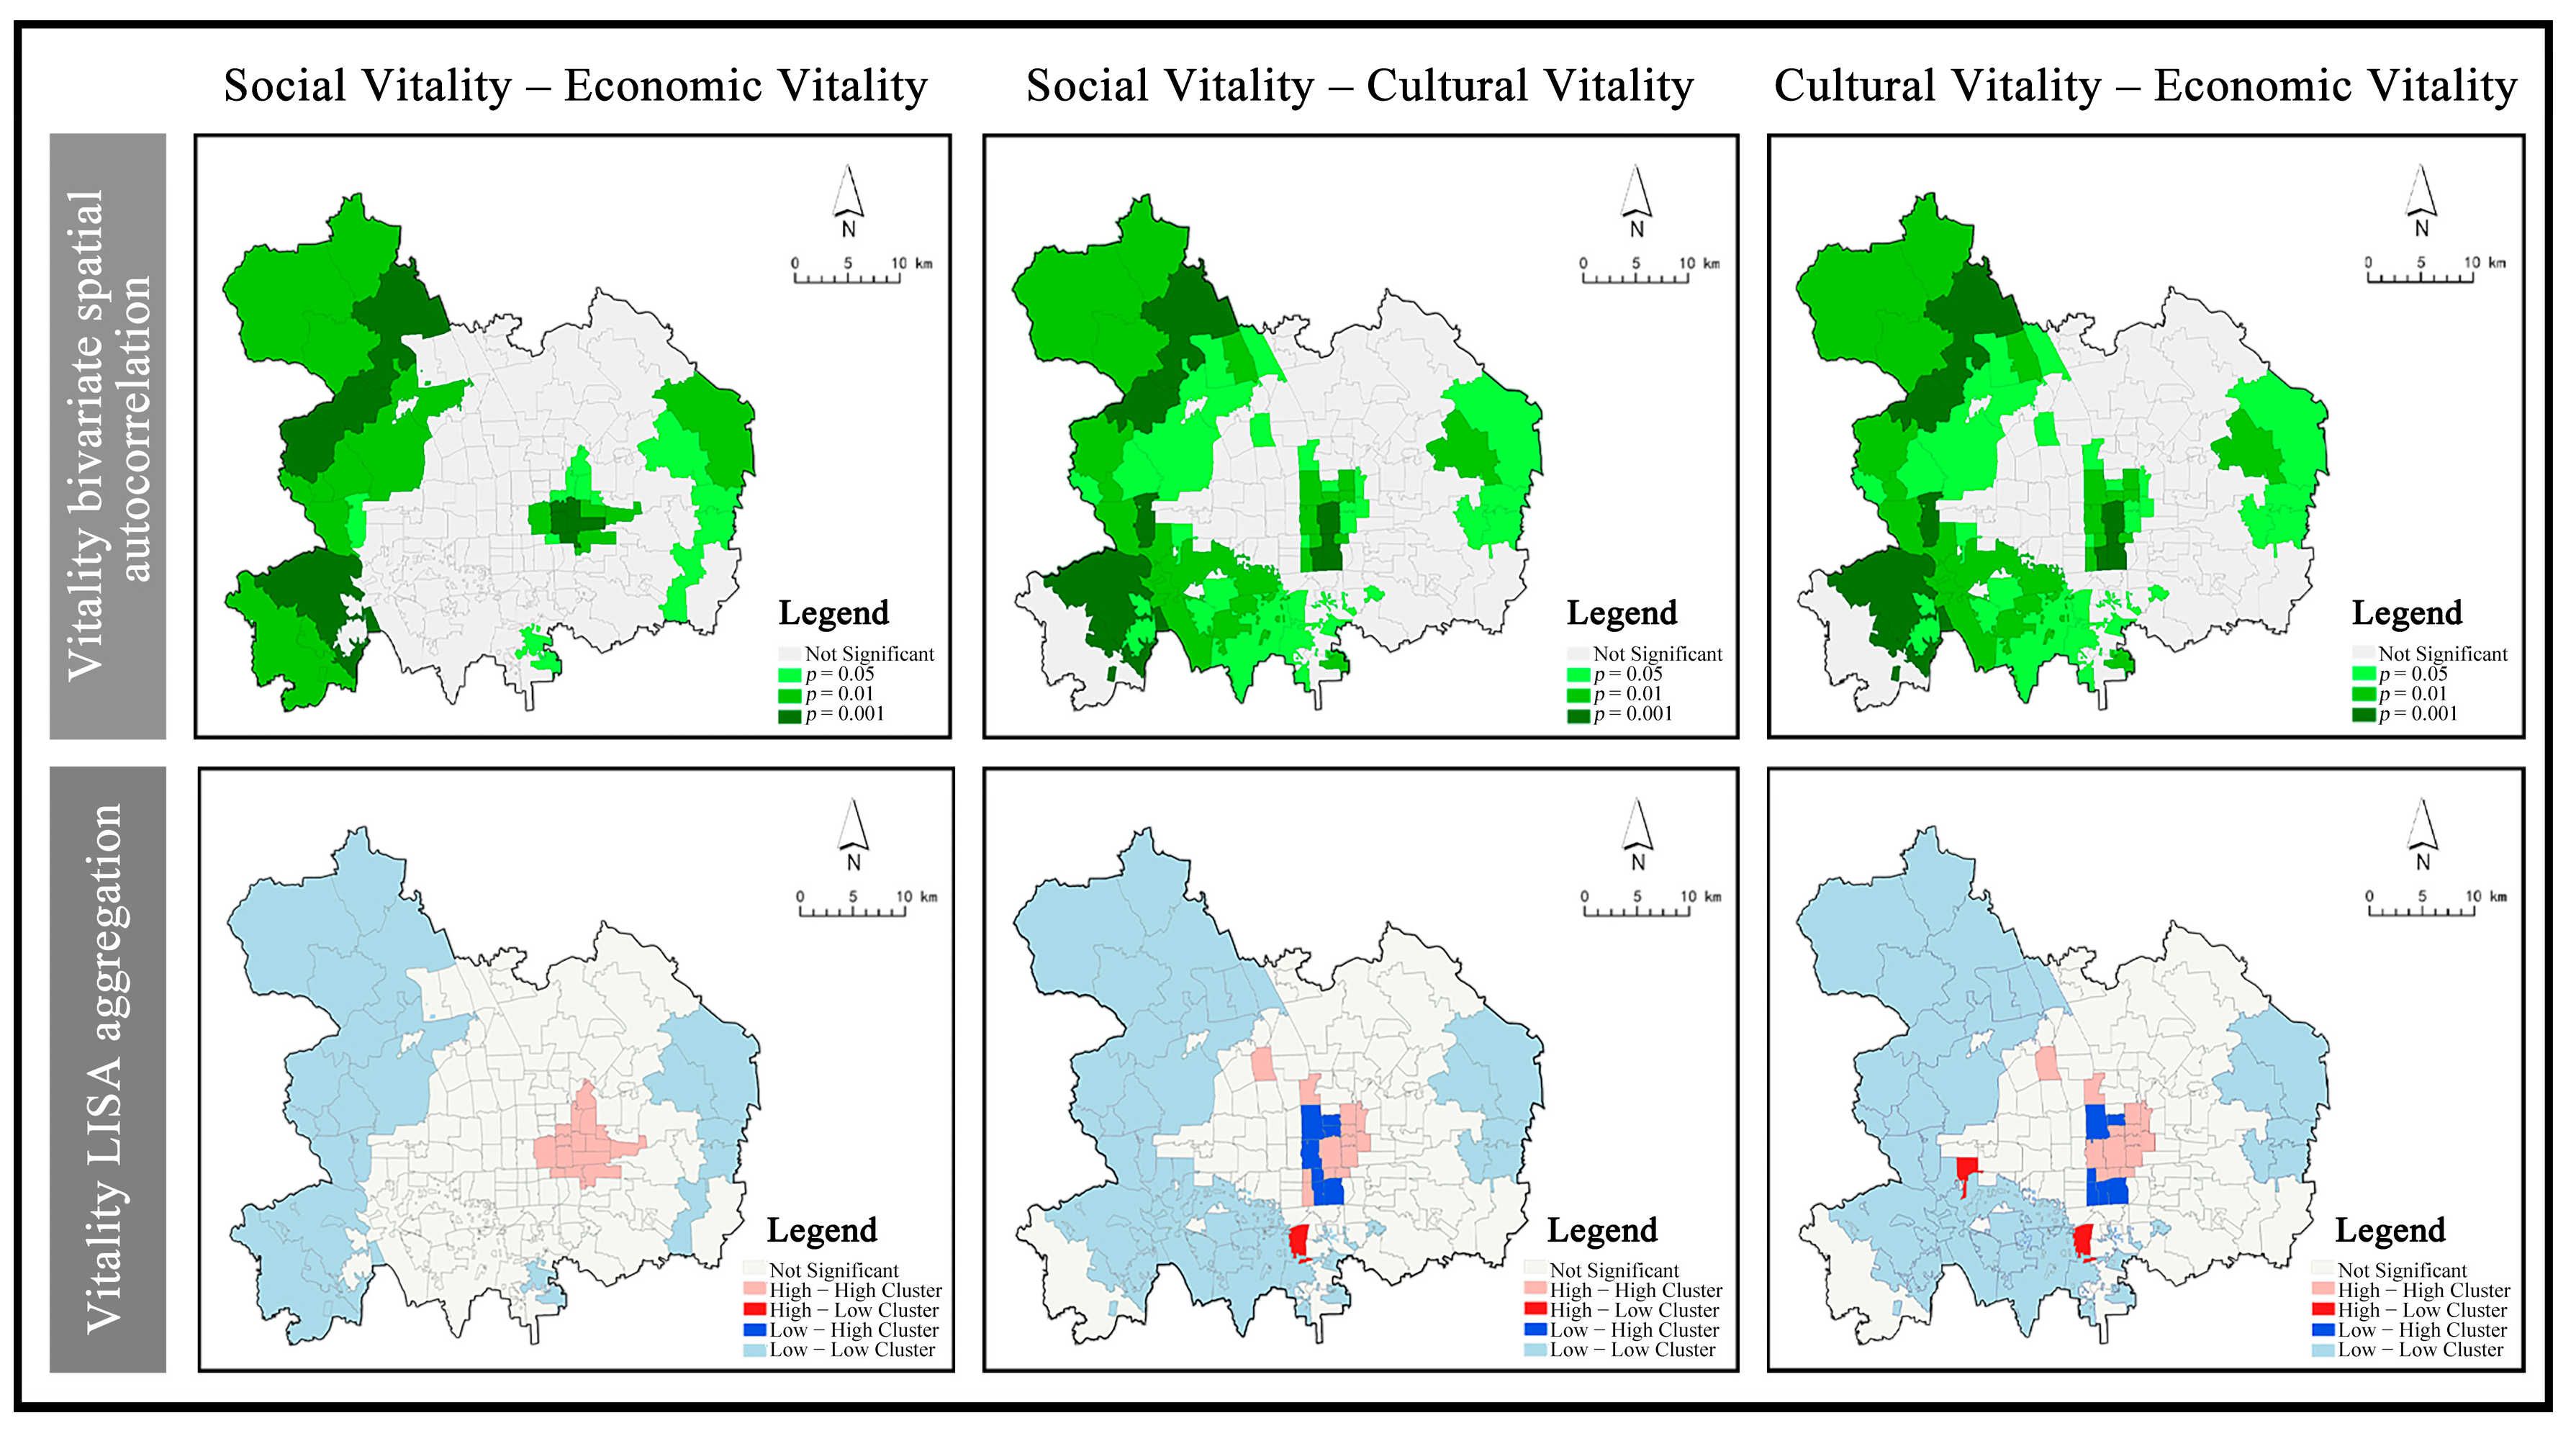
4.1.2. Spatial Correlation between Individual Types of Vitality
Table 3 details the interrelations among the individual forms of vitality. Notably, the spatial autocorrelation between SV and EV is the highest, indicating a robust spatial association between high-density population concentration and intense economic activities in the central urban area of Beijing. The correlation between SV and CV is slightly lower, suggesting that while cultural elements attract population concentrations, their pull is somewhat weaker compared to economic factors. The weakest correlation is observed between CV and EV, highlighting that cultural and economic activities are less spatially intertwined.
Table 3.
Spatial autocorrelation results of various activity bivariate variables.
This analysis underscores the pronounced spatial association between areas with high population density and intense economic activities in Beijing’s central urban area. While the spatial distribution of cultural elements may not draw population aggregation as strongly as economic factors, they still wield significant influence. Certain areas with a dense concentration of cultural facilities demonstrate a notable catalyzing effect on economic activities, indicating that cultural elements can enhance economic vibrancy in their vicinity.
Figure 5 illustrates the spatial distribution of the correlation between single vitality indices at the subdistrict scale in Beijing’s central area. The relationship between SV and EV is characterized by two main categories: HH and LL clusters. HH clusters are primarily concentrated at the intersection of Chang’an Street and the eastern Second Ring Road, indicating areas of both high population density and intense economic activity. In contrast, LL clusters are predominantly found along the eastern and western peripheries of the central urban area, where both population density and economic activity are lower.

Figure 5.
Vitality bivariate spatial autocorrelation and LISA aggregation.
The relationship between SV and CV is more complex than that between SV and EV. HH clusters are prevalent in several subdistricts south of Chang’an Street in Dongcheng District, as well as in Desheng Subdistrict, Chunshu Subdistrict, and Taoranting Subdistrict in Xicheng District, and Zhongguancun Subdistrict in Haidian District. These areas are characterized by high levels of both population density and cultural activity. LL clusters are situated outside the Fifth Ring Road in Haidian District and Shijingshan District, significant portions of Fengtai District, and subdistricts beyond the East Fifth Ring Road in Chaoyang District, where both cultural and population density are low. LH clusters representing areas with low population density but high CV exhibit a distribution pattern similar to SV within the Second Ring Road. Notably, the Majiabao Subdistrict in the south constitutes an HL cluster area, indicating high population density but lower CV.
The clustering patterns and significantly correlated regions between EV–CV and SV–CV show remarkable similarity. However, in comparison to EV–CV, SV–CV features LH clusters centered around Beihai Park and Temple of Heaven Park in the north and south, respectively, exhibiting distribution characteristics akin to EV. Additionally, there is one HL cluster area located in Babaoshan Subdistrict in Shijingshan District, highlighting an area of high CV but lower population density.
4.2. Impact of Built Environment on Multidimensional Urban Vitality
Filtering the built environment factors that significantly impact each vitality dimension, the analysis results are presented in Table 4, Table 5, Table 6 and Table 7. By comparing with the OLS model analysis results, it was found that the reduction in Akaike Information Criterion corrected (AICc) for each GWR model was >3, and the residuals of each GWR model exhibited a random spatial distribution, demonstrating the reliability of the GWR model analysis results. The spatial correlations between various types of vitality and their significantly associated built environment factors are illustrated in Figure 6, Figure 7, Figure 8 and Figure 9.
Table 4.
Descriptive statistics of GWR regression coefficients for social vitality.
Table 5.
Descriptive statistics of GWR regression coefficients for economic vitality.
Table 6.
Descriptive statistics of GWR regression coefficients for cultural vitality.
Table 7.
Descriptive statistics of GWR regression coefficients for comprehensive vitality.
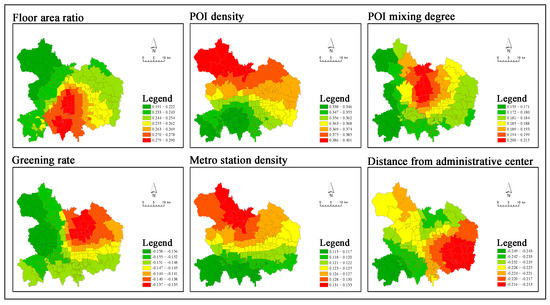
Figure 6.
Correlation between social vitality and the built environment.

Figure 7.
Correlation between economic vitality and built environment.

Figure 8.
Correlation between cultural vitality and built environment.
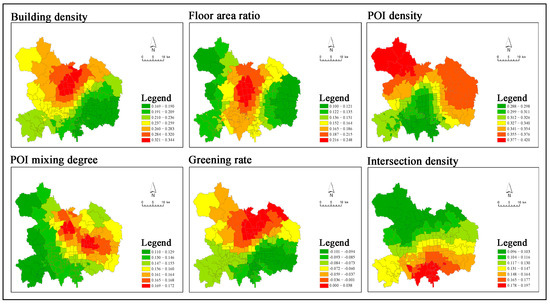
Figure 9.
Correlation between comprehensive vitality and built environment.
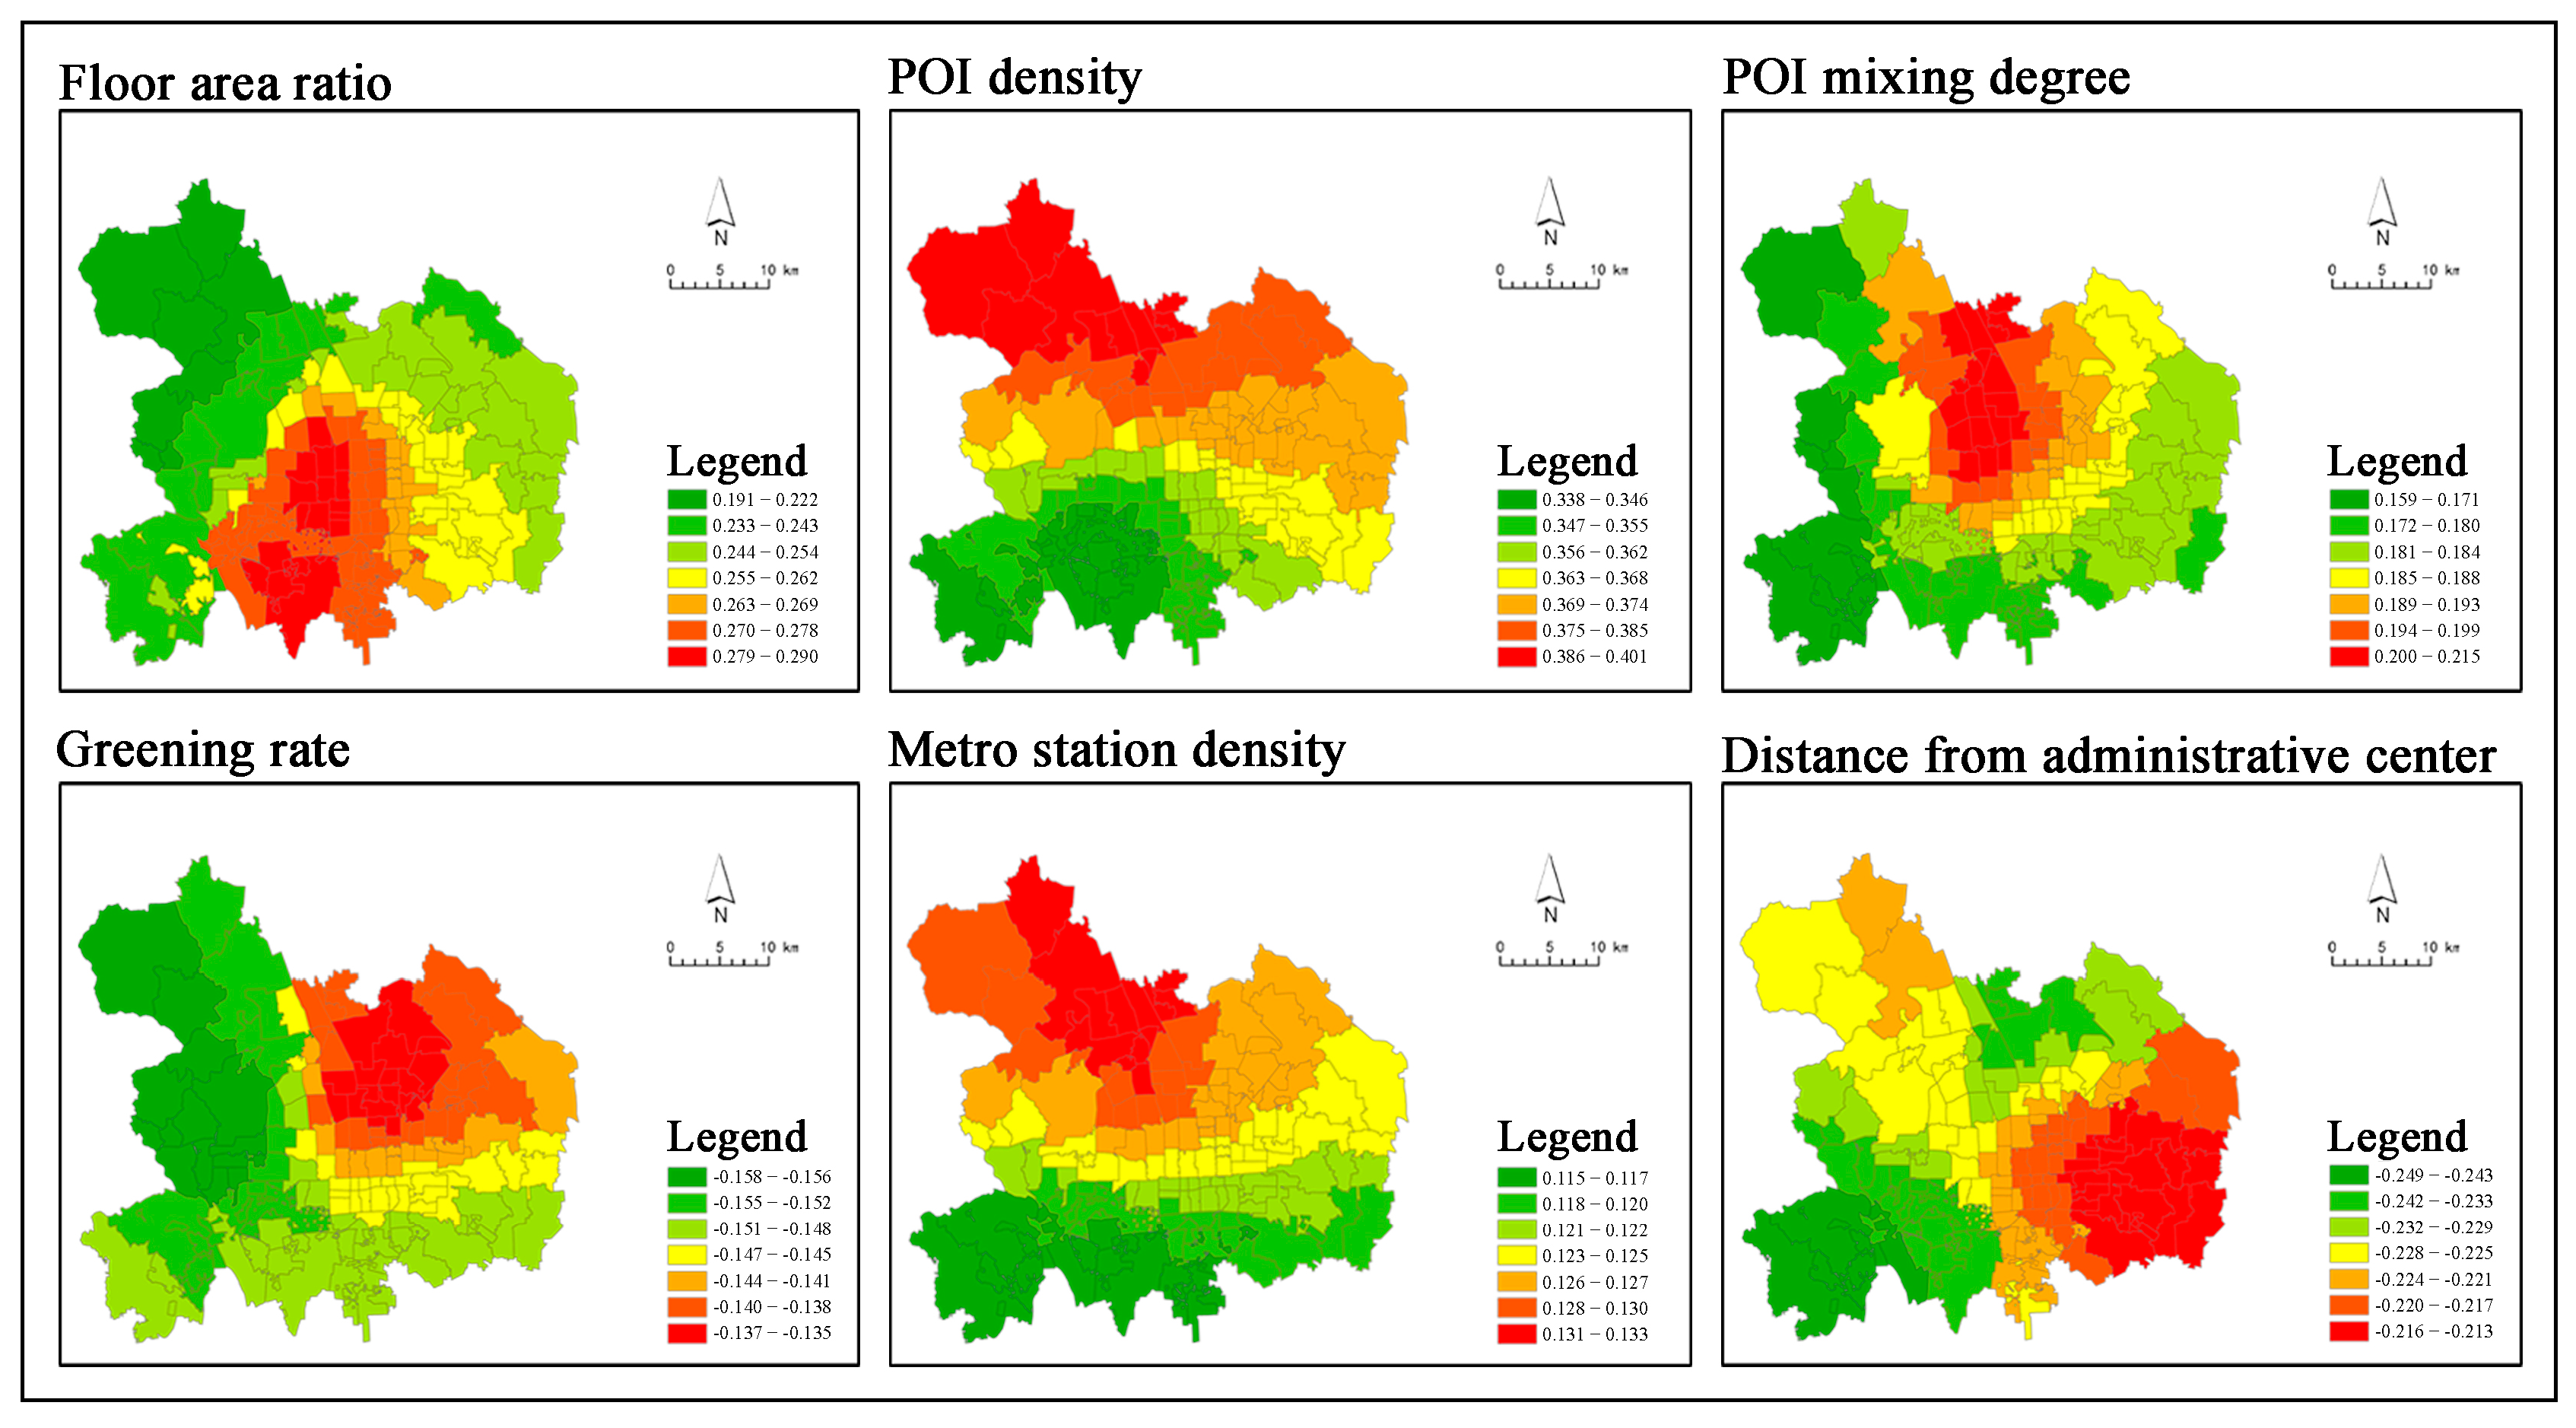
4.2.1. Correlation between Social Vitality and Built Environment
SV exhibited significant positive correlations with four categories of environmental factors: floor area ratio, POI density, POI mixing degree, and metro station density. Conversely, SV showed significant negative correlations with two categories of built environment factors: greening rate and distance from administrative center.
The strongest correlation was observed between SV and POI density, particularly pronounced in the northern part of the city, displaying a decreasing trend from north to south. The relationship between the floor area ratio and SV was consistently positive. However, it varied widely in standard deviation, with the highest correlations found in the western part of Xicheng District and the eastern part of Fengtai District, gradually diminishing outward from the BOT area. The correlation between POI mixing degree and SV, although weaker compared to POI density, was highest along the Qinghe Station–Beijing North Station corridor, decreasing gradually towards the surrounding areas. Negative correlations were observed between the greening rate and SV, with an increasing trend from the northeast region outward. The correlation between metro station density and SV was the weakest, declining from the northeast of Haidian District towards the south. The distance from the administrative center exhibited negative correlations with SV, with significantly lower associations in the eastern region compared to the western region. The highest correlation was observed in the southern part of Chaoyang District. In contrast, the lowest correlations were found in the western part of Fengtai District and the northern part of Chaoyang District.
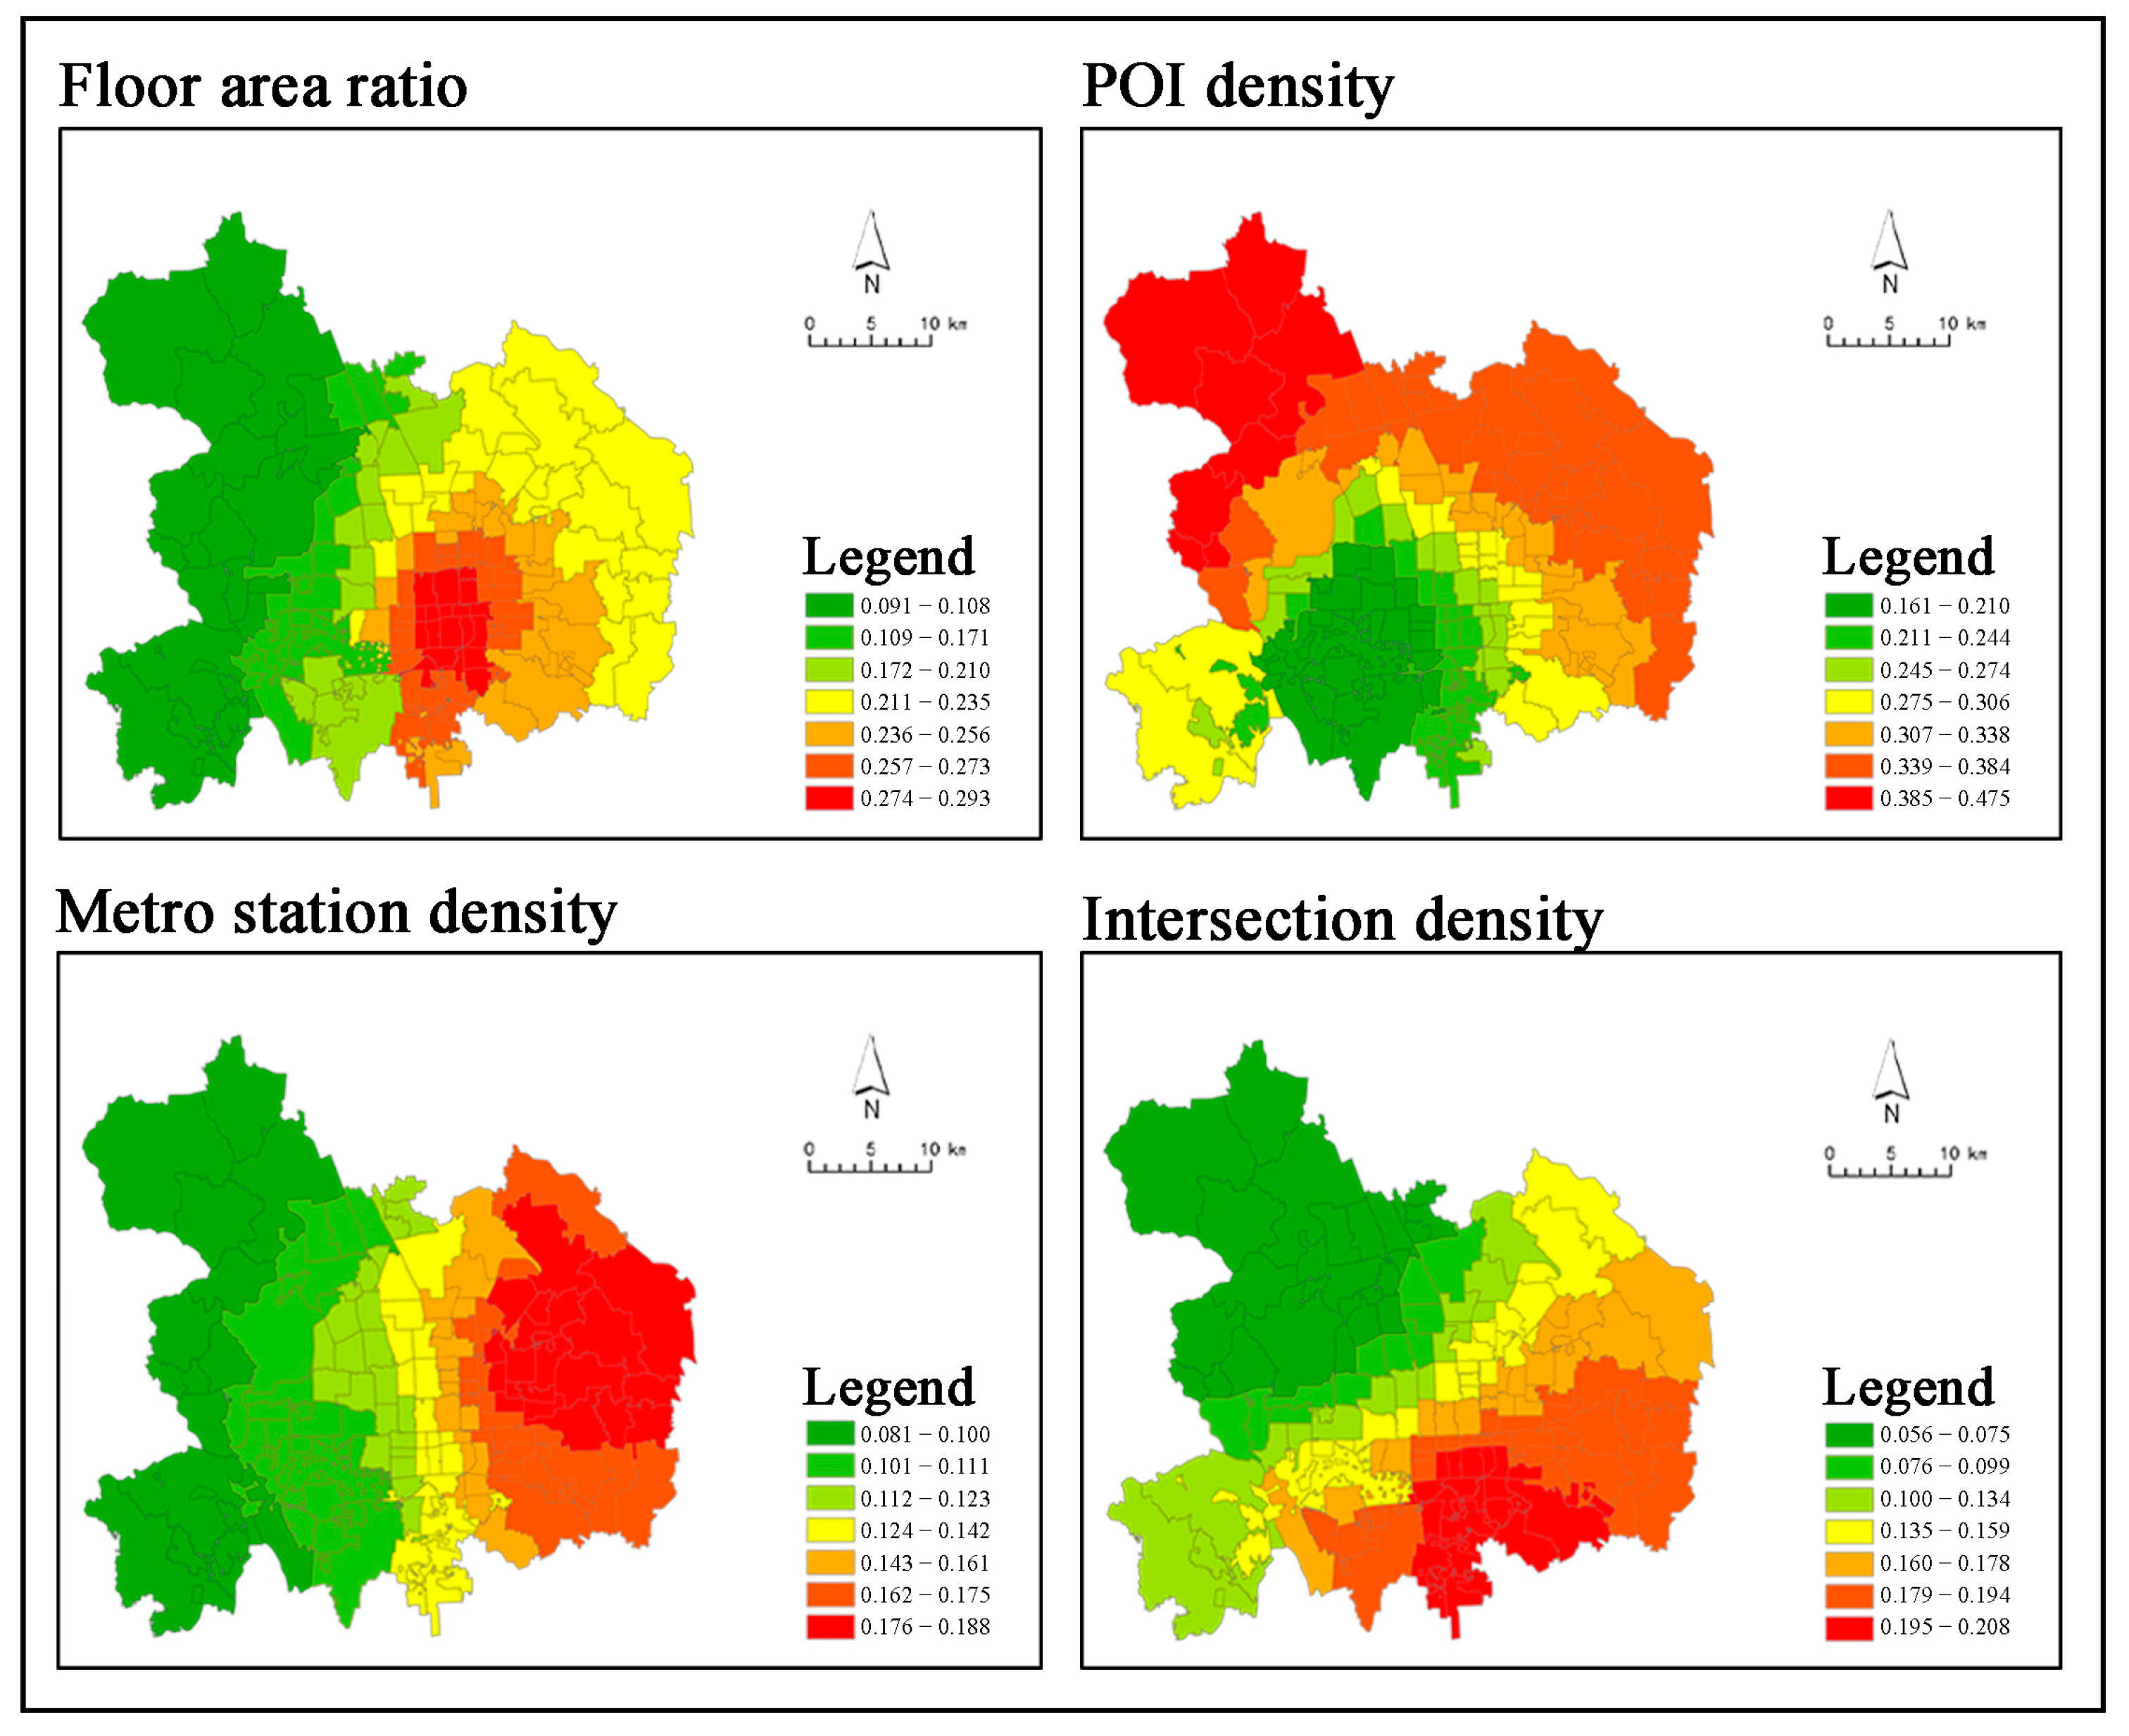
4.2.2. Correlation between Economic Vitality and Built Environment
For EV, four influencing factors—floor area ratio, POI density, metro station density, and intersection density—exerted significant effects. Floor area ratio consistently correlated positively with EV, with the highest correlation observed in the BOT area and its immediate southern vicinity. This correlation followed an east–high to west–low trend along the central axis. POI density demonstrated the strongest association with EV, with the lowest correlation observed in the western and southern parts of BOT, indicating a radial increase from this center to the outer layers. Metro station density exhibited the weakest correlation with EV, showing a decreasing trend from east to west. Intersection density also showed a decreasing trend from southeast to northwest in its relationship with EV, highlighting the spatial distribution patterns affecting EV in these regions.
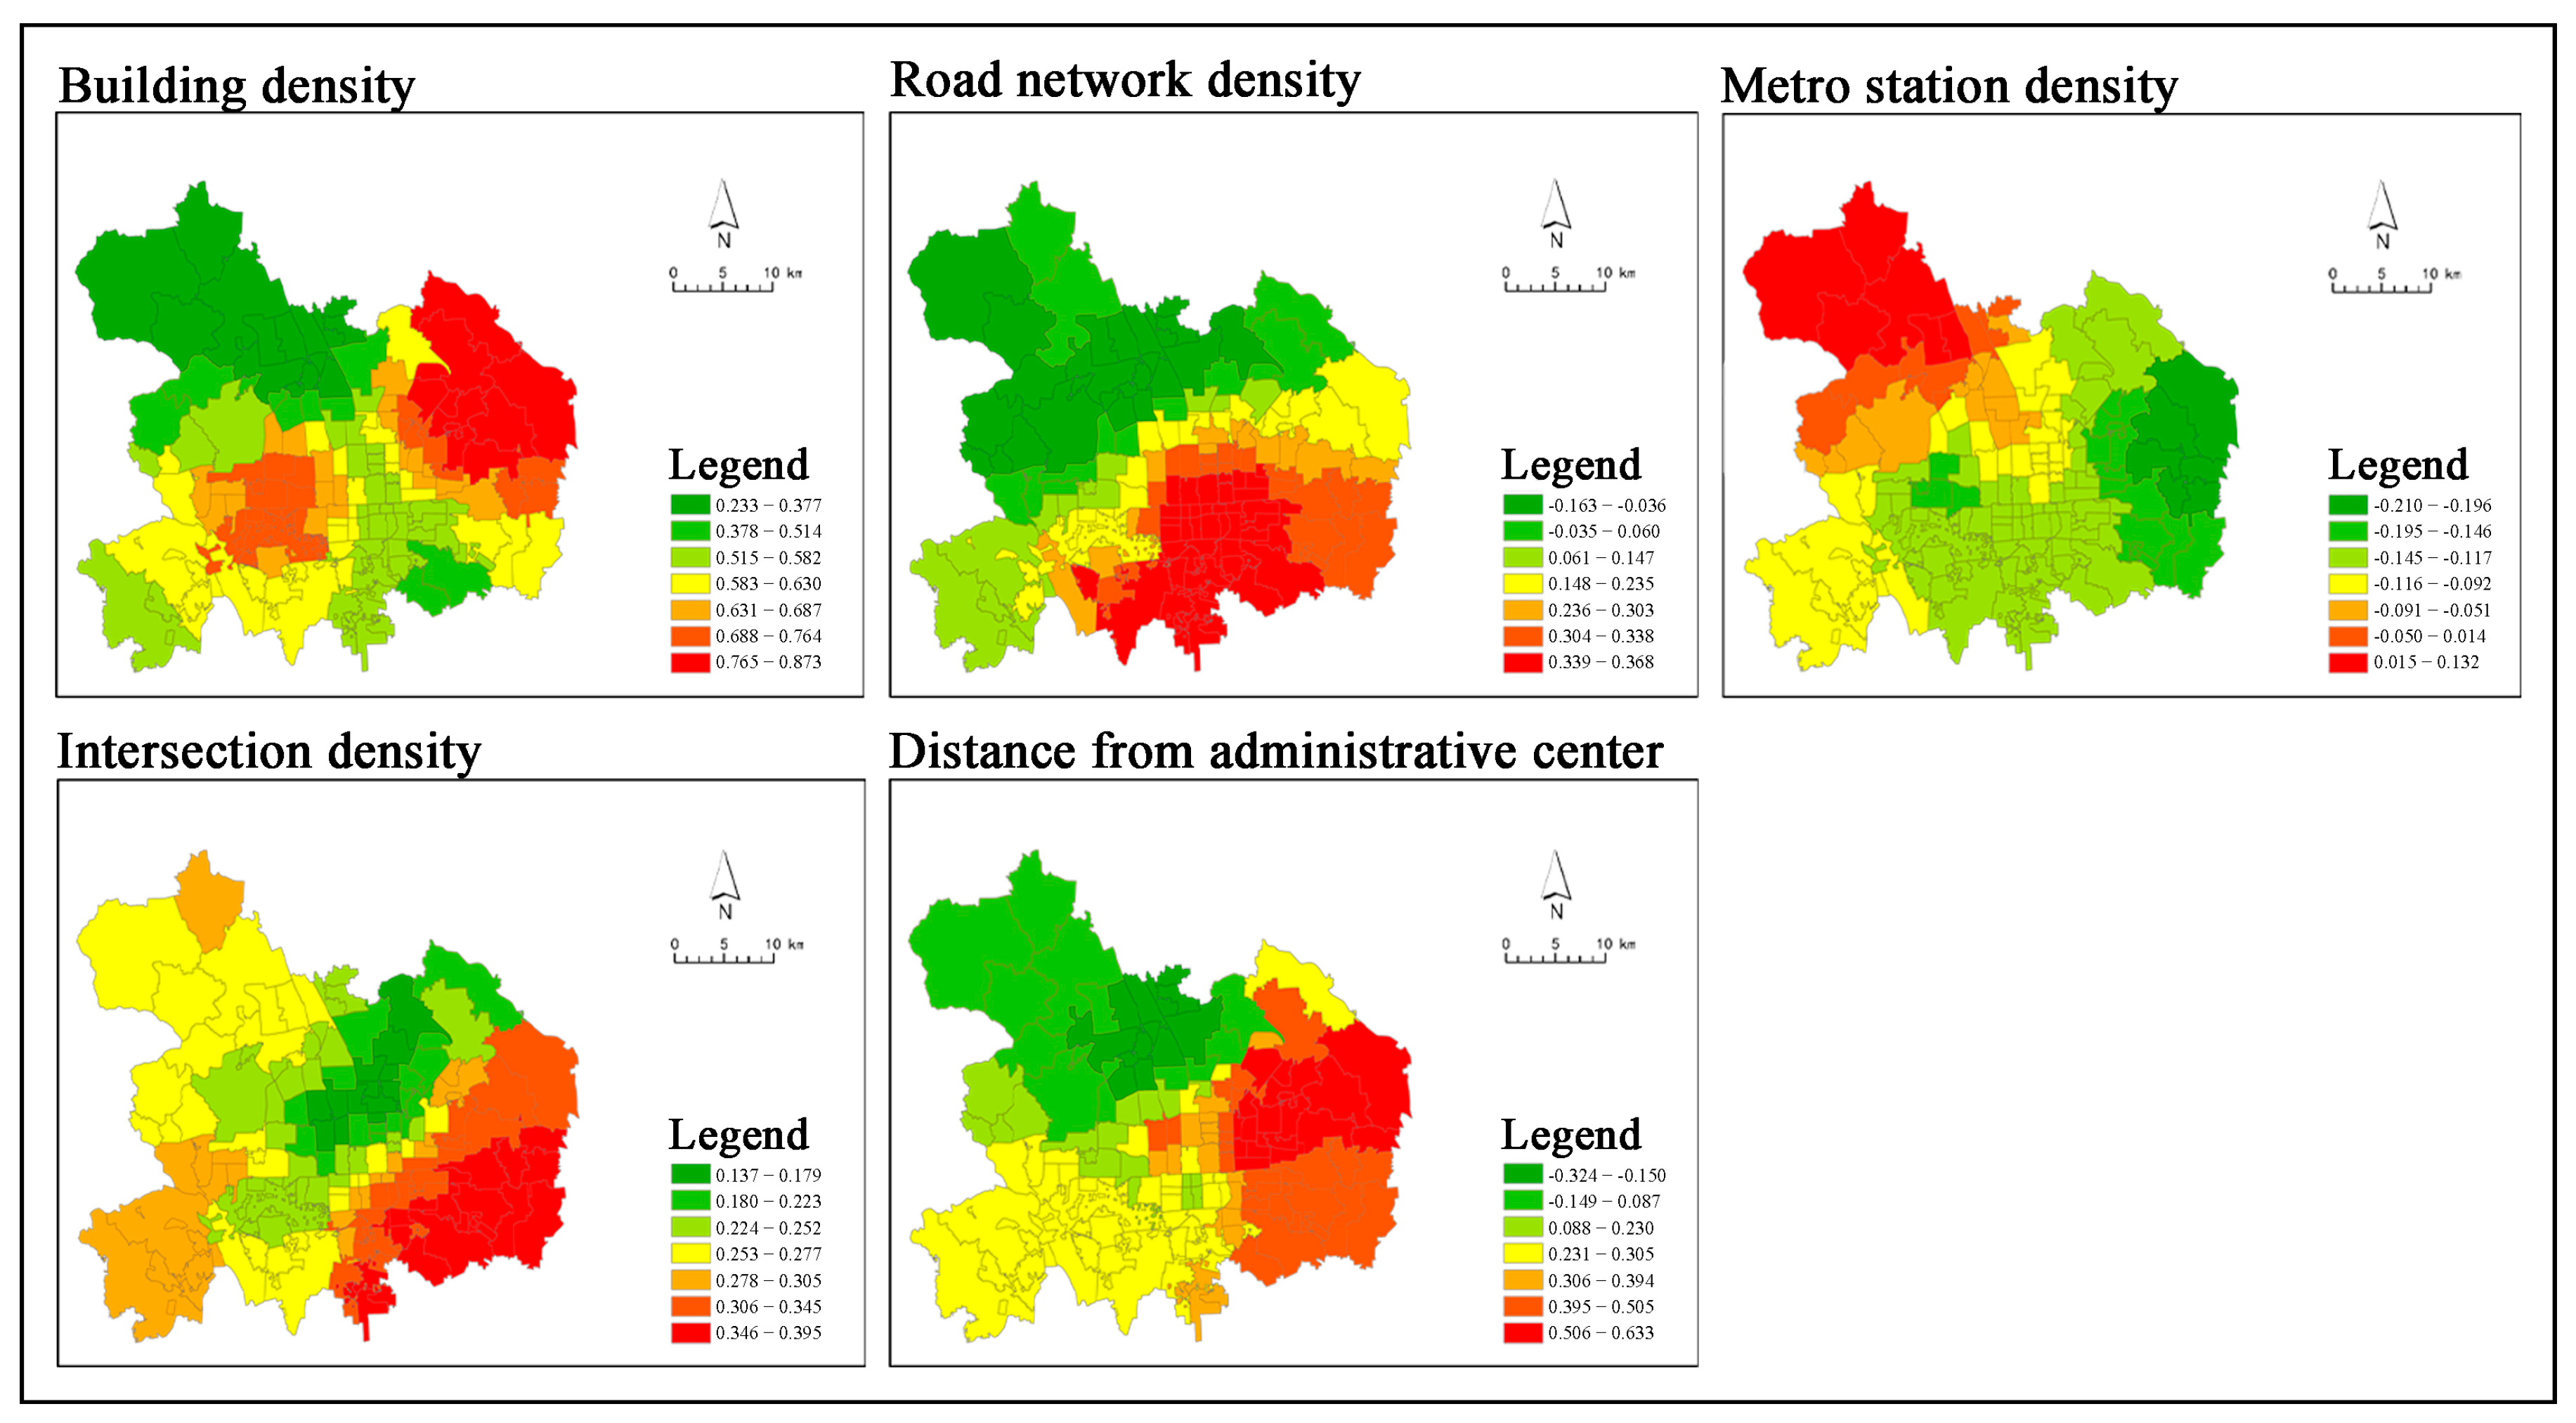
4.2.3. Correlation between Cultural Vitality and Built Environment
For CV, five influencing factors—building density, road network density, metro station density, intersection density, and distance from the administrative center—exerted significant effects. Building density exhibited the strongest association with CV, with the highest correlation observed in the northern part of Chaoyang District and the western part of the BOT area. This correlation gradually decreased from these two centers towards the periphery. Road network density showed a complex relationship with CV, displaying a negative association in the northwest region and a positive association in the southeast. This presented an increasing trend along the diagonal from northeast to southwest. Metro station density demonstrated the weakest correlation with CV, showing a positive association in the northwest region and negative associations in the east and south. There was a trend of increasing correlation along the diagonal from northeast to southwest. Intersection density correlated positively with CV, with the highest correlation observed in the southeastern part of the region adjacent to areas with the lowest correlation. Distance from the administrative center exhibited the highest correlation with CV in the northern part of Chaoyang District and a negative correlation in the northwest region, indicating a nuanced spatial relationship between CV and proximity to administrative center.
4.2.4. Correlation between Comprehensive Vitality and Built Environment
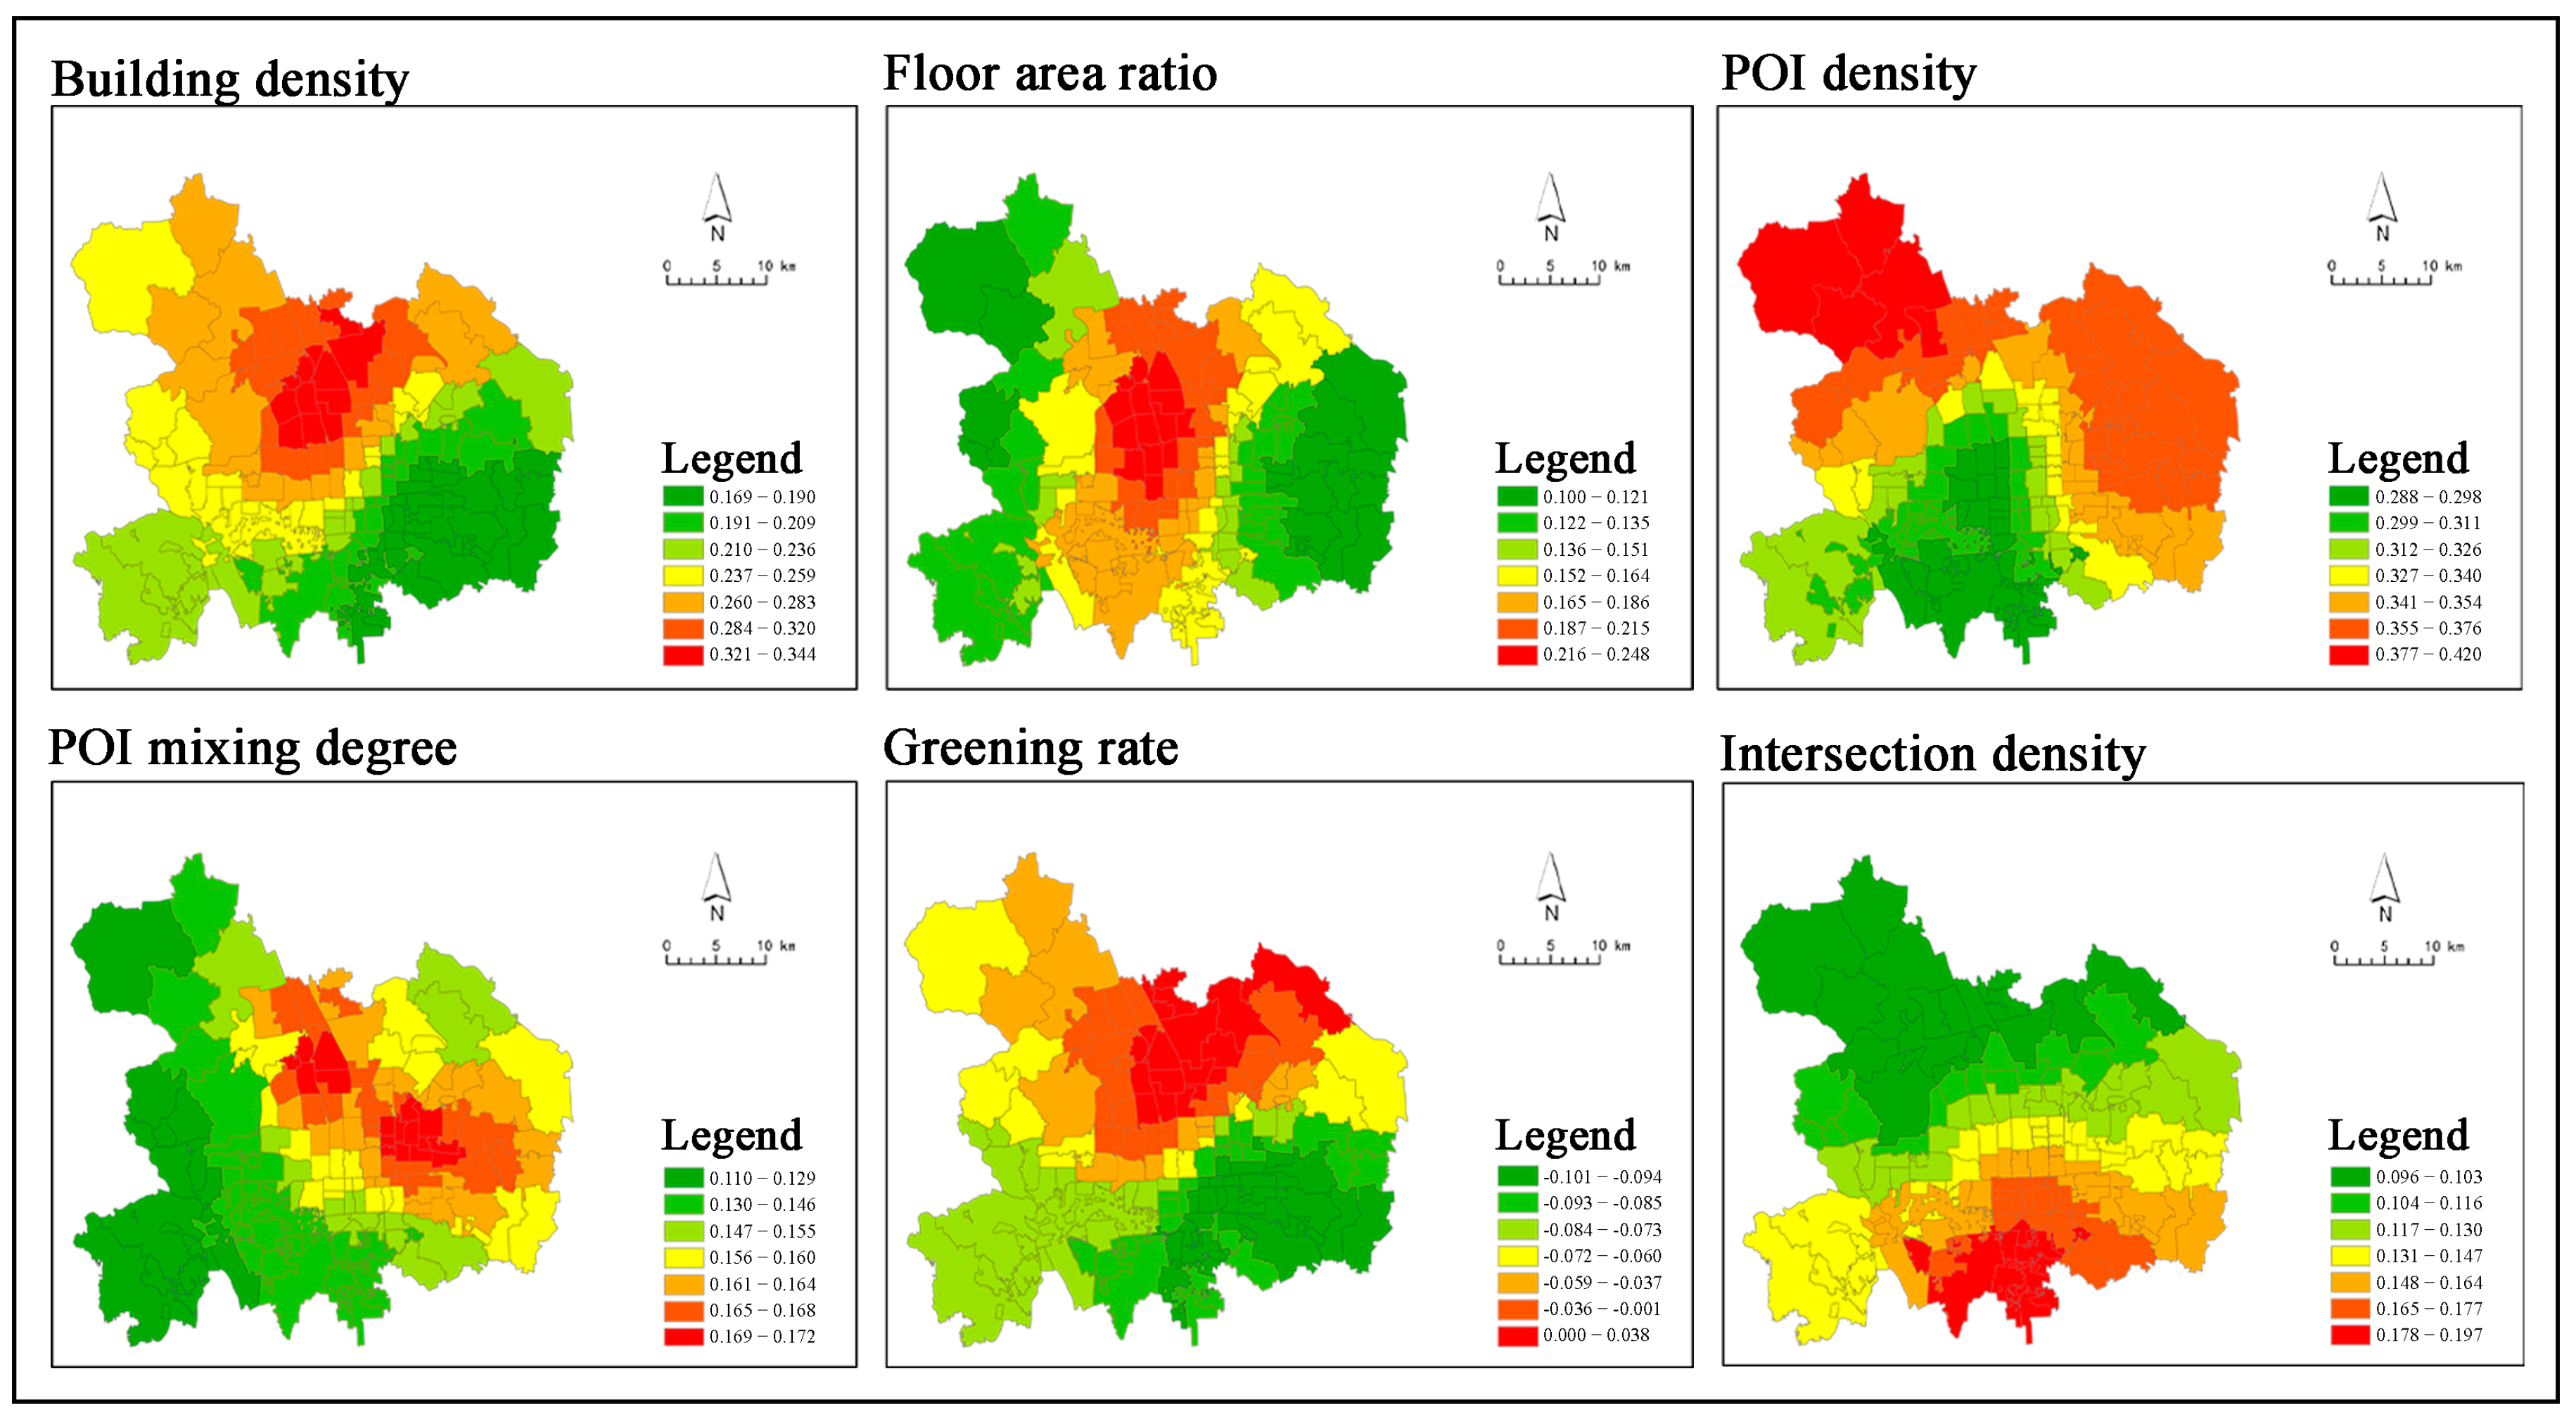
For COV, six influencing factors—building density, floor area ratio, POI density, POI mixing degree, greening rate, and intersection density—exerted significant effects. Except for the greening rate, all other factors exhibited positive associations with COV across all subdistricts. POI density emerged as the most closely associated factor with COV. The areas around Shangzhuang in the northernmost part of the Haidian District and the Zizhuyuan Subdistrict in the northwest of the Second Ring Road showed the strongest correlations. In contrast, subdistricts outside the Fifth Ring Road in the southern part of Fengtai District exhibited the weakest correlations, with a decreasing trend from the northwest to the south. Building density showed generally higher correlations with COV in the west and lower correlations in the east. A series of moderately vital subdistricts were distributed along the G5 expressway and the western Second Ring Road, with areas in Shijingshan District having the highest correlation and areas around BOT having the lowest.
Additionally, some subdistricts in the northeastern part of Chaoyang District also exhibited high correlations. The floor area ratio showed the closest correlation with COV along the subdistricts around the north–south central axis of the city, gradually decreasing from the center towards the periphery. POI mixing degree exhibited the closest correlation with COV along the subdistricts from the Xiaoyue River to the Tonghui River, gradually decreasing towards the sides. The positive association between POI mixing degree and COV was generally higher in the east and lower in the west, with the highest correlation observed around BOT. The greening rate showed a trend of higher correlation in the south and lower in the north. Intersection density exhibited the weakest correlation with COV, generally showing a trend of higher correlation in the south and lower in the north.
5. Discussion
5.1. Determinants of Urban Vitality Spatial Distribution
Multi-source data enable more efficient evaluation of urban vitality for urban planners and policymakers [56]. SV is influenced by the aggregation of populations at different times of the day [57], resulting in a characteristic circular distribution pattern with higher concentrations in the center and lower concentrations towards the periphery. This aggregation is diverse, closely reflecting human activity patterns and displaying the strongest spatial autocorrelation across various city zones. EV, determined by nighttime light brightness, is closely tied to regional planning and industrial layout [58]. However, varied commercial districts in different regions lead to generally higher spatial clustering of EV compared to CV. CV, influenced by the distribution of cultural POIs, closely aligns with historical and cultural heritage, and is often prioritized in urban cultural heritage preservation plans [59]. Consequently, high-CV areas are concentrated in historically significant subdistricts. However, the more balanced distribution of cultural heritage in the BOT area results in relatively lower CV clustering, despite a higher number of cultural POIs. COV, constrained by green isolation area, exhibits significant differences within and outside the northeast Fourth Ring Road. This area’s proximity to CV’s high clusters suggests that EV alone does not determine urban COV.
Comparing the spatial distribution of the two types of vitality, SV better reflects the underlying circular symmetry of Beijing’s central urban area, indicating that the traditional urban structure continues to influence contemporary human activity trends profoundly. Essential urban functions lay the foundation for SV, as Beijing’s central urban area hosts crucial national functions such as politics, culture, international exchanges, and technological innovation. This leads to a more concentrated clustering of urban functional groups and, hence, more pronounced spatial aggregation of SV [33]. EV still exhibits significant disparities from the current economic spatial structure outlined in urban planning. The ten major urban fringe clusters in the modern urban area, such as Dongba, Fudingzhuang, and Fatou, designated in the “Master Plan”, do not demonstrate prominent EVs in their vicinity. Instead, EVs remain reliant on early-developed commercial centers such as Chang’an Street and CBD. CV derives from three aspects of current urban planning: heritage preservation, industrial zone transformation, and infrastructure support. These aspects give rise to three constituent elements—historical and cultural heritage, modern cultural hubs, and cultural infrastructure—that collectively influence the layout of urban SV and EV. Consequently, CV’s spatial arrangement is closely intertwined with the urban axis and the blue–green foundation.
5.2. Impact Mechanism of Built Environment on Urban Multidimensional Vitality
The floor area ratio significantly influences both SV and EV, reflecting the overall building height and scale of subdistricts. This provides ample space for constructing concentrated offices and large commercial complexes [60]. In Beijing, due to factors like cultural heritage preservation, the floor area ratio within the Second Ring Road is relatively low. Consequently, the capacity to accommodate people and economic activities is much less compared to areas outside the Second Ring Road, such as the CBD and Financial Street. The relationship between floor area ratio and EV varies across urban spaces, indicating differences in human activities between day and night. This confirms previous research by Xia et al. on land use intensity and urban vitality in Beijing [43]. Furthermore, contrary to the findings of Lu et al. [31], the correlation between COV and building density in Beijing’s central urban area is positive. This discrepancy is related to the study’s definition of COV, which underscores the complementarity between COV, SV, and EV.
Service outlets, indicated by POI density, have a significant impact on Beijing’s EV. Higher POI density reflects the dense aggregation of commercial service outlets, whereas more extensive residential and public service facilities result in lower POI density [61]. A high POI mixing degree indicates greater functional diversity, which is essential for high vitality. However, excessive richness and randomness can hinder urban vitality, aligning with previous research findings [62,63]. Regarding blue–green spaces, the greening rate has a suppressive effect on both SV and EV, showing that these spaces accommodate fewer people compared to built environments. Larger green spaces typically represent lower land development intensity, which is not conducive to large-scale commercial activities within these areas. However, they can enhance the quality of the surrounding built environment [64]. The Olympic Forest Park, for instance, has positively impacted the overall vitality of surrounding subdistricts, highlighting the potential positive role of urban blue–green spaces in densely populated areas.
In terms of accessibility, high intersection density offers diverse walking options, promoting business emergence and efficient service provision for cultural facilities [65]. However, the relationship between COV and intersection density in Beijing’s central urban area does not match, suggesting that measuring COV at more minor street block scales is challenging, consistent with Liu et al.’s findings on Shanghai’s comprehensive vitality [40]. Metro station density indicates public transportation accessibility, facilitating population aggregation [66]. However, high land values near metro stations prioritize commercial development over small-to-medium-sized cultural facilities, negatively impacting CV.
Finally, the suppression of SV by the distance from the administrative center reflects a decreasing population aggregation pattern in Beijing. Despite a high density of cultural facilities in historical and cultural districts, the central urban area of Beijing needs to exhibit a comparative advantage in cultural facility density. Regions such as the area between the Second and Fourth Ring Roads in the northwest, and subdistricts like Yongdinglu and Jiuxianqiao outside the Fourth Ring Road, show higher CV despite their distance from Tiananmen Square. This results in a negative correlation between CV and the distance from the administrative center.
5.3. Promotion Strategy
In the future, spatial planning should continue to rely on the radiating effect of high-vitality subdistricts in the east and west to optimize the population distribution structure in Beijing’s central area. This can be achieved by upgrading the POI mixing degree and increasing metro station density in areas outside the Third Ring Road, such as the Western Third Ring Road, Western Fourth Ring Road, and areas beyond the Eastern Fourth Ring Road to enhance population aggregation. Additionally, EVs in commercial districts such as Zhongguancun and the “Sanyuanqiao–Wangjing” area can be enhanced through improvements in POI density, walkability, and environmental quality. Leveraging the economic influence of financial districts and CBD along Chang’an Street can help achieve balanced development of economic centers in different directions within Beijing’s central area. Furthermore, there should be a focus on enhancing cultural facilities in the southern area of ZhuShiKou, as well as the northern, eastern, and southwestern areas between the Second and Fourth Ring Roads to promote the synergistic development of economy and culture in the eastern CBD area. Based on the distribution characteristics of various types of vitality, the study also found that the north–south central axis, Chang’an Street, the Grand Canal (from Kunming Lake to Tonghui River), and the urban express ring road play important structural roles in facilitating different types of vitality. Therefore, it is recommended to strengthen the connection and radiating effect of these critical urban structures in urban planning and layout.
In terms of spatial design, to effectively promote urban vitality in Beijing’s central area, urban planners should prioritize pedestrian-friendly environments and mixed-use developments [67]. This includes designing well-connected street networks that enhance walkability and community interaction, and accommodating users of all ages and abilities through thoughtful sidewalk layouts and traffic-calming measures [68]. Enhancing neighborhood aesthetics with landscape design and lighting encourages nighttime walking, while integrating residential, commercial, and recreational activities reduces reliance on motorized transport [69]. Additionally, improving access to parks and recreational facilities fosters community vitality [70]. Tailoring specific measures to the unique urban fabric of each area is essential, from increasing service outlets in BOT areas to refining pedestrian environments in historic neighborhoods and micro-updating methods like clearing occupied roads, ensuring the smooth operation of national administrative departments, and protecting cultural heritage sites [71]. For other areas, full consideration should be given to public suggestions. Through collaborative development, redevelopment approaches, and targeted renewal measures, the efficiency of both above-ground and underground spaces should be improved. This can be achieved by maximizing the utilization of ground-floor spaces of buildings along streets to increase the number and diversity of commercial facilities, while also focusing on enhancing the pedestrian environment and connectivity of urban streets at all levels. Attention should be paid to the balance between green space and construction intensity. Efforts should be directed towards improving the ecological environment through vertical greening, three-dimensional greening, and green micro-updating methods, among others, to ensure a balanced development of the built environment.
5.4. Limitations
This study has several limitations that should be acknowledged. In terms of data acquisition, our study utilized heat maps from a regular weekday and a weekend day within a week to depict social vitality. In future research, it will be essential to collect data over more days and different seasons to avoid the limitations posed by seasonal differences and an insufficient number of days. Additionally, enriching the types of data used in the study is crucial. We will integrate survey and interview data, as well as mobile signaling data, to explore the comprehensive distribution of urban social vitality. Furthermore, our method of portraying economic vitality is constrained by the scale of our study units and the inherent inaccuracies of using nighttime light data as an economic proxy. Moving forward, research endeavors could enhance this method by amalgamating data on the density of operational restaurants, the count of commercial establishments, and other pertinent metrics to offer a more holistic depiction of regional economic vitality [72,73]. In terms of scale, although focusing on subdistricts facilitates direct alignment with grassroots administrative units, it may need to clearly identify localized high-vitality areas, especially for larger subdistricts. Subsequent research could benefit from juxtaposing subdistricts with smaller-scale grid data to address this issue. Regarding dimensionality, the study should have considered the issue of the mixture of old and new buildings mentioned by Jacobs, thus overlooking the impact of environmental history on vitality. Additionally, in terms of accuracy, Beijing’s rich urban history results in significant textural differences across different regions, suggesting the possibility of conducting classification discussions in future research.
6. Conclusions
This study offered urban planners and policymakers an efficient framework for evaluating urban vitality, particularly in the culturally rich central districts of Beijing, through its innovative use of multi-source data. By analyzing 133 subdistricts, the research integrated socioeconomic and cultural metrics, and employed bivariate spatial autocorrelation analysis to examine the distribution patterns of social, economic, and cultural vigor. The findings confirmed a previously hypothesized weak correlation between urban vitality and development intensity. Significant spatial clustering of various types of urban vitality was observed, with the most pronounced clustering found in overall vitality, followed by social, cultural, and economic vitality. This underscored the existence of distinct population, economic, and cultural centers within Beijing’s urban space. High social vitality was mainly correlated with the central city areas outlined in the master plan, forming a notable “n”-shaped distribution around the Second Ring Road. Economic vitality centered around the CBD and commercial hubs along Chang’an Avenue, while cultural vitality exhibited a northwest–southeast distribution. Interestingly, the overall vitality displayed a concentric distribution that decreased from the urban center to the peripheries, influenced by political, cultural, and historical elements in the center, and by urban greening efforts in the outer areas. Furthermore, the study highlighted the built environment’s substantial influence on urban vitality. Factors such as floor area ratio, POI density, diversity, and intersection density were crucial in fostering an environment conducive to urban vitality. Additional influences included population density, metro station proximity, and specific locational attributes, with green space ratios moderating high vitality zones. Overall, the study indicated a balanced spatial development of urban vitality across Beijing, providing valuable insights for future urban development initiatives.
Author Contributions
Conceptualization, S.Z., Y.G. and A.J.; methodology, S.Z.; software, A.J.; validation, A.J. and S.Z.; formal analysis, A.J.; investigation, A.J. and S.Z.; resources, A.J.; data curation, A.J.; writing—original draft preparation, A.J.; writing—review and editing, S.Z., Y.G. and A.J.; visualization, A.J.; supervision, S.Z.; project administration, S.Z. All authors have read and agreed to the published version of the manuscript.
Funding
This research was funded by the National Key R&D Program of China “Urban Ecological Space Control and Layout Optimization Technology” (2022YFC3800203).
Data Availability Statement
Data and materials are available from the authors upon request.
Acknowledgments
The authors thank the anonymous reviewers for their valuable comments and suggestions on this article.
Conflicts of Interest
The authors declare no conflicts of interest.
References
- Botta, F.; Gutiérrez-Roig, M. Modelling urban vibrancy with mobile phone and OpenStreetMap data. PLoS ONE 2021, 16, e0252015. [Google Scholar] [CrossRef] [PubMed]
- Montgomery, J. Making a city: Urbanity, vitality and urban design. J. Urban Des. 1998, 3, 93–116. [Google Scholar] [CrossRef]
- Xie, R.; Yao, S.; Han, F.; Zhang, Q. Does misallocation of land resources reduce urban green total factor productivity? An analysis of city-level panel data in China. Land Use Policy 2022, 122, 106353. [Google Scholar] [CrossRef]
- Batty, M. Empty buildings, shrinking cities and ghost towns. Environ. Plan. B Plan. Des. 2016, 43, 3–6. [Google Scholar] [CrossRef]
- Deng, C.; Ma, J. Viewing urban decay from the sky: A multi-scale analysis of residential vacancy in a shrinking US city. Scape Urban Plan. 2015, 141, 88–99. [Google Scholar] [CrossRef]
- Huang, Z.; He, C.; Zhu, S. Do China’s economic development zones improve land use efficiency? The effects of selection, factor accumulation and agglomeration. Landsc. Urban Plan. 2017, 162, 145–156. [Google Scholar] [CrossRef]
- Landry, C. Urban vitality: A new source of urban competitiveness. Archis 2000, 12, 8–13. [Google Scholar]
- Wu, J.; Ta, N.; Song, Y.; Lin, J.; Chai, Y. Urban form breeds neighborhood vibrancy: A case study using a GPS-based activity survey in suburban Beijing. Cities 2018, 74, 100–108. [Google Scholar] [CrossRef]
- Delclòs-Alió, X.; Gutiérrez, A.; Miralles-Guasch, C. The urban vitality conditions of Jane Jacobs in Barcelona: Residential and smartphone-based tracking measurements of the built environment in a Mediterranean metropolis. Cities 2019, 86, 220–228. [Google Scholar] [CrossRef]
- Marquet, O.; Miralles-Guasch, C. Neighbourhood vitality and physical activity among the elderly: The role of walkable environments on active ageing in Barcelona, Spain. Soc. Sci. Med. 2015, 135, 24–30. [Google Scholar] [CrossRef]
- Huang, X.; Jiang, P.; Li, M.; Zhao, X. Applicable Framework for Evaluating Urban Vitality with Multiple-Source Data: An Empirical Research of the Pearl River Delta Urban Agglomeration by Using Bpnn. Land 2022, 11, 1901. [Google Scholar] [CrossRef]
- Li, X.; Li, Y.; Jia, T.; Zhou, L.; Hijazi, I.H. The six dimensions of built environment on urban vitality: Fusion evidence from multi-source data. Cities 2022, 121, 103482. [Google Scholar] [CrossRef]
- Jacobs, J. The Death and Life of Great American Cities; Random House: New York, NY, USA, 1961. [Google Scholar]
- Lynch, K. Good City Form; The MIT Press: Cambridge, UK, 1984. [Google Scholar]
- Maas, P.R. Towards a Theory of Urban Vitality; University of British Columbia: Vancouver, BC, USA, 1984. [Google Scholar]
- Chen, Y.; Yu, B.; Shu, B.; Yang, L.; Wang, R. Exploring the spatiotemporal patterns and correlates of urban vitality: Temporal and spatial heterogeneity. Sustain. Cities Soc. 2023, 91, 104440. [Google Scholar] [CrossRef]
- Delclòs-Alió, X.; Miralles-Guasch, C. Looking at Barcelona through Jane Jacobs’s eyes: Mapping the basic conditions for urban vitality in a Mediterranean conurbation. Land Use Policy 2018, 75, 505–517. [Google Scholar] [CrossRef]
- Kim, Y.-L. Seoul’s Wi-Fi hotspots: Wi-Fi access points as an indicator of urban vitality. Comput. Environ. Urban Syst. 2018, 72, 13–24. [Google Scholar] [CrossRef]
- Jin, X.; Long, Y.; Sun, W.; Lu, Y.; Yang, X.; Tang, J. Evaluating cities’ vitality and identifying ghost cities in China with emerging geographical data. Cities 2017, 63, 98–109. [Google Scholar] [CrossRef]
- Gehl, J. Life between Buildings: Using Public Space; Island Press: Washington, DC, USA, 1971. [Google Scholar]
- Ye, Y.; Zeng, W.; Shen, Q.; Zhang, X.; Lu, Y. The visual quality of streets: A human-centred continuous measurement based on machine learning algorithms and street view images. Environ. Plan. B Urban Anal. City Sci. 2019, 46, 1439–1457. [Google Scholar] [CrossRef]
- Li, X.; Liu, H. The Influence of Subjective and Objective Characteristics of Urban Human Settlements on Residents’ Life Satisfaction in China. Land 2021, 10, 1400. [Google Scholar] [CrossRef]
- Zumelzu, A.; Barrientos-Trinanes, M. Analysis of the effects of urban form on neighborhood vitality: Five cases in Valdivia, Southern Chile. J. Hous. Built Environ. 2019, 34, 897–925. [Google Scholar] [CrossRef]
- Sallis, J.F.; Cerin, E.; Conway, T.L.; Adams, M.A.; Frank, L.D.; Pratt, M.; Salvo, D.; Schipperijn, J.; Smith, G.; Cain, K.L. Physical activity in relation to urban environments in 14 cities worldwide: A cross-sectional study. Lancet 2016, 387, 2207–2217. [Google Scholar] [CrossRef]
- Wu, C.; Ye, X.; Ren, F.; Du, Q. Check-in behaviour and spatio-temporal vibrancy: An exploratory analysis in Shenzhen, China. Cities 2018, 77, 104–116. [Google Scholar] [CrossRef]
- Chen, L.; Zhao, L.; Xiao, Y.; Lu, Y. Investigating the spatiotemporal pattern between the built environment and urban vibrancy using big data in Shenzhen, China. Comput. Environ. Urban Syst. 2022, 95, 101827. [Google Scholar] [CrossRef]
- Yang, J.; Cao, J.; Zhou, Y. Elaborating non-linear associations and synergies of metro access and land uses with urban vitality in Shenzhen. Transp. Res. Part A Policy Pract. 2021, 144, 74–88. [Google Scholar] [CrossRef]
- Fan, Z.; Duan, J.; Luo, M.; Zhan, H.; Liu, M.; Peng, W. How Did Built Environment Affect Urban Vitality in Urban Waterfronts? A Case Study in Nanjing Reach of Yangtze River. ISPRS Int. J. Geo-Inf. 2021, 10, 611. [Google Scholar] [CrossRef]
- Liu, S.; Lai, S.-Q.; Liu, C.; Jiang, L. What influenced the vitality of the waterfront open space? A case study of Huangpu River in Shanghai, China. Cities 2021, 114, 103197. [Google Scholar] [CrossRef]
- Huang, B.; Zhou, Y.; Li, Z.; Song, Y.; Cai, J.; Tu, W. Evaluating and characterizing urban vibrancy using spatial big data: Shanghai as a case study. Environ. Plan. B Urban Anal. City Sci. 2020, 47, 1543–1559. [Google Scholar] [CrossRef]
- Lu, S.; Shi, C.; Yang, X. Impacts of built environment on urban vitality: Regression analyses of Beijing and Chengdu, China. Int. J. Environ. Res. Public Health 2019, 16, 4592. [Google Scholar] [CrossRef] [PubMed]
- Tu, W.; Zhu, T.; Xia, J.; Zhou, Y.; Lai, Y.; Jiang, J.; Li, Q. Portraying the spatial dynamics of urban vibrancy using multisource urban big data. Comput. Environ. Urban Syst. 2020, 80, 101428. [Google Scholar] [CrossRef]
- Li, Q.; Cui, C.; Liu, F.; Wu, Q.; Run, Y.; Han, Z. Multidimensional urban vitality on streets: Spatial patterns and influence factor identification using multisource urban data. ISPRS Int. J. Geo-Inf. 2021, 11, 2. [Google Scholar] [CrossRef]
- Shi, J.; Miao, W.; Si, H.; Liu, T. Urban Vitality Evaluation and Spatial Correlation Research: A Case Study from Shanghai, China. Land 2021, 10, 1195. [Google Scholar] [CrossRef]
- He, Q.; He, W.; Song, Y.; Wu, J.; Yin, C.; Mou, Y. The impact of urban growth patterns on urban vitality in newly built-up areas based on an association rules analysis using geographical ‘big data’. Land Use Policy 2018, 78, 726–738. [Google Scholar] [CrossRef]
- Qin, L.; Zong, W.; Peng, K.; Zhang, R. Assessing Spatial Heterogeneity in Urban Park Vitality for a Sustainable Built Environment: A Case Study of Changsha. Land 2024, 13, 480. [Google Scholar] [CrossRef]
- Liu, L.; Dong, Y.; Lang, W.; Yang, H.; Wang, B. The Impact of Commercial-Industry Development of Urban Vitality: A Study on the Central Urban Area of Guangzhou Using Multisource Data. Land 2024, 13, 250. [Google Scholar] [CrossRef]
- Liu, H.; Li, X. Understanding the Driving Factors for Urban Human Settlement Vitality at Street Level: A Case Study of Dalian, China. Land 2022, 11, 646. [Google Scholar] [CrossRef]
- Zhe, C.; Ma, S. Research on the Vitality of Urban Streets. Archit. J. 2009, S2, 121–126. [Google Scholar]
- Liu, D.; Shi, Y. The Influence Mechanism of Urban Spatial Structure on Urban Vitality Based on Geographic Big Data: A Case Study in Downtown Shanghai. Buildings 2022, 12, 569. [Google Scholar] [CrossRef]
- Ye, Y.; Li, D.; Liu, X. How block density and typology affect urban vitality: An exploratory analysis in Shenzhen, China. Urban Geogr. 2018, 39, 631–652. [Google Scholar] [CrossRef]
- Wang, X.; Zhang, Y.; Yu, D.; Qi, J.; Li, S. Investigating the spatiotemporal pattern of urban vibrancy and its determinants: Spatial big data analyses in Beijing, China. Land Use Policy 2022, 119, 106162. [Google Scholar] [CrossRef]
- Xia, C.; Yeh, A.G.-O.; Zhang, A. Analyzing spatial relationships between urban land use intensity and urban vitality at street block level: A case study of five Chinese megacities. Landsc. Urban Plan. 2020, 193, 103669. [Google Scholar] [CrossRef]
- Gibson, J.; Olivia, S.; Boe-Gibson, G.; Li, C. Which night lights data should we use in economics, and where? J. Dev. Econ. 2021, 149, 102602. [Google Scholar] [CrossRef]
- Cervero, R.; Kockelman, K. Travel demand and the 3Ds: Density, diversity, and design. Transp. Res. Part D Transp. Environ. 1997, 2, 199–219. [Google Scholar] [CrossRef]
- Ewing, R.; Cervero, R. Travel and the built environment: A synthesis. Transp. Res. Rec. 2001, 1780, 87–114. [Google Scholar] [CrossRef]
- Gómez-Varo, I.; Delclòs-Alió, X.; Miralles-Guasch, C. Jane Jacobs reloaded: A contemporary operationalization of urban vitality in a district in Barcelona. Cities 2022, 123, 103565. [Google Scholar] [CrossRef]
- Zhang, A.; Li, W.; Wu, J.; Lin, J.; Chu, J.; Xia, C. How can the urban landscape affect urban vitality at the street block level? A case study of 15 metropolises in China. Environ. Plan. B Urban Anal. City Sci. 2021, 48, 1245–1262. [Google Scholar] [CrossRef]
- Zhang, K.; Sun, P. A Study on the Adjustment of Primary-Level Administrative Divisions in the Context of Urbanization: On the Basis of the Practice of Regional Offices in Beijing. J. Beijing Adm. Inst. 2022, 4, 18–24. [Google Scholar]
- Tian, G.; Wu, J.; Yang, Z. Spatial pattern of urban functions in the Beijing metropolitan region. Habitat Int. 2010, 34, 249–255. [Google Scholar] [CrossRef]
- Li, X.; Zhao, L.; Li, D.; Xu, H. Mapping urban extent using Luojia 1-01 nighttime light imagery. Sensors 2018, 18, 3665. [Google Scholar] [CrossRef]
- Montalto, V.; Moura, C.J.T.; Langedijk, S.; Saisana, M. Culture counts: An empirical approach to measure the cultural and creative vitality of European cities. Cities 2019, 89, 167–185. [Google Scholar] [CrossRef]
- Yue, Y.; Zhuang, Y.; Yeh, A.G.; Xie, J.-Y.; Ma, C.-L.; Li, Q.-Q. Measurements of POI-based mixed use and their relationships with neighbourhood vibrancy. Int. J. Geogr. Inf. Sci. 2017, 31, 658–675. [Google Scholar] [CrossRef]
- Zhang, J.; Zhang, K.; Zhao, F. Research on the regional spatial effects of green development and environmental governance in China based on a spatial autocorrelation model. Struct. Change Econ. Dyn. 2020, 55, 1–11. [Google Scholar] [CrossRef]
- Torun, A.Ö.; Göçer, K.; Yeşiltepe, D.; Argın, G. Understanding the role of urban form in explaining transportation and recreational walking among children in a logistic GWR model: A spatial analysis in Istanbul, Turkey. J. Transp. Geogr. 2020, 82, 102617. [Google Scholar] [CrossRef]
- Niu, H.; Silva, E.A. Crowdsourced data mining for urban activity: Review of data sources, applications, and methods. J. Urban Plan. Dev. 2020, 146, 04020007. [Google Scholar] [CrossRef]
- Mouratidis, K.; Poortinga, W. Built environment, urban vitality and social cohesion: Do vibrant neighborhoods foster strong communities? Landsc. Urban Plan. 2020, 204, 103951. [Google Scholar] [CrossRef]
- Zhang, Y.; Shang, K.; Shi, Z.; Wang, H.; Li, X. Spatial pattern of the vitality of Chinese characteristic towns: A perspective from nighttime lights. Land 2022, 11, 85. [Google Scholar] [CrossRef]
- Yan, W.-J.; Liu, S.-T. Built Equality and Sustainable Urban Cultural Space: A Case Study of Quanzhou, China. Buildings 2023, 13, 2337. [Google Scholar] [CrossRef]
- Belmiro, C.; Neto, R.d.M.S.; Barros, A.; Ospina, R. Understanding the land use intensity of residential buildings in Brazil: An ensemble machine learning approach. Habitat Int. 2023, 139, 102896. [Google Scholar] [CrossRef]
- Huang, C.; Xiao, C.; Rong, L. Integrating point-of-interest density and spatial heterogeneity to identify urban functional areas. Remote Sens. 2022, 14, 4201. [Google Scholar] [CrossRef]
- Lan, F.; Gong, X.; Da, H.; Wen, H. How do population inflow and social infrastructure affect urban vitality? Evidence from 35 large-and medium-sized cities in China. Cities 2020, 100, 102454. [Google Scholar] [CrossRef]
- Liu, S.; Zhang, L.; Long, Y. Urban vitality area identification and pattern analysis from the perspective of time and space fusion. Sustainability 2019, 11, 4032. [Google Scholar] [CrossRef]
- Chen, Y.; Xu, Z.; Byrne, J.; Xu, T.; Wang, S.; Wu, J. Can smaller parks limit green gentrification? Insights from Hangzhou, China. Urban For. Urban Green. 2021, 59, 127009. [Google Scholar] [CrossRef]
- Long, Y.; Huang, C. Does block size matter? The impact of urban design on economic vitality for Chinese cities. Environ. Plan. B Urban Anal. City Sci. 2019, 46, 406–422. [Google Scholar] [CrossRef]
- Li, S.; Lyu, D.; Huang, G.; Zhang, X.; Gao, F.; Chen, Y.; Liu, X. Spatially varying impacts of built environment factors on rail transit ridership at station level: A case study in Guangzhou, China. J. Transp. Geogr. 2020, 82, 102631. [Google Scholar] [CrossRef]
- Balsas, C.J. Exciting walk-only precincts in Asia, Europe and North-America. Cities 2021, 112, 103129. [Google Scholar] [CrossRef]
- Christiansen, L.B.; Cerin, E.; Badland, H.; Kerr, J.; Davey, R.; Troelsen, J.; van Dyck, D.; Mitáš, J.; Schofield, G.; Sugiyama, T.; et al. International comparisons of the associations between objective measures of the built environment and transport-related walking and cycling: IPEN adult study. J. Transp. Health 2016, 3, 467–478. [Google Scholar] [CrossRef] [PubMed]
- Morris, J.; Colombo, S.; Angus, A.; Parsons, D.; Brawn, M.; Stacey, K.; Hanley, N. The value of public rights of way: A choice experiment in Bedfordshire, England. Landsc. Urban Plan. 2009, 93, 83–91. [Google Scholar] [CrossRef]
- Mu, B.; Liu, C.; Mu, T.; Xu, X.; Tian, G.; Zhang, Y.; Kim, G. Spatiotemporal fluctuations in urban park spatial vitality determined by on-site observation and behavior mapping: A case study of three parks in Zhengzhou City, China. Urban For. Urban Green. 2021, 64, 127246. [Google Scholar] [CrossRef]
- Tian, M.; Li, Z.; Xia, Q.; Peng, Y.; Cao, T.; Du, T.; Xing, Z. Walking in China’s historical and cultural streets: The factors affecting pedestrian walking behavior and walking experience. Land 2022, 11, 1491. [Google Scholar] [CrossRef]
- Xia, C.; Zhang, A.; Yeh, A.G. The varying relationships between multidimensional urban form and urban vitality in Chinese megacities: Insights from a comparative analysis. Ann. Am. Assoc. Geogr. 2022, 112, 141–166. [Google Scholar] [CrossRef]
- Fan, Y.; Kuang, D.; Tu, W.; Ye, Y. Which Spatial Elements Influence Waterfront Space Vitality the Most?—A Comparative Tracking Study of the Maozhou River Renewal Project in Shenzhen, China. Land 2023, 12, 1260. [Google Scholar] [CrossRef]

Disclaimer/Publisher’s Note: The statements, opinions and data contained in all publications are solely those of the individual author(s) and contributor(s) and not of MDPI and/or the editor(s). MDPI and/or the editor(s) disclaim responsibility for any injury to people or property resulting from any ideas, methods, instructions or products referred to in the content. |
© 2024 by the authors. Licensee MDPI, Basel, Switzerland. This article is an open access article distributed under the terms and conditions of the Creative Commons Attribution (CC BY) license (https://creativecommons.org/licenses/by/4.0/).