Abstract
The coordination and stability of the regional economy (RE) and ecological quality (EQ) are essential for the synergistic development of the Beijing–Tianjin–Hebei urban agglomeration (BTH). In this paper, based on remote sensing data and economic statistics data, this paper analysed the current situation and evolution of the RE and EQ in the BTH region. Based on the coupled coordination degree (CCD) model, this paper has developed an evaluative framework and quantifies the spatiotemporal coupled coordination of the RE and EQ in the BTH region from 2000 to 2020. The results show that: (1) in 2020, the GDP of the poverty-stricken counties (PSCs) around BTH accounted for 4.57% of the total BTH region, and the area of high-quality ecosystems, Net Primary Productivity (NPP), soil conservation, water conservation, and sand fixation accounted for more than 40% of the total BTH region; (2) the GDP growth of the PSCs accounted for 4.45% of the total growth in BTH, the reduced area of high-quality ecosystems accounted for 21.04%, and the increase in NPP, soil conservation, water conservation, and sand fixation accounted for more than 40% of the total growth in the BTH region; (3) the CCD of the RE and EQ in the BTH region showed a tendency to increase, but the gap between the regions gradually expanded, and the development type changed from a lagging RE to a lagging EQ, in which the coupled coordination grade of the PSCs was in a dissonance stage for a long time, and the level of economic development had to improve. Deepening the understanding of the spatiotemporal coupling relationship between the RE and EQ and adopting appropriate development policies is of great significance for achieving the coordinated and integrated development of the BTH region.
1. Introduction
With the rapid development of urbanization, the global ecological environment is facing increasingly severe pressure [1,2], which has become a major challenge for sustainable development [3,4]. As the second largest economy in the world [5], China’s GDP grew at an annual rate of 10.1% between 1985 and 2020 [6]. In the process of rapid urban expansion, ecosystem structure and function have been altered and damaged, and the ecosystem has been seriously degraded due to the neglect of ecological protection [7,8,9,10]. Existing studies have shown that for every 1% increase in China’s urbanization level over the next 25 years, the amount of water consumed, land used for construction, energy consumed, and the resulting ecological overload will increase by 1.88, 3.45, 2.98, and 2.42 times, respectively [11]. Therefore, studying and quantifying the coupled coordination process between the economy and ecology is crucial for promoting regional coordination stability and sustainable development.
Coupling refers to the phenomenon in which indicators interact with each other, and this concept originated in the field of physics [12]. In the 1990s, Richard [13] proposed the theory of coupled coordinated development, which indicated that the coordination of social-ecological systems can be achieved through feedback loops. Coupled coordination includes good interactions between systems, and this theory can explain system sustainability well [14,15]; therefore, it has been widely used to solve the problems of economic development, ecology, and urbanization [16,17,18]. Zhang and Li [19] measured the degree of coupled coordination between urbanization and geohazards, and Cai et al. [20] analysed the coupled coordination level between urbanization and agroecology in China. These studies provide a large amount of empirical evidence and research cases for sustainable development in China.
Currently, there have been more studies on the coupled relationship between the regional economy (RE) and the ecological quality (EQ), involving different types of regions such as basins, contiguous special poverty-stricken counties (PSCs), and urban agglomerations [21,22,23,24], and the methodology generally adopts the coupled coordination degree (CCD) model [25]. For example, Fan et al. [26] studied the coordinated relationship between ecology and economy in 31 provincial capitals in China, and analysed the overall spatial pattern, which provides development paths and policy guidance for different cities. Ecosystem services refer to the benefits that humans obtain from ecosystems. Zhu and Xue [27] studied the relationship between ecosystem services and economic development in the Guanzhong region and found that the level of coordination increased overall from 2000 to 2018. Chen et al. [28] found that the CCD of the economy and ecology in Shanghai Harbour showed an increasing trend, but they are not coordinated to a sufficient degree and still need much improvement. Liao et al. [29] analysed the coupling and coordination of the economy and ecology in the Beijing–Tianjin–Hebei urban agglomeration (BTH), finding that the coupled degree showed an increasing and then decreasing trend from 2000 to 2018, and the coordination degree showed an increasing trend. Currently, although some progress has been made in the coupled coordination of the RE and EQ, there is a lack of research on the spatial and temporal coordination in PSCs from the perspective of urban agglomerations.
The BTH agglomeration is strategically prominent as the economic core and political centre of China [11]. Beijing and Tianjin take socioeconomic development as their primary goal, and their development relies on financial, commercial, trade, high-tech and high-end service industries. Hebei is positioned to serve the capital and provide ecological guarantees, and mainly relies on the large-scale expansion of energy and heavy chemicals to realize economic development. Rapid economic development has led to increasingly intensified human–land conflicts (referring to situations where human activities and land use practices clash with the natural environment or with other human needs and interests, leading to conflicts or tensions) within urban agglomerations [30], resulting in ecological and environmental problems such as water scarcity, land desertification, soil and water loss, sandstorms, air quality deterioration, and ecosystem degradation [31,32,33,34]. The different functional positions within the urban agglomerations lead to an imbalance between ecology and economy, exacerbating regional conflicts and affecting the coordinated development of the BTH region, as evidenced by the existence of the “Poverty Belt around Beijing and Tianjin”.
As regions with relatively lagging socio-economic development, the CCD, among multiple factors such as the economy, environment, and society within the PSCs, is crucial for achieving sustainable development. The PSCs often face challenges such as resource scarcity and increased environmental pressure, which necessitate the formation of efficient coordination among various factors within the region to break through development bottlenecks [35]. As an essential part of China’s economic and social development, PSCs face numerous challenges. Promoting development, narrowing the urban–rural gap, eradicating poverty, and achieving common prosperity are ideals that humanity continually pursues. Inadequate natural conditions, poor geographical conditions, and fragile ecological environments are the primary driving factors of persistent poverty [36]. In recent years, with the deepening of poverty governance, an increasing number of studies have begun to focus on the development issues of PSCs. For instance, the contiguous poverty-stricken areas in the Qinba Mountains suffer from poor infrastructure, weak resource and environmental carrying capacity, the inability to sustain more prosperous socio-economic activities, lagging economic development, a single industrial structure, and a lack of large-scale industries [37]. Wu et al. [38] have found that the government’s environment-friendly policies and mechanisms can achieve the dual goals of poverty alleviation and environmental pollution reduction. Duan et al. [39] have investigated the impact of China’s agricultural certification policies on economic growth in PSCs. The CCD, as an important indicator to measure the interaction and coordinated development level between systems, is significant for understanding the poverty dynamics of PSCs and formulating effective poverty alleviation policies. Deeply exploring the relationship between PSCs and the CCD can provide new perspectives and ideas for poverty governance and regional development. In recent years, some studies have focused on the economic and ecological coupling coordination relationship in PSCs. For example, Ge et al. [40] established an indicator system for socio-economic and environmental sectors in poverty-stricken areas of China and calculated the level of the CCD to assess the coordination relationship between them. Based on the CCD model, Meng et al. [41] analysed the economic and ecological coupling coordination status of poverty-stricken areas in Guizhou Province. Chen et al. [42] constructed a coupling indicator system for poverty and ecological vulnerability, and analysed the coupling relationship between the ecological environment and poverty from a village-level perspective. The PSCs are an important part of the Beijing–Tianjin–Hebei urban agglomeration. Deeply studying the coupled development of the economy and ecology in this region is conducive to narrowing the urban–rural gap within the region and promoting coordinated regional development. Conducting research on the economic and ecological coupling coordination of the PSCs not only aligns with China’s practical needs to vigorously promote poverty reduction and urbanization development, but also provides reference cases for other poverty-stricken areas, helps enrich regional development theories, and offers insights for the formulation and implementation of relevant policies. Therefore, this study focuses on the PSCs, aiming to deeply explore the development mechanisms and changing characteristics of their CCD, and to provide a scientific basis for formulating effective poverty alleviation and sustainable development policies. The selection of the PSCs as the primary region for this study is primarily based on the following considerations: Firstly, the PSCs serve as the frontline in China’s battle against poverty, and their development status is directly linked to the achievement of national poverty alleviation goals. Secondly, these counties confront numerous challenges in economic development, environmental protection, and social progress, making the study of their CCD crucial for understanding regional development mechanisms. Lastly, by conducting a thorough analysis of the CCD in poverty-stricken counties, we can provide valuable insights and lessons that can be applied to other similar regions. This study is based on the land use/cover change (LUCC) remote sensing monitoring data, economic statistics, Net Primary Productivity (NPP) data, annual precipitation, and soil data from 2000 to 2020 and adopts statistical analysis and spatial analysis. The main objectives include analysing the status of the RE and major EQ in the BTH region, describing the trends of the RE and EQ in the BTH region from 2000 to 2020, and exploring the CCD between the RE and major EQ, which will in turn reveal the relationship between the RE and EQ. This study is expected to provide a scientific basis for the coordinated development of the BTH region.
2. Materials and Methods
2.1. Study Area
The BTH region is one of China’s three major urban agglomerations, located in the core of China’s Bohai Rim, with a total area of approximately 21.8 × 10⁴ km2. The terrain descends in a semicircular shape from northwest to southeast, with a rich variety of landforms, mainly including the Bashang Plateau Area, the basin of the northwestern Hebei Mountains, the hilly area of the northern Hebei and Yanshan Mountains, and the plains of central Hebei. The BTH region is experiencing rapid economic growth, but it is not balanced across administrative jurisdictions, creating PSCs [43,44]. As a key ecological area, PSCs play an important role in providing ecological security for the BTH region (Figure 1).
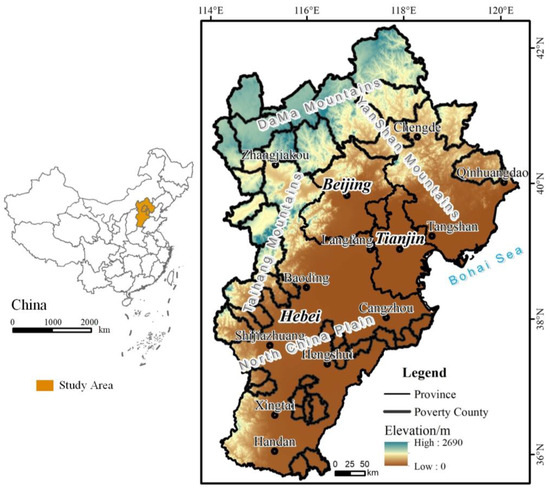
Figure 1.
Location of the study area.
2.2. Data Sources
The data mainly include LUCC remote sensing monitoring data, socioeconomic statistics, NPP data, and annual precipitation and soil data (Table 1).

Table 1.
Data sources.
LUCC data are derived from Resource and Environmental Science Data Platform [45]. The land use types include six primary types and 25 secondary types. These ecosystems are then converted into seven ecosystems: farmland, forests, grassland, wetlands, urban land, deserts, and other ecosystems.
Socioeconomic statistics, which are derived from the statistical yearbooks of Beijing, Tianjin, and Hebei from 2000 to 2020, mainly include GDP and population data for provinces, cities, districts, and counties.
The NPP data are from the MODI7A3 dataset, a product derived from the Moderate-resolution Imaging Spectroradiometer (MODIS) instrument aboard NASA’s Terra and Aqua satellites. This dataset specifically focuses on providing estimates of global Net Primary Productivity (NPP), a critical metric in understanding vegetation growth, carbon cycling, and ecosystem health. The interannual change in NPP in global terrestrial vegetation was calculated by the BIOME-BGC model, a comprehensive ecosystem process model designed to simulate the storage and fluxes of carbon, nitrogen, and water within terrestrial ecosystems, with a spatial resolution of 1 km × 1 km and a time series of 2000–2020; these data have been widely used [46,47].
The annual precipitation data are from the daily observation data from 2000 to 2020 of the China Integrated Meteorological Information Service System.
Soil data are obtained from the 1:100 China Soil Database of Resource and Environmental Science Data Platform.
All the data are converted into 1 km × 1 km raster data to unify the spatial resolution.
2.3. Construction of the Evaluation Index System
A comprehensive evaluation of each subsystem is necessary for evaluating the CCD of RE and EQ. EQ reflects the ability of ecosystems to maintain the stability of their organization, structure, and function when they encounter external disturbances. This ability is affected not only by the ecosystem’s composition, structure, and function but also by its resilience and ability to resist disturbances [48]. High-quality ecosystems are diverse, stable, self-sustaining, and restorative, and the percentage of the area of high-quality ecosystems reflects the structure of the ecosystem and its health and functionality [49]. Based on their characteristics, this paper defined high-quality ecosystems as the types of ecosystems that can maintain their structure and function in the face of external pressures, including forests, grasslands, and aquatic ecosystems [50]. NPP, soil conservation, water conservation, and sand fixation, as the provisioning and regulating services provided by the ecosystem, play crucial roles in maintaining ecosystem stability. Therefore, the evaluation indicators of both the EQ and RE were selected based on the socioeconomic and ecological background of the PSC following scientific, operable, dynamic, and systematic principles in establishing the indicator system. Among them, EQ mainly includes indicators related to the three aspects of ecosystem structure, supply services, and regulation services, and RE development is evaluated by GDP. This paper uses Analytic Hierarchy Process (AHP) to determine the weight of each index (Table 2).
Table 2.
Comprehensive evaluation indicators for RE and EQ in the PSC.
2.4. Estimation of Ecosystem Services
2.4.1. Water Conservation
Precipitation storage was used to estimate the water conservation [51]:
Please refer to Huang et al. [52] for the detailed calculation process.
2.4.2. Soil Conservation
The soil conservation capacity () is difference between soil loss under extreme degraded ecosystems and actual conditions. Soil water erosion intensity was calculated according to the Revised Universal Soil Loss Equation (RUSLE) model:
where is the soil erosion modulus; is the rainfall erodibility factor [53]; is the soil erodibility factor [54]; and are the slope length and slope steepness [55,56] is the vegetation cover factor [57]; and is the erosion control practice factor with a value range of 0–1 [58]. Please refer to Wang et al. [59] for the detailed calculation process.
2.4.3. Sand Fixation
Sand fixation service refers to the critical functions of ecosystems (including forests, grasslands, etc.) in mitigating soil wind erosion, preventing sandstorms, and reducing water and soil loss. The sand fixation capacity () is the difference in the soil wind erosion modulus between an extremely degraded ecosystem () and actual conditions ():
The wind erosion modulus is calculated using the revised wind erosion equation (RWEQ) model [60]:
where SL is the wind erosion modulus (t·hm−2); x is the field length (m); Qx is the sand flux at length x of the field (kg/m); Qmax is the maximum sand transport capacity under the wind force (kg/m); s is the critical field length (m). The values WF, EF, SCF, K′, and COG are the weather factor (kg/m), soil erodibility factor, soil crust factor, soil roughness factor, and combined vegetation factor, respectively. Please refer to Wang et al. [59] for the detailed calculation process.
2.5. Comprehensive Development Level Model
The multi-objective linear weighting method [61] is used to calculate the comprehensive development index:
where is the RE Comprehensive index () and EQ Comprehensive index (); is corresponding indicator weights in Table 2; is the normalized value.
The indicator weights are determined using the entropy value method, which can effectively eliminate the influence of subjective factors [62]. The higher the entropy, the more uniform the system structure is and the smaller the differences are. In contrast, the more uneven the system structure is, the larger the differences are. The degree of variation is calculated and the weights are determined according to the size of the entropy value of each index.
Data normalization is required because different evaluation indicators often have different units of measurement. This study used the range normalization method to make the index dimensionless [63].
2.6. Coupled Coordination Degree Model
To better reflect the balance between RE and EQ, this paper adopts the coupling model in physics to calculate the degree of coupling between RE and EQ [64]:
where represents the coupling degree between RE and EQ, and the value range is [0,1]. When → 0, the two systems tend to be out of balance, and the imbalance tends to increase; when → 1, the two systems tend to be coordinated, and the coordination is increasing. The values and are comprehensive evaluation indices, which represent the RE index and the EQ index, respectively. Since reflects only the degree of coupling between systems, it cannot distinguish the actual situation in which both have low development levels but high coupling degrees; therefore, to distinguish low-level coupling from high-level coupling, and drawing on the relevant research results, this study establishes a CCD model based on the coupling model:
where reflects the coupled coordination development level of the two systems, represents the coordination index, and are coefficients to be determined, and and are both taken as 0.5, considering the same influence of the two systems. In addition, based on the magnitude of the relationship between and , according to Equations (16)–(18), can be categorized into three types: the RE lagging type (A), the EQ lagging type (B), and the RE and EQ synchronized type (C). The judgement formula is as follows:
To directly reflect the development, it is graded by drawing on existing research results [64] (Table 3).
Table 3.
Classification criteria of CCD.
3. Results
3.1. Status of Characterization between RE and EQ Indicators
According to the RE indicators of the BTH region in 2020 (Table 4), there were significant regional variations, with the total GDP of Beijing, Tianjin, and Hebei Provinces decreasing in descending order. The proportions of the total GDP of the BTH region were 41.79%, 16.30%, and 41.91%, respectively. In contrast, that of the PSCs was CNY 394.8 billion, accounting for 4.57%.
Table 4.
Statistics on the RE and EQ indicators in the BTH region in 2020.
In terms of each EQ indicator, the area of high-quality ecosystems in the BTH region was 79.01 × 10⁶ km2 in 2020, accounting for 40.63% of the total ecosystem area of the BTH region. The areas of each region, in descending order, were Hebei, Beijing, and Tianjin, accounting for 86.38%, 10.45% and 3.16% of the total area of high-quality ecosystems in the BTH region, respectively (Table 4), while the proportion of PSCs reached 54.74%, with Beijing and Hebei mainly dominated by forest and grasslands and Tianjin dominated by wetlands. The proportion of each region in the total NPP of the BTH region was 88.78% (Hebei), 7.47% (Beijing), and 3.75% (Tianjin) in descending order, and the proportion of PSCs reached 44.94%. Hebei Province provided more than 80% of the total amount of soil conservation, water conservation, and sand fixation services in the BTH region. Beijing accounted for approximately 10% of each regulation service in the BTH region. The proportion of Tianjin was the lowest, accounting for less than 5%, while the amount of the various types of regulation services provided by PSCs accounted for more than 50% of the total amount of the BTH region.
Spatially, there were significant regional differences in ecosystem structure (Figure 2), with farmland mainly distributed in the south-central plains; urban land mainly concentrated in the municipal districts of Beijing, Tianjin, and Tangshan; and high-quality ecosystems mainly distributed in the northern mountains, the narrow strip of hilly areas in the west, and the Bohai Sea coastal areas (Figure 2a). Forests were mainly distributed in the mountainous areas of Beijing and Chengde, grasslands were mainly distributed in the hilly areas south of Zhangjiakou, and wetlands were mainly distributed in the coastal areas of Tianjin, Cangzhou, and Tangshan. The spatial distributions of NPP (Figure 2b), soil conservation (Figure 2c), and water conservation (Figure 2d) services generally corresponded to the distribution pattern of ecosystems, i.e., highest in the forested areas in the north, followed by the hilly and narrow grassland area in the west, and the farmland area in the southeast was the lowest. The spatial distribution of sand fixation services (Figure 2e) was high in the mountainous areas in the west and north and low in the south.
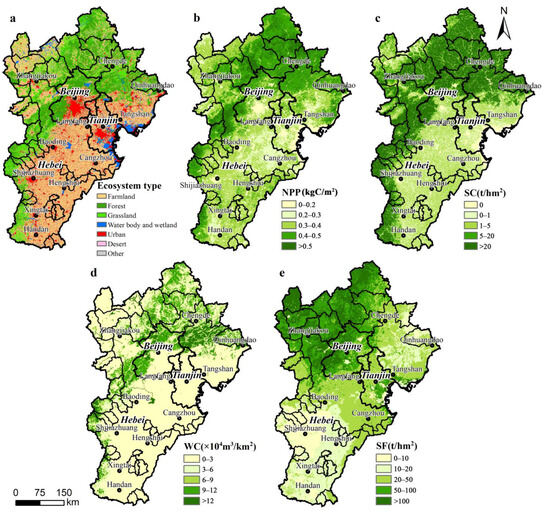
Figure 2.
Spatial distribution of ecosystem structure and ecosystem services in the BTH region in 2020: (a) ecosystem structure; (b) NPP; (c) soil conservation; (d) water conservation; and (e) sand fixation.
3.2. Evolution of the Characteristics of RE and EQ Indicators
From 2000–2020, the PSCs lagged significantly behind in economic growth (Table 5). The total GDP of Beijing, Tianjin, and Hebei Provinces increased by CNY 3.28 trillion, 1.25 trillion, and 3.16 trillion, respectively, while that of the PSCs grew by CNY 341.92 billion, accounting for 42.69%, 16.25%, 41.07%, and 4.45%, respectively, of the total change in the BTH region.
Table 5.
Statistics of the changes in RE and EQ indicators for each region of the BTH region, 2000–2020.
From 2000 to 2020, each EQ indicator showed different degrees of change (Table 5). In terms of changes in ecosystem structure, mainly interconversion between farmland and high-quality ecosystems and transfer to urban ecosystems occurred. The total area of urban land increased by 514.18 × 10⁴ km2, while the areas of farmland and high-quality ecosystems decreased by 399.22 × 10⁴ km2 and 120.69 × 10⁴ km2, respectively. Hebei Province had the largest reduction in the area of high-quality ecosystems, accounting for 58.45% of the total change in the BTH region, of which more than 1/3 of the reduction was in PSCs, dominated by grassland ecosystems, 72.5 × 10⁴ km2, and the reduction in high-quality ecosystems in PSCs was more than one-third of the total reduction in Hebei, dominated by grasslands. The reduction in Tianjin’s high-quality ecosystems accounted for 38.85% of the total change in the BTH region, mainly in wetlands. The total area of Beijing’s high-quality ecosystems increased by 3.34 × 10⁴ km2, mainly due to the increase in forests and grasslands. In terms of ecosystem productivity, both supplying and regulating services in Hebei Province increased the most, with increases in NPP, soil conservation, water conservation, and sand fixation accounting for 86.60%, 97.01%, 89.40%, and 77.78%, respectively, of the changes in the whole BTH region, of which the PSCs made the greatest contribution, with growth in all types of services accounting for approximately 40% of the total change. The changes in Beijing and Tianjin were less pronounced, with NPP, water conservation, and sand fixation all increasing to varying degrees, except for soil conservation, which showed a slight decreasing trend.
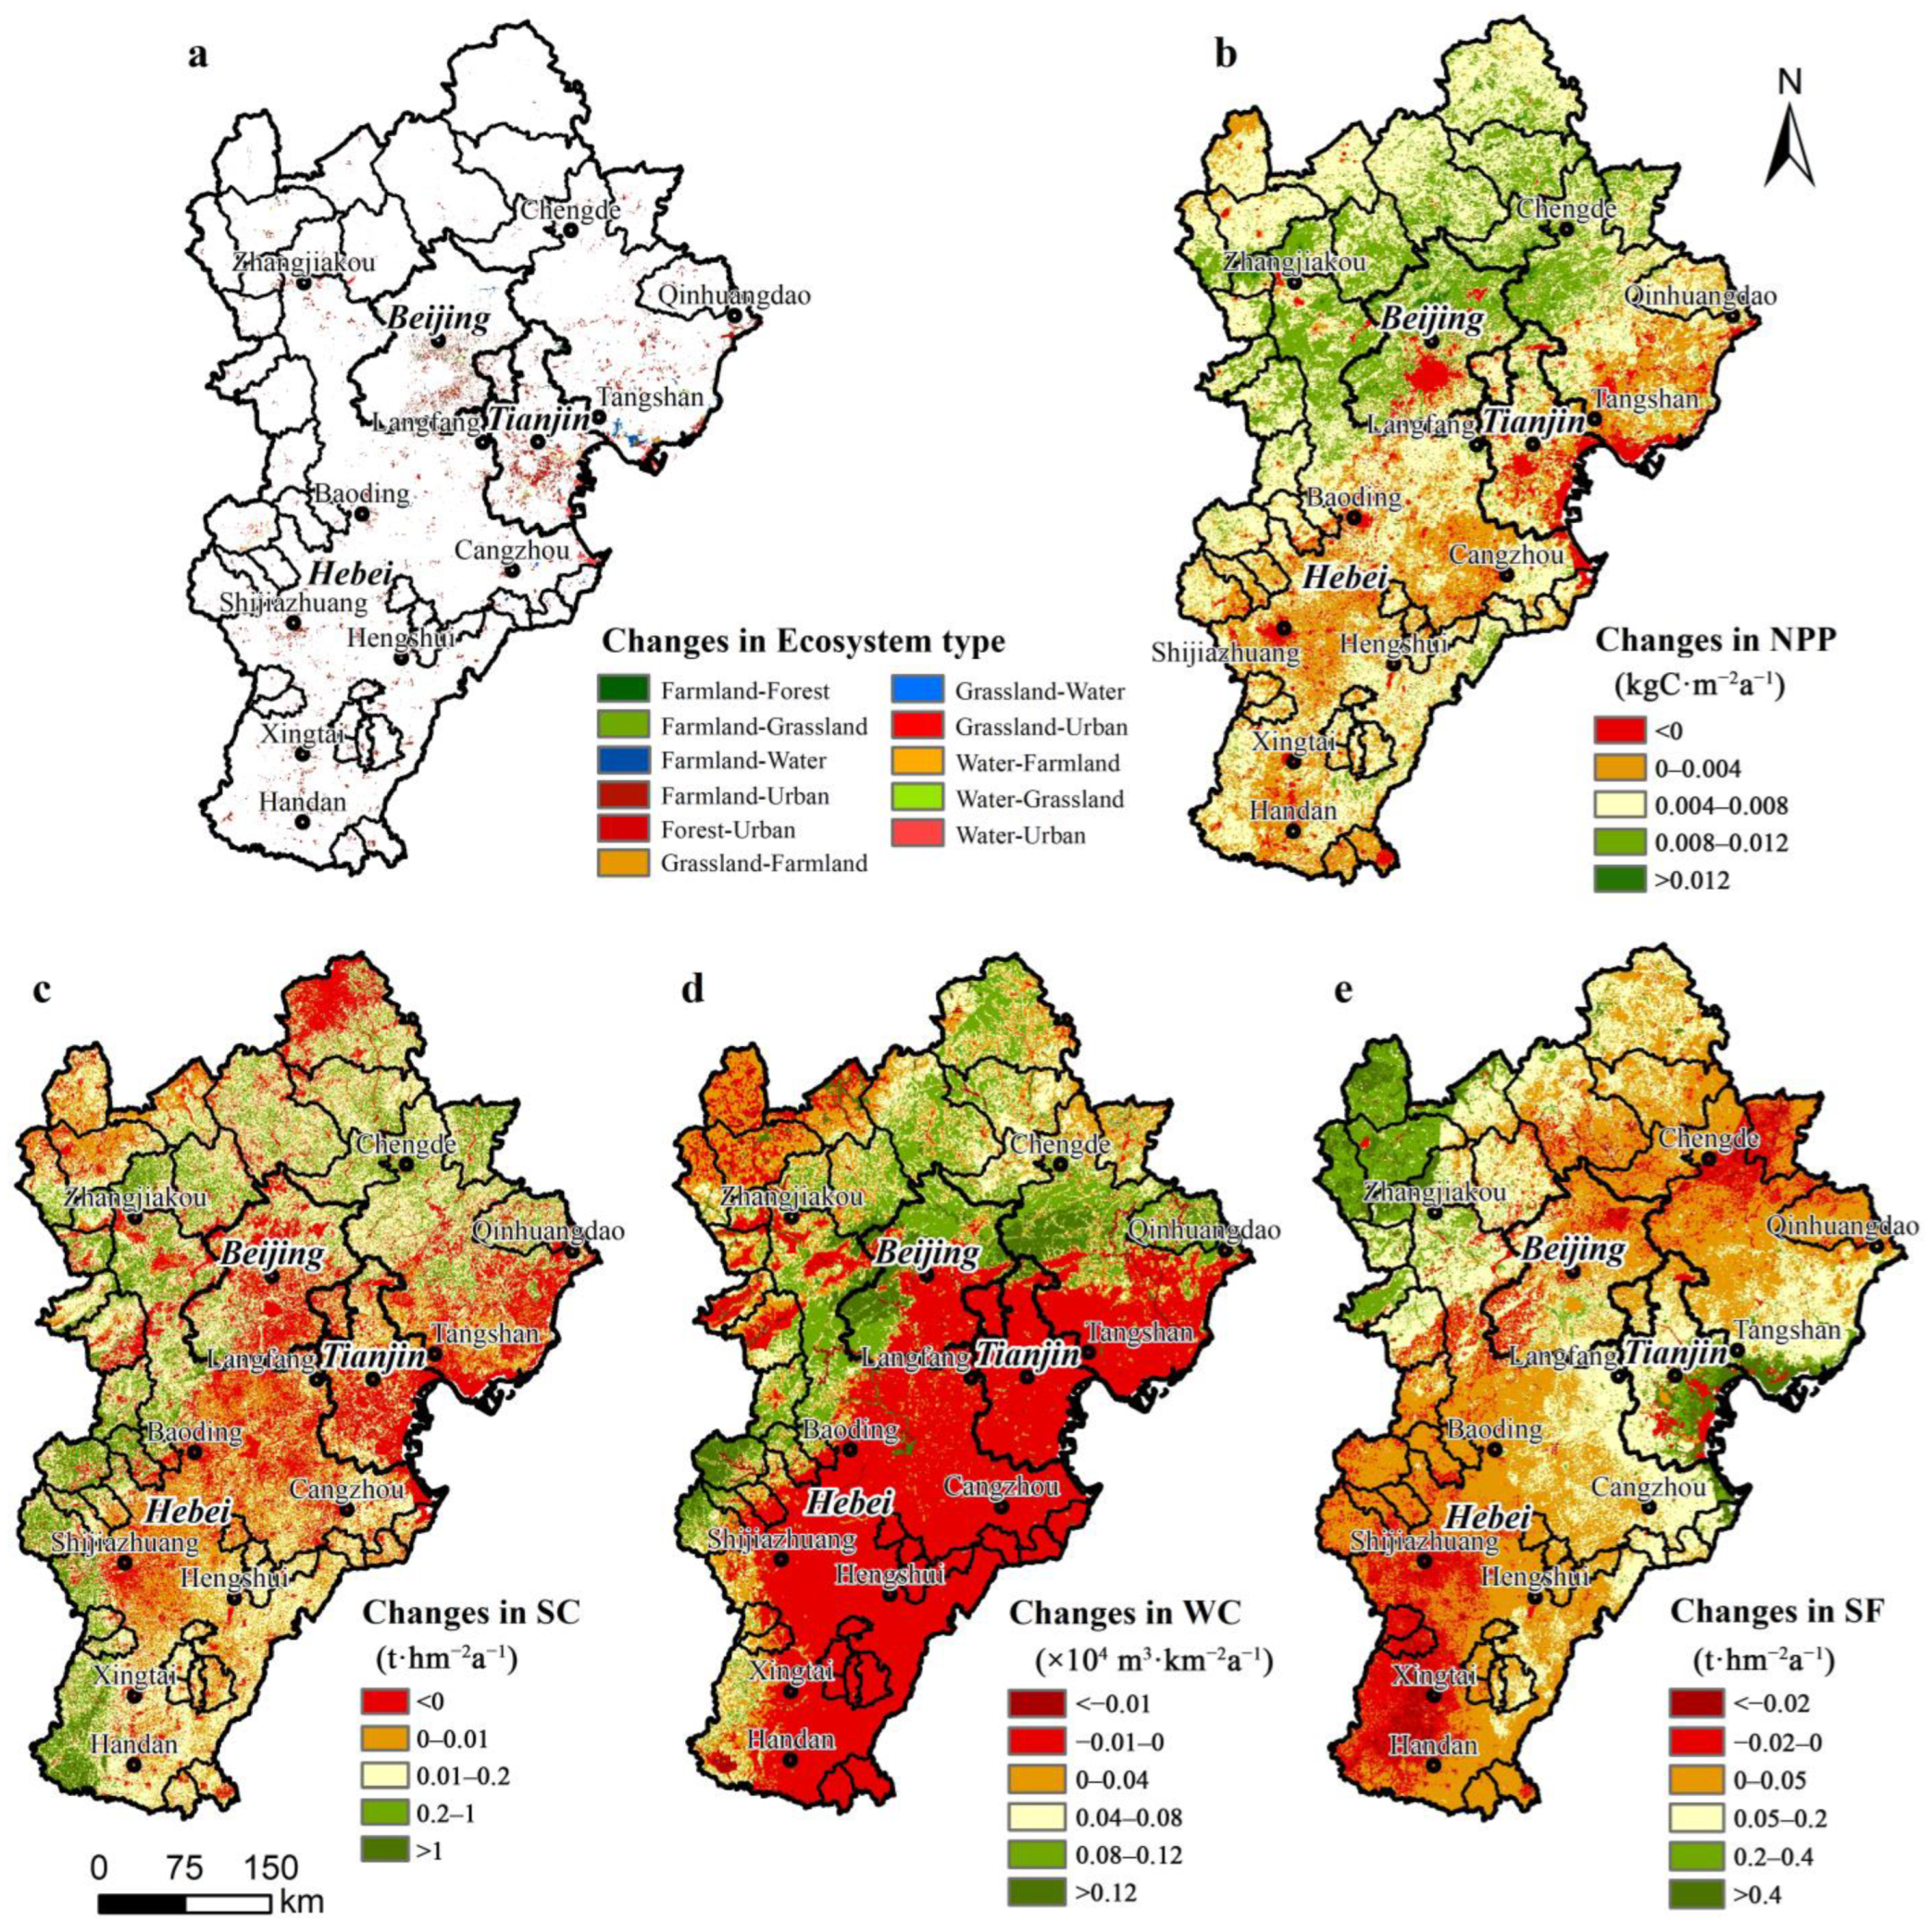
In terms of spatial distribution, the increase in urban ecosystems was mainly distributed around the municipal districts. Urban land occupying wetlands were mainly distributed in the coastal areas of Tianjin, Tangshan, and Cangzhou; those occupying grasslands were mostly located in Zhangjiakou and areas along the Taihang Mountains in the west; and those occupying forests were mainly located in the northern areas of Chengde and Tangshan. The growth in wetlands was mainly located in the southern region of Tangshan. The growth of farmland, grassland, and forest ecosystems was sporadically distributed around the Beijing–Tianjin municipal area (Figure 3a). NPP showed a significant upward trend (p < 0.05), and the relative increase was highest in the Yanshan Mountains region and the mountainous areas north of Beijing, with decreasing trends of varying degrees in the municipal districts and the eastern coastal belt area (Figure 3b). Soil conservation, water conservation, and sand fixation services all showed an increasing trend, but not significant (p > 0.05). The relative increase in soil conservation was highest in the Yanshan Mountains region and along the Taihang Mountains in the west (Figure 3c), with a decreasing trend in the Beijing–Tianjin–Tangshan and central Hebei Plain regions. The increase in the water conservation capacity was relatively high in the same Yanshan Mountains region and along the Taihang Mountains in the west, while the majority of the eastern and southern regions and the dam areas had a decreasing trend (Figure 3d). The amount of sand fixation increased more in the Zhangjiakou and Bohai Rim coastal areas but decreased in parts of the northeast and southwest regions (Figure 3e).
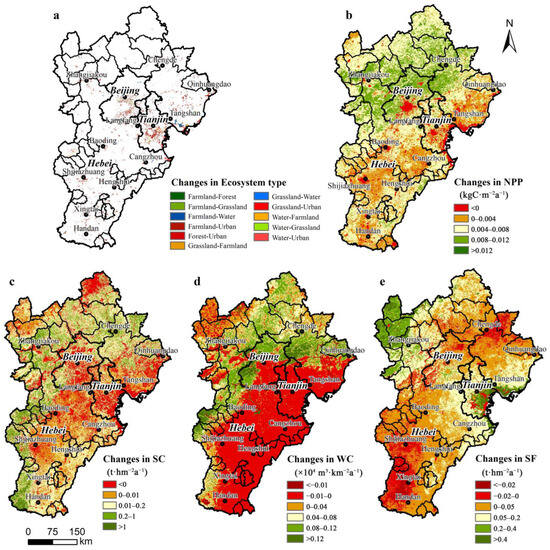
Figure 3.
Spatial distribution of ecosystem structure and ecosystem service change patterns in the BTH region, 2000–2020: (a) ecosystem structure; (b) NPP; (c) soil conservation; (d) water conservation; and (e) sand fixation.
3.3. Coupled and Coordinated Evolution of RE and EQ
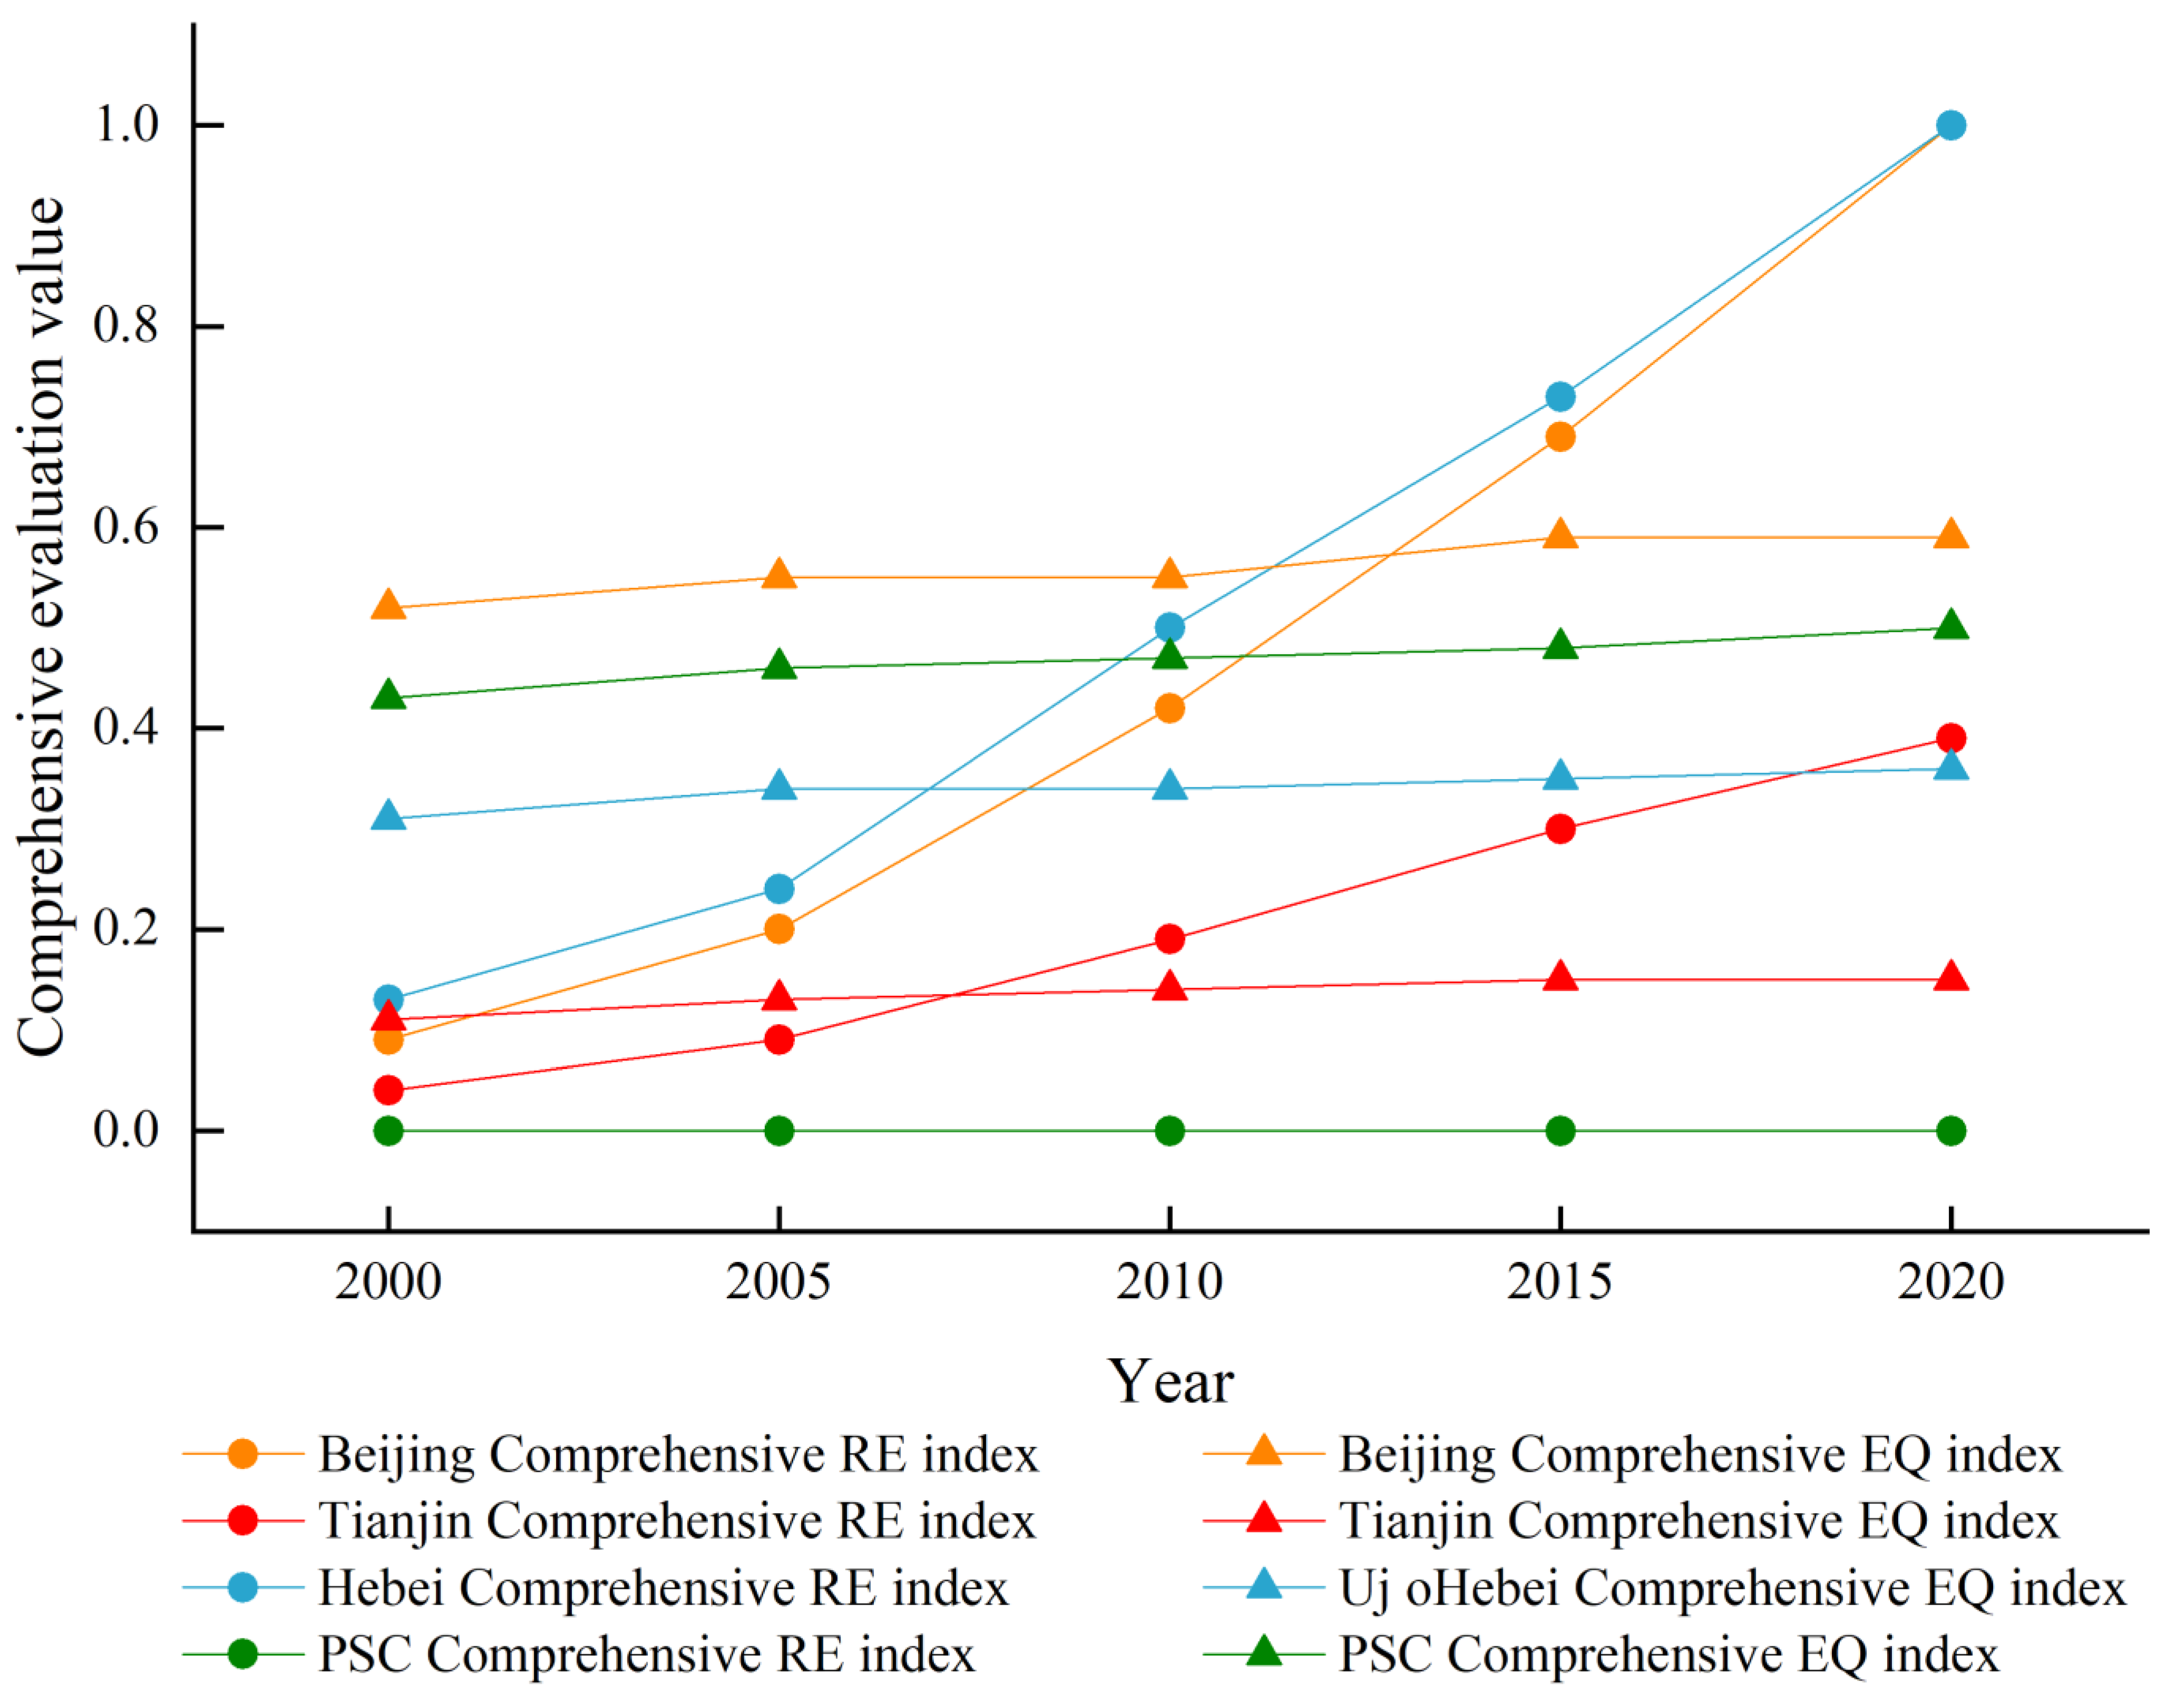
The comprehensive RE and EQ index in the BTH region from 2000 to 2020 showed an upward trend (Figure 4), in which the comprehensive RE index grew significantly faster than the EQ and the comprehensive RE index of Tianjin and Hebei exceeded the composite EQ index from 2005–2010, and Beijing’s transition occurred between 2010 and 2015, while the two types of composite indices of the PSCs were always in a parallel state with weak changes. The comprehensive RE index was low in 2000, separate from the changes in the two comprehensive indices. Beijing, Tianjin, and Hebei grew faster between 2000 and 2010. The growth rate slowed after 2010, while the PSC index continued to show weak changes between 2000 and 2020, which indicates that there were large differences in economic development within Hebei Province and that the rapid development of the neighbouring areas did not occur in the PSCs. The comprehensive index of the EQ in each region varied considerably in 2000 and grew slowly, and the change in the comprehensive index of each region from 2000 to 2020 was less than 0.1, and the scope of change was Beijing, PSCs, Hebei, and Tianjin in descending order, which indicates that the EQ of the BTH region had not significantly improved.
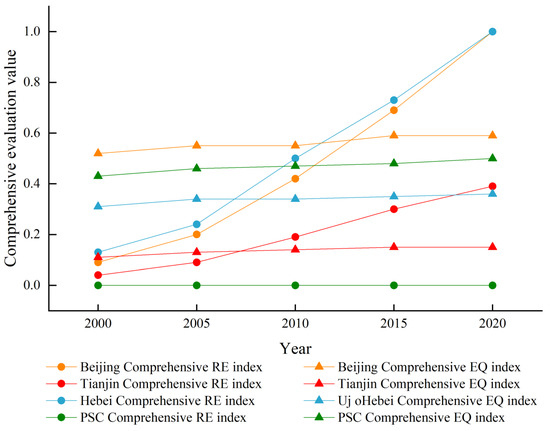
Figure 4.
Comprehensive indices for various regions of the BTH region from 2000–2020. (Ui: RE Comprehensive index; and Uj: EQ Comprehensive index).
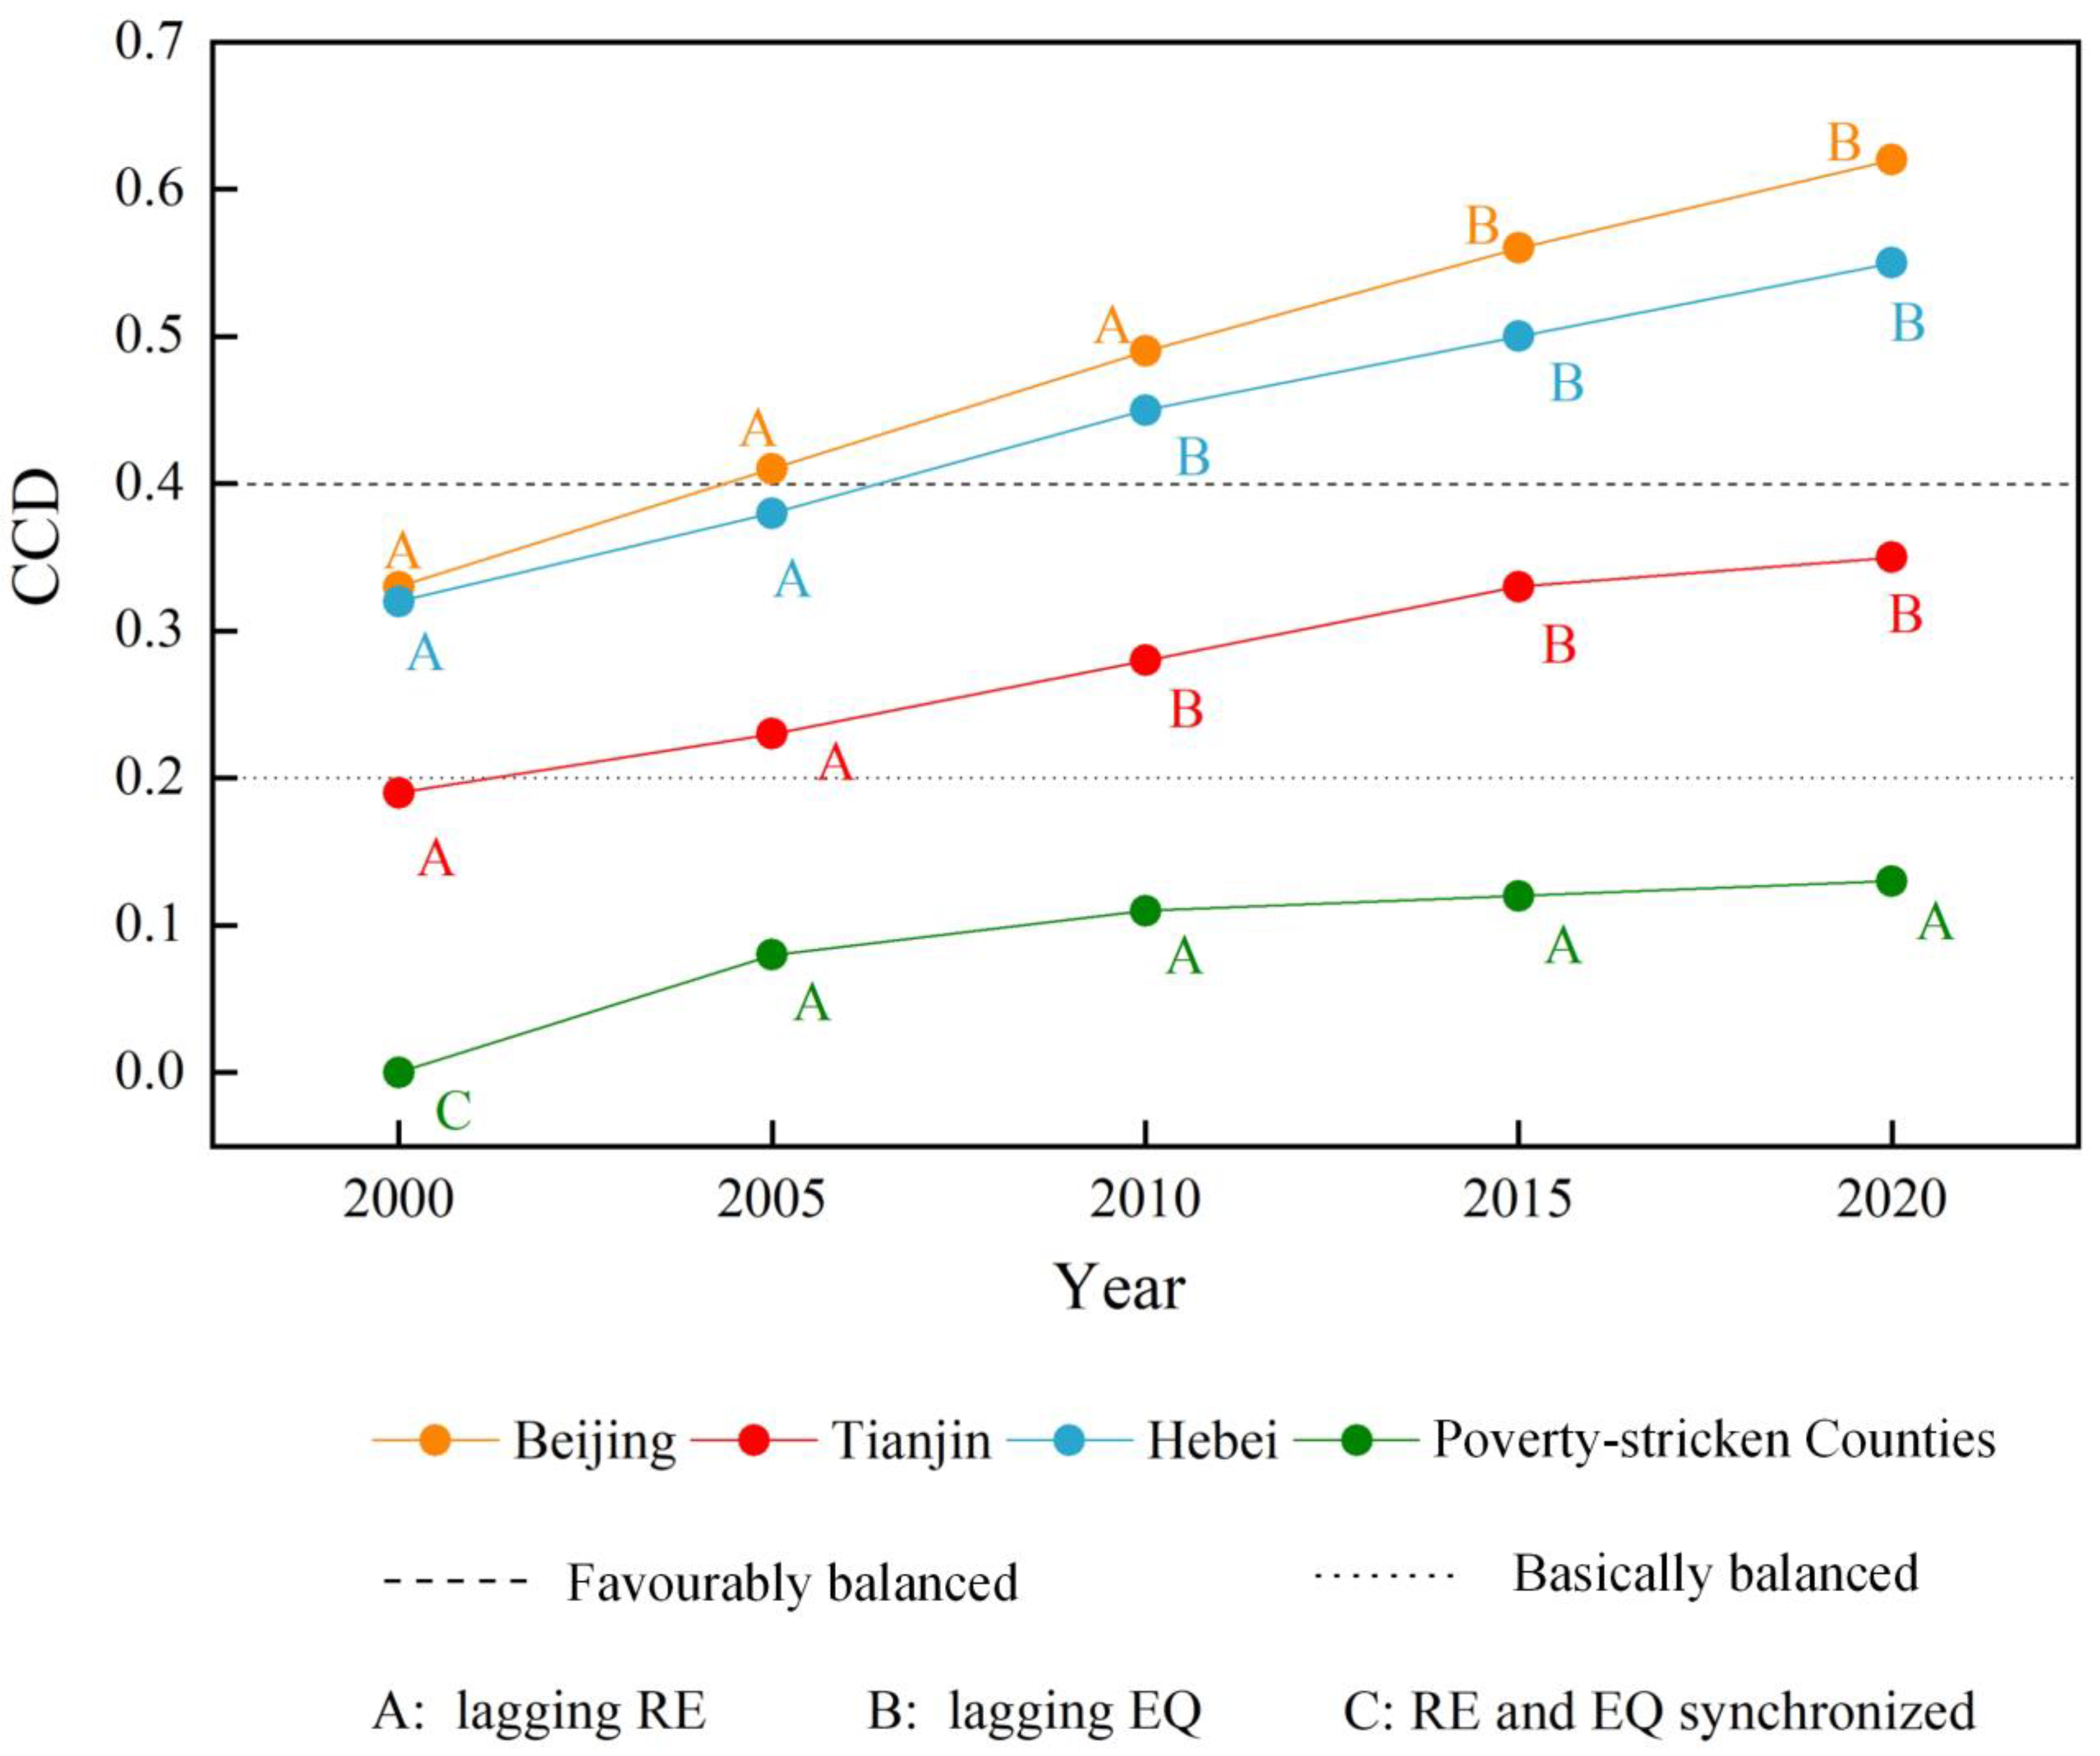
The CCD of the BTH region generally had a continuous growth trend (Figure 5), and the process of change can be divided into two phases: rapid development, Phase I (2000–2010) and steady growth, Phase II (2010–2015). In Phase I, the CCD of each region grew rapidly, with an average increase of 53% in each region, and the time series evolution was evident. In Phase II, the CCD had been steadily increasing but the rate of increase dropped, with an average increase of 25% across all regions. Rapid economic development led to a transition from a lagging RE to a lagging EQ in the Beijing, Tianjin, and Hebei CCD, while the CCD in the PSCs was low and represents the lagging RE type, indicating that the poverty-stricken areas failed to effectively transform ecological assets into economic benefits. The CCD of the PSCs shifted from type C to type A from 2000 to 2005. This transformation was primarily attributed to a series of poverty alleviation policies potentially implemented by the government during this period, which might have exhibited certain imbalances in resource allocation. The PSC regions might not have fully benefited from these policies, leading to relative lags in economic development and subsequently affecting the coupling coordination between the ecology and economy. PSC regions might have long relied on traditional or inefficient industries that gradually lost their competitive edge in the market. Simultaneously, the upgrading and transformation of industrial structures require substantial financial and technological support, which PSC regions might face significant challenges in acquiring, thereby hindering economic development and decreasing the coupling coordination degree. Furthermore, while pursuing economic development, PSC regions might encounter more severe pressures on ecological and environmental protection. To preserve the ecological environment, some development projects might be restricted or delayed, sacrificing economic growth rates to some extent and resulting in a shift towards an economic lag type in coupling coordination.
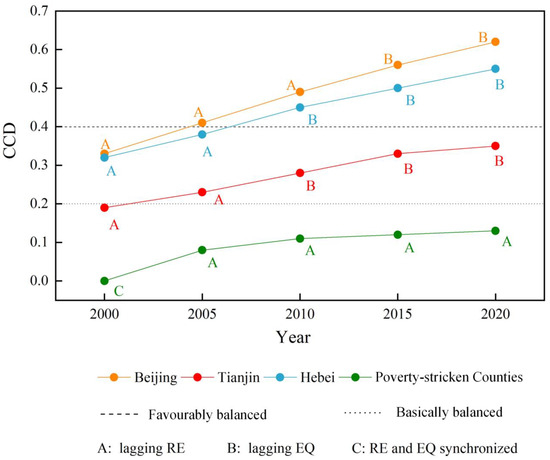
Figure 5.
CCD for various regions of the BTH region from 2000–2020. (A: RE lagging type; B: EQ lagging type; and C: RE and EQ synchronization type).
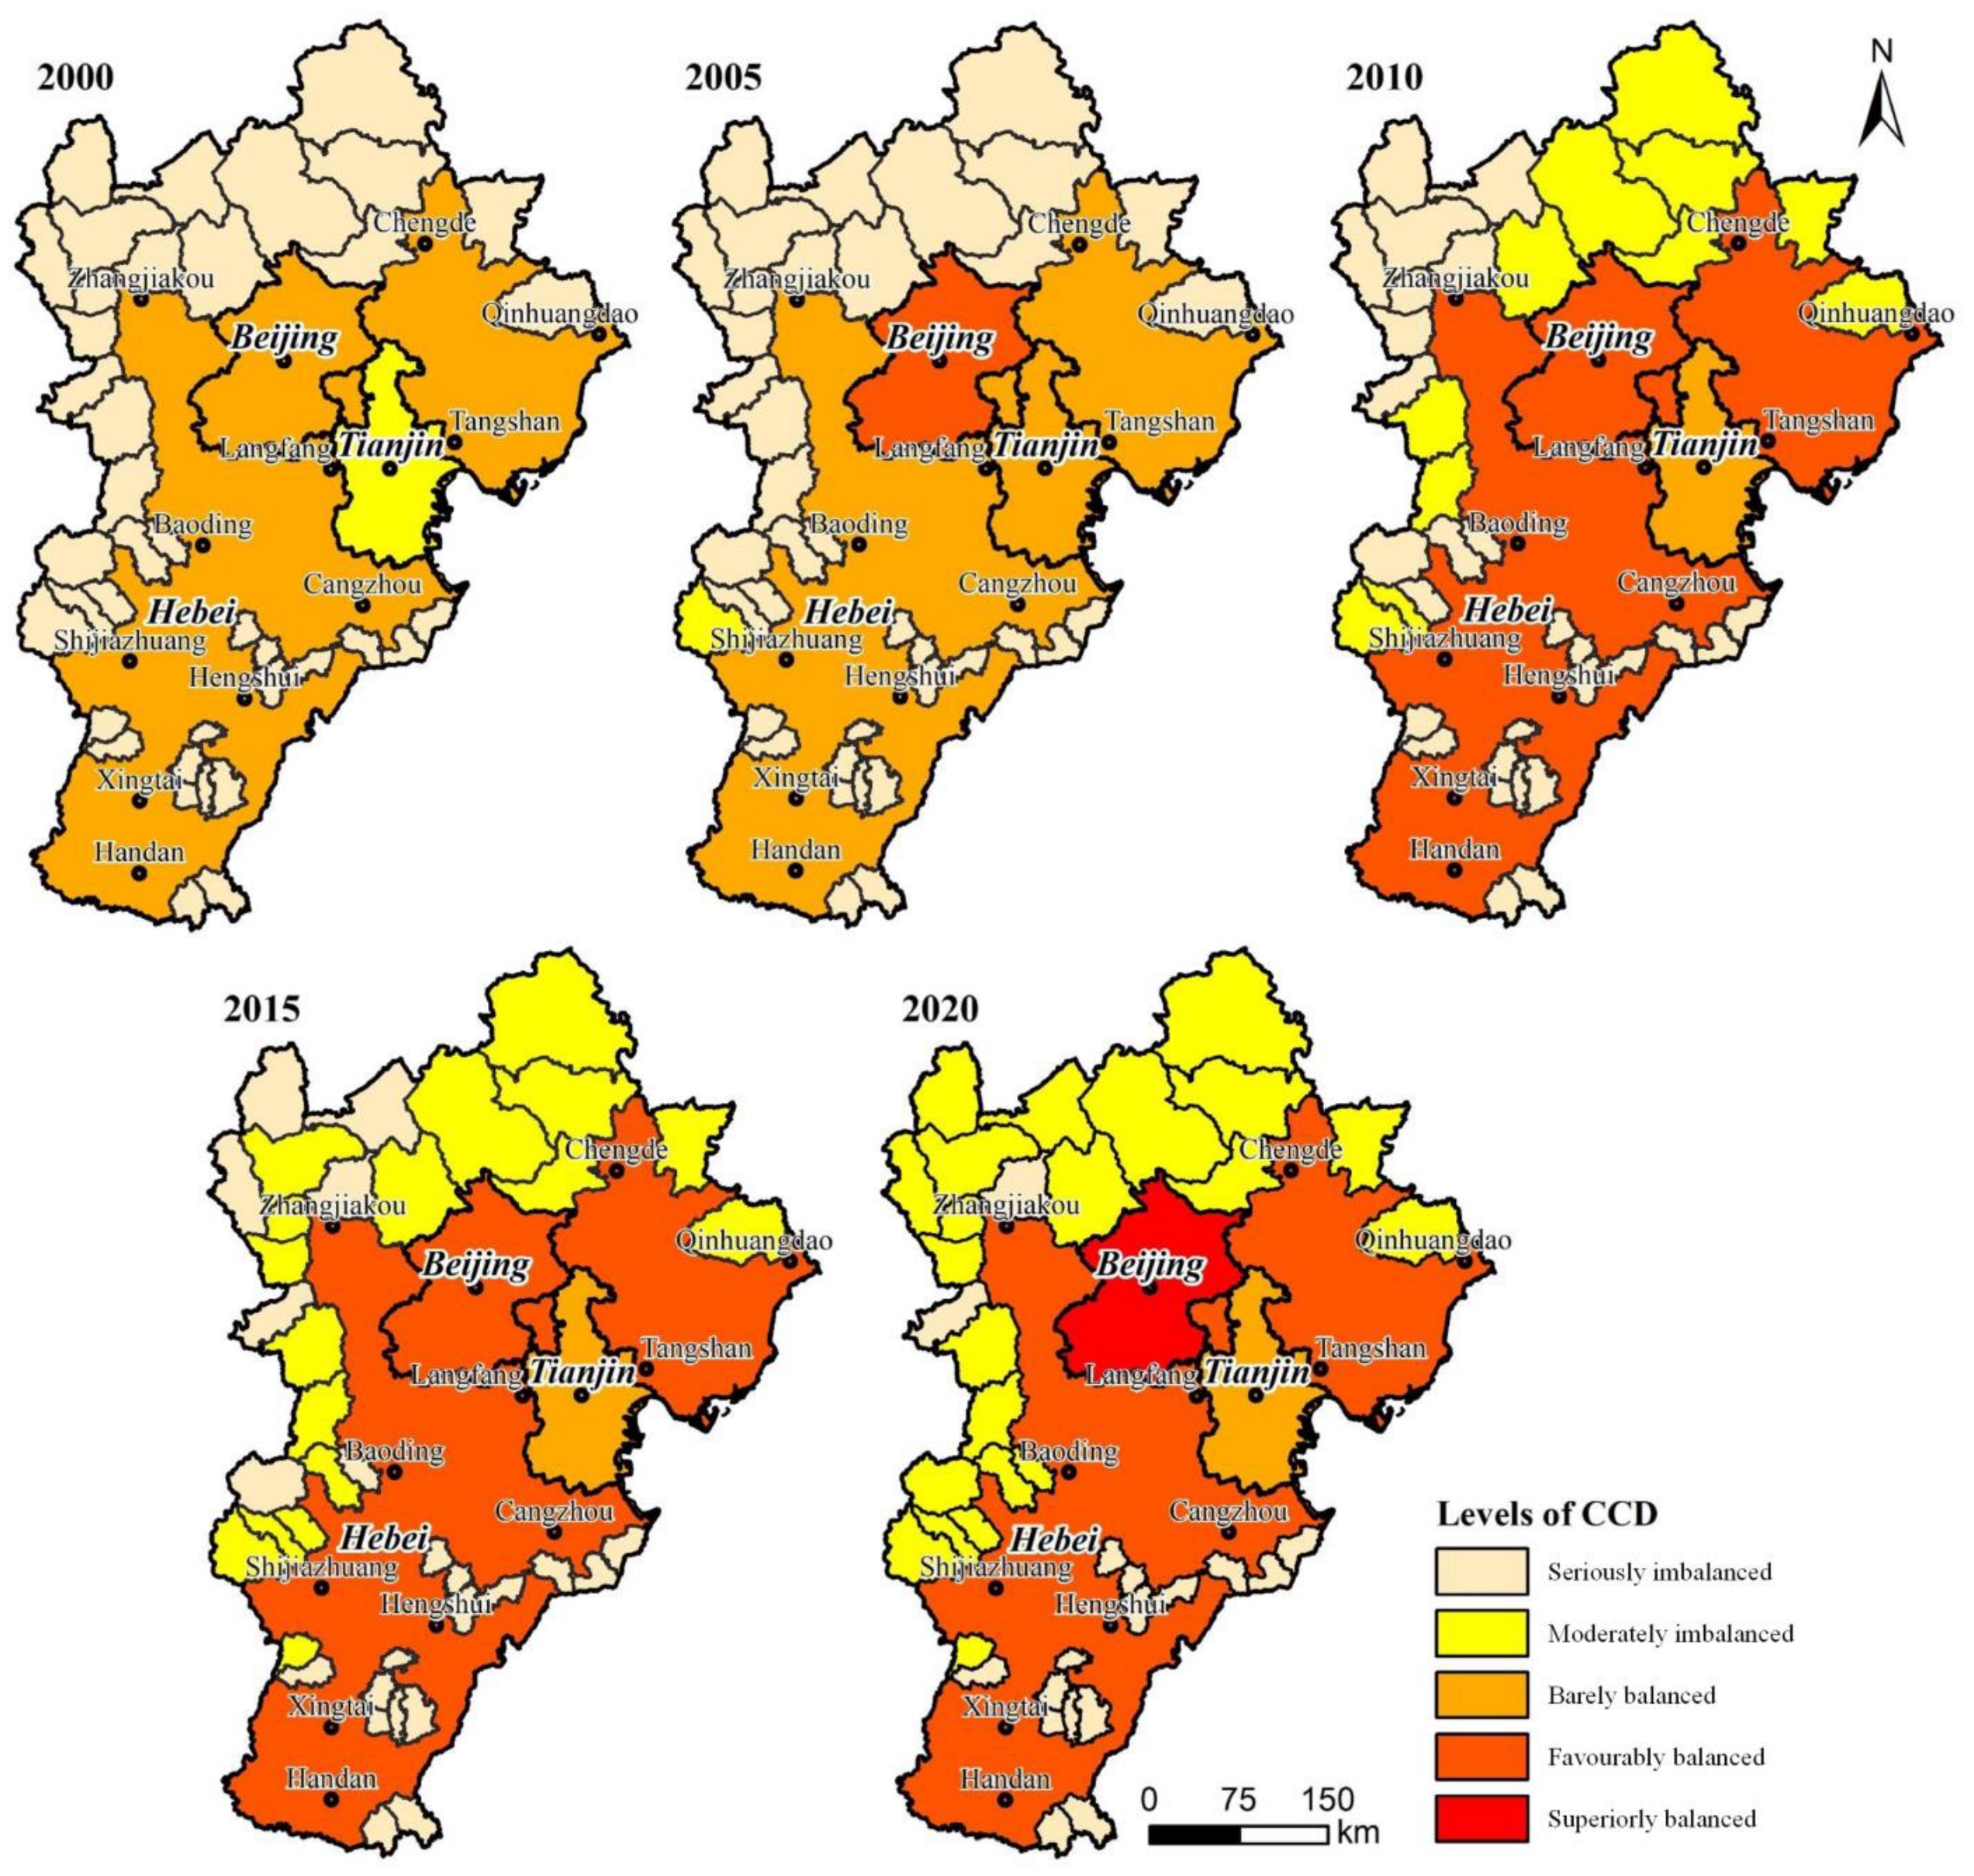
The gap in the level of regional coupled coordination gradually widened in terms of spatial distribution (Figure 6), growing gradually from a three-level gap in 2000 to a five-level gap in 2020. Beijing gradually increased in 2000–2005 and 2015–2020, changing from barely balanced to favourably balanced and then to superiorly balanced, realizing a high level of development. Tianjin changed from moderately imbalanced to barely balanced from 2000–2005. Hebei developed from barely balanced to favourably balanced in 2005–2010, and more than half of the number of PSCs changed from seriously imbalanced to moderately imbalanced in 2000–2020; only Pingshan County in 2000–2005 and Chongli, Longhua, Luanping, Pingquan, and Qinglong Manchu Autonomous County in 2005–2010 experienced an increase in the coupled coordination level. By 2015, the number of regions with rising coupled coordination levels in 2020 increased to 17 and 22, respectively, while the regions with no changes were concentrated in Cangzhou, Hengshui, Xingtai, and Handan and other southern Hebei regions.
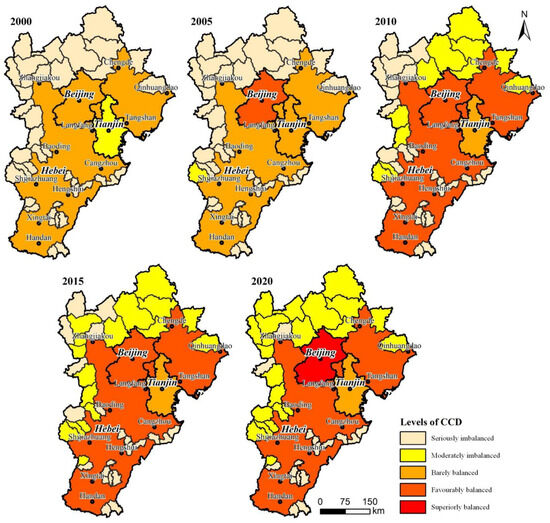
Figure 6.
Spatial distribution of coupled coordination levels for various areas of the BTH region from 2000 to 2020.
4. Discussion
This paper couples economic and EQ indicators, constructs a coupled evaluation index system based on the CCD model, and systematically analyses the spatiotemporal coordination of the RE and EQ in the BTH region from 2000–2020. The results of the study have important reference value for the realization of the coordinated development of the BTH region. The special, natural geographical pattern of the BTH region is a key factor in determining its economic spatial distribution. The central plain area, with fertile soil, high environmental carrying capacity, well-developed transportation, and a suitable living environment, is an area of concentrated population and high economic value. Beijing’s share in the total GDP of the Beijing–Tianjin–Hebei region has witnessed a surge of 7.28%, whereas other regions have experienced varying degrees of decline. The Yanshan Mountains in the north and the area along the Taihang Mountains in the west, with fragile ecological environments, complex terrain, and low development value, have resulted in slow urban construction and a poor economy. The decline in the share of Hebei Province’s GDP in the total value of the BTH region is related to the economic backwardness of the PSCs compared to neighbouring regions and the continued widening of the gap between the RE levels [43,65]. As a result, the Chinese government added 39 economically backwards counties surrounding Beijing and Tianjin to the list of key counties for national poverty alleviation and development in 2012, aiming to help them overcome economic difficulties through various poverty alleviation policies, such as relocation for poverty alleviation, photovoltaic poverty alleviation, and tourism poverty alleviation [19,66,67,68]. For example, during the thirteenth Five-Year Plan period, Hebei Province assisted 0.13 million poor families with food, housing, transportation, medical care, and schooling through the policy of relocation for poverty alleviation. In 2023, the government also proposed consolidating the results of poverty eradication by integrating relocation resettlement areas for poverty alleviation into the overall requirements of new urbanization. However, the PSCs are mostly located in deep mountainous areas with weak development bases, a long cycle of assistance measures [69], and challenges to enhancing economic development. The findings of this study reveal that the CCD in some PSCs has demonstrated a certain upward trend in recent years, primarily attributable to the deepened implementation of government poverty alleviation policies and the concerted efforts among various factors within the region. Nevertheless, we also observe significant disparities in the CCD among different PSCs, which may be related to factors such as resource endowments, economic foundations, and policy environments. In the future, it is imperative to further strengthen in-depth research on these influencing factors to formulate more precise and effective policies for poverty alleviation and sustainable development.
Ecosystem type has a strong influence on service functioning [70,71], and compared with other ecosystem types, high-quality ecosystems have relatively high ecosystem services per unit area and are the most sensitive to land-use changes [72]. The expansion of urban land has continuously occupied farmland and high-quality ecosystems, leading to a large decline in ecosystem services [32], which fits with the results of this paper in which ecosystem services decreased more in the municipal areas and coastal zones of the BTH region. The declining trends in ecosystem services in the southern and eastern regions of Hebei may be related to the relocation of a large number of highly polluting and energy-consuming enterprises from Beijing to Hebei since 2000 [73,74]. The NPP, soil conservation, and water conservation increased in the mountainous areas of northern Hebei and Beijing, and the amount of sand fixation significantly increased in the Zhangjiakou area. The main reason is that the government has invested large amounts of money in ecological management and ecological barrier construction, and it has successively implemented ecological restoration projects since 2000, including the “Beijing–Tianjin Sand 375 Source Control Project”, “Returning Farmland to Forest (Grass) Project”, and “Capital Water Resources Sustainable Utilization Project in the 21st Century”, which have resulted in the conversion of more farmland to forests or grasslands, the management of water pollution in watersheds, and the restriction of the heavy industrial sector. Related studies have also demonstrated that the Zhangjiakou and Chengde regions have relatively high amounts of various ecosystem services [75,76,77]. In summary, the EQ of the BTH region as a whole tended to improve from 2000 to 2020 under the combined effects of climate change and related ecological restoration projects, among which the contribution of the PSCs was more prominent, bearing nearly half of the increase in supply and regulating services; however, the area of high-quality ecosystems still exhibited a decreasing trend, accounting for one-fifth of the total decrease in the BTH region, and the area of urban ecosystems also increased by 19.98%, with the amount of regulating services showing a localized decreasing trend. The PSCs are located around megacities and still face the pressure of ecological environmental destruction despite the protection of various ecological policies.
This paper has explored the evolution of the CCD of the RE and EQ in the BTH region over the past 20 years and, based on an analysis of the CCD of each stage, further proposes policy suggestions, aiming to provide a reference for the coordinated development of the economy and ecology. At the beginning, the CCD of the RE and EQ in the BTH region was relatively low. By 2020, the overall CCD trended upwards through 2020, which corresponded to the findings of Chu et al. [78]. Economically developed regions such as Beijing have high requirements for the EQ and have the willingness and ability to invest in the management and restoration of the ecological environment, thus promoting the virtuous cycle of economy and ecology [79,80]. The RE development in Hebei Province is more concentrated in the eastern and southern regions, such as Tangshan and Shijiazhuang, which are dominated by heavy industry, while the provision of ecosystem services relies on northern regions, such as Chengde and Zhangjiakou, thus leading to a high CCD in Hebei Province as a whole. However, the CCD is low and varies among counties in the province. The PSCs are located in a national ecological protection zone where industrial development is constrained, and the imbalance between the ecology and economy reduces enthusiasm for ecological protection. Therefore, the government has also adopted strategic measures such as ecological compensation, but problems such as imperfect laws and regulations, insufficient supervision, lack of planning, and ambiguous compensation standards exist [81]. Some scholars have proposed that ecological compensation standards should be improved and revised by the fiscal revenues of local governments and the state of the ecological environment to promote the construction of a diversified ecological compensation mechanism and mobilize enthusiasm for local environmental governance and green development [82]. In addition to providing financial support, projects such as industrial transfer, technological support, talent introduction, and employment training should be introduced to improve the survival and development capacity of the population in poor areas [83]. Zhao et al. [84] reported that the CCD of the RE and EQ in Pingshan County has transformed from a low level to a stage of mutual inhibition, and it is more difficult to achieve better coupled coordination because the rapid development of a secondary industry has caused damage to the ecological environment, and ecological conditions and investment in ecology have constrained economic development. It can be argued that PSCs are more likely to fall into the “poverty trap”, leading to a vicious cycle between the RE and EQ [85].
In view of these findings, several policy recommendations are provided for the sustainable development of the BTH region: (1) Regional coordination mechanisms must be strengthened. To resolve the widening gap in the level of coordination between regions and to achieve coupled development, stronger regional governance mechanisms should be established to help better integrate economic and ecological policies and ensure uniform progress across the region. Harmonizing development policies in Beijing, Tianjin, and Hebei promotes equitable growth and ecological protection for coordinated development. (2) Integrated ecological and economic development must be promoted. With regard to the ecological lag, the integrated development of economic development and ecological protection should be strengthened. The implementation of green, sustainable, and eco-friendly policies should be encouraged [86,87]. (3) The continuation of the ecosystem compensation policy must be ensured. Given the pressures on high-quality ecosystems, there is an urgent need to continue implementing ecosystem compensation policies. Ongoing monitoring and adjustment should be strengthened [83]. (4) Location and ecological advantages to promote regional development to develop characteristic industries must be utilized. The Hebei PSC has good tourism resources, should fully utilize the advantages of location and other aspects, should focus on the development of Beijing, Tianjin, and other neighbouring city tourism markets, should vigorously develop ecotourism and leisure and vacation tours, should cultivate personalized and differentiated tourism products, and should form a combination of point and surface tourism product systems. The Hebei PSC is a traditional agricultural area, and the Beijing–Tianjin area should focus on market demand and vigorously develop high-quality, high-efficiency, and ecologically safe modern agriculture. The focus should be on enhancing the production capacity of green and organic agricultural products, accelerating the development of the agricultural product processing industry, and building an important agricultural and sideline product supply base in the Beijing–Tianjin area. Implementing these policy recommendations will require the concerted efforts of all stakeholders.
Due to the limitations of data collection, the selection of indicators for the integrated systematic evaluation of the RE and EQ was not sufficiently comprehensive. In addition, the driving factors affecting the coupled coordination relationship were not analysed and need to be further explored. Thus, the provision of targeted recommendations for decision-making can be strengthened to achieve sustainable development.
5. Conclusions
The different functional positions within the urban agglomerations lead to an imbalance between the ecology and economy, exacerbating regional conflicts and affecting the coordinated development of the BTH region. Based on the CCD model, this paper has developed an evaluative framework and quantifies the spatiotemporal coupled coordination of the RE and EQ in the BTH region from 2000 to 2020. The main objectives was to reveal the relationship between the RE and EQ, expecting to provide a scientific basis for the coordinated development of the BTH region. The results show that in 2020, the GDP of the PSCs accounted for a small proportion of that of the BTH region, while their areas of high-quality ecosystems, ecosystem provisioning, and regulating services accounted for a larger proportion. From 2000 to 2020, the total GDP of the PSCs increased, but the proportion of the total change was small, while the area of high-quality ecosystems decreased. This suggests that economic growth was comparatively sluggish, coupled with a significant strain on the ecosystem area. Furthermore, the amount of ecosystem provisioning and regulating services both increased, reflecting a certain improvement in the EQ. The CCD of the RE and EQ in the BTH region showed a tendency to increase, and the type of development shifted from the economic lag type to the ecological lag type. This shows that the integration of economic development and the ecological environment has gradually increased. However, it is notable that the gap between the coupling and coordination levels in various regions has gradually widened, and the PSCs have been in a stage of dysfunctional coupling and coordination development. Deepening the understanding of the spatiotemporal coupling relationship between the RE and EQ and adopting appropriate development policies is of great significance for achieving the coordinated and integrated development of the BTH region.
Author Contributions
Conceptualization, R.N. and X.X.; formal analysis, R.N.; data curation, R.N.; writing—original draft preparation, R.N.; writing—review and editing, X.X. and S.W.; supervision, X.X. and S.W. All authors have read and agreed to the published version of the manuscript.
Funding
This research was funded by the National Key R&D Program of China (Grant number 2021YFD1500101).
Data Availability Statement
Restrictions apply to the availability of these data. Data were obtained from the Resource and Environmental Science Data Platform and are available (from https://www.resdc.cn) with the permission of the Resource and Environmental Science Data Platform.
Acknowledgments
The authors greatly appreciate the reviewers and the editors for their valuable and constructive comments and suggestions that improved the manuscript. In addition, we would like to express our gratitude to Shuhui Qi from Beijing 21st Century School for her assistance in collecting materials and writing English.
Conflicts of Interest
The authors declare no conflicts of interest.
References
- Salvati, L.; Carlucci, M. Zero Net Land Degradation in Italy: The role of socioeconomic and agro-forest factors. J. Environ. Manag. 2014, 145, 299–306. [Google Scholar] [CrossRef] [PubMed]
- Wang, S.; Zhang, X.; Wu, T.; Yang, Y. The evolution of landscape ecological security in Beijing under the influence of different policies in recent decades. Sci. Total Environ. 2019, 646, 49–57. [Google Scholar] [CrossRef]
- Li, J.; Ren, Z.; Zhou, Z. Quantitative analysis of the dynamic change and spatial differences of the ecological security: A case study of Loess Plateau in northern Shaanxi Province. J. Geogr. Sci. 2006, 16, 251–256. [Google Scholar] [CrossRef]
- Yao, L.; Ma, R.; Liao, Z.; Du, S.; Jin, M.; Ren, P. Optimization and simulation of tourist shunt scheme: A case of Jiuzhai Valley. Chaos Solitons Fractals 2016, 89, 455–464. [Google Scholar] [CrossRef]
- Walker, K.; Ni, N.; Huo, W. Is the Red Dragon Green? An Examination of the Antecedents and Consequences of Environmental Proactivity in China. J. Bus. Ethics 2014, 125, 27–43. [Google Scholar] [CrossRef]
- Deng, Z.; Song, S.; Jiang, N.; Pang, R. Sustainable development in China? A nonparametric decomposition of economic growth. China Econ. Rev. 2023, 81, 102041. [Google Scholar] [CrossRef]
- Liu, W.; Jiao, F.; Ren, L.; Xu, X.; Wang, J.; Wang, X. Coupling coordination relationship between urbanization and atmospheric environment security in Jinan City. J. Clean. Prod. 2018, 204, 1–11. [Google Scholar] [CrossRef]
- de Oliveira, J.A.P.; Doll, C.N.H.; Balaban, O.; Jiang, P.; Dreyfus, M.; Suwa, A.; Moreno-Penaranda, R.; Dirgahayani, P. Green economy and governance in cities: Assessing good governance in key urban economic processes. J. Clean. Prod. 2013, 58, 138–152. [Google Scholar] [CrossRef]
- Shen, L.; Shu, T.; Liao, X.; Yang, N.; Ren, Y.; Zhu, M.; Cheng, G.; Wang, J. A new method to evaluate urban resources environment carrying capacity from the load-and-carrier perspective. Resour. Conserv. Recycl. 2020, 154, 104616. [Google Scholar] [CrossRef]
- Zhang, D.; Huang, Q.; He, C.; Wu, J. Impacts of urban expansion on ecosystem services in the Beijing-Tianjin-Hebei urban agglomeration, China: A scenario analysis based on the Shared Socioeconomic Pathways. Resour. Conserv. Recycl. 2017, 125, 115–130. [Google Scholar] [CrossRef]
- Fang, C.; Zhou, C.; Gu, C.; Chen, L.; Li, S. A proposal for the theoretical analysis of the interactive coupled effects between urbanization and the eco-environment in mega-urban agglomerations. J. Geogr. Sci. 2017, 27, 1431–1449. [Google Scholar] [CrossRef]
- Liu, L.; Caloz, C.; Chang, C.C.; Itoh, T. Forward coupling phenomena between artificial left-handed transmission lines. J. Appl. Phys. 2002, 92, 5560–5565. [Google Scholar] [CrossRef]
- Norgaard, R.B. Economic indicators of resource scarcity: A critical essay. J. Environ. Econ. Manag. 1990, 19, 19–25. [Google Scholar] [CrossRef]
- Fan, Y.; Qiao, Q.; Fang, L.; Yao, Y. Emergy analysis on industrial symbiosis of an industrial park-A case study of Hefei economic and technological development area. J. Clean. Prod. 2017, 141, 791–798. [Google Scholar] [CrossRef]
- Shi, X.; Yang, J. A material flow-based approach for diagnosing urban ecosystem health. J. Clean. Prod. 2014, 64, 437–446. [Google Scholar] [CrossRef]
- Fang, C.; Liu, H.; Li, G. International progress and evaluation on interactive coupling effects between urbanization and the eco-environment. J. Geogr. Sci. 2016, 26, 1081–1116. [Google Scholar] [CrossRef]
- Guo, L. Coupling Coordination Degree between New Urbanization and Eco-Environment in Shaanxi, China, and Its Influencing Factors. Discret. Dyn. Nat. Soc. 2021, 2021, 1555362. [Google Scholar] [CrossRef]
- Yang, Z.; Zhan, J.; Wang, C.; Twumasi-Ankrah, M.J. Coupling coordination analysis and spatiotemporal heterogeneity between sustainable development and ecosystem services in Shanxi Province, China. Sci. Total Environ. 2022, 836, 155625. [Google Scholar] [CrossRef]
- Zhang, Z.; Li, Y. Coupling coordination and spatiotemporal dynamic evolution between urbanization and geological hazards?A case study from China. Sci. Total Environ. 2020, 728, 138825. [Google Scholar] [CrossRef] [PubMed]
- Cai, J.; Li, X.; Liu, L.; Chen, Y.; Wang, X.; Lu, S. Coupling and coordinated development of new urbanization and agro-ecological environment in China. Sci. Total Environ. 2021, 776, 145837. [Google Scholar] [CrossRef] [PubMed]
- Cheng, J.; Zhang, X.; Gao, Q. Analysis of the spatio-temporal changes and driving factors of the marine economic-ecological-social coupling coordination: A case study of 11 coastal regions in China. Ecol. Indic. 2023, 153, 110392. [Google Scholar] [CrossRef]
- He, S.; Shao, X. Spatial Clustering and Coupling Coordination of Population-Land-Economic Urbanization in Beijing-Tianjin-Hebei Region. Econ. Geogr. 2018, 38, 95–102. [Google Scholar]
- Li, J.; Sun, W.; Li, M.; Meng, L. Coupling coordination degree of production, living and ecological spaces and its influencing factors in the Yellow River Basin. J. Clean. Prod. 2021, 298, 126803. [Google Scholar] [CrossRef]
- Wang, Y.-h.; Li, J.-y. Coupling coordination evaluation method between eco-environment quality and economic development level in contiguous special poverty-stricken areas of China. Ying Yong Sheng Tai Xue Bao = J. Appl. Ecol. 2015, 26, 1519–1530. [Google Scholar]
- Xu, L.; Chen, S.S. Coupling coordination degree between social-economic development and water environment: A case study of Taihu lake basin, China. Ecol. Indic. 2023, 148, 110118. [Google Scholar] [CrossRef]
- Fan, Y.; Fang, C.; Zhang, Q. Coupling coordinated development between social economy and ecological environment in Chinese provincial capital cities-assessment and policy implications. J. Clean. Prod. 2019, 229, 289–298. [Google Scholar] [CrossRef]
- Zhu, X.; Xue, L. Changes of ecological service value and its coupling with economic development in Guanzhong region. Chin. J. Ecol. 2022, 41, 769–776. [Google Scholar]
- Chen, J.; Zhang, W.; Song, L.; Wang, Y. The coupling effect between economic development and the urban ecological environment in Shanghai port. Sci. Total Environ. 2022, 841, 156734. [Google Scholar] [CrossRef] [PubMed]
- Liao, M.L.; Chen, Y.; Wang, Y.J.; Lin, M.S. Study on the coupling and coordination degree of high-quality economic development and ecological environmet in beijing-tianjin-hebei region. Appl. Ecol. Environ. Res. 2019, 17, 11069–11083. [Google Scholar] [CrossRef]
- Yang, Y.; Li, X.; Dong, W.; Poon, P.H.J.; Hong, H.; He, Z.; Liu, Y. Assessing China’s human-environment relationship. J. Geogr. Sci. 2019, 29, 1261–1282. [Google Scholar] [CrossRef]
- Fang, C.; Wang, Z.; Xu, G. Spatial-temporal characteristics of PM2.5 in China: A city-level perspective analysis. J. Geogr. Sci. 2016, 26, 1519–1532. [Google Scholar] [CrossRef]
- Li, Q.; Li, W.; Wang, S.; Wang, J. Assessing heterogeneity of trade-offs/synergies and values among ecosystem services in Beijing-Tianjin-Hebei urban agglomeration. Ecol. Indic. 2022, 140, 109026. [Google Scholar] [CrossRef]
- Liang, L.; Wang, Z.; Li, J. The effect of urbanization on environmental pollution in rapidly developing urban agglomerations. J. Clean. Prod. 2019, 237, 117649. [Google Scholar] [CrossRef]
- Wu, A.; Zhang, J.; Zhao, Y.; Shen, H.; Guo, X. Simulation and Optimization of Supply and Demand Pattern of Multiobjective Ecosystem Services-A Case Study of the Beijing-Tianjin-Hebei Region. Sustainability 2022, 14, 2658. [Google Scholar] [CrossRef]
- Liao, W.; Yu, J.; Yuan, R. Coupling synergy between poverty alleviation and rural revitalization: A comparison between poverty alleviation counties (cities) based on different time series. China Popul. Resour. Environ. 2020, 30, 132–142. [Google Scholar]
- Liu, Y.S.; Liu, J.L.; Zhou, Y. Spatio-temporal patterns of rural poverty in China and targeted poverty alleviation strategies. J. Rural. Stud. 2017, 52, 66–75. [Google Scholar] [CrossRef]
- He, J.; Li, T.R.; Chen, L.; Gao, Y.W. The impact of poverty alleviation policy on the industrial structure: Evidence from the Qinba Mountain contiguous poverty-stricken areas. Heliyon 2024, 10, e30151. [Google Scholar] [CrossRef]
- Wu, M.Z.; Zhang, P.L. Poverty alleviation and pollution reduction: Evidence from the poverty hat removal program in China. Struct. Change Econ. Dyn. 2024, 70, 56–76. [Google Scholar] [CrossRef]
- Duan, W.Q.; Jiang, M.M.; Qi, J.H. Agricultural certification, market access and rural economic growth: Evidence from poverty-stricken counties in China. Econ. Anal. Policy 2024, 81, 99–114. [Google Scholar] [CrossRef]
- Ge, Y.; Hu, S.; Song, Y.Z.; Zheng, H.; Liu, Y.S.; Ye, X.Y.; Ma, T.; Liu, M.X.; Zhou, C.H. Sustainable poverty reduction models for the coordinated development of the social economy and environment in China. Sci. Bull. 2023, 68, 2236–2246. [Google Scholar] [CrossRef]
- Meng, G.; Wang, K.Y.; Wang, F.Y.; Dong, Y.J. Analysis of the tourism-economy-ecology coupling coordination and high-quality development path in karst Guizhou Province, China. Ecol. Indic. 2023, 154, 110858. [Google Scholar] [CrossRef]
- Chen, Q.W.; Lu, S.X.; Xiong, K.N.; Zhao, R. Coupling analysis on ecological environment fragility and poverty in South China Karst. Environ. Res. 2021, 201, 111650. [Google Scholar] [CrossRef]
- Liu, H.; Ma, L.; Li, G. Spatial-temporal evolution pattern of unbalanced economic development in Beijing-Tianjin-Hebei region since the 1990s. Geogr. Res. 2016, 35, 471–481. [Google Scholar]
- Qi, Y.; Yang, Y.; Jin, F. China’s economic development stage and its spatio-temporal evolution: A prefectural-level analysis. J. Geogr. Sci. 2013, 23, 297–314. [Google Scholar] [CrossRef]
- Liu, J.; Kuang, W.; Zhang, Z.; Xu, X.; Qin, Y.; Ning, J.; Zhou, W.; Zhang, S.; Li, R.; Yan, C.; et al. Spatiotemporal characteristics, patterns, and causes of land-use changes in China since the late 1980s. J. Geogr. Sci. 2014, 24, 195–210. [Google Scholar] [CrossRef]
- Zhang, Y.; Yu, G.; Yang, J.; Wimberly, M.C.; Zhang, X.; Tao, J.; Jiang, Y.; Zhu, J. Climate-driven global changes in carbon use efficiency. Glob. Ecol. Biogeogr. 2014, 23, 144–155. [Google Scholar] [CrossRef]
- Zhao, M.S.; Heinsch, F.A.; Nemani, R.R.; Running, S.W. Improvements of the MODIS terrestrial gross and net primary production global data set. Remote Sens. Environ. 2005, 95, 164–176. [Google Scholar] [CrossRef]
- Zhen, L.; Hu, Y.; Wei, Y.; Luo, Q.; Han, Y. Trend of ecological degradation and restoration technology requirement in typical ecological vulnerable regions. Resour. Sci. 2019, 41, 63–74. [Google Scholar]
- Cleland, E. Biodiversity and ecosystem stability. Nat. Educ. Knowl. 2012, 3, 14. [Google Scholar]
- Costanza, R.; Mageau, M. What is a healthy ecosystem? Aquat. Ecol. 1999, 33, 105–115. [Google Scholar] [CrossRef]
- Zhao, T.; Ou, Y.; Zheng, H.; Wang, X.; Miao, H. Forest ecosystem services and their valuation in China. J. Nat. Resour. 2004, 19, 480–491. [Google Scholar]
- Huang, L.; Cao, W.; Xu, X.; Fan, J.; Wang, J. Linking the benefits of ecosystem services to sustainable spatial planning of ecological conservation strategies. J. Environ. Manag. 2018, 222, 385–395. [Google Scholar] [CrossRef]
- Zhang, W.; Xie, Y.; Liu, B. Rainfall Erosivity Estimation Using Daily Rainfall Amounts. Sci. Geogr. Sin. 2002, 22, 705–711. [Google Scholar]
- Wischmeier, W.H.; Johnson, C.B.; Cross, B.V. Soil erodibility nomograph for farmland and construction sites. J. Soil. Water Conserv. 1971, 26, 189–193. [Google Scholar]
- Liu, B.Y.; Nearing, M.A.; Risse, L.M. Slope gradient effects on soil loss for steep slopes. Trans. Asae 1994, 37, 1835–1840. [Google Scholar] [CrossRef]
- McCool, D.K.; Brown, L.C.; Foster, G.R.; Mutchler, C.K.; Meyer, L.D. Revised slope steepness factor for the universal soil loss equation. Trans. Asae 1987, 30, 1387–1396. [Google Scholar] [CrossRef]
- Cai, C.; Ding, S.; Shi, Z.; Huang, L.; Zhang, G. Study of Applying USLE and Geographical Information System IDRISI to Predict Soil Erosion in Small Watershed. J. Soil. Water Conserv. 2000, 14, 19–24. [Google Scholar]
- Cao, W.; Wu, D.; Huang, L.; Liu, L. Spatial and temporal variations and significance identification of ecosystem services in the Sanjiangyuan National Park, China. Sci. Rep. 2020, 10, 6151. [Google Scholar] [CrossRef]
- Wang, S.; Shi, H.; Xu, X.; Huang, L.; Gu, Q.; Liu, H. County zoning and optimization paths for trade-offs and synergies of ecosystem services in Northeast China. Ecol. Indic. 2024, 164, 112044. [Google Scholar] [CrossRef]
- Zhang, H.; Fan, J.; Cao, W.; Harris, W.; Li, Y.; Chi, W.; Wang, S. Response of wind erosion dynamics to climate change and human activity in Inner Mongolia, China during 1990 to 2015. Sci. Total Environ. 2018, 639, 1038–1050. [Google Scholar] [CrossRef] [PubMed]
- Liu, F.; Wang, C.; Luo, M.; Zhou, S.; Liu, C. An investigation of the coupling coordination of a regional agricultural economics-ecology-society composite based on a data-driven approach. Ecol. Indic. 2022, 143, 109363. [Google Scholar] [CrossRef]
- Zhang, Y.; Zhang, Y.; Zhang, H.; Zhang, Y. Evaluation on new first-tier smart cities in China based on entropy method and TOPSIS. Ecol. Indic. 2022, 145, 109616. [Google Scholar] [CrossRef]
- Zhang, H.; Gu, C.L.; Gu, L.W.; Zhang, Y. The evaluation of tourism destination competitiveness by TOPSIS & information entropy-A case in the Yangtze River Delta of China. Tour. Manag. 2011, 32, 443–451. [Google Scholar] [CrossRef]
- Zou, C.; Zhu, J.; Lou, K.; Yang, L. Coupling coordination and spatiotemporal heterogeneity between urbanization and ecological environment in Shaanxi Province, China. Ecol. Indic. 2022, 141, 109152. [Google Scholar] [CrossRef]
- Deng, J.; Chen, T.; Zhang, Y. Effect of Collaborative Innovation on High-Quality Economic Development in Beijing-Tianjin-Hebei Urban Agglomeration-An Empirical Analysis Based on the Spatial Durbin Model. Mathematics 2023, 11, 1909. [Google Scholar] [CrossRef]
- An, H.-M.; Xiao, C.-D.; Tong, Y.; Fan, J. Ice-and-snow tourism and its sustainable development in China: A new perspective of poverty alleviation. Adv. Clim. Change Res. 2021, 12, 881–893. [Google Scholar] [CrossRef]
- He, J.; Ren, F.; Weibel, R.; Fu, C. The effect of large scale photovoltaic-based projects on poverty reduction: Empirical evidence from China. Renew. Energy 2023, 218, 119294. [Google Scholar] [CrossRef]
- Leng, G.-X.; Feng, X.-L.; Qiu, H.-G. Income effects of poverty alleviation relocation program on rural farmers in China. J. Integr. Agric. 2021, 20, 891–904. [Google Scholar] [CrossRef]
- Zhou, L.; Xiong, L.-Y. Natural topographic controls on the spatial distribution of poverty-stricken counties in China. Appl. Geogr. 2018, 90, 282–292. [Google Scholar] [CrossRef]
- Feng, Z.; Jin, X.; Chen, T.; Wu, J. Understanding trade-offs and synergies of ecosystem services to support the decision-making in the Beijing?Tianjin?Hebei region. Land. Use Policy 2021, 106, 105446. [Google Scholar] [CrossRef]
- Wang, H.; Liu, L.; Yin, L.; Shen, J.; Li, S. Exploring the complex relationships and drivers of ecosystem services across different geomorphological types in the Beijing-Tianjin-Hebei region, China (2000–2018). Ecol. Indic. 2021, 121, 107116. [Google Scholar] [CrossRef]
- Sannigrahi, S.; Bhatt, S.; Rahmat, S.; Paul, S.K.; Sen, S. Estimating global ecosystem service values and its response to land surface dynamics during 1995–2015. J. Environ. Manag. 2018, 223, 115–131. [Google Scholar] [CrossRef] [PubMed]
- Luo, Y.; Zhou, D.; Tian, Y.; Jiang, G. Spatial and temporal characteristics of different types of pollution-intensive industries in the Beijing-Tianjin-Hebei region in China by using land use data. J. Clean. Prod. 2021, 329, 129601. [Google Scholar] [CrossRef]
- Zhang, Z.; Li, N.; Wang, X.; Liu, F.; Yang, L. A Comparative Study of Urban Expansion in Beijing, Tianjin and Tangshan from the 1970s to 2013. Remote Sens. 2016, 8, 496. [Google Scholar] [CrossRef]
- Guo, X.; Fang, C.; Mu, X.; Chen, D. Coupling and coordination analysis of urbanization and ecosystem service value in Beijing-Tianjin-Hebei urban agglomeration. Ecol. Indic. 2022, 137, 108782. [Google Scholar] [CrossRef]
- Li, Q.; Zhang, B.; Xie, G.; Wang, S. Identification of Key Ecosystem Services That Can Be Delivered by Water or Wind from Zhangjiakou-Chengde Region to Beijing. J. Resour. Ecol. 2018, 9, 632–641. [Google Scholar]
- Zhang, B.; Li, Q.; Wang, S.; Xie, G. Spatial-temporal changes and regional differences of the sandfixing service in the Beijing-Tianjin sandstorm source region. J. Nat. Resour. 2019, 34, 1041–1053. [Google Scholar]
- Chu, X.; Deng, X.; Jin, G.; Wang, Z.; Li, Z. Ecological security assessment based on ecological footprint approach in Beijing-Tianjin-Hebei region, China. Phys. Chem. Earth 2017, 101, 43–51. [Google Scholar] [CrossRef]
- Fu, L.; Liu, B.; Zhu, Z.; Cao, J.; Sun, C.; Yu, Z. Analysis of the coupling coordinated development and evolutionary trend of digital economy and ecological environment. Front. Environ. Sci. 2022, 10, 1006354. [Google Scholar] [CrossRef]
- Wang, H.; Xu, Y.; Li, C. Coupling coordination and spatio-temporal pattern evolution between ecological protection and high-quality development in the Yellow River Basin. Heliyon 2023, 9, e21089. [Google Scholar] [CrossRef]
- Zhou, Y.; Luo, H.; Tang, J.; Zhang, L.; Zhu, H.; Sun, S. Study on ecological environment damage compensation in China. J. Nat. Conserv. 2023, 76, 126503. [Google Scholar] [CrossRef]
- Yang, Q. Do vertical ecological compensation policies promote green economic development: A case study of the transfer payments policy for China’s National Key Ecological Function Zones. Econ. Syst. 2023, 47, 101125. [Google Scholar] [CrossRef]
- Du, H.; Zhao, L.; Zhang, P.; Li, J.; Yu, S. Ecological compensation in the Beijing-Tianjin-Hebei region based on ecosystem services flow. J. Environ. Manag. 2023, 331, 117230. [Google Scholar] [CrossRef] [PubMed]
- Zhao, X.; Liu, Z.; Zhao, H. Study on the Mechanism of Economic Development and Eco-environment Coupling in Mountainous Counties-Taking Pingshan County of Hebei Province as an Example. Res. Soil. Water Conserv. 2014, 21, 176–181. [Google Scholar]
- Li, N.; Yuan, R.; Zheng, S. Trade-offs between poverty alleviation and household energy intensity in China. Environ. Impact Assess. Rev. 2023, 98, 106957. [Google Scholar] [CrossRef]
- Li, S.; Yang, H.; Liu, J.; Lei, G. Towards Ecological-Economic Integrity in the Jing-Jin-Ji Regional Development in China. Water-Sui 2018, 10, 1653. [Google Scholar] [CrossRef]
- Wang, X.; Huang, Y.; Wu, W.; Cifuentes-Faura, J. Building a greener future: Understanding the spatial effects of eco-economic coordination in Beijing-Tianjin-Hebei regions. Ecol. Indic. 2023, 156, 111125. [Google Scholar] [CrossRef]


Disclaimer/Publisher’s Note: The statements, opinions and data contained in all publications are solely those of the individual author(s) and contributor(s) and not of MDPI and/or the editor(s). MDPI and/or the editor(s) disclaim responsibility for any injury to people or property resulting from any ideas, methods, instructions or products referred to in the content. |
© 2024 by the authors. Licensee MDPI, Basel, Switzerland. This article is an open access article distributed under the terms and conditions of the Creative Commons Attribution (CC BY) license (https://creativecommons.org/licenses/by/4.0/).