Abstract
Native fescue grassland degradation and reductions in plant species diversity due to smooth brome (Bromus inermis Leyss.) invasion and dominance have far ranging consequences for both human and ecological systems. A study was undertaken to reduce smooth brome which was invading foothills fescue grassland in Canada and displacing native species. Sheep and cattle grazing, mowing, glyphosate, and burning were applied to control smooth brome-dominant grasslands over three growing seasons. Defoliation (5 to 10 cm, 2 to 4 times) did not reduce smooth brome tiller density, etiolated regrowth, or total non-structural carbohydrates; however, the three heaviest defoliation treatments (sheep 3×, cattle 3×, mowing 4×) reduced smooth brome composition by year 3. Repeated glyphosate wicking (1× year 1, 2× year 2) was the most effective treatment and reduced smooth brome tiller density by 50% by year 3. Early-spring burning, as smooth brome began to grow, stressed the plants and reduced tiller density. Kentucky bluegrass (Poa pratensis L.), the subdominant species, increased in all treatments except the reference; thus, reducing smooth brome may result in another undesirable species becoming dominant.
1. Introduction
Native fescue grasslands, once dominant in the northern Great Plains of North America, are becoming rare as 90% of the fescue grasslands have been converted to agricultural land, urbanization, or energy development (oil and gas, well sites, pipelines, and associated roads), and the remaining fragments have been significantly modified by grazing, haying, or non-native species invasion [,,]. Fescue grasslands once found in the Canadian prairies including Manitoba, Saskatchewan, and Alberta now persist as <5% of the 255,000 km2 of historic range and are designated a rapidly diminishing natural resource [,]). Fire suppression and climate change further threaten fescue grassland integrity by invasion of trees, shrubs, and introduced competitive non-native or exotic grasses and forbs [,,]. The loss of habitat has threatened several plant and animal species, and some have become extinct; thus, public land and conservation managers are concerned with continued development that threatens prairie remnants [,,]. Maintaining the quality of the remaining prairie, continuing to provide important habitats for wildlife, and restoring degraded grasslands have become important conservation issues.
Smooth brome (Bromus inermis Leyss.) of the family Poaceae is a non-native plant species that threatens the integrity of fescue prairie remnants. It is one of the most aggressive non-native grasses invading native grassland, replacing key indigenous species and reducing plant species diversity [,,,]. Smooth brome was introduced to North America in around 1880 from Hungary and Russia as a forage species [,]. Smooth brome has been used for soil stabilization and retention purposes such as erosion control, open-pit mine reclamation, phytoremediation, and areas affected by severe forest fires []. The competitiveness of this species is suggested by its early-spring growth, high productivity, aggressive rhizome and root system, and prolific seed production [,]. Palit and DeKeyser [] reported that greater competitiveness of smooth brome can be partially attributed to its ability to alter soil and hydrological properties of a site. Wilson [] reported smooth brome to be the most competitive of several introduced species in a mixed prairie in Manitoba and that seeding smooth brome in disturbed areas suppressed native species. Smooth brome, when grown with intermediate wheatgrass (Thinopyrum intermedium (Host) Barkworth & D.R. Dewey), largely replaced the wheatgrass after ten years and provided excellent weed control []. Lindquist et al. [] concluded that the greater competitiveness of smooth brome prevented spotted knapweed (Centaurea maculosa Lam.) from becoming established on roadsides dominated by smooth brome, whereas native grasslands dominated by bluebunch wheatgrass (Pseudoroegneria spicata (Pursh) Á. Löve) or Idaho fescue (Festuca idahoensis Elmer.) were often invaded.
Control measures such as mowing, grazing, herbicide application, and burning have been employed to control smooth brome in native grasslands [,,,]. Smooth brome typically declines in permanent pastures in the prairie parklands [], indicating that the species may be reduced by frequent severe defoliation. In Saskatchewan, smooth brome ground cover decreased as grazing intensity increased. Smooth brome had relatively poor persistence under three and four cuts in Minnesota and Wisconsin [,]. Damage was greatest when plants were cut at boot or early boot [] or pre-anthesis []. Defoliation of smooth brome at elongation or early boot when carbohydrate reserves are lowest removes shoot apices and delays regrowth because it must be initiated from below-ground buds []. Glyphosate wicking of smooth brome at elongation, when height difference with native species was maximized, reduced brome tiller density by 45% in the first year in plains rough fescue grasslands in Saskatchewan and minimized impact on native species []. Bahm et al. [] concluded that herbicides were effective at reducing cover of smooth brome and could be incorporated with other management strategies. Spraying an old smooth brome-crested wheatgrass field with glyphosate dramatically increased germination of seeded mixed-grass prairie species []. Prescribed spring burning prior to growth increased glyphosate effectiveness by removing litter and stimulating early growth, thereby increasing the height differential, the area of herbicide application, and possibly the rate of translocation; smooth brome tillers were almost entirely eliminated []. Fire is considered as an effective management tool to combat smooth brome. Bahm et al. [] found that prescribed spring burning resulted in a 50% decrease in tiller density in smooth brome.
The objective of this study was to determine the effect of combinations of grazing, mowing, glyphosate wicking, and prescribed spring burning on smooth brome in foothills fescue grasslands as assessed by tiller density, plant species composition, etiolated regrowth, and carbohydrate reserves. While not the original intent of this study, the effects of these management treatments on Kentucky bluegrass, the subdominant species at most sites, was also assessed due to interaction between species.
2. Materials and Methods
2.1. Site Description and History
Research was conducted at the Ann and Sandy Cross Conservation Area, approximately 3 km southwest of Calgary, Alberta. The conservation area is located in the Rocky Mountain Foothills of the Aspen Parkland Ecoregion []. July is the warmest month with a mean temperature of 13.4 to 16.6 °C, and January is the coldest month with a mean temperature of −10.0 to −12.7 °C; the mean annual precipitation is approximately 470 mm with 67% of it occurring within the May to September growing season []. The soils are mostly clay–loam textured Orthic Black Chernozems. Trembling aspen (Populus tremuloides Michx.) covers the north-facing slopes; with native grasses, chiefly foothills rough fescue (Festuca campestris Rydb.) and Parry oat grass (Danthonia parryi Scribn.), growing on steep south-facing slopes. Gentle slopes and plateaus have been seeded to pasture and hayland dominated by smooth brome, Kentucky bluegrass (Poa pratensis L.), timothy (Phleum pratense L.), and alfalfa (Medicago sativa L.) [].
Study blocks were situated in smooth brome stands on mid (Blocks 1 and 3) to upper (Blocks 2 and 4) portions of south-facing hillsides, in proximity to areas of native vegetation (Figure A1). The slopes ranged from 10 to 19%. The blocks were in a natural state in 1920, but by 1944, fields were established in the vicinity of Block 1, immediately adjacent to Block 2 and to Blocks 3 and 4. Smooth brome in Blocks 1 and 2 was established by natural invasion through cultivation and seeding, whereas Blocks 3 and 4 were seeded to smooth brome and frequently mowed and reseeded, with the most recent reseeding conducted prior to 1985. The grazing regime in the 1980s was fall grazing in Block 1, midsummer grazing in Blocks 2 and 3, and haying in Block 4. Cattle grazing was not conducted for seven years prior to this study.
2.2. Experimental Design and Treatments
Twelve treatments were replicated across the four blocks in a randomized complete block design (Table 1). The plots were 10 by 30 m and oriented parallel to the slope. In summer year 1, four treatments were implemented: cattle grazing (4 plots), sheep grazing (2 plots), glyphosate wicking (5 plots), and reference (1 plot) in each block (Table 1). In year 2, further grazing, mowing, glyphosate application, and burning were initiated which differentiated the treatments. Grazing, mowing, and glyphosate treatments in year 2 were initiated during smooth brome elongation; sheep and cattle grazing with mowing were carried out concurrently. Grazing intensity for all the cattle treatments was heavy, defoliating elongated stems to heights of 5 to 10 cm; vegetative tillers were grazed to a lower height of approximately 3 to 4 cm. Water was located outside all the plots, and salt was placed in the opposite end of each plot. In year 1, cattle grazing commenced in late August with six cow–calf pairs (6 AU). In year 2, two cows (2 AU) were used for each of three grazing sessions (early June, late July, and late August) (Table 1). All sheep grazing was of heavy intensity, to a height of 5 cm or lower, except the midsummer year 2 grazing in Sheep-Heavy-Light2 which was moderate (to a height of approximately 7 cm). This latter treatment was designed to provide rough fescue a longer recovery period after the first grazing by removing sheep as soon as they began to graze plants other than smooth brome. Sheep grazing was conducted with 25 ewes and 8 lambs (5 AU) in year 1; year 2 grazing was conducted with 20 ewes (4 AU) for the first grazing and 15 ewes (3 AU) for the latter two grazings (Table 1).

Table 1.
Treatments implemented in smooth brome grasslands by years. X indicates times or intensity.
A hand-pushed lawn mower was used for the first mowing of all mowing treatments in year 2 and for the second mowing of Cattle-Mow4. Subsequent mowing was with a tractor-drawn rotary lawnmower. Vegetation was mowed to a height of 6 cm and left on the plots in all mowings. A 2:1 solution of water and glyphosate (Round-Up®, Monsanto Company, Creve Coeur, MO, USA. with 360 g/L glyphosate) as recommended by the manufacturer was selectively applied to smooth brome using a handheld hockey stick wick applicator in July and August of year 1 (Table 1). Selective application was possible because the smooth brome was taller than most of the other plants present. Glyphosate was also applied at elongation in June of year 2. A moderate intensity spring burn was carried out in March of year 2 using a backfire on Block 1 and a strip head fire on the other blocks under southeast winds of 0 to 14.4 km hr−1, temperatures of 5 to 11 °C, and a relative humidity of 20 to 38% (Figure A1). Weather data were collected using a belt weather kit. Fuel loads were calculated from litter collected in 3 randomly located 0.1 m2 quadrats per plot. The average fuel load over all the plots was 8155 kg ha−1.
2.3. Soil Sampling and Analysis
To characterize the soil, one core was collected randomly from each plot with a Dutch auger (7.5 cm diameter) in June of year 1. Samples were taken in 15 cm increments to the B horizon up to 75 cm. The soil samples were air dried and ground to 2 mm prior to the analysis. Soil particle size analysis was performed via the hydrometer method [], and total carbon was determined via the combustion method [] up to 45 cm. Water holding capacity was measured for all the samples and depths using pressure chambers with ceramic plates set at 1/3 bar and 15 bar representing field capacity and permanent wilting percentage, respectively. Available water holding capacity was calculated by subtracting the 15-bar reading from the 1/3-bar reading. Electrical conductivity and pH were determined by the saturation paste method [].
2.4. Vegetation and Litter Sampling
All sampling locations in this study were at least 1 m from plot boundaries. Grass tillers were counted in 5 permanent stratified random 0.1 m2 quadrats located within each plot in areas of predominantly smooth brome. Counts were conducted prior to the commencement of defoliation and glyphosate treatments in May of years 1 and 2, and at the end of the growing season in September of years 1, 2, and 3. Five 0.05 m2 litter samples were collected from each plot, in a pattern to prevent resampling, in June and September of year 1 and September of year 2. Litter, defined as dead plant material not incorporated with mineral soil and occurring above the soil mineral horizon [], was separated into three categories: standing, fallen, and partially or totally decomposed. The samples were oven dried at 65 °C and weighed. Litter depth to mineral soil was measured at each of these sampling locations.
Plant species composition was determined by a visual assessment of species in 10 randomly located permanent 0.1 m2 quadrats per plot per treatment. Assessments were conducted in July of year 1 and September of years 2 and 3. The species were grouped into 7 categories: smooth brome, Kentucky bluegrass, other introduced grasses, native grasses, introduced forbs, native forbs, and native shrubs. Percent ground cover including live vegetation, litter, bare ground, manure, and rocks was assessed in these quadrats.
2.5. Etiolated Regrowth
Three soil–plant cores, 10 cm in diameter and 7 cm deep, were collected in a stratified random pattern from each plot in late September of year 2. Care was taken to ensure the samples contained brome and were representative of the plot. Six soil–plant cores were collected from Herbicide2 (most severe herbicide treatment) at Blocks 1, 2, and 3 to determine whether smooth brome tillers, which appeared dead after glyphosate application, would produce new tillers. Three cores were selected to contain actively growing smooth brome, while the other three contained dead smooth brome as determined by tiller appearance and stem color beneath the sheath.
The samples were kept in cool, dark conditions until potted in 13 cm clay pots with clay–loam topsoil. The pots were placed in a growth chamber at 15 °C with a 12 h high-intensity light and 12 h dark cycle for 25 days to ensure root re-establishment. The pots were then subjected to dark conditions at 12 °C for 100 d to minimize stress to cool-season smooth brome [], followed by 25 d at 22 °C to stimulate growth and stress the plants. Relative humidity varied from 45 to 75% as the temperature regime changed and to accommodate watering two to three times per week. Prior to potting and approximately every 18 d thereafter, live tillers were counted, clipped to 2 cm, and the clippings dried at 55 °C. Clippings from each sampling period (five at 10 °C and two at 22 °C) were combined, redried, and weighed. All weighing was performed on a Mettler HK160 balance to 0.0001 g and rounded to 0.001 g.
2.6. Total Non-Structural Carbohydrates
Three soil–plant cores were collected from each plot in the manner described for etiolated growth in late September of year 1. The samples were kept in cool, dark conditions until transported to a freezer (−16 °C). The samples were thawed a few hours prior to washing. Smooth brome rhizomes, crowns, and shoots to 3 cm above ground level were washed, dried at 55 °C, and stored in glass jars until ground in a Retch high-speed mill to pass through a 0.5 mm screen. The ground samples were stored in glass jars until a total non-structural carbohydrate analysis was completed. Total non-structural carbohydrates were analyzed using the hot 0.2 N H2SO4 extraction method []. The sugar concentration of duplicate solutions was determined by the phenol sulfuric acid colorimetric method using fructose as a standard []. The result was expressed as percent (%) fructose on a dry-weight basis.
2.7. Statistical Analyses
Treatment means were analyzed using analyses of variance (ANOVA), and Fisher’s protected LSD was used to separate means. A split-block analysis of variance was used to determine treatment × time interactions. All statistical analyses were performed by SAS version 6.12 (IBM Corporation, Armonk, NY, USA) and all significant results were reported for p ≤ 0.05. Prior to analyses, statistical assumptions were tested using SAS Proc Univariate, Wilcox test for normality of experimental error, and Bartlett’s tests for homogeneity of variances. All parameters measured met the statistical assumptions and no transformation was required.
3. Results
3.1. Soils
Soil physical and chemical properties showed some variability with depth, but none presented serious limitations to plant growth. Soil texture in the study block was clay–loam where the proportion of sand, silt, and clay varied among depths (24.0 to 27.9% sand, 36.5 to 40.9% silt, 32.4 to 37.9% clay) (Table 2). Soil carbon content (7.9%) and electrical conductivity (3.0 dSm−1) were greatest in the upper 15 cm and decreased with depth, whereas pH showed an opposite trend (Table 2). Available water holding capacity varied among depths.
Table 2.
Mean (±SE) physical and chemical properties of soil from smooth brome stands in June year 1.
3.2. Tiller Density
Smooth brome tiller density was similar among plots prior to management treatment implementation. After late summer grazing by cattle and sheep, few summer initiated smooth brome tillers survived by September year 1; however, grazing stimulated fall tiller initiation significantly increasing tiller density the following spring (May year 2) (Table 3). This higher number of tillers remained into September year 2 for all grazing treatments even after 2 to 4 times mowing, except the lightest defoliation treatment (Cattle-Mow2); then persisted into September year 3 in the heaviest defoliation treatment (Sheep3). Smooth brome tiller densities in all other graze–mow treatments returned to almost baseline levels by fall year 3. Glyphosate wicking in spring year 1 resulted in a significant decrease in smooth brome density by September year 1 (Table 3). Although tiller density in herbicide treatments in May year 2 remained significantly lower than pre-treatment in all but Herbicide-Mow3, density was higher than the previous autumn. The only herbicide treatment to significantly reduce tiller densities in September year 2 relative to pre-treatment levels was Herbicide2 whereas in year 3, Herbicide2, Herbicide2-Burn, and Herbicide-Burn-Mow3 treatments significantly reduced brome densities to 50, 60, and 70% of pre-treatment levels (Table 3). Smooth brome tiller density was significantly lower with herbicide than other treatments for individual sampling periods (Table 3). Densities were highest under cattle and sheep grazing; however, high baseline densities in Cattle3 plots may have influenced this trend. Densities in the reference and treatments including mowing were intermediate. Within a given sampling period, herbicide effectiveness did not increase with burning or application frequency; however, when analyzed over time, only the treatments with two herbicide applications or burning significantly reduced smooth brome tiller density.
Table 3.
Treatment response of smooth brome and Kentucky bluegrass tiller density m−2 over time and within a given sampling period. * Probability of significant differences among treatments within individual sampling periods are based on ANOVA. ** Treatment × time interaction for split-block analysis. Different upper-case letters within a column and lower-case letters within a row indicate significant differences at p = 0.05.
The response of subdominant species Kentucky bluegrass showed early-spring burning dramatically increased tiller density in May of year 2, and by September of year 2, the tiller densities were greater than pre-treatment in all the treatments except the reference, which further increased in year 3. This increase was significant only under Sheep3, Sheep-Heavy-Light2, Herbicide-Burn-Mow3, Herbicide-Mow3, and Herbicide treatments. Treatment effects within an individual sampling period were significant for Kentucky bluegrass only in September of year 3 when density was least in the reference and greatest in Herbicide-Burn-Mow3 with 4.6 times of the baseline levels.
3.3. Plant Species Composition and Richness
Plant species composition was similar among plots prior to treatment implementation. Treatment effects were significant over time and within post-treatment samplings for smooth brome; Kentucky bluegrass and native forbs were the only species groups to occur in significant numbers in all plots (Table 4). Prior to treatment, smooth brome accounted for 48 to 71% of live plant composition; by year 2, smooth brome was significantly reduced from baseline in all treatments except the reference and lightest graze–mow treatments (Cattle-Mow2, Cattle-Mow3, Sheep-Heavy-Light2); smooth brome was generally 60% and 90% of pre-treatment levels in herbicide and graze–mow treatments, respectively (Table 4). Within sampling periods, smooth brome composition was higher in treatments with grazing or mowing than with herbicide. There was no significant difference among the five herbicide treatments. In year 2, smooth brome was significantly higher in the reference than other treatments. In contrast, Kentucky bluegrass composition was significantly greater in all treatments in years 2 and 3 relative to pre-treatment, except reference in year 2 and 3 and the lightest graze–mow treatment (Cattle-Mow2) in year 3 (Table 4). Within sampling periods, Kentucky bluegrass composition was significantly greater with herbicide and heavy sheep grazing (Sheep3) than the reference, and generally greater than other graze–mow treatments in year 3. Treatment trends were similar but less distinct in year 2.
Table 4.
Treatment effect on species and composition (%) over time and within a given sampling period. * Probability of significant differences among treatments within individual sampling periods are based on ANOVA. ** Treatment × time interaction for split-block analysis. Different upper-case letters within a column and lower-case letters within a row indicate significant differences at p = 0.05.
Native forb composition significantly increased over time in herbicide treatments lacking burning or mowing (Herbicide, Herbicide2) in September of year 2 and significantly decreased in several treatments including grazing or mowing (Cattle-Mow3, Cattle3, Sheep3, Sheep-Heavy-Light2, Herbicide-Mow3). The net effect over the duration of this study was a decrease in native forbs from pre-treatment levels in the reference and two grazing treatments (Cattle3, Sheep-Heavy-Light2). Within individual sampling periods, post-treatment native forb composition was lowest in the reference and grazing treatments (Cattle3, Sheep3, Sheep-Heavy-Light2) and highest in the herbicide treatments without mowing (Herbicide2, Herbicide, Herbicide2-Burn).
Species richness ranged from 9 to 16 species in treatment plots, with no significant treatment effect within sampling periods. Treatment effects were significant over time where total species richness was reduced significantly from year 1 to year 2 with heavy grazing (Cattle3 = 12.8 vs. 8.5, Sheep3 = 11.5 vs. 8.8); in year 3, in most treatment species, richness was at pre-treatment level, with some treatments slightly increased. No effect was found for glyphosate treatment, but richness was increased in most cases.
3.4. Litter Biomass and Depth
Standing litter significantly increased in four of five herbicide treatments in September of year 1 (Herbicide-Burn-Mow3, Herbicide2-Burn, Herbicide, Herbicide2) but decreased to pre-treatment levels in September of year 2, resulting in no significant net change in standing litter over time (Table 5). Decomposing litter significantly increased under sheep grazing and in two of five herbicide treatments in September year 1 and significantly decreased under burning (Herbicide-Burn-Mow3, Herbicide2-Burn) and sheep grazing (Sheep-Heavy-Light2) in September of year 2. The only treatment with a significant net increase in decomposing litter by September of year 2 was Herbicide2. Fallen litter mass did not change over time. Litter was greatest in the reference and least in burned treatments. Burning (Herbicide2-Burn, Herbicide-Burn-Mow3) significantly reduced total litter mass to 30 and 40% of pre-treatment levels, respectively (Table 5). Total litter was significantly reduced in the most intense graze–mow (Cattle-Mow4) and heavy sheep grazing (Sheep-Heavy-Light2) treatments. The Herbicide2 treatment significantly increased total litter biomass. Litter depth significantly decreased in one of four cattle treatments and significantly increased in two of five herbicide treatments in September of year 1 but declined in all treatments in year 2, resulting in a significant net decrease in all treatments.
Table 5.
Treatment response of litter biomass (kgha−1) and litter depth (cm) over time and within a given sampling period. * Probability of significant difference among treatments within individual sampling periods based on ANOVA. ** Treatment × time interaction for split-block analysis. Different upper-case letters within a column and lower-case letters within a row indicate significant differences at p = 0.05.
3.5. Ground Cover
Live vegetation cover in Herbicide-Burn-Mow3 and Cattle-Mow3 significantly increased from year 1 to year 2 but decreased to baseline cover in year 3 (Table 6). Treatments that included burning had significantly less litter cover in September year 2 than pre-treatment levels (Table 6). The extent of burned or blackened ground cover was similar in May of year 2 (42% and 40% in Herbicide-Burn-Mow3 and Herbicide2-Burn, respectively). Subsequent differences may be attributed to greater growth and ground cover of Kentucky bluegrass in Herbicide-Burn-Mow3 and to pocket gopher (Geomys bursarius) activity in Herbicide2-Burn. Most bare ground in treatments where litter cover declined significantly over time (Cattle-Mow4 and Cattle-Heavy3 in year 2; Cattle-Heavy3, Herbicide, and Herbicide2 in year 3) (Table 6).
Table 6.
Treatment response of ground cover (%) over time and within a given sampling period. * Probability of significant differences among treatments within individual sampling periods are based on ANOVA. ** Treatment × time interaction for split-block analysis. Different upper-case letters within a column and lower-case letters within a row indicate significant differences at p = 0.05.
3.6. Etiolated Regrowth and Total Non-Structural Carbohydrates
There were no significant treatment differences in smooth brome tiller density at the time soil–plant cores were potted or at the end of the growth chamber experiment (Table 7). Significant differences in Kentucky bluegrass tiller densities prior to potting were detected between treatments, with densities highest in Herbicide2-Burn and lowest in Cattle-Heavy3 and the reference. Temperature treatments had no significant effect on etiolated regrowth of smooth brome or Kentucky bluegrass, but regrowth was less in 22 °C temperature regimes (Table 7). Regardless of treatment, smooth brome tiller density peaked approximately 25 days after potting, prior to being placed in the dark. Kentucky bluegrass tiller density peaked 43 to 61 days after potting (18 to 36 days after placed in the dark). By the end of the experiment, smooth brome tiller densities were 25% or less, and Kentucky bluegrass tiller densities were 18 to 89% of the original densities.
Table 7.
Treatment response of ground cover (%) over time and within a given sampling period. * Probability of significant differences among treatments within individual sampling periods are based on ANOVA.
Total non-structural carbohydrate content of smooth brome crown and rhizomes were highest in Cattle-Mow3 and the reference; however, treatment differences were not significant (Table 7). In general, smooth brome total available carbohydrate reserves decreased dramatically after removal of shoot apices.
4. Discussion
4.1. Smooth Brome Response
Grazing and mowing over two years did not stress smooth brome as evidenced by tiller density, etiolated regrowth, and total non-structural carbohydrates. A decrease in smooth brome composition was, however, detected for the three heaviest defoliation treatments (Cattle-Mow4, Cattle-Heavy3, Sheep-Heavy3). In contrast, smooth brome decreased in ground cover under four years of grazing (two, three, and five times to 2 to 5 cm) in Saskatchewan aspen parkland [] and had relatively poor persistence under three and four cut schedules over two or three years in Minnesota and Wisconsin [,,]. Mackiewicz-Walec et al. [] reported that rotational grazing can help to reduce the competitive advantage of brome grass by periodically disturbing its growth. Although increased frequency of grazing and mowing decreased smooth brome ground cover in previous studies [,], no significant differences in smooth brome growth were detected in this study in treatments with varying mowing frequency. Smooth brome productivity was also much lower under continuous grazing than under rotational grazing in aspen parkland []. Insufficient severity or frequency of treatments may have been a factor in this lack of treatment response or greater resistance to grazing, as some studies found smooth brome is highly resistant to cutting and grazing [,].
In our study, cattle and sheep grazing treatments had more smooth brome tillers than graze–mow or herbicide wicking treatments. Smooth brome in ungrazed areas is known to have lower tiller densities []. While mowing defoliates the plant, it eliminates the grazing effects of trampling, pulling, selectivity, manure deposition, compaction, and potential growth stimulation by saliva [,]. Although Casler and Carlson [] report that grazing is usually less severe than mowing for removing shoot apices, almost all smooth brome leaves are within the bite level of livestock []. Sheep, cattle, and ungulates select forage to optimize nutrients and maximize energy [,]. Smooth brome was the forage of choice for sheep and cattle. Cattle and sheep grazing reduced the percent composition of native forbs in the plant community. Sheep grazed plants to a lower height than cattle and more readily switched to forbs and shrubs and then native grasses.
After the most palatable young smooth brome growth was consumed, the lower grazing heights could result in reduced energy reserves, snow trapping, and smooth brome ground cover and persistence [,]. Smooth brome total available carbohydrate reserves were not different between any grazing or graze–mow treatments in this study. These reserves may rebound by the end of autumn if there is no defoliation or cut, provided sufficient regrowth time is allowed [,,]. Thus, more frequent or severe defoliation for a greater number of years may be required to stress smooth brome. Including an autumn defoliation may help prevent restoration of reserves resulting in a lower capacity to regrow after early-spring defoliation.
Glyphosate wicking was more effective than grazing and mowing at reducing smooth brome tiller density and percent composition. Many studies reported that using herbicide including glyphosate can provide effective short-term control of smooth brome [,,,,]. Masters et al. [] suggested herbicide application can reduce 70% of smooth brome productivity. Two herbicide wickings (Herbicide2) resulted in the greatest decrease in smooth brome tiller density, although densities were similar to one wicking (Herbicide). Any observed differences between Herbicide and Herbicide2 were likely due to significantly greater gopher activity in Herbicide plots. The effectiveness of each subsequent glyphosate wicking was diminished as the number of smooth brome tillers, which extended above the canopy of the desirable species, decreased. Bahm et al. [] found herbicide application decreased smooth brome cover after the initial growing season but increased it by the end of the third growing season. Mowing following glyphosate application stimulated a short-term increase in tillering, compensating for the tillers previously killed by glyphosate and resulting in no net change in tiller density.
Two herbicide wickings and herbicide treatments which included burning were the only treatments that significantly reduced smooth brome. Grilz [] found that dormant spring burning increased glyphosate wicking effectiveness, resulting in smooth brome densities that were 30% of pre-treatment densities one year after application. In our study, burning did not increase glyphosate wicking effectiveness, though it did increase the effectiveness of mowing. Dormant season burns alone did not reduce smooth brome and a single burn may even have encouraged its growth and dominance [,]. Burning reduces litter which can stimulate grass tillering; the implementation of follow-up mowing or glyphosate wicking likely prevented this in our study. Spring burning can delay smooth brome growth as plants had just broken dormancy and were beginning to green at the time of the burn. Some studies found that during tiller elongation in spring, carbohydrates are low in plants and prescribed spring burning can decrease up to 50% tiller density in smooth brome [,]. A late spring burn, when smooth brome is actively growing, has been used to control the species in tall and mixed-grass prairie []. Burning had been most effective in reducing smooth brome when a substantial warm-grass component is present and there is adequate soil water content throughout the growing season to enable warm grasses to gain a competitive advantage over fire-injured smooth brome []. However, in foothills fescue grasslands, there are few warm season grasses and native grasses or forbs that had not been stimulated by the spring burns. Growth of rough fescue, the dominant species, begins very early in spring and is reduced by growing season burns [].
4.2. Kentucky Bluegrass Response
Unlike smooth brome, Kentucky bluegrass tiller densities and composition increased in all defoliation treatments, indicating greater tolerance and a longer period of responsiveness to defoliation. Kentucky bluegrass continued to produce tillers after being placed in the dark and a greater percentage of tillers remained alive at the end of the etiolated regrowth experiment, whereas smooth brome only developed new tillers with light. These observations support other research on the grazing tolerance of Kentucky bluegrass. Otfinowski et al. [] reported that grazing by cattle did not significantly reduce Kentucky bluegrass density 6 years after grazing initiation in fescue grassland restoration. Kentucky bluegrass has a higher percentage of leaf area close to the soil surface; so, it is better able to withstand close frequent grazing and is often found under continuous grazing by horses or sheep [,,]. Heavy sheep grazing throughout the season increased Kentucky bluegrass tillering and plant community composition relative to early-season cattle grazing. Kentucky bluegrass is reported to volunteer in pastures, increasing as taller forage species decline due to overgrazing or lack of winter hardiness []. Over four years of close grazing, Kentucky bluegrass ground cover increased at least 20% in smooth brome fields in Saskatchewan parkland []. Kentucky bluegrass increased from a minor species to a major component of fescue grasslands under heavy [] and severe grazing []. This suggests that control of Kentucky bluegrass requires more intense, late season grazing to reduce the initial abundance, followed by moderate grazing to increase the abundance of native species in fescue grasslands [,,].
The increase in tiller density and species composition of Kentucky bluegrass in all of our herbicide treatments was presumably due to decreased competition by smooth brome. The dramatic increase in Kentucky bluegrass tillers in Herbicide-Burn-Mow3 was attributed to Kentucky bluegrass being dormant at the time of the burn. Litter removal by burning enhanced bluegrass growth and tillering was further stimulated by mowing. Some studies suggested that prescribed fire can only temporarily reduce Kentucky bluegrass cover [,]. As with smooth brome, defoliation can stimulate seed production in Kentucky bluegrass. Burning has been commonly used to reduce litter and increase seed production of Kentucky bluegrass; mowing removes less litter than burning and is less effective in increasing seed production []. Burning in August in Idaho released tiller apical dominance over rhizomes resulting in greater numbers of tillers, panicles, and seed [,], whereas burning after initiation of fall regrowth reduced tiller density and seed yield []. As with smooth brome [], stand thinning stimulated seed production in Kentucky bluegrass [], but production decreased as gaps filled in. Openings in the canopy created by the death of smooth brome tillers by herbicide would provide additional space for Kentucky bluegrass which is tolerant of light shade though grows best in full sunlight []. McFadden et al. [] reported that herbicide had little or no effect on Kentucky bluegrass.
4.3. Native Forb Response
Forb composition was generally less than 20%, and shrubs and native grasses were present in small amounts in only two of four blocks. It was anticipated that treatments including defoliation might reduce native grasses, forbs, and shrubs and that cattle would have the least negative impact due to greater grazing heights; therefore, forbs and shrubs were avoided. Surprisingly, native forb composition only declined in Cattle-Heavy3 and Sheep-Heavy-Light2. Canada thistle also increased under Cattle-Heavy3 and Sheep-Heavy3. Cattle avoided grazing the thistle, whereas sheep would consume some of the younger plants and flowers, particularly under heavy grazing. Native forb composition and richness did not significantly change from year 1 to year 3 herbicide treatments. Germination of seeded mixed-grass prairie species increased 20 times in an old field when competition by smooth brome and crested wheatgrass was reduced by glyphosate []. In our study, the thick litter layer in unburned treatments would have prevented native forb seedling emergence. Some studies reported that smooth brome can invade native grasslands and form dense monocultural stands by replacing native species which could eventually restrict germination of other species and transform a diverse ecosystem dominated by native species into a homogenized stand [,]. Seedling establishment, primarily of introduced species such as stinkweed, was only noted on pocket gopher disturbances.
4.4. Management Implications
Grazing and mowing did not effectively reduce smooth brome density or composition and stimulated Kentucky bluegrass tillering. In contrast, glyphosate wickings which controlled smooth brome over the 3-year study were not effective at controlling Kentucky bluegrass. To significantly stress smooth brome and reduce plant growth, graze–mow treatments may need to be conducted for more than two years and possibly be more frequent and severe than those implemented in our study. Grazing or mowing for smooth brome stands at least once per summer can prevent seed production and minimize the species contribution to the seed bank. Autumn defoliation, while smooth brome is still growing, should be tested if grazing is to be implemented as a management tool; it may stress plants sufficiently to reduce spring establishment. An alternative approach could be to use grazing or mowing to release apical dominance and to stimulate tillering prior to herbicide application. Glyphosate wicking is not a permanent solution, and it alone will not eliminate smooth brome. As the number of smooth brome tillers extend above the canopy of the desirable species, could decrease the effectiveness of an additional herbicide application. In old smooth brome fields with few desirable species, it could be more effective to eliminate all smooth brome plants with herbicide and reseed with aggressive desirable species to prevent regrowth and establishment of other introduced species. Plant physiological stage at time of treatment implementation is a vital factor in determining effectiveness as evidenced by smooth brome response to burning. Smooth brome may be decreased by a dormant season burn followed by glyphosate wicking [,,,] or by a growing season burn; however, the impact on desirable species such as rough fescue must also be considered. The potential of Kentucky bluegrass to increase and dominate the plant community, especially under heavy grazing, must be considered when managing smooth brome stands as controlling smooth brome encourage establishment of Kentucky bluegrass.
5. Conclusions
Glyphosate wicking treatments were most effective at reducing smooth brome tiller densities and percent composition of the plant community; however, with decreased competition, Kentucky bluegrass readily established itself and became a dominant species. Graze only treatments, whether cattle or sheep, noticeably increased smooth brome tillering. The addition of an early-spring burn to glyphosate treatments did not result in control of smooth brome but encouraged Kentucky bluegrass growth. Increased treatment intensity, whether graze–mow or herbicide wicking, had no effect on the parameters measured. No treatment resulted in a significant increase in native plant species, although those with grazing only had fewer native species than any other treatment. Burning may only be beneficial for warm-season native species which are a small component of foothills fescue communities. Although glyphosate and grazing showed positive signs to control smooth brome in this 3-year study, longer-term research to evaluate the impacts of these management techniques would be important to affirm their application for controlling smooth brome in native fescue grasslands.
Author Contributions
Conceptualization, M.A.N.; methodology, M.A.N.; data curation D.J.B.; initial data analyses D.J.B.; formal data analysis, A.D.; writing—original draft preparation A.D.; review, and editing, A.D. and M.A.N.; project administration, M.A.N.; funding acquisition, M.A.N. All authors have read and agreed to the published version of the manuscript.
Funding
This research was funded by the NOVA Corporation under grant number G599000071.
Institutional Review Board Statement
Not applicable.
Informed Consent Statement
Not applicable.
Data Availability Statement
The data presented in this study may be available on request from the corresponding author.
Acknowledgments
Authors thank Jacquie Gilson, resident manager of the Ann and Sandy Cross Conservation Area for the logistical support.
Conflicts of Interest
The authors declare no conflicts of interest.
Appendix A
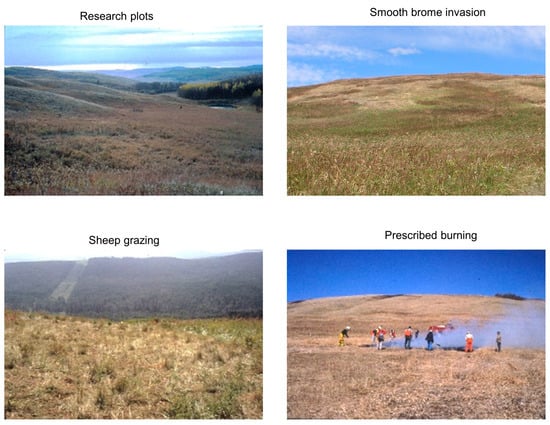
Figure A1.
Research site photos before and during management application for controlling smooth brome.
References
- Otfinowski, R.; Pinchbeck, H.G.; Sinkins, P.A. Using Cattle Grazing to Restore a Rough Fescue Prairie Invaded by Kentucky Bluegrass. Rangel. Ecol. Manag. 2017, 70, 301–306. [Google Scholar] [CrossRef]
- Woosaree, J.; Otfinowski, R. Importance of species diversity in the revegetation of Alberta’s northern fescue prairies. Biodivers. Conserv. 2017, 27, 665–680. [Google Scholar] [CrossRef]
- Elsinger, M.E.; Dhar, A.; Naeth, M.A. Recovery of plains rough fescue grasslands on reclaimed well sites. J. Nat. Conserv. 2022, 66, 126122. [Google Scholar] [CrossRef]
- Desserud, P.A.; Naeth, M.A. Natural Recovery of Rough Fescue (Festuca hallii (Vasey) Piper) Grassland After Disturbance by Pipeline Construction in Central Alberta, Canada. Nat. Areas J. 2013, 33, 91–98. [Google Scholar] [CrossRef]
- Desserud, P.A.; Gates, C.C.; Adams, B.; Revel, R.D. Restoration of foothills rough fescue grassland following pipeline disturbance in southwestern Alberta. J. Environ. Manag. 2010, 91, 2763–2770. [Google Scholar] [CrossRef] [PubMed]
- Widenmaier, K.J.; Strong, W.L. Tree and forest encroachment into fescue grasslands on the Cypress Hills plateau, southeast Alberta, Canada. For. Ecol. Manag. 2010, 259, 1870–1879. [Google Scholar] [CrossRef]
- Ren, L.; Bai, Y. Burning Modifies Composition of Emergent Seedlings in Fescue Prairie. Rangel. Ecol. Manag. 2017, 70, 230–237. [Google Scholar] [CrossRef]
- Alberta Environment and Parks. Principles for Minimizing Surface Disturbance in Native Grassland: Principles, Guidelines and Tools for All Industrial Activity in Native Grasslands in the Prairie and Parkland Landscapes of Alberta; Alberta Government: Edmonton, AB, Canada, 2016. Available online: https://open.alberta.ca/publications/9781460130551 (accessed on 11 June 2024).
- Elsinger, M.E.; Dhar, A.; Naeth, M.A. Plains rough fescue grassland restoration using natural regeneration after pipeline disturbances. Restor. Ecol. 2022, 31, e13703. [Google Scholar] [CrossRef]
- Ellis-Felege, S.N.; Dixon, C.S.; Wilson, S.D. Impacts and Management of Invasive Cool-Season Grasses in the Northern Great Plains: Challenges and Opportunities for Wildlife. Wildl. Soc. Bull. 2013, 37, 510–516. [Google Scholar] [CrossRef]
- Grant, T.A.; Shaffer, T.L.; Flanders, B. Patterns of Smooth Brome, Kentucky Bluegrass, and Shrub Invasion in the Northern Great Plains Vary with Temperature and Precipitation. Nat. Areas J. 2020, 40, 11–22. [Google Scholar] [CrossRef]
- Palit, R.; DeKeyser, E.S. Impacts and Drivers of Smooth Brome (Bromus inermis Leyss.) Invasion in Native Ecosystems. Plants 2022, 11, 1340. [Google Scholar] [CrossRef]
- Mackiewicz-Walec, E.; Żarczyński, P.J.; Krzebietke, S.J.; Żarczyńska, K. Smooth Brome (Bromus inermis L.)—A Versatile Grass: A Review. Agriculture 2024, 14, 854. [Google Scholar] [CrossRef]
- Larson, D.L.; Larson, J.L. Control of One Invasive Plant Species Allows Exotic Grasses to Become Dominant in Northern Great Plains Grasslands. Biol. Conserv. 2010, 143, 1901–1910. [Google Scholar] [CrossRef]
- Preister, L.; Kobiela, B.; Dekeyser, E. Smooth Brome (Bromus Inermis) Phenological Variability under Controlled Greenhouse Conditions. Nat. Areas J. 2021, 41, 301–306. [Google Scholar] [CrossRef] [PubMed]
- Otfinowski, R.; Kenkel, N.C.; Dixon, P.; Wilmshurst, J.F. Integrating climate and trait models to predict the invasiveness of exotic plants in Canada’s Riding Mountain National Park. Can. J. Plant Sci. 2007, 87, 1001–1012. [Google Scholar] [CrossRef]
- Walton, P.D. The production characteristics of Bromus inermis Leyss and their inheritance. Adv. Agron. 1980, 33, 341–369. [Google Scholar]
- Casler, M.D.; Carlson, I.T. Smooth brome. In Forages Volume 1: An Introduction to Grassland Agriculture, 5th ed.; Barnes, R.F., Miller, D.A., Nelson, C.J., Eds.; Iowa State University Press: Ames, IA, USA, 1995; pp. 313–324. [Google Scholar]
- Wilson, S. The suppression of native prairie by alien species introduced for revegetation. Landsc. Urban Plan. 1989, 17, 113–119. [Google Scholar] [CrossRef]
- Knowles, R.P. Productivity of grass species in the dark brown soil zone of Saskatchewan. Can. J. Plant Sci. 1987, 67, 719–725. [Google Scholar] [CrossRef]
- Lindquist, J.L.; Maxwell, B.D.; Weaver, T. Potential for controlling the spread of Centaurea maculosa with grass competition. Great Basin Nat. 1996, 56, 267–271. [Google Scholar]
- Stacy, M.D.; Perryman, B.L.; Stahl, P.D.; Smith, M.A. Brome Control and Microbial Inoculation Effects in Reclaimed Cool-Season Grasslands. Rangel. Ecol. Manag. 2005, 58, 161–166. [Google Scholar] [CrossRef]
- Bahm, M.A.; Barnes, T.G.; Jensen, K.C. Herbicide and Fire Effects on Smooth Brome (Bromus Inermis) and Kentucky Bluegrass (Poa Pratensis) in Invaded Prairie Remnants. Invasive Plant Sci. Manag. 2011, 4, 189–197. [Google Scholar] [CrossRef]
- McCartney, D.H.; Bittman, S. Persistence of cool-season grasses under grazing using the mob-grazing technique. Can. J. Plant Sci. 1994, 74, 723–728. [Google Scholar] [CrossRef]
- Smith, D.; Jacques, A.V.A.; Balasko, J.A. Persistence of several temperate grasses grown with alfalfa and harvested two, three, or four times annually at two stubble heights. Crop Sci. 1973, 13, 553–556. [Google Scholar] [CrossRef]
- Sheaffer, C.C.; Miller, D.W.; Marten, G.C. Grass dominance and mixture yield and quality in perennial grass-alfalfa mixtures. J. Prod. Agric. 1990, 3, 480–485. [Google Scholar] [CrossRef]
- Marten, G.C.; Hovin, A.W. Harvest schedule, persistence, yield and quality interactions among four perennial grasses. Agron. J. 1980, 72, 378–387. [Google Scholar] [CrossRef]
- Sheard, R.W.; Winch, J.E. The use of light interception, gross morphology and time as criteria for the harvesting of timothy, smooth brome and cocksfoot. J. Brit. Grassl. Soc. 1966, 21, 231–237. [Google Scholar] [CrossRef]
- Grilz, P.L. Ecological Relations of Bromus inermis and Festuca altaica ssp. Hallii. Master’s Thesis, University of Saskatchewan, Saskatoon, SK, Canada, 1992; p. 130. [Google Scholar]
- Wilson, S.D.; Gerry, A.K. Strategies for mixed-grass prairie restoration: Herbicide, tilling, and nitrogen manipulation. Restor. Ecol. 1995, 3, 290–298. [Google Scholar] [CrossRef]
- Strong, W.L.; Leggat, K.R. Ecoregions of Alberta; Alberta Forestry, Lands and Wildlife: Edmonton, AB, Canada, 1992. Available online: https://open.alberta.ca/publications/0864998406 (accessed on 12 June 2024).
- Environment Canada. Canadian Climate Normals 1981–2010. 2023. Available online: https://climate.weather.gc.ca/climate_normals/index_e.html (accessed on 5 June 2024).
- Carter, M.R. Soil Sampling and Methods of Analysis; Lewis Publishers: Ann Arbor, MI, USA, 1993. [Google Scholar]
- Nelson, D.W.; Sommers, L.E. Total carbon, organic carbon and organic matter. In Methods of Soil Analysis (Part 3) Chemical Methods; Page, A.L., Ed.; SSSA Book Series 5; Soil Science Society of America: Madison, WI, USA, 1982; pp. 916–1010. [Google Scholar]
- Naeth, M.A.; Bailey, A.W.; Pluth, D.J.; Chanasyk, D.S.; Hardin, R.T. Grazing impacts on litter and soil organic matter in mixed prairie and fescue grassland ecosystems of Alberta. J. Range Manag. 1991, 44, 7–12. [Google Scholar] [CrossRef]
- Horton, P.R. Some Effects of Defoliation on Plains Rough Fescue (Festuca Hallii (Vasey) Piper) in Central Alberta. Ph.D. Dissertation, Department of Plant Science, University of Alberta, Edmonton, AB, USA, 1991; p. 291. [Google Scholar]
- Suzuki, M. Semi-automatic analysis of the total available carbohydrates in alfalfa roots. Can. J. Plant Sci. 1971, 51, 184–185. [Google Scholar] [CrossRef]
- Dubois, M.; Gilles, K.A.; Hamilton, J.K.; Rebers, P.A.; Smith, F. Colorimetric method for determination of sugars and related substances. Anal. Chem. 1956, 28, 350–356. [Google Scholar] [CrossRef]
- Walton, P.D.; Martinez, R.; Bailey, A.W. A comparison of continuous and rotational grazing. J. Range Manag. 1981, 34, 19–21. [Google Scholar] [CrossRef]
- Saeidnia, F.; Majidi, M.M.; Mirlohi, A.; Manafi, M. Productivity, Persistence and Traits Related to Drought Tolerance in Smooth Bromegrass. Plant Breed. 2017, 136, 270–278. [Google Scholar] [CrossRef]
- Nazli, R.I.; Kusvuran, A.; Tansi, V.; Ozturk, H.H.; Budak, D.B. Comparison of Cool and Warm Season Perennial Grasses for Biomass Yield, Quality, and Energy Balance in Two Contrasting Semiarid Environments. Biomass Bioenergy 2020, 139, 105627. [Google Scholar] [CrossRef]
- Frank, A.B.; Hofmann, L. Light quality and stem numbers in cool-season forage grasses. Crop Sci. 1994, 34, 468–473. [Google Scholar] [CrossRef]
- Dyer, M.I. Mammalian epidermal growth factor promotes plant growth. Proc. Natl. Acad. Sci. USA 1980, 77, 4836–4837. [Google Scholar] [CrossRef] [PubMed]
- Vinton, M.A.; Hartnett, D.C. Effects of bison grazing on Andropogon gerardii and Panicum virgatum in burned and unburned tallgrass prairie. Oecologia 1992, 90, 374–382. [Google Scholar] [CrossRef] [PubMed]
- Aasen, A.; Bjorge, M. Alberta Agriculture, Food and Rural Development. Alberta Forage Manual, 2nd ed.; Alberta Agriculture, Food and Rural Development: Edmonton, AB, Canada, 2009. Available online: https://open.alberta.ca/dataset/077326082x (accessed on 12 June 2024).
- Jung, H.G.; Bennett, G.L.; Sahlu, T. Magnitude of diet selection by sheep grazing smooth bromegrass. J. Anim. Sci. 1989, 67, 2106–2115. [Google Scholar] [CrossRef]
- Willms, W.; Bailey, A.W.; McLean, A. Effect of burning or clipping Agropyron spicatum in the autumn on the spring foraging behaviour of mule deer and cattle. J. Appl. Ecol. 1980, 17, 69–84. [Google Scholar] [CrossRef]
- Knutti, H.J.; Hidiroglou, M. The effect of cutting and nitrogen treatments on yield, protein content and certain morphological characteristics of timothy and smooth bromegrass. J. Brit. Grassl. Soc. 1967, 22, 35–41. [Google Scholar] [CrossRef]
- Lawrence, T.; Ashford, R. Effect of stage and height of cutting on the dry matter yield and persistence of intermediate wheatgrass, brome and reed canary grass. Can. J. Plant Sci. 1969, 49, 321–332. [Google Scholar] [CrossRef]
- Printz, J.L.; Hendrickson, J.R. Impacts of Kentucky bluegrass (Poa pratensis L.) invasion on ecological processes in the Northern Great Plains. Rangelands 2015, 37, 226–232. [Google Scholar] [CrossRef]
- Perryman, B.L.; Laycock, W.A.; Bruce, L.B.; Crane, K.K.; Burkhardt, J.W. Range readiness is an obsolete management tool. Rangelands 2005, 27, 36–42. [Google Scholar] [CrossRef]
- Grilz, P.L.; Romo, J.T. Water relations and growth of Bromus inermis Leyss (smooth brome) following spring or autumn burning in a fescue prairie. Am. Midl. Nat. 1994, 132, 340–348. [Google Scholar] [CrossRef]
- Link, A.; Kobiela, B.; Dekeyser, S.; Huffington, M. Effectiveness of Burning, Herbicide, and Seeding Toward Restoring Rangelands in Southeastern North Dakota. Rangel. Ecol. Manag. 2017, 70, 599–603. [Google Scholar] [CrossRef]
- Slopek, J.I.; Lamb, E.G. Long-term efficacy of glyphosate for smooth brome control in native prairie. Invas. Plant Sci. Manag. 2017, 10, 350–355. [Google Scholar] [CrossRef]
- Wagner, V.; Antunes, P.M.; Irvine, M.; Nelson, C.R. Herbicide usage for invasive non-native plant management in wildland areas of North America. J. Appl. Ecol. 2017, 54, 198–204. [Google Scholar] [CrossRef]
- Masters, R.A.; Nissen, S.J.; Gaussoin, R.E.; Beran, D.D.; Stougaard, R.N.; Masters, R.A.; Nissen, S.J.; Gaussoin, R.E.; Beran, D.D. Imidazolinone Herbicides Improve Restoration of Great Plains Grasslands. Publications from USDA-ARS/UNL Faculty. 1996. 1086. Available online: https://digitalcommons.unl.edu/usdaarsfacpub/1086 (accessed on 4 June 2024).
- Blankespoor, G.W.; Larson, E.A. Response of smooth brome (Bromus inermis Leyss.) to burning under varying soil moisture conditions. Am. Midl. Nat. 1994, 131, 266–272. [Google Scholar] [CrossRef]
- Sinton, H.M.M. The Effect of Burning and Mowing on Festuca hallii (Vasey) Piper (Festuca scabrella Torr.). Master’s Thesis, University of Alberta, Edmonton, AB, Canada, 1980; p. 141. [Google Scholar] [CrossRef]
- Balasko, J.A.; Evers, G.W.; Duell, R.W. Bluegrasses, ryegrasses, and bentgrasses. In Forages: Volume 1: An Introduction to Grassland Agriculture, 5th ed.; Barnes, R.F., Miller, D.A., Nelson, C.J., Eds.; Iowa State University Press: Ames, IA, USA, 1995; pp. 357–371. [Google Scholar]
- Dekeyser, E.S.; Meehan, M.; Clambey, G.; Krabbenhoft, K. Cool Season Invasive Grasses in Northern Great Plains. Nat. Areas J. 2013, 33, 81–90. [Google Scholar] [CrossRef]
- Willms, W.D.; Quinton, D.A. Grazing effects on germinable seeds on the fescue prairie. J. Range Manag. 1995, 48, 423–430. [Google Scholar] [CrossRef]
- Trottier, G.C. Disruption of rough fescue, Festuca hallii, grassland by livestock grazing in Riding Mountain National Park, Manitoba. Can. Field-Nat. 1986, 100, 488–495. [Google Scholar] [CrossRef]
- DeKeyser, E.S.; Dennhardt, L.A.; Hendrickson, J. Kentucky bluegrass (Poa pratensis) invasion in the northern great plains: A story of rapid dominance in an endangered ecosystem. Invas. Plant Sci. Manag. 2015, 8, 255–261. [Google Scholar] [CrossRef]
- Palit, R.; Gramig, G.; Dekeyser, E.S. Kentucky Bluegrass Invasion in the Northern Great Plains and Prospective Management Approaches to Mitigate Its Spread. Plants 2021, 10, 817. [Google Scholar] [CrossRef]
- Toledo, D.; Sanderson, M.; Spaeth, K.; Hendrickson, J.; Printz, J. Extent of Kentucky bluegrass and its effect on native plant species diversity and ecosystem Services in the Northern Great Plains of the United States. Invasive Plant Sci. Manag. 2014, 7, 543–552. [Google Scholar] [CrossRef]
- Kral, K.; Limb, R.; Ganguli, A.; Hovick, T.; Sedivec, K. Seasonal prescribed fire variation decreases inhibitory ability of Poa pratensis L. and promotes native plant diversity. J. Environ. Manag. 2018, 223, 908–916. [Google Scholar] [CrossRef]
- Hickey, V.G.; Ensign, R.D. Kentucky bluegrass seed production characteristics as affected by residue management. Agron. J. 1983, 75, 107–110. [Google Scholar] [CrossRef]
- Canode, C.L.; Law, A.G. Thatch and tiller size as influenced by residue management in Kentucky bluegrass seed production. Agron. J. 1979, 71, 289–291. [Google Scholar] [CrossRef]
- Ensign, R.D.; Hickey, V.G.; Bernardo, M.D. Seed yield of Kentucky bluegrass as affected by post-harvest residue removal. Agron. J. 1983, 75, 549–551. [Google Scholar] [CrossRef]
- Fulkerson, R.S. Seed yield response of three forage grasses to thinning. Can. J. Plant Sci. 1972, 52, 613–618. [Google Scholar] [CrossRef]
- Evans, D.W. Stand thinning in seed production of ‘Cougar’ Kentucky bluegrass. Agron. J. 1980, 72, 525–527. [Google Scholar] [CrossRef]
- McFadden, D.; Fry, J.; Keeley, S.; Hoyle, J.; Raudenbush, Z. Establishment of Kentucky bluegrass and tall fescue seeded after herbicide application. Crop Forage Turfgrass Manag. 2022, 8, e20151. [Google Scholar] [CrossRef]
Disclaimer/Publisher’s Note: The statements, opinions and data contained in all publications are solely those of the individual author(s) and contributor(s) and not of MDPI and/or the editor(s). MDPI and/or the editor(s) disclaim responsibility for any injury to people or property resulting from any ideas, methods, instructions or products referred to in the content. |
© 2024 by the authors. Licensee MDPI, Basel, Switzerland. This article is an open access article distributed under the terms and conditions of the Creative Commons Attribution (CC BY) license (https://creativecommons.org/licenses/by/4.0/).