Article

The Impact of Social Capital on Community Resilience: A Comparative Study of Seven Flood-Prone Communities in Nanjing, China

1
School of Architecture, Nanjing Tech University, Nanjing 211816, China
2
School of Government, Central University of Finance and Economics, Beijing 100081, China
3
School of Architecture, Huaqiao University, Xiamen 361021, China
4
Faculty of Architecture and City Planning, Kunming University of Science and Technology, Kunming 650093, China
*
Author to whom correspondence should be addressed.
Land 2024, 13(8), 1145; https://doi.org/10.3390/land13081145 (registering DOI)
Submission received: 22 May 2024 / Revised: 21 July 2024 / Accepted: 22 July 2024 / Published: 26 July 2024
(This article belongs to the Special Issue Mega-City Regions in the Global South)

Abstract

:
Social capital plays a crucial role in enhancing community resilience during flood disasters. This study investigates the influence of social capital on community resilience in Nanjing, China. Social capital is composed of five aspects: cohesion, collective efficacy, sense of belonging, trust and reciprocity and informal social control. Factor analysis and multiple regression analysis are employed to analyze the dimensions of social capital and its impact on community resilience. Our results demonstrate that social cohesion and collective efficacy are the most representative factors of social capital. Reformed housing communities typically have higher cohesion than those in commercial and affordable housing. Affordable housing communities in flood-prone areas have higher collective efficacy but lower trust and reciprocity. Commercial housing communities have higher informal social control but have great internal differences in collective efficacy. We strongly urge government decision makers to enhance flood resilience by fostering social capital within local communities.

1. Introduction

The global increase in flood risk highlights the growing importance of understanding the link between social capital and community resilience. In the past decade, China’s urbanization rate exceeded 65% in 2023, with a permanent urban population of 932 million and 117,000 urban communities [1]. Socio-spatial differentiation has increased housing inequality in major cities like Nanjing due to the expanding diversity in housing provision and consumption following economic reforms. Since the 1990s, the government in China has encouraged the commercialization of urban housing, leading to a pattern of spatial segregation in housing systems [2]. Nanjing has three types of housing, namely reformed housing 1, commercial housing and affordable housing. Reformed housing is a kind of public housing made up of work units under the central planning system. Commercial housing 2 is built for higher-income groups with access to mortgage financing. Affordable housing 3 is often provided to low-income groups to meet family needs [3,4]. Studies have confirmed that social capital plays a crucial role in enhancing social resilience to natural disasters, especially for susceptible individuals and cities with spatial heterogeneity [5,6,7].
The concept of resilience has become a fundamental paradigm for examining risks and safety threats [8,9]. Most researchers have focused on the engineering dimensions of resilience and overlooked the social aspects, particularly the lack of exploration into the interactions between social capital and community resilience. Social capital refers to the relationships of responsibility, expectation, trust and power among individuals and groups [10]. Social capital refers to the characteristics of social organizations, such as networks, norms and trust that facilitate action and cooperation for mutual benefit [11,12]. Social capital is a resource embedded in social networks [13]. With the increasing occurrence of disaster losses, experts in disaster management have embraced various forms of resilience as a means to mitigate losses and recover from their impacts [5]. The Federal Emergency Management Agency recommends that local and national responders establish partnerships among emergency management, community sectors, and organizations. They also encourage empowering local action through increased social capital and civic activity [14]. The Community Resilience Development Framework in the UK argues that social capital includes the cohesiveness of communities, barriers to inclusion, access to shared resources, behaviors and social norms
Efforts to assess social capital in the context of real disasters can be carried out through various methods, including quantitative surveys, in-depth interviews, field observations, and the analysis of statistical indicators derived from publicly available data [5]. Based on evidence from various disasters, the indices used to measure disaster resilience include the social capital index. This includes participation in nonprofit, religious and civic organizations, as well as the number of registered voters and voter participation [15,16,17]. Scholars assessed the social capital within the community through both qualitative and quantitative methods. For instance, Choo and Yoon (2022) conducted a study on the impact of social capital on disaster response capacity in Seoul using factor analysis [18]. Fraser (2021) utilized publicly available data to construct new bonding, bridging and linking social capital indices through principal component analysis [19].
This study makes several contributions to the existing literature. Firstly, social capital has been investigated, but few studies have focused on the differences in community type, especially in the context of transition periods in a developing country. Previous research has primarily focused on examining the relationship between social capital and the process of disaster recovery; for example, the Chicago Heat Wave Study found that isolated, elderly and economically disadvantaged communities have high mortality rates, with less public organization and limited social capital present in these communities. Communities with strong trust, norms and participation can recover from disasters more quickly [20]. Mutual trust and interdependence enhance awareness of disaster management, volunteer opportunities and responsibilities, thereby supporting disaster preparedness [21]. A case study in Sri Lanka confirmed the important role of social capital in rural communities’ ability to respond to disasters like landslides and floods [22]. Scholars assessed social capital before, during and after disasters. They also studied the types of social capital—bonding, bridging and linking—in relocation and reconstruction efforts [23]. The current study contributes to the existing literature by empirically analyzing the differences in community-based social capital in China. Secondly, while there have been studies on community resilience, few have specifically focused on the relationship between social capital and disaster recovery or preparedness. Furthermore, there has been a lack of examination regarding the impact of social capital on community resilience. Previous research has shown that the reconstruction of communities is significantly influenced by social networks, such as churches, and connections with relatives and friends [9,24]. Lo et al., (2015) proposes that the development of social capacity and trust within a community will be more effective in strengthening resilience than simply increasing awareness of potential hazard risks [25]. Liang et al. (2017) suggest that government support, community activities and local Hukou are key factors influencing residents’ adaptation capacity [26]. Cui and Li (2020) assess community resilience from the perspective of social capital at different stages of flood disaster. Chinese communities commonly face challenges such as limited pre-disaster awareness, passive resistance during disasters and rapid decline post-disasters, leading to the recurrence of similar situations [25,27]. Our study involves an analysis on the impact of social capital on community resilience and the simultaneous consideration of the impacts of individual characteristics and risk perception on community resilience.
Thirdly, previous research on the social capital of communities has primarily focused on developed countries and a few developing countries. Aldrich and Meyer (2015) investigated the relationship between social capital and community resilience [5]. Cutter, Ash and Emrich (2014) examined the landscape of disaster resilience indicators in the USA [28]. Fraser (2021) assessed the social capital and social vulnerability of specific communities in Japan, modeling the impact of these factors to better prepare for future disasters [19]. Shahid and Bohara (2022) proposed a social capital index (SCI) to assess formal and informal settlements in Pakistan, finding a strong positive correlation between actual and perceived social capital [29]. However, these studies on social capital in China focused on farmers’ climate-related disaster adaptation behavior, perceived collective efficacy and self-efficacy, social capital and evacuation behavior in rainstorm disasters [30,31]. Our studies focused on the different types of communities and the impact of social capital on community resilience.
Taking seven communities in Nanjing as a case study, this research examines social capital from the following perspectives: (1) developing an evaluation system for social capital; (2) assessing the comprehensive scores of social capital in different types of communities; and (3) analyzing the factors that impact community resilience, including social capital, individual characteristics and risk perception.

2. Methods

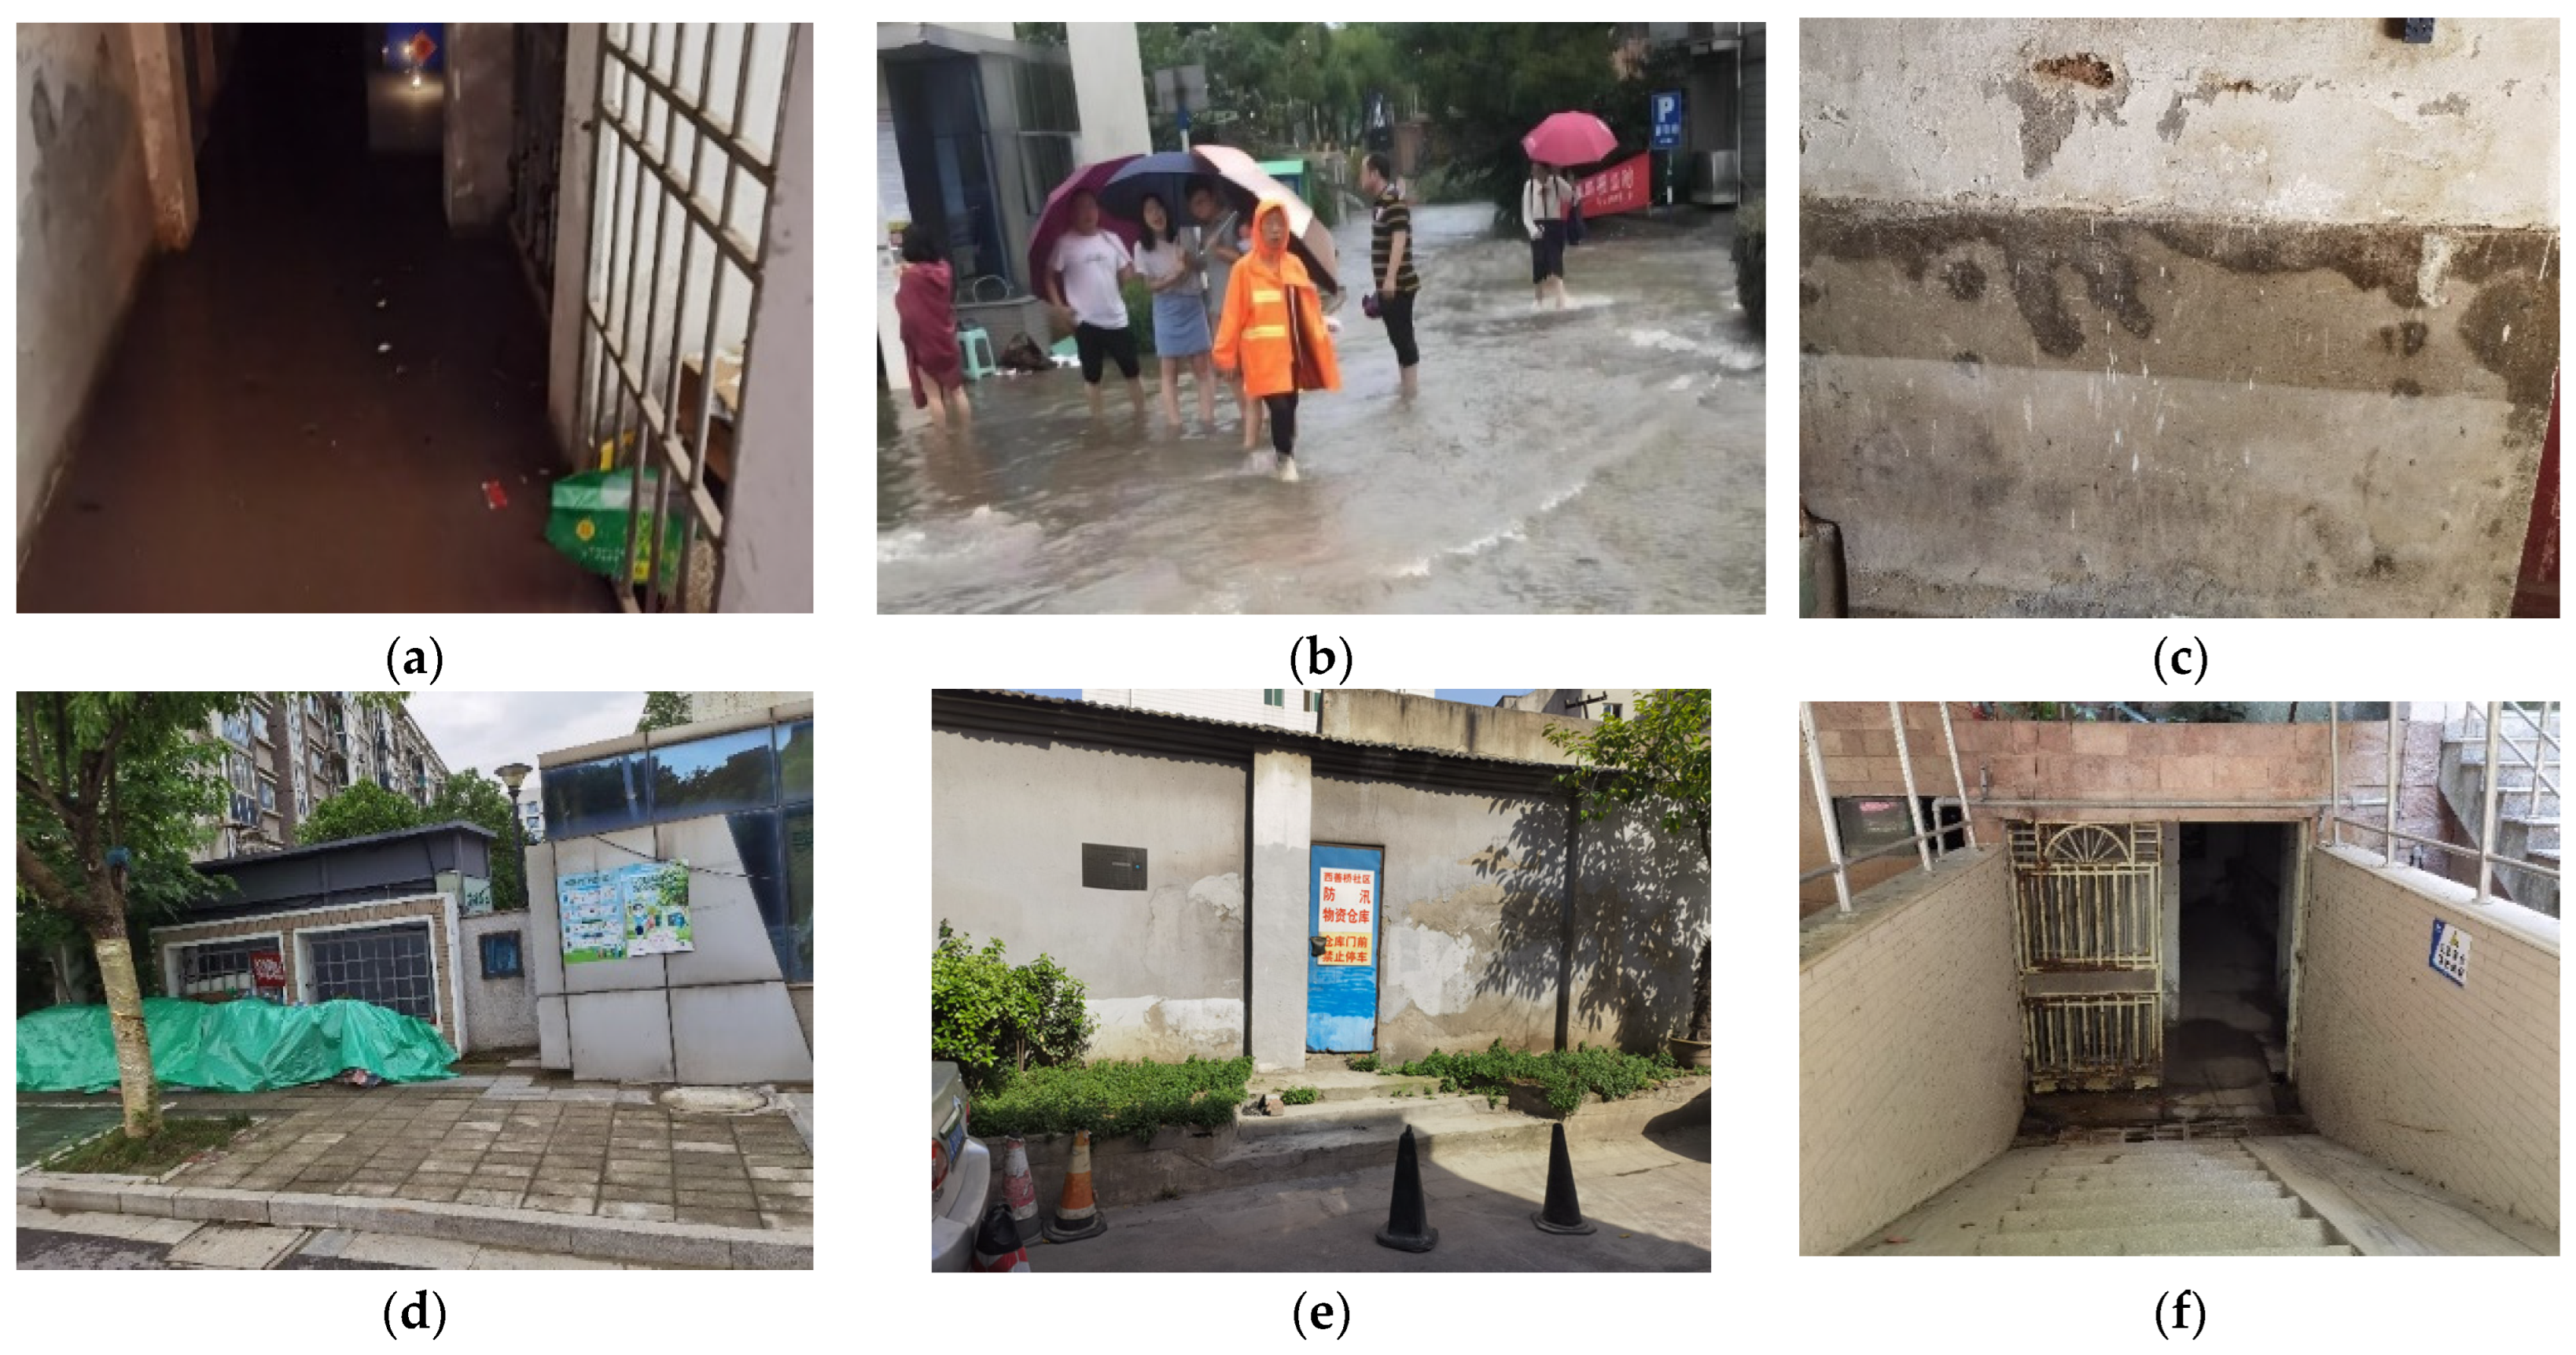
2.1. Study Area and Data

Nanjing is the capital city of Jiangsu Province and the center of the Yangtze River Economic Belt. In 2023, the land area was 6587 km2, the population was 9.547 million and there was an urbanization rate of 87.2%. The city has average annual precipitation of more than 1100 mm, and its flooding season usually ranges from May to September. The Yuhuatai District is located in the south of urban center and the Yangtze River in the west, with an area of 132.39 km2 (Figure 1). In 2021, the Yuhuatai District, consisting of 7 subdistricts and 64 communities, with a total population of 608,800 residents, has been severely impacted by rainstorms and floods. Our surveys conducted from April to June 2021 focused on seven flood-prone communities: Mingchengshijia community, Kangsheng Garden community, Blue Valley community, Shuiwen Garden community, Xishan apartment community, Golden Leaf Garden community and Banqiao Xincun community (Figure 2). These seven communities were selected based on their low-lying terrains and history of waterlogging. They are under the jurisdiction of five subdistricts, including Sanhongqiao, Yuhua, Tiexinqiao, Xishanqiao, Guxiong and Yuhuatai EDZ.
This research was conducted at two levels. We used the term ‘communities’ to refer to neighborhoods, and ‘residents’ to refer to individual respondents. At the community level, we designed a basic information form to collect detailed data on communities, including the type of community, year of construction, floor area ratio, green ratio and number of building stories. Table 1 presents the fundamental construction status of the surveyed communities. At the individual level, we conducted a survey to assess residents’ experiences, knowledge, and attitudes regarding flooding. The questionnaire consisted of four parts. The first part gathered basic demographic information, including gender, age, education level, occupation, and income. The second part focused on community resilience and historical flood events, such as the severity and duration of past floods. The third part examined six aspects of social capital. The fourth part addressed flood countermeasures. A total of 328 questionnaires were collected from seven typical communities using accidental and snowball sampling methods. Of these, 289 questionnaires were deemed valid, resulting in an effective response rate of 88% (Table 2). We compared the demographic characteristics (sex, age, educational background) of our sample with those reported in the city’s latest statistical yearbook and found high consistency between the two datasets. This indicates that our sample is representative of the citywide population.

2.2. Variables

The questionnaires were divided into two parts: community resilience and social capital (Table 3). Social capital is a collection of actual or potential resources with a structural nature, which can produce corresponding social benefits whilst reducing action costs. The independent variable comprised 22 indicators of social capital, representing the five dimensions of collective efficacy, sense of belonging, trust and reciprocity, cohesion and informal social control; meanwhile, the dependent variable comprised 8 indicators of community resilience, representing the three dimensions of economic resilience, social resilience and organizational resilience.
Cohesion refers to the closeness and degree of relationship between community residents. Collective efficacy refers to the flood fighting efficiency of residents, property management and government when flood disaster comes. Sense of belonging refers to the degree of community identity of residents. Trust and reciprocity refer to mutual trust and mutual assistance between residents. Informal social control refers to the degree to which residents consciously abide by the code of conduct. Likert scales were used to assess the community’s evaluation and attitude towards social capital in 21 aspects.
In this study, social capital and community resilience are comprehensive concepts with multiple dimensions and indexes. To assess the impact of social capital on community resilience, factor analysis and multiple regression methods were employed to analyze the influence of social capital factors on community resilience.

2.3. Models

(1)
Factor analysis
Principal component analysis (PCA) is a well-known method for dimension reduction, and plays a crucial role in presenting data in a more concentrated manner. Factor analysis utilizes the PCA method for factor extraction, aiming to simplify the factor structure of a set of original variables. Generally, the determination of factors through linear combination is expressed as
F i k = j W j k X i j
Fik = score of community i social capital on factor k;
Xij = value of original variable j for community i social capital, which is standardized in PCA;
Wjk = factor loading of variable j on factor k representing the proportion of variance of variable j explained by factor k.
The comprehensive score of social capital or community resilience in community i is then calculated using a weighted sum method.
S i = k λ k · F i k / k λ k
Si = comprehensive factor scores of communities i representing the social capital or community resilience of the community;
λk = the eigenvalue of factor k.
The following 21 indicators are categorized into cohesion, collective efficacy, sense of belonging, trust and reciprocity, and informal social control. It is important to note that these five aspects are crucial for enhancing our understanding of social capital in relation to urban flooding, and they are not entirely distinct from each other. Factor analysis is first conducted on all variables and then on each set of the five in order to assess social capital as a whole. The following 8 indicators are categorized into organizational resilience, social resilience and economic resilience. Factor analysis is first conducted on all variables to evaluate community resilience as a whole in three sets.
(2)
Multiple regression
The explanatory variable in this study is social capital, which has an influence on community resilience. Therefore, the multiple regression model is selected for analysis. Community resilience is used as the dependent variable and social capital as the independent variable to identify the impact of socio-economic attributes, risk perception and social capital. The dependent variable follows a continuous and approximately normal distribution; therefore, the multiple regression model is utilized for regression analysis. The model can be expressed as
Y = β 0 + β 1 x 1 + β 2 x 2 + + β p x p + ε
Y is the dependent variable (community resilience index); β 0 is constant; β 1 , β 2 β p represent the regression coefficients; x 1 ,   x 2     x p represent independent variables (social capital factor), and ε is the random error.

3. Results and Discussion

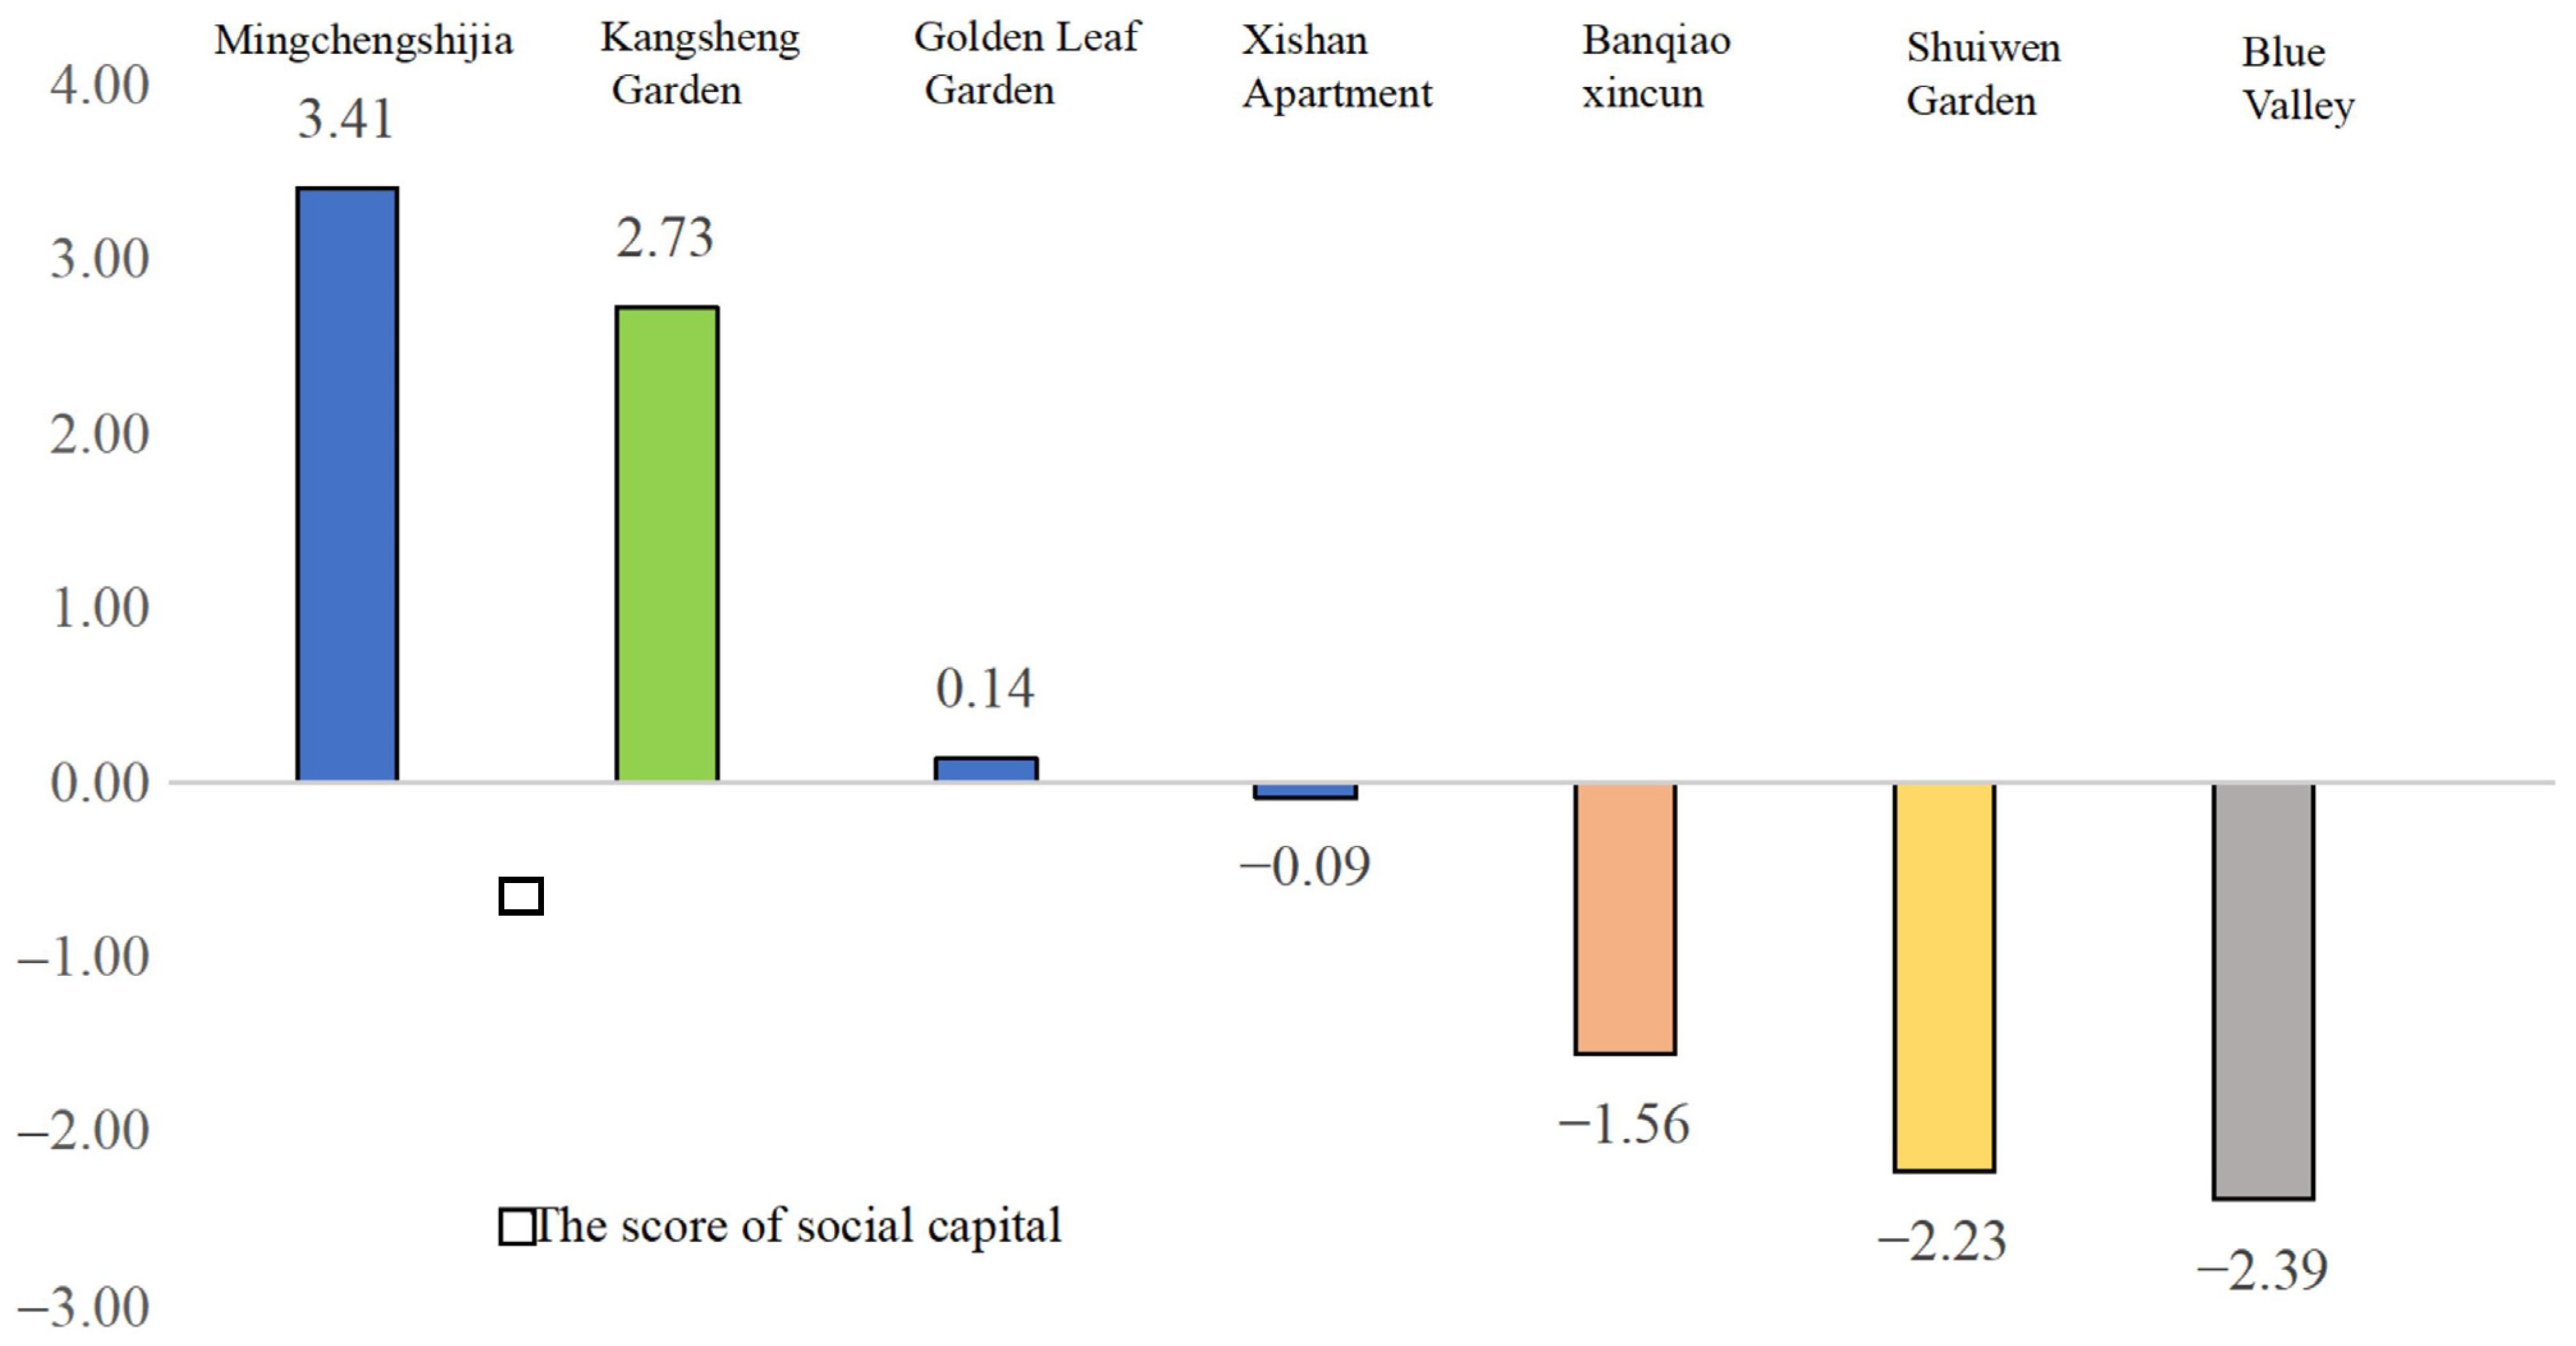
3.1. Social Capital of Different Communities

To differentiate the social capital of various types of communities, the factor analysis method was employed to categorize 21 indicators of social capital. These indicators were primarily derived from previous literature on social capital and urban flooding [5,32]. The test results revealed a KMO statistic of 0.840. Additionally, Bartlett’s sphericity test (p = 0.000 < 0.05) was conducted, indicating that the correlation coefficient matrix significantly differed from the identity matrix, thus demonstrating the necessity and suitability of factor analysis for this study. The result of the factor analysis identified five principal components, which accounted for a cumulative variance contribution rate of 59.77%, encompassing most of the original variables (Table 4). Consequently, the 21 indicators were categorized into five groups. The first principal component (F1), named the cohesion factor, included close interaction, resident cooperation, resident participation, number of greetings, neighborhood communication and mutual assistance. The second principal component (F2), named the collective efficacy factor, comprised property concern, committee concern, government concern and trust in committees. The third principal component (F3), named the sense of belonging factor, encompassed residence intention, livability, comfortable living conditions and community members’ satisfaction. The fourth principal component (F4), named trust and reciprocity, included problem-solving cooperation, residents’ trust, residents’ mutual assistance and level of trust within the community. Finally, the fifth principal component (F5), named informal social control, encompassed protecting public health as well as the acceptance or prevention of unethical behavior (Table 4).
The comprehensive factor score of each community can be calculated using the weighted sum method from Equation (3). This score reflects the level of social capital in the various indicators of the community, and a score below zero indicates that it is below average.
Z = 0.1506F1 + 0.1306F2 + 0.1203F3 + 0.12025F4 + 0.7124F5
The highest scores for social capital belong to commercial housing communities, with great internal differences, including the following: the highest scores belong to Mingchenshijia and Kangsheng Garden, and the middle scores belong to the Xishan apartments, whereas the lowest scores belong to Blue Valley. The lowest scores belong to reform housing communities, including Banqiao Xincun and Shuiwen Garden, whereas the highest score of social capital belongs to the affordable housing community of Golden Leaf Garden. Despite the limited number of communities surveyed in this study, the trend of social capital level is obvious (Figure 3).

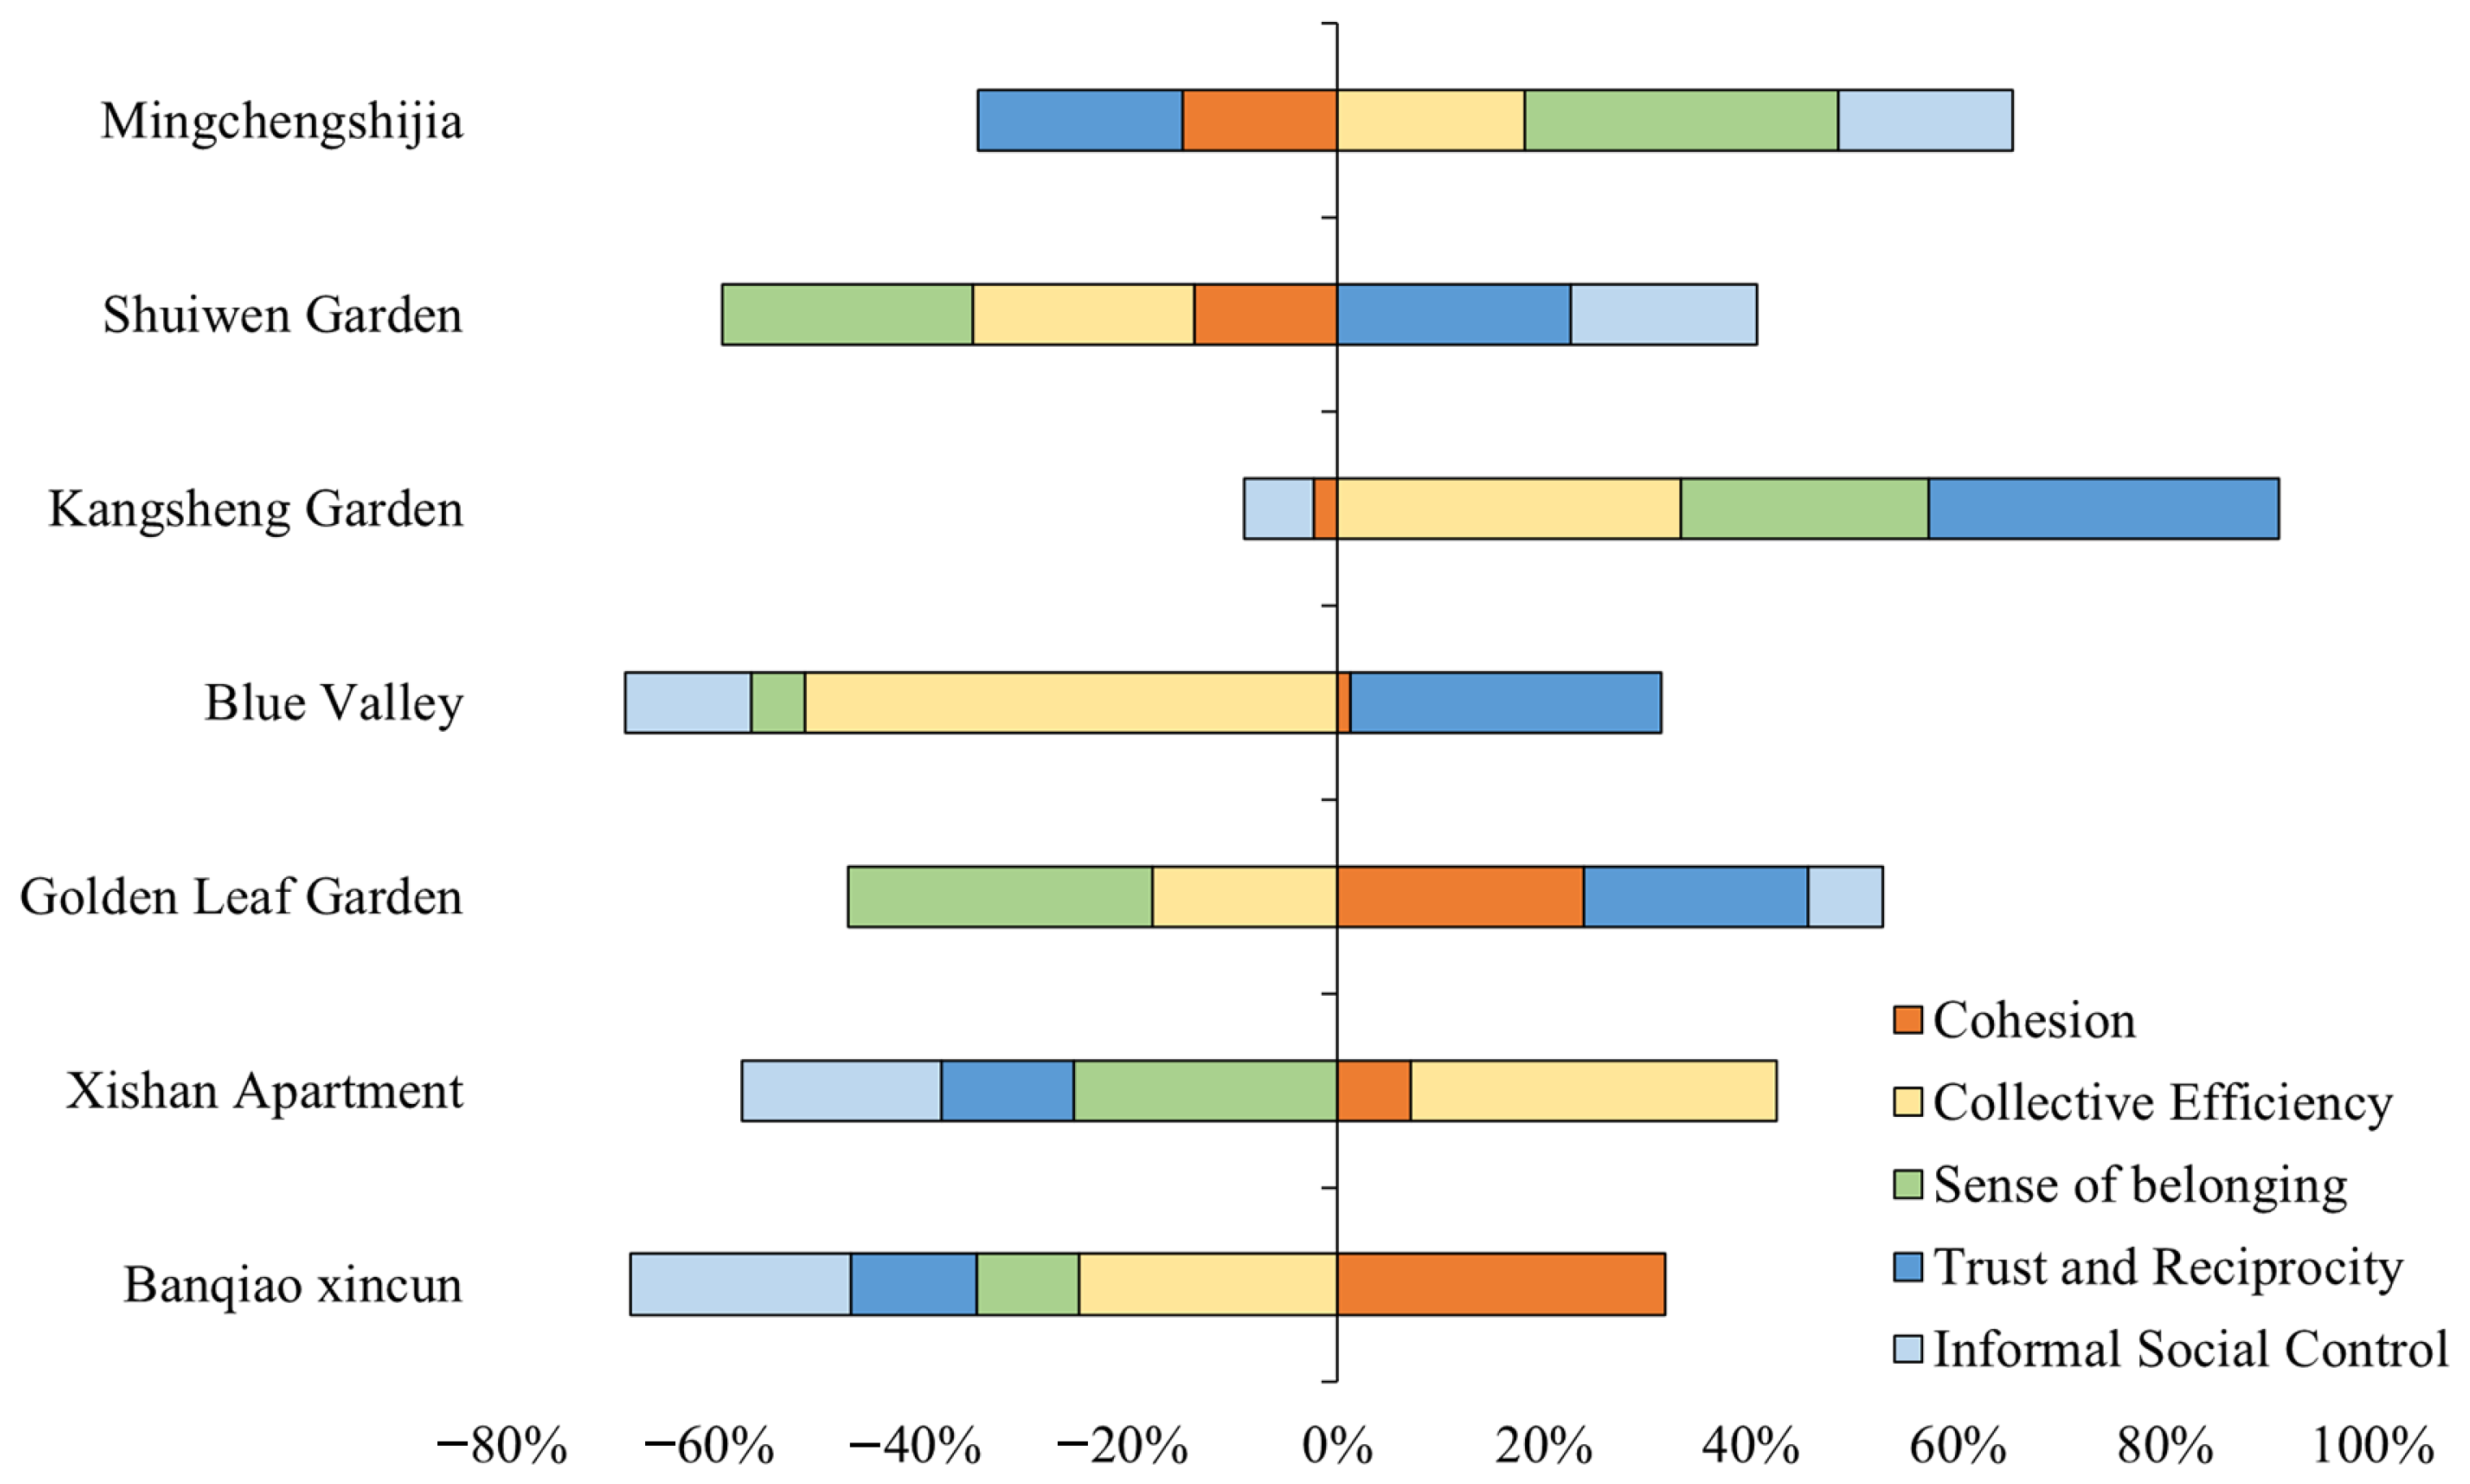
3.2. Different Dimensions of Social Capital

Figure 3 illustrates the social capital across different dimensions within the relevant communities. In terms of cohesion, the reform housing communities exhibit varying levels of cohesion, with Banqiao Xincun scoring the highest and Shuiwen Garden scoring the lowest, indicating significant internal differences. The middle scores belong to affordable housing, including Golden Leaf Garden. The lowest scores belong to commercial housing, with great differences, including the highest for the Xishan apartments and the lowest for Kangsheng Garden and Blue Valley. Comparing reform housing to commercial housing, the relationships of neighborhoods in reform housing are relatively closer than those in commercial housing; therefore, reform housing has a high level of cohesion.
In the dimension of collective efficacy, the highest score of collective efficacy belongs to commercial housing communities, with great internal differences, including the highest for Mingchengshijia and the Xishan apartments, and the lowest for Blue Valley. According to the survey, Mingchengshijia belongs to a commercial housing community, and the property corporation does a good job in flood emergencies after disasters, which is reflected in the timely high cooperation between residents and the property corporation to alleviate flood situations. Additionally, the Xishan apartment community is located in a flood-prone area with low terrain and close proximity to the river. Therefore, the government pays much attention to this community and prepares sufficient flood control materials to alleviate flood situations. However, Blue Valley is blacklisted in Yuhuatai District due to refusal to pay property fees and is in severe conflict with the property corporation. The property corporation failed to implement their responsibilities, resulting in a low score. The lowest scores belong to reform housing communities and affordable housing communities.
In the dimension of sense of belonging, the highest score of sense of belonging is for commercial housing, with great internal differences, including the highest for Mingchengshijia and the lowest for the Xishan apartments. The community with a mid-level score is Kangsheng Garden. The sense-of-belonging scores are lower for reform housing and affordable housing, with significant internal differences in reform housing. This includes the highest score for Banqiao Xincun and the lowest score for Shuiwen Garden.
According to the survey, Mingchengshijia is a newly built commercial housing community which has a good environment, a high green rate and sufficient support facilities. However, the Xishan apartment community is an old community with a long history of construction, a low green rate and insufficient community support facilities. Residents of the Xishan apartment community have a low education level but high rental rate. Most of them completed primary school and junior high school. Therefore, the sense of belonging is relatively weak.
In the dimension of trust and reciprocity, the highest score of trust and reciprocity is for commercial housing, with great internal differences, including the highest for Blue Valley and the lowest for Mingchengshijia. The community with a mid-level score is Kangshen Garden. Despite some internal distinctions, reform housing has the same level of reciprocity and community trust as commercial housing. The highest (Shuiwenyuan) and the lowest (Banqiao Xincun) scores belong to reform housing communities. Golden Leaf Garden belongs to the affordable housing community and has a low level of trust and reciprocity. According to the survey, flooding is a constant problem in Blue Valley communities, with the highest scores in the dimension of trust and reciprocity. Residents in this community report floods to the government, which increases the trust among residents in the process of jointly solving flood problems. This scenario is true despite the fact that cooperation between residents and property in the community is low, and solving the community flood problem is difficult. However, the fact that the residents are not intimately related is the key reason explaining the low comprehensive score of trust and reciprocity in Mingchengshijia.
In the dimension of informal social control, the score of informal social control in commercial housing is higher than in affordable housing and reform housing. The highest belongs to Mingchengshijia, and the lowest scores belong to the Xishan apartments, Blue Valley and Kangsheng Garden. The informal social control of reform housing shows polarization, including the highest for Shuiwenyuan and the lowest for Banqiao Xincun. The informal social control of affordable housing of Golden Leaf Garden is relatively low. According to the survey, Mingchengshijia has the highest score of informal social control because the residents in this community primarily have bachelor’s degrees or above, and their income levels are relatively high. Both the Xishan apartments and Banqiao Xincun have the lowest scores for informal social control because the residents in this community have lower education and a higher proportion of tenants (Figure 4).

3.3. Community Resilience Measurement

To assess the comprehensive score of community resilience, the factor analysis method was employed to identify eight indicators of community resilience. These indicators were primarily drawn from existing literature on community resilience and floods. The test results revealed a KMO statistic of 0.642. Additionally, a Bartlett sphericity test (p = 0.000 < 0.05) was conducted, indicating that the correlation coefficient matrix significantly differs from an identity matrix and that a factor analysis is necessary and appropriate for this analysis. The result of the factor analysis identified three principal components, which accounted for a cumulative variance contribution rate of 55.887%, encompassing most of the original variables. The first principal component (F1), termed organization resilience, includes neighborhood help, committee help and government help. The second principal component (F2), termed social resilience, comprises resident participation, shelter availability, insurance purchase behavior and rainstorm information access. Lastly, the third principal component (F3), named economic resilience, encompasses expense reduction strategies (Table 5).
The comprehensive factor score of each community can be calculated using the weighted sum method. These scores reflect the level of community resilience across various indicators, and a score below zero indicates that the community is performing below average.
Z = 0.02122F1 + 0.19576F2 + 0.14189F3
The highest scores belong to Mingchenshijia, Kangshen Garden and the Xishan apartments, whereas the lowest scores belong to Golden Leaf Garden, Banqiao Xincun, Shuiwenyuan and Blue Valley.

3.4. Impact of Social Capital on Community Resilience

A stepwise regression model was utilized for calculation using SPSS 24.0. The individual attributes, risk perception and social capital were each examined in relation to community resilience, resulting in the derivation of multiple linear regression equations.
Y1 = −0.002 X1 − 0.150 X4 − 0.165 X6 + 0.449
Y2 = 0.051 X7 + 0.147 X8 + 0.033 X9 + 0.054 X11 + 0.000
After incorporating all three sets of variables into the model, the results indicate that in the regression equation, R2 = 0.371 and F = 12.47 (Sig = 0.000). This suggests that the regression equation demonstrates a high degree of fitting and effectiveness (Table 6). Based on the results of the regression analysis, we can derive the following multiple regression equation.
Y = −0.003 X1 − 0.111 X4 + 0.070 X7 + 0.124 X8 + 0.039 X9 + 0.046 X11 + 0.271
In the context of community resilience, the regression model comprises a total of six factors. The regression coefficients for these influencing factors do not exceed 0.5, indicating relatively low significance levels and highlighting the complexity of their impact on community resilience. The explanatory powers of individual attributes, risk perception and social capital for community resilience are 0.152, 0.306 and 0.371, respectively. Therefore, social capital has the greatest impact on community resilience, followed by individual attributes and risk perception.
The explanatory powers of individual attributes, risk perception and social capital on community resilience (R2) are 0.152, 0.306 and 0.371, respectively. Although the R2 value is not high, it is evident that the dependent variable Y has been influenced by a lot of complicated factors. Furthermore, the core variable remains significant in the context. As can be seen, social capital has a higher impact on community resilience than individual attributes and risk perception. Considering the combined impact of both groups of variables, the explanatory power of Model 3 reaches 0.371. The impact of individual attributes and risk perception on community resilience primarily focuses on age, savings transfer and community preparation, which are closely related to community resilience. The existing literature indicates a connection between age and the capacity to cope with risks. As individuals age, their ability to manage risks tends to decrease, potentially impacting community resilience. A correlation exists between risk awareness and community resilience. Risk awareness includes increasing savings and community preparation. Increased savings indicate that respondents possess a strong awareness of disaster risk prevention. Community preparation involves facility construction and lecture propaganda, among others. By enhancing residents’ risk perception, overall community resilience is strengthened.
The impact of social capital on community resilience primarily focuses on cohesion, collective efficacy, sense of belonging and informal social control. Cohesion includes the closeness of community residents’ communication and cooperation, significantly influencing community resilience. Collective efficacy involves the government, neighborhood committees and property management guiding the community to fight against floods. Sense of belonging includes the residents’ sense of identity to the community and livability. Informal social control includes community collective quality, public health and acceptance of immoral behavior.
When both sets of variables are simultaneously incorporated into the model, an enhancement in model correlation indicates that individual characteristics, risk perception and social capital all have an impact on community resilience. Age, increased savings, cohesion, collective efficacy, sense of belonging and informal social control significantly influence community resilience.

4. Conclusions and Policy Implications

4.1. Social Capital at the Community Level

These findings reveal that social capital plays a crucial role in enhancing community resilience during flood disasters. Social capital varies among reformed housing, commercial housing and affordable housing within different communities. Our findings indicate that cohesion and collective efficacy are the most significant factors contributing to social capital in Nanjing. There is evidence suggesting that communities with strong collective efficacy are better equipped to learn from past flood experiences and effectively utilize the social capital present within the community, including individuals, groups and organizations [33,34,35]. Furthermore, the most crucial criteria for enhancing community resilience in developing countries include effective neighborhood communication, resident cooperation, mutual assistance and trust in local committees.

4.2. Influencing Factors of Community Resilience

Communities with moderate to high levels of social capital are more likely to exhibit resilience in the face of flooding events. This suggests that social capital plays a crucial role in enhancing a community’s ability to recover from flood-related challenges. For instance, residents living in reformed housing generally exhibit higher cohesion scores compared to those residing in commercial or affordable housing; however, internal variations persist within each type of community. The majority of reformed housing residents consist of employees from the same workplace, resulting in close-knit neighborly relationships. In times of flood disasters, mutual assistance among neighbors living in reformed housing is more prevalent than within other types of communities. Previous studies on flood risk assessment have traditionally focused primarily on the physical factors of flooding while neglecting the socio-economic factors, such as income, age and race, as important aspects affecting the impact of urban flood disasters. Therefore, it is essential to integrate the social impact of flood disasters into the risk assessment process [36,37,38,39]. The relationships among community stakeholders and community participation are crucial social assets for coping with community disasters. Specifically, the transformation of social capital is evident in the response, recovery and reconstruction processes which directly influence the development and consolidation of capacities for community adaptation [40,41,42].

4.3. Policy Implications

Our findings have several policy implications for enhancing community resilience. Firstly, it is crucial to emphasize the importance of community committees and property services in building resilience against flood disasters. Both stakeholders require a strong ability for informal social control and collective efficacy [27]. Our interviews with local residents revealed that property services play a vital role in cleaning garbage from drains and preparing emergency flood control resources. They also disseminate warning information to ensure that all community residents are aware of potential waterlogging. A well-functioning property service has the potential to enhance trust and social cohesion among residents through activities such as focus groups and social events. Additionally, some community committees have implemented various volunteering projects, including activities for children and the establishment of community gardens, with the aim of fostering trust among residents.
Secondly, different types of communities demonstrate varying levels of social capital. Reformed housing communities tend to exhibit high levels of cohesion, especially those that are densely populated with predominantly elderly residents in urban and peri-urban areas [43,44]. In order to improve disaster preparedness, the community committee should gather basic information about residents and establish a database to identify vulnerable groups. Regular meetings for disaster prevention should be held in public squares and playgrounds. The community committee or property service should also provide sandbags and shovels to residents, especially those living on the ground floor who are more vulnerable to floods [45,46]. By contrast, commercial housing communities generally demonstrate a high level of collective efficacy, and a sense of belonging, trust and reciprocity. Strengthening these aspects of social capital in commercial housing communities can help reduce social differentiation whilst enhancing cooperation between residents and property management. This finding contributes to increased collective efficacy through improved community governance. The level of social capital in affordable housing communities is lower than in the other two types of communities. Additional efforts are required to boost collective efficacy and mutual trust in these communities.
Thirdly, the Chinese government should improve the dissemination of hazard information to the public and implement measures to mitigate the impact of flooding. Utilizing flood risk maps can play a crucial role in increasing public awareness and promoting safety education. The existing government-led disaster management model in China necessitates structural reforms to transition from a top-down approach to a bottom-up model that encourages social connections and community involvement. Establishing emergency response practices at the community level is imperative, ensuring that local areas have sufficient rescuers, resources and technical support for effective risk reduction.

Author Contributions

Conceptualization, Y.C. and H.L.; methodology, Y.C.; software, Y.C., S.L. and Q.Z.; validation, Y.C., H.L.; formal analysis, S.L.; investigation, S.L., Y.W., Q.Z. and L.F.; resources, Y.C. and H.L.; data curation, Y.C.; writing—original draft preparation, S.L., Y.W., Q.Z. and L.F.; writing—review and editing, Y.C. and H.L.; visualization, S.L.; supervision, Y.C. and H.L.; project administration, Y.C. and H.L.; funding acquisition, Y.C. and H.L. All authors have read and agreed to the published version of the manuscript.

Funding

This research was funded by (National Natural Science Foundation of China) grant number (41701186, 42371231).

Institutional Review Board Statement

Not applicable.

Informed Consent Statement

Informed consent was obtained from all subjects involved in the study.

Data Availability Statement

The raw data supporting the conclusions of this article will be made available by the authors on request.

Conflicts of Interest

The authors declare no conflict of interest.

Notes

1
Reformed housing was assigned by the government or state-owned enterprises in the pre-reform era and then the occupiers were given the full property rights with very low prices in the reform of the housing system.
2
Commercial housing in China is developed by both public and private property companies to meet the needs of higher-income groups. The unit size typically ranges from 80 m2 to 200 m2 per unit.
3
Affordable housing was a government subsidized owner-occupied housing type targeting middle- and low- income families. The unit size usually ranging between 60 m2 and 80 m2 per unit.

References

  1. National Bureau of Statistics. China Statistical Yearbook 2022; China Statistics Press: Beijing, China, 2023. [Google Scholar]
  2. He, S.J.; Liu, Y.T.; Wu, F.L.; Webster, C. Social Groups and Housing Differentiation in China’s Urban Villages: An Institutional Interpretation. Hous. Stud. 2010, 25, 671–691. [Google Scholar] [CrossRef]
  3. Zheng, S.; Song, Z.; Sun, W. Do affordable housing programs facilitate migrants’ social integration in Chinese cities? Cities 2020, 96, 102449. [Google Scholar] [CrossRef]
  4. Liu, C.L.; Song, W.X. Perspectives of Socio-Spatial Differentiation from Soaring Housing Prices A Case Study in Nanjing, China. Sustainability 2019, 11, 2627. [Google Scholar] [CrossRef]
  5. Aldrich, D.P.; Meyer, M.A. Social Capital and Community Resilience. Am. Behav. Sci. 2015, 59, 254–269. [Google Scholar] [CrossRef]
  6. Wilson, G.A. Community resilience, transitional corridors and macro-scalar lock in effects. Environ. Policy Gov. 2014, 24, 42–59. [Google Scholar] [CrossRef]
  7. Blaikie, P.; Cannon, T.; Davis, I.; Wisner, B. At Risk, Natural Hazards, People’s Vulnerability and Disasters; Routledge: London, UK, 2004. [Google Scholar]
  8. Doorn, N.; Gardoni, P.; Murphy, C. A multidisciplinary definition and evaluation of resilience: The role of social justice in defining resilience. Sustain. Resilient Infrastruct. 2018, 4, 112–123. [Google Scholar] [CrossRef]
  9. Murphy, B.L. Locating social capital in resilient community-level emergency management. Nat. Hazards 2007, 41, 297–315. [Google Scholar] [CrossRef]
  10. Coleman, J.S. Social Capital in the Creation of Human Capital. Am. J. Sociol. 1988, 94, S95–S120. [Google Scholar] [CrossRef]
  11. Putnam, R.D. Making Democracy Work: Civic Traditions in Modern Italy; Princeton University Press: Princeton, NJ, USA, 1994. [Google Scholar]
  12. Putnam, R.D. Bowling Alone: The Collapse and Revival of American Community; Simon and Schuster: New York, NY, USA, 2000. [Google Scholar]
  13. Lin, N. Social Capital: A Theory of Social Structure and Action; Cambridge University Press: Cambridge, UK, 2002. [Google Scholar]
  14. FEMA. A Whole Community Approach to Emergency Management: Principles, Themes, and Pathways for Action; Federal Emergency Management Agency: Washington, DC, USA, 2011. [Google Scholar]
  15. Cutter, S.L.; Burton, C.G.; Emrich, C.T. Disaster Resilience Indicators for Benchmarking Baseline Conditions. J. Homel. Secur. Emerg. Manag. 2010, 7, 51. [Google Scholar] [CrossRef]
  16. Peacock, W.G.; Van Zandt, S.; Zhang, Y.; Highfield, W.E. Inequities in Long-Term Housing Recovery After Disasters. J. Am. Plan. Assoc. 2014, 80, 356–371. [Google Scholar] [CrossRef]
  17. Galea, K.S.F.H.N.S. Measuring Capacities for Community Resilience. Soc. Indic. Res. 2010, 99, 227–2472. [Google Scholar]
  18. Choo, M.; Yoon, D.K. Examining the effects of the local communities’ social capital on disaster response capacity in Seoul, South Korea. Int. J. Disaster Risk Reduct. 2022, 75, 102973. [Google Scholar] [CrossRef]
  19. Fraser, T. Japanese social capital and social vulnerability indices: Measuring drivers of community resilience 2000–2017. Int. J. Disaster Risk Reduct. 2021, 52, 101965. [Google Scholar] [CrossRef]
  20. Nakagawa, Y.; Shaw, R. Social capital: A missing link to disaster recovery. Int. J. Mass Emergencies Disasters 2004, 22, 5–34. [Google Scholar] [CrossRef]
  21. Hausman, A.J.; Hanlon, A.; Seals, B. Social capital as a mediating factor in emergency preparedness and concerns about terrorism. J. Community Psychol. 2007, 35, 1073–1083. [Google Scholar] [CrossRef]
  22. Karunarathne, A.Y. Geographies of the evolution of social capital legacies in response to flood disasters in rural and urban areas in Sri Lanka. Int. J. Disaster Risk Reduct. 2021, 62, 102359. [Google Scholar] [CrossRef]
  23. Hawkins, R.L.; Maurer, K. Bonding, Bridging and Linking: How Social Capital Operated in New Orleans following Hurricane Katrina. Br. J. Soc. Work 2009, 40, 1777–1793. [Google Scholar] [CrossRef]
  24. Shaw, R.; Goda, K. From disaster to sustainable civil society: The Kobe experience. Disasters 2004, 28, 16–40. [Google Scholar] [CrossRef]
  25. Lo, A.Y.; Xu, B.; Chan, F.K.S.; Su, R. Social capital and community preparation for urban flooding in China. Appl. Geogr. 2015, 64, 1–11. [Google Scholar] [CrossRef]
  26. Liang, Y.; Jiang, C.; Ma, L.; Liu, L.; Chen, W.; Liu, L. Government support, social capital and adaptation to urban flooding by residents in the Pearl River Delta area, China. Habitat Int. 2017, 59, 21–31. [Google Scholar] [CrossRef]
  27. Cui, P.; Li, D.Z. A SNA-based methodology for measuring the community resilience from the perspective of social capitals: Take Nanjing, China as an example. Sustain. Cities Soc. 2020, 53, 101880. [Google Scholar] [CrossRef]
  28. Cutter, S.L.; Ash, K.D.; Emrich, C.T. The geographies of community disaster resilience. Glob. Environ. Change-Hum. Policy Dimens. 2014, 29, 65–77. [Google Scholar] [CrossRef]
  29. Shahid, M.A.; Bohara, A. Does social capital help in post-disaster recovery? Evidence from the Gorkha earthquake of Nepal. Int. J. Disaster Risk Reduct. 2022, 82, 103359. [Google Scholar] [CrossRef]
  30. Lyu, M.; Sun, B.Q.; Tian, X.; Wang, Y.Y. How does social capital influence shadow evacuation behavior under rainstorm disaster in China. Saf. Sci. 2023, 162, 106098. [Google Scholar] [CrossRef]
  31. Zhang, Z.Y.; Yang, A.H.; Wang, Y.X. How do social capital and village-level organizational trust affect farmers’ climate-related disaster adaptation behavior? Evidence from Hunan Province, China. Int. J. Disaster Risk Reduct. 2023, 99, 104083. [Google Scholar] [CrossRef]
  32. Wickes, R.; Zahnow, R.; Taylor, M.; Piquero, A.R. Neighborhood Structure, Social Capital, and Community Resilience: Longitudinal Evidence from the 2011 Brisbane Flood Disaster. Soc. Sci. Q. 2015, 96, 330–353. [Google Scholar] [CrossRef]
  33. Taylor, M.; Singleton, S. The communal resource: Transaction costs and the solution of collective action problems. Politics Soc. 1993, 21, 195–214. [Google Scholar] [CrossRef]
  34. Flora, J.L. Social capital and communities of place. Rural. Sociol. 1998, 63, 481–506. [Google Scholar] [CrossRef]
  35. Woolcock, M. Social capital and economic development: Toward a theoretical synthesis and policy framework. Theory Soc. 1998, 27, 151–208. [Google Scholar] [CrossRef]
  36. Jongman, B.; Koks, E.E.; Husby, T.G.; Ward, P.J. Increasing flood exposure in the Netherlands: Implications for risk financing. Nat. Hazards Earth Syst. Sci. 2014, 14, 1245–1255. [Google Scholar] [CrossRef]
  37. Aerts, J.C.; Botzen, W.J.; Clarke, K.C.; Cutter, S.L.; Hall, J.W.; Merz, B.; Michel-Kerjan, E.; Mysiak, J.; Surminski, S.; Kunreuther, H. Integrating human behaviour dynamics into flood disaster risk assessment. Nat. Clim. Chang. 2018, 8, 193–199. [Google Scholar] [CrossRef]
  38. Knighton, J.; Hondula, K.; Sharkus, C.; Guzman, C.; Elliott, R. Flood risk behaviors of United States riverine metropolitan areas are driven by local hydrology and shaped by race. Proc. Natl. Acad. Sci. USA 2021, 118, e2016839118. [Google Scholar] [CrossRef] [PubMed]
  39. Wing, O.E.J.; Lehman, W.; Bates, P.D.; Sampson, C.C.; Quinn, N.; Smith, A.M.; Neal, J.C.; Porter, J.R.; Kousky, C. Inequitable patterns of US flood risk in the Anthropocene. Nat. Clim. Chang. 2022, 12, 156–162. [Google Scholar] [CrossRef]
  40. McEwen, L.; Holmes, A.; Quinn, N.; Cobbing, P. ‘Learning for resilience’: Developing community capital through flood action groups in urban flood risk settings with lower social capital. Int. J. Disaster Risk Reduct. 2018, 27, 329–342. [Google Scholar] [CrossRef]
  41. Castro-Correa, C.P.; Ide, P.A.; Vásquez, K.W.; Maldonado, D.M.; Tello, S.P. Transformation of social capital during and after a disaster event: The cases Chañaral and Diego de Almagro, Atacama Region, Chile. Nat. Hazards 2020, 103, 2440. [Google Scholar] [CrossRef]
  42. Liu, W.M.; Gerber, E.; Jung, S.Y.; Agrawal, A. The role of human and social capital in earthquake recovery in Nepal. Nat. Sustain. 2022, 5, 167. [Google Scholar] [CrossRef]
  43. Reininger, B.M.; Rahbar, M.H.; Lee, M.; Chen, Z.X.; Alam, S.R.; Pope, J.; Adams, B. Social capital and disaster preparedness among low income Mexican Americans in a disaster prone area. Soc. Sci. Med. 2013, 83, 50–60. [Google Scholar] [CrossRef]
  44. Tan, J.; Lin, L. Exploring key social capital indicators for disaster preparedness in rural disaster-prone areas: A boosted regression tree approach. Nat. Hazards 2024, 120, 4159–4180. [Google Scholar] [CrossRef]
  45. Lwin, K.K.; Pal, I.; Shrestha, S.; Warnitchai, P. Assessing social resilience of flood-vulnerable communities in Ayeyarwady Delta, Myanmar. Int. J. Disaster Risk Reduct. 2020, 51, 101745. [Google Scholar] [CrossRef]
  46. Wickes, R.; Britt, C.; Broidy, L. The resilience of neighborhood social processes: A case study of the 2011 Brisbane flood. Soc. Sci. Res. 2017, 62, 96–119. [Google Scholar] [CrossRef]
Figure 1. Location of the case study area.
Land 13 01145 g001
Figure 2. Photos of communities. (a) Waterlogging in the basement of Golden Leaf Garden; (b) Flooding in Blue Valley; (c) Historical flooding in Xishan apartments; (d) Flood prevention supplies in Blue Valley; (e) Flood prevention supplies in Xishan apartments(note: Xishan community flood control materials warehouse, No parking outside the warehouse); (f) Basement in Kangsheng Garden.
Land 13 01145 g002
Figure 3. Social capital of community differences.
Land 13 01145 g003
Figure 4. Social capital in different dimensions for the relevant communities.
Land 13 01145 g004
Table 1. Basic information of the communities.
StreetCommunityTypeConstruction
Year
Area
(ha)
Floor Area
Ratio
Green Ratio
(%)
Building
SanhongqiaoMingchengshijiaCommercial20095.32236High-story
YuhuaKangsheng GardenCommercial199710.341.545Multiple-story
TiexinqiaoBlue ValleyCommercial20072.311.7840Multiple-story
TiexinqiaoShuiwen GardenReform19821.3235Small high-story
XishanqiaoXishan apartmentsReform19961.861.8245Small high-story
Yuhuatai EDZGolden Leaf GardenAffordable19907.041.620Multiple-story
GuxiongBanqiao XincunReform19902.86228Small high-story
Table 2. The attributes of the samples.
ItemClassificationProportion (%)ItemClassificationProportion (%)
SexMale43MarriageMarried59
Female57 Single27
Age0–203 Divorced2
21–4029 Widow12
41–8062Hukou LocationLocal77
Over 816 Migrant23
EducationPrimary school37Hu KouTown76
Junior high school22 Countryside24
High school9HousingSelf-owned86
Undergraduate26 Rental14
Postgraduate6
Table 3. The indicators of social capital and community resilience to flood.
VariablesCriterionIndicator
Dependent variable:
Community resilience
Social ResilienceResident participation
Shelter
Purchase insurance
Rainstorm information
Economic resilienceReduced expenses
Organizational resilienceNeighborhood help
Committee help
Government help
Independent variable:
Social capital
CohesionClose interaction
Resident cooperation
Resident participation
Number of greetings
Neighborhood communication
Mutual assistance
Collective
Efficiency
Property concern
Committees’ concern
Government concern
Trust of committees
Sense of BelongingResidence intention
Livability
Comfort
Community members
Trust and ReciprocityProblem-solving cooperation
Residents’ trust
Residents’ mutual assistance
Trust level
Informal Social ControlProtection of public health
Acceptance of unethical behavior
Stopping unethical behavior
Table 4. Factor analysis of urban community social capital.
FactorEvaluation Index SystemLoad
Factor
EigenvalueVariance
Contribution
Rate (%)
Cumulative
Variance
Contribution
Rate (%)
F1 CohesionClose interaction0.6983.31315.06016.060
Resident cooperation0.722
Resident participation0.700
Number of greetings0.461
Neighborhood communication0.723
Mutual assistance0.699
F2 Collective
efficacy
Property concern0.8462.97613.06028.589
Committees’ concern0.866
Government concern0.663
Trust of committees0.761
F3 Sense of
Belonging
Residence intention0.5832.64712.03040.619
Livability0.842
Comfort0.843
Community members0.575
F4 Trust and
Reciprocity
Problem-solving cooperation0.5782.64612.02552.769
Residents’ trust0.646
Residents’ mutual assistance0.805
Trust level0.623
F5 Informal
Social Control
Protection of public health0.6861.5677.12459.769
Acceptance of unethical behavior0.696
Stopping unethical behavior0.492
Table 5. Factor analysis of community resilience.
FactorEvaluation Index SystemLoad
Factor
EigenvalueVariance
Contribution Rate (%)
Cumulative Variance
Contribution Rate (%)
F1 Organization
resilience
Neighborhood help0.3531.7702.12222.122
Committee help0.871
Government help0.836
F2 Social
resilience
Resident participation0.6551.56619.57641.698
Shelter0.611
Purchase insurance0.390
Rainstorm information0.738
F3 Economic
resilience
Reduced expenses0.8991.13514.18955.887
Table 6. Regression analysis of the impact of social capital on community resilience.
ModelIModel IIModel III
IndividualAge X1−0.002 * (−1.69) −0.003 ** (−2.44)
AttributesGender X20.039 (1.00) −0.006 (−0.17)
Education X30.013 (0.896) 0.009 (0.74)
Risk PerceptionIncreased savings X4−0.150 *** (−2.78) −0.111 ** (−2.35)
Property transfer X50.027 (0.50) 0.019 (0.41)
Community preparation X6−0.165 *** (−2.57) −0.01 (−0.19)
Social CapitalCohesion X7 0.051 *** (3.35)0.070 *** (4.08)
Collective efficacy X8 0.147 *** (9.65)0.124 *** (6.93)
Sense of belonging X9 0.033 ** (2.17)0.039 ** (2.21)
Trust and reciprocity X10 0.020(1.33)0.023 (1.27)
Informal social control X11 0.054 *** (3.56)0.046 *** (2.72)
Constant0.449 *** (3.34)0.000 (0.00)0.271 ** (2.24)
Adjusted R20.1520.3060.371
F value7.10 ***24.70 ***12.47 ***
Note: t values are in brackets; *, ** and *** indicate significance at the 10%, 5% and 1% levels, respectively.
Disclaimer/Publisher’s Note: The statements, opinions and data contained in all publications are solely those of the individual author(s) and contributor(s) and not of MDPI and/or the editor(s). MDPI and/or the editor(s) disclaim responsibility for any injury to people or property resulting from any ideas, methods, instructions or products referred to in the content.

