
Per Capita Land Use through Time and Space: A New Database for (Pre)Historic Land-Use Reconstructions

 , , , , , , , and
Abstract
:1. Introduction
ALCC Models and PCLU
2. Materials and Methods
2.1. Data Sources
2.2. Data Structure
2.3. Distribution of Values
3. Results
3.1. Variation among Subsistence Strategies
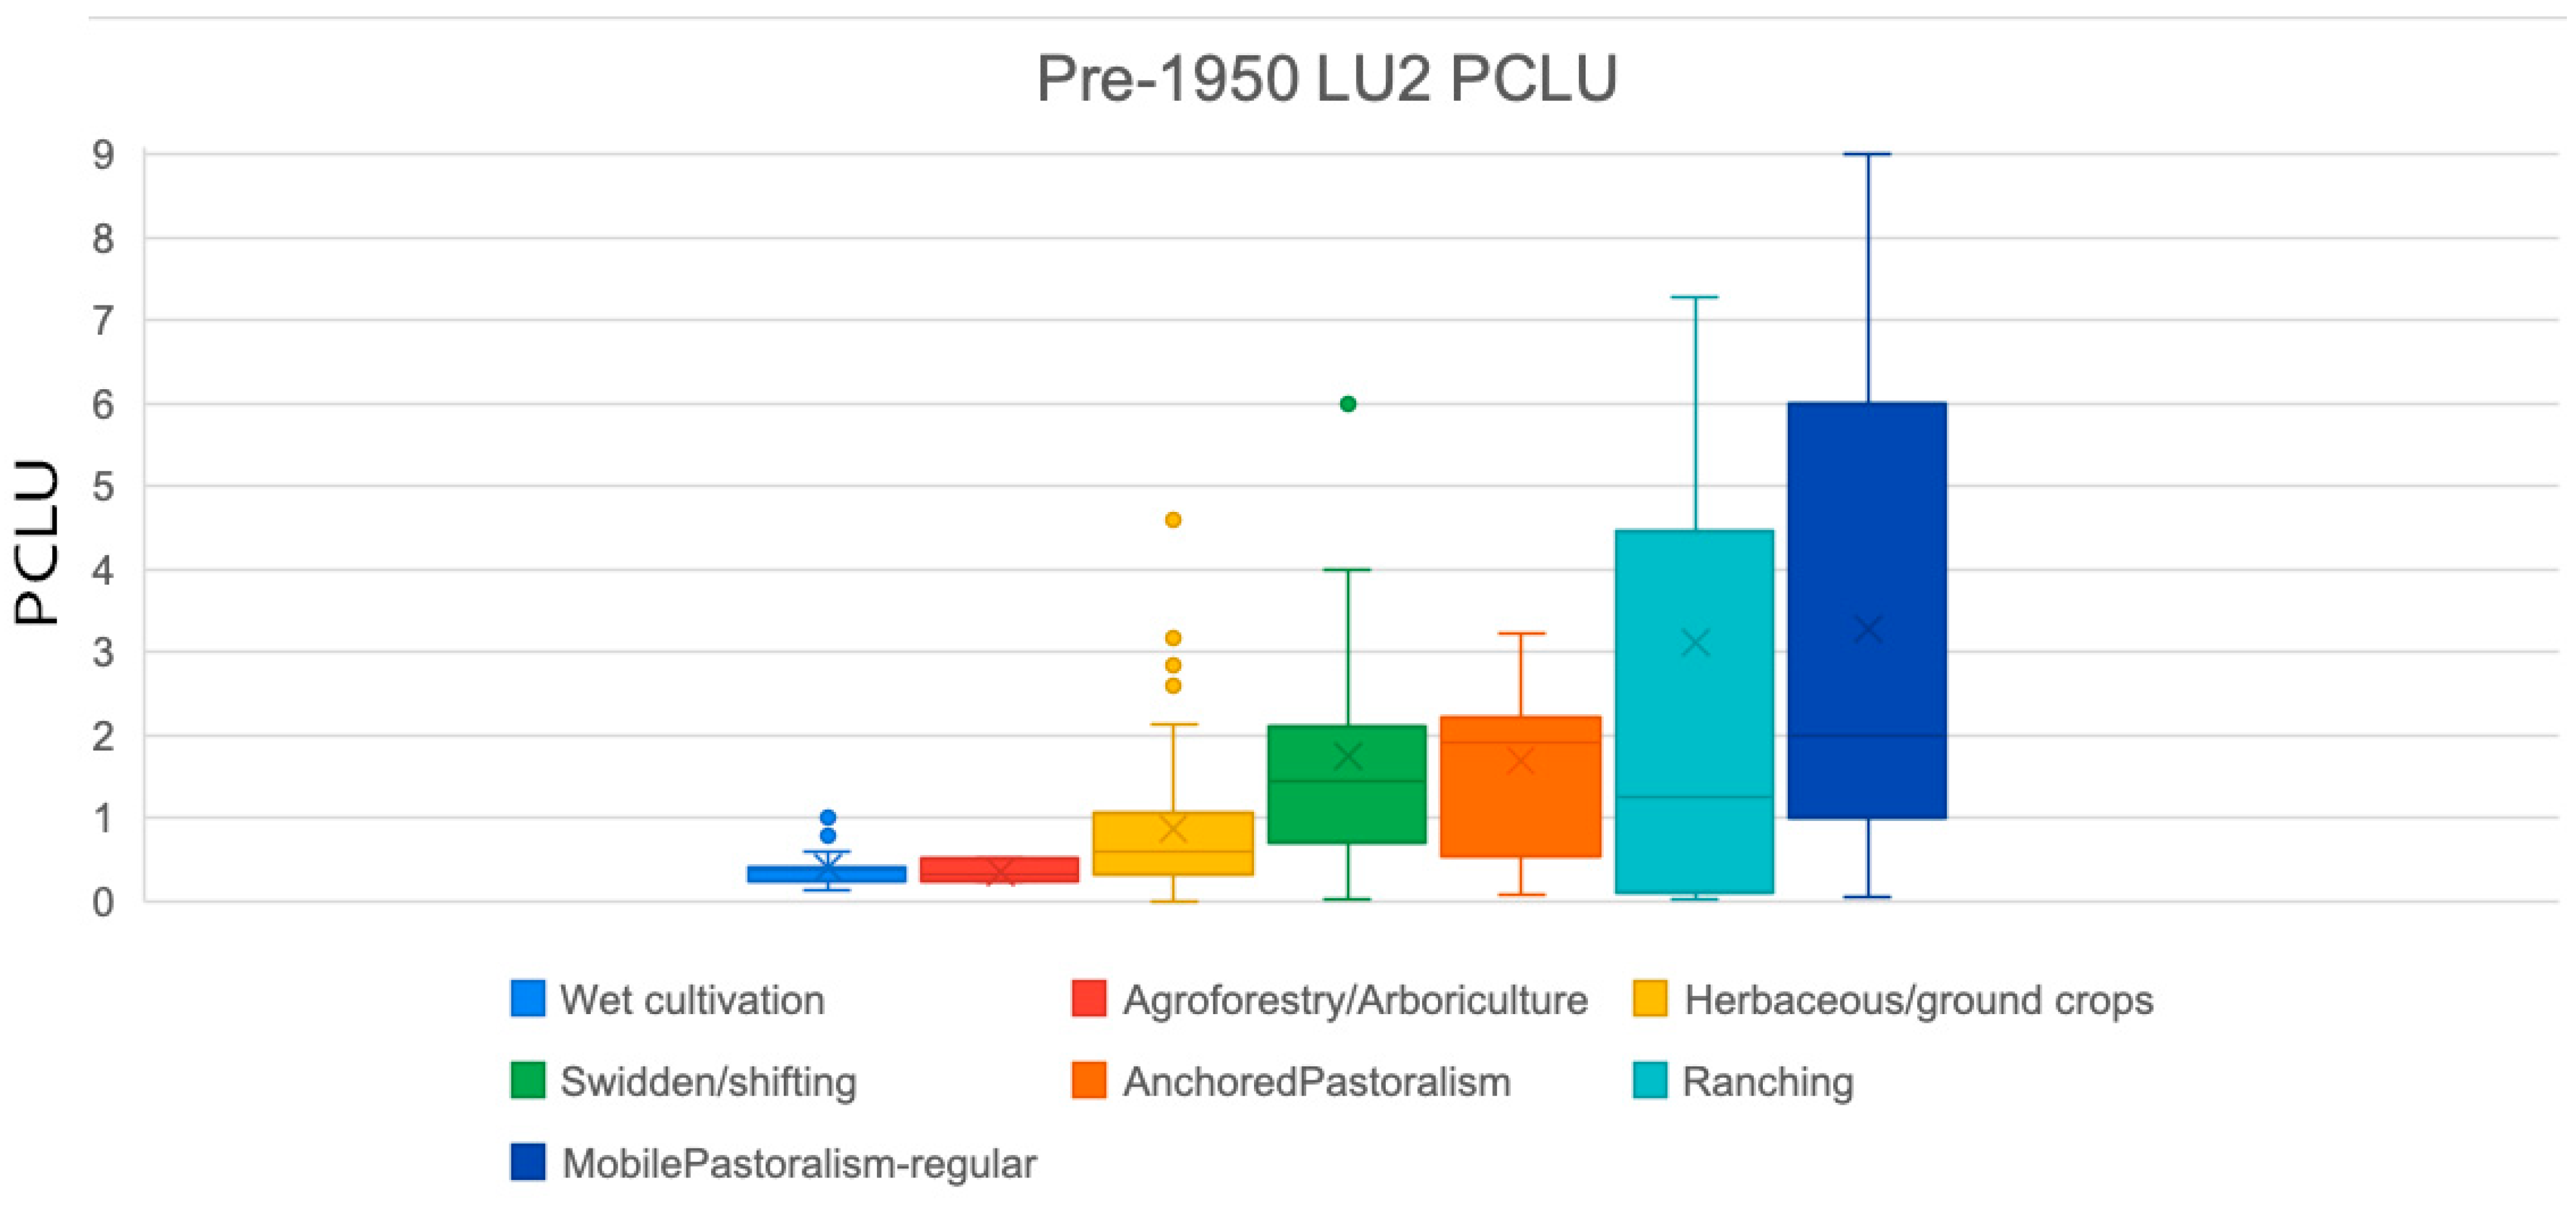
3.2. Variation among LU2 Categories
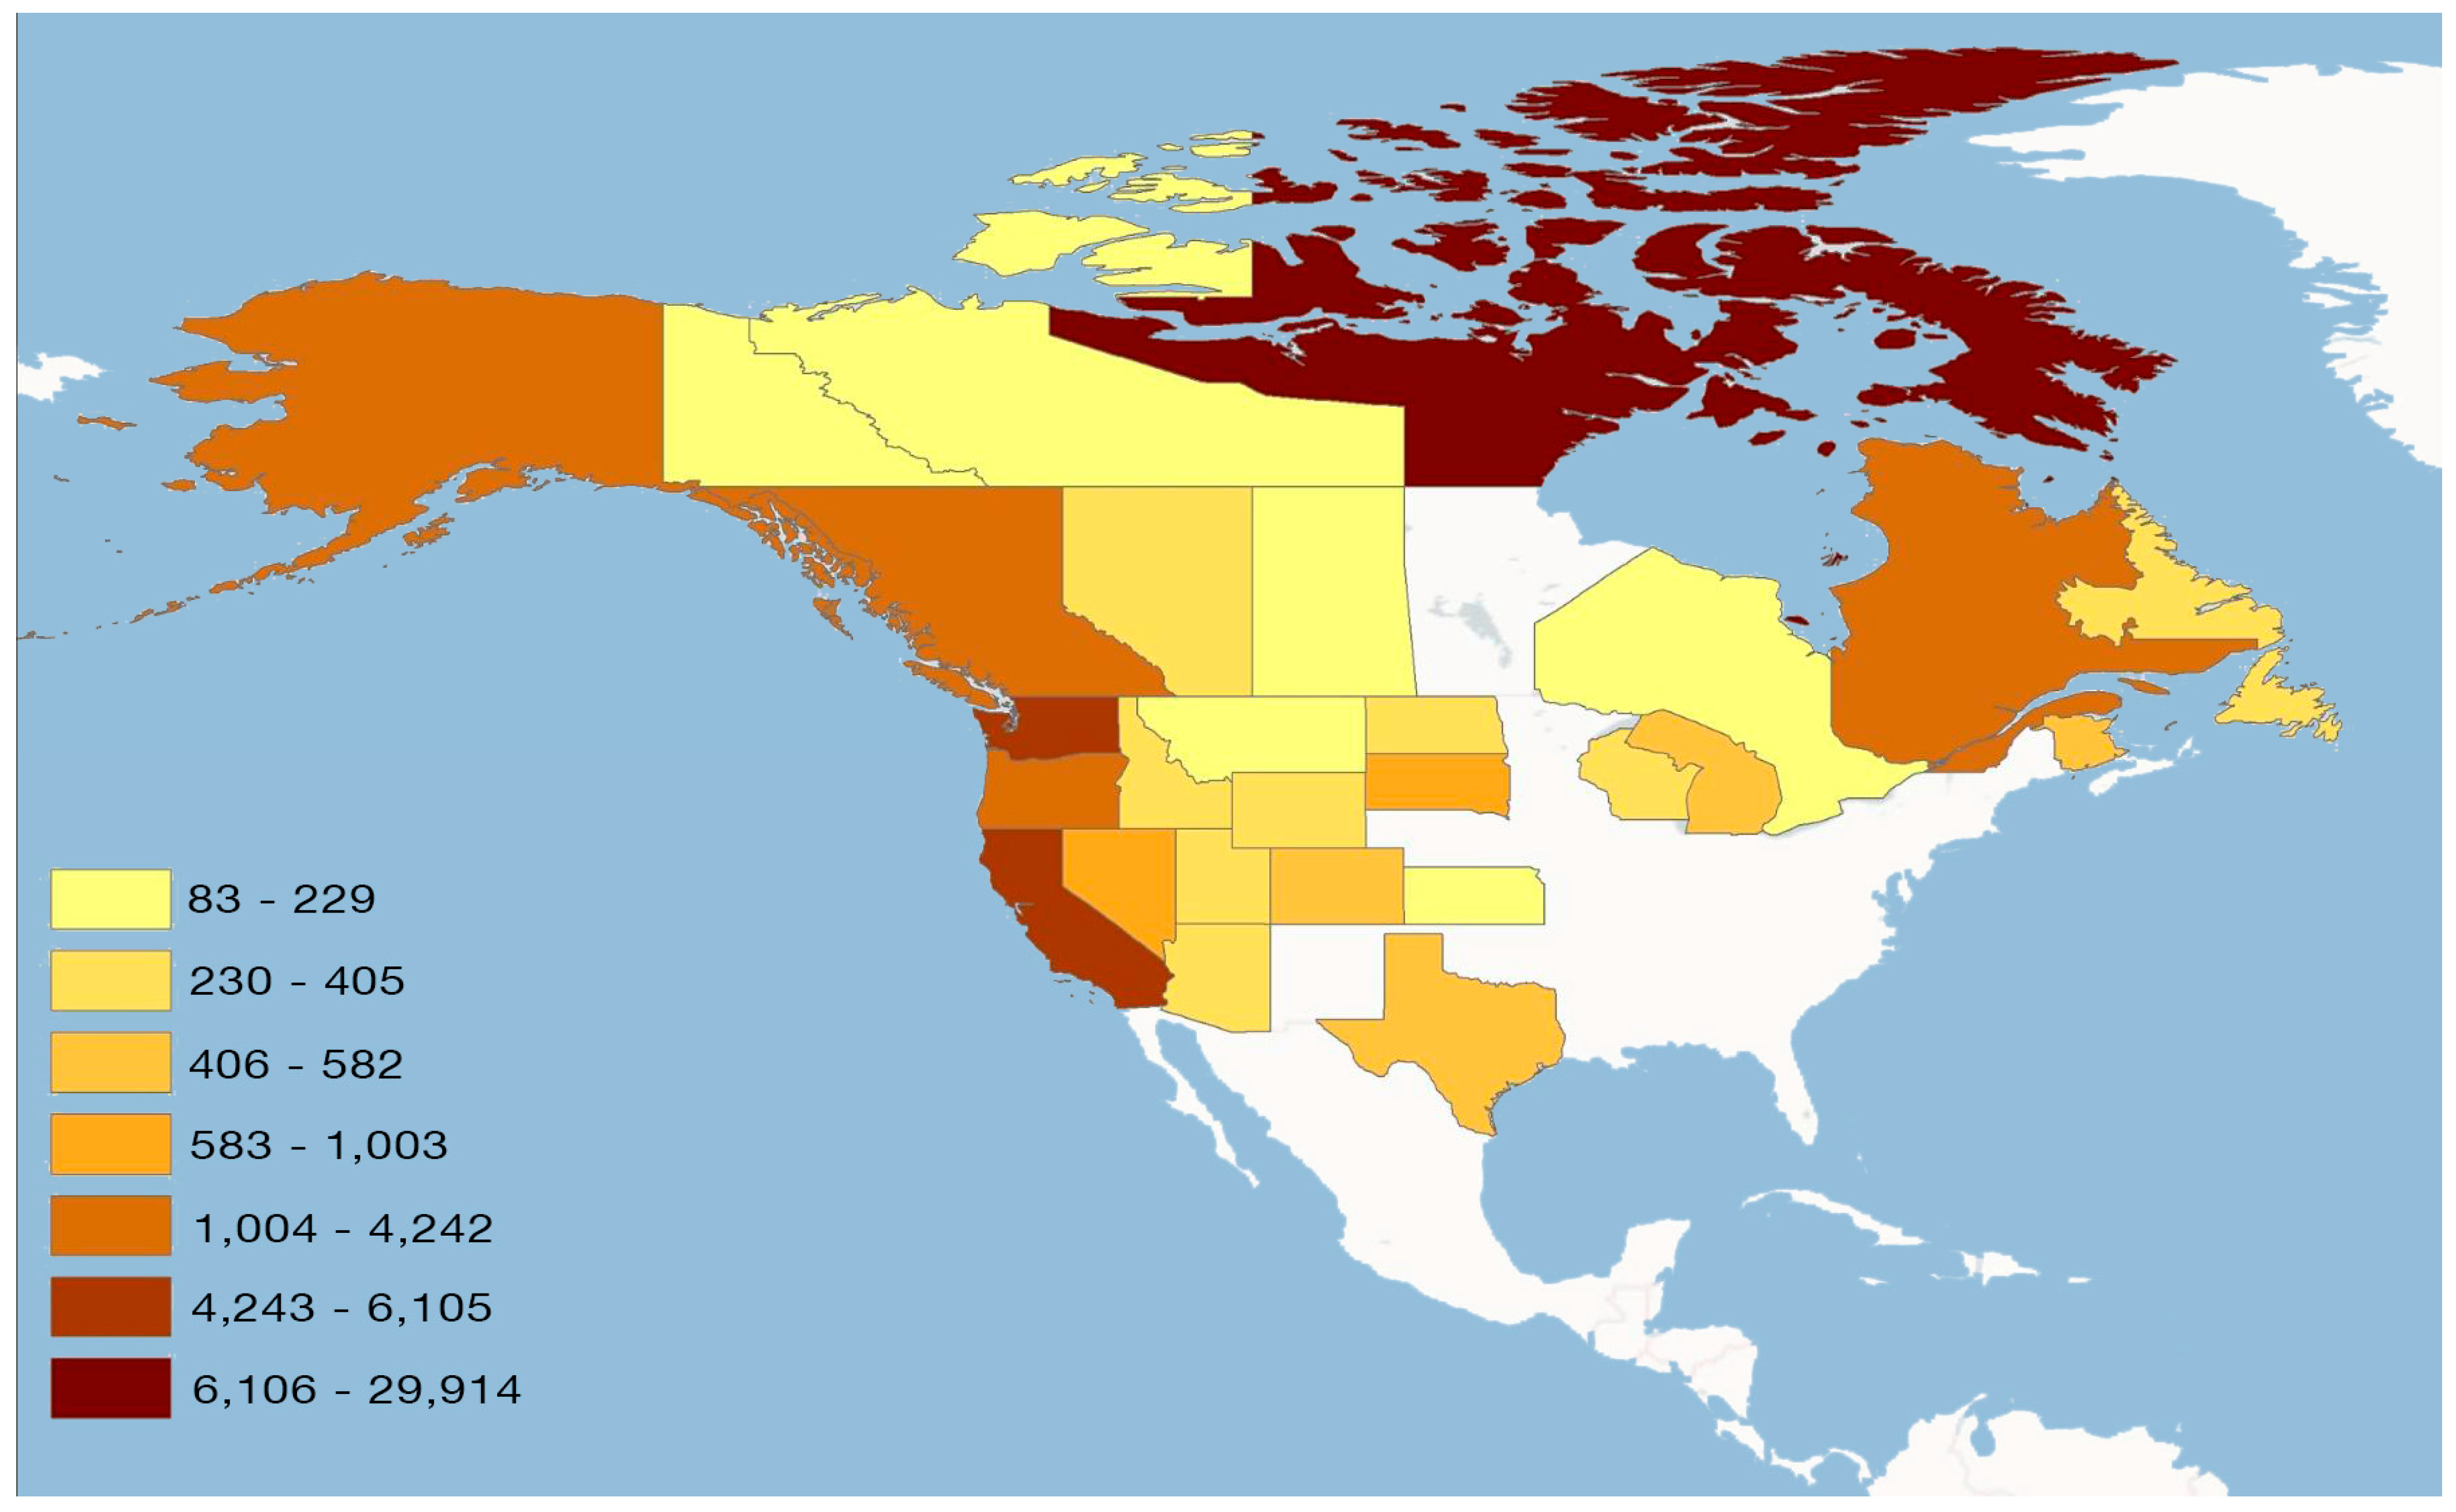
3.3. Geographic Distribution
3.4. Environmental Distribution
3.5. Subnational Regions
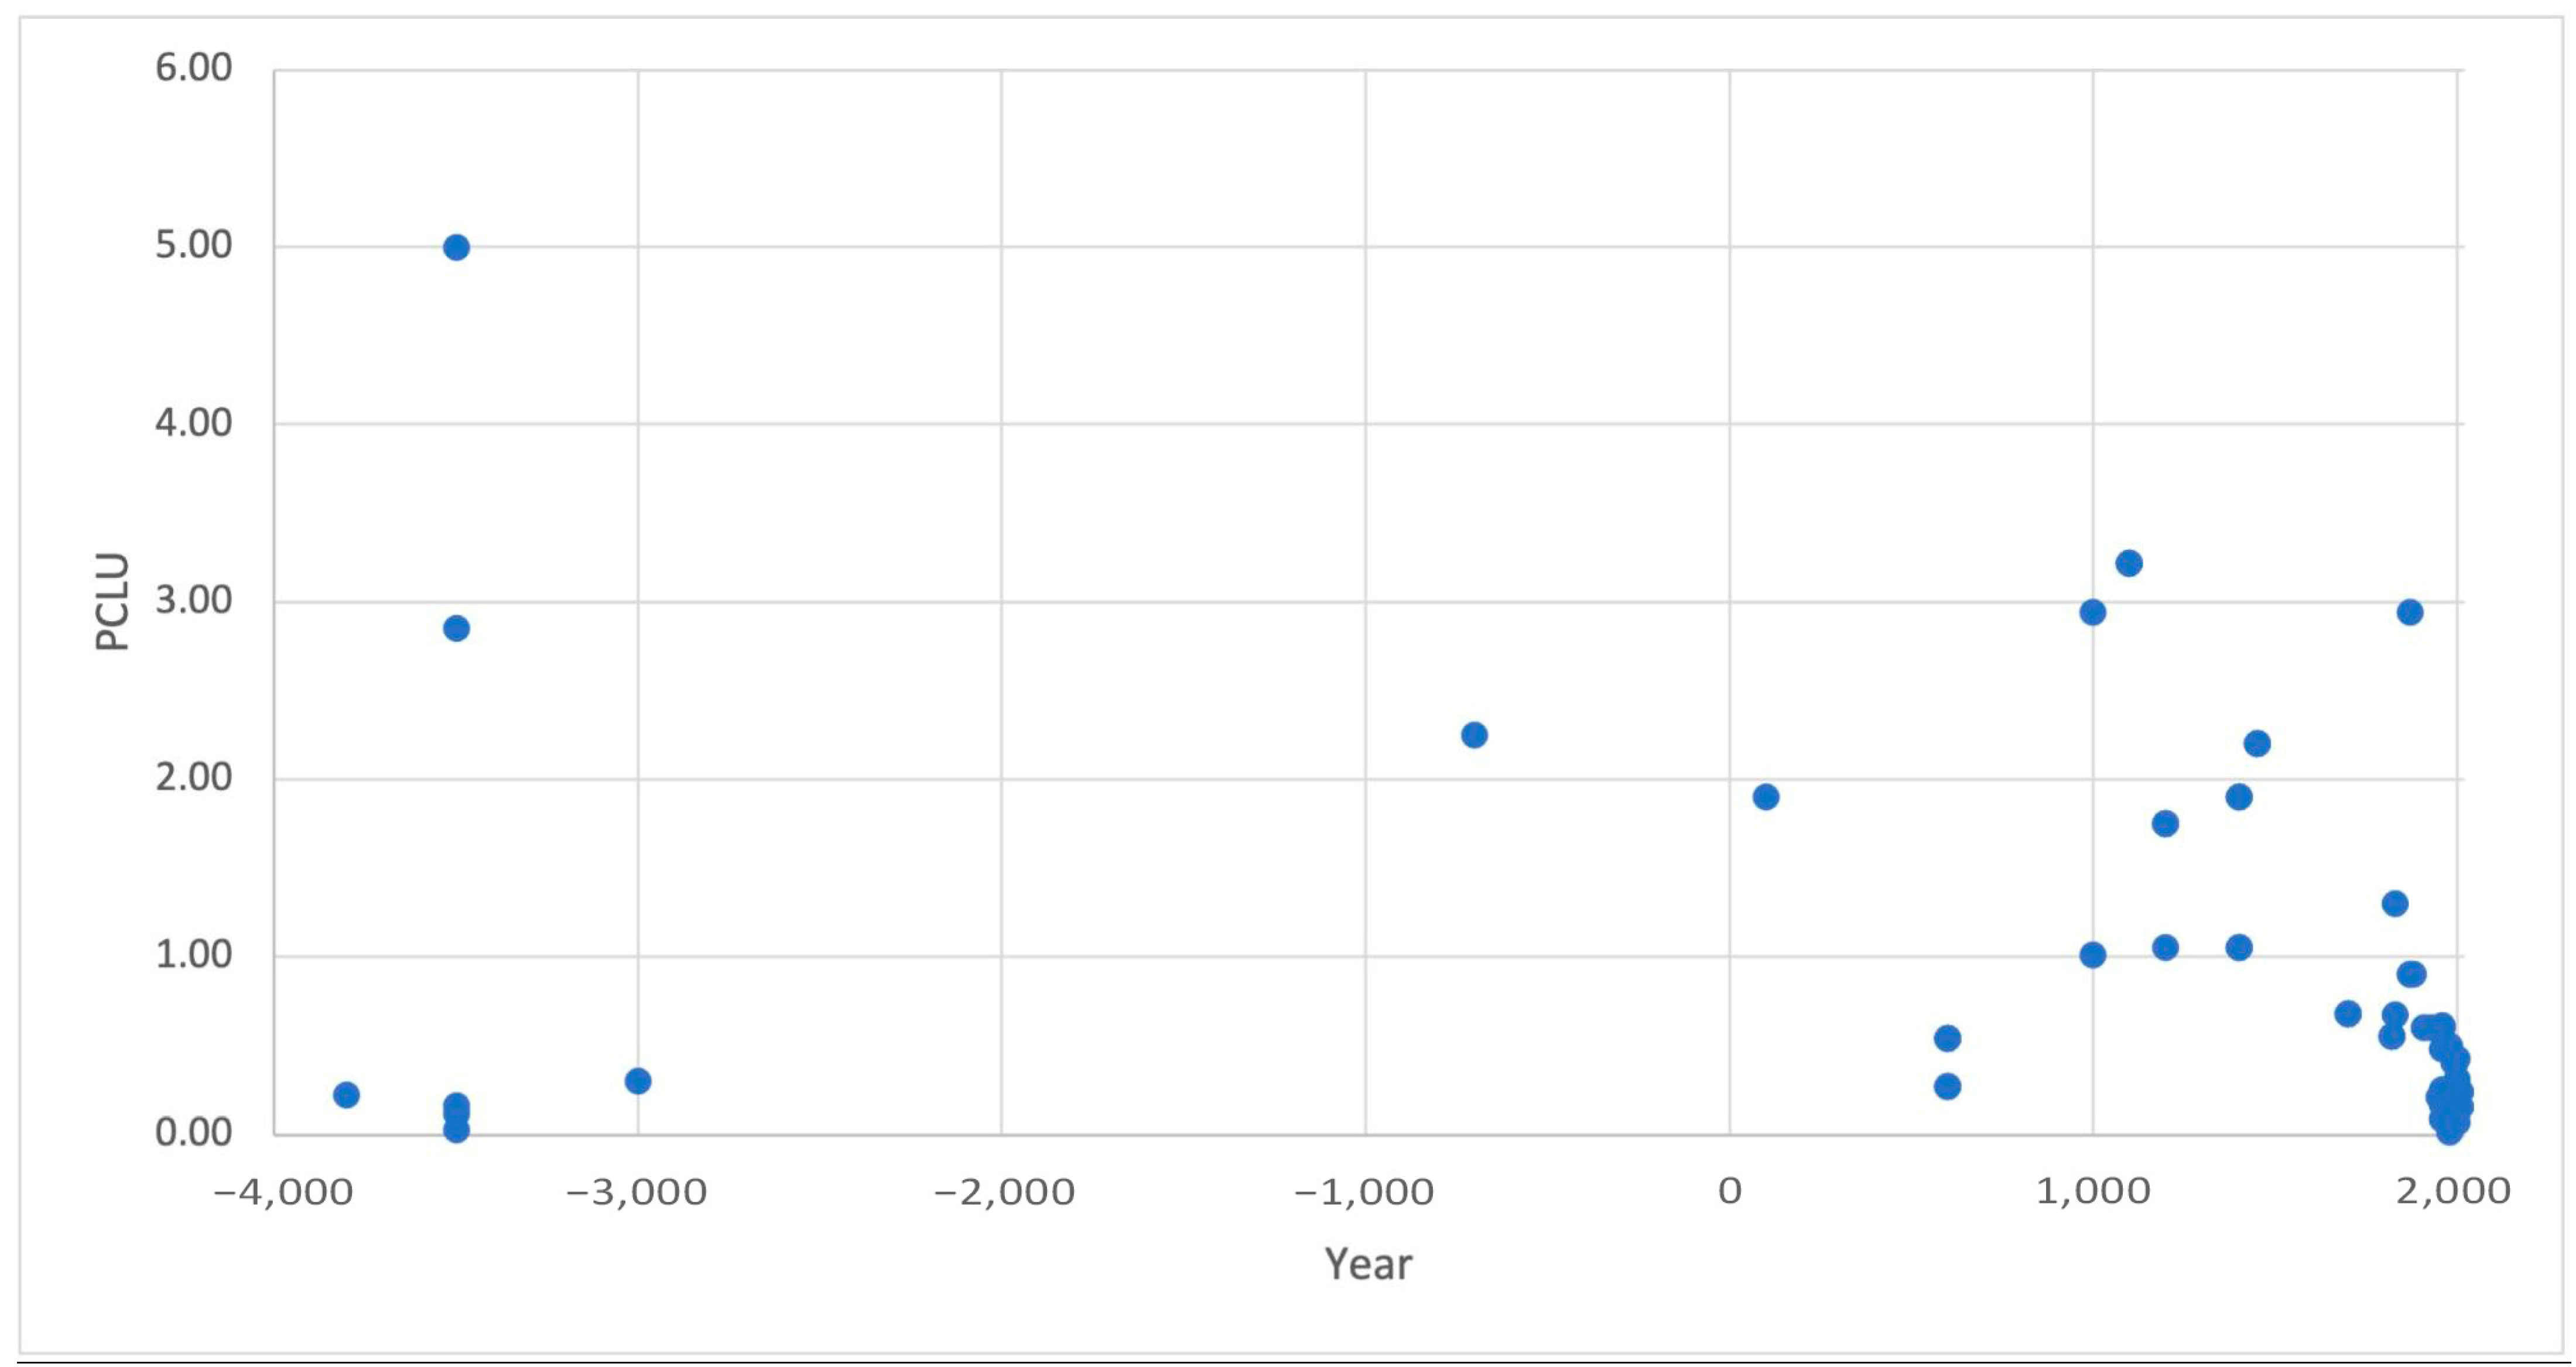
3.6. Temporal Variation
4. Discussion
4.1. Population and Land Use
4.2. Increased Nuance within LU1 Categories
4.3. Potential Applications
4.4. Impacts on HYDE
4.5. Alternate Approaches
5. Conclusions
Supplementary Materials
Author Contributions
Funding
Data Availability Statement
Conflicts of Interest
References
- Klein-Goldewijk, K.; Beusen, A.; Doelman, J.; Stehfest, E. Anthropogenic Land Use Estimates for the Holocene—HYDE 3.2. Earth Syst. Sci. Data 2017, 9, 927–953. [Google Scholar] [CrossRef]
- Klein Goldewijk, K.; Beusen, A.; Janssen, P. Long-Term Dynamic Modeling of Global Population and Built-up Area in a Spatially Explicit Way: HYDE 3.1. Holocene 2010, 20, 565–573. [Google Scholar] [CrossRef]
- Kaplan, J.O.; Krumhardt, K.M.; Ellis, E.C.; Ruddiman, W.F.; Lemmen, C.; Goldewijk, K.K. Holocene Carbon Emissions as a Result of Anthropogenic Land Cover Change. Holocene 2011, 21, 775–791. [Google Scholar] [CrossRef]
- Ruddiman, W.F. The Anthropogenic Greenhouse Era Began Thousands of Years Ago. Clim. Chang. 2003, 61, 261–293. [Google Scholar] [CrossRef]
- Ruddiman, W.F. The Early Anthropogenic Hypothesis: Challenges and Responses: Early anthropogenic hypothesis. Rev. Geophys. 2007, 45, 207. [Google Scholar] [CrossRef]
- Nikulina, A.; Macdonald, K.; Zapolska, A.; Serge, M.A.; Roche, D.M.; Mazier, F.; Davoli, M.; Svenning, J.-C.; van Wees, D.; Pearce, E.A. Hunter-Gatherer Impact on European Interglacial Vegetation: A Modelling Approach. Quat. Sci. Rev. 2024, 324, 108439. [Google Scholar] [CrossRef]
- Cui, J.; Piao, S.; Huntingford, C.; Wang, X.; Lian, X.; Chevuturi, A.; Turner, A.G.; Kooperman, G.J. Vegetation Forcing Modulates Global Land Monsoon and Water Resources in a CO2-Enriched Climate. Nat. Commun. 2020, 11, 5184. [Google Scholar] [CrossRef]
- Klein Goldewijk, K.; Ramankutty, N. Land Cover Change over the Last Three Centuries Due to Human Activities: The Availability of New Global Data Sets. GeoJournal 2004, 61, 335–344. [Google Scholar] [CrossRef]
- Ellis, E.C.; Ramankutty, N. Putting People in the Map: Anthropogenic Biomes of the World. Front. Ecol. Environ. 2008, 6, 439–447. [Google Scholar] [CrossRef]
- Hurtt, G.C.; Chini, L.P.; Frolking, S.; Betts, R.A.; Feddema, J.; Fischer, G.; Fisk, J.P.; Hibbard, K.; Houghton, R.A.; Janetos, A.; et al. Harmonization of Land-Use Scenarios for the Period 1500-2100: 600 Years of Global Gridded Annual Land-Use Transitions, Wood Harvest, and Resulting Secondary Lands. Clim. Chang. 2011, 109, 117–161. [Google Scholar] [CrossRef]
- Klein Goldewijk, K.; Dekker, S.C.; van Zanden, J.L. Per-Capita Estimations of Long-Term Historical Land Use and the Consequences for Global Change Research. J. Land Use Sci. 2017, 12, 313–337. [Google Scholar] [CrossRef]
- Pongratz, J.; Reick, C.; Raddatz, T.; Claussen, M. A Reconstruction of Global Agricultural Areas and Land Cover for the Last Millennium. Glob. Biogeochem. Cycles 2008, 22, GB3018. [Google Scholar] [CrossRef]
- Morrison, K.D.; Hammer, E.; Boles, O.J.C.; Madella, M.; Whitehouse, N.J.; Gaillard, M.-J.; Bates, J.; Vander Linden, M.; Merlo, S.; Yao, A.; et al. Mapping Past Human Land Use Using Archaeological Data: A New Classification for Global Land Use Synthesis and Data Harmonization. PLoS ONE 2021, 16, e0246662. [Google Scholar] [CrossRef]
- Beck, H.E.; Zimmermann, N.E.; McVicar, T.R.; Vergopolan, N.; Berg, A.; Wood, E.F. Present and Future Köppen-Geiger Climate Classification Maps at 1-km Resolution. Sci. Data 2018, 5, 180214. [Google Scholar] [CrossRef]
- Kottek, M.; Grieser, J.; Beck, C.; Rudolf, B.; Rubel, F. World Map of the Köppen-Geiger Climate Classification Updated. Metz 2006, 15, 259–263. [Google Scholar] [CrossRef]
- Rubel, F.; Kottek, M. Observed and Projected Climate Shifts 1901–2100 Depicted by World Maps of the Köppen-Geiger Climate Classification. Meteorol. Z. 2010, 19, 135. [Google Scholar] [CrossRef]
- Yoo, J.; Rohli, R.V. Global Distribution of Köppen–Geiger Climate Types during the Last Glacial Maximum, Mid-Holocene, and Present. Palaeogeogr. Palaeoclimatol. Palaeoecol. 2016, 446, 326–337. [Google Scholar] [CrossRef]
- Willmes, C.; Becker, D.; Brocks, S.; Hütt, C.; Bareth, G. High Resolution Köppen-Geiger Classifications of Paleoclimate Simulations. Trans. GIS 2017, 21, 57–73. [Google Scholar] [CrossRef]
- FAO. FAOStat Land Use Domain; FAO: Rome, Italy, 2020. [Google Scholar]
- FAO. FAOStat Annual Population; FAO: Rome, Italy, 2019. [Google Scholar]
- The World Bank. The World Bank Global Strategy to Improve Agricultural and Rural Statistics; The World Bank: Washington, DC, USA, 2011. [Google Scholar]
- Carfagna, E.; Pratesi, M.; Carfagna, A. Methodological Developments for Improving the Reliability and Cost-Effectiveness of Agricultural Statistics in Developing Countries. In Proceedings of the 59th World Statistics Congress of the International Statistical Institute, The Hague, The Netherlands, 25–30 August 2013. [Google Scholar]
- Schoolcraft, H.R. Notes on the Iroquois: Or, Contributions to American History, Antiquities, and General Ethnology; E. H. Pease & Co.: Albany, NY, USA, 1847. [Google Scholar]
- Simpson, J.H. Palestine. Report on Immigration, Land Settlement and Development [and Appendix Containing Maps]; [Parliament. Papers by command] Cmd. 3686-3687; H.M. Stationery Off.: London, UK, 1930. [Google Scholar]
- Stadelman, R. Maize Cultivation in Northwestern Guatemala; Carnegie Institution of Washington Publication; Johnson Reprint Corporation: New York, NY, USA, 1940. [Google Scholar]
- Piper, C.V.; Vinall, H.N.; Oakley, R.A.; Carrier, L.; Baker, O.E.; Cotton, J.; Juve, O.A.; Bradshaw, N.P.; Sheets, E.; Marsh, C.D. Our Forage Resources; USDA Yearbook; United States Department of Agriculture: Washington, DC, USA, 1924.
- Allan, W. The African Husbandman; Oliver and Boyd: Edinburgh, UK, 1965. [Google Scholar]
- Humphrey, N. The Relationship of Population to the Land in South Nyeri. In The Kikuyu Lands; Government Printer: Nairobi, Kenya, 1945; pp. 1–17. [Google Scholar]
- Dikau, R.; Herget, J.; Hennrich, K. Land Use and Climate Impacts on Fluvial Systems during the Period of Agriculture in the River Rhine Catchment (RhineLUCIFS)—An Introduction. Erdkunde 2005, 177–183. [Google Scholar] [CrossRef]
- Lang, A.; Preston, N.; Dickau, R.; Bork, H.-R.; Rudiger, M. Examples from the Rhine catchment. Pages News 2000, 8, 11–13. [Google Scholar] [CrossRef]
- Houben, P.; Burggraaff, P.; Hoffmann, T.; Kleefeld, K.; Zimmermann, A.; Dikau, R. Reconstructing Holocene Land-Use Change and Sediment Budgets in the Rhine System. Pages News 2007, 15, 17–18. [Google Scholar] [CrossRef]
- Schmidt, I.; Hilpert, J.; Kretschmer, I.; Peters, R.; Broich, M.; Schiesberg, S.; Vogels, O.; Wendt, K.P.; Zimmermann, A.; Maier, A. Approaching Prehistoric Demography: Proxies, Scales and Scope of the Cologne Protocol in European Contexts. Phil. Trans. R. Soc. B 2021, 376, 20190714. [Google Scholar] [CrossRef] [PubMed]
- Russell-Smith, J.; Lucas, D.; Gapindi, M.; Kapirigi, N.; Namingum, G.; Giuliani, P.; Chaloupka, G. Aboriginal Resource Utilization and Fire Management Practice in Western Arnherm Land, Monsoonal Northern Australia: Notes for Prehistory, Lessons for the Future. Human Ecol. 1997, 25, 159–195. [Google Scholar] [CrossRef]
- Gerbens-Leenes, W.; Nonhebel, S. Food and Land Use. The Influence of Consumption Patterns on the Use of Agricultural Resources. Appetite 2005, 45, 24–31. [Google Scholar] [CrossRef] [PubMed]
- Debenham, F. The Bushman’s Way of Life: Freedom and Contentment in Arid Surroundings. Times Br. Colon. Rev. 1954, 13, 7. [Google Scholar]
- Tindale, N.B. Aborigines: The White Contact. In Australian Encyclopaedia; Butterworth: Sydney, Australia, 1958. [Google Scholar]
- Binford, L.R. Constructing Frames of Reference: An Analytical Method for Archaeological Theory Building Using Hunter-Gatherer and Environmental Data Sets; University of California Press: Berkeley, CA, USA, 2001; ISBN 978-0-520-22393-6. [Google Scholar]
- Murdock, G.P. Ethnographic Atlas; University of Pittsburgh: Pittsburg, PA, USA, 1967. [Google Scholar]
- Gaillard, M.-J.; Morrison, K.; Whitehouse, N. Past Anthropogenic Land Use and Land Cover Change at the Global Scale for Climate Modelling Studies: PAGES LandCover6k Working Group. Quat. Perspect. 2015, 22, 25–27. [Google Scholar]
- Morrison, K.; Hammer, E.; Popova, L.; Madella, M.; Whitehouse, N.; Gaillard, M.-J. Global-Scale Comparisons of Human Land Use: Developing Shared Terminology for Land-Use Practices for Global Change. Pages Mag. 2018, 26, 8–9. [Google Scholar] [CrossRef]
- Di Gregorio, A.; Jansen, L.J.M. Land Cover Classification System (LCCS): Classification Concepts and User Manual, for Software Version 1.0; FAO: Rome, Italy, 2001; ISBN 978-92-5-104216-8. [Google Scholar]
- Schroeder, S. Maize Productivity in the Eastern Woodlands and Great Plains of North America. Am. Antiq. 1999, 64, 499–516. [Google Scholar] [CrossRef]
- Kay, A.U.; Kaplan, J.O. Human Subsistence and Land Use in Sub-Saharan Africa, 1000BC to AD1500: A Review, Quantification, and Classification. Anthropocene 2015, 9, 14–32. [Google Scholar] [CrossRef]
- Sheuyange, A.; Oba, G.; Weladji, R.B. Effects of Anthropogenic Fire History on Savanna Vegetation in Northeastern Namibia. J. Environ. Manag. 2005, 75, 189–198. [Google Scholar] [CrossRef]
- Gammage, B. The Biggest Estate on Earth: How Aborigines Made Australia; Nachdr., Allen & Unwin: Sydney, Australia, 2012; ISBN 978-1-74331-132-5. [Google Scholar]
- Munro, N.D.; Bar-Oz, G.; Meier, J.S.; Sapir-Hen, L.; Stiner, M.C.; Yeshurun, R. The Emergence of Animal Management in the Southern Levant. Sci. Rep. 2018, 8, 9279. [Google Scholar] [CrossRef]
- Ramankutty, N.; Foley, J.A. Estimating Historical Changes in Global Land Cover: Croplands from 1700 to 1992. Glob. Biogeochem. Cycles 1999, 13, 997–1027. [Google Scholar] [CrossRef]
- Ellis, E.C.; Beusen, A.H.W.; Goldewijk, K.K. Anthropogenic Biomes: 10,000 BCE to 2015 CE. Land 2020, 9, 129. [Google Scholar] [CrossRef]
- Cropper, M.; Griffiths, C. The Interaction of Population Growth and Environmental Quality. Am. Econ. Rev. 1994, 84, 250–254. [Google Scholar]
- Weiberg, E.; Hughes, R.E.; Finné, M.; Bonnier, A.; Kaplan, J.O. Mediterranean Land Use Systems from Prehistory to Antiquity: A Case Study from Peloponnese (Greece). J. Land Use Sci. 2019, 14, 1–20. [Google Scholar] [CrossRef]
- Wills, D.M.; Whipple, C.J.; Takuno, S.; Kursel, L.E.; Shannon, L.M.; Ross-Ibarra, J.; Doebley, J.F. From Many, One: Genetic Control of Prolificacy during Maize Domestication. PLoS Genet. 2013, 9, e1003604. [Google Scholar] [CrossRef] [PubMed]
- Palka, J.W. Ancestral Maya Domesticated Waterscapes, Ecological Aquaculture, and Integrated Subsistence. Anc. Mesoam. 2023, 35, 208–236. [Google Scholar] [CrossRef]
- Comptour, M.; Caillon, S.; Rodrigues, L.; McKey, D. Wetland Raised-Field Agriculture and Its Contribution to Sustainability: Ethnoecology of a Present-Day African System and Questions about Pre-Columbian Systems in the American Tropics. Sustainability 2018, 10, 3120. [Google Scholar] [CrossRef]
- Morrison, K.D. The Intensification of Production: Archaeological Approaches. J. Archaeol. Method Theory 1994, 1, 111–159. [Google Scholar] [CrossRef]
- Boserup, E. The Conditions of Agricultural Growth: The Economics of Agrarian Change under Population Pressure; Allen & Unwin: London, UK, 1965; ISBN 978-0-202-36387-5. [Google Scholar]
- Stiner, M.C. Paleolithic Population Growth Pulses Evidenced by Small Animal Exploitation. Science 1999, 283, 190–194. [Google Scholar] [CrossRef]
- Stiner, M.C.; Munro, N.D.; Surovell, T.A. The Tortoise and the Hare: Small-Game Use, the Broad-Spectrum Revolution, and Paleolithic Demography. Curr. Anthropol. 2000, 41, 39–79. [Google Scholar] [CrossRef] [PubMed]
- Yeshurun, R.; Bar-Oz, G.; Weinstein-Evron, M. Intensification and Sedentism in the Terminal Pleistocene Natufian Sequence of El-Wad Terrace (Israel). J. Hum. Evol. 2014, 70, 16–35. [Google Scholar] [CrossRef] [PubMed]
- Kennett, D.J.; Winterhalder, B. (Eds.) Behavioral Ecology and the Transition to Agriculture; Origins of human behavior and culture; University of California Press: Berkeley, CA, USA, 2006; ISBN 978-0-520-24647-8. [Google Scholar]
- Redding, R.W. A General Explanation of Subsistence Change: From Hunting and Gathering to Food Production. J. Anthropol. Archaeol. 1988, 7, 56–97. [Google Scholar] [CrossRef]
- Sherratt, A. Plough and Pastoralism: Aspects of the Secondary Products Revolution; Cambridge University Press: Cambridge, UK, 1981. [Google Scholar]
- Marchant, R.; Richer, S.; Boles, O.; Capitani, C.; Courtney-Mustaphi, C.J.; Lane, P.; Prendergast, M.E.; Stump, D.; De Cort, G.; Kaplan, J.O.; et al. Drivers and Trajectories of Land Cover Change in East Africa: Human and Environmental Interactions from 6000 years Ago to Present. Earth Sci. Rev. 2018, 178, 322–378. [Google Scholar] [CrossRef]
- Stephens, L.; Fuller, D.; Boivin, N.; Rick, T.; Gauthier, N.; Kay, A.; Marwick, B.; Armstrong, C.G.; Barton, C.M.; Denham, T.; et al. Archaeological Assessment Reveals Earth’s Early Transformation through Land Use. Science 2019, 365, 897–902. [Google Scholar] [CrossRef] [PubMed]
- Greenfield, H.J. The Secondary Products Revolution: The Past, the Present and the Future. World Archaeol. 2010, 42, 29–54. [Google Scholar] [CrossRef]
- Hill, A.C. Specialized Pastoralism and Social Stratification—Analysis of the Fauna from Chalcolithic Tel Tsaf, Israel. Ph.D. Thesis, University of Connecticut, Mansfield, CT, USA, 2011. [Google Scholar]
- Marciniak, A. The Secondary Products Revolution: Empirical Evidence and Its Current Zooarchaeological Critique. J. World Prehistory 2011, 24, 117–130. [Google Scholar] [CrossRef]
- Bishop, R.R.; Gröcke, D.R.; Ralston, I.; Clarke, D.; Lee, D.H.J.; Shepherd, A.; Thomas, A.S.; Rowley-Conwy, P.A.; Church, M.J. Scotland’s First Farmers: New Insights into Early Farming Practices in North-West Europe. Antiquity 2022, 96, 1087–1104. [Google Scholar] [CrossRef]
- Scharl, S.; Zerl, T.; Eckmeier, E.; Gerlach, R. Earliest Archeological Evidence of Fertilization in Central Europe. J. Plant Nutr. Soil Sci. 2023, 186, 375–382. [Google Scholar] [CrossRef]
- Hart, J.P.; Winchell-Sweeney, S. Resetting Archaeological Interpretations of Precontact Indigenous Agriculture: Maize Isotopic Evidence from Three Ancestral Mohawk Iroquoian Villages. Am. Antiq. 2023, 88, 497–512. [Google Scholar] [CrossRef]
- Kuijt, I. What Do We Really Know about Food Storage, Surplus, and Feasting in Preagricultural Communities? Curr. Anthropol. 2009, 50, 641–644. [Google Scholar] [CrossRef] [PubMed]
- Bogaard, A. The Archaeology of Food Surplus. World Archaeol. 2017, 49, 1–7. [Google Scholar] [CrossRef]
- Frangipane, M. From a Subsistence Economy to the Production of Wealth in Ancient Formative Societies: A Political Economy Perspective. Econ. Polit. 2018, 35, 677–689. [Google Scholar] [CrossRef]
- Prats, G.; Antolín, F.; Alonso, N. From the Earliest Farmers to the First Urban Centres: A Socio-Economic Analysis of Underground Storage Practices in North-Eastern Iberia. Antiquity 2020, 94, 653–668. [Google Scholar] [CrossRef]
- Wilkinson, T.; Miller, N.; Reichel, C.; Whitcomb, D. On the Margin of the Euphrates: Settlement and Land Use at Tell Es-Sweyhat and in the Upper Lake Assad Area, Syria; Excavations at Tell es-Sweyhat, Syria; Oriental Institute of the University of Chicago: Chicago, IL, USA, 2004; Volume 1. [Google Scholar]
- Wilkinson, T.J.; Gibson, M.; Widell, M. Models of Mesopotamian Landscapes: How Small-Scale Processes Contributed to the Growth of Early Civilizations; Archaeopress: Almería, Spain, 2013. [Google Scholar]
- Akkermans, P.M. Villages in the Steppe–Later Neolithic Settlement and Subsistence in the Balikh; Berghahn Books: New York, NY, USA, 1993. [Google Scholar]
- Butzer, K.W. Early Hydraulic Civilization in Egypt: A Study in Cultural Ecology; Prehistoric archeology and ecology; University of Chicago Press: Chicago, IL, USA, 1976; ISBN 978-0-226-08634-7. [Google Scholar]
- Kaplan, J.O.; Krumhardt, K.M.; Gaillard, M.-J.; Sugita, S.; Trondman, A.-K.; Fyfe, R.; Marquer, L.; Mazier, F.; Nielsen, A.B. Constraining the Deforestation History of Europe: Evaluation of Historical Land Use Scenarios with Pollen-Based Land Cover Reconstructions. Land 2017, 6, 91. [Google Scholar] [CrossRef]
- Gaillard, M.-J. LandCover6k: Global Anthropogenic Land-Cover Change and Its Role in Past Climate. Pages Mag. 2015, 23, 38–39. [Google Scholar] [CrossRef]
- Harrison, S.P.; Gaillard, M.-J.; Stocker, B.D.; Vander Linden, M.; Klein Goldewijk, K.; Boles, O.; Braconnot, P.; Dawson, A.; Fluet-Chouinard, E.; Kaplan, J.O.; et al. Development and Testing Scenarios for Implementing Land Use and Land Cover Changes during the Holocene in Earth System Model Experiments. Geosci. Model Dev. 2020, 13, 805–824. [Google Scholar] [CrossRef]


| Continent | # of Agriculture Values | # Pastoralism Values | # of HGFF Values | Total |
|---|---|---|---|---|
| North America | 186 | 17 | 223 | 426 |
| Latin America | 91 | 58 | 20 | 169 |
| Europe (including former USSR) | 203 | 95 | 9 | 280 |
| Asia | 244 | 42 | 24 | 310 |
| North Africa and Middle East | 311 | 29 | 0 | 340 |
| Sub-Saharan Africa | 152 | 41 | 21 | 214 |
| Oceania | 17 | 11 | 60 | 88 |
| Total | 1204 | 293 | 357 | 1854 |
| 8000– 4000 BCE | 4000– 2000 BCE | 2000– 1 BCE | 0–1000 CE | 1000–1800 CE | 1800–1900 CE | 1900–1950 CE | 1950- Present | |
|---|---|---|---|---|---|---|---|---|
| Count | 53 | 42 | 73 | 50 | 85 | 307 | 274 | 835 |
| LC6k Land-Use Category | Mean/Single PCLU | Range |
|---|---|---|
| Agriculture, herbaceous ground crops, rainfed | 0.5 | 0.21–0.79 |
| Agriculture, herbaceous ground crops, with water modification | 0.48 | 0.28–0.53 |
| Extensive, minimal | 0 | 0 |
| HGFF, low-level food production | 4248 | 588–13,333 |
| No evidence, underwater | 0 | 0 |
| Pastoralism, mobile-regular | 1.5 | 0.5–3 |
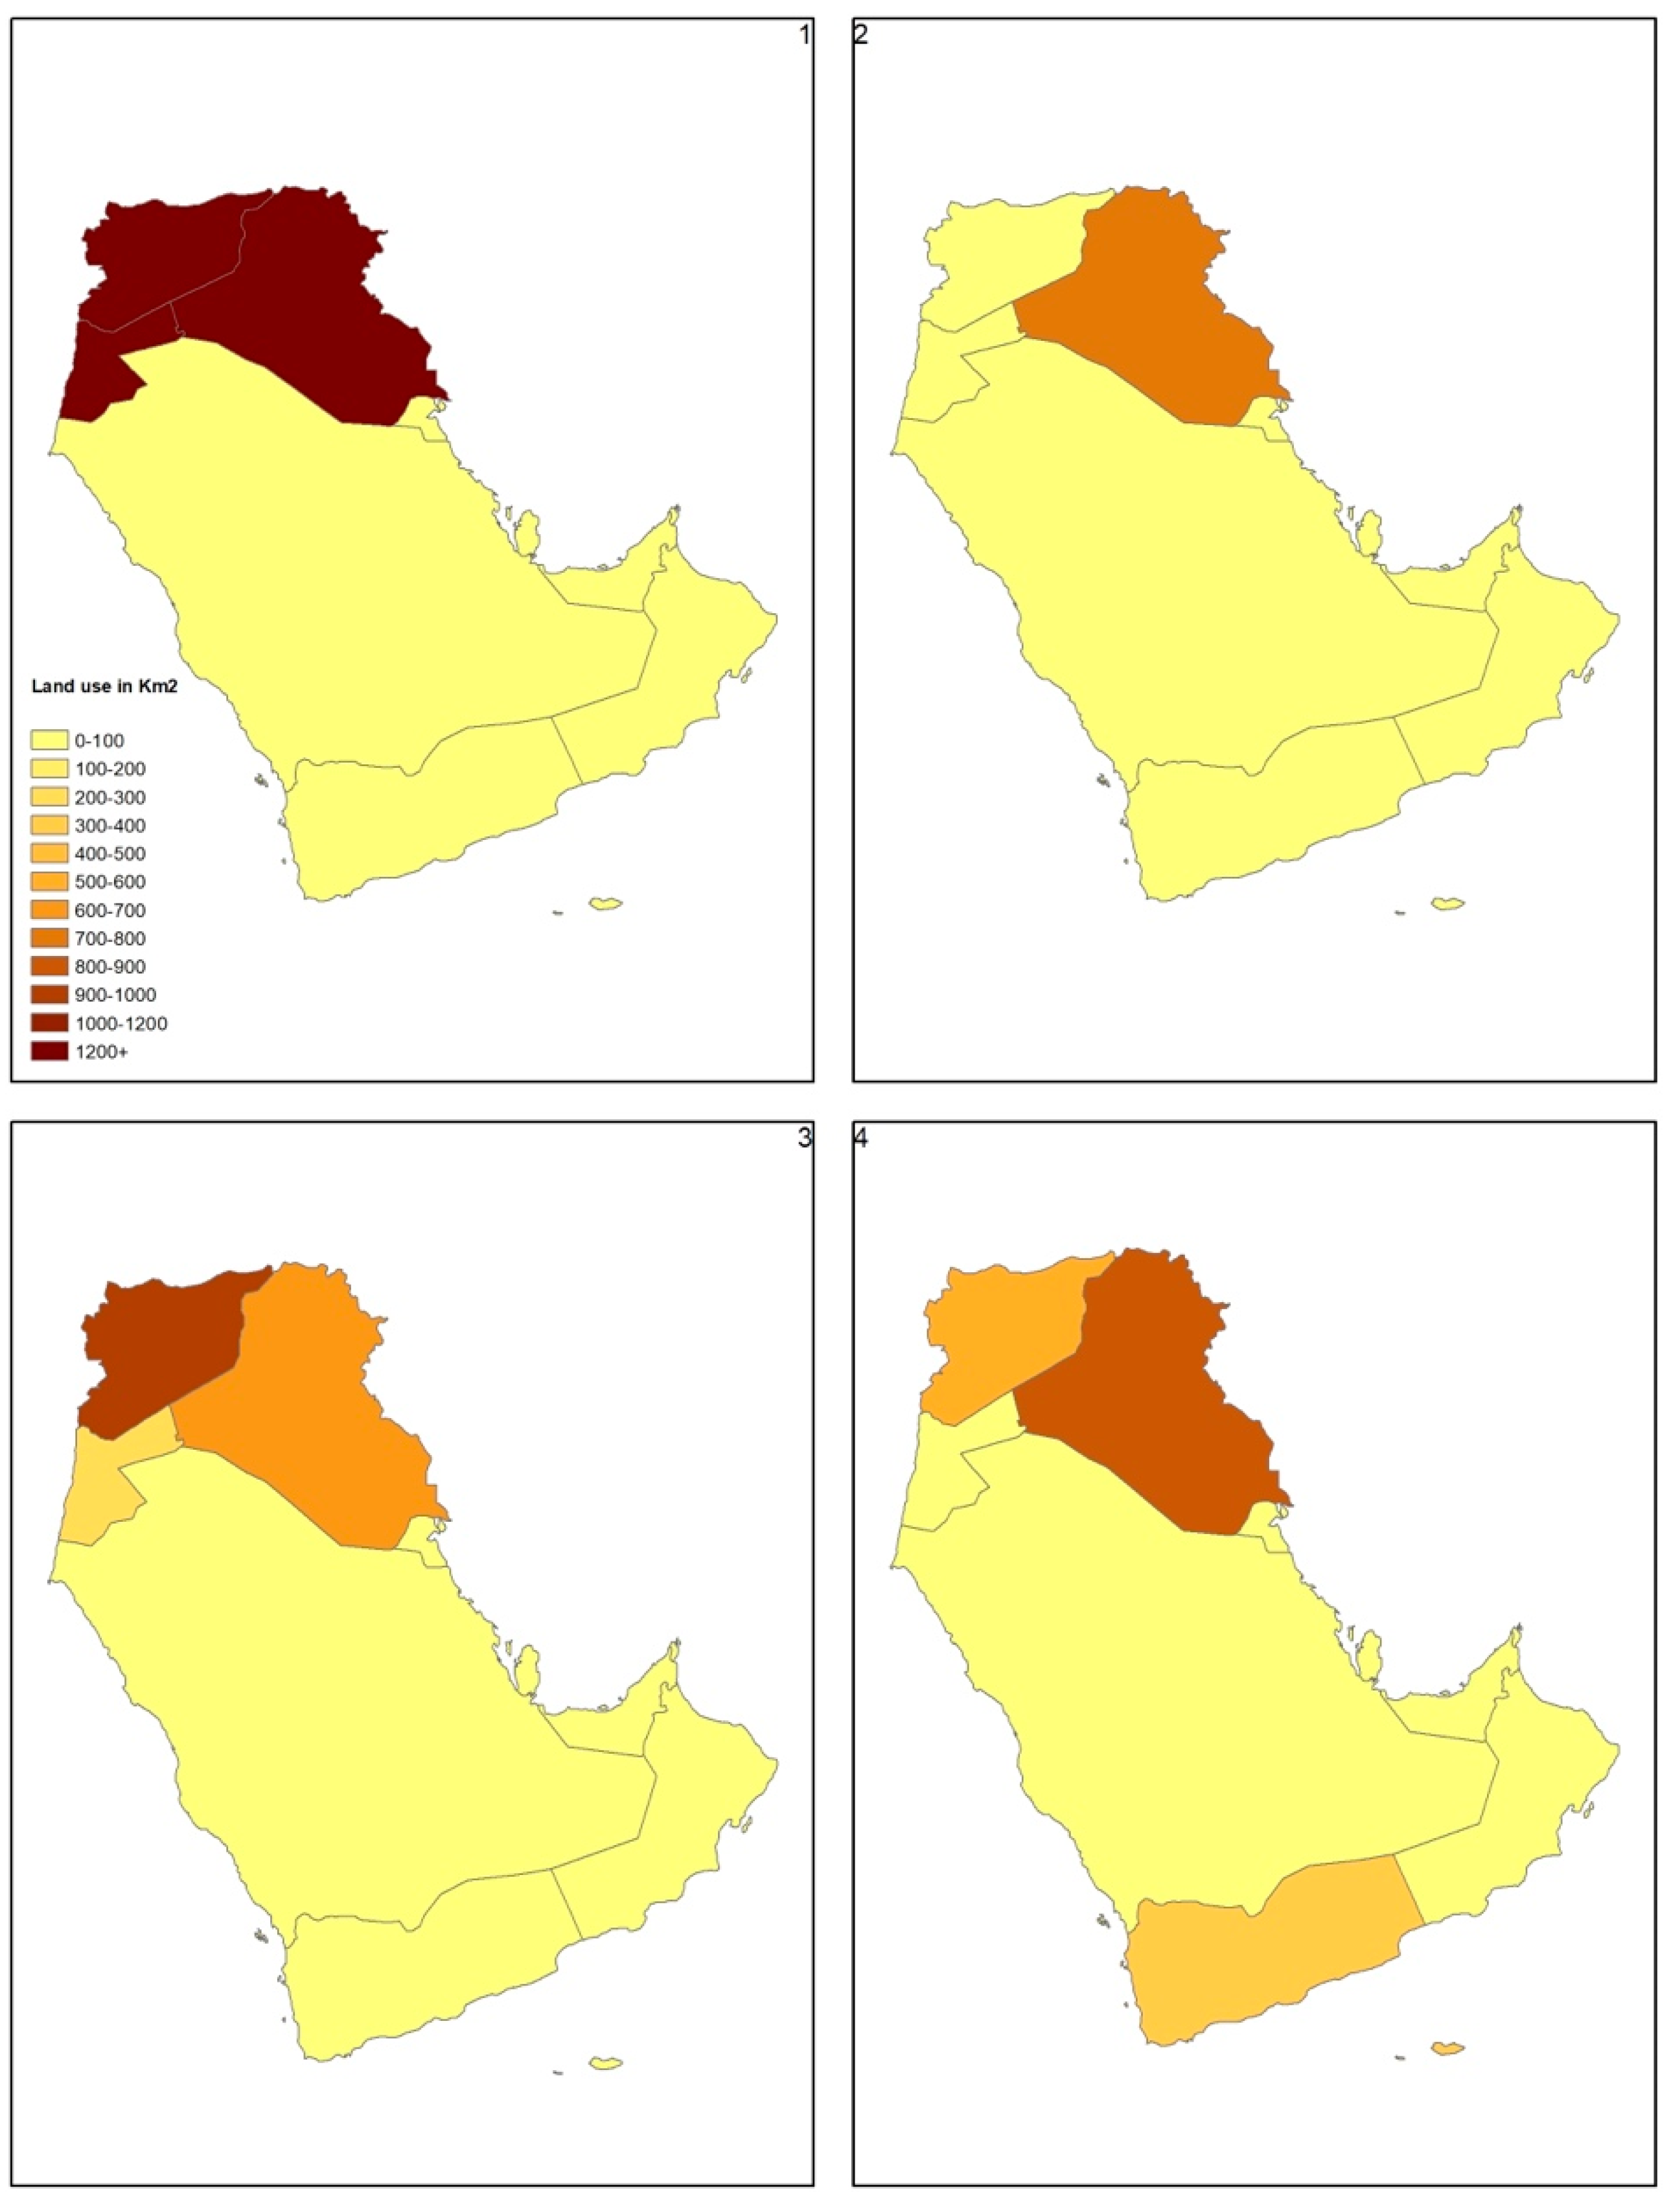
| Country | HYDE 3.2 Rainfed Agriculture | HYDE 3.2 Irrigated Agricultural Area | Irrigated Agricultural Area Using LUT | Rainfed Agricultural Area Using LUT |
|---|---|---|---|---|
| Jordan | 2267.859 | 0 | 245.09 | 0 |
| Saudi Arabia | 0 | 0 | 0 | 0 |
| Iraq | 13,129.88 | 749.3536 | 606 | 858.11 |
| Yemen | 0 | 0 | 0 | 301.63 |
| Oman | 0 | 0 | 0 | 0 |
| United Arab Emirates | 0 | 0 | 0 | 0 |
| Qatar | 0 | 0 | 0 | 0 |
| Bahrain | 0 | 0 | 0 | 0 |
| Kuwait | 0 | 0 | 0 | 0 |
| Syrian Arab Republic | 14,090.65 | 99.83208 | 935.52 | 574.19 |
| TOTAL (km2) | 29,488.38 | 849.18 | 1786.61 | 1733.93 |
Disclaimer/Publisher’s Note: The statements, opinions and data contained in all publications are solely those of the individual author(s) and contributor(s) and not of MDPI and/or the editor(s). MDPI and/or the editor(s) disclaim responsibility for any injury to people or property resulting from any ideas, methods, instructions or products referred to in the content. |
© 2024 by the authors. Licensee MDPI, Basel, Switzerland. This article is an open access article distributed under the terms and conditions of the Creative Commons Attribution (CC BY) license (https://creativecommons.org/licenses/by/4.0/).
Share and Cite
Hill, C.; Madella, M.; Whitehouse, N.J.; Jiménez-Arteaga, C.; Hammer, E.; Bates, J.; Welton, L.; Biagetti, S.; Hilpert, J.; Morrison, K.D. Per Capita Land Use through Time and Space: A New Database for (Pre)Historic Land-Use Reconstructions. Land 2024, 13, 1144. https://doi.org/10.3390/land13081144
Hill C, Madella M, Whitehouse NJ, Jiménez-Arteaga C, Hammer E, Bates J, Welton L, Biagetti S, Hilpert J, Morrison KD. Per Capita Land Use through Time and Space: A New Database for (Pre)Historic Land-Use Reconstructions. Land. 2024; 13(8):1144. https://doi.org/10.3390/land13081144
Chicago/Turabian StyleHill, Chad, Marco Madella, Nicki J. Whitehouse, Carolina Jiménez-Arteaga, Emily Hammer, Jennifer Bates, Lynn Welton, Stefano Biagetti, Johanna Hilpert, and Kathleen D. Morrison. 2024. "Per Capita Land Use through Time and Space: A New Database for (Pre)Historic Land-Use Reconstructions" Land 13, no. 8: 1144. https://doi.org/10.3390/land13081144
APA StyleHill, C., Madella, M., Whitehouse, N. J., Jiménez-Arteaga, C., Hammer, E., Bates, J., Welton, L., Biagetti, S., Hilpert, J., & Morrison, K. D. (2024). Per Capita Land Use through Time and Space: A New Database for (Pre)Historic Land-Use Reconstructions. Land, 13(8), 1144. https://doi.org/10.3390/land13081144