Article

Climate and Land Use Changes Impact the Future of European Amphibian Functional Diversity

by
Konstantinos Proios
*,
Danai-Eleni Michailidou
,
Maria Lazarina
*,
Mariana A. Tsianou
and
Athanasios S. Kallimanis
Department of Ecology, School of Biology, Aristotle University of Thessaloniki, 54124 Thessaloniki, Greece
*
Authors to whom correspondence should be addressed.
Land 2024, 13(8), 1206; https://doi.org/10.3390/land13081206
Submission received: 2 May 2024 / Revised: 17 July 2024 / Accepted: 3 August 2024 / Published: 5 August 2024
(This article belongs to the Special Issue Monitoring Ecosystem Services and Biodiversity under Land Use Change)

Abstract

:
Climate and land use changes drive shifts in species distributions, causing variations in species richness. Yet the influence of shifts in species distributions on functional diversity at broad spatial scales remains uncertain. Here, we explored the potential effect of climate and land use changes on the functional diversity of European amphibian assemblages from the present to 2050, along with their effect on species richness. We performed species distribution modelling using a scenario of climate and land use change to estimate current and future potential distributions of 73 species. We estimated functional diversity using morphological and ecological functional traits. Our results highlight the intricate effects of climate and land use changes on taxonomic and functional diversity of amphibians. A climate-induced northward expansion of amphibians is anticipated, with temperature, precipitation, and forest cover prominently shaping future assemblages. Species expected to have shrinking ranges (n = 35) tend to mature sexually at a later age, produce fewer offspring per reproductive event, and live at higher maximum altitudes compared to species expected to expand (n = 38). Furthermore, trait composition changes are expected to exceed predictions based solely on species richness. These changes will vary geographically, with northern regions likely experiencing substantial increases in functional richness and functional redundancy, i.e., the coexistence of species with similar functional roles. Our findings underscore that functional diversity changes might serve as an early warning signal to assess human impacts on biodiversity.

1. Introduction

As we enter the Anthropocene, a new geological era characterized by significant human influence on Earth, our environment is undergoing notable changes with the emergence of modified or even novel environmental conditions. Such “man-made” ecosystems differ from their past naturally formed analogs in that they tend to be shaped by unprecedented species assemblages, thus potentially altering current functions or even presenting wholly new functions and services [1]. In this context, gaining insights into and predicting alterations in the structure of species assemblages is a crucial initial move towards formulating efficient conservation strategies that focus on areas where human-induced climate and land use changes—two of the defining features of the Anthropocene [2]—are likely to impact ecosystem functions [3]. Anthropogenic climate change is now well documented to cause the shifting of species ranges towards higher latitudes and/or elevations, where species’ eco-physiological needs are “met” [4,5]. On the other hand, land use changes may be affecting species and communities at finer spatial scales, causing the contraction of species ranges due to loss of suitable habitat [6]. Despite major recent advances in forecasting potential future species ranges—mainly through the use of species distribution modelling (SDM)—describing the functional composition of future assemblages has been achieved only for a few taxa and mainly at local to regional spatial scales (e.g., Thuiller et al. [7] for trees; Buisson et al. [8] for fish; Gallagher et al. [9] for plants; Del Toro et al. [10] for ants; Benedetti et al. [11] for zooplankton; Bender et al. [12] for birds; but see Jetz et al. [13], Stewart et al. [14], Scherer et al. [15] for global bird and fish assessments).
Species richness (i.e., a measure of taxonomic diversity) has commonly been employed as the key response variable to describe the large-scale influence of human activities on biodiversity patterns. Yet the metric does not reflect species identities, that is, the species-specific responses which result from interspecific differences in eco-physiological limitations and/or dispersal abilities. Examining simultaneously the accompanied changes in functional trait composition (i.e., functional diversity) provides a more direct link to ecosystem structure and functioning and thus a more elaborate way to evaluate the impact of human activities on biodiversity. Specifically, the study of functional traits may provide information on the dominant biological/ecological processes and the underlying environmental variables guiding species assembly. For example, endotherm animals (mammals and birds) are known to be less responsive to global warming than ectotherms (amphibians and reptiles), which are documented to exhibit stronger range shifts—across both latitude and elevation—in order to sustain their metabolic rates [16,17,18]. Similarly, water availability has been shown to pose a physiological constraint on amphibian ectotherms—mainly through their water demands for reproduction [19]—more so than it does for other groups of vertebrates [20]. Therefore, key environmental variables such as environmentally available energy, i.e., ambient energy [20], and water availability may adequately capture the key processes, namely, thermo- and hydro-regulation sensu Rozen-Rechels et al. [21], respectively, determining niche occupancy and species assembly across disparate functional species groups. Projected changes in functional trait composition at the community level may thus offer insights about potential future species packing and biotic interactions [22] and losses or modifications of ecosystem multifunctionality [23] and resilience [24].
Amphibians are widely acknowledged as the most threatened vertebrate group at the global scale [25]. Specifically, 41% of worldwide amphibian species are currently threatened with extinction [25], with climate change and habitat loss being the leading causes of conservation status deteriorations (39% and 37%, respectively) since 2004 [26]. As ectotherm animals, amphibians are particularly sensitive to shifts in temperature and precipitation patterns, as they largely rely on the quality of their environment—particularly wetlands—for completing their life history. Wetlands are declining due to human-induced changes, both globally [27] and in Europe, where 80% of wetlands are estimated to have been lost during the last 100 years [28]. Wetland loss mainly due to land use changes results in the loss of amphibians’ habitats and disruption of amphibian breeding and foraging sites, diminishing their functional diversity. Additionally, climate change as manifested through longer drought periods, increased likelihood for severe storms and flooding, and temperature extremes can alter the distribution of amphibian species and lead to local extinctions [25]. These combined pressures may cause a reshuffling of species assemblages and reduced functional diversity within ecosystems, also leading to reduced ecosystem resilience and functionality as amphibians play critical roles in nutrient cycling, decomposition, and food web coherence [29]. Therefore, assessing the degree to which climate and land use changes contribute to the potential future changes in amphibian functional diversity at the community level is essential in order to understand the drivers affecting species persistence and mitigate human impacts on their ecosystems.
Here, we set out to explore the present and future (2050) potential effects of climate and land use changes on the functional diversity of amphibian assemblages in Europe, focusing on 73 species of Anura (frogs and toads) and Urodela (salamanders and newts) across 43 countries lying within the Western Palearctic biogeographic realm. We aim to depict the temporal fluctuations in functional diversity on a large spatial scale (50 × 50 km grain size), attempting to comprehensively assess the contributions of climate and landscape factors to broad-scale biodiversity patterns from a macro-ecological perspective. We compile an updated list of European native amphibian species and analyze a full spectrum of functional traits related to climate and land use preferences (including morphological, life history, habitat, and topographic traits) to address the following: (i) the species-specific amphibian dependence on climate and land use, (ii) how climate and land use change between the present and 2050 may affect amphibian functional diversity, (iii) the extent to which changes in community species richness reflect changes in functional diversity (i.e., whether emergent differences in functional diversity are principally related to the loss or gain of functionally distinct species).

2. Materials and Methods

2.1. Species List and Occurrence Data

We retrieved an initial list of 88 native European amphibian species (Anura and Caudata) through querying the Amphibian Species of the World database (ASW; [30]). We included natural resident and endemic species across 43 European countries (Albania, Andorra, Austria, Belgium, Bosnia and Herzegovina, Bulgaria, Croatia, Czech Republic, Denmark, Estonia, Finland, France, Germany, Gibraltar, Greece, Guernsey, Hungary, Ireland, Isle of Man, Italy, Jersey, Kosovo, Latvia, Liechtenstein, Lithuania, Luxembourg, Malta, Monaco, Montenegro, Netherlands, North Macedonia, Norway, Poland, Portugal, Romania, San Marino, Serbia, Slovakia, Slovenia, Spain, Sweden, Switzerland, United Kingdom). We then restricted our list to contain only species present in the European continent and islands that are part of European countries (e.g., excluding Spanish territories in continental Africa but including the Macaronesian islands).
For each of the 88 species of the initial list we retrieved point occurrence data from the Global Biodiversity Information Facility [31] using the “rgbif” R package [32]. We then kept only georeferenced data with uncertainty radius < 500 m, half of the environmental variables’ spatial resolution (ca. 1 km, see Section 2.3 Climate and Land Use Data below) in order to have accurate distributional data and the respective environmental responses. Data were also flagged and excluded from the analysis using common spatial tests in the “CoordinateCleaner” package [33], such as species observations matching capital or institution coordinates and/or rounded coordinates. Finally, we selected only those species with >10 georeferenced observations (i.e., human or machine observations, e.g., camera traps) for downstream analyses (see Section 2.4 Ensemble Species Distribution Modelling below).
We also excluded species-rank names not recognized as separate species-level lineages by the latest accepted taxonomy for European amphibians [34]—namely, Lissotriton schmidtleri (but see Bozkurt et al. [35], Sotiropoulos et al. [36], Güler et al. [37]), Bufotes balearicus, Pelophylax bergeri, P. cerigensis, and P. kurtmuelleri—and species for which there was a considerable lack of information for the selected functional traits (see Section 2.2 Functional Traits below)—namely, Triturus ivanbureschi (but see Furtula et al. [38,39], Lukanov et al. [40,41]) and Bufo spinosus (note that the point occurrence data of B. spinosus were largely coincident with those of Bufo bufo, possibly as a result of its very recent elevation to species rank from Bufo bufo spinosus; see Recuero et al. [42] and Frost [30]). Hence, our final species list included 73 species (Table S1). Among the analyzed amphibian species, two species are critically endangered (Salamandra lanzai and Speleomantes ambrosii), eight species are endangered, ten species are vulnerable, and five species are near threatened according to the IUCN Red List of threatened species [43], while the remaining ones are considered of least concern (LC). The majority of the species show a decreasing population trend (~81%), while only 15% of European amphibian species exhibit stable population and merely 2 species (namely, the endangered Alytes muletensis and the of-least-concern Pelophylax ridibundus) show increasing population trend.

2.2. Functional Traits

For each of the 73 species, we compiled information on 6 continuous (CO-) and 2 categorical (CA-) traits reflecting the morphological (M), life history (LH), and topographic (T) aspects of a multidimensional functional space sensu Villéger et al. [44]. The selection of traits was determined by (i) the a priori assumption about their sensitivity to and relevance with climate and land use spatiotemporal changes (e.g., [45,46]), (ii) their prior utilization in assessing the functional diversity of and processes of community assembly in amphibians (see Tsianou and Kallimanis [47,48,49]), and (iii) the extent to which species-specific trait information was available. The importance of intraspecific trait variability (ITV)—including variability between cryptic species—in functional diversity patterns has been gaining recognition lately (e.g., [50,51,52,53]). However, we were not able to address the potential influence of ITV due to the lack of the required population-level trait data across the entire extent of occurrence for each analyzed species. As Gonçalves-Souza et al. [54] point out, ITV is rarely considered in the relevant literature, and the vast majority of studies relies on trait averages. Data on ITV are scarce for animals in general [55,56,57] and amphibians in particular [58]. Therefore, the traits we compiled represent average values per species, aligning with established methodologies and prevailing research suggesting that the impact of ITV may be considerable for regional- to local-scale diversity patterns, with its relative contribution decreasing with spatial extent and saturating at large spatial scales (e.g., [59,60,61] for plants, [62] for ants, and [63] for birds). The traits we compiled are outlined in Table S1 and represent average values per species, along with the IUCN status and current population trend of each species. These traits include the following: (a) body mass (CO-M), estimated from body length–mass allometries according to Santini et al. [64]; (b) adult total length (CO-M); (c) time of activity (diurnal, nocturnal, both) (CA-LH); (d) age at sexual maturity (CO-LH); (e) clutch size (CO-LH); (f) breeding season (explosive or prolonged) (CA-LH); (g) altitudinal range of occurrence (CO-T); and (h) maximum altitude of occurrence (CO-T). Collectively, these traits capture key dimensions of the functional space, including (micro-)habitat utilization, foraging and reproductive strategy, metabolic requirements, and dispersal capacity (i.e., captured through body size and reproductive traits; see Alzate and Onstein [65], Trakimas et al. [66]). Functional traits were mainly retrieved from the databases of Trochet et al. [67] and AmphiBIO [68]. Given the scarcity of species-specific trait data in the amphibian-related scientific literature [58,68], for species and traits not included in either of these databases, we gathered the traits as follows: (i) from published papers, books and electronic databases, (ii) by assigning trait information from average values at the genus level (calculated from the AmphiBIO database, n = 8 species-trait cases), and (iii) by assigning traits from the closest relatives (n = 12 species-trait cases) following taxonomic comments provided in ASW [30] (See Table S2).
We used the trait values to construct a matrix of Gower interspecific distances in the 8-dimensional functional space with the R package “gawdis” [69], applying an iterative optimization algorithm to weight the contribution of each trait to the overall multitrait dissimilarity (i.e., argument w.type = “optimized” within the gawdis function, see gawdis package documentation). We then performed a principal coordinate analysis (PCoA) and retained the first four PCoA axes—which accounted for ca. 78% of the variance in the multidimensional functional space—for downstream analyses.

2.3. Climate and Land Use Data

We investigated a set of 19 bioclimatic variables and 39 land use classes as potential environmental predictors of species occurrence. We retrieved the 19 bioclimatic variables from CHELSA V.2.x for both current (averaged over the period 1981–2010; hereafter “current”) and future (averaged over the period 1941–2070; hereafter “2050”) climatologies [70,71] at a 30 arc-second resolution (ca. 1 km). As future bioclimatic variables, we chose the ones projected under the global climate model developed by the Institute Pierre-Simon Laplace (IPSL-CM6A-LR) [72] as a contribution to the Coupled Model Intercomparison Project Phase 6 (CMIP6) [73]. We opted to use the data for the Shared Socio-Economic Pathway (SSP) 3–70 [74] because it comprises a fairly modest scenario (Regional Rivalry—A Rocky Road; [75]). In the SSP3-7.0 scenario, emissions and temperatures are expected to rise at a relatively constant rate, with CO2 emissions approximately doubling and average temperatures climbing by 3.6 °C from present levels by the year 2100 [2]. We retrieved land use data (39 classes) for both the present (2015) and the future (2050) scenario (i.e., SSP3–70) from the GLObal BIOdiversity model for policy support 4 (GLOBIO4) at a spatial resolution of 10 arc-seconds (ca. 300 m) [76]. To reduce computation time for downstream SDM analyses, we aggregated the original 39 classes into 10 major land types (Table S3). We then upscaled the resolution of land use data to match the climate data resolution as the ratio of area covered by each major land type within the larger cell (30 arc-second). The area covered in 2015 and anticipated to be covered in 2050 by each aggregated land cover type is presented in Table S4. According to the Shared Socio-Economic Pathway (SSP) 3–70 scenario, extended transformation of forests to croplands is expected in the future, as nations are assumed to become increasingly competitive, prioritizing national security and safeguarding their food sources.
Prior to analyses, we checked for multicollinearity among the environmental variables (on the current data) by performing a variance inflation factor (VIF) analysis and excluded 13 bioclimatic variables and 1 land use variable with strong collinearity (i.e., VIF > 10) from downstream SDM analyses (see Section 2.4 Ensemble Species Distribution Modelling below) (Table S5).

2.4. Ensemble Species Distribution Modelling

We estimated the potential distribution of each species under both current and future conditions through ensemble species distribution modelling (ESDM) as employed in the “biomod2” R package (version 3.4.6) [77] by adjusting methods (and script) provided in Polaina et al. [78] and further developed by Michailidou et al. [79]. The ESDM approach, which combines predictions from various modelling techniques, addresses prediction variability among different modelling algorithms and enhances the reliability of projected distributions [80,81,82,83,84].
We employed four algorithms, generally categorized as regression-based or machine learning approaches, i.e., generalized linear models, generalized additive models, random forest, and maxent (used settings are described in Table S6). Each algorithm underwent 3 runs, with 70% of the presence–absence data randomly selected for training and the remaining 30% reserved for cross validation (testing data). We assessed the predictive reliability of all candidate models using the true skill statistic (TSS), a metric spanning from −1 to 1 (1 being a perfect score) and gauging a model’s efficiency in correctly predicting presences (sensitivity) and absences (specificity) [85]. Before fitting the models, we selected 10,000 random pseudo-absences (PAs) for each species, a preferred method when true absence data are lacking [86,87].
The ensemble model for each species constituted a total consensus model using all models and cross-validation runs meeting a predefined evaluation threshold of TSS ≥ 0.7. In case no model achieved this threshold, the ensemble model included the top 10% of model runs with the highest TSS. This ensemble model predicted the probability of species presence under current and future environmental conditions as a weighted mean of probabilities. The continuous probability was transformed to binary using a cut-off value maximizing TSS [88].
We estimated the mean Coefficient of Variation (CV) of ensemble models across all species (rescaled for each species to range 0–1). Grid cells with a high coefficient of variation (CV > 0.5) are assumed to exhibit high variability in suitability values, reflecting disparities across algorithms, pseudo-absences, and cross-validation runs, while low CV values suggest a consensus among model predictions [78].
By overlapping the binary predictions from each ensemble model output (current and future) into the 50 × 50 km European Environment Agency UTM grid (http://www.eea.europa.eu/, accessed on 15 January 2024), we calculated the potential current and future amphibian assemblages in each of 2775 grid cells. This approach provided an estimate of the potential emergence of novel communities and number of species likely to encounter favorable conditions for persistence within each grid cell, being also comparable with the NAT2RE Atlas of European amphibians and reptiles [89]. Finally, to assess whether species projected to contract in range size differ in their traits compared to the species projected to expand, we performed one-sample Wilcoxon tests for all continuous (n = 6) and chi-square tests for all categorical (n = 2) traits.

2.5. Analysis of Temporal Changes of Taxonomic and Functional Diversity

We quantified functional diversity of each grid cell for both time instances (2015 and 2050) by calculating functional richness (FRic; [90]) and Rao’s quadratic entropy (RaoQ; [91]). FRic refers to the amount of functional space occupied by a species assemblage as a proportion of the functional space defined by all species-trait combinations [90]. RaoQ reflects the expected functional distance between two randomly chosen species and is thus used as a measure of species variability within an assemblage. We also calculated the number of species (SR) of each grid cell across both time instances. Given the sensitivity of functional diversity metrics to species richness, we estimated the standardized effect sizes (SES) for functional richness and Rao’s quadratic entropy (SES.ΔFric, SES.ΔRaoQ). We performed 1000 randomizations of current and future assemblages, and we estimated SES as (FDobs − Meannull)/sdnull, where FDobs is the observed value of functional diversity and Meannull and sdnull are the mean and the standard deviation of 1000 iterations generated under the null model, respectively. Furthermore, we estimated functional redundancy (FRed; [92]) as a metric of the overlap of functional roles within the community. Briefly, FRed is the average number of species per functional entity (group of species with similar functional traits; [90]). To calculate FRed, we first assigned each species to a functional entity (n = 65) by splitting continuous traits into distinct classes with approximately equal number of species per class. FRed ranges from 1, i.e., all species are functionally identical, to species richness, i.e., each species of an assemblage is assigned to a distinct functional entity. All functional indices were calculated with the “mFD” package in R [93]. Note that we dropped 491 grid cells that contained four or fewer species to ensure that all indices could be estimated (these grid cells were located mainly in the north).
We calculated the difference in the three functional indices (ΔFRic, ΔRaoQ, ΔFRed) and species richness (ΔSR) between the projected current and future assemblages. Then, following methods suggested by Stewart et al. [14], we examined whether temporal changes in FRic (ΔFRic) are primarily driven by the loss or gain of functionally distinct species. To do so, we estimated ΔFric predicted by ΔSR (hereafter, ΔFRicpredicted) using a robust regression model with projected ΔFRic (i.e., ΔFRic calculated from ESDM projections, hereafter ΔFRicprojected) fitted as a response and ΔSR as an explanatory variable with the R package “MASS” [94]. We subsequently compared the ΔFRicprojected to the ΔFRicpredicted between current and future assemblages. Inconsistencies in the estimated direction between predicted and projected ΔFRic (negative or positive, i.e., −ve/+ve, and vice versa) may highlight potential gains or losses in functional richness despite corresponding losses or gains expected from the difference in species richness, thus indicating the likely formation of species-poor yet functionally distinct assemblages. We assigned the 2284 assemblages in four categories, based on the (in)consistency of projected and predicted ΔFRic directional outcomes (+ve/+ve, −ve/−ve, +ve/−ve, −ve/+ve) and used them as a response variable in a multinomial logistic regression model with the mean assemblage altitude as an explanatory variable (elevation data were acquired using the “elevatr” R package; [95]). This model reflected the probability of each of the four outcomes as a function of elevation.
All analyses were performed in R version 4.0.3 [96].

3. Results

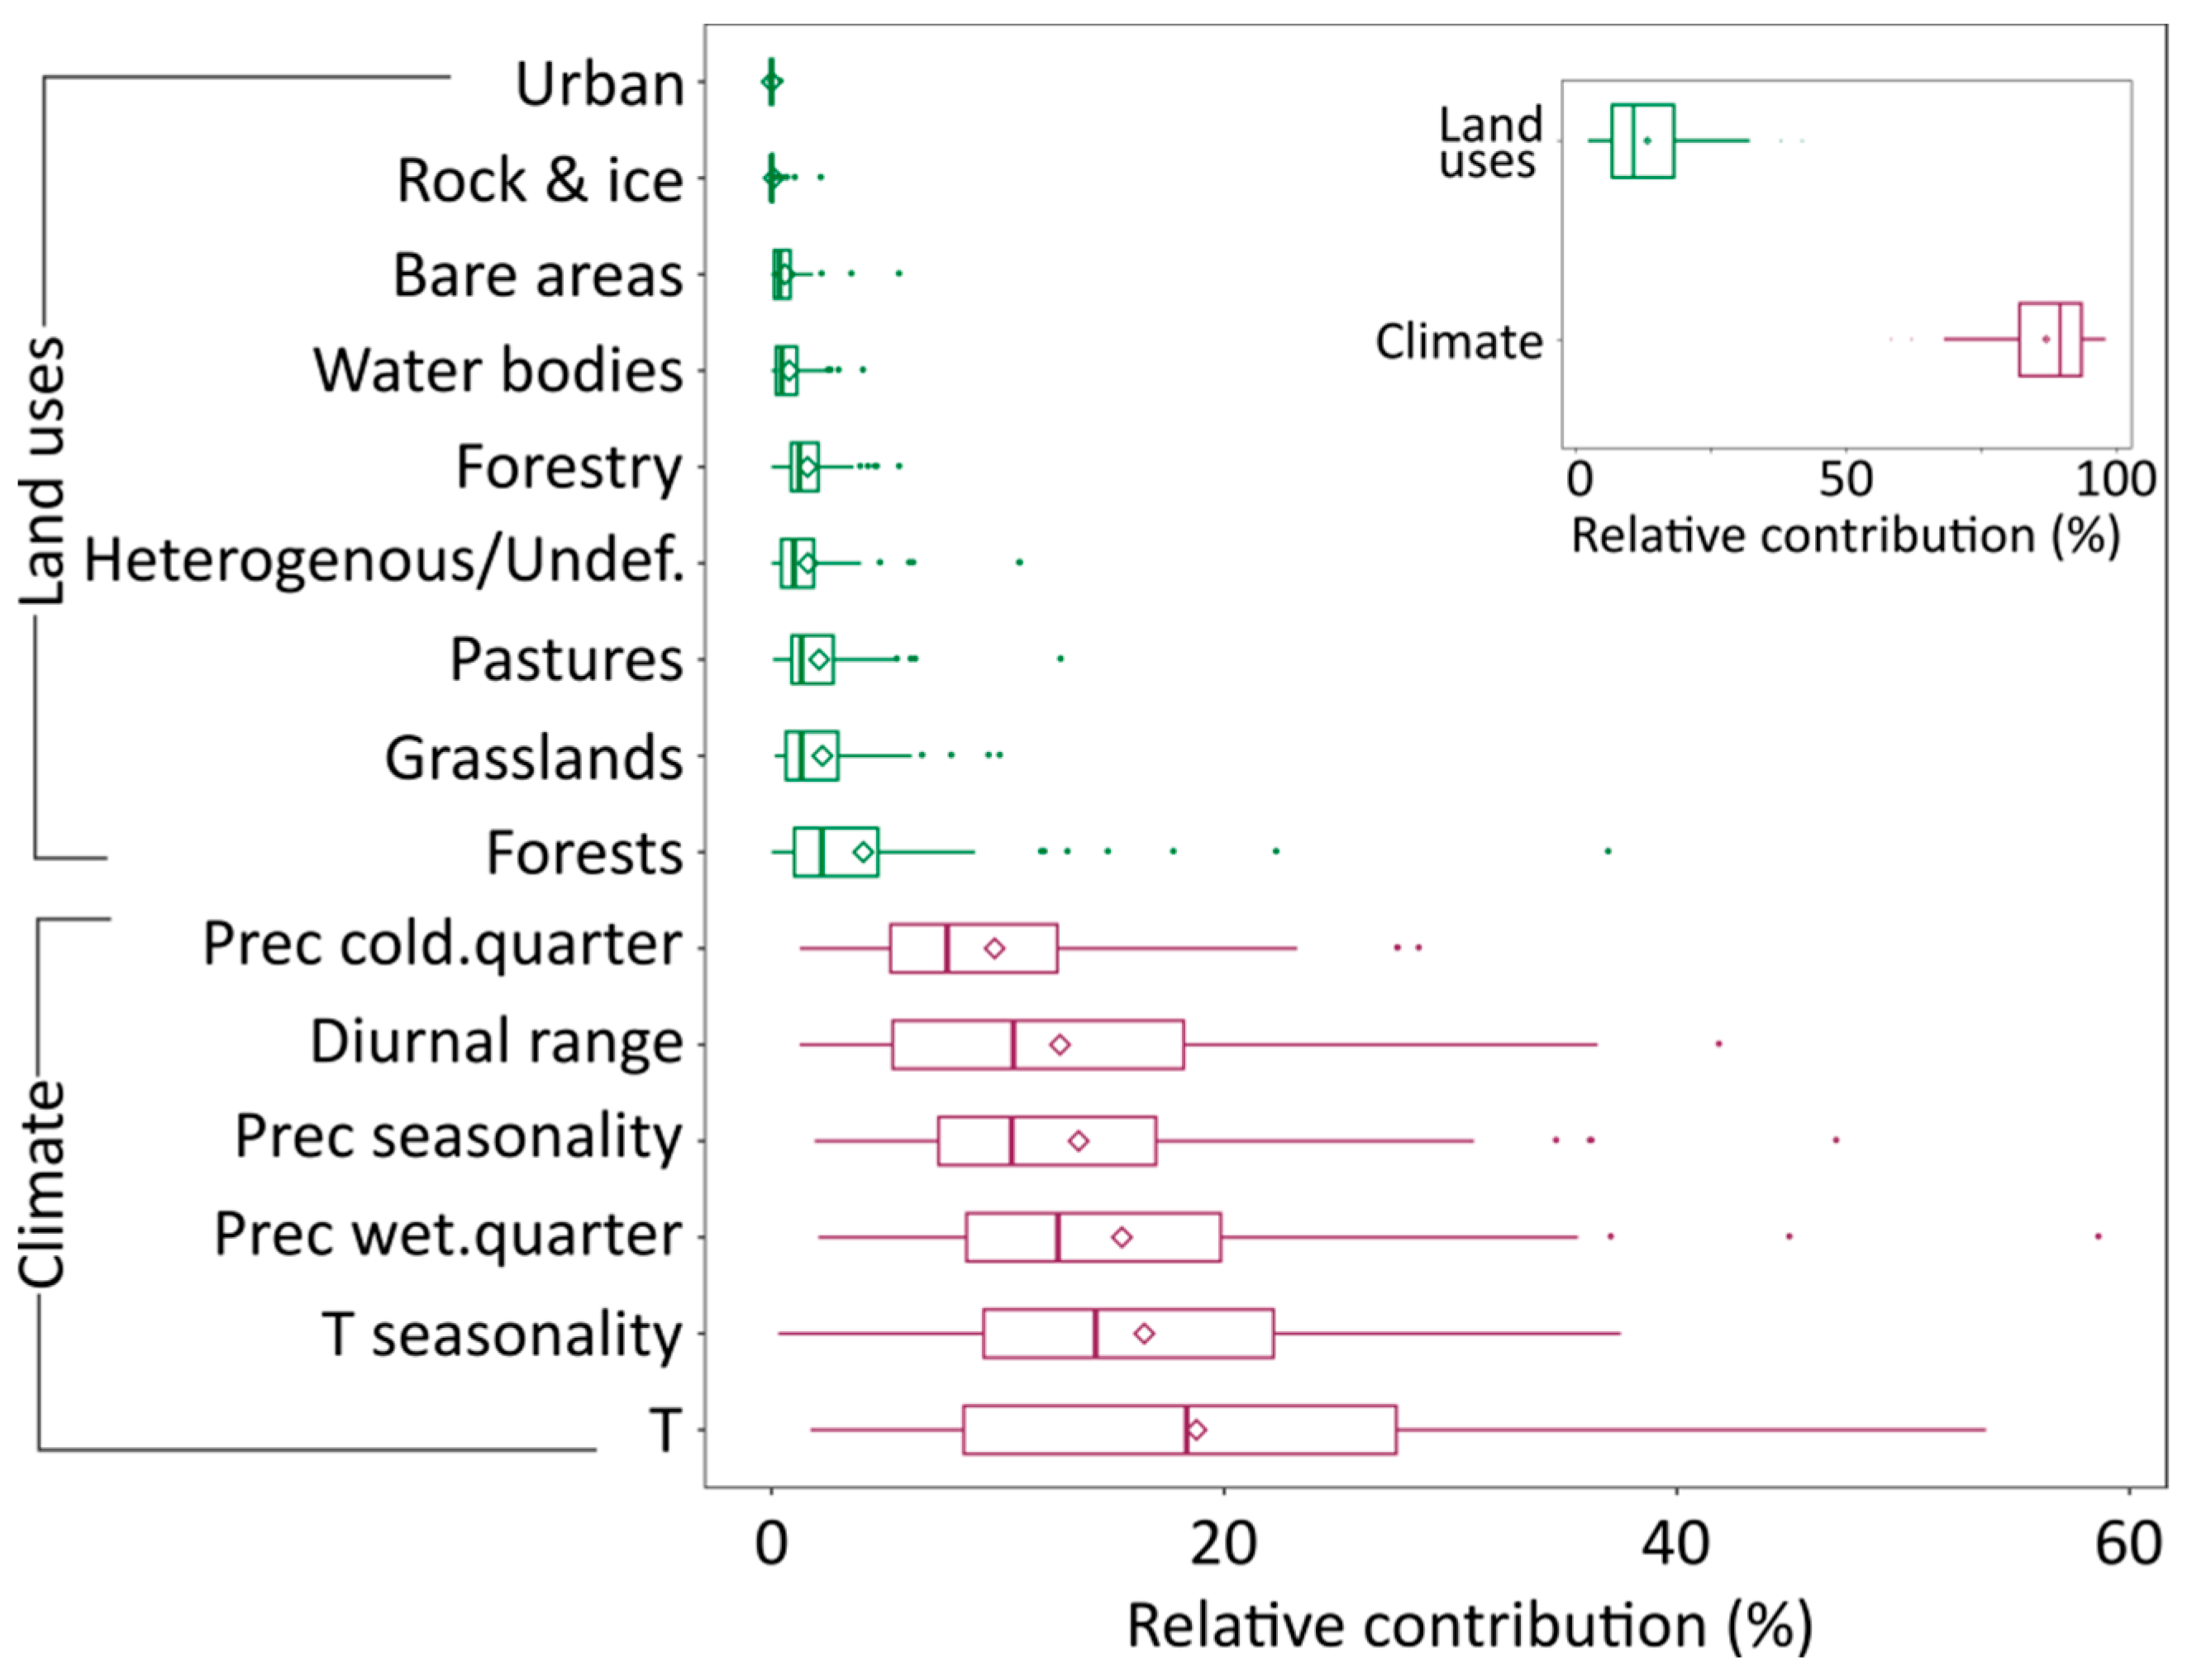
3.1. Contribution of Climate and Land Use to Projected Species Distributions

The resulting ensemble species distribution models (ESDMs) demonstrated substantial efficiency in predicting the distribution of all 73 species, as indicated by true skill statistic (TSS) and area under the curve (AUC) scores for the testing data, sensitivity, and specificity, in all cases being >0.7 (Figure S1). The mean model uncertainties across all species varied across latitude, as shown by the Coefficient of Variation (CV) which ranged from low to medium values (<0.5) in southern Europe for current projections (being >0.5 mostly in northern Europe) and from low values in central Europe to medium values in southern and northern Europe for future projections (Figure S2).
The ESDMs showed that the range size of 35 species (approximately 48%) is expected to decrease by 2050. Salamandra lanzai, a critically endangered species according to the IUCN Red List, is expected to lose 73.44% of its range (range change = −73.24%). Additionally, two species considered endangered, five species considered vulnerable, and three species considered near threatened are anticipated to suffer range contraction (Table S7). In contrast, 38 species (52%) are expected to expand their range. The greater expansion in suitable areas was observed for Rana latastei (range change = +545%), a vulnerable species according to the IUCN Red List, and another five vulnerable species will increase their range by retaining part of their current range and spreading into new regions. Furthermore, the critically endangered Speleomantes ambrosii is anticipated to retain 19% of its current range expanding to new regions (suitable range change = +123.5%) but losing 81% of its current region (Table S7). When exploring the relationship between distributional changes and functional traits, we found that species whose suitable distribution will increase had a significantly lower median of age at sexual maturity (Wilcoxon test, p < 0.05; Figure S3). We also found weak evidence for the effect of maximum altitude and clutch size on range shifting; species expected to expand their suitable range are observed at lower altitudes and have higher clutch size compared to species expected to contract (Wilcoxon test, p < 0.1; Figure S3).
Climate was the major determinant of species distributions for all 73 species (Figure 1; inset), contributing on average 86.90%, and ranging from 58% for Speleomantes ambrosii to 98% (for Discoglossus galganoi). Among climatic variables, mean annual temperature (T) was the most influential variable, contributing on average 18.8% to species distributions (Figure 1; diamond symbols inside boxplots). In contrast, the mean contribution of land use variables to species distributions was 13.1%, ranging between 2% for Discoglossus galganoi and 42% for Speleomantes ambrosii. Land use variables contributed, on average, more than 25% (Figure 1) to species distributions of seven species (Alytes dickhilleni, Discoglossus montalentii, Lissotriton italicus, Lissotriton montandoni, Salamandrina terdigitata, Speleomantes ambrosii, and Speleomantes italicus). Among land uses, forest and grassland cover were the most important drivers of species distributions. Specifically, forests played the most crucial role in determining species distributions, contributing, on average, ca. twice (4.1%) as much as any other land use variable (<2.2%, Figure 1; diamond symbols inside boxplots). Notably, the relative contribution of each of the nine land use variables was mostly below 10%, except for 11 species—namely, (i) Bufotes viridis, (ii) Ichthyosaura alpestris, (iii) Lissotriton montandoni, (iv) Discoglossus montalentii, (v) Alytes dickhilleni, (vi) Alytes muletensis, (vii) Discoglossus montalentii, (viii) Salamandrina terdigitata, (ix) Speleomantes ambrosii, (x) Speleomantes italicus, (xi) Speleomantes strinatii—the distributions of which were substantially (>10%) affected by the presence of heterogenous/undefined land use, albeit this class of land use covered merely 48,039 ha in 2015 (for the first two, 11%), pastures and rangelands (for the third, 12.8%), grasslands (for the fourth, 10.1%), and forests (for (v) to (xi), 12–37%) (Figure 1). It is worth noting that grasslands and forested areas are expected to decrease by about 13% and 9%, respectively (Table S4). The relative contributions of climatic- and land use-related variables per species are provided in Table S8.

3.2. Temporal Differences in Taxonomic and Functional Diversity

Geographical range projections for current and future climatic and land use conditions showed that the diversity and structure of most examined assemblages are expected to change, with varying nature and extent of these modifications depending on the geographical location. The mean species richness (SR) across assemblages was 18.14 ± 9.34 species (range: 5–48 species) and 19.48 ± 7.63 species (range: 5–47 species) for current and future projections (Figure 2), respectively.
Mean functional richness was equal to 0.19 ± 0.14 in 2015 (range: 0.00001–0.70) and to 0.21 ± 0.14 (range: 0.0007–0.78) in 2050, while the mean RaoQ values across all assemblages were 1.52 ± 0.10 (range: 1.22–1.85) and 1.55 ± 0.08 (1.3–1.80) for current and future projections, respectively. The spatial pattern of taxonomic and functional diversity was congruent in both time instances, i.e., communities in southern areas were species-richer and functionally more diverse compared to the communities of northern Europe (Figure 3a,b and Figure 3d,e, respectively). However, temporal differences in species richness (ΔSR), in functional richness (ΔFRic, Figure 3c), and in RaoQ (ΔRaoQ, Figure 3f) followed a different pattern. Specifically, species richness is expected to decrease by as much as 14 species in the south and likewise increase in the north, with moderate changes being expected mainly in median latitudes (Figure 2). These changes in species richness were mirrored in changes in functional diversity. We detected a substantial expected increase in functional richness in the northernmost latitudes (e.g., >50°, regions around the Baltic Sea), with considerable variation across assemblages (Figure 3c). In contrast, the southernmost assemblages (e.g., 35–45°, Mediterranean countries and especially Greece and central Spain) are expected to exhibit a decrease in functional richness by an average of 4% (Figure 3c). Additionally, changes in RaoQ (ΔRaoQ) are mainly expected in the north (55–60°), where intra-assemblage species variability will likely increase by as much as 21%, with a corresponding maximum loss by 11% being anticipated in mid- to lower latitudes (35–45°; Figure 3f). Regarding functional redundancy, a latitudinal gradient was also observed in both time instances (Figure 3i). Communities across parts of Central and Eastern Europe along with the United Kingdom (45–60°) are likely to become more functionally redundant by 2050, exhibiting an as much as 18% increase in functional redundancy. A corresponding loss in functional redundancy by 17% at most is expected to occur in the southern regions of Europe (e.g., 35–45°, Mediterranean countries and especially Spain).

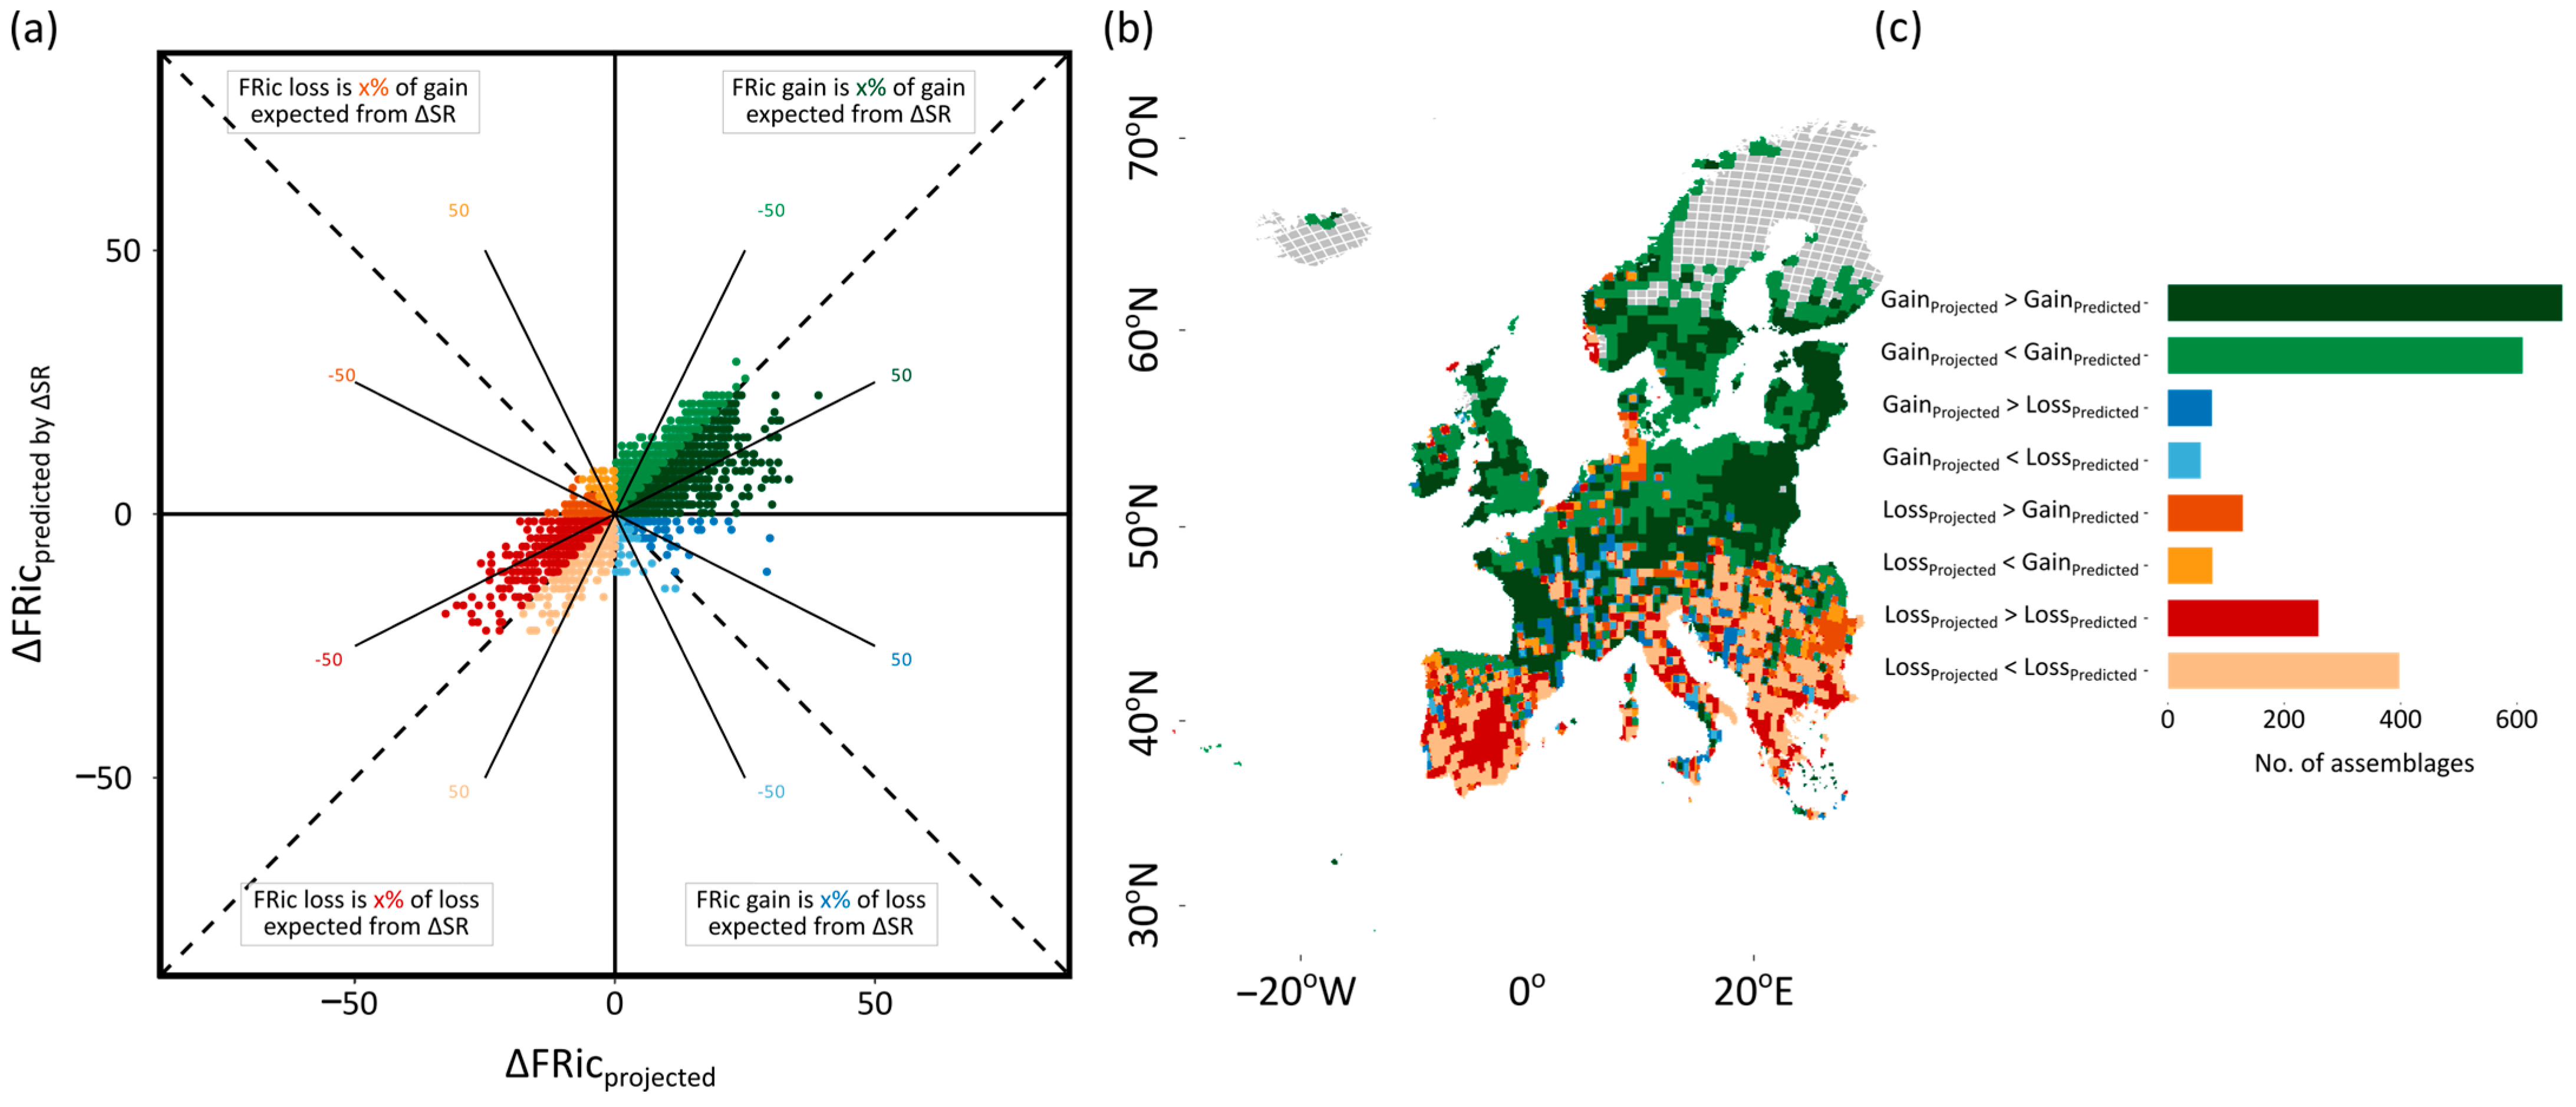
3.3. The Influence of Species Richness on Functional Diversity

Projected temporal differences, gains or losses, in functional richness (calculated from ESDM projections; ΔFRicprojected) were greater than differences predicted by changes in species richness (ΔFRicpredicted) in 41% of assemblages (n = 937), suggesting that changes in functional richness are due to gain or loss of functionally distinct species. Specifically, projected FRic gains were higher than gains anticipated based on the difference in species richness (ΔSR) by around 50% in 678 assemblages (Figure 4a: dark-green-colored areas) and projected FRic losses were higher than those expected by species richness differences in 259 assemblages (Figure 4: dark-red-colored areas). Note that standardized effect sizes for functional richness and Rao’s quadratic entropy (SES.ΔFRic, SES.ΔRaoQ) indicated that functional diversity does not depart from null expectations (SES < |0.7|; Figure S4) given the species richness. ΔFRicpredicted values were greater than ΔFRicprojected in 1008 assemblages (gains: 610 assemblages, pale-green-colored in Figure 4; losses: 398 assemblages, pale-red-colored in Figure 4), indicating that gains or losses correspond to functionally similar species. Consistent trends, i.e., projected and predicted FRic temporal differences (either gains or losses), are expected mainly in mid- to high European latitudes. Yet, primarily in middle and southern Europe, projected and predicted ΔFRic exhibited contrasting trends, i.e., projections indicated an increase or decrease in FRic while corresponding expectations based on ΔSR indicated an opposite trend (blue- and orange-colored areas in Figure 4, 133 and 206 assemblages, respectively).
The modelled joint projected–predicted temporal difference in functional richness (ΔFRic) outcomes (Gainprojected − Gainpredicted, Gainprojected − Losspredicted, Lossprojected − Gainpredicted, Lossprojected − Losspredicted) showed that there is a trend for consistent higher probability of decreased ΔFRic towards higher elevations (i.e., projected and predicted ΔFRic being both negative) with a parallel consistent increase in ΔFRic towards lower elevations (i.e., projected and predicted ΔFRic being both positive; see the green and red lines in Figure S5 and Table S9). In addition, this model suggests a weak yet significant tendency for higher elevations projected to sustain higher functional richness (i.e., positive ΔFRicprojected) than predicted from differences in species richness (ΔSR; i.e., negative ΔFRicpredicted, see the blue line in Figure S5 and Table S9). This indicates that regions with high elevation might be able to support more functionally distinct communities despite potential species losses.

4. Discussion

Our study is one of few, to our knowledge, that demonstrates the combined responses of amphibian taxonomic and functional diversity to climate and land use changes at a broad spatial scale. Although previous studies have utilized similar approaches, their spatial coverage has so far remained limited across country and regional levels (e.g., [97,98,99,100,101]), while their taxonomic scope has been restricted to the examination of a subset of European amphibian species (e.g., [102,103]). Our analysis goes beyond these constraints by extending across both taxonomic and functional dimensions of diversity and identifying climate as the primary driver shaping amphibian diversity patterns. At the same time, our results emphasize the synergistic role of land use changes in shaping the prospective gains and losses of species within European assemblages.

4.1. Shifts in Species Richness and Functional Diversity: The Importance of Traits

By employing one of the hitherto largest collated amphibian assemblage-trait datasets, we found that depending on the species, both climate and land use changes will play a substantial role in altering species distributions and thus forming the novel European amphibian communities of the mid-21st century. Our analyses revealed a conspicuous geographical pattern with regard to the direction and extent of shifts in species richness and functional diversity. Specifically, species gains (ΔSR) and accompanied increased functional richness (ΔFRic) and variability (ΔRaoQ) are expected in northern latitudes, with corresponding reductions across the south. Additionally, we found some evidence for higher elevations being expected to support species-poorer yet more functionally distinct communities in the future compared to the present (Figure S5). These findings corroborate those of previous studies conducted in various spatial contexts—e.g., in the Brazilian Atlantic Forest [46,104], in the Manu Biosphere Reserve (southeastern Peru) [105], in the Andes [106], in Iberia [107], in the Italian Alps [99,108], and globally [109,110]—and hint that human-induced environmental change is pivotal in shifting the hotspots of amphibian diversity towards higher latitudes and altitudes.
Nearly twenty years ago, Araújo et al. [102] advocated the view that increasing global temperatures due to climate change “may be less deleterious [for European amphibians] than previously postulated” based on SDM analyses that showed that by 2050, approximately 70% of species will expand their distribution northwards given unlimited dispersal. Since then, many other studies have shown this pattern for amphibians in other regions (e.g., in the Western Hemisphere [111] and China [112,113]). Notwithstanding that such patterns are contingent upon the extent of dispersal capacity (which varies amongst species and is affected by suitable habitat connectivity) and hence represent a best-case free-dispersal scenario, our results complement these findings by providing evidence that the majority of the species examined, i.e., 38 out of 73, are expected to expand their distribution towards higher latitudes. These changes in species richness are expected to mirror corresponding increased functional richness towards higher latitudes. Therefore, quite a few species are expected to disperse into regions lying north of their current range, concurrently expanding the functional space occupied by the current assemblages. Similar findings have been reported for other invertebrate, vertebrate, and plant taxa and in other parts of the world, e.g., for trees [7] and odonates [114] in Europe and ants [10] in North America. Additionally, Stewart et al. [14] reported a temporal shift in avian functional diversity at a global scale, emphasizing the effect of human-induced environmental change as a primary force shaping the ecosystems of the future.
The functional traits that play the most important role in shifts in species distributional range vary with taxa. For example, in trees, range and community functional trait shifts depend on seasonality of development (evergreen vs. deciduous) and leaf morphology (broadleaved vs. conifers), and thus, energy availability seems to play a major role [7]. For birds and ants, biotic interactions captured by traits such as diet (frugivore vs. invertivore) and the functional ecosystem role (soil movers, wood decomposers, invertebrate community regulators, ant community regulators, seed dispersers), respectively, are most likely to drive range and community composition shifts [10,14]. In contrast, for odonates, shifts in range and functional trait composition depend on body size and duration of flight [114], indicating dispersal capacity as the chief mechanism. Our results are consistent with a climate-mediated dispersal capacity being a driving force of range shifting also for amphibians. Specifically, we showed that traits relating to life span (i.e., age at sexual maturity) and fecundity (i.e., clutch size) are likely to determine the course of range shifting towards expansion or contraction (Figure S3). These traits have previously been shown to exhibit geographical variation, with higher latitudes and altitudes relating to older ages at sexual maturity (and thus longevity; see Zhang and Lu [115]) and smaller clutches [116,117], therefore a K-selected reproductive strategy. Amphibians that have undergone a northward expansion following recolonization from southern late Pleistocene refugia—which are typically characterized by higher range size compared to southern-remaining ones—seem to embody a combination of both r and K traits. Therefore, it is possible that species with intermediate life history strategies tend to expand their ranges into northern regions [66]. Further research is required to elucidate the effects of these traits on dispersal capacity and their linkage with climate-dependent range shifting.
Additionally, we detected a weak effect (Wilcoxon test, p < 0.1) of niche breadth (maximum altitude) on the likely outcome of range shifting, with species distributed at higher elevations being more likely to contract their ranges. Species in high elevations are predicted to lose a greater proportion of climatically suitable areas compared to lower distributed species which are expected to expand their ranges [109]. Thus, high and thermally isolated altitudes may act as a dead-end refuge promoting extinction risk in amphibians (cf. [104,105,107,108,110,118]). Interestingly, body size and total length, which capture several aspects of energy and water utilization of species (see Slavenko and Meiri [119] for review), were not substantially linked to the direction of range shifting (i.e., contraction or expansion; Wilcoxon text, p > 0.1). Indeed, the geographical distribution of amphibian mean body sizes across North America and Europe have been shown to be independent of major climatic clines such as temperature, precipitation, and seasonality regimes [119]. Therefore, climate and land use changes are expected to have minimal effect on the spatial patterns of body size in future assemblages.

4.2. Contribution of Climate and Land Use to Changes in Functional Diversity

Our findings revealed that temperature- and precipitation-related changes are expected to have a massive influence on amphibian species distributions across Europe, surpassing the influence of land use variables. Climatic changes at various temporal scales, i.e., annual (annual mean temperature), seasonal (temperature seasonality, precipitation seasonality, mean monthly precipitation of the warmest/coldest quarter), and daily (mean temperature diurnal range), are anticipated to drive variation in future assemblages. These temporal levels align with projected changes in mean annual temperature, total annual precipitation, seasonal temperature and precipitation, heat waves, and dry spell patterns, which are expected to exhibit a roughly monotonic latitudinal gradient [120]. Being ectotherm vertebrates with particular adaptations to terrestrial life—such as permeable skin, eggs with no shell, and complex life histories that are subject to changes in both terrestrial and freshwater environments [121]—amphibians heavily rely on ambient conditions, particularly moisture and temperature [122] and their joint water–energy dynamics [14,123], for their survival and reproduction. Thus, multiple aspects of their biology, including physiological performance, breeding phenology, eco-evolutionary adaptations, and (chiefly) range shifts, have been and are being influenced by corresponding changes in temperature and precipitation regimes both during the Quaternary [124,125] and under current anthropogenic climate change [126,127,128,129,130].
Differences between current and future projections in species richness (ΔSR), functional richness (ΔFric), and variability (ΔRaoQ) tend to monotonically increase northwards (Figure 2 and Figure 3). This suggests that climate change will enable a northward expansion of southern species, overcoming energy availability limitations, which are more pronounced in higher latitudes [123]. In contrast, southern amphibian assemblages are expected to become less species-rich with lower functional richness and variability, possibly due to increased aridity, particularly expected across the Mediterranean [2]. A shift in constraining factors for amphibian survival, from water availability in the south to energy availability in the north, has been previously reported [102,123]. This shift can be attributed to the constrained adaptability of amphibians to lower temperatures. Most species cannot survive in the cold winter temperatures in northern latitudes, while their upper lethal temperature range displays more plasticity [131,132]. Consequently, as climate change induces temperature rise in middle and northern regions (e.g., 45–60°, see Figure 3) and increased aridity in the south (e.g., 35–45°, see Figure 3), it is expected to create additional available niche space in the north while diminishing niche space in the south.
Despite the vast contribution of climate in explaining species distributions in our ESDMs, it only forms part of the narrative. Our results provide further insights into landscape-mediated amphibian community assembly. We emphasize the significant influence of forest cover and land management practices associated with pasture/rangeland, grassland, and forestry on both current and future species distributions. This impact was particularly pronounced for species currently identified as near threatened or threatened by the IUCN Red List of Threatened Species—including Discoglossus montalentii, Alytes dickhilleni, Alytes muletensis, Speleomantes ambrosii, Speleomantes italicus, and Speleomantes strinatii [43]. Future patterns of amphibian taxonomic and functional diversity will likely be intricately linked to the dynamics of various natural and anthropogenic land cover types (at least in the case of the SSP3-7.0 scenario that we analyzed, which is characterized by extensive transformation of forests to agricultural land; see Riahi et al. [75]). For instance, Mediterranean and temperate broadleaf and mixed forests, which constitute the main forested biomes of Europe, are expected to be heavily influenced by increased wildfire, windstorm, drought, and flood incidents due to climate change [133], resulting in lower forest resilience [133]. This deforestation might result in increased amphibian extinction debts [134]. Surprisingly, despite amphibian life cycles’ dependence on water, water bodies’ cover was not an important driver of amphibian species distribution at this spatial scale. Water regime at this spatial scale is not expected to change in area cover by 2050 (see Table S4) and thus does not efficiently capture changes in topographic and hydrological conditions related to the accessibility of surface water and the essential microhabitat characteristics of amphibians (cf. [123]). However, we note that although the mean annual precipitation was excluded from our analyses due to collinearity issues, its effect emerged indirectly through the significant effect of other precipitation- and temperature-related variables, indicating a substantial dependence of species range shifting on the dynamics of water availability.

4.3. Relationship between Species with Functional Richness

Extensive alterations in functional richness (ΔFRicprojected) that—most often—are likely to exceed predictions based solely on changes in species richness are anticipated in the future. This suggests that shifts in trait composition in these assemblages will predominantly be influenced by the gain or loss of functionally distinct species, each potentially playing a unique functional role. Gains are expected mainly across median to northern European latitudes and losses are expected in the south, especially across the Mediterranean region. A latitudinal gradient of more-than-expected gains in functional diversity across the north and more-than-expected losses in functional diversity in the south of Europe has been also reported for birds [14]. These consistent patterns across greatly disparate taxa suggest that climate change may also alter biotic interactions to a great degree, eventually leading to a disruption of current ecological networks and their replacement with modified or even novel ecosystems, especially in Mediterranean regions where functional diversity is expected to be lost more than predicted from mere reductions in species richness.
In contrast, we also found evidence for some regions, mainly in the south, wherein alterations in functional richness are less pronounced than anticipated based on species richness changes (e.g., see the categories LossProjected < LossPredicted and GainProjected < LossPredicted in Figure 4b). It is possible that in these regions, the species expected to be acquired/lost will be functionally similar to the set of species expected to persist. This was confirmed by the finding that the current assemblages of southern European latitudes were more functionally redundant than northern counterparts. Thus, the ecological impacts of potential species losses will likely be mitigated by the persistence of functionally similar species (cf. [135]). However, with our future projections suggesting a decline in functional redundancy in several places in the south—including the Iberian, Italian, and Balkan peninsulas—this “protective cushion” is expected to be canceled out, thereby exposing the well-acknowledged Mediterranean biodiversity hotspot to unprecedented risks (cf. [136]). As climate change is expected to profoundly impact European amphibian diversity by the end of the 21st century [136], our projections, which foresee an increase in functional redundancy across mid-European latitudes by 2050 but no substantial change in the north, may fall short. Projections further in the future or based on higher emissions scenarios are likely to reveal shifts in the geographical center of functional redundancy even farther north.

4.4. Limitations

Species distribution models typically estimate current and predict future distribution of suitable habitat by correlating species occurrences and environmental variables (e.g., climate- and land use-related variables) without taking into account the relationship between suitable habitat and species functional traits. This might have influenced our inferences to some degree regarding shifts in distribution ranges given that some traits are linked to range shifts [137]. The application of methods incorporating functional traits would limit uncertainty around the accuracy of range shift predictions [138], but coupling species distribution changes and functional traits is a challenging task that is in its infancy [137]. Doing so requires species-specific rigorous knowledge about physiological requirements/tolerances or dispersal capacity (e.g., dispersion distances of juveniles, distances traveled by adults for breeding migrations), but such knowledge in the amphibian-related literature is currently largely unavailable [58,68]. Yet caution is required in interpreting SDMs’ results, even when accounting for species functional traits. For example, species Hyla arborea and H. orientalis, which have similar life history traits (Table S1), are anticipated to exhibit different range shifts by 2050 (−59% range shift for H. arborea and +115% for H. orientalis; Table S7). The two sister species might share functional traits, but their current ranges differ, i.e., Hyla arborea occurs mainly in Western Europe, while H. orientalis mainly in Eastern Europe, and this might explain the contrasting predictions. We analyzed changes in distribution of suitable habitat, but we did not assess the trends in population size or area of occupancy at the species level. Climate change and land use changes have resulted in an unprecedented decline in amphibians’ populations (among others, Eggert et al. [139], Hof et al. [140]), and assessment of the relationship between suitable habitat space and population dynamics can provide important information about the future of the species, thus allowing us to design effective conservation strategies [141]. Another limitation of our study is that we focused exclusively on amphibian species within the European region. Incorporating data on potential species influxes from Africa and neighboring regions could enhance our understanding of community assembly processes and potential shifts in the functional space occupied by current assemblages. Additionally, finer spatial-scale factors, such as local losses of water habitats due to climate change, the role of protected areas in facilitating dispersal potential, ongoing erosion of genetic diversity caused by local extinctions and reduced population sizes [142,143,144], as well as future climate-induced local-scale changes in productivity, food availability, and biotic interactions which link to shifts in predator–prey dynamics, e.g., [145], the spread of alien species [141], and disease (e.g., chytridiomycosis caused by Batrachochytrium dendrobatidis; see [140,146]) influence broad-scale patterns of distribution shifts and functional diversity. Incorporating such finer-scale processes remains an open research question for the future since it will provide further insights into some discrepancies between our results regarding the calculations of distributional expansion/contraction of certain species and other studies. For example, we note our prediction for a substantial distributional expansion of Alytes dickhilleni (+338%), whereas available data demonstrate that despite the potential increase in suitable habitat, the impact of chytridiomycosis leads to an ongoing population decline across its entire extent of occurrence and ultimately in its classification as an endangered species [147]. Notwithstanding such discrepancies caused by processes not incorporated in our models, our approach provides some basal knowledge about the potential habitat suitability, which might further be constrained by limited dispersal of species due to pervasive land use particularities at narrower spatial scales (e.g., agricultural alteration, urban development, deforestation, water pollution, infrastructure expansion, and recreational activities). Finally, we quantified functional diversity using species-level data and did not consider the intraspecific trait variability (i.e., ITV; e.g., through phenotypic plasticity, microgeographic adaptation), which could be substantial, especially in the case of cryptic species, thereby potentially affecting the estimation of functional diversity patterns and inferences about underlying ecological processes. Incorporating ITV has the following potential uses: (i) determining the spatial grain and extent at which it becomes important, (ii) enhancing the accuracy of diversity patterns like the ones reported herein, and (iii) providing insights into direct and scale-dependent links between specific functional traits and ecosystem function—a plea recently posed for animals in general (see Gonçalves-Souza et al. [54]).

5. Future Perspectives

Climate and land use changes are recognized as the primary causes of deteriorating conservation status, each contributing about equally to declines in species richness [26]. Our study predicts that approximately 48% of the amphibian species in Europe will suffer range contraction by 2050, with some of the “loser” species being considered as critically endangered (Salamandra lanzai), endangered (Rana pyrenaica, Alytes muletensis), or vulnerable (Speleomantes genei, Rana iberica, Salamandra salamandra, Triturus marmoratus, Pelobates cultripes) according to the IUCN Red List. Notably, Speleomantes genei (Vulnerable) is expected to lose 99% of its current range, retaining only 1% of its range. Taking into account the declining trajectory of the majority of the amphibians’ populations, conservations policies should be updated and revised in order to mitigate the adverse impacts of climate and land use changes. Climate and land use changes synergistically affect European amphibian diversity patterns (e.g., [48,141,148,149,150,151,152,153,154]), perhaps resulting in extended shifts in the functional structure (functional richness, variability, and redundancy) of future assemblages [140,141]. Given that amphibian biodiversity loss is a prominent feature of the Anthropocene [155], studying functional diversity becomes imperative to comprehend the magnitude and pace of this loss [156]. Before extinctions occur, species are likely to coexist with con-taxonomic competitors within human-defined novel landscapes, including heavily transformed areas and protected areas intended to reduce human impact. Therefore, future research across such distinct landscapes that will aim to detect changes in the functional features of amphibian communities over the mid-term—including biotic homogenization [157,158]—may help develop early warning signals [90] and provide an opportunity to proactively identify the winners and losers of the future.

Supplementary Materials

The following supporting information can be downloaded at: https://www.mdpi.com/article/10.3390/land13081206/s1, Figure S1. Scores of true skill statistic (TSS) and area under the curve (AUC) of European amphibian ensemble species distribution models. Each circle corresponds to the model scores for each species (n = 73); Figure S2. Mean coefficient of variation (standard deviation/mean) of the current (left) and future (right) predictions generated through ensemble species distribution modelling across 73 amphibian species. Darker colors represent higher coefficient of variation and uncertainty of prediction; Figure S3. Wilcoxon rank-sum test results of the continuous functional trait differences between species expected to contract (n = 33) or expand (n = 42) their distribution range by 2050; Figure S4. Standardized effect sizes (SES) for functional richness (a,b) and Rao’s quadratic entropy (c,d) for current (2015) and future (2050) projections; Figure S5. Predicted probability of directional shifts in functional richness estimated through ensemble species distribution models (ΔFRicprojected) and based on differences in species richness (ΔFRicpredicted) by 2050. Each of the four categories denotes the directional (in)consistency between ΔFRicprojected and ΔFRicpredicted, (i.e., Gainprojected − Gainpredicted, Gainprojected − Losspredicted, Lossprojected − Gainpredicted, Lossprojected − Losspredicted), which was fitted as a response variable in a multinomial logistic regression model with elevation as an explanatory variable. Error bars indicate the 95% confidence interval of the estimated probability; Table S1. The mean functional traits of the 77 amphibian species included in the analyses. Each species was assigned to a functional entity (n = 65) in order to estimate functional redundancy (see Methods). Definitions and measurements details are given as footnotes, from Trochet et al. [67] (see main text); Table S2. Sources used to complement the functional traits of species missing from the database of Trochet et al. [67]) or AmphiBIO (see main text for details); Table S3. Land type aggregation of the GLOBIO4 land use maps; Table S4. The area covered by each aggregated land cover type in 2015 and 2050; Table S5. The variance inflation factor (VIF) of the 15 climatic and land use variables included for ensemble species distribution modelling; Table S6. The models used for the ensemble modelling and the associated parameter settings; Table S7. The projected range size of each species and the relative change compared to the range size in 2015; Table S8. Relative contribution of climatic variables and land use-related variables to projected species distributions per species; Table S9. The estimated effect of elevation on temporal shifts in projected and predicted functional richness.

Author Contributions

Conceptualization, K.P., M.L. and A.S.K.; methodology, K.P., D.-E.M., M.L. and A.S.K.; validation, K.P., D.-E.M. and M.L.; formal analysis, K.P., D.-E.M. and M.L.; investigation, K.P., M.L. and M.A.T.; writing—original draft, K.P. and M.L.; writing—review and editing, all authors. All authors have read and agreed to the published version of the manuscript.

Funding

The research was supported by the Hellenic Foundation for Research and Innovation (H.F.R.I.) under the “First Call for H.F.R.I. Research Projects to support Faculty members and Researchers and the procurement of high-cost research equipment grant” (Project Number: HFRI-FM17-2024 Mapping Functional Diversity Drivers, Impacts and Threats—MAPFUN).

Data Availability Statement

The functional traits analyzed are available in the Supplementary Materials. Climatic data are available at https://chelsa-climate.org/ (accessed on 15 November 2023), land use data are available at https://www.globio.info/globio-data-downloads (accessed on 15 November 2023), and elevation data are available at https://opentopography.org/ (accessed on 15 December 2023).

Acknowledgments

Results presented in this work have been produced using the Aristotle University of Thessaloniki (AUTH) High-Performance Computing Infrastructure and Resources.

Conflicts of Interest

The authors declare no conflicts of interest.

References

  1. Morse, N.B.; Pellissier, P.A.; Cianciola, E.N.; Brereton, R.L.; Sullivan, M.M.; Shonka, N.K.; Wheeler, T.B.; McDowell, W.H. Novel ecosystems in the Anthropocene: A revision of the novel ecosystem concept for pragmatic applications. Ecol. Soc. 2014, 19. [Google Scholar] [CrossRef]
  2. Intergovernmental Panel on Climate Change. Climate Change 2021: The Physical Science Basis. In Contribution of Working Group I to the Sixth Assessment Report of the Intergovernmental Panel on Climate Change; Cambridge University Press: Cambridge, UK; New York, NY, USA, 2021; p. 2391. [Google Scholar]
  3. Oliver, T.H.; Roy, D.B. The pitfalls of ecological forecasting. Biol. J. Linn. Soc. 2015, 115, 767–778. [Google Scholar] [CrossRef]
  4. Lenoir, J.; Bertrand, R.; Comte, L.; Bourgeaud, L.; Hattab, T.; Murienne, J.; Grenouillet, G. Species better track climate warming in the oceans than on land. Nat. Ecol. Evol. 2020, 4, 1044–1059. [Google Scholar] [CrossRef] [PubMed]
  5. Lenoir, J.; Svenning, J.C. Climate-related range shifts–a global multidimensional synthesis and new research directions. Ecography 2015, 38, 15–28. [Google Scholar] [CrossRef]
  6. Dale, V.H. The relationship between land-use change and climate change. Ecol. Appl. 1997, 7, 753–769. [Google Scholar] [CrossRef]
  7. Thuiller, W.; Lavorel, S.; Sykes, M.T.; Araújo, M.B. Using niche-based modelling to assess the impact of climate change on tree functional diversity in Europe. Divers. Distrib. 2006, 12, 49–60. [Google Scholar] [CrossRef]
  8. Buisson, L.; Grenouillet, G.; Villéger, S.; Canal, J.; Laffaille, P. Toward a loss of functional diversity in stream fish assemblages under climate change. Glob. Chang. Biol. 2013, 19, 387–400. [Google Scholar] [CrossRef]
  9. Gallagher, R.V.; Hughes, L.; Leishman, M.R. Species loss and gain in communities under future climate change: Consequences for functional diversity. Ecography 2013, 36, 531–540. [Google Scholar] [CrossRef]
  10. Del Toro, I.; Silva, R.R.; Ellison, A.M. Predicted impacts of climatic change on ant functional diversity and distributions in eastern N orth A merican forests. Divers. Distrib. 2015, 21, 781–791. [Google Scholar] [CrossRef]
  11. Benedetti, F.; Ayata, S.D.; Irisson, J.O.; Adloff, F.; Guilhaumon, F. Climate change may have minor impact on zooplankton functional diversity in the Mediterranean Sea. Divers. Distrib. 2019, 25, 568–581. [Google Scholar] [CrossRef]
  12. Bender, I.M.; Kissling, W.D.; Böhning-Gaese, K.; Hensen, I.; Kühn, I.; Nowak, L.; Töpfer, T.; Wiegand, T.; Dehling, D.M.; Schleuning, M. Projected impacts of climate change on functional diversity of frugivorous birds along a tropical elevational gradient. Sci. Rep. 2019, 9, 17708. [Google Scholar] [CrossRef] [PubMed]
  13. Jetz, W.; Wilcove, D.S.; Dobson, A.P. Projected impacts of climate and land-use change on the global diversity of birds. PLoS Biol. 2007, 5, e157. [Google Scholar] [CrossRef] [PubMed]
  14. Stewart, P.S.; Voskamp, A.; Santini, L.; Biber, M.F.; Devenish, A.J.; Hof, C.; Willis, S.G.; Tobias, J.A. Global impacts of climate change on avian functional diversity. Ecol. Lett. 2022, 25, 673–685. [Google Scholar] [CrossRef]
  15. Scherer, L.; Boom, H.A.; Barbarossa, V.; van Bodegom, P.M. Climate change threats to the global functional diversity of freshwater fish. Glob. Chang. Biol. 2023, 29, 3781–3793. [Google Scholar] [CrossRef]
  16. Walther, G.-R.; Post, E.; Convey, P.; Menzel, A.; Parmesan, C.; Beebee, T.J.; Fromentin, J.-M.; Hoegh-Guldberg, O.; Bairlein, F. Ecological responses to recent climate change. Nature 2002, 416, 389–395. [Google Scholar] [CrossRef]
  17. Buckley, L.B.; Hurlbert, A.H.; Jetz, W. Broad-scale ecological implications of ectothermy and endothermy in changing environments. Glob. Ecol. Biogeogr. 2012, 21, 873–885. [Google Scholar] [CrossRef]
  18. Ramalho, Q.; Vale, M.M.; Manes, S.; Diniz, P.; Malecha, A.; Prevedello, J.A. Evidence of stronger range shift response to ongoing climate change by ectotherms and high-latitude species. Biol. Conserv. 2023, 279, 109911. [Google Scholar] [CrossRef]
  19. Rodríguez, M.Á.; Belmontes, J.A.; Hawkins, B.A. Energy, water and large-scale patterns of reptile and amphibian species richness in Europe. Acta Oecologica 2005, 28, 65–70. [Google Scholar] [CrossRef]
  20. Currie, D.J. Energy and Large-Scale Patterns of Animal- and Plant-Species Richness. Am. Nat. 1991, 137, 27–49. [Google Scholar] [CrossRef]
  21. Rozen-Rechels, D.; Dupoué, A.; Lourdais, O.; Chamaillé-Jammes, S.; Meylan, S.; Clobert, J.; Le Galliard, J.F. When water interacts with temperature: Ecological and evolutionary implications of thermo-hydroregulation in terrestrial ectotherms. Ecol. Evol. 2019, 9, 10029–10043. [Google Scholar] [CrossRef]
  22. Bellard, C.; Bertelsmeier, C.; Leadley, P.; Thuiller, W.; Courchamp, F. Impacts of climate change on the future of biodiversity. Ecol. Lett. 2012, 15, 365–377. [Google Scholar] [CrossRef]
  23. Mouillot, D.; Villéger, S.; Scherer-Lorenzen, M.; Mason, N.W. Functional structure of biological communities predicts ecosystem multifunctionality. PLoS ONE 2011, 6, e17476. [Google Scholar] [CrossRef] [PubMed]
  24. Bregman, T.P.; Lees, A.C.; MacGregor, H.E.; Darski, B.; de Moura, N.G.; Aleixo, A.; Barlow, J.; Tobias, J.A. Using avian functional traits to assess the impact of land-cover change on ecosystem processes linked to resilience in tropical forests. Proc. R. Soc. B Biol. Sci. 2016, 283, 20161289. [Google Scholar] [CrossRef] [PubMed]
  25. Re:wild; Synchronicity Earth; IUCN SSC Amphibian Specialist Group. State of the World’s Amphibians: The Second Global Amphibian Assessment; Re:wild: Austin, TX, USA, 2023. [Google Scholar]
  26. Luedtke, J.A.; Chanson, J.; Neam, K.; Hobin, L.; Maciel, A.O.; Catenazzi, A.; Borzée, A.; Hamidy, A.; Aowphol, A.; Jean, A. Ongoing declines for the world’s amphibians in the face of emerging threats. Nature 2023, 622, 308–314. [Google Scholar] [CrossRef] [PubMed]
  27. Kingsford, R.T.; Basset, A.; Jackson, L. Wetlands: Conservation’s poor cousins. Aquat. Conserv. Mar. Freshw. Ecosyst. 2016, 26, 892–916. [Google Scholar] [CrossRef]
  28. Verhoeven, J.T. Wetlands in Europe: Perspectives for restoration of a lost paradise. Ecol. Eng. 2014, 66, 6–9. [Google Scholar] [CrossRef]
  29. Hocking, D.J.; Babbitt, K.J. Amphibian contributions to ecosystem services. Herpetol. Conserv. Biol. 2014, 9, 1–17. [Google Scholar]
  30. Frost, D. Amphibian Species of the World 6.2. Available online: https://amphibiansoftheworld.amnh.org/ (accessed on 1 November 2023).
  31. GBIF. GBIF Home Page. Available online: https://www.gbif.org (accessed on 15 March 2024).
  32. Chamberlain, S.; Barve, V.; Mcglinn, D.; Oldoni, D.; Desmet, P.; Geffert, L.; Ram, K. rgbif: Interface to the Global Biodiversity Information Facility API; Version 3.7.9. 2019. Available online: https://cran.r-project.org/web/packages/rgbif/index.html (accessed on 30 April 2024).
  33. Zizka, A.; Silvestro, D.; Andermann, T.; Azevedo, J.; Duarte Ritter, C.; Edler, D.; Farooq, H.; Herdean, A.; Ariza, M.; Scharn, R.; et al. CoordinateCleaner: Standardized cleaning of occurrence records from biological collection databases. Methods Ecol. Evol. 2019, 10, 744–751. [Google Scholar] [CrossRef]
  34. Speybroeck, J.; Beukema, W.; Dufresnes, C.; Fritz, U.; Jablonski, D.; Lymberakis, P.; Martínez-Solano, I.; Razzetti, E.; Vamberger, M.; Vences, M.; et al. Species list of the European herpetofauna—2020 update by the Taxonomic Committee of the Societas Europaea Herpetologica. Amphib. Reptil. 2020, 41, 139–189. [Google Scholar] [CrossRef]
  35. Bozkurt, E.; Tural, M.; Ulutaş, G.; Üzüm, N.; Olgun, K. Two new paedomorphic population records of the smooth newt, Lissotriton vulgaris schmidtleri (Raxworthy, 1988)(Urodela, Salamandridae), from Western Turkey. Russ. J. Herpetol. 2016, 23, 158–162. [Google Scholar]
  36. Sotiropoulos, K.; Moustakas, K.; Toli, E.-A. First record of facultative paedomorphosis in the Turkish smooth newt (Lissotriton schmidtleri) from Greece. Herpetol. Notes 2020, 13, 1041–1044. [Google Scholar]
  37. Güler, H.; Üzüm, N.; Olgun, K.; Avcı, A. Age and Body Size Comparison of the Turkish Smooth Newt, Lissotriton schmidtleri We (Raxworthy, 1988)(Amphibia: Urodela) Populations from Two Different Altitudes. Commagene J. Biol. 2023, 7, 24–30. [Google Scholar] [CrossRef]
  38. Furtula, M.; Ivanović, A.; Džukić, G.; Kalezić, M.L. Egg size variation in crested newts from the western Balkans (Caudata, Salamandridae, Triturus cristatus superspecies). Zool. Stud. 2008, 47, 585–590. [Google Scholar]
  39. Furtula, M.; Todorović, B.; Simić, V.; Ivanović, A. Interspecific differences in early life-history traits in crested newts (Triturus cristatus superspecies, Caudata, Salamandridae) from the Balkan Peninsula. J. Nat. Hist. 2009, 43, 469–477. [Google Scholar] [CrossRef]
  40. Lukanov, S.; Doncheva, T.; Kostova, N.; Naumov, B. Effects of selected environmental parameters on the activity and body condition of the Buresch’s crested newt (Triturus ivanbureschi) with notes on skin secretions. North-West. J. Zool. 2021, 17, 34–38. [Google Scholar]
  41. Lukanov, S.; Tzankov, N. Life history, age and normal development of the Balkan-Anatolian crested newt (Triturus ivanbureschi Arntzen and Wielstra, 2013) from Sofia district. North-West. J. Zool. 2016, 12, 22–32. [Google Scholar]
  42. Recuero, E.; Canestrelli, D.; Vörös, J.; Szabó, K.; Poyarkov, N.; Arntzen, J.W.; Crnobrnja-Isailovic, J.; Kidov, A.; Cogălniceanu, D.; Caputo, F. Multilocus species tree analyses resolve the radiation of the widespread Bufo bufo species group (Anura, Bufonidae). Mol. Phylogenet. Evol. 2012, 62, 71–86. [Google Scholar] [CrossRef] [PubMed]
  43. International Union for Conservation of Nature. The IUCN Red List of Threatened Species. Available online: https://www.iucnredlist.org (accessed on 10 January 2024).
  44. Villéger, S.; Mason, N.W.; Mouillot, D. New multidimensional functional diversity indices for a multifaceted framework in functional ecology. Ecology 2008, 89, 2290–2301. [Google Scholar] [CrossRef] [PubMed]
  45. Zellmer, A.J.; Slezak, P.; Katz, T.S. Clearing up the crystal ball: Understanding uncertainty in future climate suitability projections for amphibians. Herpetologica 2020, 76, 108–120. [Google Scholar] [CrossRef]
  46. Anunciação, P.R.; Ernst, R.; Martello, F.; Vancine, M.H.; de Carvalho, L.M.T.; Ribeiro, M.C. Climate-driven loss of taxonomic and functional richness in Brazilian Atlantic Forest anurans. Perspect. Ecol. Conserv. 2023, 21, 274–285. [Google Scholar] [CrossRef]
  47. Tsianou, M.A.; Kallimanis, A.S. Different species traits produce diverse spatial functional diversity patterns of amphibians. Biodivers. Conserv. 2016, 25, 117–132. [Google Scholar] [CrossRef]
  48. Tsianou, M.A.; Kallimanis, A.S. Geographical patterns and environmental drivers of functional diversity and trait space of amphibians of Europe. Ecol. Res. 2020, 35, 123–138. [Google Scholar] [CrossRef]
  49. Tsianou, M.A.; Kallimanis, A.S. Trait selection matters! A study on European amphibian functional diversity patterns. Ecol. Res. 2019, 34, 225–234. [Google Scholar] [CrossRef]
  50. Albert, C.H.; de Bello, F.; Boulangeat, I.; Pellet, G.; Lavorel, S.; Thuiller, W. On the importance of intraspecific variability for the quantification of functional diversity. Oikos 2011, 121, 116–126. [Google Scholar] [CrossRef]
  51. Wong, M.K.L.; Carmona, C.P.; Ergon, T. Including intraspecific trait variability to avoid distortion of functional diversity and ecological inference: Lessons from natural assemblages. Methods Ecol. Evol. 2021, 12, 946–957. [Google Scholar] [CrossRef]
  52. Carmona, C.P.; de Bello, F.; Mason, N.W.H.; Leps, J. Traits without Borders: Integrating Functional Diversity Across Scales. Trends Ecol. Evol. 2016, 31, 382–394. [Google Scholar] [CrossRef]
  53. Palacio, F.; Ottaviani, G.; Mammola, S.; Graco-Roza, C.; de Bello, F.; Carmona, C. Integrating intraspecific trait variability in functional diversity: An overview of methods and a guide for ecologists. EcoEvoRxiv 2024. [Google Scholar] [CrossRef]
  54. Goncalves-Souza, T.; Chaves, L.S.; Boldorini, G.X.; Ferreira, N.; Gusmao, R.A.F.; Peronico, P.B.; Sanders, N.J.; Teresa, F.B. Bringing light onto the Raunkiaeran shortfall: A comprehensive review of traits used in functional animal ecology. Ecol. Evol. 2023, 13, e10016. [Google Scholar] [CrossRef]
  55. Hevia, V.; Martin-Lopez, B.; Palomo, S.; Garcia-Llorente, M.; de Bello, F.; Gonzalez, J.A. Trait-based approaches to analyze links between the drivers of change and ecosystem services: Synthesizing existing evidence and future challenges. Ecol. Evol. 2017, 7, 831–844. [Google Scholar] [CrossRef]
  56. Etard, A.; Morrill, S.; Newbold, T.; Sheard, C. Global gaps in trait data for terrestrial vertebrates. Glob. Ecol. Biogeogr. 2020, 29, 2143–2158. [Google Scholar] [CrossRef]
  57. Schleuning, M.; García, D.; Tobias, J.A. Animal functional traits: Towards a trait-based ecology for whole ecosystems. Funct. Ecol. 2023, 37, 4–12. [Google Scholar] [CrossRef]
  58. Michaels, C.J.; Gini, B.F.; Preziosi, R.F. The importance of natural history and species-specific approaches in amphibian ex-situ conservation. Herpetol. J. 2014, 24, 135–145. [Google Scholar]
  59. Chalmandrier, L.; Münkemüller, T.; Colace, M.P.; Renaud, J.; Aubert, S.; Carlson, B.Z.; Clément, J.C.; Legay, N.; Pellet, G.; Saillard, A.; et al. Spatial scale and intraspecific trait variability mediate assembly rules in alpine grasslands. J. Ecol. 2016, 105, 277–287. [Google Scholar] [CrossRef]
  60. Siefert, A.; Violle, C.; Chalmandrier, L.; Albert, C.H.; Taudiere, A.; Fajardo, A.; Aarssen, L.W.; Baraloto, C.; Carlucci, M.B.; Cianciaruso, M.V.; et al. A global meta-analysis of the relative extent of intraspecific trait variation in plant communities. Ecol. Lett. 2015, 18, 1406–1419. [Google Scholar] [CrossRef]
  61. Albert, C.H.; Grassein, F.; Schurr, F.M.; Vieilledent, G.; Violle, C. When and how should intraspecific variability be considered in trait-based plant ecology? Perspect. Plant Ecol. Evol. Syst. 2011, 13, 217–225. [Google Scholar] [CrossRef]
  62. Ibarra-Isassi, J.; Handa, I.T.; Lessard, J.P. Community-wide trait adaptation, but not plasticity, explains ant community structure in extreme environments. Funct. Ecol. 2022, 37, 139–149. [Google Scholar] [CrossRef]
  63. Callaghan, C.T.; Palacio, F.X.; Benedetti, Y.; Morelli, F.; Bowler, D.E. Large-scale spatial variability in urban tolerance of birds. J. Anim. Ecol. 2023, 92, 403–416. [Google Scholar] [CrossRef]
  64. Santini, L.; BENÍTEZ-LÓPEZ, A.; Ficetola, G.F.; Huijbregts, M.A. Length–mass allometries in amphibians. Integr. Zool. 2018, 13, 36–45. [Google Scholar] [CrossRef] [PubMed]
  65. Alzate, A.; Onstein, R.E. Understanding the relationship between dispersal and range size. Ecol. Lett. 2022, 25, 2303–2323. [Google Scholar] [CrossRef]
  66. Trakimas, G.; Whittaker, R.J.; Borregaard, M.K. Do biological traits drive geographical patterns in European amphibians? Glob. Ecol. Biogeogr. 2016, 25, 1228–1238. [Google Scholar] [CrossRef]
  67. Trochet, A.; Moulherat, S.; Calvez, O.; Stevens, V.M.; Clobert, J.; Schmeller, D.S. A database of life-history traits of European amphibians. Biodivers. Data J. 2014, 2, e4123. [Google Scholar] [CrossRef] [PubMed]
  68. Oliveira, B.F.; São-Pedro, V.A.; Santos-Barrera, G.; Penone, C.; Costa, G.C. AmphiBIO, a global database for amphibian ecological traits. Sci. Data 2017, 4, 170123. [Google Scholar] [CrossRef]
  69. de Bello, F.; Botta-Dukát, Z.; Lepš, J.; Fibich, P. Towards a more balanced combination of multiple traits when computing functional differences between species. Methods Ecol. Evol. 2021, 12, 443–448. [Google Scholar] [CrossRef]
  70. Karger, D.N.; Conrad, O.; Böhner, J.; Kawohl, T.; Kreft, H.; Soria-Auza, R.W.; Zimmermann, N.E.; Linder, H.P.; Kessler, M. Climatologies at high resolution for the earth’s land surface areas. Sci. Data 2017, 4, 170122. [Google Scholar] [CrossRef]
  71. Karger, D.N.; Conrad, O.; Böhner, J.; Kawohl, T.; Kreft, H.; Soria-Auza, R.W.; Zimmermann, N.E.; Linder, H.P.; Kessler, M. Climatologies at high resolution for the earth’s land surface areas. EnviDat 2021. [Google Scholar] [CrossRef] [PubMed]
  72. Boucher, O.; Servonnat, J.; Albright, A.L.; Aumont, O.; Balkanski, Y.; Bastrikov, V.; Bekki, S.; Bonnet, R.; Bony, S.; Bopp, L. Presentation and evaluation of the IPSL-CM6A-LR climate model. J. Adv. Model. Earth Syst. 2020, 12, e2019MS002010. [Google Scholar] [CrossRef]
  73. Eyring, V.; Bony, S.; Meehl, G.A.; Senior, C.A.; Stevens, B.; Stouffer, R.J.; Taylor, K.E. Overview of the Coupled Model Intercomparison Project Phase 6 (CMIP6) experimental design and organization. Geosci. Model Dev. 2016, 9, 1937–1958. [Google Scholar] [CrossRef]
  74. Fujimori, S.; Hasegawa, T.; Masui, T.; Takahashi, K.; Herran, D.S.; Dai, H.; Hijioka, Y.; Kainuma, M. SSP3: AIM implementation of shared socioeconomic pathways. Glob. Environ. Chang. 2017, 42, 268–283. [Google Scholar] [CrossRef]
  75. Riahi, K.; Van Vuuren, D.P.; Kriegler, E.; Edmonds, J.; O’neill, B.C.; Fujimori, S.; Bauer, N.; Calvin, K.; Dellink, R.; Fricko, O. The Shared Socioeconomic Pathways and their energy, land use, and greenhouse gas emissions implications: An overview. Glob. Environ. Chang. 2017, 42, 153–168. [Google Scholar] [CrossRef]
  76. Schipper, A.M.; Hilbers, J.P.; Meijer, J.R.; Antão, L.H.; Benítez-López, A.; de Jonge, M.M.; Leemans, L.H.; Scheper, E.; Alkemade, R.; Doelman, J.C. Projecting terrestrial biodiversity intactness with GLOBIO 4. Glob. Chang. Biol. 2020, 26, 760–771. [Google Scholar] [CrossRef]
  77. Thuiller, W.; Georges, D.; Engler, R.; Breiner, F. Biomod2: Ensemble Platform for Species Distribution Modelling; R Package Version 3.4.6. 2020. Available online: https://biomodhub.github.io/biomod2/ (accessed on 30 April 2024).
  78. Polaina, E.; Pärt, T.; Recio, M.R. Identifying hotspots of invasive alien terrestrial vertebrates in Europe to assist transboundary prevention and control. Sci. Rep. 2020, 10, 11655. [Google Scholar] [CrossRef] [PubMed]
  79. Michailidou, D.-E.; Lazarina, M.; Sgardelis, S.P. Temperature and prey species richness drive the broad-scale distribution of a generalist predator. Diversity 2021, 13, 169. [Google Scholar] [CrossRef]
  80. Aguirre-Gutiérrez, J.; Carvalheiro, L.G.; Polce, C.; van Loon, E.E.; Raes, N.; Reemer, M.; Biesmeijer, J.C. Fit-for-purpose: Species distribution model performance depends on evaluation criteria–Dutch hoverflies as a case study. PLoS ONE 2013, 8, e63708. [Google Scholar] [CrossRef] [PubMed]
  81. Comte, L.; Grenouillet, G. Species distribution modelling and imperfect detection: Comparing occupancy versus consensus methods. Divers. Distrib. 2013, 19, 996–1007. [Google Scholar] [CrossRef]
  82. Marmion, M.; Parviainen, M.; Luoto, M.; Heikkinen, R.K.; Thuiller, W. Evaluation of consensus methods in predictive species distribution modelling. Divers. Distrib. 2009, 15, 59–69. [Google Scholar] [CrossRef]
  83. Crossman, N.D.; Bass, D.A. Application of common predictive habitat techniques for post-border weed risk management. Divers. Distrib. 2008, 14, 213–224. [Google Scholar] [CrossRef]
  84. Araújo, M.B.; New, M. Ensemble forecasting of species distributions. Trends Ecol. Evol. 2007, 22, 42–47. [Google Scholar] [CrossRef] [PubMed]
  85. Allouche, O.; Tsoar, A.; Kadmon, R. Assessing the accuracy of species distribution models: Prevalence, kappa and the true skill statistic (TSS). J. Appl. Ecol. 2006, 43, 1223–1232. [Google Scholar] [CrossRef]
  86. Wisz, M.S.; Guisan, A. Do pseudo-absence selection strategies influence species distribution models and their predictions? An information-theoretic approach based on simulated data. BMC Ecol. 2009, 9, 8. [Google Scholar] [CrossRef]
  87. Barbet-Massin, M.; Jiguet, F.; Albert, C.H.; Thuiller, W. Selecting pseudo-absences for species distribution models: How, where and how many? Methods Ecol. Evol. 2012, 3, 327–338. [Google Scholar] [CrossRef]
  88. Liu, C.; White, M.; Newell, G. Selecting thresholds for the prediction of species occurrence with presence-only data. J. Biogeogr. 2013, 40, 778–789. [Google Scholar] [CrossRef]
  89. Sillero, N.; Campos, J.; Bonardi, A.; Corti, C.; Creemers, R.; Crochet, P.-A.; Isailović, J.C.; Denoël, M.; Ficetola, G.F.; Gonçalves, J. Updated distribution and biogeography of amphibians and reptiles of Europe. Amphib. Reptil. 2014, 35, 1–31. [Google Scholar] [CrossRef]
  90. Mouillot, D.; Graham, N.A.; Villéger, S.; Mason, N.W.; Bellwood, D.R. A functional approach reveals community responses to disturbances. Trends Ecol. Evol. 2013, 28, 167–177. [Google Scholar] [CrossRef] [PubMed]
  91. Rao, C.R. Diversity and dissimilarity coefficients: A unified approach. Theor. Popul. Biol. 1982, 21, 24–43. [Google Scholar] [CrossRef]
  92. Mouillot, D.; Villéger, S.; Parravicini, V.; Kulbicki, M.; Arias-González, J.E.; Bender, M.; Chabanet, P.; Floeter, S.R.; Friedlander, A.; Vigliola, L. Functional over-redundancy and high functional vulnerability in global fish faunas on tropical reefs. Proc. Natl. Acad. Sci. USA 2014, 111, 13757–13762. [Google Scholar] [CrossRef] [PubMed]
  93. Magneville, C.; Loiseau, N.; Albouy, C.; Casajus, N.; Claverie, T.; Escalas, A.; Leprieur, F.; Maire, E.; Mouillot, D.; Villéger, S. mFD: An R package to compute and illustrate the multiple facets of functional diversity. Ecography 2021, 2022. [Google Scholar] [CrossRef]
  94. Ripley, B.; Venables, B.; Bates, D.M.; Hornik, K.; Gebhardt, A.; Firth, D.; Ripley, M.B. Package ‘MASS’; CRAN R. 2013. Available online: https://cran.r-project.org/web/packages/MASS/index.html (accessed on 30 April 2024).
  95. Hollister, J.W.; Robitaille, A.L.; Beck, M.W.; MikeJohnson-NOAA; Shah, T. jhollist/elevatr: CRAN Release v0.99.0. 2023. Available online: https://zenodo.org/records/8335450 (accessed on 30 April 2024).
  96. R Core Team. R: A Language and Environment for Statistical Computing; R Foundation for Statistical Computing: Vienna, Austria, 2023. [Google Scholar]
  97. Arntzen, J. From descriptive to predictive distribution models: A working example with Iberian amphibians and reptiles. Front. Zool. 2006, 3, 8. [Google Scholar] [CrossRef] [PubMed]
  98. Girardello, M.; Griggio, M.; Whittingham, M.J.; Rushton, S.P. Models of climate associations and distributions of amphibians in Italy. Ecol. Res. 2010, 25, 103–111. [Google Scholar] [CrossRef]
  99. Boyer, I.; Cayuela, H.; Bertrand, R.; Isselin-Nondedeu, F. Improving biological relevance of model projections in response to climate change by considering dispersal amongst lineages in an amphibian. J. Biogeogr. 2021, 48, 561–576. [Google Scholar] [CrossRef]
  100. Campos, J.C.; Rodrigues, S.; Freitas, T.; Santos, J.A.; Honrado, J.P.; Regos, A. Climatic variables and ecological modelling data for birds, amphibians and reptiles in the Transboundary Biosphere Reserve of Meseta Ibérica (Portugal-Spain). Biodivers. Data J. 2021, 9, e66509. [Google Scholar] [CrossRef]
  101. Arntzen, J.W. Coexistence of two newt species in a transition zone of range overlap. Contrib. Zool. 2022, 91, 133–151. [Google Scholar] [CrossRef]
  102. Araújo, M.B.; Thuiller, W.; Pearson, R.G. Climate warming and the decline of amphibians and reptiles in Europe. J. Biogeogr. 2006, 33, 1712–1728. [Google Scholar] [CrossRef]
  103. Markovic, D.; Carrizo, S.; Freyhof, J.; Cid, N.; Lengyel, S.; Scholz, M.; Kasperdius, H.; Darwall, W. Europe’s freshwater biodiversity under climate change: Distribution shifts and conservation needs. Divers. Distrib. 2014, 20, 1097–1107. [Google Scholar] [CrossRef]
  104. Lourenço-de-Moraes, R.; Campos, F.S.; Ferreira, R.B.; Solé, M.; Beard, K.H.; Bastos, R.P. Back to the future: Conserving functional and phylogenetic diversity in amphibian-climate refuges. Biodivers. Conserv. 2019, 28, 1049–1073. [Google Scholar] [CrossRef]
  105. Villacampa, J.; Whitworth, A.; Allen, L.; Malo, J.E. Altitudinal differences in alpha, beta and functional diversity of an amphibian community in a biodiversity hotspot. Neotrop. Biodivers. 2019, 5, 60–68. [Google Scholar] [CrossRef]
  106. González-del-Pliego, P.; Scheffers, B.R.; Freckleton, R.P.; Basham, E.W.; Araújo, M.B.; Acosta-Galvis, A.R.; Medina Uribe, C.A.; Haugaasen, T.; Edwards, D.P. Thermal tolerance and the importance of microhabitats for Andean frogs in the context of land use and climate change. J. Anim. Ecol. 2020, 89, 2451–2460. [Google Scholar] [CrossRef]
  107. Sillero, N. Climate change in action: Local elevational shifts on Iberian amphibians and reptiles. Reg. Environ. Chang. 2021, 21, 101. [Google Scholar] [CrossRef]
  108. Tiberti, R.; Mangiacotti, M.; Bennati, R. The upward elevational shifts of pond breeding amphibians following climate warming. Biol. Conserv. 2021, 253, 108911. [Google Scholar] [CrossRef]
  109. Alves-Ferreira, G.; Talora, D.C.; Solé, M.; Cervantes-López, M.J.; Heming, N.M. Unraveling global impacts of climate change on amphibians distributions: A life-history and biogeographic-based approach. Front. Ecol. Evol. 2022, 10, 987237. [Google Scholar] [CrossRef]
  110. Guirguis, J.; Goodyear, L.E.; Finn, C.; Johnson, J.V.; Pincheira-Donoso, D. Risk of extinction increases towards higher elevations across the world’s amphibians. Glob. Ecol. Biogeogr. 2023, 32, 1952–1963. [Google Scholar] [CrossRef]
  111. Lawler, J.J.; Shafer, S.L.; White, D.; Kareiva, P.; Maurer, E.P.; Blaustein, A.R.; Bartlein, P.J. Projected climate-induced faunal change in the Western Hemisphere. Ecology 2009, 90, 588–597. [Google Scholar] [CrossRef] [PubMed]
  112. Duan, R.-Y.; Kong, X.-Q.; Huang, M.-Y.; Varela, S.; Ji, X. The potential effects of climate change on amphibian distribution, range fragmentation and turnover in China. PeerJ 2016, 4, e2185. [Google Scholar] [CrossRef] [PubMed]
  113. Mi, C.; Huettmann, F.; Li, X.; Jiang, Z.; Du, W.; Sun, B. Effects of climate and human activity on the current distribution of amphibians in China. Conserv. Biol. 2022, 36, e13964. [Google Scholar] [CrossRef] [PubMed]
  114. Cancellario, T.; Miranda, R.; Baquero, E.; Fontaneto, D.; Martínez, A.; Mammola, S. Climate change will redefine taxonomic, functional, and phylogenetic diversity of Odonata in space and time. npj Biodivers. 2022, 1, 1. [Google Scholar] [CrossRef]
  115. Zhang, L.; Lu, X. Amphibians live longer at higher altitudes but not at higher latitudes. Biol. J. Linn. Soc. 2012, 106, 623–632. [Google Scholar] [CrossRef]
  116. Morrison, C.; Hero, J.M. Geographic variation in life-history characteristics of amphibians: A review. J. Anim. Ecol. 2003, 72, 270–279. [Google Scholar] [CrossRef]
  117. Amat, F.; Meiri, S. Geographical, climatic and biological constraints on age at sexual maturity in amphibians. Biol. J. Linn. Soc. 2018, 123, 34–42. [Google Scholar] [CrossRef]
  118. Forero-Medina, G.; Joppa, L.; Pimm, S.L. Constraints to species’ elevational range shifts as climate changes. Conserv. Biol. 2011, 25, 163–171. [Google Scholar] [CrossRef] [PubMed]
  119. Slavenko, A.; Meiri, S. Mean body sizes of amphibian species are poorly predicted by climate. J. Biogeogr. 2015, 42, 1246–1254. [Google Scholar] [CrossRef]
  120. Jacob, D.; Petersen, J.; Eggert, B.; Alias, A.; Christensen, O.B.; Bouwer, L.M.; Braun, A.; Colette, A.; Déqué, M.; Georgievski, G. EURO-CORDEX: New high-resolution climate change projections for European impact research. Reg. Environ. Chang. 2014, 14, 563–578. [Google Scholar] [CrossRef]
  121. Blaustein, A.R.; Wake, D.B. The puzzle of declining amphibian populations. Sci. Am. 1995, 272, 52–57. [Google Scholar] [CrossRef]
  122. Buckley, L.B.; Jetz, W. Environmental and historical constraints on global patterns of amphibian richness. Proc. R. Soc. B Biol. Sci. 2007, 274, 1167–1173. [Google Scholar] [CrossRef]
  123. Whittaker, R.J.; Nogués-Bravo, D.; Araújo, M.B. Geographical gradients of species richness: A test of the water-energy conjecture of Hawkins et al.(2003) using European data for five taxa. Glob. Ecol. Biogeogr. 2007, 16, 76–89. [Google Scholar] [CrossRef]
  124. Araújo, M.B.; Nogués-Bravo, D.; Diniz-Filho, J.A.F.; Haywood, A.M.; Valdes, P.J.; Rahbek, C. Quaternary climate changes explain diversity among reptiles and amphibians. Ecography 2008, 31, 8–15. [Google Scholar] [CrossRef]
  125. Brown, S.C.; Wigley, T.M.; Otto-Bliesner, B.L.; Rahbek, C.; Fordham, D.A. Persistent Quaternary climate refugia are hospices for biodiversity in the Anthropocene. Nat. Clim. Chang. 2020, 10, 244–248. [Google Scholar] [CrossRef]
  126. López-Alcaide, S.; Macip-Ríos, R. Effects of climate change in amphibians and reptiles. In Biodiversity Loss in A Changing Planet; Grillo, O., Venora, G., Eds.; InTech: Rijeka, Croatia, 2011; pp. 163–184. [Google Scholar]
  127. Blaustein, A.R.; Walls, S.C.; Bancroft, B.A.; Lawler, J.J.; Searle, C.L.; Gervasi, S.S. Direct and indirect effects of climate change on amphibian populations. Diversity 2010, 2, 281–313. [Google Scholar] [CrossRef]
  128. Munguía, M.; Rahbek, C.; Rangel, T.F.; Diniz-Filho, J.A.F.; Araújo, M.B. Equilibrium of global amphibian species distributions with climate. PLoS ONE 2012, 7, e34420. [Google Scholar] [CrossRef]
  129. Li, Y.; Cohen, J.M.; Rohr, J.R. Review and synthesis of the effects of climate change on amphibians. Integr. Zool. 2013, 8, 145–161. [Google Scholar] [CrossRef]
  130. Winter, M.; Fiedler, W.; Hochachka, W.M.; Koehncke, A.; Meiri, S.; De la Riva, I. Patterns and biases in climate change research on amphibians and reptiles: A systematic review. R. Soc. Open Sci. 2016, 3, 160158. [Google Scholar] [CrossRef]
  131. Carilo Filho, L.M.; Gomes, L.; Katzenberger, M.; Sole, M.; Orrico, V.G. There and back again: A meta-analytical approach on the influence of acclimation and altitude in the upper thermal tolerance of amphibians and reptiles. Front. Ecol. Evol. 2022, 10, 1017255. [Google Scholar] [CrossRef]
  132. Pottier, P.; Lin, H.-Y.; Oh, R.R.; Pollo, P.; Rivera-Villanueva, A.N.; Valdebenito, J.O.; Yang, Y.; Amano, T.; Burke, S.; Drobniak, S.M. A comprehensive database of amphibian heat tolerance. Sci. Data 2022, 9, 600. [Google Scholar] [CrossRef]
  133. Vacek, Z.; Vacek, S.; Cukor, J. European forests under global climate change: Review of tree growth processes, crises and management strategies. J. Environ. Manag. 2023, 332, 117353. [Google Scholar] [CrossRef] [PubMed]
  134. He, Y.; Liao, Z.; Chen, X.; Chen, Y. Climatic debts for global amphibians: Who, where and why? Biol. Conserv. 2023, 279, 109929. [Google Scholar] [CrossRef]
  135. Lazarina, M.; Sgardelis, S.P.; Michailidou, D.E.; Tsianou, M.; Andrikou-Charitidou, A.; Touloumis, K.; Kallimanis, A.S. Replacement drives native β-diversity of British avifauna, while richness differences shape alien β-diversity. Divers. Distrib. 2023, 29, 61–74. [Google Scholar] [CrossRef]
  136. Maiorano, L.; Amori, G.; Capula, M.; Falcucci, A.; Masi, M.; Montemaggiori, A.; Pottier, J.; Psomas, A.; Rondinini, C.; Russo, D. Threats from climate change to terrestrial vertebrate hotspots in Europe. PLoS ONE 2013, 8, e74989. [Google Scholar] [CrossRef] [PubMed]
  137. MacLean, S.A.; Beissinger, S.R. Species’ traits as predictors of range shifts under contemporary climate change: A review and meta-analysis. Glob. Chang. Biol. 2017, 23, 4094–4105. [Google Scholar] [CrossRef] [PubMed]
  138. Wu, J. The hazard and unsureness of reducing habitat ranges in response to climate warming for 91 amphibian species in China. Acta Oecologica 2020, 108, 103640. [Google Scholar] [CrossRef]
  139. Eggert, C.; Cogălniceanu, D.; Veith, M.; Dzukic, G.; Taberlet, P. The declining Spadefoot toad, Pelobates fuscus (Pelobatidae): Paleo and recent environmental changes as a major influence on current population structure and status. Conserv. Genet. 2006, 7, 185–195. [Google Scholar] [CrossRef]
  140. Hof, C.; Araújo, M.B.; Jetz, W.; Rahbek, C. Additive threats from pathogens, climate and land-use change for global amphibian diversity. Nature 2011, 480, 516–519. [Google Scholar] [CrossRef] [PubMed]
  141. Falaschi, M.; Manenti, R.; Thuiller, W.; Ficetola, G.F. Continental-scale determinants of population trends in European amphibians and reptiles. Glob. Chang. Biol. 2019, 25, 3504–3515. [Google Scholar] [CrossRef]
  142. Allentoft, M.; O’Brien, J. Global Amphibian Declines, Loss of Genetic Diversity and Fitness: A Review. Diversity 2010, 2, 47–71. [Google Scholar] [CrossRef]
  143. Hu, J.; Huang, Y.; Jiang, J.; Guisan, A. Genetic diversity in frogs linked to past and future climate changes on the roof of the world. J. Anim. Ecol. 2019, 88, 953–963. [Google Scholar] [CrossRef] [PubMed]
  144. Pearman, P.B.; Broennimann, O.; Aavik, T.; Albayrak, T.; Alves, P.C.; Aravanopoulos, F.A.; Bertola, L.D.; Biedrzycka, A.; Buzan, E.; Cubric-Curik, V.; et al. Monitoring of species’ genetic diversity in Europe varies greatly and overlooks potential climate change impacts. Nat. Ecol. Evol. 2024, 8, 267–281. [Google Scholar] [CrossRef] [PubMed]
  145. Pupins, M.; Nekrasova, O.; Marushchak, O.; Tytar, V.; Theissinger, K.; Čeirāns, A.; Skute, A.; Georges, J.-Y. Potential Threat of an Invasive Fish Species for Two Native Newts Inhabiting Wetlands of Europe Vulnerable to Climate Change. Diversity 2023, 15, 201. [Google Scholar] [CrossRef]
  146. Tytar, V.; Nekrasova, O.; Pupins, M.; Skute, A.; Kirjusina, M.; Gravele, E.; Mezaraupe, L.; Marushchak, O.; Ceirans, A.; Kozynenko, I.; et al. Modeling the Distribution of the Chytrid Fungus Batrachochytrium dendrobatidis with Special Reference to Ukraine. J. Fungi 2023, 9, 607. [Google Scholar] [CrossRef]
  147. IUCN SSC Amphibian Specialist Group. Alytes dickhilleni. The IUCN Red List of Threatened Species 2022: e.T979A89697540. 2022. Available online: https://www.iucnredlist.org/species/979/89697540 (accessed on 30 April 2024).
  148. Brum, F.T.; Gonçalves, L.O.; Cappelatti, L.; Carlucci, M.B.; Debastiani, V.J.; Salengue, E.V.; dos Santos Seger, G.D.; Both, C.; Bernardo-Silva, J.S.; Loyola, R.D. Land use explains the distribution of threatened new world amphibians better than climate. PLoS ONE 2013, 8, e60742. [Google Scholar] [CrossRef] [PubMed]
  149. Mouchet, M.; Levers, C.; Zupan, L.; Kuemmerle, T.; Plutzar, C.; Erb, K.; Lavorel, S.; Thuiller, W.; Haberl, H. Testing the effectiveness of environmental variables to explain European terrestrial vertebrate species richness across biogeographical scales. PLoS ONE 2015, 10, e0131924. [Google Scholar] [CrossRef] [PubMed]
  150. Chaudhary, A.; Mooers, A.O. Terrestrial vertebrate biodiversity loss under future global land use change scenarios. Sustainability 2018, 10, 2764. [Google Scholar] [CrossRef]
  151. Tsianou, M.A.; Koutsias, N.; Mazaris, A.D.; Kallimanis, A.S. Climate and landscape explain richness patterns depending on the type of species’ distribution data. Acta Oecol. 2016, 74, 19–27. [Google Scholar] [CrossRef]
  152. Newbold, T. Future effects of climate and land-use change on terrestrial vertebrate community diversity under different scenarios. Proc. R. Soc. B 2018, 285, 20180792. [Google Scholar] [CrossRef]
  153. Tsianou, M.A.; Lazarina, M.; Michailidou, D.-E.; Andrikou-Charitidou, A.; Sgardelis, S.P.; Kallimanis, A.S. The effect of climate and human pressures on functional diversity and species richness patterns of amphibians, reptiles and mammals in Europe. Diversity 2021, 13, 275. [Google Scholar] [CrossRef]
  154. Cordier, J.M.; Aguilar, R.; Lescano, J.N.; Leynaud, G.C.; Bonino, A.; Miloch, D.; Loyola, R.; Nori, J. A global assessment of amphibian and reptile responses to land-use changes. Biol. Conserv. 2021, 253, 108863. [Google Scholar] [CrossRef]
  155. Finn, C.; Grattarola, F.; Pincheira-Donoso, D. More losers than winners: Investigating Anthropocene defaunation through the diversity of population trends. Biol. Rev. 2023, 98, 1732–1748. [Google Scholar] [CrossRef]
  156. Toussaint, A.; Brosse, S.; Bueno, C.G.; Pärtel, M.; Tamme, R.; Carmona, C.P. Extinction of threatened vertebrates will lead to idiosyncratic changes in functional diversity across the world. Nat. Commun. 2021, 12, 5162. [Google Scholar] [CrossRef] [PubMed]
  157. Nowakowski, A.J.; Frishkoff, L.O.; Thompson, M.E.; Smith, T.M.; Todd, B.D. Phylogenetic homogenization of amphibian assemblages in human-altered habitats across the globe. Proc. Natl. Acad. Sci. USA 2018, 115, E3454–E3462. [Google Scholar] [CrossRef]
  158. Newbold, T.; Adams, G.L.; Albaladejo Robles, G.; Boakes, E.H.; Braga Ferreira, G.; Chapman, A.S.; Etard, A.; Gibb, R.; Millard, J.; Outhwaite, C.L. Climate and land-use change homogenise terrestrial biodiversity, with consequences for ecosystem functioning and human well-being. Emerg. Top. Life Sci. 2019, 3, 207–219. [Google Scholar]
Figure 1. The relative contributions of land use and climatic variables to projected species distributions (rescaled to sum up to 100). Boxplots show the interquartile value range (50%), with left and right whiskers denoting the lower (25%) and upper (75%) quartiles, respectively. Lines inside boxplots are the median and diamond symbols the mean values of each variable. Dots above the 75% quartile denote outliers. The inset figure shows the relative contribution of each effect group (land uses, climate). See Table S3 for definition of each land use variable. Heterogenous/Undef. = heterogenous/undefined; Prec cold quarter = mean monthly precipitation amount of the coldest quarter; Prec seasonality = precipitation seasonality; Prec wet quarter = mean monthly precipitation amount of the wettest quarter; T seasonality = standard deviation of the monthly mean temperatures; T = mean annual daily mean air temperatures averaged over 1 year.
Land 13 01206 g001
Figure 2. Projected amphibian species richness across (a) current (2015) and (b) future (2050) climatic and land use conditions; (c) projected temporal change in species richness (ΔSR) from 2015 to 2050. Future conditions comply with the SSP3-7.0 emissions scenario.
Land 13 01206 g002
Figure 3. Projected amphibian functional diversity across (a,d,g) current (2015) and (b,e,h) future (2050) climatic and land use conditions; (c,f,i) projected temporal changes in functional diversity (ΔFRic, ΔRaoQ, ΔFRed) from 2015 to 2050. Future conditions comply with the SSP3-7.0 emissions scenario.
Land 13 01206 g003
Figure 4. (a) The relationship between changes in functional richness estimated through ensemble species distribution modelling (ΔFRicprojected) and functional richness predicted from differences in species richness (ΔSR; ΔFRicpredicted) from 2015 to 2050. Annotations highlight areas where projected ΔFRic deviates from the predicted ΔFRic. Dashed lines denote the 1:1 (from bottom left to upper right) and −1:1 (from upper left to bottom right) relationships; (b) the count of assemblages falling into each scenario depicted in (a); (c) spatial representation of the scenarios outlined in (a). Light-grey areas denote 491 assemblages with ≤4 species that were dropped due to constraints in the analytical procedure (see Section 2 Methods).
Land 13 01206 g004
Disclaimer/Publisher’s Note: The statements, opinions and data contained in all publications are solely those of the individual author(s) and contributor(s) and not of MDPI and/or the editor(s). MDPI and/or the editor(s) disclaim responsibility for any injury to people or property resulting from any ideas, methods, instructions or products referred to in the content.

