Article

Spatial and Temporal Change Characteristics and Climatic Drivers of Vegetation Productivity and Greenness during the 2001–2020 Growing Seasons on the Qinghai–Tibet Plateau

1
College of Soil and Water Conservation, Southwest Forestry University, Kunming 650224, China
2
Biological and Environmental Sciences, The University of Stirling, Stirling FK94LA, UK
*
Author to whom correspondence should be addressed.
Land 2024, 13(8), 1230; https://doi.org/10.3390/land13081230
Submission received: 3 July 2024 / Revised: 30 July 2024 / Accepted: 5 August 2024 / Published: 7 August 2024
(This article belongs to the Special Issue Assessment of Land Use/Cover Change Using Geospatial Technology)

Abstract

:
Exploring NDVI variation and what drives it on the Qinghai–Tibet Plateau can strategically inform environmental protection efforts in light of global climate change. For this analysis, we obtained MODIS NDVI data collected during the vegetative growing season, vegetation types for the region, and meteorological data for the same period from 2001 to 2020. We performed Theil–Sen trend analysis, Mann–Kendall significance testing, spatial autocorrelation analysis, and Hurst index calculation to review the spatiotemporal changes in NDVI characteristics on the plateau for various vegetation types. We used the correlation coefficients from these analyses to investigate how the NDVI responds to temperature and precipitation. We found the following: (1) Overall, the Qinghai–Tibet Plateau NDVI increased throughout the multi-year growing season, with a much larger area of improvement (65.68%) than of degradation (8.83%). (2) The four main vegetation types were all characterized by improvement, with meadows (72.13%) comprising the largest portion of the improved area and shrubs (18.17%) comprising the largest portion of the degraded area. (3) The spatial distribution of the NDVI had a strong positive correlation and clustering effect and was stable overall. The local clustering patterns were primarily low–low and high–high clustering. (4) The Hurst index had an average value of 0.46, indicating that the sustainability of vegetation is poor; that is, the trend of vegetation change in the growing season in a large part of the Qinghai–Tibet Plateau in the future is opposite to that in the past. (5) The plateau NDVI correlated positively with air temperature and precipitation. However, the correlations varied geographically: air temperature had a wide influence, whereas precipitation mainly influenced meadows and grassland in the northern arid zone. The overall temperature-driven effect was stronger than that of precipitation. This finding is consistent with the current research conclusion that global warming and humidification promote vegetation growth in high-altitude areas and further emphasizes the uniqueness of the Qinghai–Tibet Plateau as a climate-change-sensitive area. This study also offers a technical foundation for understanding how climate change impacts high-altitude ecosystems, as well as for formulating ecological protection strategies for the plateau.

1. Introduction

In recent years, rising temperatures and sea levels, increasingly recurrent extreme storms, and melting glaciers have posed enormous challenges to human society and natural ecosystems [1]. Vegetation is a natural “link” connecting soil, water, and atmosphere and also is a major player in the conservation of soil and water, storage of carbon, regulation of climate, and protection of the ecological environment [2]. Vegetation is highly sensitive to climatic factor fluctuation, which is why it is known as an “indicator” of climate change [3]. Therefore, an in-depth study of spatiotemporal changes observed in regional vegetation, especially in response to climate change, will help inform regional ecosystem protection and sustainable development.
The Normalized Difference Vegetation Index (NDVI) represents vegetation coverage and growth status based on remote sensing of green vegetation that captures dynamic changes in the vegetation [4]. Thus, it is commonly used to track vegetation coverage dynamics at a regional scale over a long time frame [5]. Recently, several scholars have investigated spatiotemporal changes in the vegetation cover at varying spatial scales by using the long NDVI time series of data. These past studies have largely focused on NDVI dynamic trends at regional scales and their responses to meteorological factors. Jin et al. [6] investigated NDVI trends in China in recent years. They concluded that temperature and precipitation are the primary factors improving the vegetative cover and that the impact of climate change on the general trend of the NDVI presents salient spatial and temporal heterogeneity in various regions of China. Gao et al. [7,8] investigated fluctuations in the vegetation cover, as well as their drivers, in the Sanjiangyuan region and along the mid-to-upper Yellow River. The average NDVI values in these two study sites generally grew during the study period. Natural factors typically had a stronger impact than anthropogenic factors. This suggests that climate change trends significantly impact vegetative growth, primarily via temperature and precipitation [9]. Liu et al. [10] analyzed the temporal and spatial variation in alpine grassland and the impact of climate change and human activities on grassland change in Naqu City during the multi-year growing season. The results showed that the effects of extreme temperature and soil moisture on the overall scale rise in alpine grassland are more significant. Liu et al. [11] analyzed the response of vegetation to extreme climate change in the Qilian Mountains in the northeastern Qinghai–Tibet Plateau and concluded that the contribution rate of the extreme precipitation intensity index is the largest.
In studies regarding vegetation dynamics, Theil–Sen median trend estimation and one-way linear regression may be performed together with p-tests or Mann–Kendall nonparametric tests to accurately assess the variation in a vegetation index and its statistical significance [12,13]. These methods have been shown to be effective in monitoring vegetation change. However, few researchers have used geostatistical methods to assess the spatial features of vegetative change. Spatial autocorrelation with geostatistical methods may reveal aggregated and discrete patterns of attribute values between neighboring locations [14]. Moran’s I is a frequently used metric of spatial autocorrelation, often used to depict the spatial features of variables, and it has been used in related studies to estimate the degree of spatial agglomeration and the spatiotemporal dynamics of vegetation [15]. Akhter and Afroz [16] analyzed the spatial distribution of NDVI values in the dry season of Bangladesh and the relationship of each NDVI pixel with its neighboring grid. The results showed that the NDVI values in the northwest and southwest regions have been clustered into distinct hot and cold spots for many years.
The ecosystem of the Qinghai–Tibet Plateau is fragile and sensitive to climate change, and it is of great significance to understand the impact of climate on it [17]. Recent climate warming has significantly altered the natural environment of the plateau, even causing an anomalous rise in temperature [18]. Recent studies suggest that climate change is a major driver of the greening vegetation trend on the plateau [19]. However, most of the studies on the spatiotemporal changes in the plateau’s vegetation in the context of climate change have focused on grassland and swampy wetland ecosystems [20,21]. To gain a more comprehensive understanding of how climate change impacts the plateau’s vegetation, the variation in responses among different vegetation types requires further investigation. In addition, most research has focused on observable past changes in vegetation indices, thus neglecting the forecasting of future patterns of evolution. Studying future trends in the plateau’s vegetation cover is also critical for predicting environmental modifications in the region, developing climate change adaptation and mitigation strategies, and ensuring the region’s continued sustainable development.
Therefore, this paper investigated the spatiotemporal trends in the NDVI of the Qinghai–Tibet Plateau and how the NDVI responds to climate, using monthly NDVI data, vegetation-type data, and meteorological data representing 2001 to 2020. The spatiotemporal fluctuations in the NDVI were analyzed across different vegetation types during the Qinghai–Tibet Plateau growing season using Theil–Sen median trend analysis, spatial autocorrelation, and Hurst index values to examine the current distribution and future trends. Pearson’s correlation analysis was conducted to assess how the meteorological factors of precipitation and temperature affect the NDVI across different types of vegetation. This study offers a more complete understanding of the health of ecosystems on the Qinghai–Tibet Plateau, which will support those aiming to maintain the region’s ecological balance or to cope with regional and global climatic and ecological problems.

2. Study Site and Data Sources

2.1. Study Site Overview

The Qinghai–Tibet Plateau stands in southwestern China, ranging from 73°19′ to 104°47′ E, 26°00′ to 39°47′ N, extending from west to east from the Pamir Plateau to the Hengduan Mountains, and ranging from north to south from the Kunlun and Qilian Mountains to the southern Himalayan boundary (Figure 1A). The plateau covers a total area of 2.57 × 10⁶ km2 [22] and has an average altitude that exceeds 4.000 m, making it the highest plateau in the world and justifying its title as the “Roof of the World” [23]. The Indian summer monsoon primarily influences the plateau’s climate, with mid-latitude westerly winds and the East Asian summer monsoon translating into temperate and damp summers, frigid and dry winters, and an average annual temperature ranging from −6 to 8 °C [24]. Precipitation is low in most areas, at about 400 mm per year, though areas across the plateau differ greatly in their seasonal precipitation, with a typical decrease from southeast to northwest [25]. Because of its combination of climatic and topographic factors, the plateau has a rich variety of vegetation types (Figure 1B). The dominant vegetation type on the plateau, alpine grassland, occupies one-third of China’s total grassland area. Heading westward across the plateau, the vegetation transitions from forest to meadow to grassland and finally to desert [26]. The abundance of vegetation types and the low level of human interference in the plateau, both of which have contributed to a great variety of responses to climate change, make it an ideal site in which to study how vegetation relates to regional and global climate change [27].

2.2. Data Sources and Processing

NDVI data were acquired from the long time series of Chinese monthly-scale data made available at a spatial resolution of 1 km by the National Earth System Science Data Center (http://www.geodata.cn, accessed on 1 July 2024). This dataset is produced based on the MODIS MOD13A2 Vegetation Index data after monthly synthesis, mosaicking, and cropping operations that use the maximum value composites method. This method effectively reflects the spatiotemporal distributions of and changes in the surface vegetation cover in each region. To mirror related studies, this paper also defined the Qinghai–Tibet Plateau’s vegetative growing season as a period beginning in May and lasting until September [28]. The monthly NDVI data were cropped and averaged in ArcGIS to obtain the plateau’s NDVI data from the multi-year growing-season average.
Meteorological data were obtained from China’s month-by-month temperature and precipitation dataset made available at a resolution of 1 km by the National Tibetan Plateau Data Center (https://data.tpdc.ac.cn/, accessed on 1 July 2024), with a temperature data unit of 0.1 °C and a precipitation data unit of 0.1 mm. The data were produced by the Delta spatial downscaling program based on the global 0.5° climate dataset made available by the Climatic Research Unit gridded Time Series (CRU TS), as well as on the worldwide climate dataset made available at a high resolution by WorldClim. They were validated using data from 496 reliable, stand-alone meteorological observation sites [29,30,31,32,33,34]. The meteorological data were projected and extracted by masking separately in ArcGIS 10.7 to make the projected coordinate system and spatial resolution consistent with the NDVI data. The multi-year growing season’s accumulated precipitation and average temperature were also calculated.
Vegetation-type data were obtained from China’s vegetation-type spatial distribution dataset made available at a resolution of 1 km by the Resources and Environment Science Data Platform of the Chinese Academy of Sciences (https://www.resdc.cn/, accessed on 1 July 2024). From multiple vegetation types, four types that represented over half of the region were selected: grassland (28.35%), meadow (25.78%), alpine vegetation (11.64%), and shrub (10.26%).

3. Research Methodology

3.1. Averaging Method

The averaging process calculated the average of the NDVI data for a given period to effectively minimize or eliminate any potential impacts on vegetation growth by climatic anomalies occurring in the endpoint years of a given period. The annual NDVI values were averaged from the maximum NDVI values of each month [35]. Because the average NDVI value only represents the 5-month growing season (May–September), the annual NDVI was calculated using Equation (1):
M N D V I , i = 1 5 j = 1 5 N D V I i j
where M N D V I , i denotes the NDVI of the i –th year and N D V I i j denotes the NDVI value of the j –th month of the i –th year ( i ranges from 1 to 20, and j ranges from 5 to 9).

3.2. Theil–Sen Median Trend Analysis and Mann–Kendall Significance Testing

Theil–Sen Median trend analysis and Mann–Kendall significance testing have been commonly used in combination in the long-term evaluation of vegetation because the results offer significant benefits [36]. For one, the combination of the two methods forgoes the requirement for the data to follow a specific distribution, is strongly resistant to data errors, and, based on a robust statistical theory, makes the significance test results even more robust [37]. Theil–Sen median trend analysis is a robust nonparametric statistical method, the results of which are not affected by the missing data and outliers in the time series [38]. The multi-year growing-season NDVI was first analyzed by image-by-image metric trend analysis in MATLAB R2022b software, and then the Mann–Kendall test was performed to obtain the multi-year trend results. The formula is:
S l o p e = M e d i a n x j x i j i
where x j and x i denote, respectively, the sequence values at the j time and the i time, with 2001 ≤   i <   j ≤ 2020. The S l o p e values indicate the change rate of the time series data, with positive values representing an upward trend over time and negative values representing the opposite. Mann–Kendall testing statistically assesses the time series trend analysis results. Because the sample is not required to follow a specific distribution, and it does not respond to outliers, the Mann–Kendall is a favorable nonparametric statistical test [39]. The formula is:
S = i = 1 m 1 j = i + 1 m sgn ( x j x i )
sgn = 1 x j x i > 0 0 x j x i = 0 1 x j x i < 0
where m indicates the time series duration and s g n is the compliance function. Trend significance tests were run using the standardized normality test statistic Z:
Z = S + 1 V a r ( S ) , S > 0 0 ,   S = 0 S + 1 V a r ( S ) , S < 0
V a r ( S ) = m ( m 1 ) ( 2 m + 5 ) 18
where V a r is the variance function, S is the vegetation index time series data from 2001 to 2020, the significance level α is 0.05, and the critical value is ±1.96. When the absolute value of Z tops 1.65, 1.96, or 2.58, the trend is significant at a confidence level of 90%, 95%, or 99%, respectively [40].

3.3. Spatial Autocorrelation Analysis

At present, research on the spatial heterogeneity of the NDVI and the potential dynamics and influence of its spatial autocorrelation on the Qinghai–Tibet Plateau is still insufficient. Therefore, to deeply analyze the spatial distribution characteristics of the NDVI, we introduced spatial autocorrelation analysis as a tool to quantify the spatial interdependence and difference of the NDVI and then explored the convergence and dispersion of NDVI data between adjacent spatial locations, which is called the “second-order effect” [41]. From a statistical perspective, spatial autocorrelation examines the consistency of spatial features. It effectively reflects the extent of relatedness between numerical values or spatial features within a regional or in neighboring units [42]. Spatial autocorrelation is generally split into two scales: global and local. Moran’s I was used to calculate the degree of global spatial autocorrelation throughout the entire study site. The formula is:
G l o b a l M o r a n s I = i = 1 m j = 1 m W ij ( x i x ¯ ) ( x j x ¯ ) [ 1 m i = 1 m ( x i x ¯ ) 2 ] i = 1 m j = 1 m W ij
where W i j is the spatial weight matrix; m is the total count of image elements in the region; x i and x j are the NDVI values for regions i and j , respectively; and x ¯ is the average NDVI value of all image elements. G l o b a l M o r a n s I values are in the range [−1, 1]. A higher absolute value signifies greater spatial correlation or a larger spatial difference. In addition, the significance level was assessed using the Z score [43], which is calculated as:
Z ( I ) = I E ( I ) V a r ( I ) E ( I ) = 1 ( m 1 ) V a r ( I ) = E ( I 2 ) E ( I ) 2
where Z ( I ) is used to measure the significance of Moran’s I, E ( I ) is the mathematical expectation of Moran’s I, and V a r ( I ) is the variance in Moran’s I. Further, local Moran’s I was used as a spatially correlated local index for local spatial autocorrelation analysis to deeply examine NDVI spatial variability and dependence among regions and also to reveal the significant features of local clustering and discrete effects [44].
L o c a l M o r a n s I = i = 1 m j = 1 m W ij ( x i x ¯ ) ( x j x ¯ ) [ 1 m i = 1 m ( x i x ¯ ) 2 ] 2
where l o c a l M o r a n s I is the local autocorrelation index. Based on these results, the NDVI values were assigned into one of five clustering types; low–low clustering, high–high clustering, low–high clustering, high–low clustering, and insignificant clustering.

3.4. Hurst Index

The Hurst index enumerates the continuation of linear time series trends that effectively perform short-term predictions after training with data that cover a long time frame [45]. Using the R/S analysis method to estimate the Hurst index shows significant effectiveness in predicting the long-term trend of time series, and its application scope spans multiple disciplines, such as hydrology, geology, and ecology [46]. In addition, R/S analysis is used for the trend analysis of the inversion index, especially in the analysis of the time series consistency of vegetation cover changes, such as the NDVI, and its effectiveness has been fully verified [47,48]. The value H of the Hurst index is in the range [0, 1]. When 0 ≤ H < 0.5, the NDVI time series does not continue, and the trend expected in the future is the opposite of what it was in the past. When H = 0.5, the NDVI time series is independent, and the future trend does not relate to what it was in the past. When 0.5 < H < 1, the NDVI time series continues, and the trend expected in the future mirrors what it was in the past [49]. A value of H closer to 1 indicates that the future trend will mirror the current trend to a greater degree. Based on the direction and intensity of persistence, the Hurst index can be classified into the following four categories [50]: strong anti-sustainability (0 < H < 0.35), weak anti-sustainability (0.35 < H < 0.5), weak sustainability (0.5 < H < 0.65), and strong sustainability (0.65 < H < 1).

3.5. Pearson Correlation Analysis

Pearson correlation analysis is a common statistical method that has been widely used to determine the correlation between vegetation and meteorological factors [51]. The code was generated in MATLAB R2022b software to analyze the pixel-by-pixel correlation between NDVI temperature and NDVI precipitation. The correlation between meteorological factors and NDVIs of various vegetation types in the plateau during the growing season was calculated using the Pearson correlation coefficient with the following formula:
R = i = 1 m ( x i x ¯ ) ( y i x ¯ ) i = 1 m ( x i x ¯ ) 2 i = 1 m ( y i x ¯ ) 2
where R is the correlation coefficient; m is the duration of the study in number of years, i.e., 20 years; x i is the NDVI value in the i th year; y i is the value of the climate factor in the i th year; and x ¯ and y ¯ are the average values of the variables. The value of R is in the range [−1, 1]; R > 0 denotes a positive correlation, and R < 0 denotes a negative correlation; when R (absolute value) approaches 1, the correlation strengthens between the variables [52].

4. Results and Analysis

4.1. Characteristics of Spatiotemporal Changes in the NDVI of the Qinghai–Tibet Plateau during the Growing Season in the Last 20 Years

The average NDVI of the Qinghai–Tibet Plateau was low during the multi-year growing season, thus indicating that the vegetation cover is poor. From 2001 to 2020, the growing-season NDVI on the plateau fluctuated and trended upward. The average values were distributed between 0.26 and 0.30, with a linear growth rate of 0.0012/a (Figure 2). The maximum value (0.292) was achieved in 2019. The minimum value (0.262) was recorded in 2002, and the multi-year average NDVI was 0.28. Over time, the variation in the NDVI can be described as y = 0.0012x − 2.0740 (R2 = 0.7122, p < 0.05), with a standard deviation of 0.0082. The fluctuation in the growing-season NDVI was relatively small over the 20 years.
The plateau’s vegetation coverage showed significant spatial heterogeneity during the growing season. The spatial distribution of the plateau’s average NDVI values shifted from northwest to southeast from 2001 to 2020 (Figure 3A). The low NDVI average values in most areas of Tibet, western and northern Qinghai, southern Xinjiang, and some areas of Gansu reflect the relatively sparse vegetation cover of these areas. In contrast, the high NDVI values were mostly located in eastern Sichuan. The rest were distributed across Yunnan, Qinghai, and southeastern Tibet, as well as in Gansu, all of which had relatively high vegetation coverage.
Theil–Sen median trend analysis and Mann–Kendall significance testing were performed in combination to evaluate the multi-year growing-season NDVI values image by image and to further explore the plateau’s spatial pattern of NDVI evolution. The NDVI change trends were categorized into five grades based on the slope and the test statistic Z value. These were severe degradation (S < 0.0005, |Z| ≥ 1.96), slight degradation (S < 0.0005,|Z| ≤ 1.96), stable (−0.0005 ≤ S ≤ 0.000 5, |Z| ≤ 1.96), slight improvement (S ≥ 0.0005, |Z| ≤ 1.96), and significant improvement (S ≥ 0.0005, |Z| ≥ 1.96) [53]. The plateau vegetation largely experienced improvement in the growing season, followed by stability (Figure 3B), with 65.68% and 25.49% of the area dominated by these grades, respectively. Only 8.83% of the area experienced degradation. The areas categorized as having experienced severe degradation, slight degradation, slight improvement, and significant improvement were 0.99%, 7.84%, 29.61%, and 36.07%, respectively, with significant improvement having the largest area of the five categories. The areas experiencing vegetation degradation in the growing season were mainly spread across central Tibet, southeastern Tibet, and the southeastern edge of the plateau, i.e., most of the areas in the bottom of the valley in southern Tibet, as well as in localized areas of Sichuan, Yunnan, and Qinghai. The areas experiencing vegetation cover improvement in the growing season were mainly spread across the western, central, northern, and eastern parts of the plateau, i.e., most of the northern part of the plateau, the Hengduan Mountains, and the Qilian Mountains, with the northern part of the plateau following the most significant upward trend.

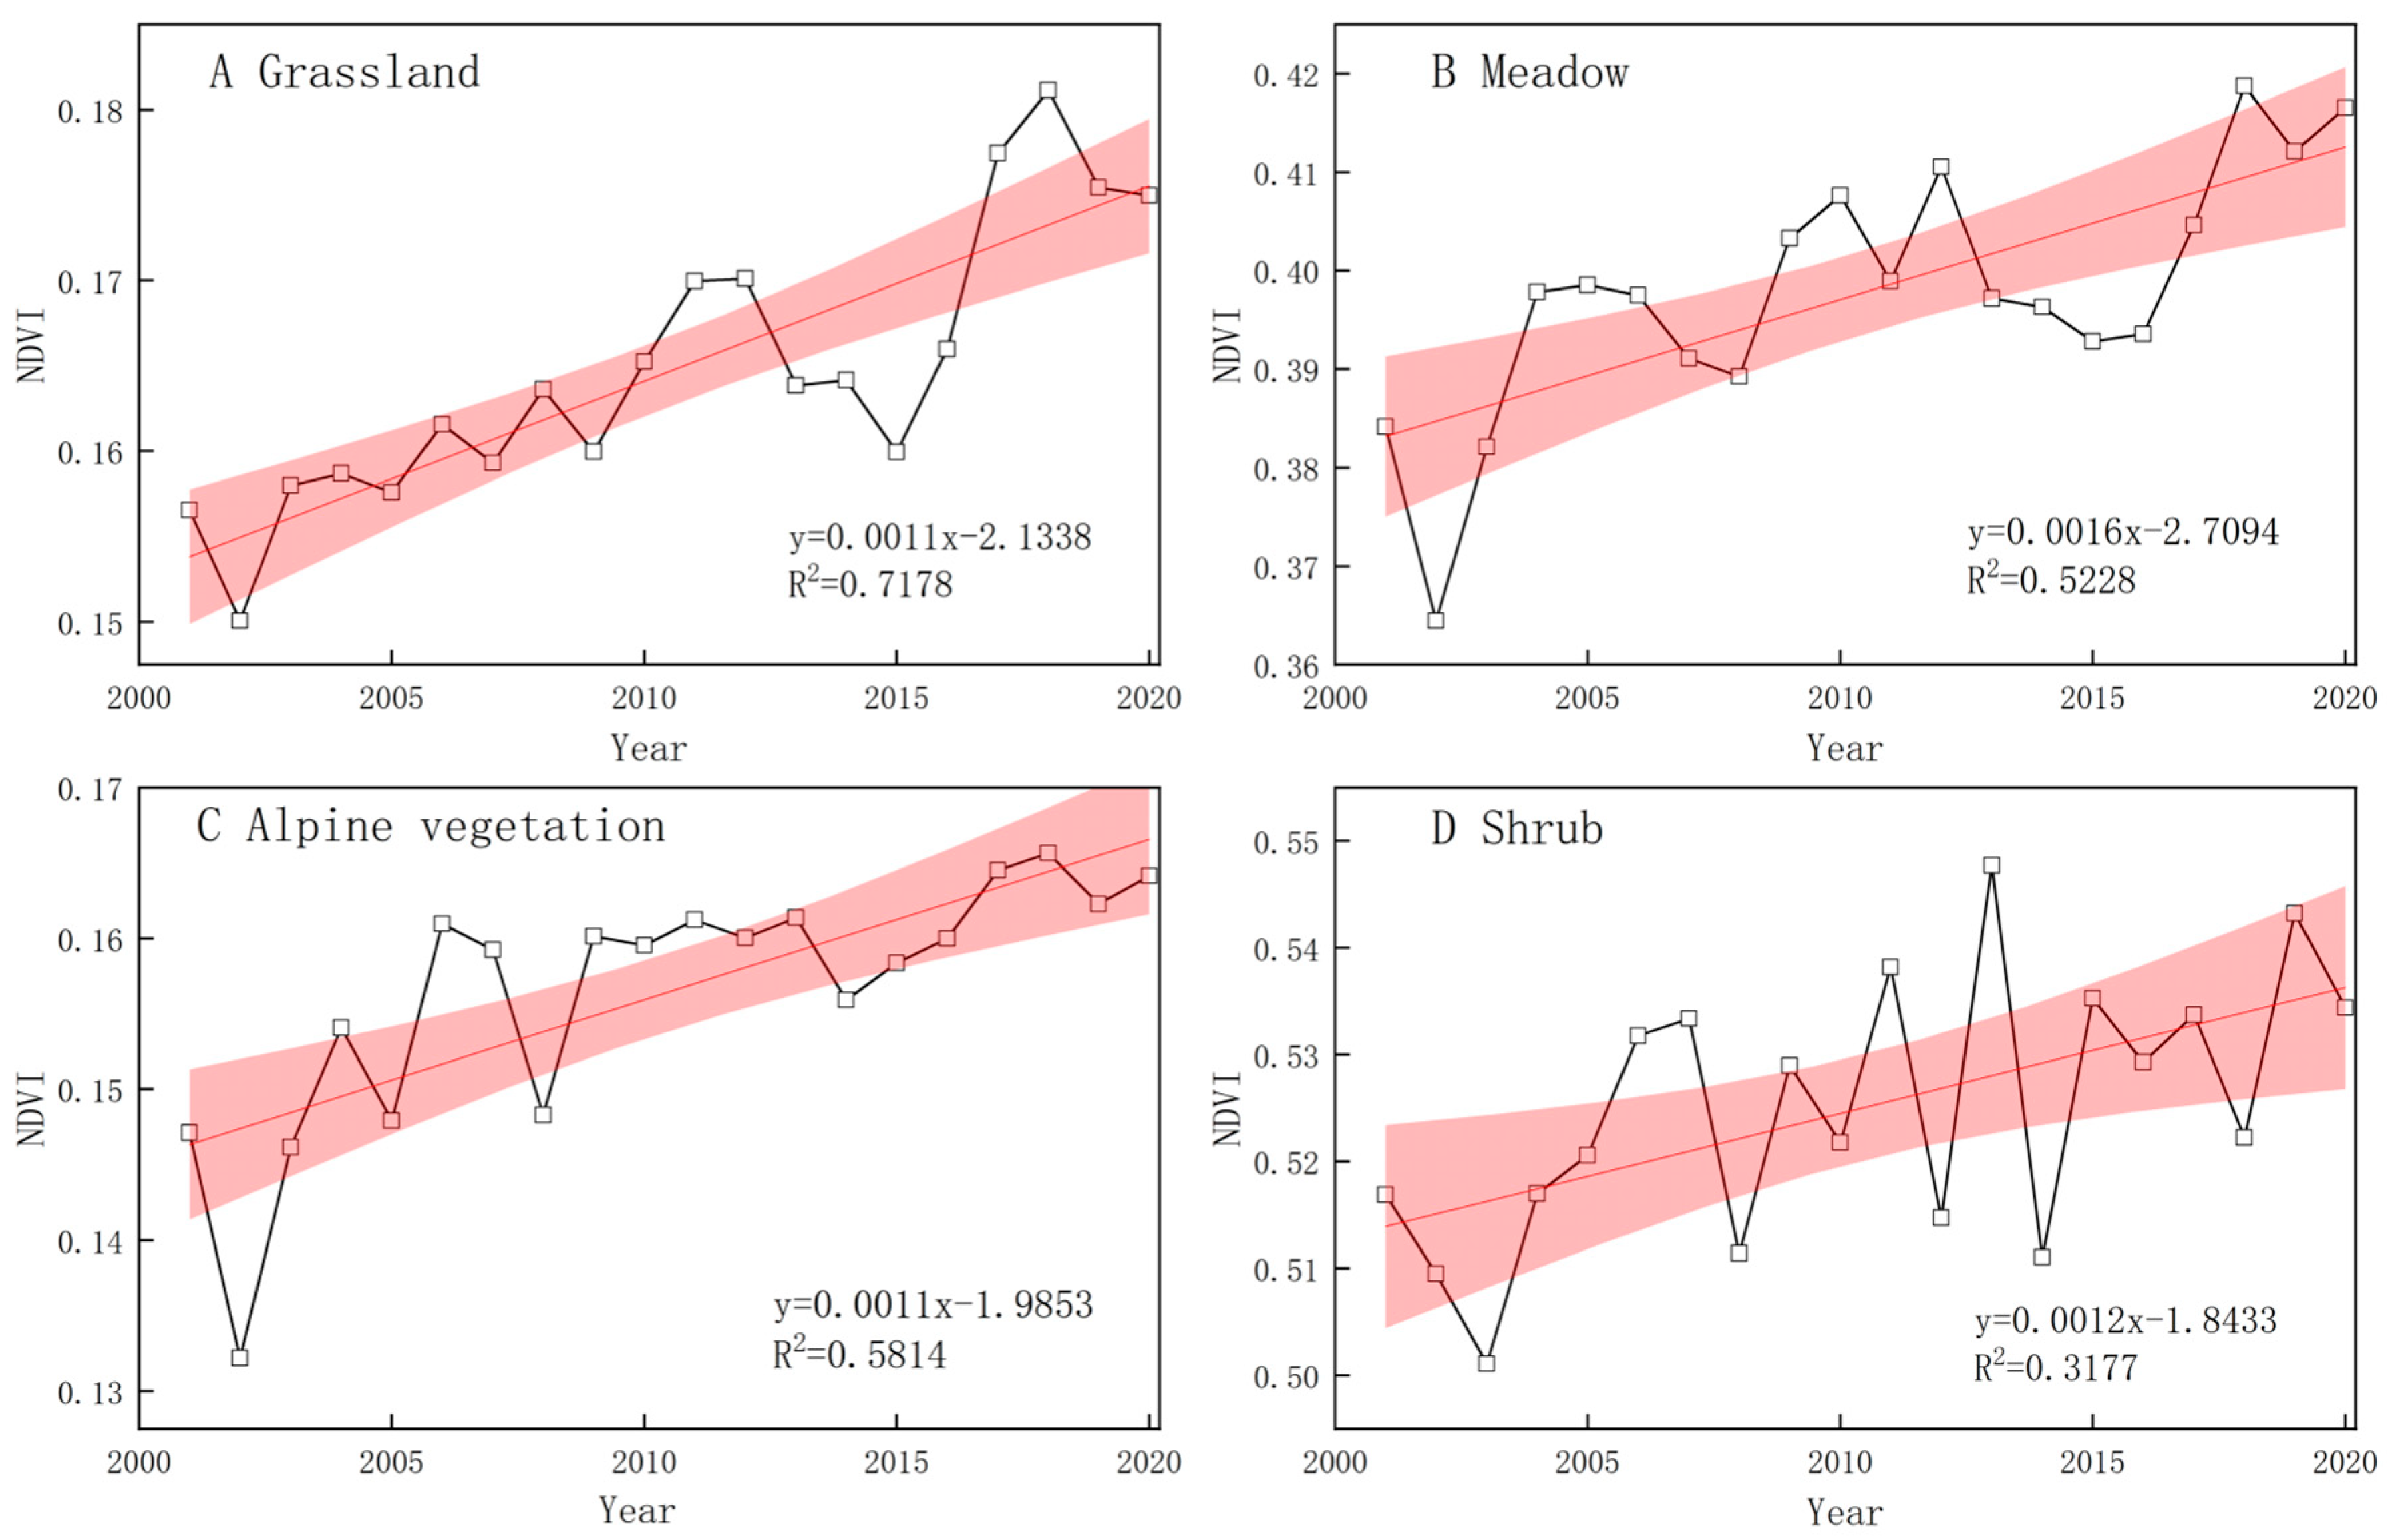
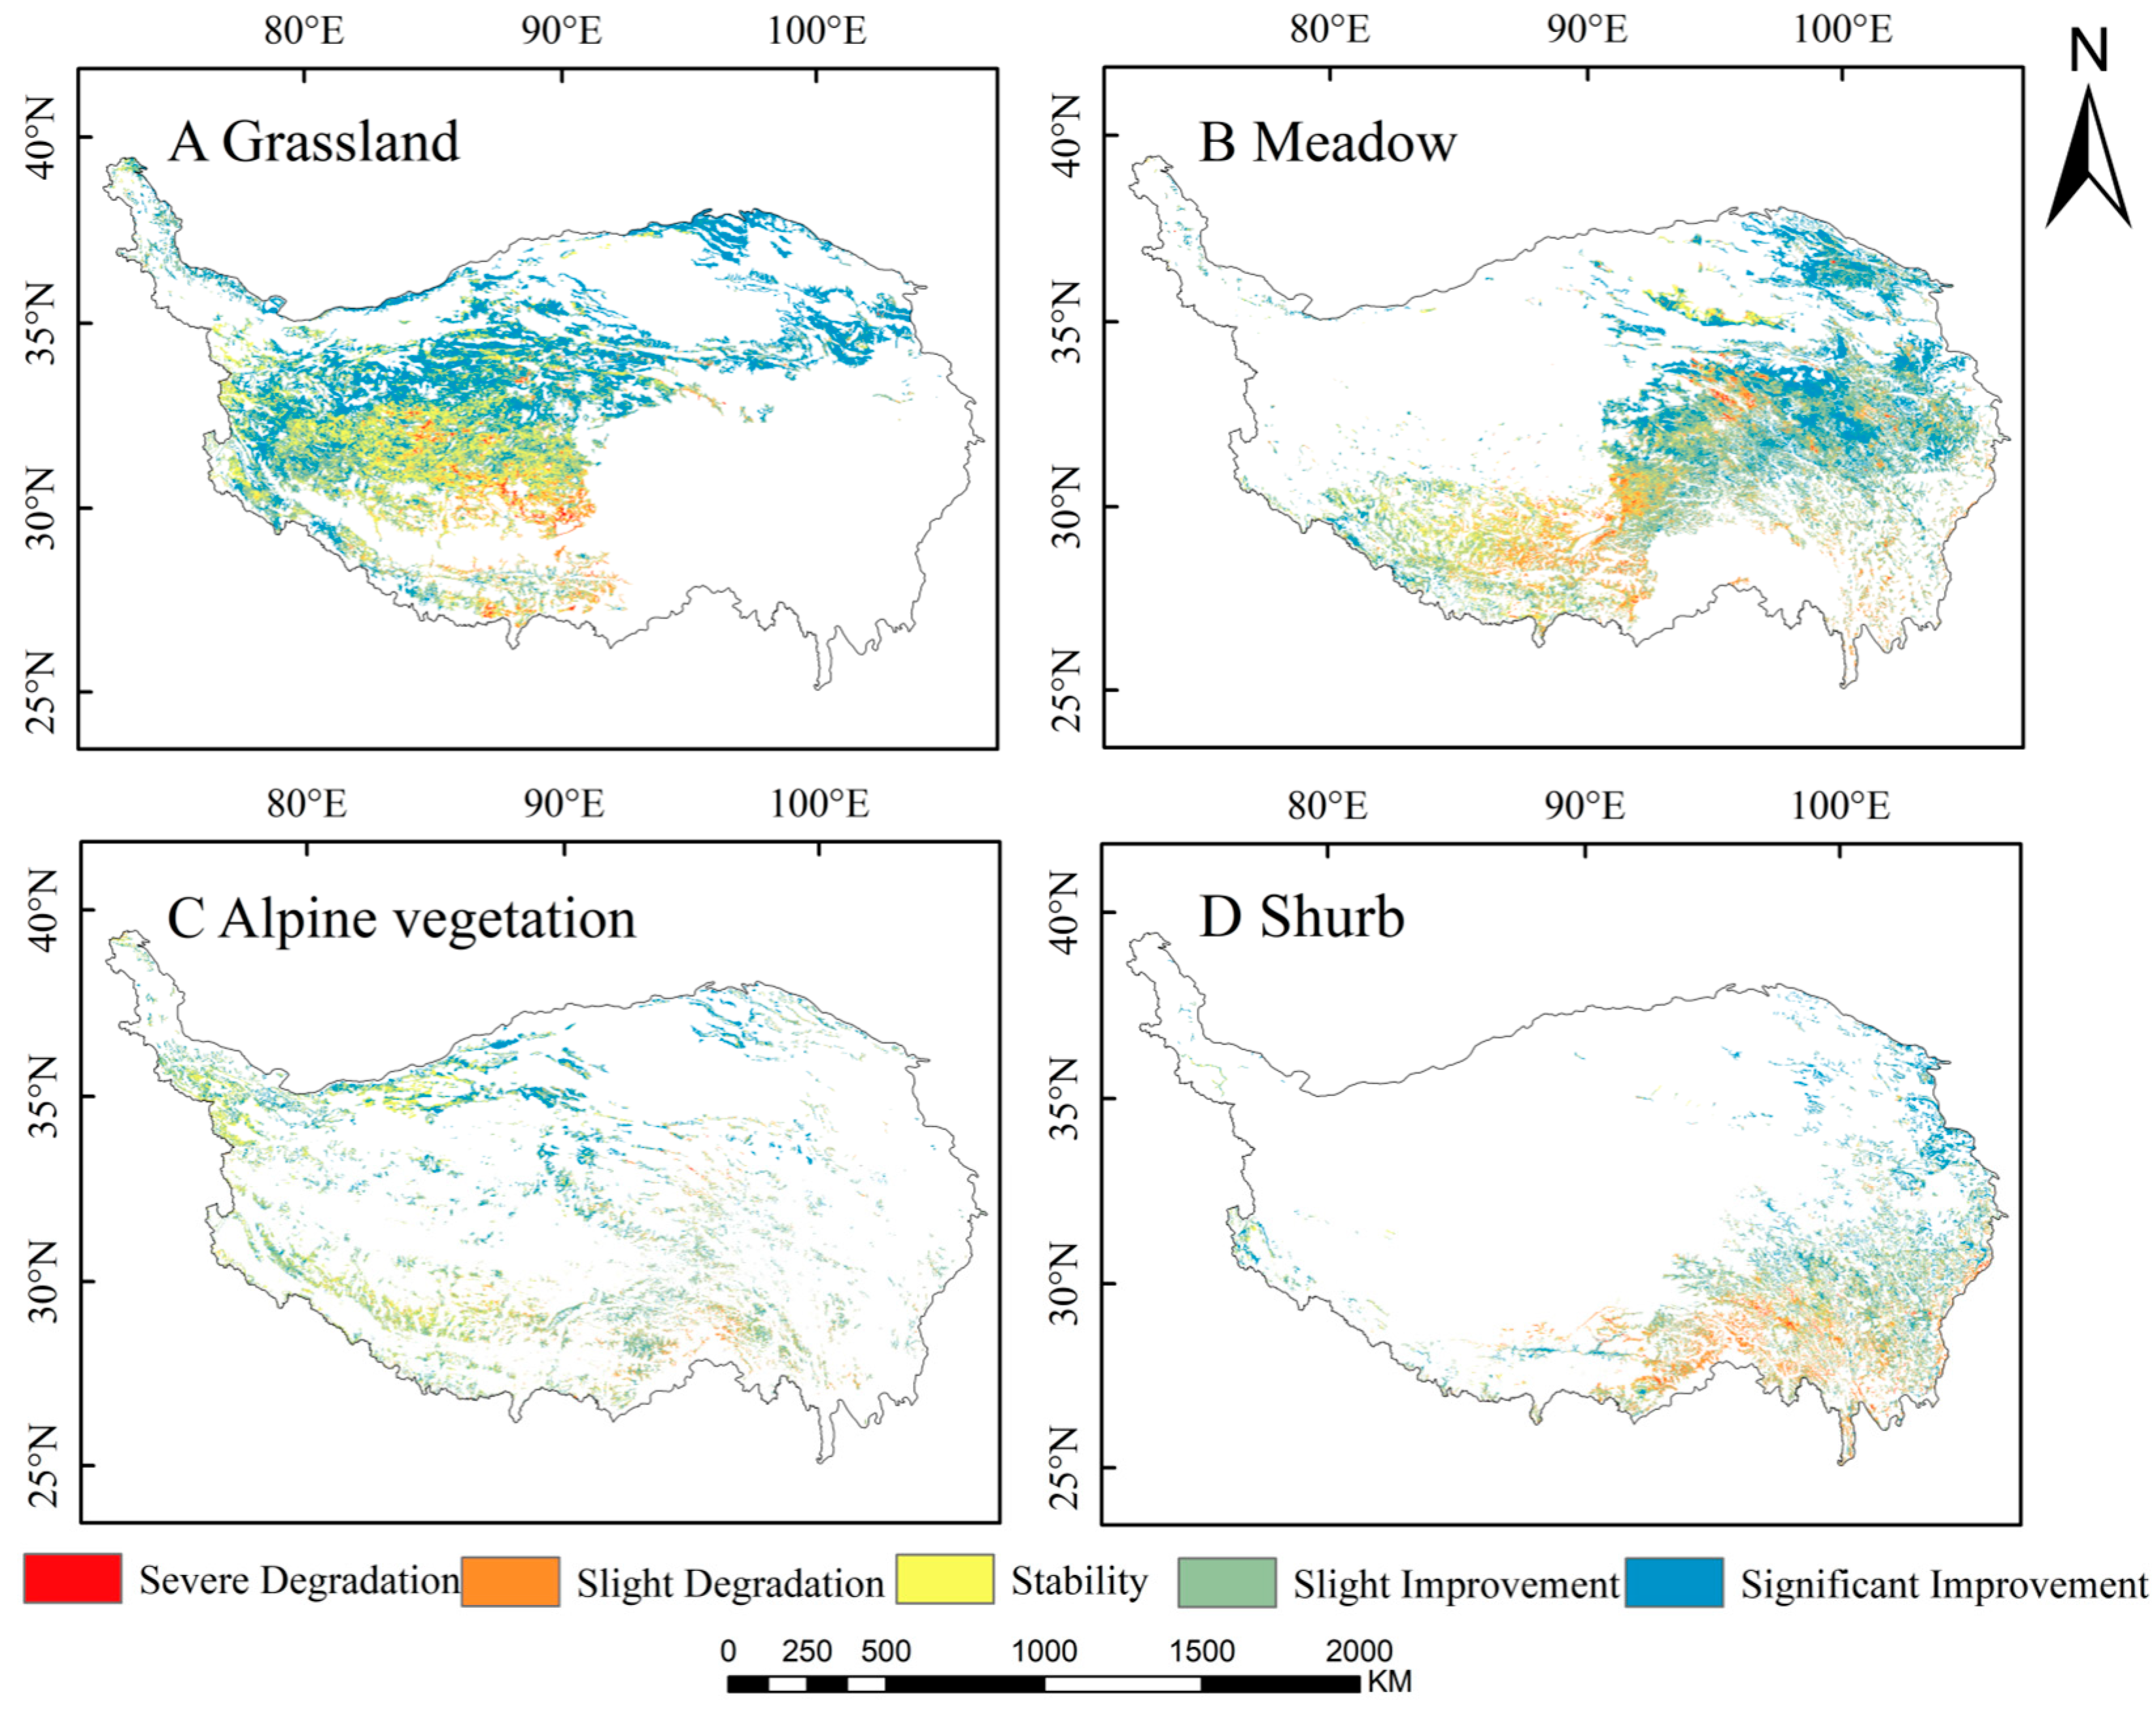
4.2. Characteristics of Spatiotemporal Changes in the NDVI for Various Vegetation Types during the Multi-Year Growing Season on the Qinghai–Tibet Plateau

To more deeply interpret the change characteristics of the regional vegetative ecosystems, four major vegetation types were analyzed in detail. The NDVI of the Qinghai–Tibet Plateau trended upward overall during the growing season, with spatiotemporal characteristics differing by vegetation type. In grassland vegetation on the plateau, the NDVI varied within the range of 0.15–0.18 and fluctuated upward, with a linear growth rate of 0.0011/a, a minimum value of 0.150 recorded in 2002, and a maximum value of 0.181 recorded in 2018 (Figure 4A). In meadows (Figure 4B), the NDVI varied within the range of 0.36–0.42 and displayed a clear upward trend, with a linear growth rate of 0.0016/a, the minimum value of 0.364477 recorded in 2002, and the maximum value of 0.41874 recorded in 2018. In alpine vegetation (Figure 4C), the NDVI varied within the range of 0.13–0.17 and followed a significant upward trend, growing at a linear rate of 0.0011/a, and a minimum of 0.132 in 2002 and a maximum of 0.165 in 2018 were recorded. In shrub vegetation (Figure 4D), the NDVI varied within the range of 0.50–0.55 and showed large fluctuations trending upward, with a linear growth rate of 0.0012/a, the highest recorded value of 0.547 in 2013, and the lowest recorded value of 0.501 in 2003. In summary, the NDVI values of the different vegetation types displayed significant hierarchical differences, with shrubs having the highest NDVI values, followed by meadows, then grassland, and finally alpine vegetation with the lowest NDVI values.
Grasslands comprised more area than any other vegetation type, and they were primarily found in the central, western, and northern parts of the Qinghai–Tibet Plateau. Next came meadows, which were primarily found in the central, southwestern, and most of the eastern plateau areas. The third was alpine vegetation, which was more discretely and widely distributed throughout the region. Finally, shrub vegetation was the smallest in size and was concentrated in the eastern and southeastern areas. In all four vegetation types, the largest proportion of area experienced improvement (Table 1, Figure 5). The type of vegetation with the greatest improved area was meadow, and the type of vegetation with the greatest degraded area was shrub. The stable areas of grassland, meadows, and alpine vegetation, those that were relatively unchanged, were larger than the degraded areas, which were 29.78%, 18.15%, and 28.41%, respectively. In grassland, the improved area covered 65.22%, with 46.46% of the overall area showing significant improvement, which was the largest area for a grade category and was mainly distributed along the Kunlun Mountain Range. The degraded area accounted for only 5% of the grassland and was primarily observed in central Tibet. Meanwhile, 72.13% of the meadow area showed improvement, but the slight improvement category comprised the largest area, 41.04%, and was primarily found on the Qinghai Plateau and along the Qilian Mountains. In contrast, the degraded areas comprised 9.73% of the meadows and were primarily found in southern Nagqu City, northern Shigatse City, and the Lhasa area. The alpine area experiencing improvement accounted for 65.84%, with the slight improvement grade covering the largest area, 36.33%, which was primarily found in the central plateau area. In contrast, the degraded area accounted for 5.76% and had a fragmented distribution. In shrub vegetation, the area experiencing improvement in the NDVI covered 66.97%, with slight improvement accounting for 43.85% of the entire area and being concentrated mostly in the southwestern plateau area along the Hengduan Mountains. The degraded area covered 18.17% and was mainly found in localized areas of Linzhi and Chamdo.

4.3. Spatial Autocorrelation Characteristics of the NDVI during the Growing Season on the Qinghai–Tibet Plateau

4.3.1. Global Spatial Autocorrelation of the NDVI

Spatial autocorrelation testing was carried out during the 2001–2020 growing seasons on the Qinghai–Tibet Plateau. Four representative years were chosen for the global spatial autocorrelation analysis: 2005, 2010, 2015, and 2020. First, the mean NDVI of the four years was calculated by using the fishing net tool in ArcGIS 10.7, and then, the spatial data were imported into GeoDa software 1.21, and the spatial weight matrix was created to define the adjacency relationship. Next, the global Moran’s I was calculated by the Univariate Moran’s I tool to evaluate the spatial autocorrelation and its statistical significance. For many years, the global Moran’s I of the NDVI on the plateau was greater than 0.935 (Figure 6), had a high Z-score, and passed the significance test, thus demonstrating a significant positive spatial autocorrelation (p < 0.01). This indicated that the plateau’s vegetation cover was in a highly aggregated state during the growing season. The degree of spatial agglomeration of the NDVI in the plateau’s growing season showed an initially increasing trend that later declined. In contrast, from 2000 to 2015, Moran’s I gradually increased. The vegetation cover was most spatially correlated in 2015, with a Moran’s I of 0.941 (Z = 302.55, p < 0.01), and then, it slightly decreased to 0.937 (Z = 298.99, p < 0.01) in 2020. The distribution of the random points was highly similar in the four years, and they were mainly found in quadrants 1 and 3, with a smaller portion in quadrants 2 and 4. The spatial distribution of the multi-year growing-season NDVI had a strong positive correlation and agglomeration effect.

4.3.2. Localized Spatial Autocorrelation of the NDVI

A local spatial autocorrelation analysis was carried out in ArcGIS 10.7 software, and the local Moran’s I and visual analysis were obtained by using Anselin Local Moran’s I tool. Further, the localized spatial autocorrelation testing of the NDVI on the plateau revealed local spatial differences, though the spatial agglomeration patterns were highly similar for the four years (Figure 7). Over the years, the localized spatial autocorrelation types of the NDVI on the plateau were characterized mainly by low–low and high–high clustering. The low–low clustering was primarily found in the western, northern, and most of the central high-elevation areas, which was consistent with the distribution of low NDVI values. This area had a higher elevation, making it less appropriate for vegetative growth, and had mainly grassland and alpine vegetation. The vegetation cover was relatively low, as was the overall degree of agglomeration. The high–high clustering was primarily found in the eastern and southeastern low-elevation plateau areas. This was similar to the distribution of the high NDVI values in Figure 3A. The area’s vegetation was mainly shrubs and meadows, with high cover and an obvious agglomeration effect. The rest of the area was non-significant, located between the low–low and the high–high clustering areas. The distribution of extreme points and spatial anomalies (low–high anomalies and high–low anomalies) of the NDVI was relatively small on the plateau, with the four years of anomalies accounting for less than 1% of the total. Although the local autocorrelation distributions were similar between the four years, a small increase was observed in the area of the high–high clustering throughout the study period, which corresponds to the region with increasing NDVI values in Figure 3B. This implies that the vegetation cover in this part of the plateau has improved over time.

4.4. Future Trends in Vegetative Coverage on the Qinghai–Tibet Plateau

In order to understand the continuity of the future trend, the Hurst index of the NDVI of the Tibetan Plateau during the growing season was calculated by Matlab software using the R/S analysis method on an image-by-image basis. The Hurst values throughout the entire study area varied within the range of 0.07 to 0.94 during the 2001–2020 growing seasons (Figure 8A). The Hurst index average was 0.46, with values below 0.5 found in 60.52% of the study area and values above 0.5 found in the other 33.03%. This suggests that the current trends for the growing-season NDVI of the Qinghai–Tibet Plateau are unlikely to continue. In fact, the trend in NDVI changes in most areas in the future may be opposite to that in the past. Higher Hurst index values were primarily found in the Qaidam Basin and the Kunlun Mountains in the northern part of the plateau, which are less affected by monsoon and human activities. With a relatively stable ecosystem, the expected changes in vegetation have a stronger chance of persisting here. Lower Hurst index values were primarily observed in areas such as southern and western Tibet, Sichuan, and Yunnan. The southern and western parts of Tibet have higher altitudes and harsh climatic conditions. The Sichuan and Yunnan regions are characterized by complex topographical conditions, strong monsoon influences, and frequent human activities. This part of the ecosystem is fragile, so the sustainability of vegetation change is poorer.
To further disclose the future pattern of vegetation change on the Qinghai–Tibet Plateau, the Theil–Sen median trend analysis was overlaid on the geographic range of the Hurst index results (Figure 8B) [54]. Of the entire area of the Qinghai–Tibet Plateau, 26.96% was characterized by future NDVI trend improvement (Table 2), which is mainly distributed around the Tarim Basin, the southern part of the plateau, and a small part of northern Tibet. The areas of continuous improvement accounted for 20.41%, and the areas of degradation improvement accounted for 6.55%. Among them, the area of improvement and weak sustainability accounted for the largest proportion, 18.91%, concentrated around the Tarim Basin. The future NDVI degradation trend area of the Tibetan Plateau accounted for 44.05% of the total area, which is relatively widely distributed. The area of continuous degradation accounted for 2.52%, and the area of improvement to degradation accounted for 41.52%. Of these, the proportion of areas with weak improvement and anti-sustainability was the largest in all regions, at 34.2%, concentrated in the eastern area of the plateau. In addition, 28.99% of the vegetation areas will maintain a stable trend in the future, and these areas are mainly located in the Tarim Basin, Xinjiang, and the central and western parts of Tibet. On the whole, the area of vegetation degradation in the future is larger than that of improvement and stability, indicating that there is a risk of vegetation degradation in the growing season of the Qinghai–Tibet Plateau in the future, and this risk is most obvious in the eastern part of the plateau.

4.5. Response Analysis of Vegetation and Meteorological Factors

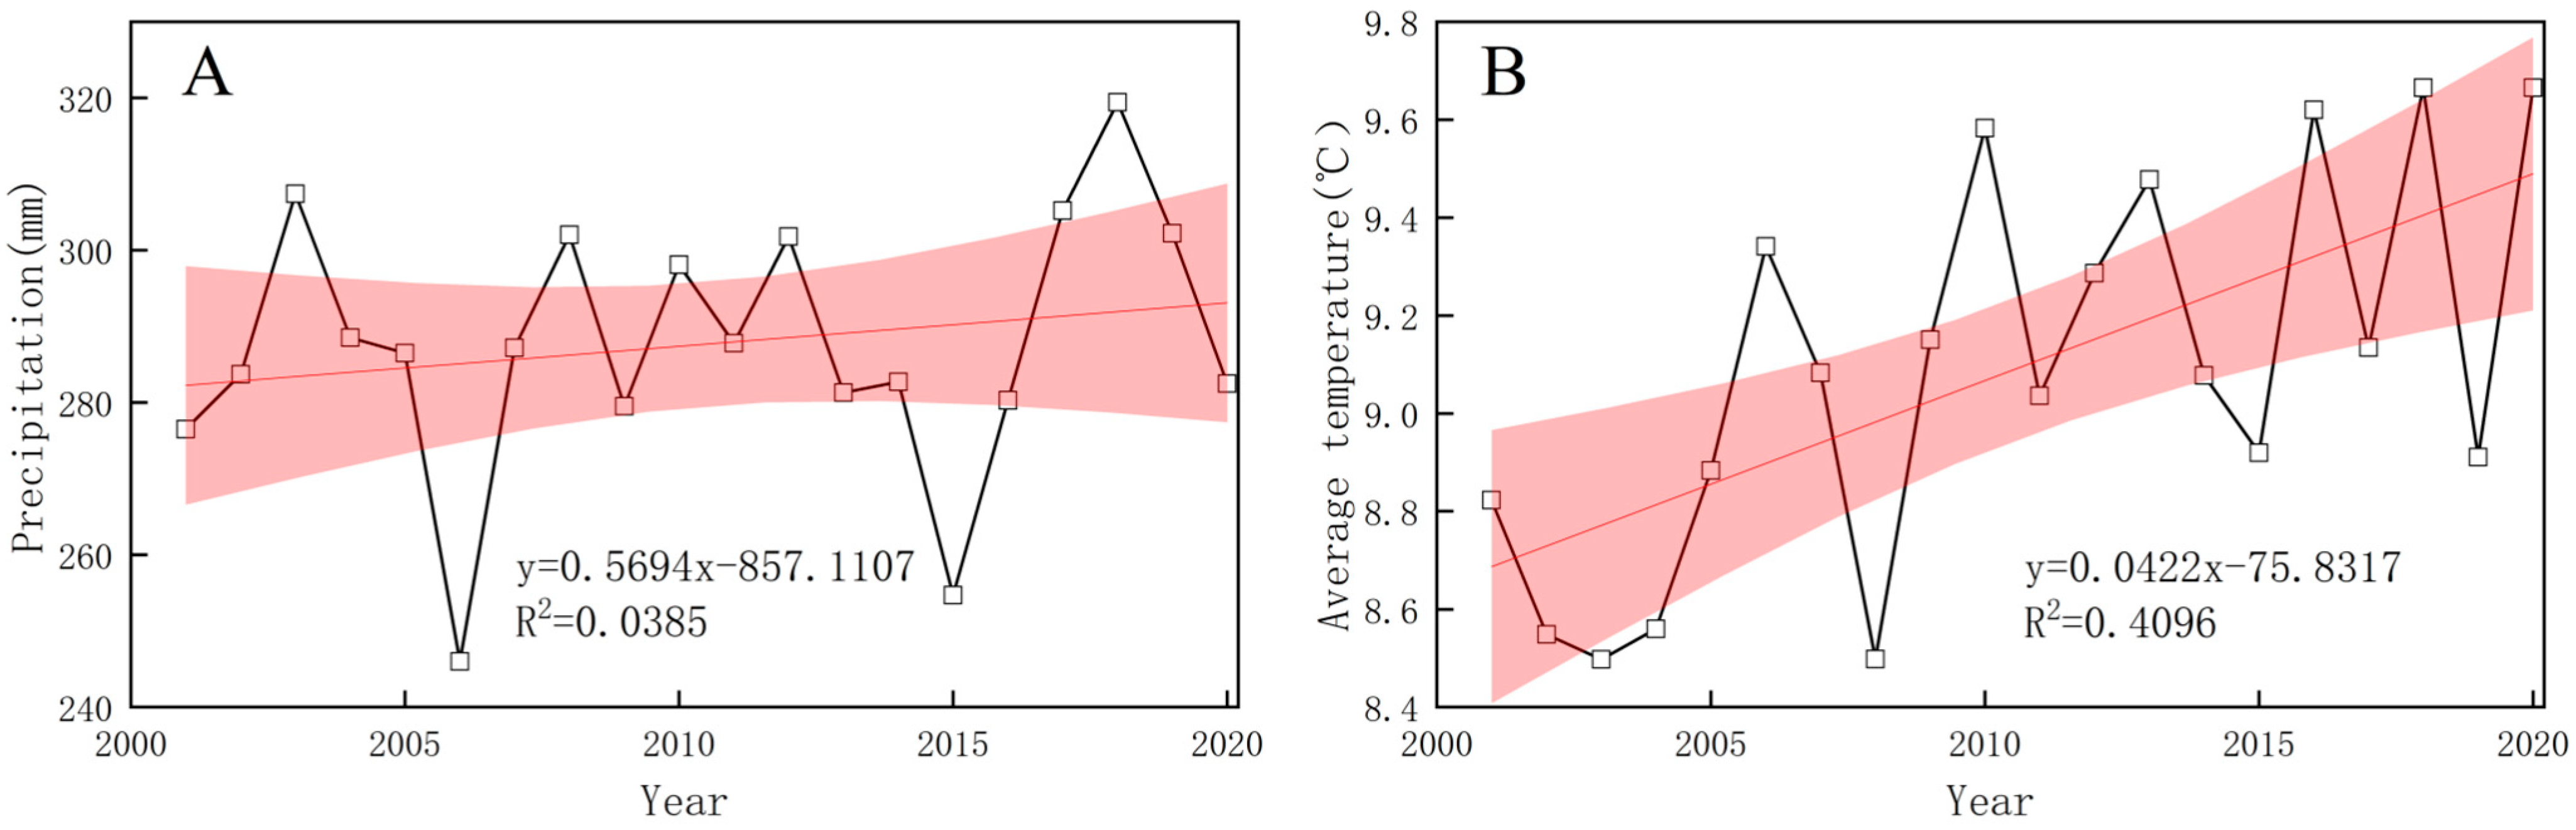
4.5.1. Variation in Climate Factors during the Qinghai–Tibet Plateau Growing Season

Overall, the annual growing-season precipitation on the Qinghai–Tibet Plateau increased through the years (Figure 9A), with large inter-annual fluctuation varying between 240 and 320 mm. A linear trend was not obvious, though there was a linear growth rate of 0.5694/a, a maximum value of 319.4 mm in 2018, a minimum value of 246.04 mm in 2006, and an average precipitation of 287.67 mm. The average growing-season temperature showed a fluctuating upward trend over the years (Figure 9B), with a large fluctuation ranging between 8.4 and 9.8 °C. The linear growth rate was 0.0422/a, with the maximum (9.67 °C) in 2020, the minimum (8.49 °C) in 2003, and a multi-year average of 9.09 °C. Altogether, these reflect a trend of global warming.

4.5.2. Response of the NDVI to Climate Change

Correlation analysis and significance tests were conducted for the NDVIs of different vegetation types with precipitation and average temperature to investigate how the various vegetation types on the plateau respond to climate change during the growing season. Barring the negative correlation between alpine vegetation and precipitation, the NDVIs of the other vegetation types correlated positively with both precipitation and average temperature (Table 3). In particular, there was a notable correlation between the grassland NDVI and precipitation (p < 0.05) and significant correlations between the meadow and shrub NDVIs and precipitation (p < 0.01). The correlations between grassland, meadow, and shrub NDVIs and average temperature were significant (p < 0.01), while there was slightly less significant correlation between alpine vegetation and average temperature (p < 0.05).
The NDVI exhibited varied responses to precipitation and average temperature across different regions for various vegetation types. (Figure 10). Correlations between the grassland NDVI and precipitation ranged from −0.869 to 0.929. The south and east of the grassland distribution were the main regions with strong positive correlations. In contrast, negative correlations were distributed to the north, i.e., at the confluence of the three provinces of Tibet, Xinjiang, and Qinghai and some areas of Tibet. The meadow NDVI and precipitation had correlations ranging from −0.861 to 0.939. Strong positive correlations were primarily found in the northern meadow distribution (i.e., most of the areas in Qinghai and the southern area of Nagqu), while negative correlations were distributed in the south and southwestern areas. Correlations between the alpine NDVI and precipitation varied from −0.849 to 0.872 and had a relatively sporadic distribution. Strong positive correlations were primarily concentrated in the eastern and northeastern regions of the alpine vegetation distribution (i.e., some areas of Qinghai and Gansu), while negative correlations were found in most of the rest of the area. Correlations between the shrub NDVI and precipitation ranged from −0.887 to 0.866. Strong positive correlations were primarily found among the northern shrub distribution, while negative correlations were distributed to the south. The range of correlations between the grassland NDVI and temperature was −0.892 to 0.906. Strong positive correlations were primarily found in the northern grassland area, while negative correlations were distributed to the south (central and southern Tibet). Correlations between the meadow NDVI and temperature varied from −0.852 to 0.932, with negative correlations found in the southwestern area of the meadow distribution. Conversely, a strong positive correlation was observed throughout most of the rest of the distribution area. Correlations between the alpine NDVI and temperature varied from −0.736 to 0.867, with most areas of alpine distribution having a positive correlation and a few marginal areas having a negative correlation. The correlation between the shrub NDVI and temperature varied from −0.891 to 0.916. Areas with negative correlations were found in the eastern and southern margins of the distribution area, while positive correlations were found in most of the rest of the area.

5. Discussion and Conclusions

5.1. Discussion

5.1.1. Characteristics of Spatiotemporal Changes in the Vegetation Cover during the Growing Season and Future Trends

(1)
Here, we analyzed the NDVI characteristics during the 2001–2020 growing seasons on the Qinghai–Tibet Plateau at different spatial and temporal scales. Overall, the vegetation tended to increase during the growing season. This agreed with the findings of Liu et al. [55], which indicated that the Qinghai–Tibet Plateau vegetation has improved over the course of the past two decades during the growing season. With the global warming in recent years, the warming and humidification of the Qinghai–Tibet Plateau have become more pronounced [56]. Climate change, especially via improved hydrothermal conditions, is the main driver of vegetative growth. The spatiotemporal characteristics of the NDVI vary during the growing season among different vegetation types. Improvement trends are dominant in all four vegetation types, with meadows accounting for the greatest percentage of the growth rate and the greatest area experiencing improvement, but significant improvement trends were also observed in grassland, alpine, and shrub areas. Duan et al. [57] studied variation in alpine meadows and grasslands, as well as in the complete vegetation on the Qinghai–Tibet Plateau. Their findings demonstrated that the growing-season NDVI grows significantly for all three vegetation types, with alpine meadow and alpine grassland areas dominated by trends of improvement. Their findings mirror the outcome of this study. Studies have shown that the increasing CO2 concentration increases the photosynthetic rate of vegetation (i.e., CO2 fertilization effect) and also increases the ability of terrestrial ecosystems to absorb atmospheric CO2 (i.e., carbon sink capacity) [58]. Consequently, the increase in the atmospheric carbon dioxide concentration mainly leads to an increase in the vegetation coverage in alpine meadows and temperate grasslands [59]. More importantly, after 2000, the state has made major deployments to protect the ecological environment of the Qinghai-–Tibetan Plateau: the construction of an ecological security barrier has been approved in Tibet, and nature reserves have been established in the Sanjiangyuan region, Qilian Mountains, and Hengduan Mountains.
(2)
Here, the spatial autocorrelation of the NDVI was analyzed during the plateau’s growing season to foster a deep understanding of the plateau’s agglomeration or discrete pattern of NDVI distribution, as well as of the spatiotemporal characteristics of the evolution of vegetative coverage. In all four representative years, the global Moran’s I calculated exceeded 0.9, and the vegetation cover was in a high agglomeration state. The global Moran’s I values increased and then decreased throughout our study. The effects of climatic change and human interference may have lowered the degree of spatial agglomeration in a small area of the region, but the fluctuation was small. This indicates that the NDVI spatial distribution on the plateau is relatively stable overall. The local spatial autocorrelation analysis further explored the spatial agglomeration patterns and characteristics of the NDVI. The resulting main agglomeration patterns were low–low and high–high clustering. This is similar to the spatial aggregation pattern observed by Zhang et al. in grassland NPP on the Qinghai–Tibet Plateau [60]. Both studies observed low–low clustering to the northwest and high–high clustering to the southeast. Moreover, it was found that the spatial distribution of these two agglomeration patterns corresponds to the distribution areas of high and low NDVI values, thereby indicating a close correlation between local spatial agglomeration and the vegetation cover. The low–low clustering in the northwest of the Qinghai–Tibet Plateau indicates that the NDVI value in this area is generally low and relatively concentrated. The region is located in arid and semi-arid areas, with grassland as the main vegetation type, with a small desert area. The high–high clustering phenomenon in the southeast of the Qinghai–Tibet Plateau indicates that the NDVI values in this area are generally high and relatively concentrated. The region has mainly humid and semi-humid areas, with vegetation dominated by shrubs, forests, and meadows. The vegetation coverage in this area is high, and the vegetation health is good. The NDVI spatial clustering results in this paper are complementary to the patterns of the ecological risk spatial clustering results of Huang et al. [61]. Their research showed that the ecological risk of the Qinghai–Tibet Plateau decreases from the northwest to the southeast. The largest of the high-risk areas is mainly distributed in the northwest region, with low vegetation coverage, resulting in low and concentrated NDVI values.
(3)
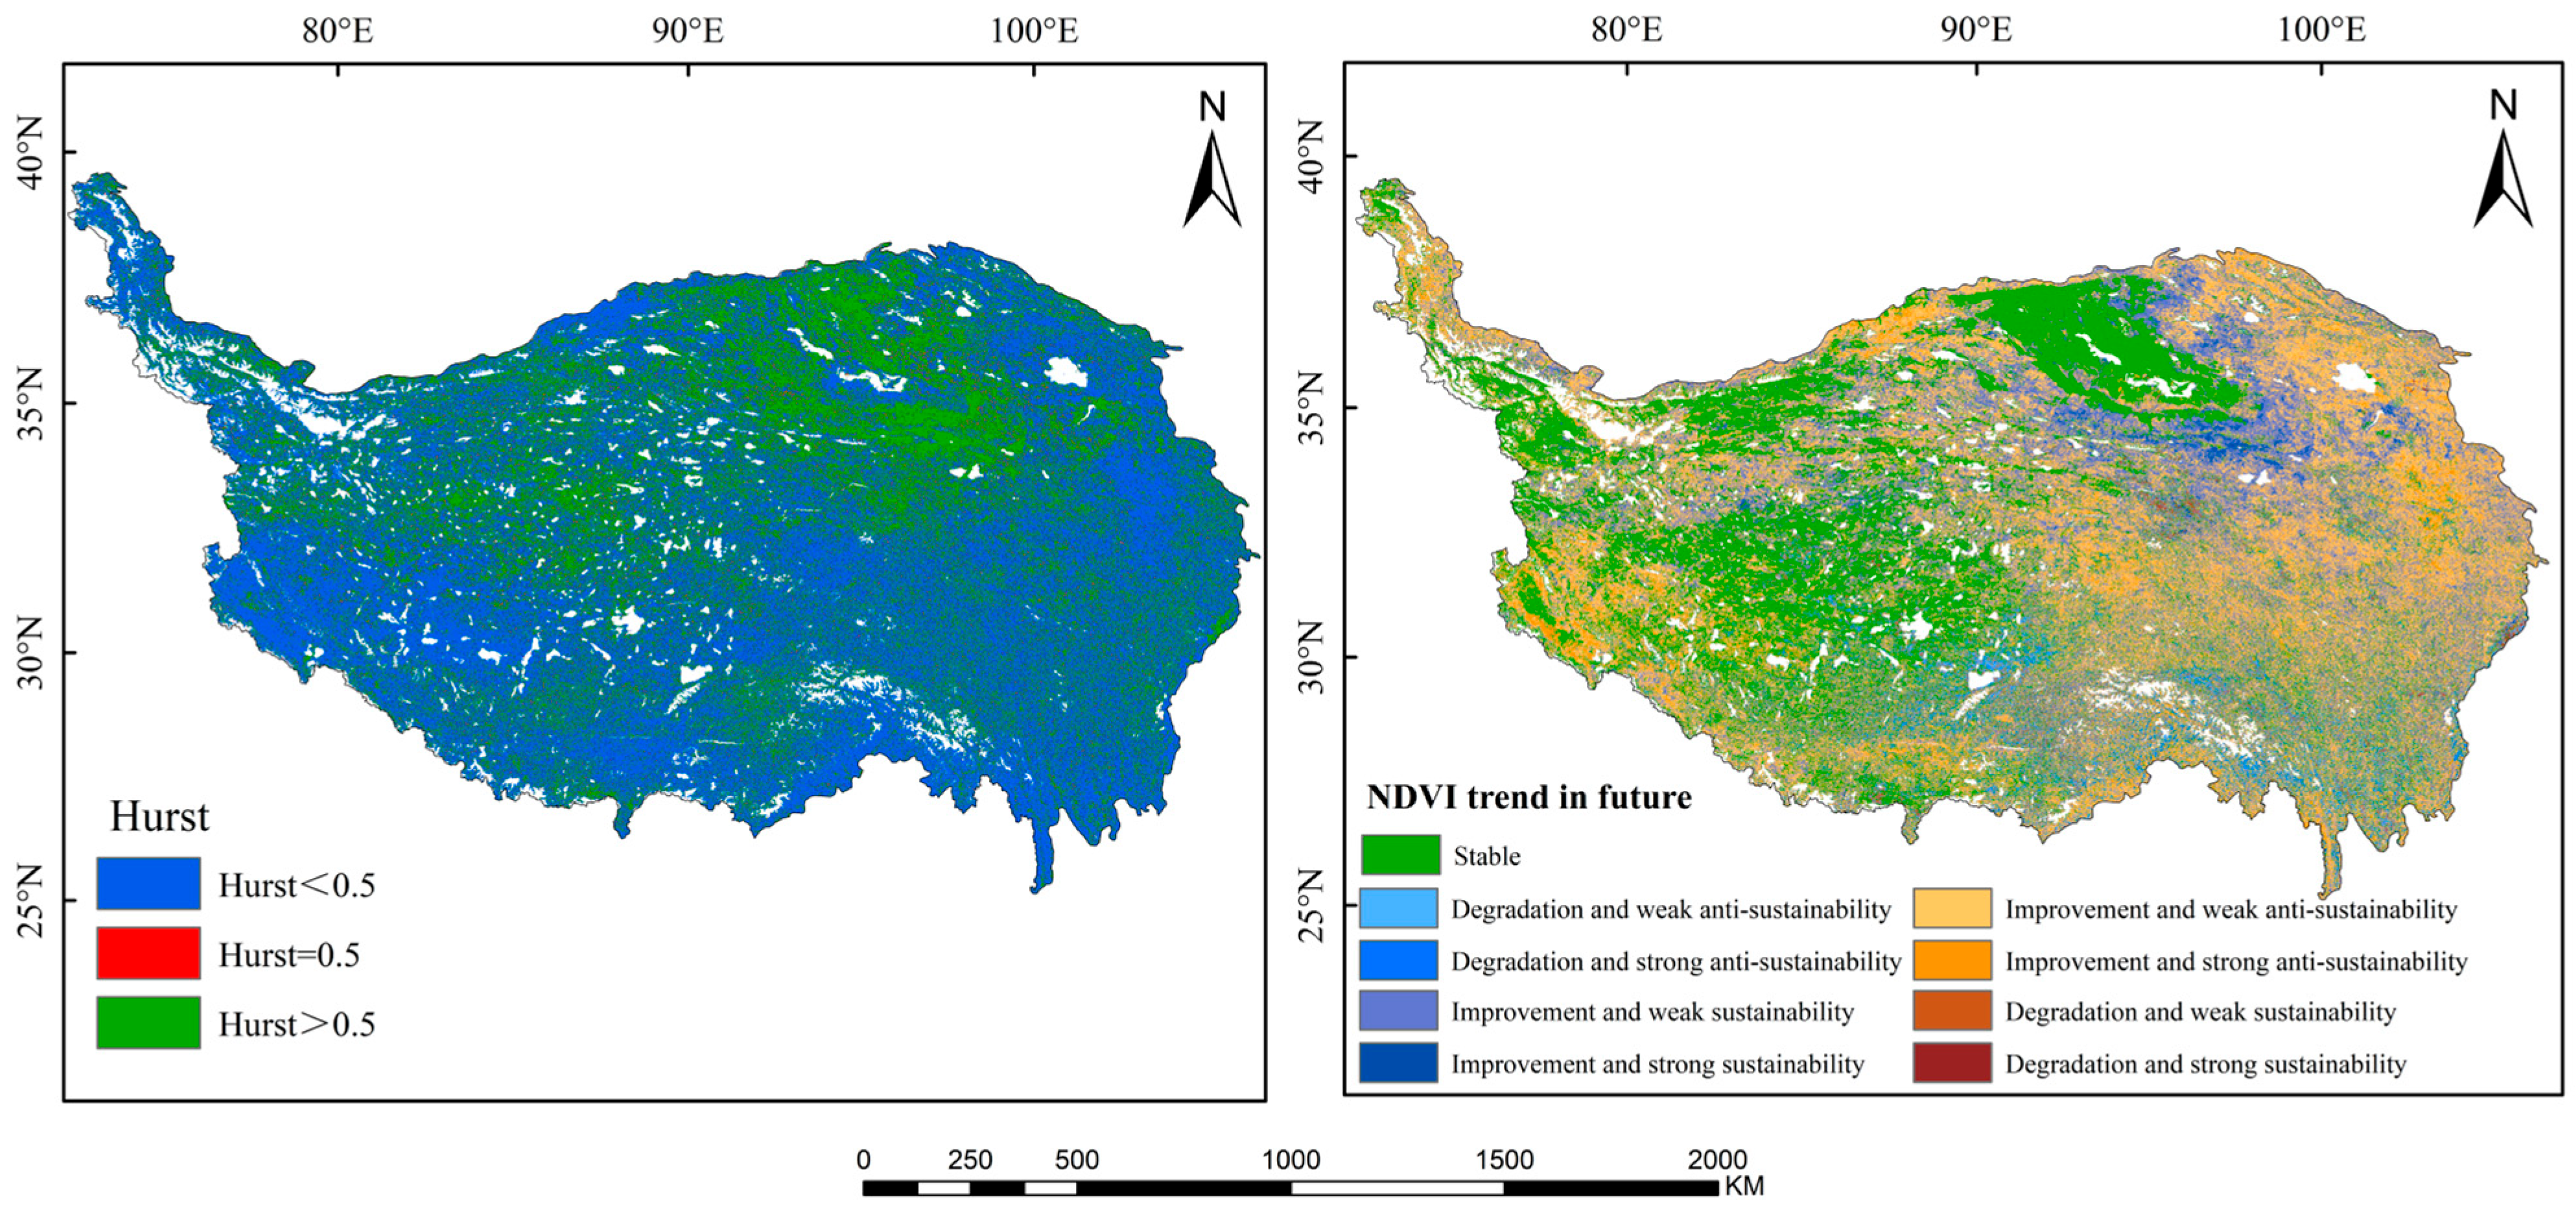
Hurst index calculation and future trend analysis were carried out for the NDVI during the growing season to better understand the characteristics of future vegetation trends. It is helpful to scientifically predict and evaluate the long-term trend of vegetation change and provide theoretical support for the formulation of effective ecological protection and restoration strategies so as to reduce the risk of vegetation degradation and protect the fragile ecological environment of the Qinghai–Tibet Plateau. The average Hurst index value was 0.46, which indicates that the current trends of the growing-season NDVI of the plateau are unlikely to continue in the future. This agrees with the findings of Chen et al. [62]. The vegetation around the Tarim Basin will show an upward trend in the future, thanks to the warming and humidification of the climate and the implementation of a series of ecological protection measures, such as returning farmland to forests and ecological water delivery [63]. In addition, it is expected that the areas degraded in the future will be mainly distributed in the eastern part of the plateau, especially in humid and semi-humid areas, such as Sichuan, Yunnan, and eastern Tibet. These regions, with their warm and humid climates and large populations, are likely to experience degradation of vegetation cover during the growing season as a result of increased human activity [64]. In addition to human activities, soil erosion [65] and geological disasters are also important factors affecting vegetation changes in these areas. As a result, it will be necessary to closely monitor the region’s vegetation cover and to implement several regulations to protect the plateau’s ecosystem in the years to come.

5.1.2. Response of Vegetation to Climate Change during the Growing Season on the Qinghai–Tibet Plateau

With its fragile ecosystems, the plateau is more vulnerable to global climate change than other regions, and it is heavily threatened by external disturbances. In particular, climate change is expected to greatly impact its ecological environment [66]. The correlations of the NDVIs of various vegetation types with precipitation and average temperature were checked. Overall, changes in the NDVI correlated positively with changes in precipitation and air temperature. However, the correlation coefficients were relatively higher and more significant with air temperature than with precipitation. Air temperature had a stronger driving effect on the NDVI than precipitation did during the growing season. This is consistent with He et al.’s conclusion that air temperature on the Qinghai–Tibet Plateau influences the changes in LAI and NDVI values more significantly than precipitation does [67]. In most areas of central Tibet, the correlations between the NDVI and precipitation or air temperature showed obvious complementary relationships. The high elevation, complex landscape, low water supply, and generally colder climate of the region limit vegetation growth, thus ensuring that temperature change directly impacts vegetation growth less significantly than precipitation does. And in the northeastern part of the plateau, the NDVI is more strongly correlated with precipitation. This may be due to the dry climate, less precipitation, and uneven distribution in this area, which leads to a higher dependence of vegetation growth on water [68]. At the same time, the change in precipitation can be quickly reflected in the growth of vegetation and reflected in a change in the NDVI.
Here, we assessed the spatiotemporal variation in the NDVI and its correlation with precipitation and air temperature during the multi-year growing season on the Qinghai–Tibet Plateau. However, a variety of other elements also contribute to changes in the vegetation cover. This study was limited in its selection of influencing factors. For instance, it ignored the lag effect of climate factors [69], human factors [70], land use change [71], and other environmental factors. Thus, it will be necessary to further explore these factors to enhance the theoretical depth and practical value of this research. For example, the effects of human activities on vegetation are studied using Geo Detector models or multiple residual regression analysis based on the GDP, night light, and grazing density data. In addition, the Hurst index is only based on the calculation of the time series GNDVI value and does not involve other factors, especially climate factors. Therefore, its relationship with climate change needs to be further studied in the future [62].

5.2. Conclusions

(1)
The multi-year average NDVI during the 2001–2020 growing seasons on the Qinghai–Tibet Plateau shifted in its spatial distribution from the southeast to the northwest. Overall, the growing-season NDVI shows an overall trend of improvement, especially in the west-central and northern parts of the plateau and parts of the eastern area of the plateau.
(2)
The NDVI change trends vary among various vegetation types. Of the four major vegetation types analyzed here, meadows have the largest area of improvement, grasslands have the largest area of stable land, and shrubs have the largest area of degradation.
(3)
The Qinghai–Tibet Plateau’s NDVI exhibits a high global Moran’s I during the growing season, indicating strong positive spatial correlation and clustering. The main patterns are low–low and high–high clustering in the northwest and the southeast, respectively. There are a few extreme points and anomalies, and the overall distribution pattern is stable.
(4)
The average value of the Hurst index of the NDVI in the growing season for many years is 0.46. Overall, the area of degraded vegetation is larger than the area of improved vegetation, especially in the eastern part of the plateau.
(5)
The NDVI correlates positively with both temperature and precipitation during the growing season on the Qinghai–Tibet Plateau. Nonetheless, these correlations clearly differ among different NDVIs. Air temperature has a more generalized effect on the wider regions of the plateau. In contrast, precipitation mainly affects meadows in the arid region of the northeastern part of the plateau. Overall, temperature has a greater driving effect than precipitation does.

Author Contributions

Conceptualization, Y.J.; methodology, J.L.; project administration, Y.J.; resources, J.L.; software, J.L. and Y.J.; supervision, Y.J. and J.L.; validation, J.L.; writing—original draft preparation, J.L. and Y.J.; writing—review and editing, Y.J., A.M. and J.L.; visualization, J.L. All authors have read and agreed to the published version of the manuscript.

Funding

This research was supported by the National Natural Science Foundation of China (grant numbers 32160365, 32371869, and 42161059) and the Yunnan Province Agriculture Joint Special Project (grant number 202301BD070001-058).

Data Availability Statement

The primary data used in this paper are openly available in the data sources. NDVI data were derived from the long time series of Chinese monthly-scale data provided by the National Science & Technology Infrastructure-National Earth System Science Data Center (http://www.geodata.cn, accessed on 1 July 2024). Meteorological data were obtained from China’s 1 km resolution month-by-month temperature and precipitation dataset provided by the National Tibetan Plateau Data Center (https://data.tpdc.ac.cn/, accessed on 1 July 2024). Vegetation-type data were obtained from data on the spatial distribution of vegetation types in China provided by the Resources and Environment Science Data Center of the Chinese Academy of Sciences (https://www.resdc.cn/, accessed on 1 July 2024).

Acknowledgments

The authors are thankful to all the reviewers and editors.

Conflicts of Interest

The authors declare no conflicts of interest.

References

  1. IPCC. Climate change 2022: Mitigation of climate change. In Contribution of Working Group IlI to the Sixth Assessment Report of the Intergovernmental Panel on Climate Change; Cambridge University Press: Cambridge, UK; New York, NY, USA, 2022. [Google Scholar]
  2. Ma, Y.; Guan, Q.; Sun, Y.; Zhang, J.; Yang, L.; Yang, E.; Li, H.; Du, Q. Three-dimensional dynamic characteristics of vegetation and its response to climatic factors in the Qilian Mountains. Catena 2022, 208, 105694. [Google Scholar] [CrossRef]
  3. Fu, Y.H.; Zhao, H.; Piao, S.; Peaucelle, M.; Peng, S.; Zhou, G.; Ciais, P.; Huang, M.; Menzel, A.; Peñuelas, J.; et al. Declining global warming effects on the phenology of spring leaf unfolding. Nature 2015, 526, 104–107. [Google Scholar] [CrossRef]
  4. Peng, W.; Kuang, T.; Tao, S. Quantifying influences of natural factors on vegetation NDVI changes based on geographical detector in Sichuan, western China. J. Clean. Prod. 2019, 233, 353–367. [Google Scholar] [CrossRef]
  5. Zhang, Y.; Ye, A. Spatial and temporal variations in vegetation coverage observed using AVHRR GIMMS and Terra MODIS data in the mainland of China. Int. J. Remote Sens. 2020, 41, 4238–4268. [Google Scholar] [CrossRef]
  6. Jin, K.; Wang, F.; Zong, Q.; Qin, P.; Liu, C.; Wang, S. Spatiotemporal differences in climate change impacts on vegetation cover in China from 1982 to 2015. Environ. Sci. Pollut. Res. 2022, 29, 10263–10276. [Google Scholar] [CrossRef] [PubMed]
  7. Gao, S.Q.; Dong, G.T.; Jiang, X.H.; Nie, T.; Yin, H.J.; Guo, X.W. Quantification of natural and anthropogenic driving forces of vegetation changes in the Three-River Headwater Region during 1982–2015 based on geographical detector model. Remote Sens. 2021, 13, 4175. [Google Scholar] [CrossRef]
  8. Gao, S.; Dong, G.; Jiang, X.; Nie, T.; Guo, X. Analysis of factors influencing spatiotemporal differentiation of the NDVI in the upper and middle reaches of the Yellow River from 2000 to 2020. Front. Environ. Sci. 2023, 10, 1072430. [Google Scholar] [CrossRef]
  9. Zhong, L.; Ma, Y.; Xue, Y.; Piao, S. Climate change trends and impacts on vegetation greening over the Tibetan Plateau. J. Geophys. Res. Atmos. 2019, 124, 7540–7552. [Google Scholar] [CrossRef]
  10. Liu, Y.; Zhang, X.; Du, X.; Du, Z.; Sun, M. Alpine grassland greening on the Northern Tibetan Plateau driven by climate change and human activities considering extreme temperature and soil moisture. Sci. Total Environ. 2024, 916, 169995. [Google Scholar] [CrossRef]
  11. Liu, L.; Gou, X.; Wang, X.; Yang, M.; Qie, L.; Pang, G.; Wei, S.; Zhang, F.; Li, Y.; Wang, Q.; et al. Relationship between extreme climate and vegetation in arid and semi-arid mountains in China: A case study of the Qilian Mountains. Agric. For. Meteorol. 2024, 348, 109938. [Google Scholar] [CrossRef]
  12. Han, W.; Chen, D.; Li, H.; Chang, Z.; Chen, J.; Ye, L.; Liu, S.; Wang, Z. Spatiotemporal Variation of NDVI in Anhui Province from 2001 to 2019 and Its Response to Climatic Factors. Forests 2022, 13, 1643. [Google Scholar] [CrossRef]
  13. Xu, Y.; Dai, Q.Y.; Lu, Y.G.; Zhao, C.; Huang, W.T.; Xu, M.; Feng, Y.X. Identification of ecologically sensitive zones affected by climate change and anthropogenic activities in Southwest China through a NDVI-based spatial-temporal model. Ecol. Indic. 2024, 158, 111482. [Google Scholar] [CrossRef]
  14. Ren, H.; Shang, Y.; Zhang, S. Measuring the spatiotemporal variations of vegetation net primary productivity in Inner Mongolia using spatial autocorrelation. Ecol. Indic. 2020, 112, 106108. [Google Scholar] [CrossRef]
  15. Liu, C.; Li, W.; Wang, W.; Zhou, H.; Liang, T.; Hou, F.; Xu, J.; Xue, P. Quantitative spatial analysis of vegetation dynamics and potential driving factors in a typical alpine region on the northeastern Tibetan Plateau using the Google Earth Engine. Catena 2021, 206, 105500. [Google Scholar] [CrossRef]
  16. Akhter, J.; Afroz, R. Influence of Climate Variability and Land Cover Dynamics on the Spatio-temporal NDVI Patterns in Western Hydrological Regions of Bangladesh. Heliyon 2024, 10, e32625. [Google Scholar] [CrossRef] [PubMed]
  17. Luo, Y.; Yang, S.; Wen, C.; Xu, X.; Xiao, X.; Zhou, J.; Yang, X.; Li, R.; Zhang, J.; Fang, X. Anthropogenic effects on soils in the eastern Tibetan Plateau revealed by geochemical elemental characteristics. Environ. Res. 2024, 252, 118794. [Google Scholar] [CrossRef]
  18. Zhang, C.; Qin, D.H.; Zhai, P.M. Amplification of warming on the Tibetan Plateau. Adv. Clim. Chang. Res. 2023, 14, 493–501. [Google Scholar] [CrossRef]
  19. Wang, Z.; Wu, J.; Niu, B.; He, Y.; Zu, J.; Li, M.; Zhang, X. Vegetation expansion on the Tibetan Plateau and its relationship with climate change. Remote Sens. 2020, 12, 4150. [Google Scholar] [CrossRef]
  20. Huang, N.; He, J.S.; Chen, L.; Wang, L. No upward shift of alpine grassland distribution on the Qinghai-Tibetan Plateau despite rapid climate warming from 2000 to 2014. Sci. Total Environ. 2018, 625, 1361–1368. [Google Scholar] [CrossRef]
  21. Shen, X.; Shen, M.; Wu, C.; Peñuelas, J.; Ciais, P.; Zhang, J.; Freeman, C.; Paler, P.I.; Liu, B.; Henderson, M.; et al. Critical role of water conditions in the responses of autumn phenology of marsh wetlands to climate change on the Tibetan Plateau. Glob. Chang. Biol. 2023, 30, e17097. [Google Scholar] [CrossRef]
  22. Yao, T.; Thompson, L.; Chen, D.; Piao, S. Reflections and future strategies for Third Pole Environment. Nat. Rev. Earth Environ. 2022, 3, 608–610. [Google Scholar] [CrossRef]
  23. Chang, Y.; Ding, Y.; Zhang, S.; Qin, J.; Zhao, Q. Variations and drivers of evapotranspiration in the Tibetan Plateau during 1982–2015. J. Hydrol. Reg. Stud. 2023, 47, 101366. [Google Scholar] [CrossRef]
  24. Chen, F.; Zhang, J.; Liu, J.; Cao, X.; Hou, J.; Zhu, L.; Xu, X.; Liu, X.; Wang, M.; Wu, D.; et al. Climate change, vegetation history, and landscape responses on the Tibetan Plateau during the Holocene: A comprehensive review. Quat. Sci. Rev. 2020, 243, 106444. [Google Scholar] [CrossRef]
  25. Chen, Y.; Sun, L.; Xu, J.; Liang, B.; Wang, J.; Xiong, N. Wetland vegetation changes in response to climate change and human activities on the Tibetan Plateau during 2000–2015. Front. Ecol. Evol. 2023, 11, 1113802. [Google Scholar] [CrossRef]
  26. Jiao, K.; Gao, J.; Liu, Z. Precipitation drives the NDVI distribution on the Tibetan Plateau while high warming rates may intensify its ecological droughts. Remote Sens. 2021, 13, 1305. [Google Scholar] [CrossRef]
  27. Mao, X.; Ren, H.-L.; Liu, G. Primary Interannual Variability Patterns of the Growing-Season NDVI over the Tibetan Plateau and Main Climatic Factors. Remote Sens. 2022, 14, 5183. [Google Scholar] [CrossRef]
  28. Lv, J.; Zhao, W.; Hua, T.; Zhang, L.; Pereira, P. Multiple Greenness Indexes Revealed the Vegetation Greening during the Growing Season and Winter on the Tibetan Plateau despite Regional Variations. Remote Sens. 2023, 15, 5697. [Google Scholar] [CrossRef]
  29. Peng, S. 1-km Monthly Mean Temperature Dataset for China (1901–2022); National Tibetan Plateau/Third Pole Environment Data Center: Beijing, China, 2019. [Google Scholar]
  30. Peng, S. 1-km Monthly Precipitation Dataset for China (1901–2022); National Tibetan Plateau/Third Pole Environment Data Center: Beijing, China, 2020. [Google Scholar]
  31. Ding, Y.; Peng, S. Spatiotemporal trends and attribution of drought across China from 1901–2100. Sustainability 2020, 12, 477. [Google Scholar] [CrossRef]
  32. Peng, S.; Ding, Y.; Wen, Z.; Chen, Y.; Cao, Y.; Ren, J. Spatiotemporal change and trend analysis of potential evapotranspiration over the Loess Plateau of China during 2011–2100. Agric. For. Meteorol. 2017, 233, 183–194. [Google Scholar] [CrossRef]
  33. Peng, S.; Ding, Y.; Liu, W.; Li, Z. 1 km monthly temperature and precipitation dataset for China from 1901 to 2017. Earth Syst. Sci. Data 2019, 11, 1931–1946. [Google Scholar] [CrossRef]
  34. Peng, S.; Gang, C.; Cao, Y.; Chen, Y. Assessment of climate change trends over the Loess Plateau in China from 1901 to 2100. Int. J. Climatol. 2018, 38, 2250–2264. [Google Scholar] [CrossRef]
  35. Han, B.; Zhou, B.; Yan, Y.; Shi, M.; Su, S.; Zhao, H.; Niu, D.; Fu, H. Analysis of vegetation coverage change and its driving factors over Tibetan Plateau from 2000 to 2018. Acta Agrestia Sin. 2019, 27, 1651–1658. (In Chinese) [Google Scholar]
  36. Wu, R.; Wang, Y.; Liu, B.; Li, X. Spatial-temporal changes of NDVI in the three northeast provinces and its dual response to climate change and human activities. Front. Environ. Sci. 2022, 10, 974988. [Google Scholar] [CrossRef]
  37. Cai, B.F.; Yu, R. Advance and evaluation in the long time series vegetation trends research based on remote sensing. J. Remote Sens. 2009, 13, 1170–1186. [Google Scholar]
  38. Zuo, Y.; Li, Y.; He, K.; Wen, Y. Temporal and spatial variation characteristics of vegetation coverage and quantitative analysis of its potential driving forces in the Qilian Mountains, China, 2000–2020. Ecol. Indic. 2022, 143, 109429. [Google Scholar] [CrossRef]
  39. Tong, S.; Zhang, J.; Bao, Y.; Lai, Q.; Lian, X.; Li, N.; Bao, Y. Analyzing vegetation dynamic trend on the Mongolian Plateau based on the Hurst exponent and influencing factors from 1982–2013. J. Geogr. Sci. 2018, 28, 595–610. [Google Scholar] [CrossRef]
  40. Li, Y.; Li, Z.; Zhang, X.; Gui, J.; Xue, J. Vegetation variations and its driving factors in the transition zone between Tibetan Plateau and arid region. Ecol. Indic. 2022, 141, 109101. [Google Scholar]
  41. Mao, S.; Shangguan, Z. Evolution of spatiotemporal patterns in vegetation net primary productivity and the driving forces on the Loess Plateau. Front. Environ. Sci. 2023, 11, 1134917. [Google Scholar] [CrossRef]
  42. García-Pardo, K.A.; Moreno-Rangel, D.; Domínguez-Amarillo, S.; García-Chávez, J.R. Urban classification of the built-up and seasonal variations in vegetation: A framework integrating multisource datasets. Urban For. Urban Green. 2023, 89, 128114. [Google Scholar] [CrossRef]
  43. Xu, L.; Cai, R.; Yu, H.; Du, W.; Chen, Z.; Chen, N. Monthly NDVI prediction using spatial autocorrelation and nonlocal attention networks. IEEE J. Sel. Top. Appl. Earth Obs. Remote Sens. 2024, 17, 3425–3437. [Google Scholar] [CrossRef]
  44. Liu, C.; Wu, X.; Wang, L. Analysis on land ecological security change and affect factors using RS and GWR in the Danjiangkou Reservoir area, China. Appl. Geogr. 2019, 105, 1–14. [Google Scholar] [CrossRef]
  45. Jiang, F.; Deng, M.; Long, Y.; Sun, H. Spatial pattern and dynamic change of vegetation greenness from 2001 to 2020 in Tibet, China. Front. Plant Sci. 2022, 13, 892625. [Google Scholar] [CrossRef] [PubMed]
  46. Wang, B.; Xu, G.; Li, P.; Li, Z.; Zhang, Y.; Cheng, Y.; Jia, L.; Zhang, J. Vegetation dynamics and their relationships with climatic factors in the Qinling Mountains of China. Ecol. Indic. 2020, 108, 105719. [Google Scholar] [CrossRef]
  47. Kalisa, W.; Igbawua, T.; Henchiri, M.; Ali, S.; Zhang, S.; Bai, Y.; Zhang, J. Assessment of climate impact on vegetation dynamics over East Africa from 1982 to 2015. Sci. Rep. 2019, 9, 16865. [Google Scholar] [CrossRef] [PubMed]
  48. Chen, C.; Wang, J.X.; Gan, S.; Yuan, X.P.; Luo, W.D. Spatial-Temporal Change Patterns of Vegetation and the Influence of Climatic Factors in Yunnan Province, China from 2000 to 2020. Appl. Ecol. Environ. Res. 2023, 21, 5265–5283. [Google Scholar] [CrossRef]
  49. Kang, Y.; Guo, E.; Wang, Y.; Bao, Y.; Bao, Y.; Mandula, N. Monitoring Vegetation Change and Its Potential Drivers in Inner Mongolia from 2000 to 2019. Remote Sens. 2021, 13, 3357. [Google Scholar] [CrossRef]
  50. Cao, S.; He, Y.; Zhang, L.; Chen, Y.; Yang, W.; Yao, S.; Sun, Q. Spatiotemporal characteristics of drought and its impact on vegetation in the vegetation region of Northwest China. Ecol. Indic. 2021, 133, 108420. [Google Scholar] [CrossRef]
  51. Ma, Y.; Zuo, L.; Gao, J.; Liu, Q.; Liu, L. The karst NDVI correlation with climate and its BAS-BP prediction based on multiple factors. Ecol. Indic. 2021, 132, 108254. [Google Scholar] [CrossRef]
  52. Ren, Y.; Zhang, F.; Zhao, C.; Cheng, Z. Attribution of climate change and human activities to vegetation NDVI in Jilin Province, China during 1998–2020. Ecol. Indic. 2023, 153, 110415. [Google Scholar] [CrossRef]
  53. Jiang, W.; Yuan, L.; Wang, W.; Cao, R.; Zhang, Y.; Shen, W. Spatio-temporal analysis of vegetation variation in the Yellow River Basin. Ecol. Indic. 2015, 51, 117–126. [Google Scholar] [CrossRef]
  54. Bai, Y. Analysis of vegetation dynamics in the Qinling-Daba Mountains region from MODIS time series data. Ecol. Indic. 2021, 129, 108029. [Google Scholar] [CrossRef]
  55. Liu, X.; Du, G.; Bi, H.; Li, Z.; Zhang, X. Normal Difference Vegetation Index Simulation and Driving Analysis of the Tibetan Plateau Based on Deep Learning Algorithms. Forests 2024, 15, 137. [Google Scholar] [CrossRef]
  56. Hu, M.; Wang, S.; Chen, F.; Chen, Y.; Zhang, H.; Hadad, M.A.; Roig, F.A.; Yue, W.; Zhao, X. Strong coupling between soil moisture and temperature intensifies warming and humidification on the Tibetan Plateau: Evidence from 200-year tree ring records. Palaeogeogr. Palaeoclimatol. Palaeoecol. 2024, 644, 112206. [Google Scholar] [CrossRef]
  57. Duan, H.; Xue, X.; Wang, T.; Kang, W.; Liao, J.; Liu, S. Spatial and temporal differences in alpine meadow, alpine steppe and all vegetation of the Qinghai-Tibetan Plateau and their responses to climate change. Remote Sens. 2021, 13, 669. [Google Scholar] [CrossRef]
  58. Liu, W.; Mo, X.; Liu, S.; Liu, C. Impacts of climate change on grassland fractional vegetation cover variation on the Tibetan Plateau. Sci. Total Environ. 2024, 939, 173320. [Google Scholar] [CrossRef] [PubMed]
  59. Wang, S.; Zhang, Y.; Ju, W.; Chen, J.M.; Ciais, P.; Cescatti, A.; Sardans, J.; Janssens, I.A.; Wu, M.; Berry, J.A.; et al. Recent global decline of CO2 fertilization effects on vegetation photosynthesis. Science 2020, 370, 1295–1300. [Google Scholar] [CrossRef] [PubMed]
  60. Zhang, J.; Zhang, Y.; Qin, Y.; Lu, X.; Cao, J. The spatiotemporal pattern of grassland NPP in Inner Mongolia was more sensitive to moisture and human activities than that in the Qinghai-Tibetan Plateau. Glob. Ecol. Conserv. 2023, 48, e02709. [Google Scholar] [CrossRef]
  61. Huang, X.; Wang, X.; Zhang, X.; Zhou, C.; Ma, J.; Feng, X. Ecological risk assessment and identification of risk control priority areas based on degradation of ecosystem services: A case study in the Tibetan Plateau. Ecol. Indic. 2022, 141, 109078. [Google Scholar] [CrossRef]
  62. Chen, J.; Yan, F.; Lu, Q. Spatiotemporal variation of vegetation on the Qinghai–Tibet Plateau and the influence of climatic factors and human activities on vegetation trend (2000–2019). Remote Sens. 2020, 12, 3150. [Google Scholar] [CrossRef]
  63. Zhao, X.; Xu, H.; Ai, S.; Zhang, Q.; Liu, K. Whether the ecological benefits will continue to increase as usual and improve under the background of continuous ecological water delivery?—Taking the Lower Tarim River in China as an example. Ecol. Indic. 2024, 159, 111733. [Google Scholar] [CrossRef]
  64. Huang, Y.; Xin, Z.; Dor-ji, T.; Wang, Y. Tibetan Plateau greening driven by warming-wetting climate change and ecological restoration in the 21st century. Land Degrad. Dev. 2022, 33, 2407–2422. [Google Scholar] [CrossRef]
  65. Tian, Q.; Zhang, X.; He, J.; Yi, H.; He, L.; Yang, Q. Potential risk of soil erosion on the Tibetan Plateau during 1990–2020: Impact of climate change and human activities. Ecol. Indic. 2023, 154, 110669. [Google Scholar] [CrossRef]
  66. Gao, Q.; Guo, Y.; Xu, H.; Ganjurjav, H.; Li, Y.; Wan, Y.; Qin, X.; Ma, X.; Liu, S. Climate change and its impacts on vegetation distribution and net primary productivity of the alpine ecosystem in the Qinghai-Tibetan Plateau. Sci. Total Environ. 2016, 554, 34–41. [Google Scholar] [CrossRef] [PubMed]
  67. He, Z.; Zhou, T.; Chen, J.; Fu, Y.; Peng, Y.; Zhang, L.; Yao, T.; Farooq, T.H.; Wu, X.; Yan, W.; et al. Impacts of Climate Warming and Humidification on Vegetation Activity over the Tibetan Plateau. Forests 2023, 14, 2055. [Google Scholar] [CrossRef]
  68. Cui, J.; Wang, Y.; Zhou, T.; Jiang, L.; Qi, Q. Temperature mediates the dynamic of MODIS NPP in alpine grassland on the Tibetan Plateau, 2001–2019. Remote Sens. 2022, 14, 2401. [Google Scholar] [CrossRef]
  69. Cai, S.; Song, X.; Hu, R.; Guo, D. Ecosystem-dependent responses of vegetation coverage on the Tibetan Plateau to climate factors and their lag periods. ISPRS Int. J. Geo-Inf. 2021, 10, 394. [Google Scholar] [CrossRef]
  70. Jin, Z.; You, Q.; Mu, M.; Sun, G.; Pepin, N. Fingerprints of anthropogenic influences on vegetation change over the Tibetan Plateau from an ecohydrological diagnosis. Geophys. Res. Lett. 2020, 47, e2020GL087842. [Google Scholar] [CrossRef]
  71. Jiang, S.; Chen, X.; Smettem, K.; Wang, T. Climate and land use influences on changing spatiotemporal patterns of mountain vegetation cover in southwest China. Ecol. Indic. 2021, 121, 107193. [Google Scholar] [CrossRef]
Figure 1. Distribution of elevation (A) and vegetation types (B) on the Qinghai–Tibet Plateau.
Land 13 01230 g001
Figure 2. Changes in the growing-season NDVI of various vegetation types on the Qinghai–Tibet Plateau, 2001–2020.
Land 13 01230 g002
Figure 3. Spatial distribution (A) and significance test of trends (B) in NDVI average value variation during the 2001–2020 growing seasons.
Land 13 01230 g003
Figure 4. Changes in the NDVI of four major vegetation types during the 2001–2020 growing seasons on the Qinghai–Tibet Plateau.
Land 13 01230 g004
Figure 5. Significance test for NDVI change trend grades for different types of vegetation during the 2001–2020 growing seasons.
Land 13 01230 g005
Figure 6. Moran scatterplot of global NDVI spatial autocorrelation on the Qinghai–Tibet Plateau during the growing season. Note: (A) (2005), (B) (2010), (C) (2015), and (D) (2020).
Land 13 01230 g006
Figure 7. LISA map of localized NDVI spatial autocorrelation on the Qinghai–Tibet Plateau during the growing season.
Land 13 01230 g007
Figure 8. Spatial distribution of vegetation Hurst index values (A) and future trends (B) during the 2001–2020 growing seasons on the Qinghai–Tibet Plateau.
Land 13 01230 g008
Figure 9. Interannual variation diagram of precipitation (A) and average temperature (B) in the 2001–2020 growing seasons on the Qinghai–Tibet Plateau.
Land 13 01230 g009
Figure 10. Correlation of the NDVIs of the main vegetation types with precipitation and average temperature during the 2001–2020 growing seasons on the Qinghai–Tibet Plateau: (A) grassland, (B) meadow, (C) alpine, and (D) shrub).
Land 13 01230 g010
Table 1. Areas categorized into NDVI change trend grades for various vegetation types on the Qinghai–Tibet Plateau (2001–2020).
SNDVIZTrend of NDVIArea Percentage (%)
Study AreaGrasslandMeadowAlpine VegetationShrub
<−0.0005<−1.96Severe degradation0.991.200.890.271.24
<−0.0005−1.96–1.96Slight degradation7.843.808.845.4916.93
−0.0005–0.0005−1.96–1.96Stable25.4929.7818.1528.4114.86
≥0.0005−1.96–1.96Slight improvement29.6118.7641.0436.3343.85
≥0.0005≥1.96Significant improvement36.0746.4631.0929.5123.12
Table 2. Percentage of future NDVI growing-season trends on the Qinghai–Tibet Plateau.
SNDVIChange DirectionsFuture Change TrendPercentage (%)
<−0.0005Continuous degradationDegradation and strong sustainability0.18
Degradation and weak sustainability2.34
≥0.0005Improvement to degradationImprovement and strong anti-sustainability7.32
Improvement and weak anti-sustainability34.2
<−0.0005Degradation to improvementDegradation and weak anti-sustainability5.08
Degradation and strong anti-sustainability1.47
≥0.0005Continuous improvementImprovement and weak sustainability18.91
Improvement and strong sustainability1.5
−0.0005–0.0005StableStable28.99
Table 3. Correlation coefficients and significance for growing-season NDVIs of different vegetation types with precipitation and average temperature.
Vegetation TypePrecipitation in the Growing SeasonAverage Temperature in the Growing Season
Correlation Coefficient RSignificance pCorrelation Coefficient RSignificance p
Grassland0.1694710.0186060.2062610.003545
Meadow0.2180250.0055420.2301940.001839
Alpine vegetation−0.0554910.0922510.2777130.015412
Shrub0.0669390.008540.1175810.002275
Disclaimer/Publisher’s Note: The statements, opinions and data contained in all publications are solely those of the individual author(s) and contributor(s) and not of MDPI and/or the editor(s). MDPI and/or the editor(s) disclaim responsibility for any injury to people or property resulting from any ideas, methods, instructions or products referred to in the content.

