Article

Characteristics of Runoff and Sediment Yield in a Simulated Hedgerow–Grass Ditch System in Sloping Lands with Regosols

by
Lan Song
,
Yunfei Bi
,
Qingsong Bo
,
Tianyang Li
,
Yonghao Li
,
Binghui He
* and
Xinmei Zhao
College of Resources and Environment, Southwest University, Tiansheng Road, Beibei District, Chongqing 400715, China
*
Author to whom correspondence should be addressed.
These authors contributed equally to this work.
Land 2024, 13(8), 1231; https://doi.org/10.3390/land13081231
Submission received: 3 July 2024 / Revised: 3 August 2024 / Accepted: 6 August 2024 / Published: 8 August 2024

Abstract

:
The independent effects of hedgerow or grass ditches on the migration of runoff, sediment and nutrients are well known; however, the effects of combined hedgerow–grass ditch systems have rarely been assessed. Vegetation stem diameter (VSD) is an essential variable that changes the effectiveness of a hedgerow–grass ditch system in reducing runoff and sediment yield on sloping lands. A hedgerow–grass ditch system was simulated to interpret the effects of varied VSDs [i.e., 0 (control), 0.1, 0.2, 0.4 and 0.8 cm] in hedgerow on runoff and sediment yield by laboratory rainfall simulation. Compared to the control, the time to runoff initiation presented a 43.3% delay in 0.8 cm VSD (p < 0.05), and the runoff rate was significantly reduced by 16.6% in the 0.2 cm VSD and by 17.0% in the 0.8 cm VSD, respectively (p < 0.05). The sediment yield rate decreased by 74.2% and 85.8% relative to that of the control, respectively (p < 0.05). The reduction was 5.3–17.0% for the runoff rate and 3.5–85.8% for the sediment yield rate with varied VSDs relative to the control. The sediment yield rate decreased remarkably as an exponential function with increased stem diameter (p < 0.05). Our results have great significance for creating strategies for soil and water conservation on sloping lands.

1. Introduction

Revegetation is an eco-friendly strategy that is employed worldwide to reduce runoff and sediment yield from sloping lands. The benefits of revegetation controlling runoff and sediment vary depending on many features of the used vegetation, such as the stem diameter [1,2]. Previous discoveries have concluded that, with vegetation growth, the stem diameter of vegetation changes and strongly affects runoff and sediment on sloping lands [3,4]. Yao et al. [5] found the stems reduced runoff and sediment yield more effectively than roots in the southern Loess Plateau. The vegetation stem directly decreases runoff flow energy, thus reducing sediment transport. Salman et al. [6] and Lou et al. [7] reported that flow resistance decreased, but flow velocity elevated, as the stem diameter of vegetation increased. Cen et al. [8] suggested that covered stems increase flow disturbance and reduce runoff and sediment production. The disturbance of flow affects the stripping and migration of soil particles, which in turn affects the formation of rills on slopes, thus altering the production of runoff and sediment yield during rainfall [9]. Indeed, characterization of the relations between variable vegetation stem diameters and runoff, as well as sediment yield, is essential to interpret the role of vegetated measures in regulating runoff and sediment yield.
Hedgerows are widely used to decrease soil loss on sloping land (Figure 1b). Many studies have studied the influences of hedgerows on runoff and sediment yield [10]. In purple soil sloping lands, compared to slopes with no hedgerow, hedgerows prolonged the time to runoff initiation by 43.4% and decreased runoff by 15.6% and sediment yield by 78.4% [11]. Lenka et al. [12] suggested that hedgerows reduced runoff by 33% and sediment yield by 35% relative to those in treatments without hedgerows in eastern India. Grass ditches are another measure commonly adopted to reduce runoff-related and sediment-bound nutrient losses, owing to their low construction costs (Figure 1c). Grass ditches have good ecological benefits on sloping lands because they can strongly intercept runoff flow, lower flow velocity [13], and remove sediment yield [14], chemical substances [15], nutrients [16], and organic matters from runoff [17]. Martin et al. [4] suggested that sites with greater vegetation coverage in agricultural ditches in northeastern Arkansas had lower sediment and nutrient loadings. Lucke et al. [13] suggested that 30 m long grass swales could reduce the mean total flow by 52% on the Sunshine Coast of Australia. Kumwimba et al. [18] observed an average reduction of 44% for total nitrogen over the winter in vegetated agricultural drainage ditches on purple soil sloping lands. Major efforts have been made to investigate the impacts of hedgerow and/or grass ditches on runoff and sediment yield, respectively. However, the effectiveness of hedgerow–grass ditch systems in decreasing the yield of runoff and sediment has rarely been assessed.
The Three Gorges Reservoir Area (TGRA) has a vital ecological function in China (Figure 1a). A total of 78.7% of the sloping land in the TGRA is purple soil sloping land and is characterized by sensitivity and vulnerability to soil erosion [19], as a result of the large sloping lands and concentrated rainfall. Meanwhile, high-intensity rainfall can also cause severe rill erosion on sloping land. Revegetation can control soil erosion and rill development on sloping land by slowing down raindrop impact and soil splashing [20]. Previous studies have shown that combined measures are often more conducive to controlling soil and water than independent measures [21]. The independent impacts of hedgerow and/or grass ditches on the losses of runoff nutrients on sloping lands in the TGRA are well known, whereas the influences of combined hedgerow–grass ditch systems on runoff and sediment yield remain unclear. Determining the efficiency of combined hedgerow–grass ditch systems is important for conserving runoff and sediment yield on sloping lands, considering agricultural disturbance and the changing climate [22].
In this study, a combined hedgerow–grass ditch system was constructed on laboratory-simulated sloping land. The effects of various vegetation stem diameters (Figure 1d) in the hedgerow–grass ditch system on runoff and sediment yield were revealed using rainfall simulation tests. The following hypotheses were tested: (1) the large stem diameter of hedgerows markedly reduces the yield of runoff and sediment in hedgerow–grass ditch systems, and (2) stem diameter is significantly related to sediment yield. The goals of this study were to (1) investigate the influence of vegetation stem diameter on runoff and sediment yield and (2) quantify the relations between stem diameter and runoff as well as sediment yield in hedgerow–grass ditch systems.

2. Materials and Methods

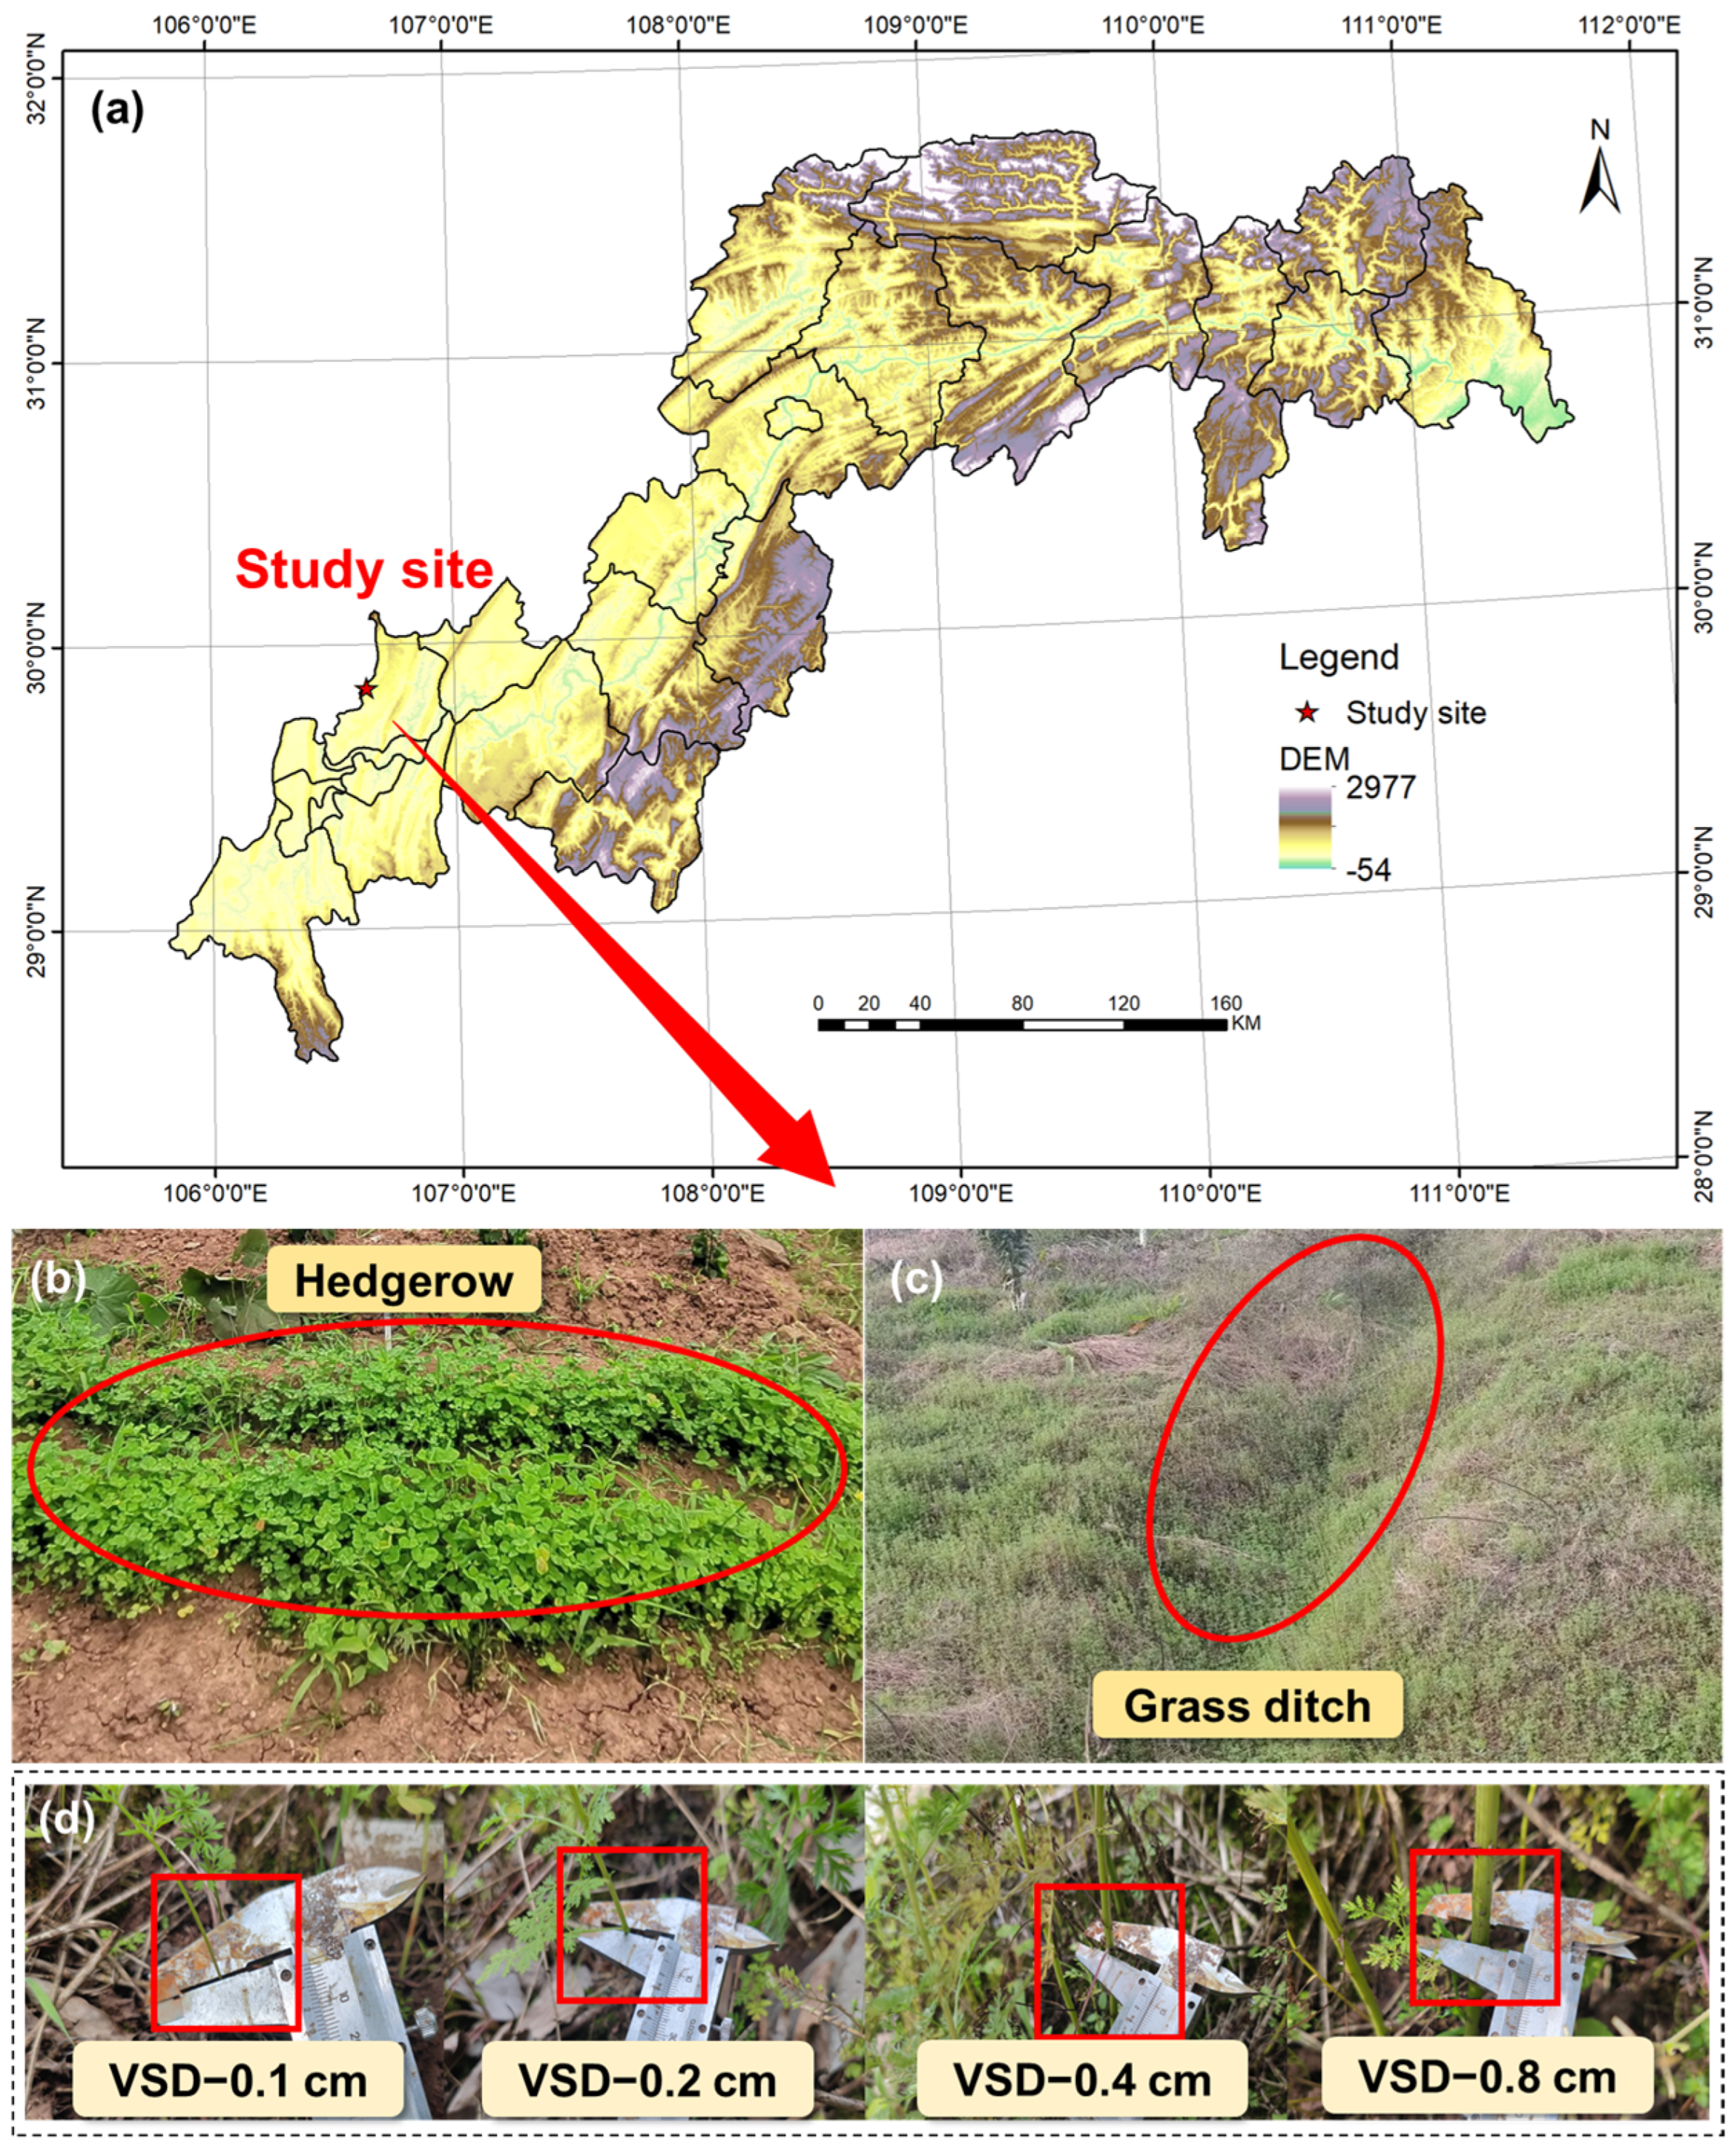
2.1. Soil and Rainfall Simulator

The tested soil was Regosols, based on the IUSS Working Group WRB [23]. The soil was obtained from a representative sloping land with a gradient of 15° experiencing long-term wheat (Triticum aestivum L.) and maize (Zea mays L.) in Beibei District, Chongqing Municipality, Southwestern China (106°24′20″ E, 29°48′42″ N) [24], which is representative and typical in the TGRA. The region has a typical subtropical warm and humid monsoon climate, with an average annual temperature of 18.6 °C and an average annual rainfall of 1173.6 mm, while the peak rainfall intensity in the TGRA ranges from 55 to 110 mm h−1 [11]. TGRA has an existing cultivated land area of 3,891,000 km2, of which more than 69% is cultivated land with purple soil sloping land, and the area of slopes larger than 15° accounts for 53.87%. Therefore, the slope with hedgerow was selected as 15°. In addition, the grass ditch was connected to the slope by a hedgerow and was needed to guide the runoff, so the slope gradient should be greater than the slope of the slope. If the slope is too small, it can cause water to pool and affect drainage. If the slope is too large, it can cause the water flow rate to become too fast and damage the ditch walls. Therefore, in this study, the grass ditch was selected to be set at 16° based on the slope gradient of 15° at the study site.
The soil was sampled to a depth of 0–20 cm at the sampling site using handheld instruments and sent to the laboratory. Prior to laboratory rainfall simulation, soil samples brought to the laboratory were manually cleared of stones and other impurities, dried naturally, and passed through a 10 mm sieve. The tested soil properties are presented in Table 1.
The rainfall simulator used in this experiment was a single lateral sprinkler system that can be used in pairs. When used in pairs, the two nozzles were separated horizontally by 1.5 m and vertically by 4 m from the soil surface to allow for the formation of an effective rainfall area of 8 m × 3 m. Later, both the water pressure and the size of the circular holes in the nozzles were varied, allowing rainfall intensities of 30–230 mm h−1 to be achieved. This allowed the simulation to be similar to natural rainfall and to achieve an 80% uniformity factor [9].

2.2. Experiment Design

The hedgerow–grass ditch system comprised two adjustable soil flumes, and their bottoms were permeable. One soil flume (4.8 m long, 0.5 m wide, and 0.4 m deep) was used to simulate the hedgerow slope with a slope gradient of 15°. Soil samples were compacted in layers in this soil flume (20 cm soil depth in total) over 5 cm intervals to standardize a bulk density of 1.25 g cm−3. The soil surface was gently treated to make it smooth and parallel to the plane of the flume. As described by Bai et al. [25], hedgerows were placed on the upper, middle, and lower portions of the slope, and it was found that the hedgerow-located lower portion of the slope intercepted more runoff and sediment yield; therefore, the hedgerow strip was laid out 0.5 m from the end of the soil flume and had an area of 0.25 m2 (0.5 m × 0.5 m) in this study. To investigate the response of runoff and sediment yield to variable stem diameters, imitation plastic stems were used to simulate a hedgerow with a height of 15 cm. The imitation plastic stems had analogous flexibility to natural stems and were reusable and allowed us to control the vegetation coverage and stems. According to the growth principles of typical natural hedgerow vegetation, the VSD was set to 0 (control), 0.1, 0.2, 0.4, and 0.8 cm (Figure 2c). To simulate the hedgerow vegetation grown in the soil, 10 individual stems were tied to one another and inserted into the soil at an underground depth of 5 cm. A total of 150 individual vegetation types in the hedgerow strip were used in each experiment.
The other soil flume (2 m long, 0.5 m wide, and 0.4 m deep) was used to simulate a grass ditch with a slope gradient of 16°. Soil samples were also compacted in layers in this soil flume (20 cm soil depth in total) over 5 cm intervals. The soil bulk density was 1.35 g cm−3 in the grass ditch. Unlike the hedgerow slope, the topsoil was carefully reshaped into a parabolic-shaped ditch filled with grass. Shen et al. [26] have shown that parabolic-shaped ditches with grass growing in them are widely used and less constrained. Similarly, 10 individual stems were used and tied using ties, obtaining grass (0.5 cm in stem diameter) grown in soil with an underground depth of 5 cm. The grass ditch was maintained at a constant stem diameter (0.5 cm) and canopy cover (80%) in the grass ditch for all experiments (Figure 2a,b). The two flumes were connected by a rectangular stainless-steel trough (0.3 m × 0.5 m). A “V-shaped” collecting trough fixed at the epilog of the hedgerow–grass ditch system was used to direct the runoff flow into a plastic bucket (Figure 2a,b).
Preliminary rainfall simulation with a 30 mm h−1 rainfall intensity was executed to saturate the tested soil. A plastic film was used to mulch the soil, preventing evaporation of water and allowing for redistribution of soil water within 24 h of settlement. The official rainfall simulation was conducted under a fixed rainfall intensity of 120 mm h−1. Each treatment was replicated twice. This resulted in a total of 10 rainfall simulations creating 5 independent samples (1 rainfall intensity × 1 combined slope gradient for the hedgerow–grass ditch system × 5 vegetation stem diameters for the system). The mulched plastic film was removed when the rainfall simulation was initiated. The initiated time of the simulated rainfall and the time to runoff initiation was recorded by a stopwatch. Each simulated rainfall experiment was fixed to last for 60 min. Runoff and sediment were sampled at 2 min intervals for the first 10 min and 5 min intervals were adopted for the last 50 min. The volume of runoff and sediment in the plastic bucket was determined. A clean plastic bottle with a volume of 590 mL was used to sample the runoff and sediment after thorough stirring. At the end of the simulated rainfall, the width and depth of the rill formed on the slopes were measured with a ruler at the head of the rill, in the middle of the rill, and at the bottom of the rill. The average width and depth of the rill were obtained by averaging the three measurements.

2.3. Measurements and Calculation

The plastic bottle-bearing runoff and sediment samples were permitted to stand until the supernatant was filtered. The remaining sediment sample was oven-dried to obtain the sediment mass.
The runoff and sediment variables were converted using Equations (1)–(3):
RR = v i V i × V S · T × 10 3
S c = s i V i
SR = s i V i × V S · T
where RR (mm min−1) is the runoff rate; vi (mL) is the runoff volume in the plastic bottle in each time interval; Vi (mL) is the volumes of runoff and sediment sample obtained using plastic bottle after mixing the runoff and sediment in the plastic bucket, which was equal to 590 mL; V (mL) is the total volumes of mixed samples in the plastic bucket at each time interval; and T (min) is the time interval for sampling; S (m2) is the area of the soil flume, si (g) is the sediment yield in the plastic bottle, Sc (g mL−1) is the sediment concentration, and SR (g min−1 m−2) is the sediment yield rate; 10−3 is the conversion factor.
The reductions in runoff and sediment yield for different stem diameters compared to those of the control were computed using Equations (4)–(6).
R R a = R 0 R a R 0 × 100 %
R S a = S 0 S a S 0 × 100 %
R S ca = SC 0 SC a SC 0 × 100 %
where RRa (%) is the runoff reduction; R0 (mL) is the runoff production for the control; Ra (mL) is the runoff production at 0.1, 0.2, 0.4, and 0.8 cm VSD. RSa (%) is the sediment yield reduction. S0 and Sa (g) denote the sediment yield in control and in treatments with shifted stem diameters (i.e., 0.1, 0.2, 0.4, or 0.8 cm VSD). RSca (%) is the sediment concentration reduction. SC0 and SCa (g mL−1) indicate the sediment concentration in control and in treatments with shifted stem diameters (i.e., 0.1, 0.2, 0.4, or 0.8 cm VSD).

2.4. Statistical Analysis

The changes in the runoff rate, sediment concentration, and sediment yield rate among various treatments were determined using a one-way analysis of variance, and Tukey’s post hoc multiple comparison test was conducted. Regression analysis was implemented to coordinate the relations between stem diameter and runoff rate, sediment concentration, and sediment yield rate. A p < 0.05 was identified as statistically significant. The SPSS 22.0 was run to perform statistical analyses, and the SigmaPlot 15 was used to plot figures, except Figure 1 and Figure 2.

3. Results

3.1. Rainfall and Soil Erosion Process Simulation

The time to runoff initiation presented a significant delay at 0.8 cm VSD, which was 43.3% longer than the control and 35%, 35%, and 32% longer than the other treatments, respectively (p < 0.05). The accumulated runoff at 0.2 and 0.8 cm VSD was significantly reduced by 16.6% and 17.0% compared to the control. Furthermore, the accumulated sediment production in 0.4 and 0.8 cm VSD significantly reduced by 74.2% and 85.7% compared to the control (Table 2).
In response to all treatments, the runoff rate fluctuated, increased, and then stabilized with the rainfall duration (Figure 3a). The average runoff rate for the control (1.5 ± 0.1 mm min−1) was 19.9% and 20.4% higher than that at 0.2 cm (1.2 ± 0.0 mm min−1) and 0.8 cm (1.2 ± 0.1 mm min−1) VSD, respectively (p < 0.05), but did not significantly differ from that at 0.1 cm (1.4 ± 0.0 mm min−1) and 0.4 cm (1.3 ± 0.1 mm min−1) VSD (Figure 4a).
In response to all treatments, the sediment concentration elevated and then reduced with the rainfall duration (Figure 3b). The average sediment concentration for the control (0.08 ± 0.01 g mL−1) did not significantly differ from that for the 0.1 cm (0.07 ± 0.03 g mL−1) and 0.2 cm (0.07 ± 0.01 g mL−1) VSD, but it was 253.6% and 618.1% higher than that associated with the 0.4 cm (0.02 ± 0.00 g mL−1) and 0.8 cm (0.01 ± 0.00 g mL−1) (p < 0.05) VSD, respectively (Figure 4b).
The sediment yield rate elevated and reduced during the simulated rainfall in these treatments (Figure 3c). The average sediment yield rate for the control (201.0 ± 2.1 g m−2 min−1) did not significantly differ from that for the 0.1 cm (194.0 ± 55.5 g m−2 min−1) and 0.2 cm (173.0 ± 23.6 g m−2 min−1) VSD but was 287.3% and 601.7% higher than that associated with the 0.4 cm (51.9 ± 3.9 g m−2 min−1) and 0.8 cm (28.6 ± 5.2 g m−2 min−1) VSD (p < 0.05), respectively (Figure 4c).
The average rill depth for the control was 23.9%, 49.6%, 61.6%, and 92.6% higher than that at 0.1 cm (108.8 ± 1.0 mm), 0.2 cm (90.1 ± 5.3 mm), 0.4 cm (83.4 ± 6.4 mm) and 0.8 cm (70.0 ± 5.6 mm) VSD (p < 0.05), respectively (Figure 5a). However, the average rill width at 0.8 cm (183.4 ± 2.8 mm) VSD was 45.1%, 36.5%, 36.1%, and 22.9% higher than that of the control (126.4 ± 2.3 mm), 0.1 cm (134.4 ± 8.7 mm), 0.2 cm (134.8 ± 5.2 mm), and 0.4 cm (149.2 ± 4.0 mm) VSD (p < 0.05), respectively (Figure 5b).

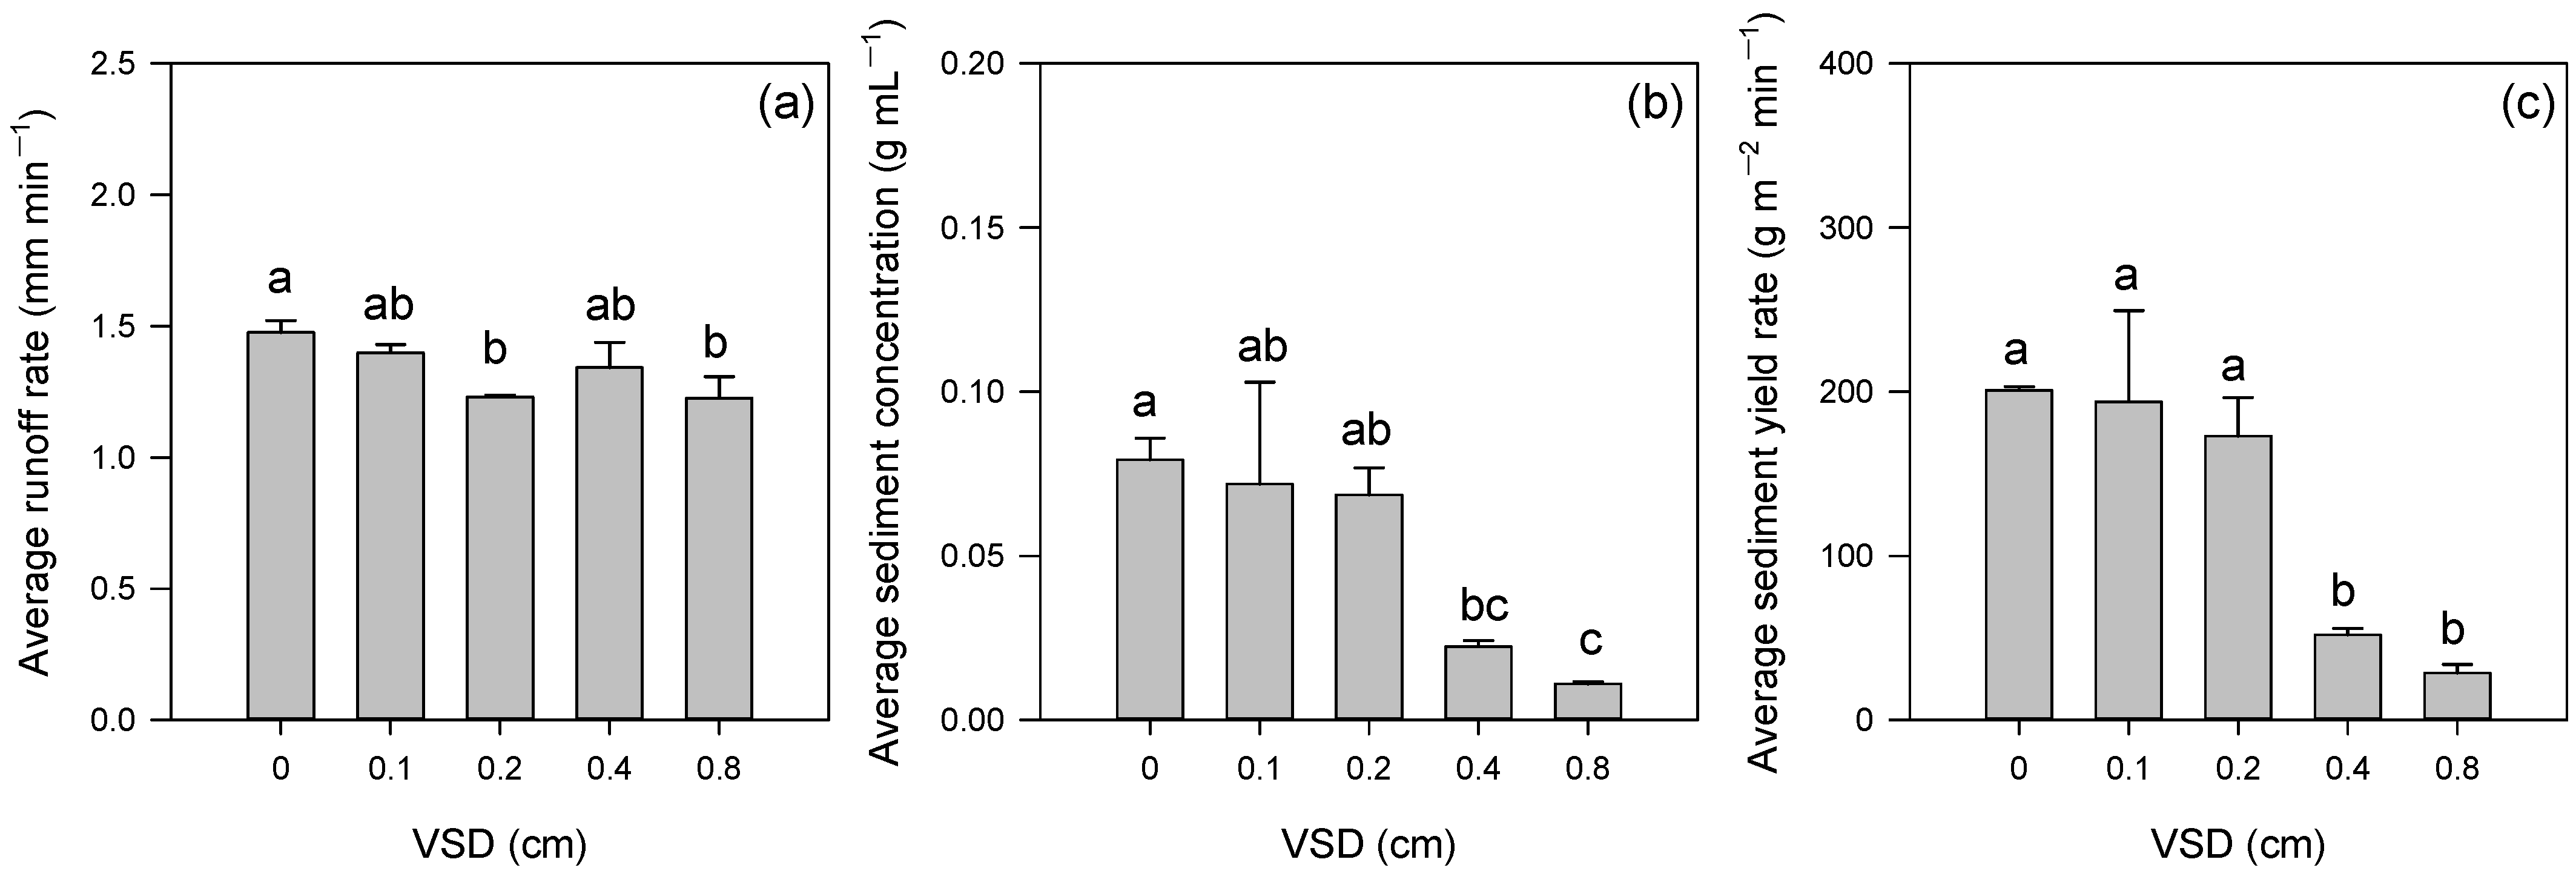
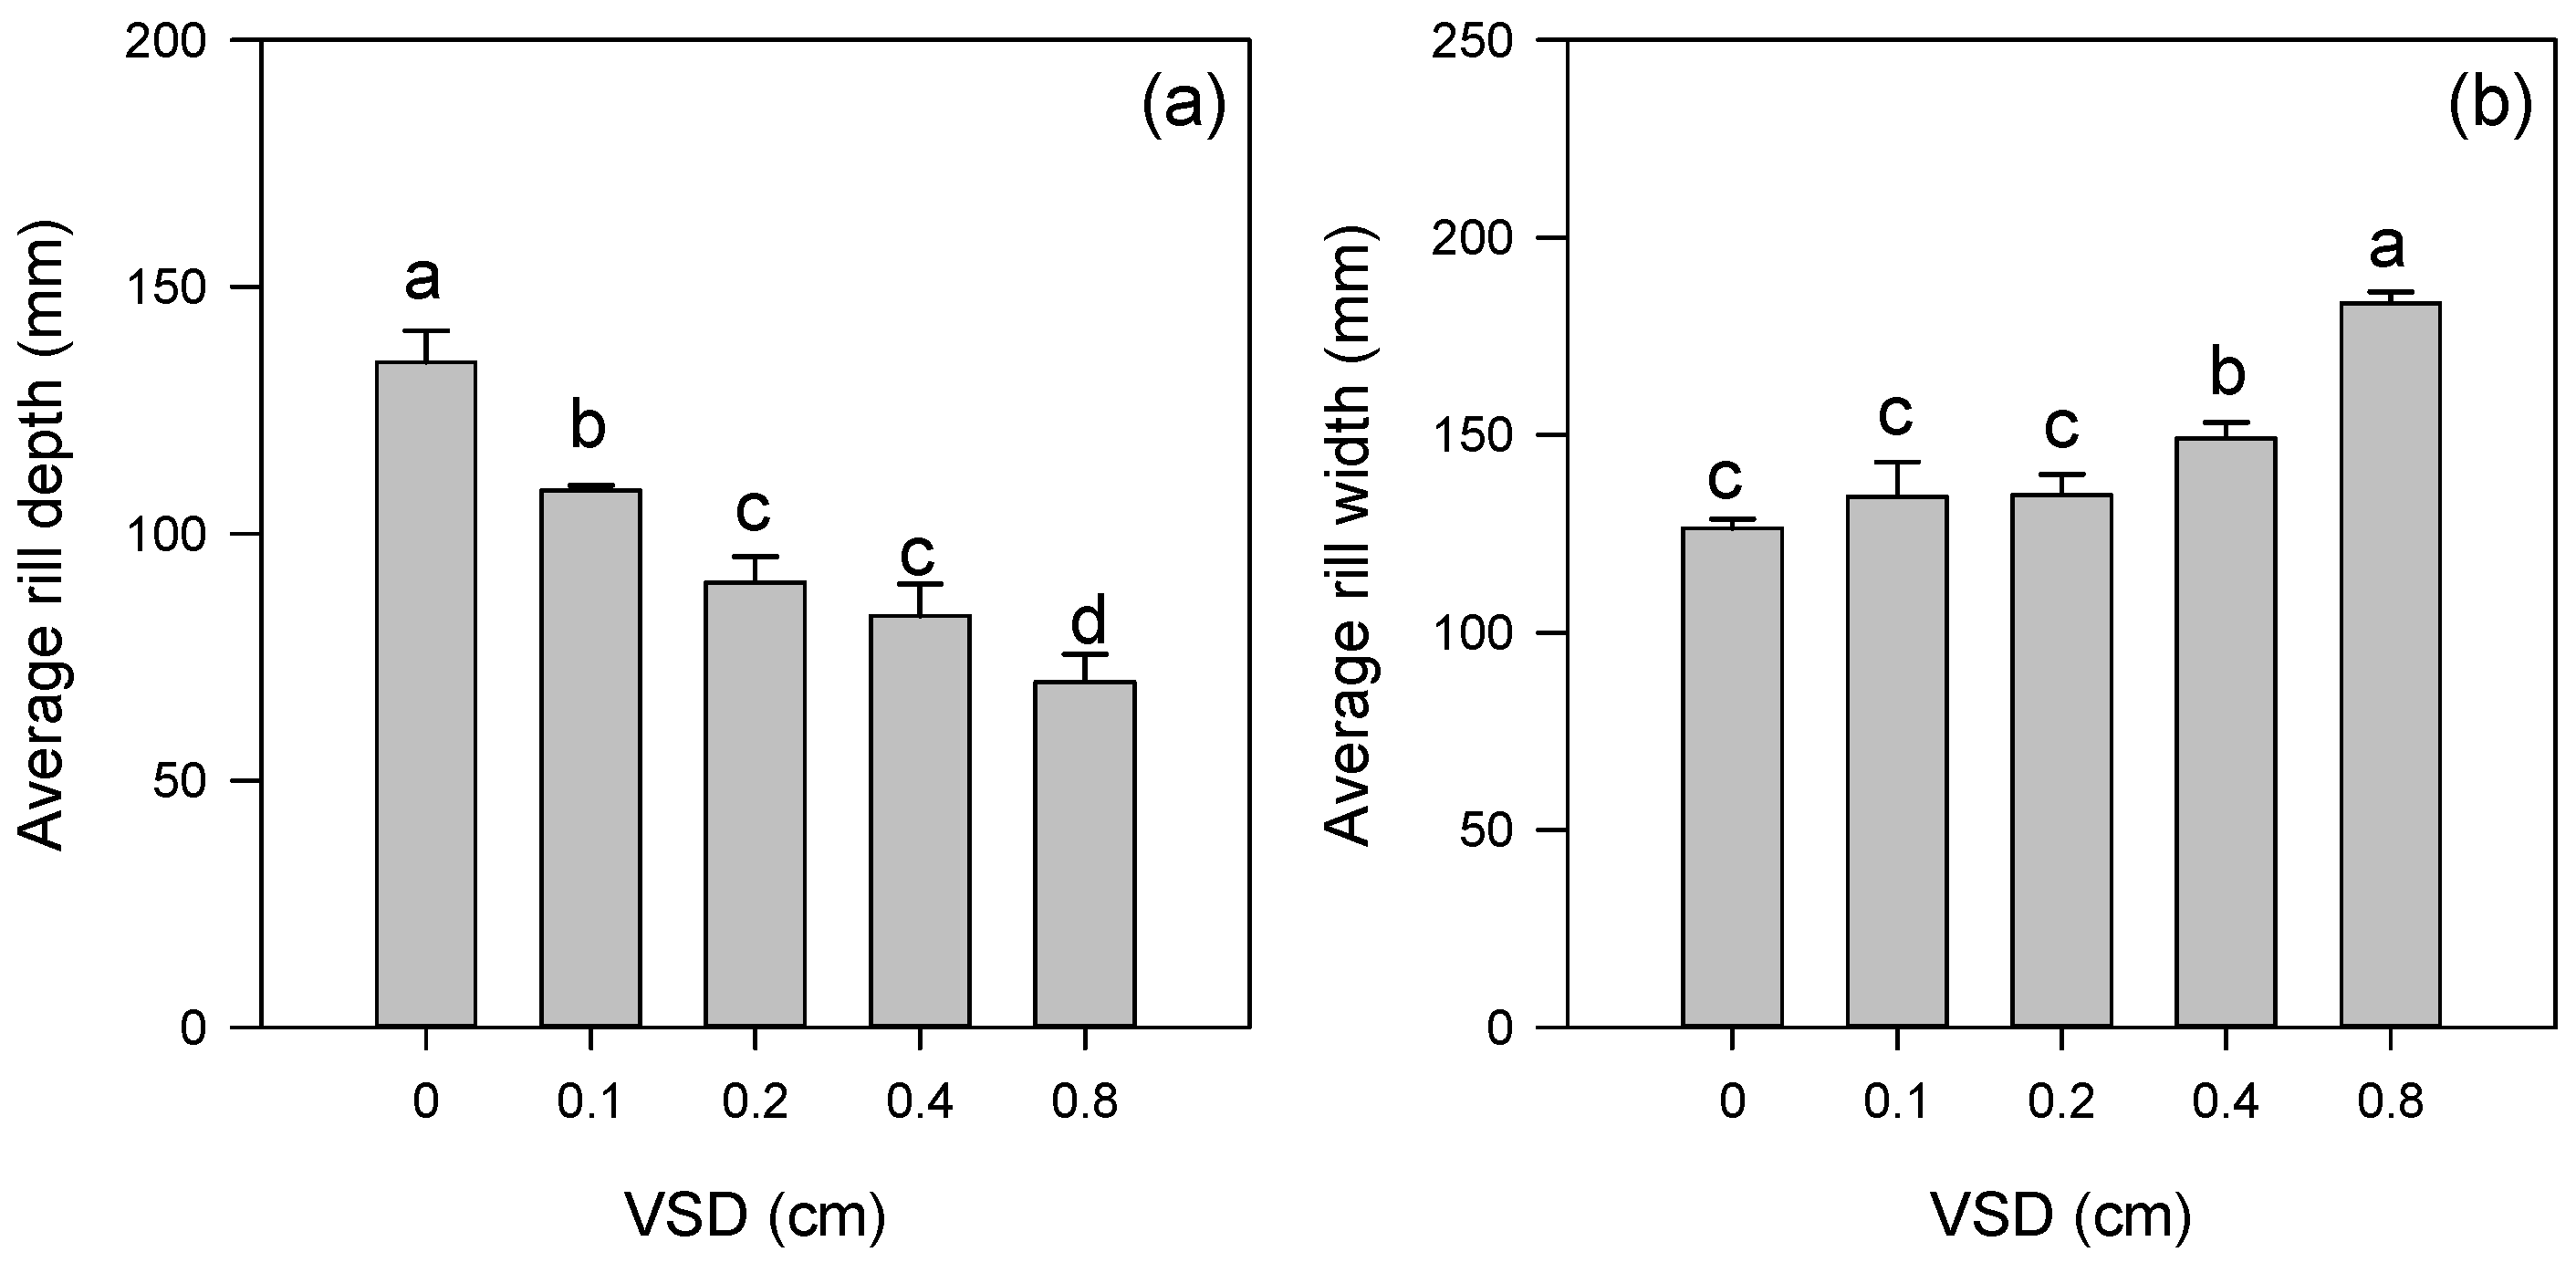
3.2. Reduction in Runoff and Sediment Yield

The reduction in the runoff rate was largest at 0.8 cm VSD (17.0%) and was 222.2%, 2.1%, and 88.3% larger than that at 0.1, 0.2 and 0.4 cm VSD, respectively. The reduction in the sediment concentration at 0.8 cm VSD (86.1%) was 821.5%, 539.5%, and 20.0% larger than that at 0.1, 0.2, and 0.4 cm VSD, respectively. The reduction in the sediment yield rate was largest at 0.8 cm VSD (85.8%) and was 2364.1%, 515.1%, and 15.6% larger than that at 0.1, 0.2, and 0.4 cm VSD, respectively. The reduction in the accumulated runoff was the largest at 0.8 cm VSD, and this was also true for the reduction in the accumulated sediment production (Table 3).

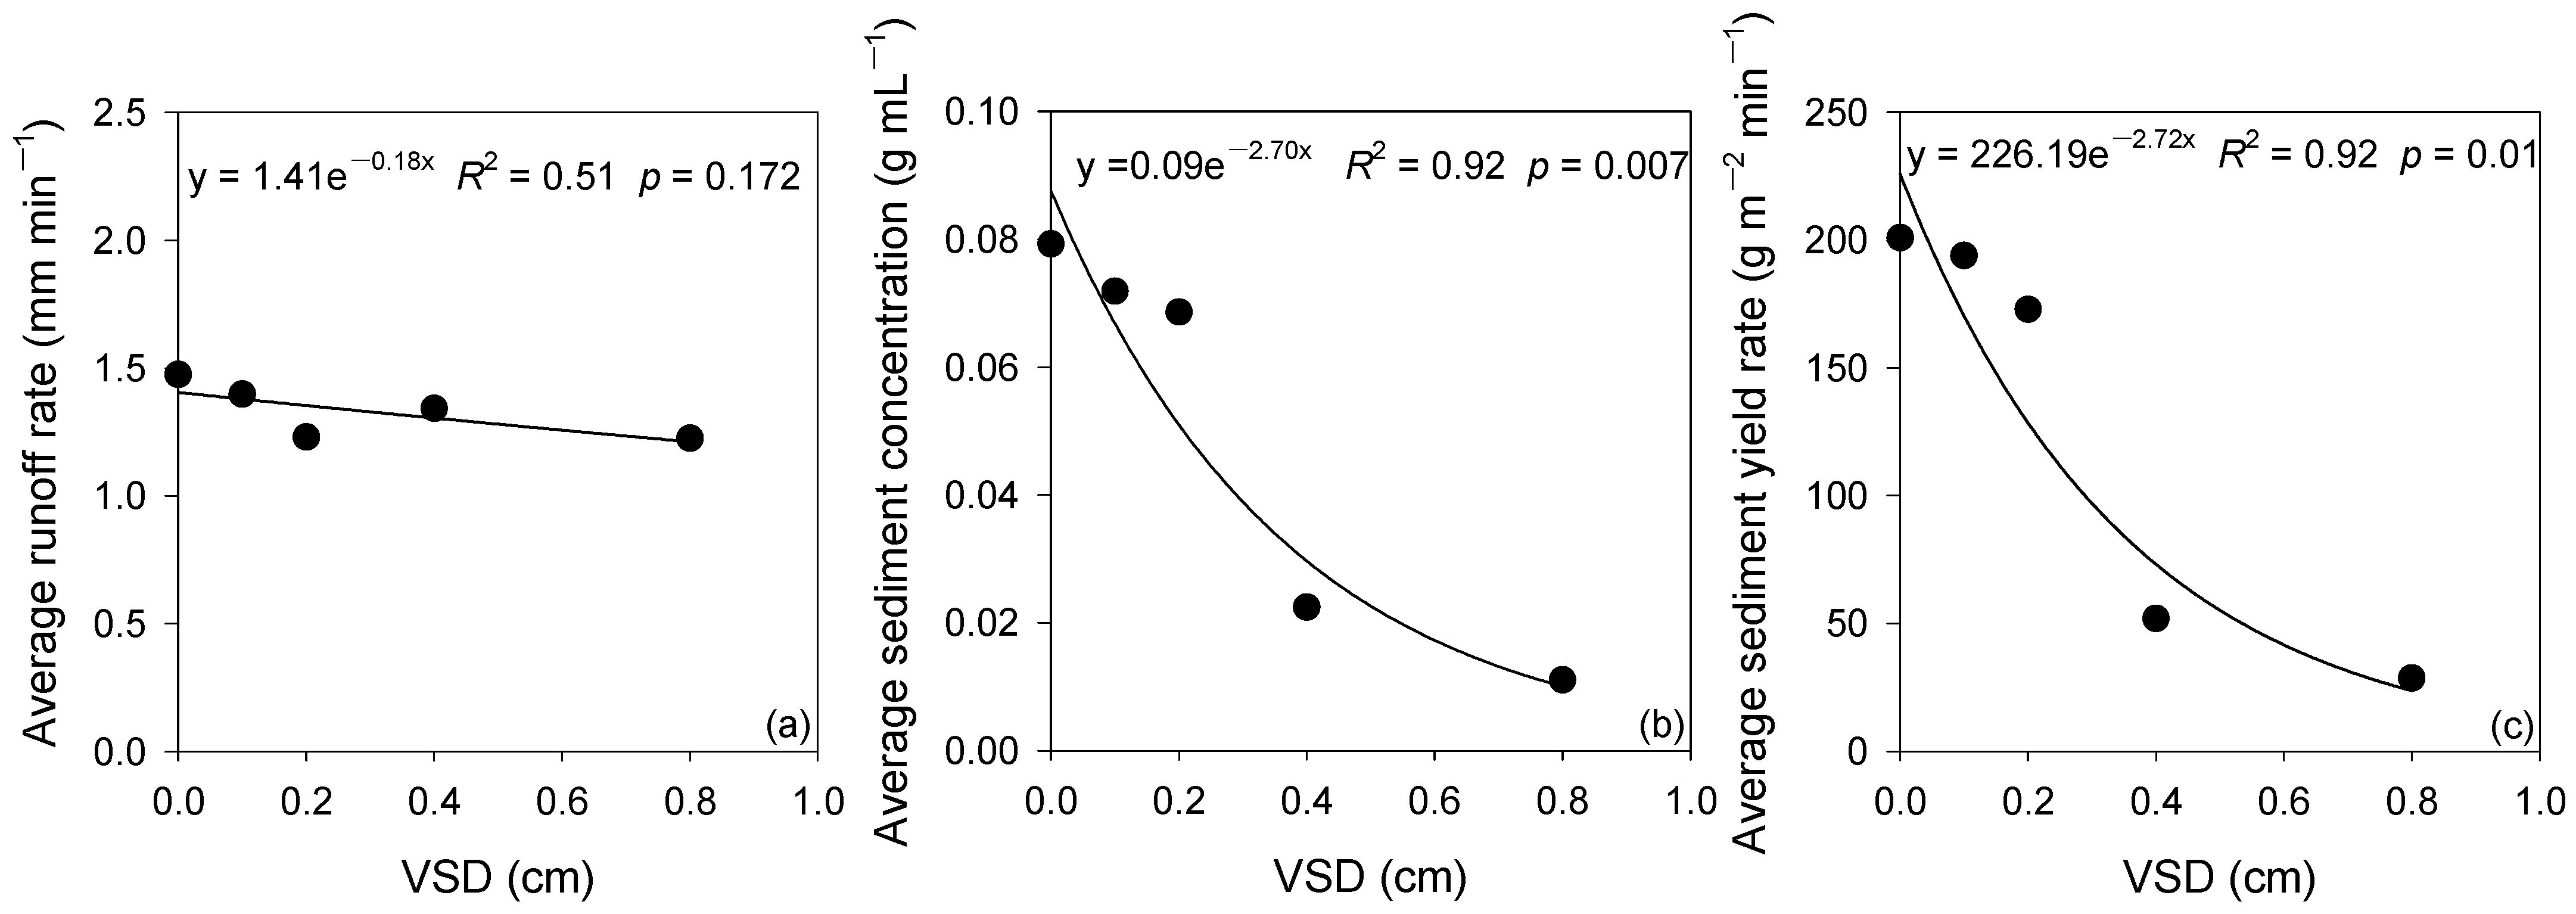
3.3. Runoff and Sediment Yield Indicators and VSD Model

The VSD was significantly negatively correlated with the average sediment concentration and average sediment yield rate (p < 0.05) (Table 4). Regression analysis revealed that average sediment concentration and average sediment yield rate decreased as an exponential function with the increase in the VSD (Figure 6).
The runoff rate exhibited marked positive relations with the sediment concentration for 0.1 cm VSD and with the sediment yield rate for the control, 0.1 cm, and 0.8 cm VSD (p < 0.05). The runoff rate displayed a significant positive relation with sediment concentration in 0.4 cm VSD (p < 0.01) (Table 5). Regression analysis revealed that the runoff rate showed a linear relationship with the sediment concentration and sediment yield rate (Table 6).

4. Discussion

The time to runoff initiation was significantly delayed as the VSD increased. This finding supported the results of Yao et al. [5]. Yao et al. [5] found that the time to runoff initiation was delayed with the increase in VSD when alfalfa was planted as the hedgerow on the sloping land. This was because the larger the VSD, the greater the coverage of vegetation growth. A previous study has found that as hedgerow coverage increases, it changes the flow rate, reduces the kinetic energy of raindrops, and affects the hydrodynamics on slopes [27], thus increasing the time to runoff initiation and prolonging the runoff water retention time on sloping lands.
The runoff rate elevated and then stabilized with the rainfall duration. This change was similar to that observed in previous studies [27,28,29]. Sun et al. [27] found that the runoff rate elevated and then fluctuated under different scouring rates on the slope with alfalfa. In addition, with rainfall duration, an increased and decreased trend was found for study sediment variables. This finding was supported by a previous discovery by Shi et al. [30]. This is because the topsoil is loose and very easily carried away by the surface runoff on the slope, resulting in a higher sediment concentration in the early stage of rainfall. Subsequently, the rill then developed well and the soil was completely saturated, resulting in stable runoff, and coupled with the interception effect of vegetation stem, the sediment yield gradually decreased [31]. In contrast, Bai et al. [25] found that the sediment yield sharply increased and stabilized on the slope–gully system. This may be because the grass ditch was not deployed on the slope–gully system in the study by Bai et al. [25], so there was no significant decreasing trend.
Our discoveries also evidenced that a larger VSD significantly decreases the runoff production and sediment yield in hedgerow–grass ditch systems. This was because the VSD could change the flow velocity and energy [6,32], thereby affecting the runoff capacity, causing migration of runoff and sediment yield. Lou et al. [7] conducted a simulated scouring experiment and reported that a raised VSD significantly reduced the flow velocity, reflecting the reduced transport capacity of the flow as impacted by the vegetation stem. The flow reduced the transport capacity and led to impeded detachment and transportation of soil particles [33], which reduced the undercut rill erosion at the bottom of the rill, and the rill depth did not continue to increase [9]. This is also consistent with studies showing that the average rill depth decreases as the VSD increases.
The hedgerow–grass ditch system could decline the runoff and sediment yield relative to the system without a hedgerow, indicating that the hedgerow–grass ditch reduced more runoff and sediment yield than independent grass ditch systems, which was consistent with previous findings [21,34]. Bai et al. [34] suggested that combined vegetation and check dams in a slope–gully system reduced runoff and sediment yield more than independent check dams. Moreover, with an increase in stem diameter, the reductions in runoff and sediment yield were considerably enhanced. Yao et al. [5] reported that, with the growth of alfalfa, stem–leaf system runoff and sediment yield were decreased by 7.8–78.2% and 14.3–89.0%, respectively. Lin et al. [35] reported 43.8–83.4% and 86.7–98.2% reductions for runoff and sediment yield, respectively, as stems thickened. These results were partially supported by our findings displaying a 13.7–87.5% reduction in sediment yield and a 5.6–19.3% reduction in runoff, implying that the reduction in sediment yield was more sensitive than the runoff with regard to the changes in vegetation stem diameter owing to the physical interception [36,37].
Stem diameter was not significantly related to runoff but was negatively correlated with the sediment variables as an exponential relation (Table 4, Figure 6), indicating that stem diameter is a critical factor in altering the sediment yield on sloping lands. Ding and Li [38] also suggested that the sediment yield rate was significantly negatively linked to grass coverage as an exponential relation. Notably, a reduction in sediment yield does not significantly increase when vegetation coverage develops [39], suggesting that a threshold exists that hinders the improvement of vegetation benefits [40]. The threshold value for vegetation coverage in semiarid regions of southeastern Australia and northern Mexico is 10% [41], whereas it is 30% in the Mediterranean region [42]. In the Loess Plateau, 65% vegetation coverage has been reported to effectively control soil erosion [43]. These findings suggest that the stem diameter threshold may affect sediment yield reduction. Our study indicated that the variations in runoff and sediment yield at 0.4 and 0.8 cm stem diameters were not considerable, indicating a potential threshold value for the stem diameter of the hedgerow–grass ditch system to regulate soil erosion. Moreover, considering the natural and economic conditions of the TGRA supports the idea that the vegetation stem diameter threshold can maximize the benefits of hedgerow–grass ditch systems for soil and water conservation.
Additionally, a significant positive relation was detected between the runoff rate and sediment yield, as well as the sediment concentration. This was in agreement with the discoveries of Bai et al. [34] and Han et al. [31]. However, the runoff rate and sediment concentration were significantly negatively correlated when the VSD was 0.4 cm. This was similar to the negative correlation between sediment concentration and runoff rate under variable vegetation coverages as found by Ding et al. [37]. This suggests that changes in stem diameter can significantly alter the relationship between runoff and sediment concentration, which, in turn, affects soil separation, transport, and deposition on slopes [44]. In summary, stem diameter is an important factor in soil erosion control measures, and it is vital to explore the impacts of vegetation stem diameter on the runoff and sediment yield of hedgerow–grass ditch systems.
Our findings suggested that a larger stem diameter in hedgerows may reduce yielded runoff and sediment in hedgerow–grass ditch systems. However, the variations in runoff and sediment yield at 0.4 and 0.8 cm stem diameters were not considerable. In the future, we may consider controlling the vegetation stem diameter to explore its specific threshold for further exploration, and stem diameters in hedgerow and grass ditches following the life cycles of vegetation also should be considered. Furthermore, to immediately understand the impact of different stem diameters on the runoff and sediment yield of hedgerow–grass ditch systems, the test soil was manually treated. This created discrepancies in the soil conditions between the laboratory and field. Consequently, further field observations are needed to interpret the impacts of vegetation stem diameter on runoff and sediment yield in hedgerow–grass ditch systems and to determine the optimized patterns that maximize the ecological and economic benefits of these combined systems.

5. Conclusions

In this study, laboratory rainfall simulations were used to reveal runoff and sediment yield at different VSDs in a hedgerow–grass ditch system. Reductions in the runoff rate, sediment concentration, and sediment yield rate in the hedgerow–grass ditch system under different VSDs reached 5.3–17.0%, 9.3–86.1%, and 3.5–85.8%, respectively. In addition, the sediment concentration and sediment yield rate declined as an exponential relation with the raised stem diameter. Our results notarize the feasibility of hedgerow–grass ditch systems for lowering runoff and sediment yield from sloping land. This study provides a new composite measure: a hedgerow–grass ditch system, which is valuable for optimizing strategies for controlling soil erosion on sloping lands worldwide.

Author Contributions

Conceptualization, L.S., Y.B., T.L. and B.H.; methodology, Q.B.; software, L.S.; validation, Y.B. and T.L.; formal analysis, L.S. and Y.L.; investigation, L.S., Y.L. and X.Z.; resources, L.S. and Y.B.; data curation, Y.B. and Q.B.; writing—original draft preparation, L.S.; writing—review and editing, T.L. and B.H.; visualization, T.L. and B.H.; supervision, T.L. and B.H.; project administration, T.L. and B.H.; funding acquisition, B.H. All authors have read and agreed to the published version of the manuscript.

Funding

This study received the financial supports from the National Natural Science Foundation of China (U20A20326), the Technology Innovation and Application Development Project of Chongqing, China (CSTB2022TIAD-GPX0043), the Major Science and Technology Project of the Ministry of Water Resources, China (SKS-2022078), the Graduate Student Research and Innovation Program of Chongqing, China (CYS22209), and the Innovation and Entrepreneurship Training Program for College Students (S202310635182).

Data Availability Statement

No new data were created or analyzed in this study.

Conflicts of Interest

The authors declare no conflicts of interest.

References

  1. Li, X.; Zhang, Y.F.; Ji, X.D.; Strauss, P.; Zhang, Z.Q. Effects of shrub-grass cover on the hillslope overland flow and soil erosion under simulated rainfall. Environ. Res. 2022, 214, 113774. [Google Scholar] [CrossRef] [PubMed]
  2. Kervroëdan, L.; Armand, R.; Saunier, M.; Faucon, M. Effects of plant traits and their divergence on runoff and sediment retention in herbaceous vegetation. Plant Soil 2019, 441, 511–524. [Google Scholar] [CrossRef]
  3. Eshghizadeh, M.; Talebi, A.; Dastorani, M. Thresholds of land cover to control runoff and soil loss. Hydrol. Sci. J. 2018, 63, 1424–1434. [Google Scholar] [CrossRef]
  4. Martin, E.R.; Godwin, I.A.; Cooper, R.I.; Aryal, N.; Reba, M.L.; Bouldin, J.L. Assessing the impact of vegetative cover within Northeast Arkansas agricultural ditches on sediment and nutrient loads. Agric. Ecosyst. Environ. 2021, 320, 107613. [Google Scholar] [CrossRef]
  5. Yao, C.; Chen, K.B.; Zhang, Q.W.; Wang, C.F.; Lu, C.; Wang, H.; Wu, F.Q. The contribution rate of stem-leaf and root of alfalfa (Medicago sativa L.) to sediment and runoff reduction. Land Degrad. Dev. 2023, 34, 3991–4005. [Google Scholar] [CrossRef]
  6. Salamn, M.; Manochehr, G.; Ali, J. Effect of rock fragments cover on distance of rill erosion initiation and overland flow hydraulics. Int. J. Soil Sci. 2012, 7, 100–107. [Google Scholar] [CrossRef]
  7. Lou, Y.B.; Kang, H.L.; Wang, W.L.; Guo, M.M.; Zhu, Y.N.; Feng, L.Q.; Shi, Q.H.; Guo, W.Z.; Xu, W.X. Effects of vegetation stem coverage on the hydraulic characteristics and on-wall and jet flow proportions at the gully head. Catena 2023, 229, 107201. [Google Scholar] [CrossRef]
  8. Cen, Y.D.; Zhang, K.D.; Peng, Y.; Rubinato, M.; Zhang, H.Y.; Shang, H.X.; Li, P. Quantification of the effects on the flow velocity caused by gramineous plants in the Loess Plateau in North-Western China. Geoderma 2023, 429, 116264. [Google Scholar] [CrossRef]
  9. Tian, P.; Xu, X.Y.; Pan, C.Z.; Hsu, K.; Yang, T.T. Impacts of rainfall and inflow on rill formation and erosion processes on steep hillslopes. J. Hydrol. 2017, 548, 24–39. [Google Scholar] [CrossRef]
  10. Dunn, R.M.; Zhang, Y.S.; Blackwell, M.S.A.; Hawkins, J.M.B.; Collins, A.L. Impacts of different vegetation in riparian buffer strips on runoff and sediment loss. Hydrol. Process. 2022, 36, e14733. [Google Scholar] [CrossRef]
  11. Xiao, H.; Xiang, R.; Yan, R.B.; Xia, Z.Y.; Guo, P.; Gao, F.; Zhang, W.Q.; Zhu, Z.E.; Dong, X.H.; Zhang, L.; et al. Evaluating the influences hedgerow on soil erosion and nitrogen loss of purple soil sloping farmland under simulated rainfall. Ecol. Indic. 2024, 158, 111438. [Google Scholar] [CrossRef]
  12. Lenka, N.K.; Dass, A.; Sudhishri, S.; Patnaik, U.S. Soil carbon sequestration and erosion control potential of hedgerows and grass filter strips in sloping agricultural lands of eastern India. Agric. Ecosyst. Environ. 2012, 158, 31–40. [Google Scholar] [CrossRef]
  13. Lucke, T.; Mohamed, M.A.K.; Tindale, N. Pollutant Removal and Hydraulic Reduction Performance of Field Grassed Swales during Runoff Simulation Experiments. Water 2014, 6, 1887–1904. [Google Scholar] [CrossRef]
  14. Li, X.N.; Zhang, W.W.; Zhao, C.Q.; Li, H.J.; Shi, R.S. Nitrogen interception and fate in vegetated ditches using the isotope tracer method: A simulation study in northern China. Agric. Water Manag. 2020, 228, 105893. [Google Scholar] [CrossRef]
  15. Kumwimba, M.N.; Meng, F.G.; Iseyemi, O.; Moore, M.T.; Bo, Z.; Tao, W.; Liang, T.J.; Ilunga, L. Removal of non-point source pollutants from domestic sewage and agricultural runoff by vegetated drainage ditches (VDDs): Design, mechanism, management strategies, and future directions. Sci. Total Environ. 2018, 639, 742–759. [Google Scholar] [CrossRef] [PubMed]
  16. Taylor, J.; Moore, M.; Speir, S.L.; Testa, S. Vegetated ditch habitats provide net nitrogen sink and phosphorus storage capacity in agricultural drainage networks despite senescent plant leaching. Water 2020, 12, 875. [Google Scholar] [CrossRef]
  17. Vymazal, J.; Březinová, T.D. Removal of nutrients, organics and suspended solids in vegetated agricultural drainage ditch. Ecol. Eng. 2018, 118, 97–103. [Google Scholar] [CrossRef]
  18. Kumwimba, M.N.; Zhu, B.; Wang, T.; Dzakpasu, M.; Li, X.Y. Nutrient dynamics and retention in a vegetated drainage ditch receiving nutrient-rich sewage at low temperatures. Sci. Total Environ. 2020, 741, 140268. [Google Scholar] [CrossRef]
  19. Gratien, N.; Li, H.; Bao, Y.H.; Jean, D.D.N.; Li, J.L.; Tite, N.; He, X.B. Soil aggregate disintegration effects on soil erodibility in the water level fluctuation zone of the Three Gorges Reservoir, China. Environ. Res. 2023, 217, 114928. [Google Scholar]
  20. Shi, Z.H.; Yue, B.J.; Wang, L.; Fang, N.F.; Wang, D.; Wu, F.Z. Effects of Mulch Cover Rate on Interrill Erosion Processes and the Size Selectivity of Eroded Sediment on Steep Slopes. Soil Sci. Soc. Am. J. 2013, 77, 257–267. [Google Scholar] [CrossRef]
  21. Are, K.S.; Oshunsanyab, S.O.; Oluwatosina, G.A. Changes in soil physical health indicators of an eroded land as influenced by integrated use of narrow grass strips and mulch. Soil Tillage Res. 2018, 184, 269–280. [Google Scholar] [CrossRef]
  22. Bah, H.; Zhou, M.H.; Ren, X.; Hu, L.; Dong, Z.X.; Zhu, B. Effects of organic amendment applications on nitrogen and phosphorus losses from sloping cropland in the upper Yangtze River. Agric. Ecosyst. Environ. 2020, 302, 107086. [Google Scholar] [CrossRef]
  23. IUSS Working Group. World Reference Base for Soil Resources. International Soil Classification System for Naming Soils and Creating Legends for Soil Maps, 4th ed.; International Union of Soil Sciences (IUSS): Vienna, Austria, 2022. [Google Scholar]
  24. Du, Y.N.; Li, T.Y.; He, B.H. Runoff-related nutrient loss affected by fertilization and cultivation in sloping croplands: An 11-year observation under natural rainfall. Agric. Ecosyst. Environ. 2021, 319, 107549. [Google Scholar] [CrossRef]
  25. Bai, L.L.; Shi, P.; Li, Z.B.; Li, P.; Zhao, Z.; Dong, J.B.; Cui, L.Z. Effects of vegetation patterns on soil nitrogen and phosphorus losses on the slope-gully system of the Loess Plateau. J. Environ. Manag. 2022, 324, 116288. [Google Scholar] [CrossRef]
  26. Shen, H.B.; Xu, Z.X.; Zhang, Q.; Zhang, S.H. Reduction of runoff-sediment-pollutants and correlation analysis in grass swale. J. Beijing Norm. Univ. (Nat. Sci.) 2019, 55, 641–647, (In Chinese with English Abstract). [Google Scholar]
  27. Sun, L.Q.; Zhang, B.; Yin, Z.M.; Guo, H.L.; Siddique, K.H.M.; Wu, S.F.; Yang, J.T. Assessing the performance of conservation measures for controlling slope runoff and erosion using field scouring experiments. Agric. Water Manag. 2022, 259, 107212. [Google Scholar] [CrossRef]
  28. Li, T.Y.; Li, S.Y.; Liang, C. The immediate effects of downslope cornstalk mulch (DCM) on sediment yield, runoff and runoff-associated dissolved carbon loss in a representative hillslope, Southwestern China. Catena 2019, 175, 9–17. [Google Scholar] [CrossRef]
  29. Duan, J.; Liu, Y.J.; Wang, L.Y.; Yang, J.; Tang, C.J.; Zheng, H.J. Importance of grass stolons in mitigating runoff and sediment yield under simulated rainstorms. Catena 2022, 213, 106132. [Google Scholar] [CrossRef]
  30. Shi, P.; Li, P.; Li, Z.B.; Sun, J.M.; Wang, D.J.; Min, Z.Q. Effects of grass vegetation coverage and position on runoff and sediment yields on the slope of Loess Plateau, China. Agric. Water Manag. 2022, 259, 107231. [Google Scholar] [CrossRef]
  31. Han, D.D.; Deng, J.C.; Gu, C.J.; Mu, X.M.; Gao, P.; Gao, J.J. Effect of shrub-grass vegetation coverage and slope gradient on runoff and sediment yield under simulated rainfall. Int. J. Sediment Res. 2021, 36, 29–37. [Google Scholar] [CrossRef]
  32. Mu, H.L.; Fu, S.H. Comparison of the influences of vegetation stem parameters on hydraulic variables and sediment transport capacity. Int. Soil Water Conserv. Res. 2023, 11, 135–144. [Google Scholar] [CrossRef]
  33. Mu, H.L.; Yu, X.J.; Fu, S.H.; Yu, B.F.; Liu, Y.N.; Zhang, G.H. Effect of stem basal cover on the sediment transport capacity of overland flows. Geoderma 2019, 337, 384–393. [Google Scholar] [CrossRef]
  34. Bai, L.L.; Shi, P.; Li, Z.B.; Li, P.; Zhao, Z.; Dong, J.B.; Cui, L.Z. Grass coverage and the runoff path length decreased by sedimentation have synergistic effects on runoff and sediment yields in a slope-gully system, revealed by rainfall simulation experiments. Catena 2022, 218, 106577. [Google Scholar] [CrossRef]
  35. Lin, Q.T.; Xu, Q.; Wu, F.Q.; Li, T.T. Effects of wheat in regulating runoff and sediment on different slope gradients and under different rainfall intensities. Catena 2019, 183, 104196. [Google Scholar] [CrossRef]
  36. Wang, L.H.; Yen, H.; Huang, C.H.; Wang, Y.F. Erosion and covered zones altered by surface coverage effects on soil nitrogen and carbon loss from an agricultural slope under laboratory-simulated rainfall events. Int. Soil Water Conserv. Res. 2022, 10, 382–392. [Google Scholar] [CrossRef]
  37. Ding, W.F.; Wang, X.K.; Zhang, G.H.; Meng, X.; Ye, Z.W. Impacts of grass coverage and arrangement patterns on runoff and sediment yield in slope-gully system of the Loess Plateau, China. Water 2023, 15, 133. [Google Scholar] [CrossRef]
  38. Ding, W.F.; Li, M. Effects of grass coverage and distribution patterns on erosion and overland flow hydraulic characteristics. Environ. Earth Sci. 2016, 75, 477. [Google Scholar] [CrossRef]
  39. Zhao, X.N.; Wu, P.T.; Chen, X.L.; Helmers, M.J.; Zhou, X.B. Runoff and sediment yield under simulated rainfall on hillslopes in the Loess Plateau of China. Soil Res. 2013, 51, 50–58. [Google Scholar] [CrossRef]
  40. Sepúlveda, R.B.; Carrillo, A.A. Soil erosion and erosion thresholds in an agroforestry system of coffee (Coffea arabica) and mixed shade trees (Inga spp. and Musa spp.) in Northern Nicaragua. Agric. Ecosyst. Environ. 2015, 210, 25–35. [Google Scholar] [CrossRef]
  41. Puigdefábregas, J. The role of vegetation patterns in structuring runoff and sediment fluxes in drylands. Earth Surf. Process. Landf. 2005, 30, 133–147. [Google Scholar] [CrossRef]
  42. Heras, M.M.L.; Merino-Martín, L.; Nicolau, J.M. Effect of vegetation cover on the hydrology of reclaimed mining soils under Mediterranean-Continental climate. Catena 2009, 77, 39–47. [Google Scholar] [CrossRef]
  43. Liu, X.Y.; Dang, S.Z.; Gao, Y.F.; Yang, S.T. The rule and threshold of the effect of vegetation change on sediment yield in the loess hilly region, China. J. Hydraul. Eng. 2020, 51, 505–518, (In Chinese with English Abstract). [Google Scholar]
  44. Pan, D.L.; Gao, X.D.; Dyck, M.; Song, Y.Q.; Wu, P.T.; Zhao, X.N. Dynamics of runoff and sediment trapping performance of vegetative filter strips: Run-on experiments and modeling. Sci. Total Environ. 2017, 593, 54–64. [Google Scholar] [CrossRef] [PubMed]
Figure 1. Location of the study site in the Three Gorges Reservoir Area (a) and a view of hedgerow (b), grass ditch (c), and measured stem diameters (d) in the field. VSD—vegetation stem diameter.
Land 13 01231 g001
Figure 2. A view of the schematic diagram of experiment apparatus (a,b), and the sketch diagram of different VSDs (c).
Land 13 01231 g002
Figure 3. Runoff rate (a), sediment concentration (b), and sediment yield rate (c) during the period of simulated rainfall under different VSDs.
Land 13 01231 g003
Figure 4. Average runoff rate (a), average sediment concentration (b), and average sediment yield rate (c) under different VSDs. The lowercase letters indicate the significant difference under different VSDs at p < 0.05.
Land 13 01231 g004
Figure 5. Average rill depth (a) and average rill width (b) under different VSDs. The lowercase letters indicate the significant difference under different VSDs at p < 0.05.
Land 13 01231 g005
Figure 6. Regression analysis showing that exponential function between VSD and average runoff rate (a), average sediment concentration (b), and average sediment yield rate (c).
Land 13 01231 g006
Table 1. Basic properties of soil used in the experiment.
PSD (%)BD
(g cm−3)
WHC
(%)
pH
(/)
EC
(µS cm−1)
CEC
(cmol kg−1)
SOC
(g kg−1)
TN
(g kg−1)
TP
(g kg−1)
1–0.05 mm0.05–0.002 mm<0.002 mm
50.87 ± 1.5238.05 ± 0.0411.08 ± 1.561.25 ± 0.0323.35 ± 0.017.6 ± 0.1319 ± 10.726.7 ± 3.73.89 ± 0.120.60 ± 0.010.78 ± 0.02
PSD—soil particle size distribution; BD—bulk density; WHC—water-holding capacity; EC—electrical conductivity; CEC—cation exchange capacity; SOC—soil organic carbon; TN—total nitrogen; TP—total phosphorus.
Table 2. Time to runoff initiation, accumulated runoff, and accumulated sediment production under different VSDs.
VSD (cm)Time to Runoff Initiation (min)Accumulated Runoff (mm)Accumulated Sediment Production (g m−2)
01.2 ± 0.1 b88.6 ± 2.7 a12,060.6 ± 127.1 a
0.11.4 ± 0.2 b83.9 ± 1.9 ab11,640.4 ± 3328.5 a
0.21.4 ± 0.0 b73.8 ± 0.4 b10,379.0 ± 1413.8 a
0.41.5 ± 0.3 b80.6 ± 5.7 ab3114.1 ± 236.4 b
0.82.2 ± 0.0 a73.5 ± 4.9 b1718.7 ± 310.7 b
The lowercase letters indicate the significant difference under different VSDs at p < 0.05; VSD—vegetation stem diameter.
Table 3. The reduction in runoff and sediment yield at different VSDs compared to control.
VSD (cm)Average Runoff Rate (%)Average Sediment Concentration (%)Average Sediment Yield Rate (%)Accumulated Runoff (%)Accumulated Sediment Production (%)
0.15.39.33.55.613.7
0.216.613.513.916.714.0
0.49.071.774.28.974.2
0.817.086.185.819.387.5
Table 4. The Pearson correlation coefficient matrix of the VSDs, average runoff rate, average sediment concentration, and average sediment yield rate.
VariableVSD (cm)
Average runoff rate−0.719
Average sediment concentration−0.936 *
Average sediment yield rate−0.926 *
“*” indicates p < 0.05.
Table 5. The Pearson correlation coefficient matrix of runoff rate, sediment concentration, and sediment yield rate.
VSD (cm)VariableRunoff RateSediment ConcentrationSediment Yield Rate
0Runoff rate1
Sediment concentration0.2551
Sediment yield rate0.565 *0.809 **1
0.1Runoff rate1
Sediment concentration0.742 **1
Sediment yield rate0.622 *0.855 **1
0.2Runoff rate1
Sediment concentration−0.1151
Sediment yield rate0.1930.700 **1
0.4Runoff rate1
Sediment concentration−0.666 **1
Sediment yield rate0.110.3541
0.8Runoff rate1
Sediment concentration−0.0171
Sediment yield rate0.754 **0.4111
TotalRunoff rate1
Sediment concentration0.284 *1
Sediment yield rate0.397 **0.835 **1
“*” indicates p < 0.05; “**” indicates p < 0.01.
Table 6. Regression analysis showing the linear function between runoff rate and sediment concentration as well as the sediment yield rate.
VariableVSD (cm)Regression EquationsR2pn
Sediment concentration0y = 0.11x − 0.090.070.35915
0.1y = 0.35x − 0.410.550.00215
0.2y = −0.06x + 0.140.010.68215
0.4y = −0.10x + 0.150.440.00715
0.8y = −1 × 10⁻⁴x + 0.010.000.95215
Totaly = 0.08x − 0.060.080.01475
Sediment yield rate0y = 946.05x − 1195.20.320.02815
0.1y = 597x − 640.740.390.01315
0.2y = 250.11x − 134.820.040.49015
0.4y = 26.21x + 16.700.010.69515
0.8y = 61.37x − 46.570.570.00115
Totaly = 328.31x − 308.480.160.00075
Disclaimer/Publisher’s Note: The statements, opinions and data contained in all publications are solely those of the individual author(s) and contributor(s) and not of MDPI and/or the editor(s). MDPI and/or the editor(s) disclaim responsibility for any injury to people or property resulting from any ideas, methods, instructions or products referred to in the content.

