Abstract
Numerous researchers have endeavored to amalgamate critical transit-oriented development (TOD) indicators, such as development density, walkability, and diversity, into a single TOD index to assess TOD performance. However, implementing TOD in megacities necessitates a more comprehensive selection of indicators, an objective calculation methodology, and accessible calculation data for the TOD index. This study introduces a method based on multi-indicator TOD performance assessment using multi-source urban big data; it uses Shanghai as a case study to evaluate and analyze the impact of site characteristics on performance. The method constructs the Comprehensive Socio-Economic Development Index (CSEDI) based on four indicators of TOD site operations. It establishes a multivariate regression model utilizing principal component analysis to extract 22 leading component indicators as independent variables from 71 indicators associated with TOD. Within the sample space of 77 rail transit TOD sites in Shanghai, the CSEDI exhibited a robust correlation with the independent variables. The evaluation results of the case study demonstrate consistency with the development characteristics of the city and the sites, indicating that the evaluation method can guide the renovation of existing sites and the development of new sites.
1. Introduction
In recent decades, China has experienced urbanization of an unprecedented scale and pace. This rapid expansion has brought with it escalating traffic challenges, including congestion and pollution. To overcome these issues, China has developed an extensive rail transit system. As of January 2023, the nation hosts subways in 54 cities, with 291 operational lines that extend over 10,857.17 km, accounting for 26.23% of the global subway mileage [1]. Based on the development of rail transit, many cities in China have adopted the concept of transit-oriented development (TOD), a city planning framework that prioritizes public transportation [2]. This approach seeks to optimize urban layouts, boost public transport efficiency, mitigate traffic congestion, and enhance urban sustainability [3].
TOD promotes integrated land use near public transit stations, combining high-density, mixed-use spaces with human-centered design [4]. This strategy supports sustainable transportation options such as walking and cycling and decreases reliance on private vehicles. The benefits are manifold: it spurs economic growth in adjacent areas, boosts urban vitality, and enhances the social fabric and convenience for city dwellers, ultimately elevating their quality of life.
Transit-oriented development (TOD) has garnered substantial validation through extensive empirical research and case studies, affirming its significant socio-economic benefits. Researchers not only highlight the positive impacts of TOD but also continuously identify a diverse range of factors influencing the performance of TOD sites [5]. These factors, emerging from the dynamics of surrounding community land use, planning, and design, pose multifaceted challenges. These challenges necessitate an approach based on a detailed understanding during the planning process to prevent unnecessary land wastage [6].
A comprehensive scientific evaluation method that covers a broad spectrum of performance targets and influential factors can effectively guide the planning and refinement of TOD initiatives [7]. Qualitative approaches to evaluation, such as expert interviews and case studies, yield deep insights into the practical implementation of TOD, enhancing understanding of its complexities and differences. Conversely, quantitative methods leverage data collection and analysis to objectively evaluate the impacts of TOD, with typical criteria including transportation efficiency, land use optimization, and community design integration.
Despite the TOD indicator systems that already exist in regions such as North America and Asia, China faces distinctive challenges due to its later stage of urbanization and the ongoing evolution of TOD practices [8]. The unique characteristics of Chinese urban environments are marked by varying urban scales, population sizes, and transportation modalities. While TOD initiatives in North America often retrofit existing car-centric urban layouts, China’s approach is more prescriptive and fully supported by the government, emphasizing the creation of high-capacity public transit systems that are integrated with urban development.
This approach is in line with sustainable management practices aimed at enhancing the capacity of the public transport infrastructure, which is crucial to the accommodation of the different urban scales, population sizes, and transport modalities in Chinese cities, ensuring that TOD can effectively contribute to sustainable urban development [9]. Consequently, the characteristics of Chinese urban environments and development objectives demand customized approaches to TOD evaluation [10].
The remainder of this paper is organized into four main sections. Section 2 reviews the literature on TOD and applies our evaluation method to Shanghai’s rail transit network. Section 3 analyzes the results of the evaluation using geospatial features. Section 4 discusses the findings with reference to a detailed case study. The final section presents our findings and proposes directions for future research.
2. Materials and Methods
2.1. Previous Literature
Transit-oriented development (TOD) is a strategic urban development initiative that prioritizes public transit; it is rooted in the public transportation-oriented development (PTOD) theory that emerged in the 1950s [11]. The conceptualization of TOD was significantly shaped by seminal work conducted by Calthorpe and others in 1993 [12], which emphasized its profound influence on the planning of urban structures and transportation infrastructures. This foundational research elaborated on the core principles of TOD, which advocate for intensive land use, functional diversity, and human-centered design. In 1997, Cervero and Kockelman further enriched the theoretical framework by introducing the “3Ds” principles—density, diversity, and pedestrian-oriented design—establishing them as cornerstones of transit-oriented development [13].
While the definitions of TOD vary across the scholarly literature, there is a consensus that TOD essentially aims to create mixed-use, high-density, and pedestrian-friendly communities around transit nodes [14]. The approach emphasizes the integration of land use and transportation planning to enhance the convenience of walking, cycling, and public transit, thus maximizing the efficiency of existing transportation services. This model has been empirically shown to significantly improve urban sustainability and quality of life within cities [15].
The methodology used to evaluate TOD sites has evolved from Bertolini’s pioneering “node-place” model [16], a dual-dimensional method that assesses sites based on their capacity to provide transportation services and the richness of their functionalities. By assigning numerical values to these dimensions, sites can be classified into five distinct categories. This model has been expanded by subsequent researchers who have introduced new dimensions and indicators to refine the evaluation process. The TCRP Report No. 102 [17] stands out as an influential study analyzing specific instances of TOD implementation, providing valuable insights into the practical application and impacts of TOD principles.
Lyu [18] conducted a comprehensive review of the literature, identifying 94 indicators that were categorized into three dimensions, thus enhancing the framework for assessing TOD performance. Similarly, Jamme [19] advanced the discourse on TOD research with the introduction of the extended 6Ds framework. Methodological innovations are also seen in the work of Rodríguez and Kang [20] and Huang [21], who applied direct clustering of indicator data to classify Canadian stations into ten types. Further adaptations were made by Zhang [22], who expanded the traditional 3Ds framework to include a “pedestrian-oriented dimension”, tailoring the analysis specifically to sites in Shanghai. Amini Pishro focused on TOD at rail transit stations in Chengdu, establishing a Node, Place, Ridership, and Time model (NPRT) to classify the stations and determine the impact on ridership [23,24]. These developments underscore the dynamic nature of TOD research and its critical role in shaping sustainable urban environments.
The impact of transit-oriented development (TOD) on urban environments is profoundly multifaceted [25]. The efficacy of TOD practices can be evaluated through a spectrum of functional indicators, including travel efficiency, behavioral changes, and environmental impacts [26]. Research exploring the mechanisms behind these outcome indicators has illuminated myriad factors contributing to TOD’s success. For instance, Seong, Lee, and Choi [27] highlighted how mixed land use in dense urban areas such as Seoul encourages walking over driving. Their findings indicate a nonlinear relationship, wherein increased commercial density substantially raises the likelihood of walking, underscoring the complex interdependencies within the urban fabric that influence pedestrian behavior. Pan et al. [28] focused on typology, utilizing the “Node–Place–Function” model to identify types of subway station areas; they revealed the nonlinear relationships of built-environment vitality and the differences among various types of subway station areas. Shuai et al. [29] explored the characteristics of passenger flow based on swipe card data, establishing that the similarity in passenger flow at rail transit stations is influenced by the functional attributes of the stations. They utilized an improved t-SNE model for prediction.
Further elaborating on methodological advancements, Singh [30,31] introduced a novel approach to evaluate “TOD-ness”, a metric designed to gauge the level of TOD integration within walkable distances from transit stations and throughout broader regions. Higgins [32] enhanced this approach by aggregating standardized values across seven indices to comprehensively assess the TODness of station areas. These innovations not only deepened our understanding of TOD’s utility but also provided empirical support for the correlation between TODness and critical urban outcomes, such as public transit ridership and real estate values. Yi et al. calculated TODness based on 15 sub-indicators across three dimensions: transport (T), orientation (O), and development (D). They employed an ordinary least squares (OLS) model to examine the relationship between TODness and urban vitality [33]. Subsequent studies [34,35,36] have corroborated these findings, showcasing the substantial impact of effectively implemented TOD on urban development.
The existing methods of evaluating TOD performance frequently rely on isolated performance variables to affirm the validity of comprehensive indices [37], yet there have been limited efforts to evaluate the multiple aspects of TOD performance using a single composite index [38]. The prevailing methodology for constructing such indices involves selecting and hierarchically weighting indicators based on the 3Ds framework and expert insights [39]. However, the emergence of new potential indicators necessitates a reassessment of the existing indicator weights and classifications. Additionally, the variability in the feasibility of computing these indicators across different urban contexts, due to disparities in digital infrastructure, further complicates the standardization of TOD evaluation methods [40]. Rather than using subjective weighting, Zhao et al. [41] employed an objective method, the entropy weight method, to assign weights and compute scores across the three dimensions of the Node–Place–People (NPP) model, subsequently utilizing these scores for cluster analysis. Another task involves using objective methods to screen the variables; Huang et al. [42] employed a Bayesian network to filter out two significant variables from five built-environment variables.
In response to these methodological challenges, this study advocates for an evaluation method that is grounded in multi-source big data, which are made accessible via open data platforms. This approach aims to encapsulate multiple dimensions of TOD performance and utilizes an objective computational strategy for the composite index calculation. The selected indicators are meticulously designed to capture the extensive diversity and complexity of TOD characteristics. The resultant composite index is intended to accurately reflect the degree of TOD implementation at sites and its consequent impact on sustainable urban development.
In this study, we adopted a primarily quantitative analytical approach to assess and optimize the performance of TOD. The principal advantage of quantitative methods lies in their ability to provide objective and quantifiable outcomes, which are crucial for evaluating complex urban planning initiatives. By integrating quantitative data analysis with qualitative insights, we were able to gain a more comprehensive understanding of the diverse impacts of TOD projects and the underlying drivers. This hybrid approach not only enhances the rigor of our research but also offers scientific guidance for the planning and implementation of TOD, ensuring the effectiveness and adaptability of our strategies.
Our comprehensive literature review identified 71 independent variable indicators and 4 dependent variable indicators. We developed a method for calculating these using multi-source big data, leading to the creation of the Comprehensive Socio-Economic Development Index (CSEDI). Employing principal component analysis followed by regression analysis, we ascertained the relative significance of each indicator in evaluating TOD performance [43], effectively minimizing the biases and limitations inherent in single-indicator evaluations. Using Shanghai—one of China’s largest cities—as a case study, this research conducts an empirical evaluation of its rail transit stations. This examination aims to verify the performance and practicality of the proposed method. The anticipated outcomes are expected to furnish actionable insights for urban planners, enhance the progression of TOD-related theoretical frameworks, and exert a positive influence on practical applications within this field.
2.2. Method for Evaluating Shanghai’s Rail Transit Network
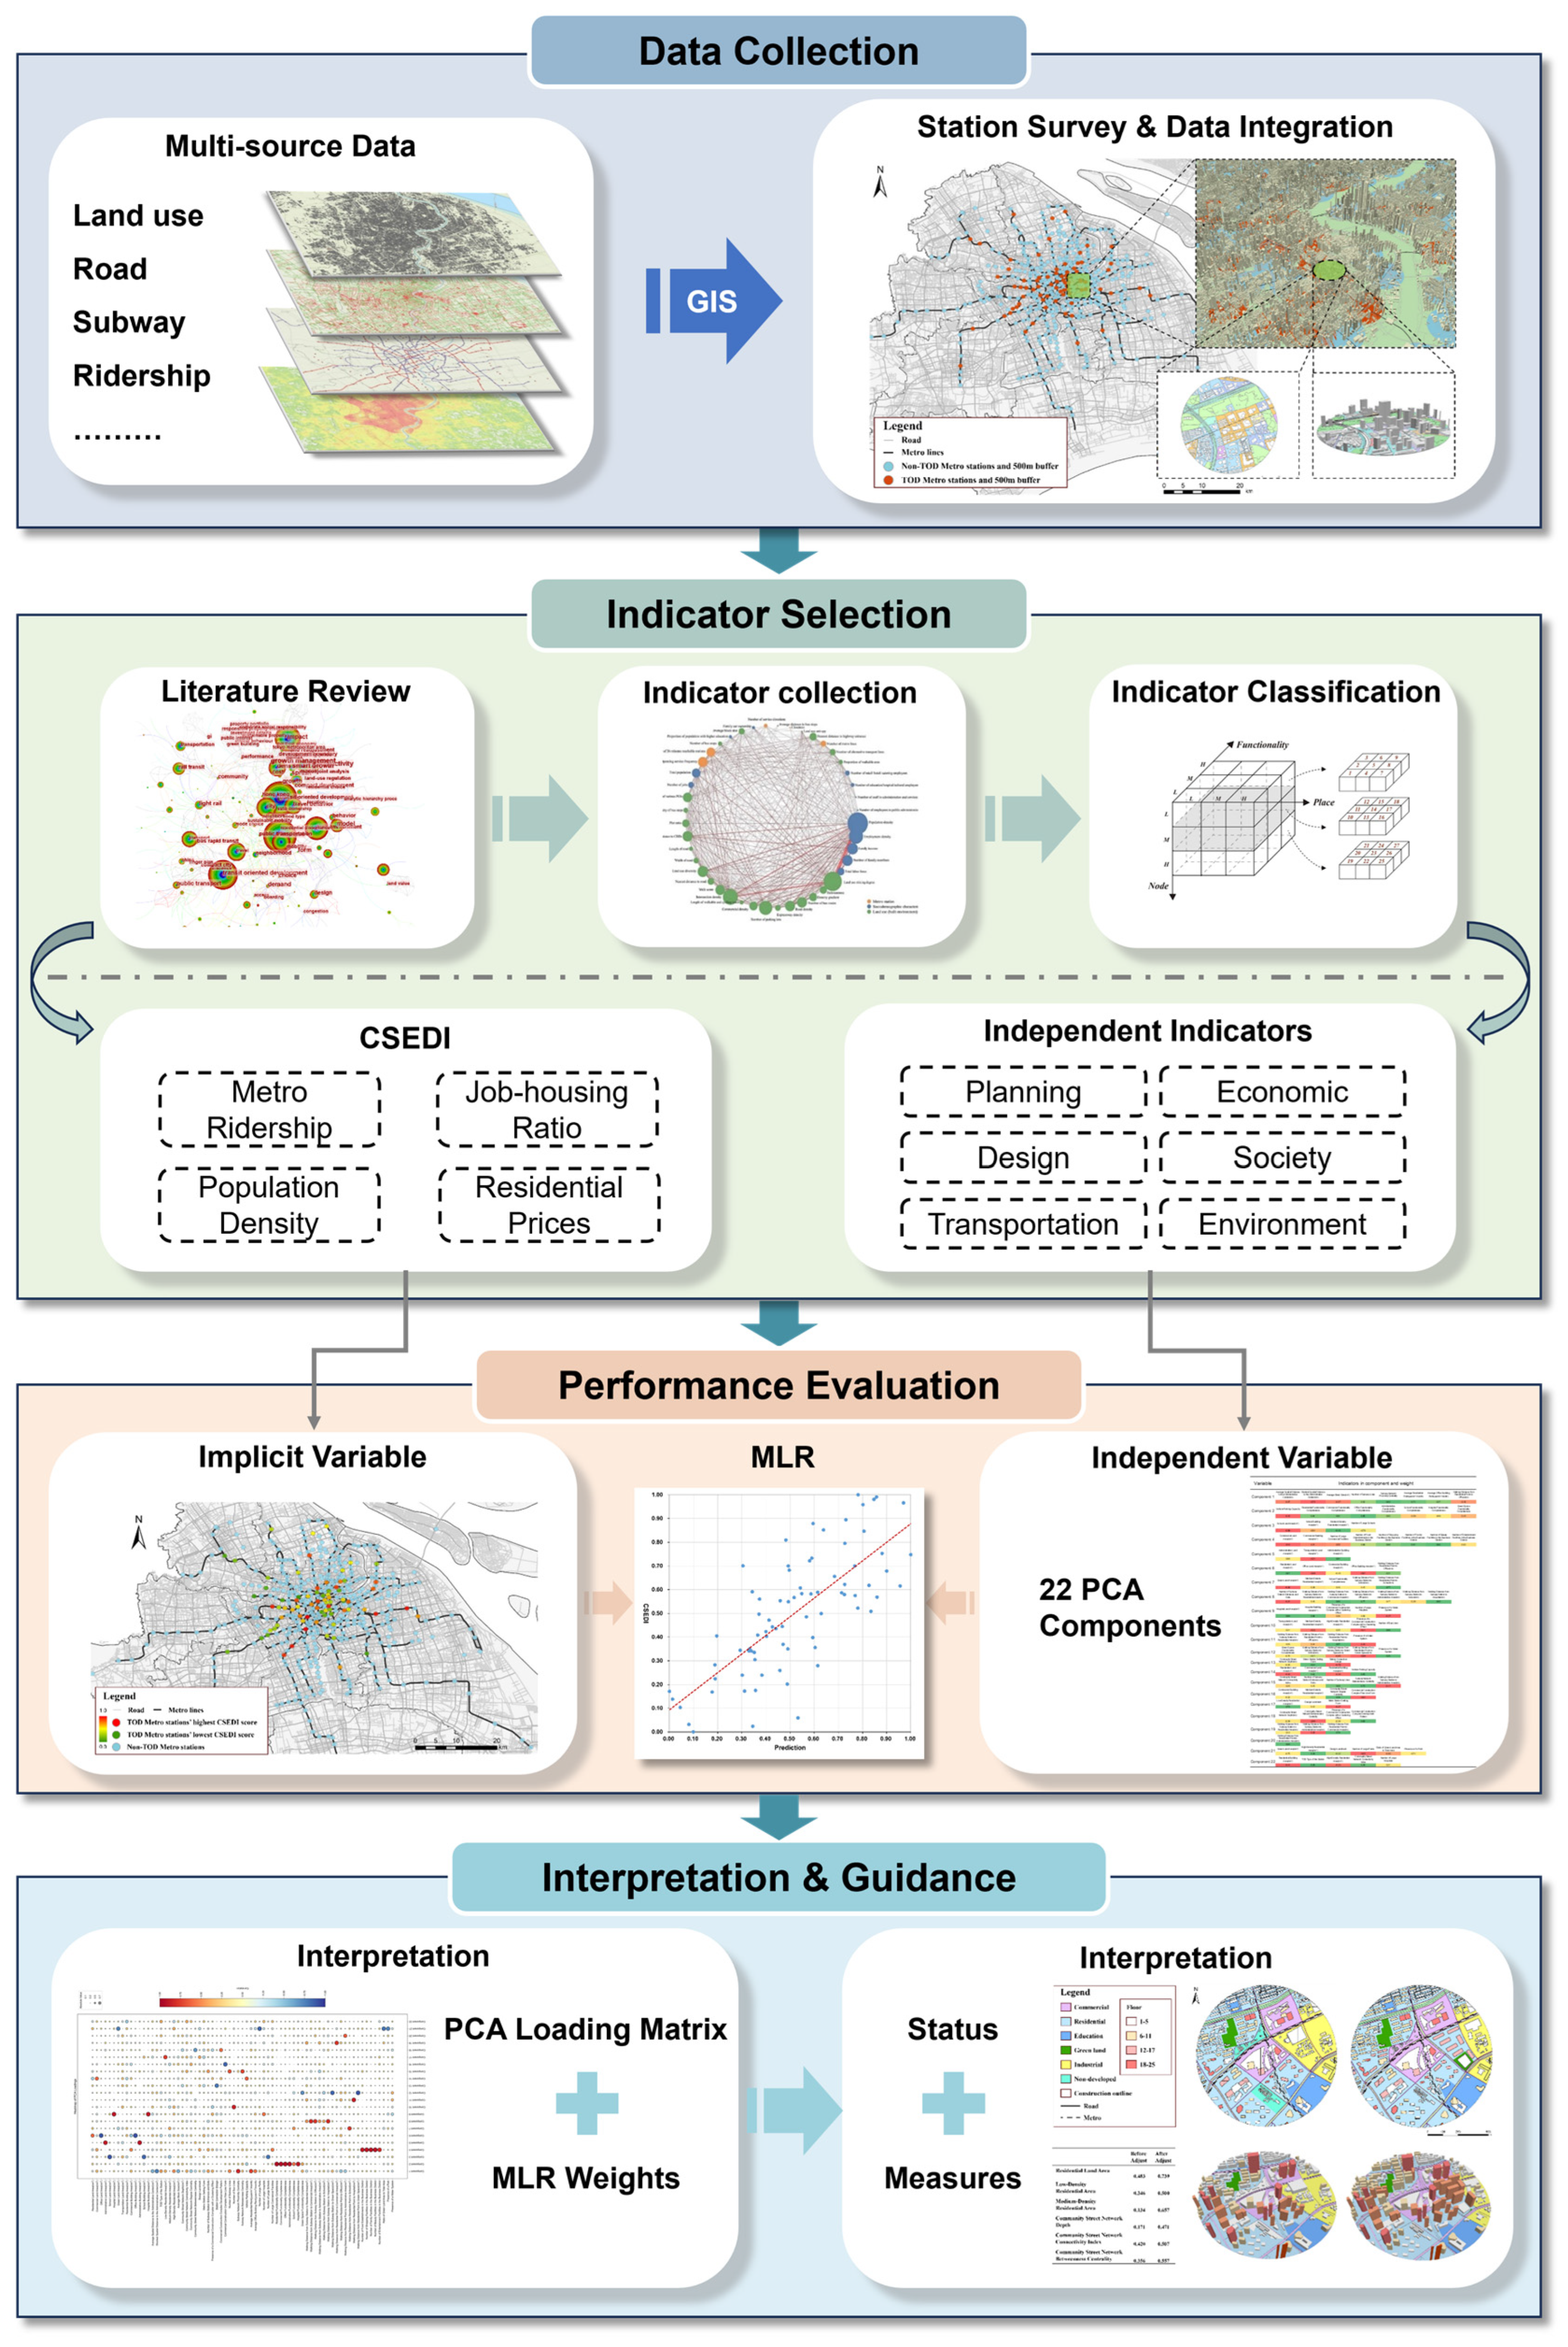
This study is structured into four distinct phases: data collection, indicator selection and measurement, site performance evaluation, and prediction and guidance for future development, as shown in Figure 1. During the initial phase, we systematically gathered multi-source big data pertaining to all rail transit sites in Shanghai. These data included comprehensive details about urban transportation infrastructure, building and landmark information, real estate pricing, and demographic and economic data from community surveys. To ensure the reliability and validity of our data, we sourced all information from publicly accessible data platforms and official statistical agencies.
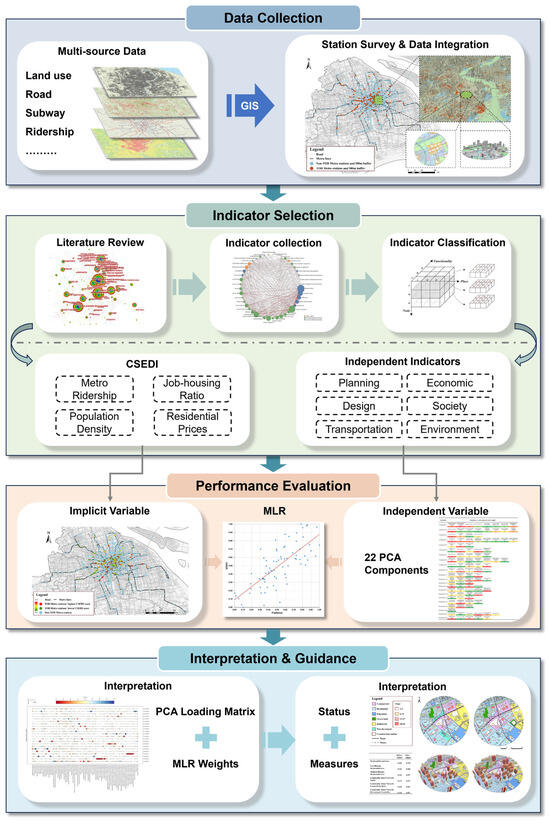
Figure 1.
Flowchart of this research.
During the second phase, our approach involved compiling an extensive list of indicators from existing studies that influence the performance of TOD sites. These indicators include multiple domains—planning, economic, social, transportation, design, and environmental factors—each providing unique insights into the facets of TOD. From this broad spectrum of indicators, we identified and selected the four most frequently cited by researchers. These were then weighted appropriately to construct a composite dependent variable indicator, which serves as a critical measure in our analysis.
During the third phase, we conducted a thorough assessment of site performance. We used the CSEDI to describe the comprehensive performance of the TOD site. Moreover, utilizing principal component analysis (PCA), we weighted each sub-indicator to derive a composite TOD performance score for each site. This methodological approach not only ensures that our evaluation is robust but also allows for the interpretation of data.
The final phase of the study focused on the application of our findings. We focused on the performance metrics of each site across the identified sub-indicators, which facilitated a detailed analysis of each site’s primary strengths and areas for improvement. Based on this comprehensive evaluation, we proposed targeted strategies for enhancement. These recommendations are designed to provide actionable guidance for urban planners and stakeholders involved in TOD in Shanghai, aiming to optimize both current practices and future initiatives.
2.2.1. Study Area
Shanghai was selected as the study area for this research for two compelling reasons. First, Shanghai possesses the world’s most extensive urban rail network, which facilitates an average daily passenger flow exceeding 10 million and spans an operational length of 831 km. As of 2023, the Shanghai Metro operates 20 lines encompassing 508 stations, and it is undergoing significant expansion with nine additional lines and approximately 224 km of new track under construction [44] (Shanghai Municipal Transportation Commission, 2023). The subway network in Shanghai encompasses stations that exemplify different developmental phases, diverse technological backgrounds, and various policy directives. Consequently, the issues and challenges arising from the practice of TOD within the Shanghai subway system are representative. Therefore, Shanghai serves as an exemplary model for examining TOD evaluation methods.
Second, the historical context of Shanghai’s urban planning is uniquely polycentric, dating back to the 1950s when the concept was first integrated into its comprehensive planning strategies. More recently, the 14th Five-Year Plan for Shanghai’s Comprehensive Transportation Development highlighted the municipal government’s commitment to station–city integration. This plan advocates for a systematic and complete transportation system that supports the integrated development of metro stations and their adjacent areas, fostering communities that embody the core principles of TOD.
The diverse functions, forms, surrounding land use, and socio-economic characteristics of Shanghai’s metro stations provide a rich and varied dataset. This diversity offers ample opportunities to design and implement nuanced TOD evaluation methods. The presence of multiple TOD types across the metro sites enables a comprehensive analysis of prevalent issues and the formulation of targeted developmental strategies.
By assessing the TOD levels at various metro sites in Shanghai, this study aims to formulate precise recommendations for urban planning within the city. Additionally, the findings are intended to serve as a benchmark for other major cities with comparable urban structures and transportation systems, enhancing the broader applicability of our research findings.
2.2.2. Data Source
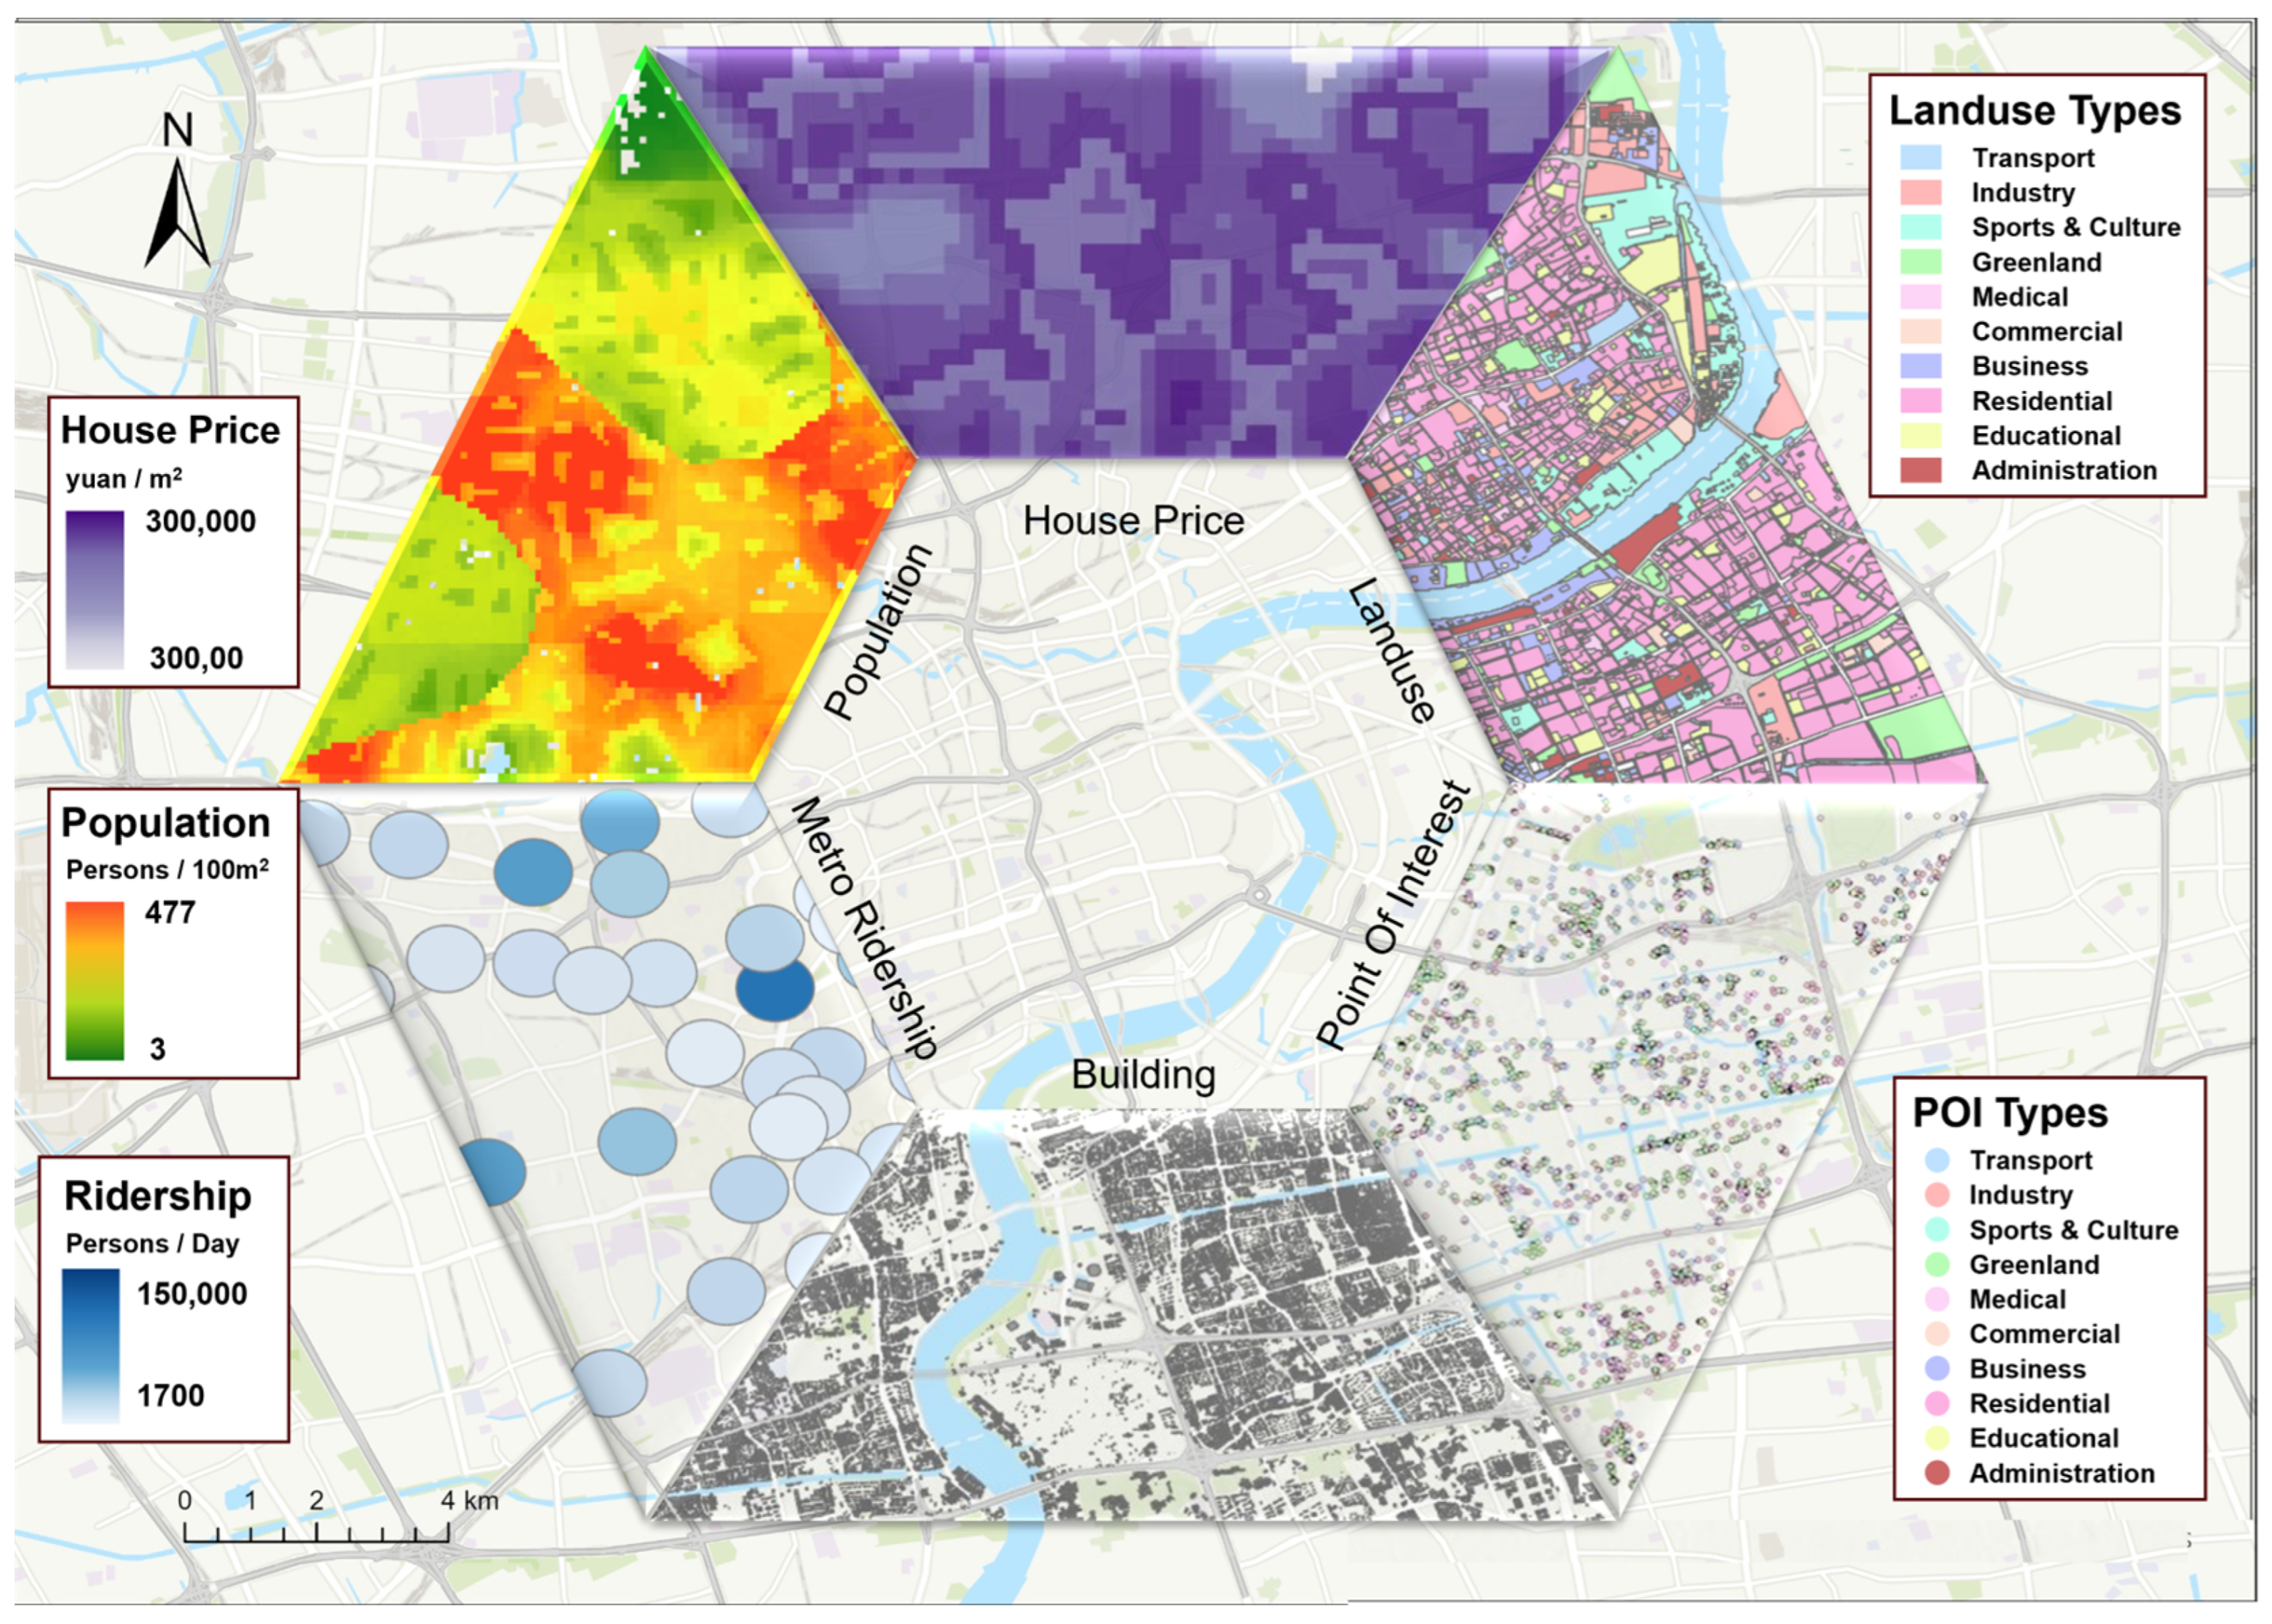
The dataset employed in this study encompasses comprehensive data from the year 2021 in Shanghai, ensuring a robust foundation for our analysis, as shown in Table 1 and Figure 2.

Table 1.
Details about data sources.

Figure 2.
Main data used in this study.
In the present study, a diverse array of data sources was employed to ensure a comprehensive analysis of the urban dynamics in Shanghai for the year 2021. OpenStreetMap, a collaborative platform akin to Wikipedia for maps, provided extensive street data, which are pivotal for delineating the urban infrastructure. Baidu Maps API supplemented this with detailed building outlines and additional street folds, offering precise geographic data tailored to Chinese locales. Gaode Maps API was instrumental in providing point of interest (POI) data, encapsulating essential amenities and facilities that highlight the functional aspects of the city. Population distribution was detailed using high-resolution raster data from Worldpop.org, which aids in understanding demographic dynamics; these are crucial for urban planning. Real estate transaction records from Lianjia.com were utilized to analyze the economic and residential trends within the city, reflecting the active real estate market in Shanghai. The Shanghai Metro supplied detailed subway layouts, which are essential for examining transit-oriented developments. Data on over 5000 car parks were obtained from the Shanghai Parking APP, developed by the Shanghai Municipal Government, providing insights into vehicle management and urban traffic flows. The EU–LUC–China dataset contributed land-use data, which are crucial for understanding land utilization patterns in urban planning. Finally, the Meituan APP provided data on commercial establishments and their classifications, offering a window into the commercial landscape of Shanghai. Each data source was carefully selected and integrated based on its relevance to urban roads and planning guidelines, ensuring a holistic view of the city’s urban framework.
After preprocessing, we fused these multi-source big datasets based on their relevance to urban roads, with a specific focus on areas within a 500 m radius around each station; this was selected based on the guidelines issued by China’s Ministry of Housing and Urban–Rural Development in 2015. The integration process involved:
- Three-dimensional road network generation: utilizing spatial data on road fold lines and intersections, we constructed a comprehensive model of Shanghai’s road network, including underground passages, ground-level roads, and elevated flyovers, alongside pedestrian crossings and station access points.
- Data integration: we harmonized the POI data with real estate transactions, which were further linked to building outlines. This integrated dataset was then connected to the road network, incorporating details from building entrances and exits.
Specifically, data fusion was conducted using ArcGIS Pro and Python to integrate diverse datasets such as road networks, land use, and building outlines. This integration was facilitated using Geographic Information Systems (GIS), utilizing spatial coordinates and attributes to ensure a seamless combination of the data layers. This approach allows for the comprehensive analysis of urban development factors in relation to TOD efficiency, effectively combining qualitative and quantitative data to bolster our study’s findings.
The spatial configuration and infrastructure specifics of 417 rail transit sites in Shanghai were extensively restructured by integrating these diverse data sources. High-resolution open data facilitated a detailed evaluation of the locational attributes of TOD sites, as well as the economic and social metrics of their surrounding areas. This approach also allowed us to assess each site’s compliance with the 3Ds principles of TOD and its contribution to enhancing transit friendliness.
A subsequent screening process, guided by the core tenets of TOD, was implemented for the Shanghai rail transit sites. This helped us to identify sites that embody the TOD philosophy, categorizing them as rail transit TOD sites. It is important to recognize that, while the TOD concept was adopted relatively recently in China, the development of rail transit sites in Shanghai has a long history. As such, these sites were not originally designed under the TOD framework. However, the prevailing approach in major Chinese cities often mirrors TOD principles, emphasizing high-density development, the prioritization of public transportation, and the integration of station–city designs.
Consequently, many rail transit stations were constructed or retrofitted to reflect key characteristics of the TOD concept. Therefore, we considered these sites as well, so that our sample encompasses sites at all stages and at different levels of TOD to ensure that the sample is sufficiently representative of the diversity of TODs within the city. Ultimately, we identified and categorized 77 TOD sites into five distinct TOD categories, operational for at least one year during the data collection phase.
2.2.3. Indicator Selection
To conduct a thorough and practical evaluation of transit-oriented development (TOD) in Shanghai, our initial step involved an extensive review of the literature. We meticulously examined a wide array of research papers that have significantly contributed to the field of TOD, including the seminal works by Bertolini (1999), Cervero and Murakami (2009), Dittmar and Ohland (2012), and Su (2021, 2022) [45,46,47,48,49]. This comprehensive review facilitated the compilation of over 200 potentially relevant evaluation indicators, which were rigorously analyzed for their applicability and relevance to our study context.
In pursuit of operational feasibility, we narrowed our focus to 71 indicators deemed the most suitable for describing TOD. This refined selection was guided by criteria ensuring non-duplication and computability, alongside an evaluation of the frequency with which these indicators appeared in prior studies. These indicators cover six key dimensions that are critical to TOD assessment: “planning”, “design”, “transportation”, “society”, “economy”, and “environment”. Each dimension and the corresponding indicators are comprehensively detailed in Table 2.
Table 2.
Interpretation of dependent variable indicators.
This structured approach not only ensures the relevance and utility of the selected indicators but also enhances the validity of our evaluation framework. By grounding our indicator selection in established research and adhering to stringent selection criteria, we aim to provide a robust analytical foundation for assessing the efficacy of TOD initiatives in Shanghai.
In the context of transit-oriented development (TOD), selecting appropriate dependent variables is crucial for effectively assessing and distinguishing the operational performance of TOD sites. We chose population density, the number of daily subway passengers, average residential rent, and the occupancy/housing ratio as dependent variables. These indicators are not only easily measurable through various urban big data sources but also represent the core benefits of TOD, such as enhanced urban livability, economic productivity, and sustainable growth—the ultimate goal of TOD. These choices are grounded in the existing literature and validated by comprehensive studies [11,50,51], including the World Bank’s 3V approach to TOD. Since scholars have widely studied all four indicators, we normalized them to their maximum and minimum and then added them together with equal weights to form a new index, the CSEDI, for evaluating the performance of TOD stations.
CSEDI = Population Density + Metro Ridership + Job–Housing Ratio + Real Estate Price
In this study, the population density metric was derived from the average number of individuals within a 500 m buffer zone based on the WorldPop population density data. Metro ridership refers to the total number of passengers entering and exiting the station throughout the day on a Wednesday in August 2021. The job–housing ratio was calculated using points of interest (POIs) and residential types as references. Employment numbers for each job-related POI were allocated in accordance with the “Office Building Design Standards” published by the People’s Republic of China. This was further refined using the average residential area per household in Shanghai, which is 37.4 square meters, as reported in the “China Population Census Yearbook 2020” by the National Bureau of Statistics. This residential area was used to estimate the residential capacity, and the ratio of employment positions to residential capacity was calculated to derive the job–housing ratio. The real estate price was determined using the transaction data of secondary housing sales provided by Lianjia.com. For each property, the average price from the last three transaction records was calculated as the sale price. An average sale price was then computed for all properties within the TOD community area, providing an average real estate price at the TOD sites.
2.2.4. Principal Component Analysis and Regression Analysis
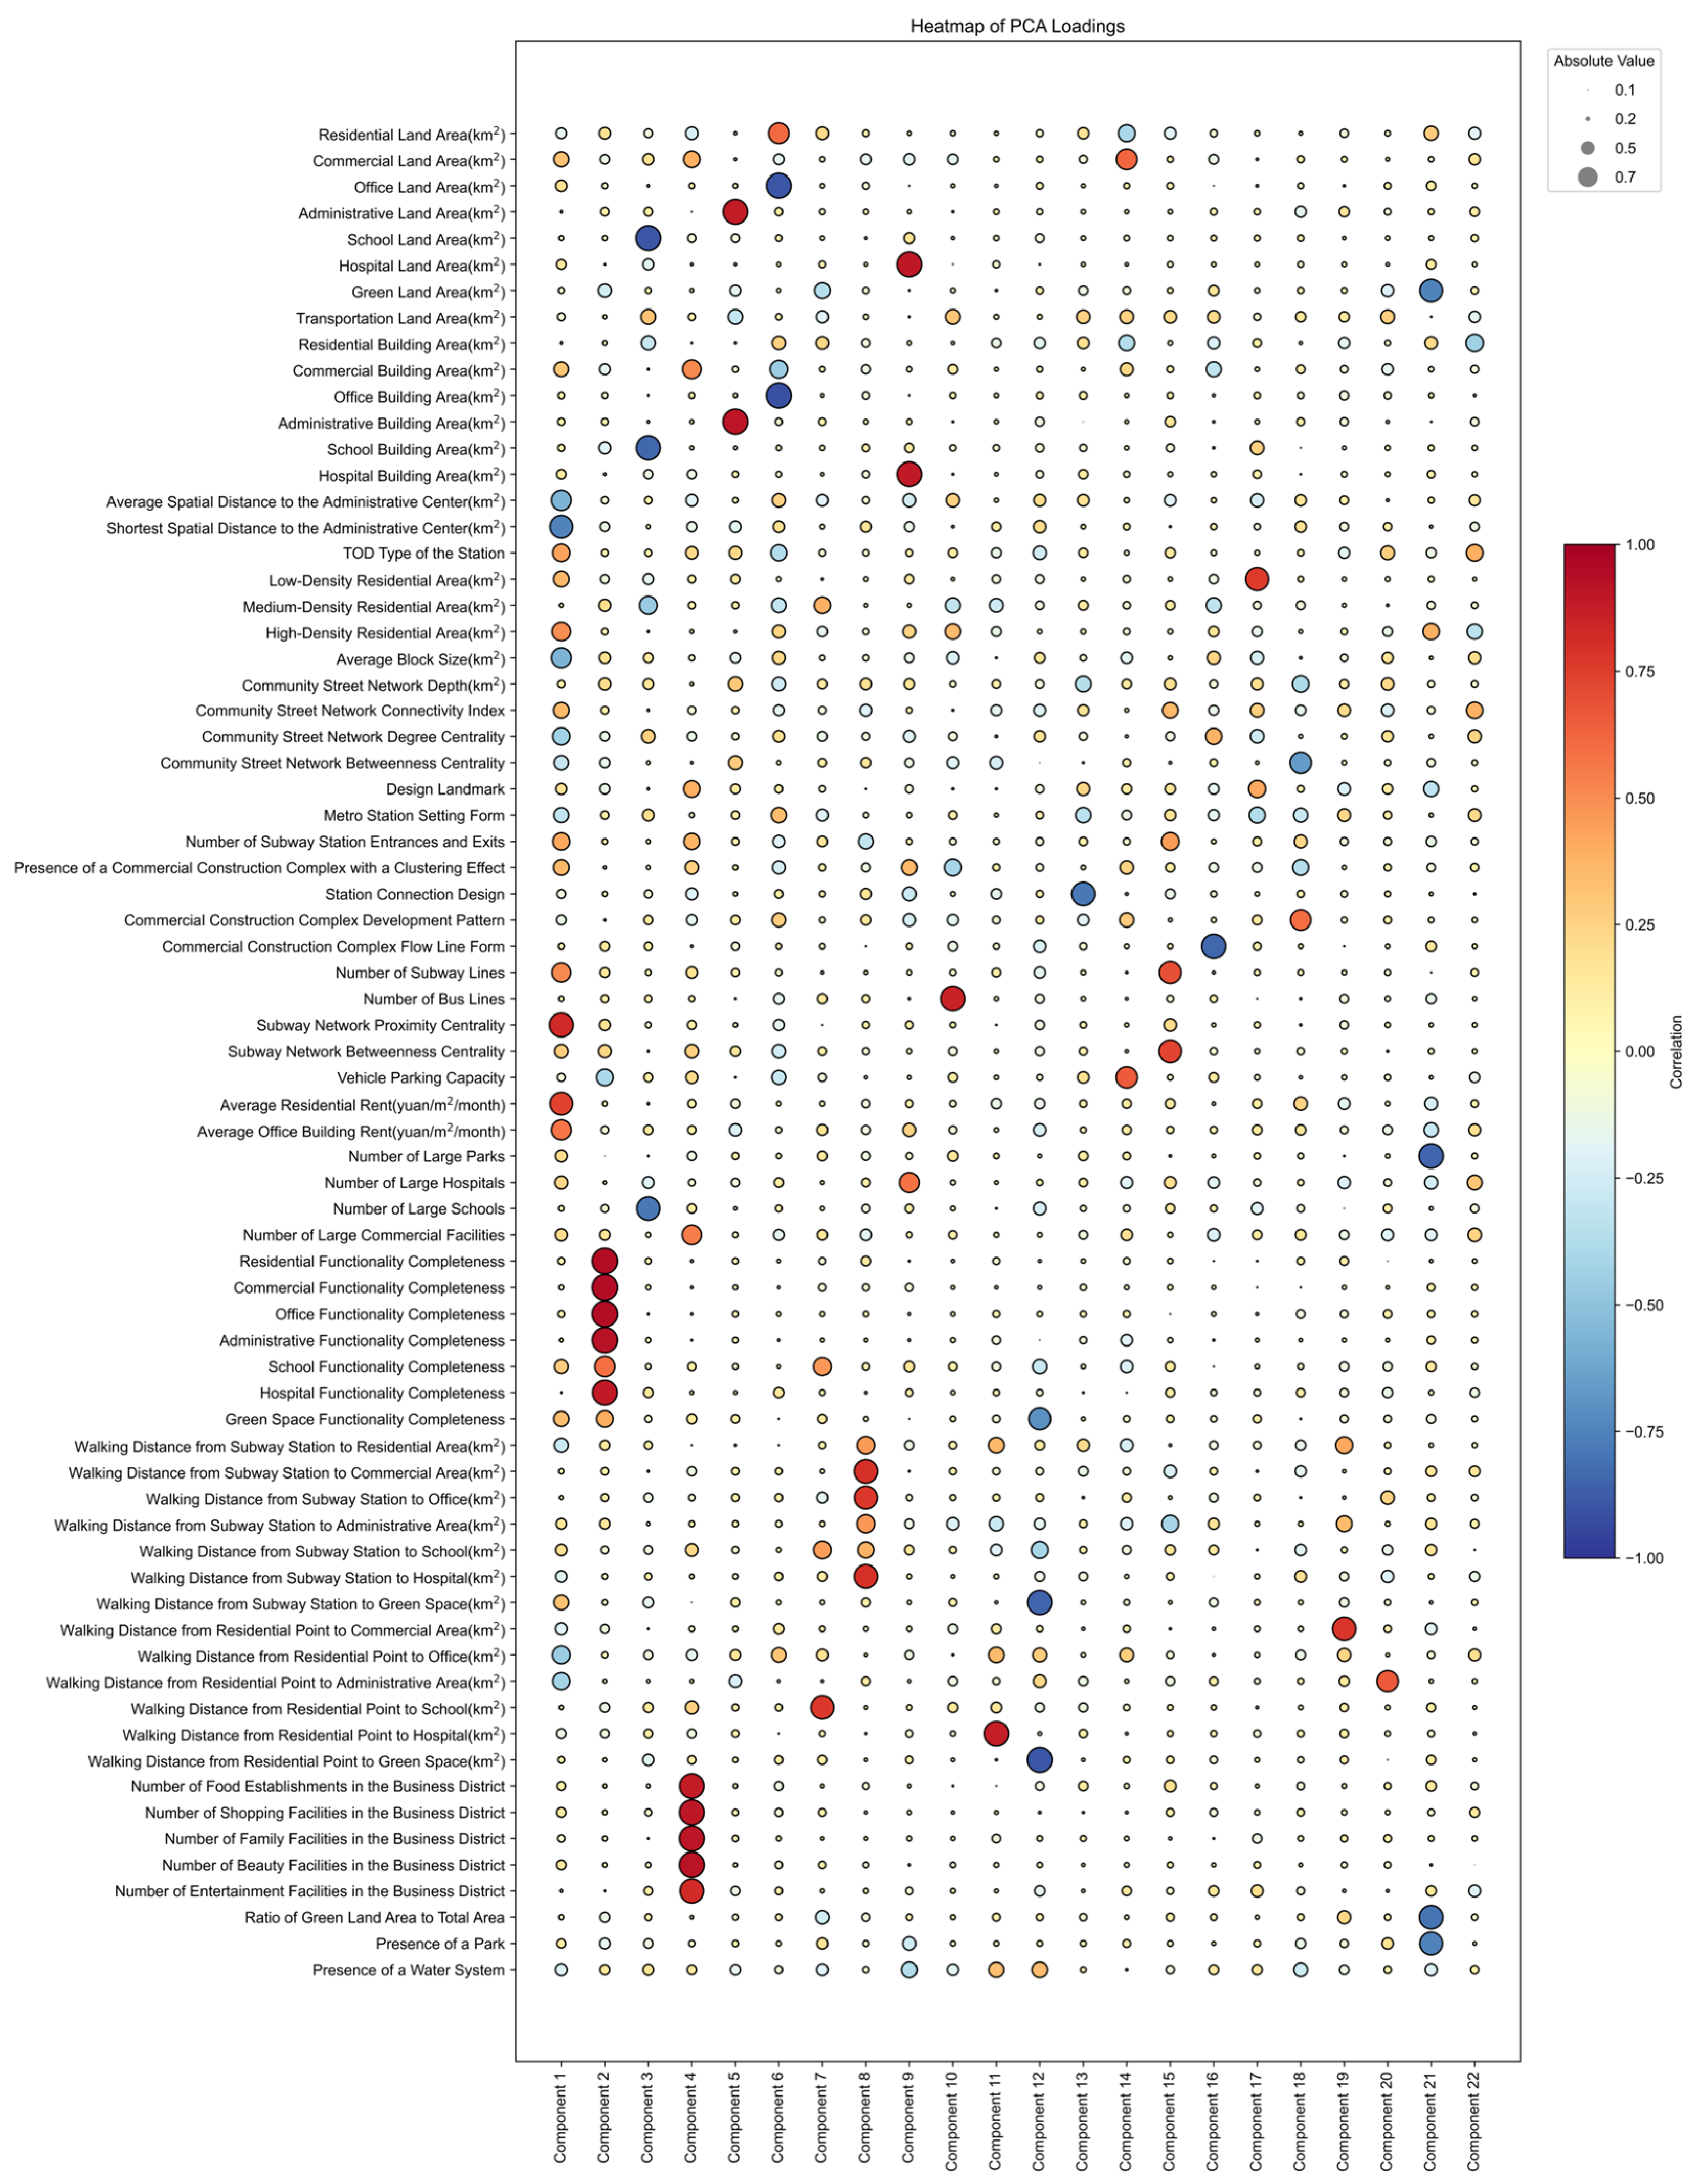
Principal component analysis (PCA) is a statistical technique employed to simplify the complexity of data by reducing their dimensionality. This method transforms original indicators into new, uncorrelated variables called principal components, which retain the maximum possible variability from the original dataset. In our study, we initiated the PCA process by standardizing the 71 selected indicators to neutralize the scale differences among them. The selection of the number of principal components was guided by a combination of Kaiser’s criterion [52] and the cumulative percentage of explained variance. Kaiser’s criterion recommends retaining all components with eigenvalues greater than 1. In our analysis, the first 23 components met this criterion. To further refine our selection and ensure a substantial yet concise representation of the data, we set a threshold for the cumulative explained variance at 85%. Finally, we identified 22 principal components that collectively explained 85.7% of the total variance in the original data. This significant reduction in dimensionality indicates that our PCA successfully condensed the data while preserving essential information, as detailed in Figure 3.
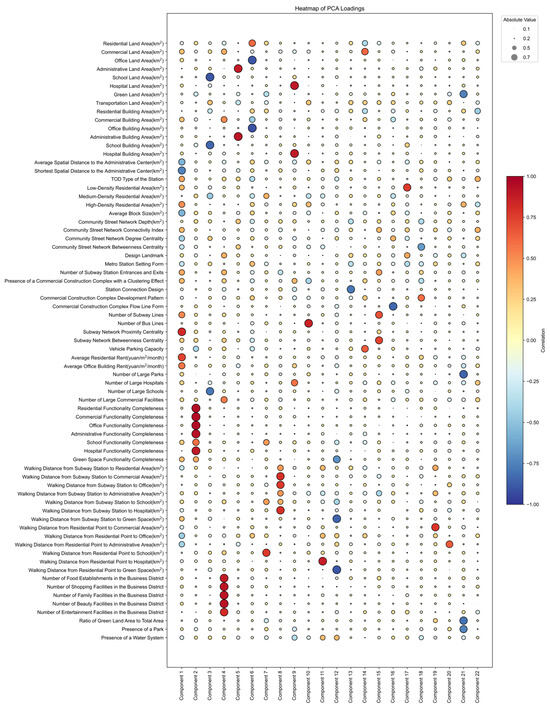
Figure 3.
Heatmap of the PCA loadings.
Based on the PCA results, we implemented a stepwise multiple linear regression model to evaluate the performance of rail transit sites in Shanghai. In this model, the CSEDI served as the dependent variable, with the 22 principal components acting as independent variables.
3. Results
3.1. Interpretation of the Principal Component Analysis Results
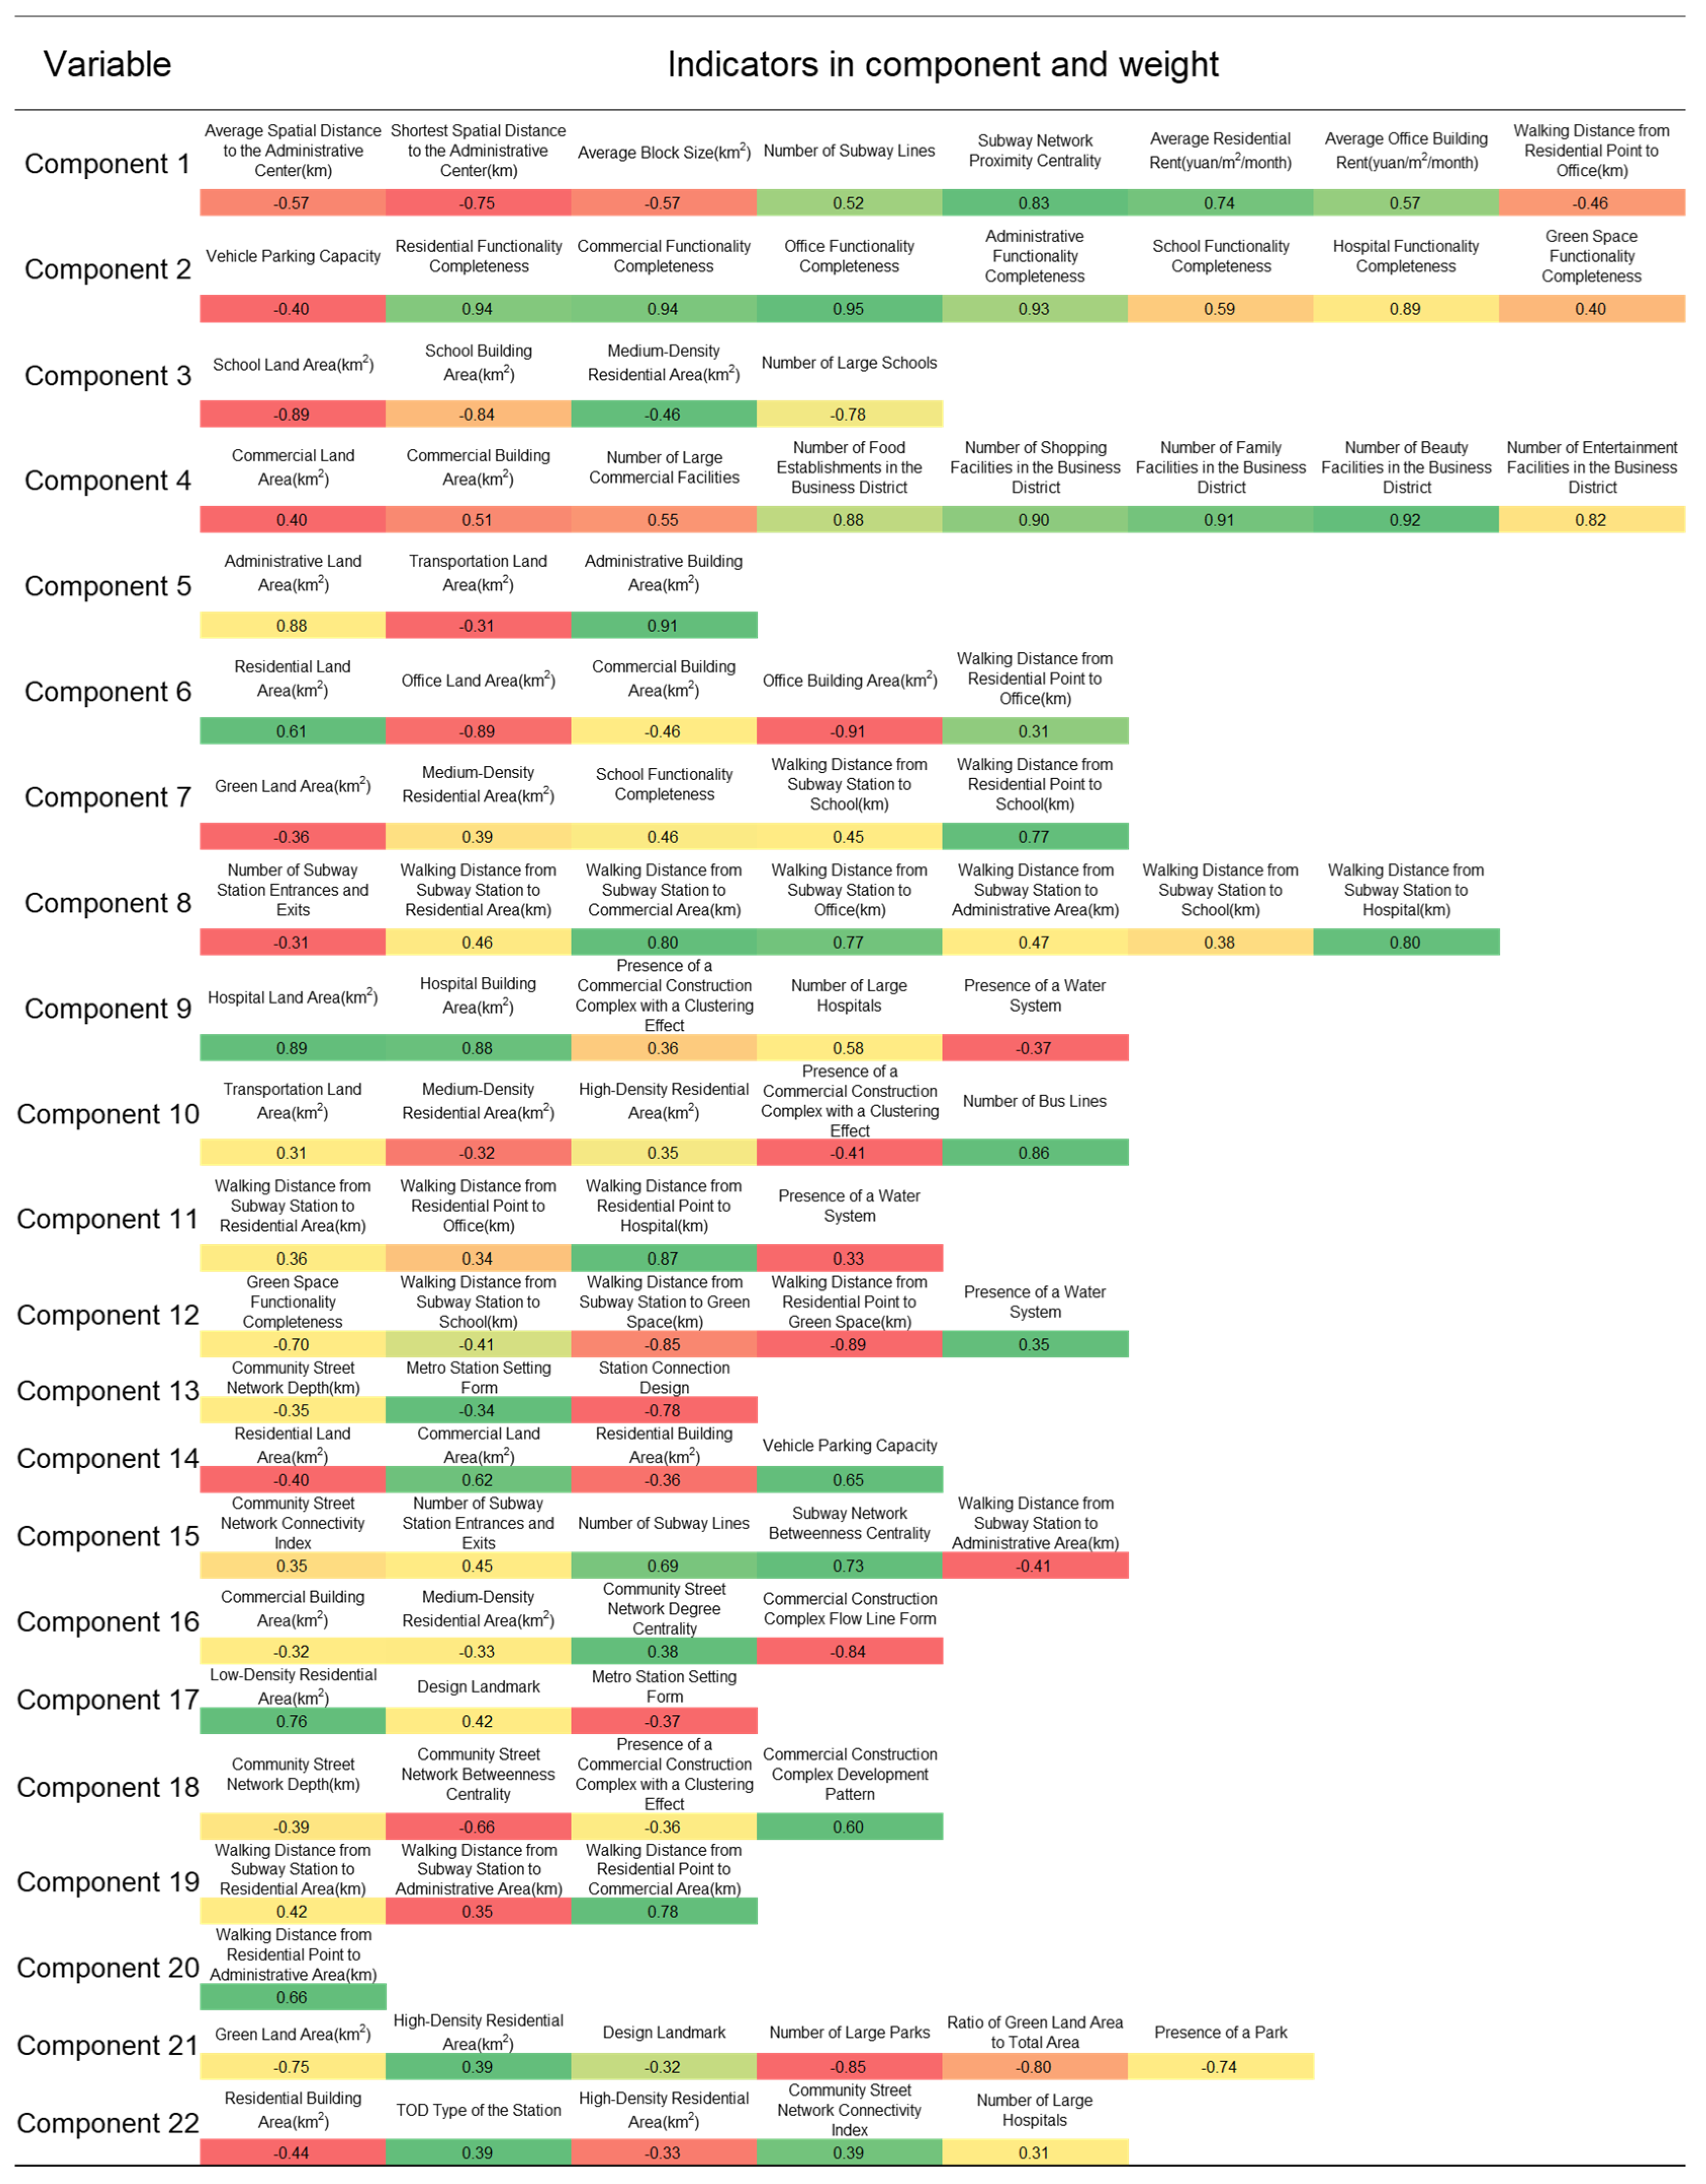
In this study, our analysis focused on the raw variables within the PCA loading matrix that exhibited high absolute loadings, specifically, those greater than 0.3. These high loadings signify that the corresponding variables play a pivotal role in the associated principal components. Figure 4 illustrates these variables, highlighting those with weight values exceeding 0.3 for each principal component. The PCA effectively segregated the variables, as demonstrated by the differentiated distribution of the principal weights for each variable, the clear distinctions between the principal components, and the variable relevance of each principal component.
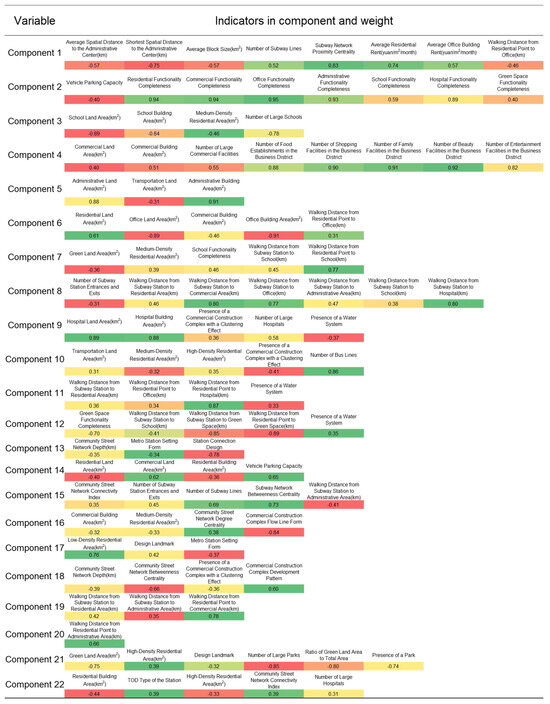
Figure 4.
Main indicators and weights of the principal component analysis variables.
Among the key findings, several principal components stood out due to their distinct attributes and impacts: Principal Component 2 encapsulated all “functional integrity” indicators, which were assigned high positive weights, suggesting a strong association with comprehensive functionality within the station’s vicinity. Principal Component 3 comprised indicators related to the size of school facilities, with each receiving substantial negative weights, indicating a potential trade-off between school size and other community attributes. Principal Component 5 was heavily influenced by the area of administrative land and the floor space indicators, emphasizing the administrative capacity and physical infrastructure. Principal Component 8 attributed negative weights to the number of metro station entrances and exits along with positive weights to walking distances to various facilities. This suggests that higher values of this component correlate with higher costs to access services, denoting less convenience and greater travel distances within the station area. Principal Component 11 pertained to the cost implications of traveling from a metro station to residential areas and accessing health services, reflecting challenges associated with connectivity and accessibility. Principal Component 15 focused on transportation attributes, such as the number of buses and metros at the station, its strategic position in the network, and the station’s design centrality, which are crucial for efficient transit operations. Principal Component 18 centered on the design aspects of the TOD neighborhood, including road network design and the layout and configuration of commercial complexes, underscoring the importance of thoughtful urban design in enhancing TOD performance.
These results not only affirm the robustness of our analytical approach but also highlight the diverse factors that influence TOD performance. The findings underscore the complexity of transit-oriented development and the necessity for multifaceted strategies to optimize urban transit nodes effectively.
3.2. Interpretation of the Regression Model Results
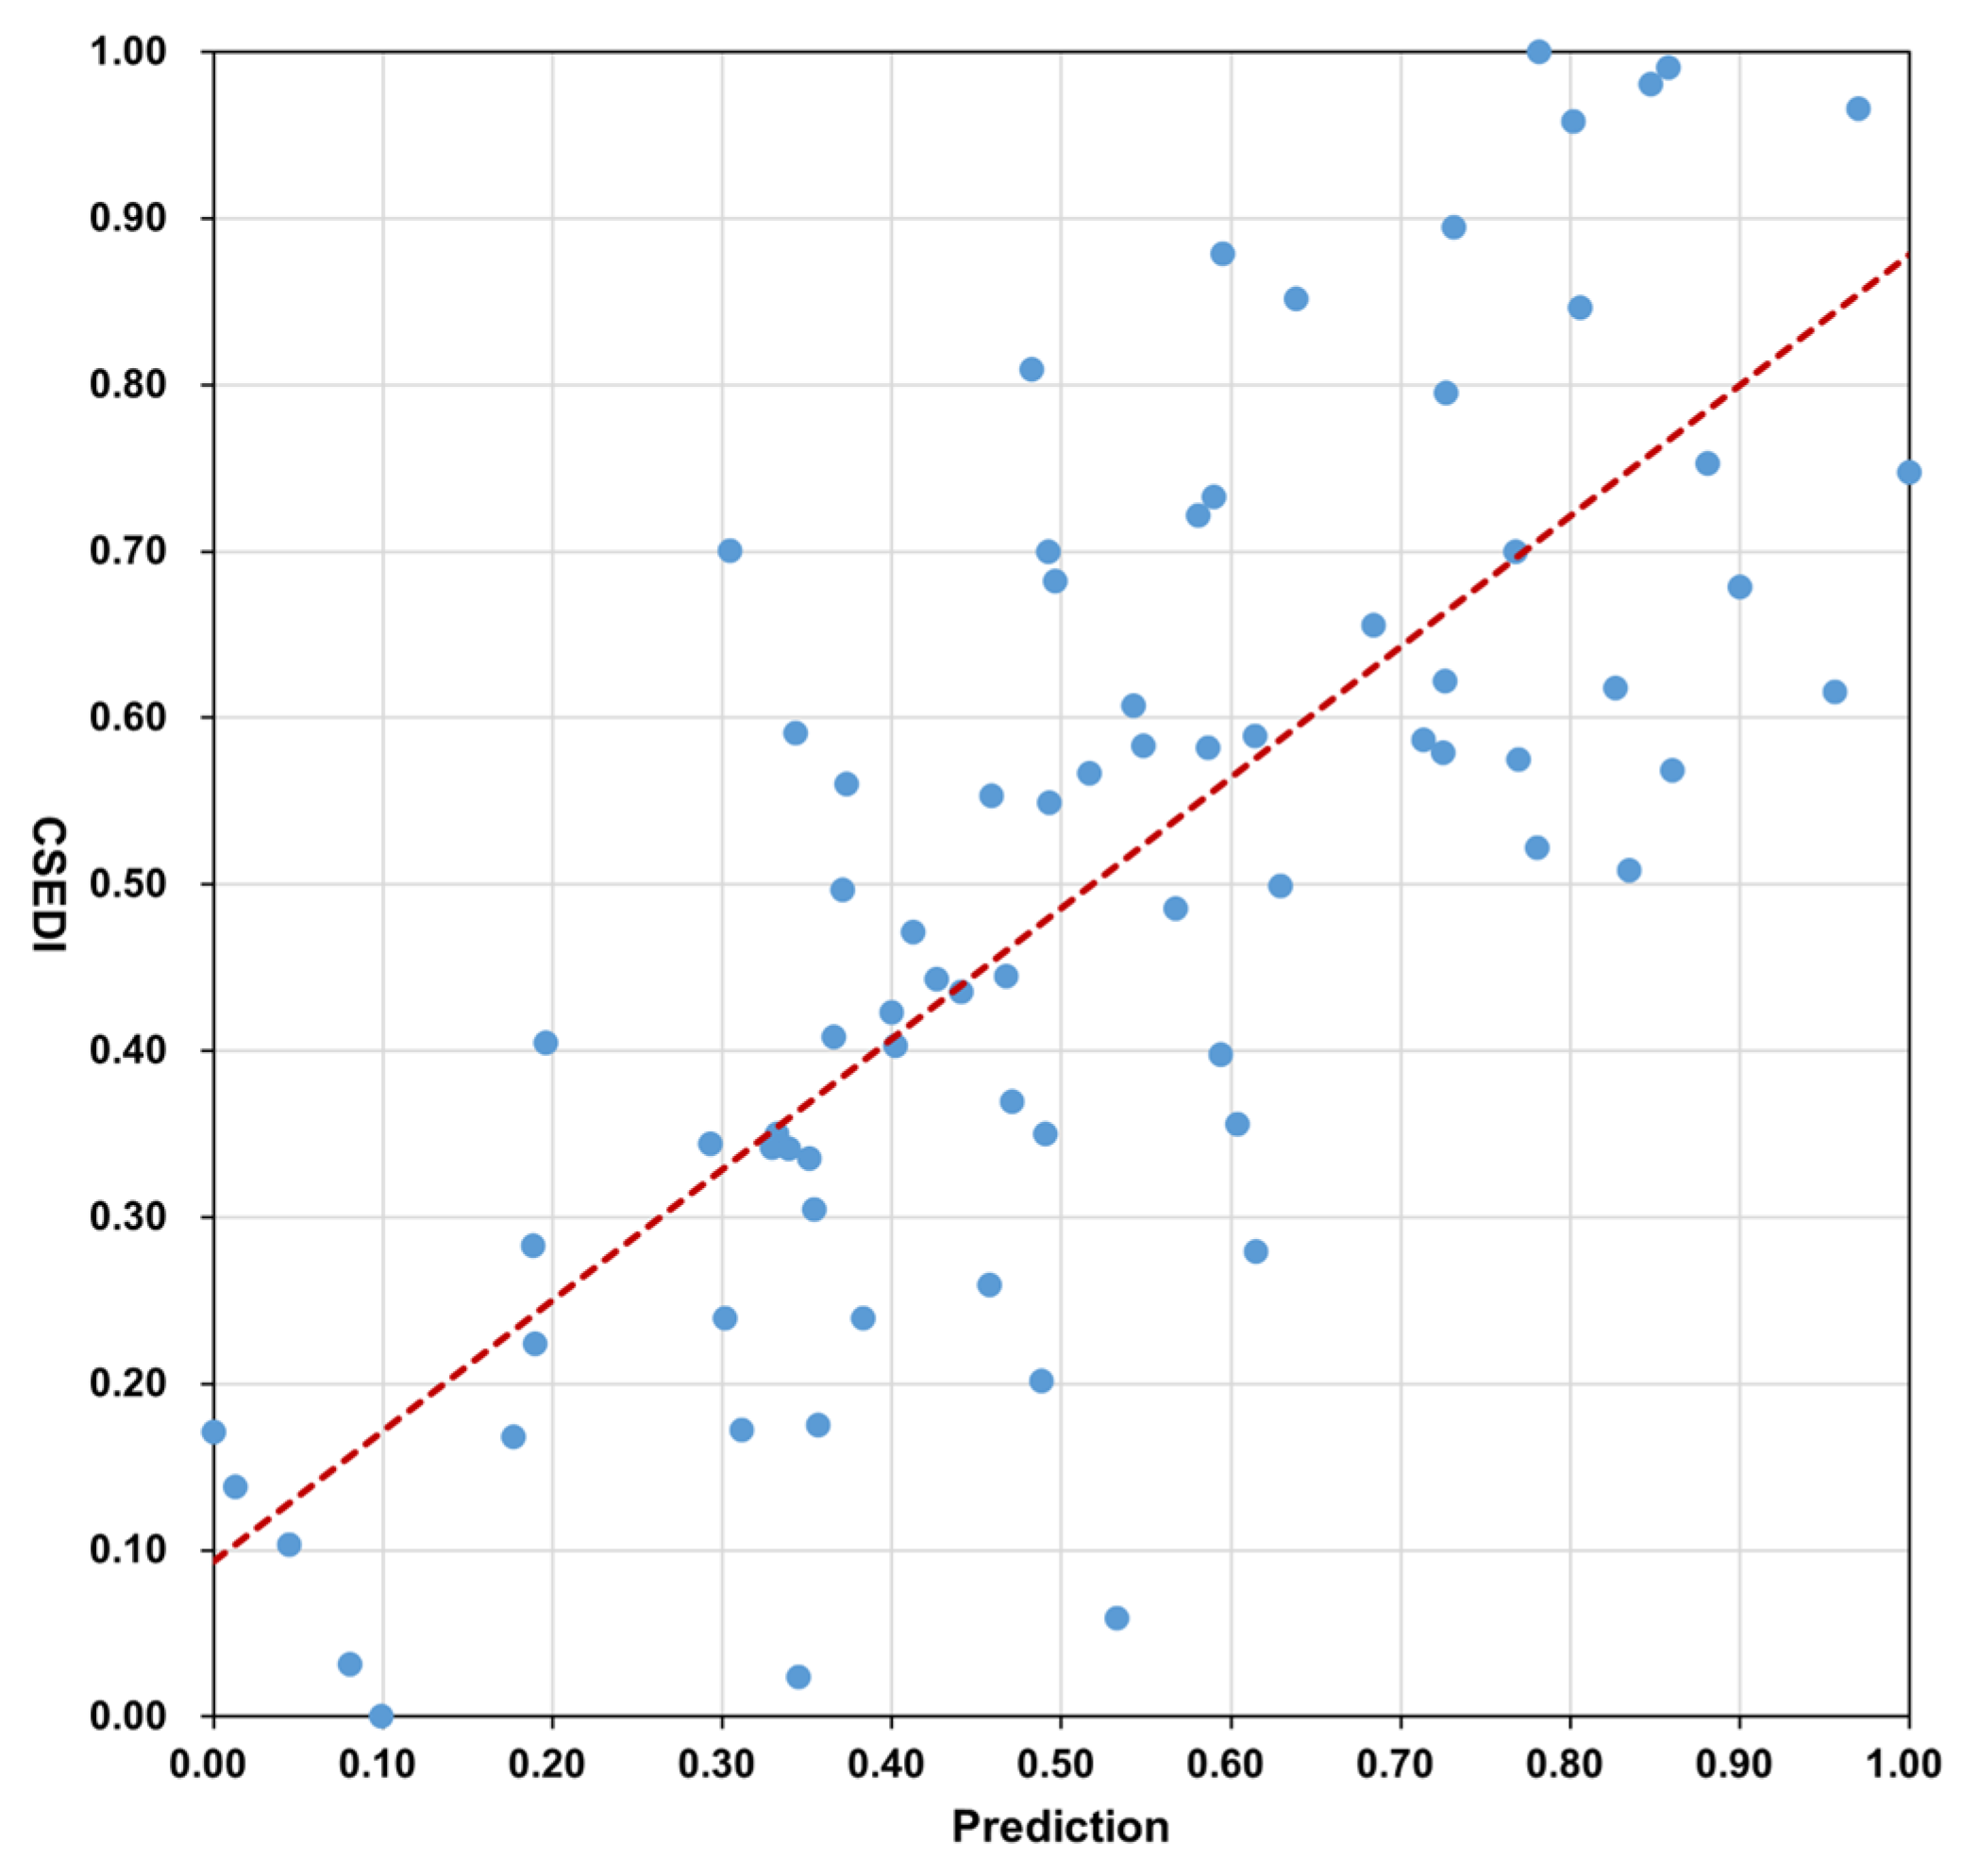
The regression analysis results indicate a moderate to strong linear relationship between the CSEDI and the principal components, evidenced by an R-value of 0.747. This suggests a robust linkage between our chosen variables and the overall TOD performance. The R-squared value of 0.558 implies that approximately 55.8% of the variability in the CSEDI score is accounted for by the independent variables selected for this model. Moreover, the variance inflation factor (VIF) values, ranging from 1.219 to 2.151, affirm that multicollinearity is not a concern within our model, ensuring that the regression coefficients are reliable, and the model is stable.
The deviation by 13% of the total CSEDI score from its predicted value highlights the model’s substantial predictive capacity, as illustrated in Figure 5 and detailed in Table 3. In Figure 5, each scatter point represents a TOD site. The horizontal axis is the predicted value from the linear regression model, and the vertical axis is the actual CSEDI value of the site. This deviation underscores the performance of the model in capturing the essential dynamics of TOD at the analyzed stations.
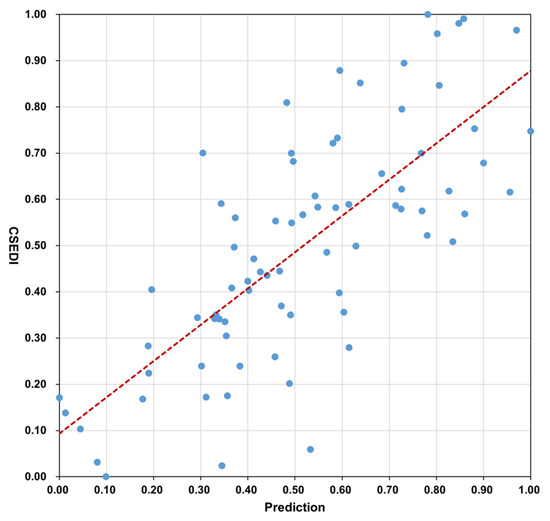
Figure 5.
The model’s predicted values vs. the CSEDI values.
Table 3.
Weights of the regression model.
We continue to analyze the outcomes of the regression model, utilizing several principal components as detailed in Section 3.1. All the selected components demonstrate a significance level of less than 0.1, indicating robust conclusions within a 90% confidence interval.
The analysis of Principal Component Variable 2 shows a weight of 0.004 and a significance of 0.038. This suggests that enhancing the value of this component could beneficially influence the overall performance of the TOD sites. Notably, this component emphasizes the need for maintaining comprehensive functionality within the station domain, aligning with the core principles of TOD. Principal Component Variable 3 bears a weight of −0.05 and a significance of 0.076. This component suggests that the presence of school facilities within the station’s vicinity positively impacts the performance of the station, likely reflecting public preferences for accessible educational infrastructure and policies. Principal Component Variable 8 presents a weight of 22120.007 with a significance of 0.02. The model indicates that increasing the number of station entrances and reducing service access costs can improve the performance of TOD sites, enhancing user convenience and station accessibility. Principal Component Variable 11 exhibits a weight of −0.117 and a significance of 0.04, highlighting the importance of improving connectivity between residential areas and key urban facilities such as medical centers, offices, and metro stations. This enhancement, particularly in terms of reducing walking distances, is deemed crucial for boosting site performance. Principal Component Variable 15 exhibits a weight of 0.105 with a significance of 0.035. This finding underscores that a station’s strategic role within the urban public transport network and its interchange design significantly influence its operational performance. The analysis of Principal Component Variable 18, with a weight of −0.079 and a significance of 0.066, suggests that a richer road network design, the enhanced centrality of the site, and the synergy between multiple commercial facilities contribute positively to the operational performance of the site. Lastly, Principal Component Variable 20 carries the most substantial weight of 0.191 with a significance of 0.009, marking it as the most influential in terms of model outcomes among all evaluated components. This component implies that administrative facilities with strong office attributes tend to draw external traffic for business purposes, thereby affecting the TOD site’s dynamics.
These findings from the regression model not only validate the multifaceted influences on TOD performance but also provide actionable insights into specific areas of development that can enhance the sustainability and functionality of transit-oriented sites.
4. Discussion
4.1. Spatial Analysis of TOD Performance
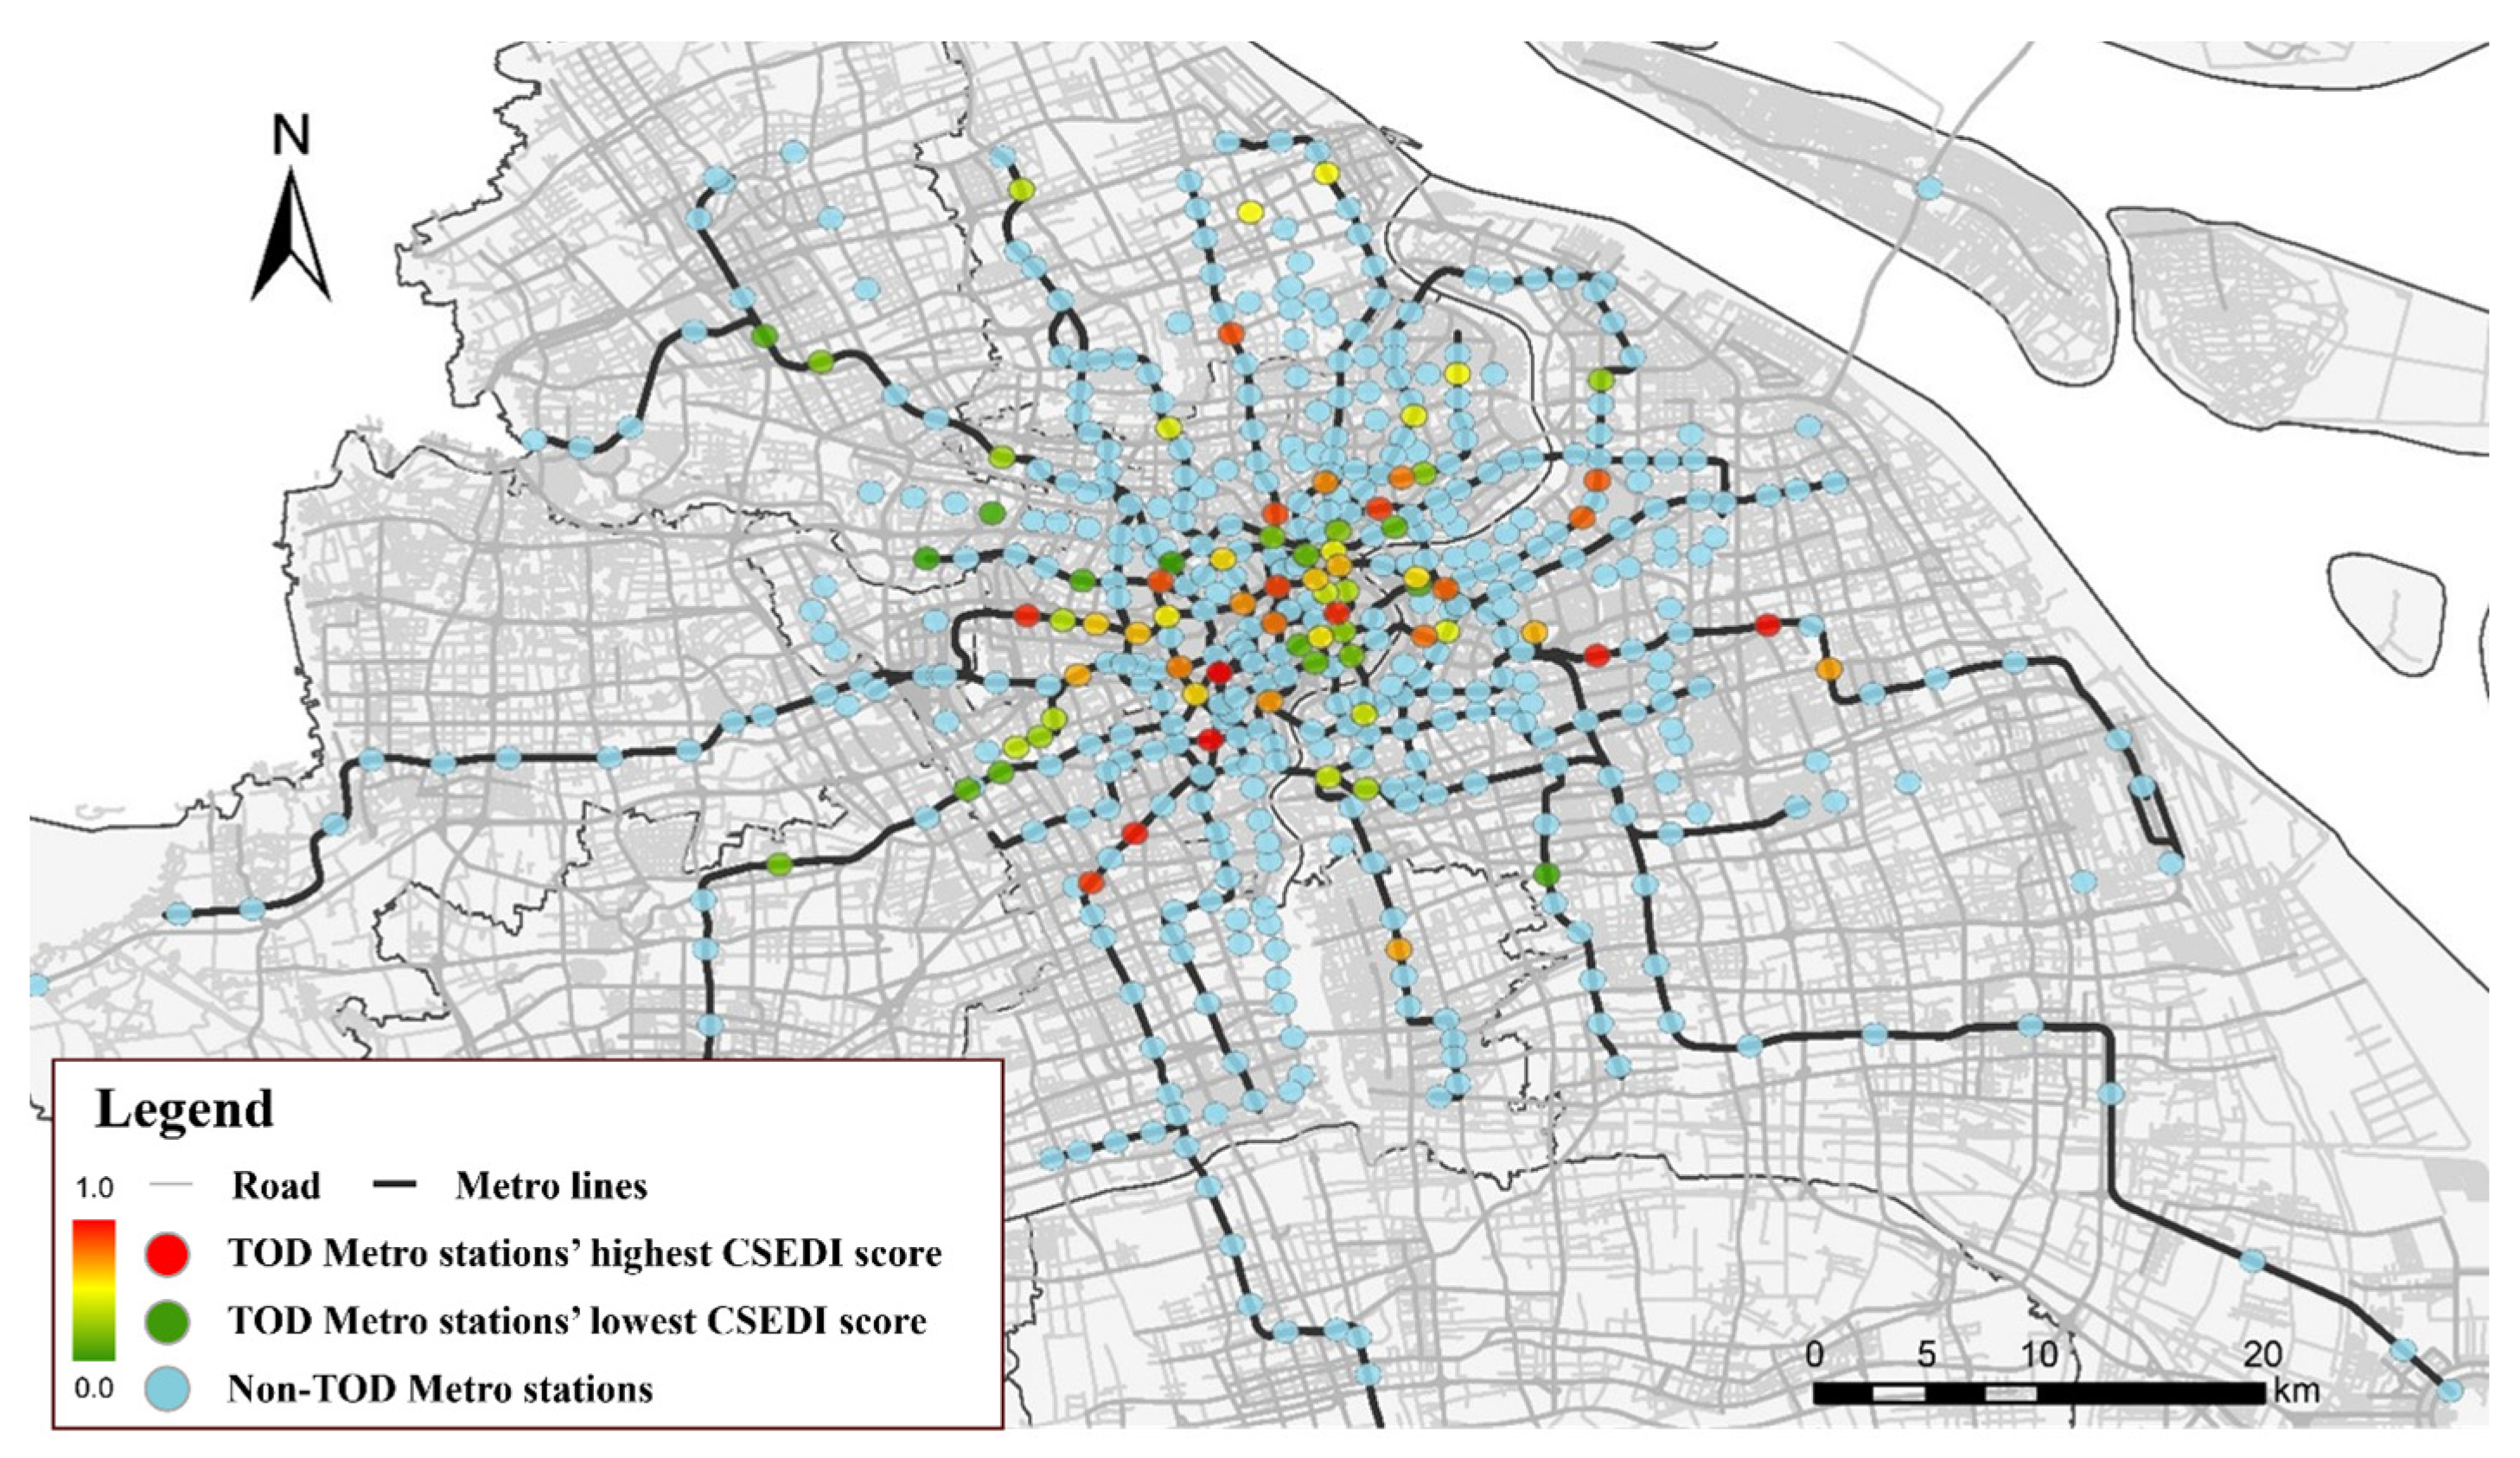
Figure 6, Figure 7 and Figure 8 each feature circles that represent a subway station and its 500 m buffer area. If a station is not a TOD site, it is colored blue. For TOD sites, a shift towards red indicates higher actual CSEDI values, higher predicted values, and larger prediction errors, respectively, in Figure 6, Figure 7 and Figure 8. Figure 6 and Figure 7 describe the spatial distribution of the CSEDI scores alongside the predictive scores for designated sites within Shanghai. The distribution in a spatial location shows a strong correlation between the model’s predictions and the actual scoring outcomes, particularly for sites that rank in the top 50% based on their scores. Notably, many of these high-scoring sites are characterized as significant transportation hubs, with a particular concentration around Lines 3 and 4, near the intersection with the outer elevated ring road.
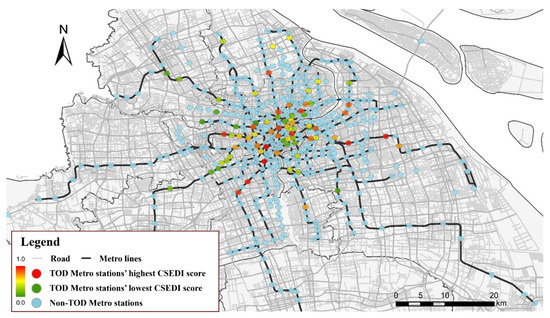
Figure 6.
Distribution of the CSEDI scores.

Figure 7.
Distribution of the scores from the predictive model.

Figure 8.
Distribution of absolute error values.
Line 3 runs from north to south through diverse residential and industrial zones, including three major railway stations. Line 4, or the Circle Line, is unique as Shanghai’s only complete loop line, encircling the central parts of the city and intersecting with nearly all other metro lines. In total, 50 percent of the stations on Line 3 are combined with Line 4. Lines 3 and 4 facilitate efficient transport for a significant daily workforce, thereby supporting residential and commercial development along their routes. As the most external of Shanghai’s three major ring expressways, the outer elevated ring road plays a vital role in the city’s traffic regulation policy. Vehicles with certain license plates are restricted from entering areas within and including this ring road. This strategic placement significantly enhances the transfer traffic and automobile accessibility at the rail transit stations adjacent to this expressway. Moreover, the peripheral location relative to the urban core provides an expansive land reservoir, which is conducive to development initiatives, coupled with lower associated costs, thereby enhancing the potential of transit hub sites in these zones.
We identified a pattern of high-performing TOD locations near Rail Transit Line 1, where five out of the ten highest-ranked CSEDI and predicted sites are situated. These stations on Line 1 handle substantial daily passenger volumes, a testament to their early establishment and operational longevity. Over the past decade, as Shanghai has expanded, essential services such as educational facilities, healthcare centers, and commercial zones have developed around these high-traffic routes. The confluence of well-established infrastructure and high passenger volumes at these stations translates into high performance; these findings echo those in other existing studies [37,53].
Another feature of the spatial data is the observed clustering effect among TOD sites. Typically, higher-scoring TOD stations exhibit a spatial separation exceeding 1.5 km, the same as the distance between stations in areas with moderate development density. In denser urban cores, however, the pattern often presents a unique scenario where stations with lower TOD efficiency are interspersed between higher-performing stations. This spatial arrangement highlights a significant developmental challenge: the collaboration between closely situated sites. Overlooking this factor can lead to the suboptimal strategic placement and underutilization of infrastructure, potentially diminishing the overall TOD performance of these areas.
4.2. Discrepancies in the Model Predictions and CSEDI Scores
Figure 8 showcases the spatial distribution of the absolute error between the CSEDI scores and model predictions. Stations in the central city generally exhibit CSEDI scores that are lower than predicted by the model, whereas stations in the suburbs tend to record higher scores than anticipated. Additionally, our analysis reveals a correlation coefficient of 0.5 between the subway ridership metrics and the prediction errors, suggesting that areas with high ridership frequently yield lower-than-expected model predictions.
Upon further examination of these discrepancies, we categorized the stations into types based on their characteristics and discrepancies. In the suburbs, stations such as Tangzhen and Jinqiao Road serve large commuting populations and are somewhat distant from the city center, yet they exhibit higher-than-predicted station patronage and population density. Similarly, stations such as Zhangjiang Hi-Tech and Jiangyue Road, which are nestled within areas dense with enterprises, also show higher usage rates, likely due to the significant employment opportunities they offer.
Conversely, certain urban stations, including Taipuqiao and Shanghai Railway Station, received higher predictive scores due to their accessibility and suitability for pedestrian traffic, despite their proximity to extensive infrastructure such as hospitals and their favorable positions within the subway network. Nevertheless, the actual CSEDI scores for these stations do not reflect this potential. This discrepancy can be attributed to several factors. First, the early development and slow pace of urban renewal in central city areas have led to a reduced population-carrying capacity and outdated infrastructure, diminishing the overall appeal of these stations. Second, the close proximity of stations within the city center leads to a diffusion of transit traffic to neighboring stations, impacting the expected performance metrics of individual stations.
4.3. Optimizing Transit-Oriented Development through Strategic Planning and Design
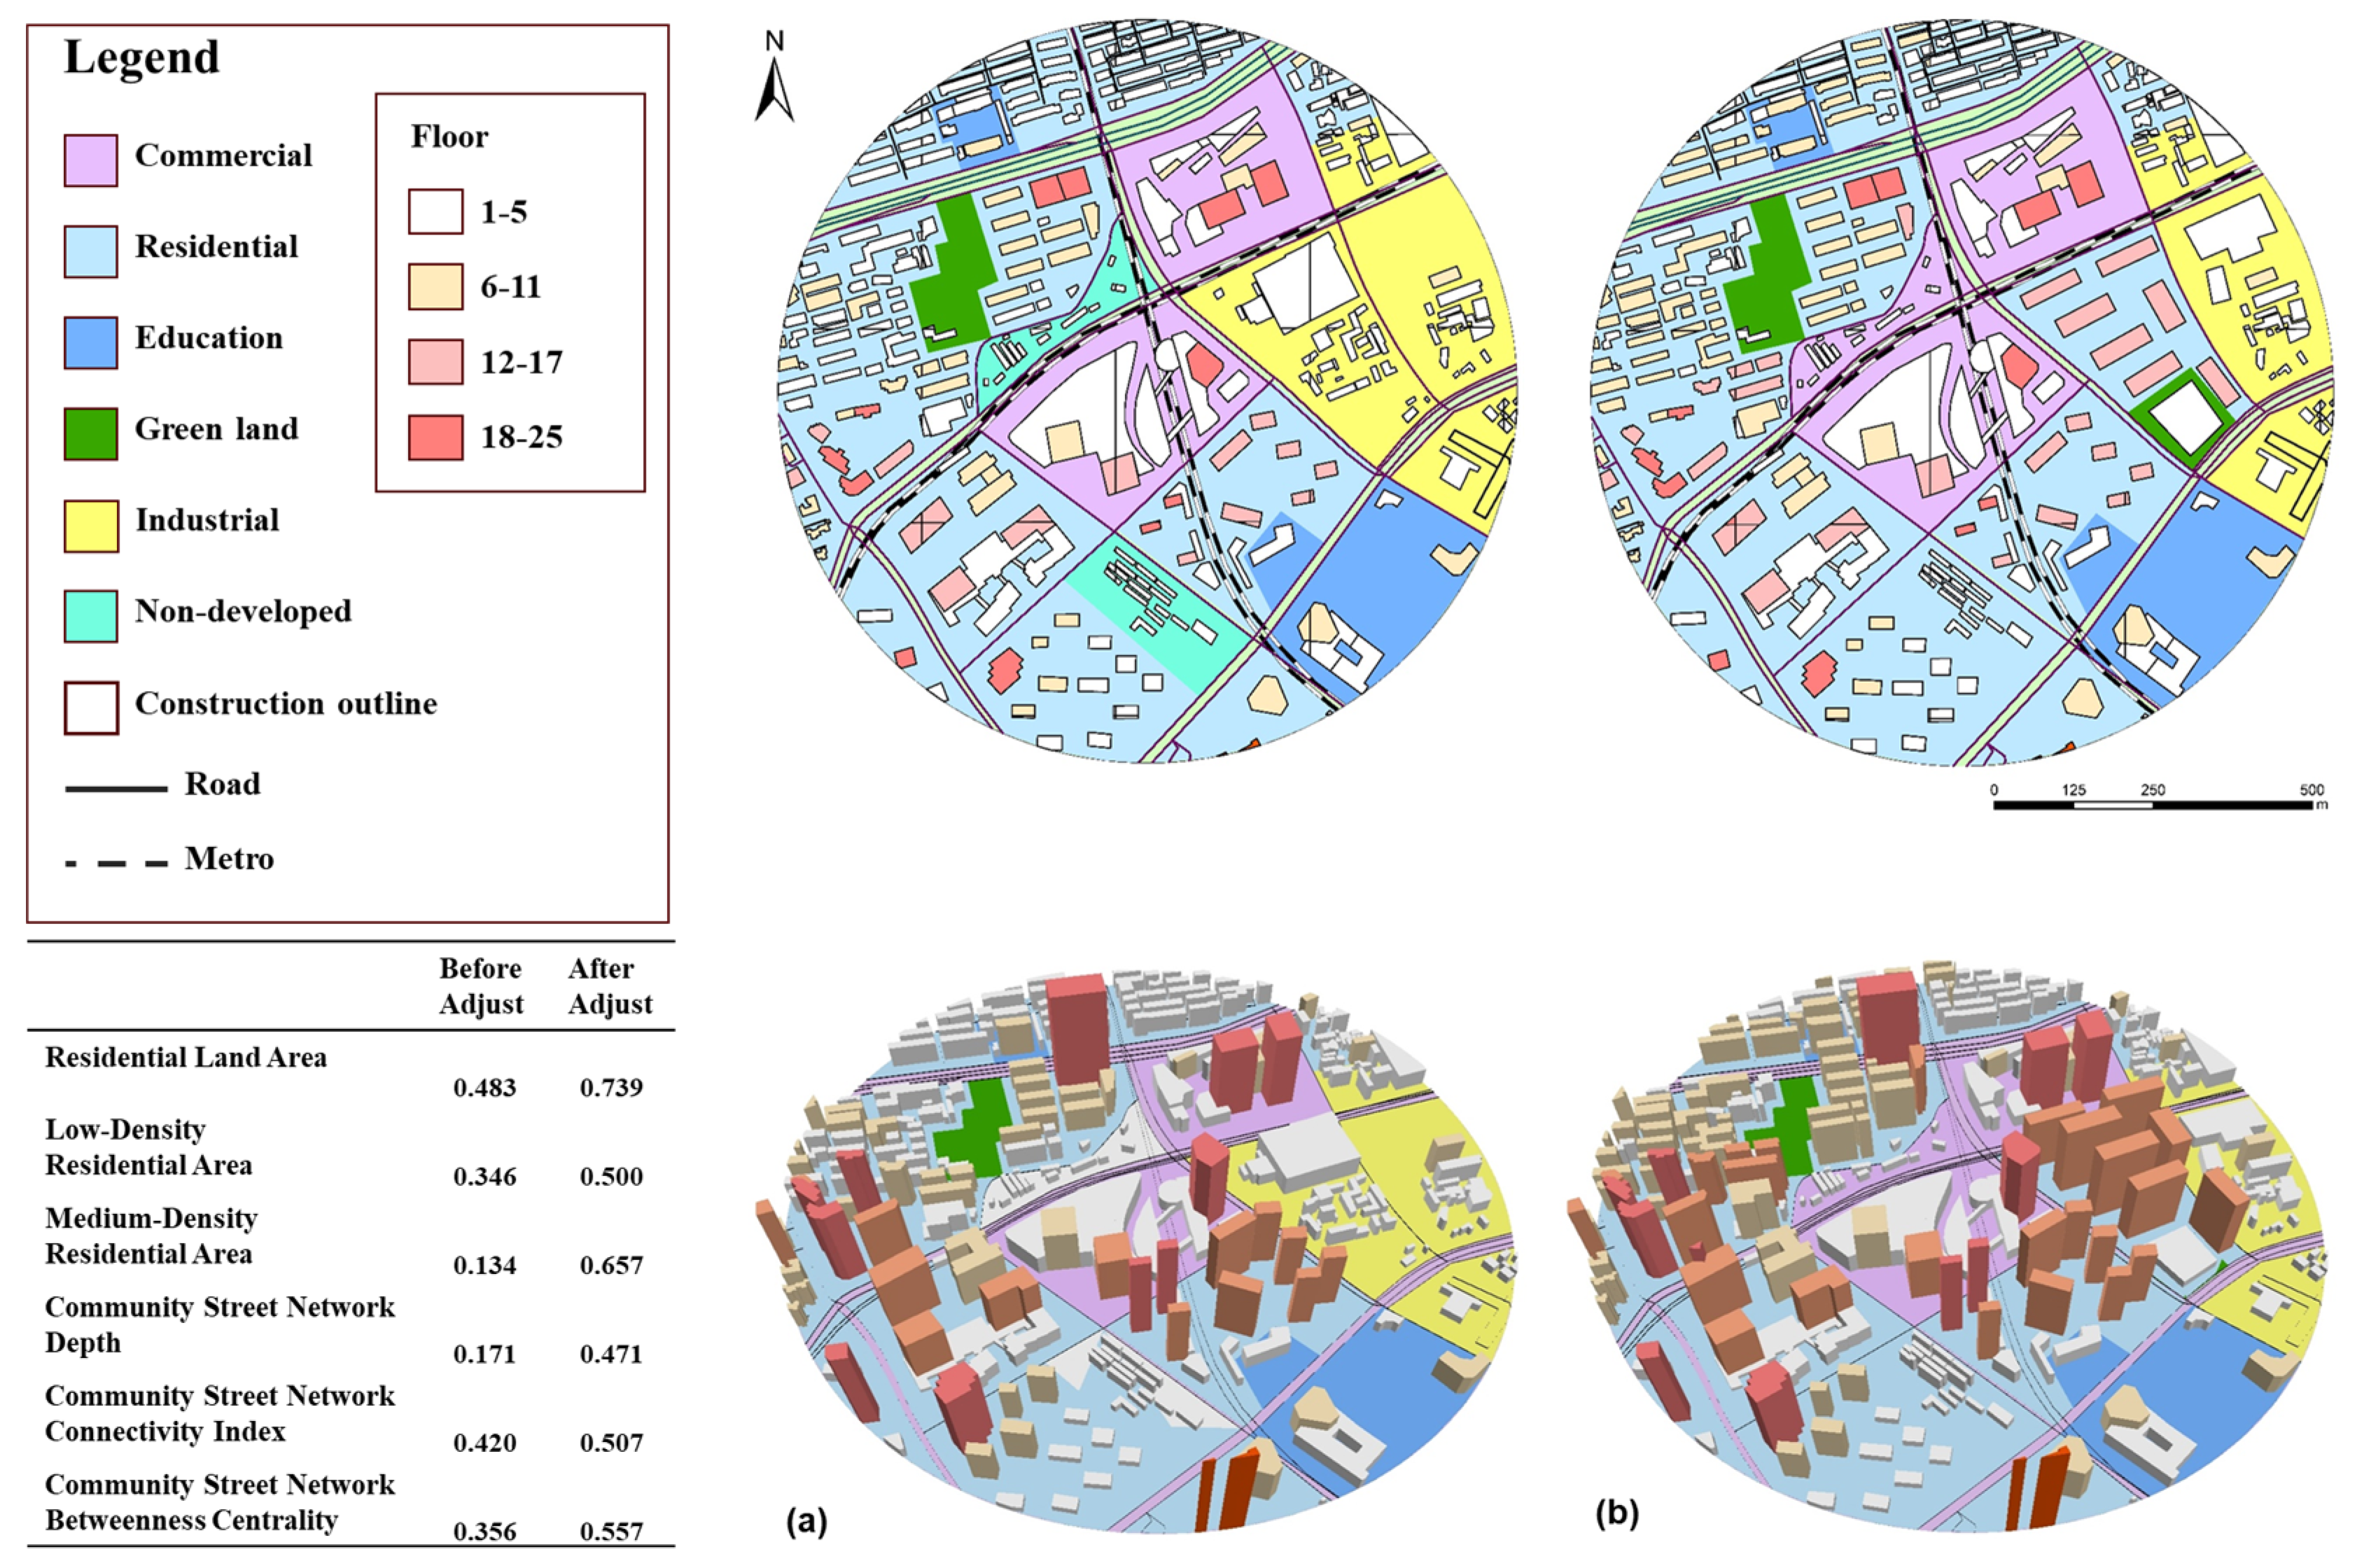
Utilizing the weights of each indicator within our predictive model, urban planners can effectively assess and adjust the planning schemes of TOD sites. For example, the Middle Longhua Road Station, initially scored at 0.389, ranked 35th among all of the stations evaluated. Located on the eastern side of Shanghai’s downtown and intersected by two subway lines, this station benefits from significant educational resources and certain locational advantages, as detailed in Figure 9. In Figure 9, panel (a) shows the two-dimensional plan and three-dimensional schematic of a site before redevelopment, and panel (b) displays the two-dimensional plan and three-dimensional schematic after redevelopment.

Figure 9.
Improved station design schemes based on the optimal evaluation indicator scores. (a,b) The top is the comparison of the plan view, the bottom is the comparison of the three-dimensional view, the left side is before the adjustment, the right side is after the adjust-ment.
Despite its strategic position, this TOD station faces challenges due to historical planning. The surrounding area is characterized by substantial undeveloped and industrial land, restricting the accessibility of services within a convenient walking distance from residential zones. The station exhibits high centrality within the rail network, yet its floor area ratio and network connectivity remain suboptimal compared to other stations of a similar caliber.
Based on these observations, we proposed targeted modifications to the station’s design scheme, which are aimed at improving the station’s medium- to long-term TOD performance through progressive development and urban renewal. Our recommendations include the construction of commercial and residential buildings on the undeveloped land and a reasonable increase in the density of the existing residential areas; the intensive development of the industrial land with the addition of residential areas and green spaces; and the incorporation of pedestrian paths to enhance the slow traffic system and increase accessibility to service facilities. These strategies align with the expert opinions we have gathered. Following the optimization measures, improvements were observed across six key indicators, including the residential land area and the depth of the station’s community street network. The station’s normalized predictive score subsequently rose from 0.389 to 0.571, with the normalized score post-optimization reaching 0.917, thereby elevating it to one of the top-performing stations of its type.
5. Conclusions
This research aimed to appraise the performance of transit-oriented development at urban rail transit stations using the analytical lens of multi-source urban big data. Focusing on Shanghai as a pivotal case study, this study quantitatively evaluated TOD performance using the Comprehensive Socio-Economic Development Index, explored the validity of this index, and investigated the principal factors influencing TOD performance through principal component analysis.
Our key findings underscore the efficacy of PCA for reducing dimensionality in multi-source big data; this is crucial for isolating significant independent variables that impact TOD. This methodological approach offers a framework for future TOD researchers to incorporate a comprehensive array of influencing factors in their analyses.
Moreover, this research validates the CSEDI as a potent index for assessing TOD performance, demonstrating a strong linear correlation with pertinent TOD indicators. This index, coupled with the evaluation methodology, is versatile and can be readily adapted to other urban contexts where similar open data resources are available.
The regression model highlights several key factors that contribute significantly to the success of transit-oriented development (TOD) sites. These include the comprehensive functionality of facilities within the TOD, the accessibility and connectivity of essential services, and the strategic design and positioning of transit stations within the urban network. These elements underscore the necessity of integrating functional diversity, ease of access, and effective station design to enhance TOD performance, providing valuable guidelines for urban planners and developers to foster more sustainable and efficient urban environments.
In conclusion, this study proposes an objective and promotable methodology for assessing TOD performance at rail transit stations. This methodology offers a perspective on the impacts of station location and design and the environmental context, enabling urban planners to swiftly modify spatial planning, development density, and land use in both existing and forthcoming station designs to promote sustainable urban growth.
However, while this methodology marks a significant advancement in TOD evaluation, it has certain limitations that warrant further exploration. Notably, the exclusion of a temporal dimension from the analysis poses a constraint; urban development is inherently dynamic, with timelines for station construction often spanning decades. Future studies incorporating time-series data could yield more profound insights into the long-term effects of TOD patterns on station efficacy. Additionally, extending the analytical boundary beyond the immediate 500 m radius around each station to include transport corridors and neighboring stations could provide a more comprehensive view of the intricate dynamics that characterize urban development.
6. Possible Directions for Future Studies
The indices developed in this paper are based on continually updated open data sources, providing a solid foundation for future researchers to explore changes over time in urban rail transit network station communities. Future research should consider incorporating time-series data to continuously monitor the temporal trends of various indicators at the stations. This longitudinal and cross-sectional comparison of model parameters and interpretative outcomes will enhance the understanding of the long-term impacts of TOD station development models on station efficacy.
Another limitation of the study is the insufficient consideration of the impact of transportation corridors on station efficacy. High-density development is a significant characteristic of Chinese cities. This study defined the research area with a 500 m radius, but many rail transit stations in Shanghai are located less than 1 km apart. Some stations within the study area lack uniqueness and irreplaceability, leading to functional overlap. Additionally, this delineation overlooks certain infrastructures that, while located more than 500 m from a station, significantly impact one or more stations, especially those along the same transit line, where their influence may be amplified. Future studies should consider inter-station interactions more comprehensively—for instance, by selecting multi-layered buffer zones to compare model parameter changes, thus exploring the differential impact ranges of various types of stations in practice. Alternatively, methods based on graph theory and geographic information systems could be used to quantify inter-station interactions and incorporate these into the numerical values of independent variables. This would allow for the consideration of TOD models from the perspectives of transportation corridors and station clusters, extending the application scope of TOD concepts from individual stations to corridors and even entire urban areas.
Author Contributions
Conceptualization, H.C., H.Z. and Z.Z.; methodology, H.C.; validation, H.C. and K.Z.; investigation, H.C. and H.Z.; resources, K.Z. and L.L.; data curation, H.C.; writing—original draft preparation, H.C.; writing—review and editing, K.Z., Z.Z. and L.L.; visualization, H.C.; supervision, Z.Z. All authors have read and agreed to the published version of the manuscript.
Funding
This research received no external funding.
Data Availability Statement
The data presented in this study are available upon request from the corresponding author due to safety regulatory requirements imposed by the relevant authorities.
Acknowledgments
We thank the Transportation Research Center at the SJTU for their technical support and acknowledge GPT-4 for assisting with manuscript polishing.
Conflicts of Interest
Author Kai Zhao was employed by the company HYP Architecture. The remaining authors declare that the research was conducted in the absence of any commercial or financial relationships that could be construed as a potential conflict of interest.
References
- Han, B.; Yang, Z.; Yu, Y.; Qian, L.; Chen, J.; Ran, J.; Sun, Y.; Xi, Z.; Lu, F. Statistical analysis of urban rail transit operation in the world in 2020: A review. Urban Rapid. Rail. Transit. 2021, 34, 5–11. [Google Scholar]
- Gao, W.; Sun, X.L.; Zhao, M.; Gao, Y.; Ding, H.R. Evaluate Human Perception of the Built Environment in the Metro Station Area. Land 2024, 13, 90. [Google Scholar] [CrossRef]
- Bai, L.; Xie, L.; Li, C.; Yuan, S.; Niu, D.; Wang, T.; Yang, Z.; Zhang, Y. The Conceptual Framework of Smart TOD: An Integration of Smart City and TOD. Land 2023, 12, 664. [Google Scholar] [CrossRef]
- Cervero, R.; Rood, T.; Appleyard, B. Tracking accessibility: Employment and housing opportunities in the San Francisco Bay Area. Environ. Plan. A 1999, 31, 1259–1278. [Google Scholar] [CrossRef]
- Vale, D.S. Transit-oriented development, integration of land use and transport, and pedestrian accessibility: Combining node-place model with pedestrian shed ratio to evaluate and classify station areas in Lisbon. J. Transp. Geogr. 2015, 45, 70–80. [Google Scholar] [CrossRef]
- Knowles, R.D.; Ferbrache, F.; Nikitas, A. Transport’s historical, contemporary and future role in shaping urban development: Re-evaluating transit oriented development. Cities 2020, 99, 102607. [Google Scholar] [CrossRef]
- Caset, F.; Derudder, B.; Witlox, F.; Teixeira, F.M.; Boussauw, K. Planning for nodes, places, and people in Flanders and Brussels: An empirical railway station assessment tool for strategic decision-making. J. Transp. Land Use 2019, 12, 811–837. [Google Scholar] [CrossRef]
- Li, Z.; Han, Z.; Xin, J.; Luo, X.; Su, S.; Weng, M. Transit oriented development among metro station areas in Shanghai, China: Variations, typology, optimization and implications for land use planning. Land Use Policy 2019, 82, 269–282. [Google Scholar] [CrossRef]
- Thomas, R.; Pojani, D.; Lenferink, S.; Bertolini, L.; Stead, D.; van der Krabben, E. Is transit-oriented development (TOD) an internationally transferable policy concept? Reg. Stud. 2018, 52, 1201–1213. [Google Scholar] [CrossRef]
- Wu, W.; Divigalpitiya, P. Assessment of Accessibility and Activity Intensity to Identify Future Development Priority TODs in Hefei City. Land 2022, 11, 1590. [Google Scholar] [CrossRef]
- Ibraeva, A.; de Almeida Correia, G.H.; Silva, C.; Antunes, A.P. Transit-oriented development: A review of research achievements and challenges. Transp. Res. Part A Policy Pract. 2020, 132, 110–130. [Google Scholar] [CrossRef]
- Calthorpe, P. The Next American Metropolis: Ecology, Community, and the American Dream; Princeton Architectural Press: New York, NY, USA, 1993. [Google Scholar]
- Cervero, R.; Kockelman, K. Travel demand and the 3Ds: Density, diversity, and design. Transp. Res. Part D Transp. Environ. 1997, 2, 199–219. [Google Scholar] [CrossRef]
- Wey, W.-M.; Zhang, H.; Chang, Y.-J. Alternative transit-oriented development evaluation in sustainable built environment planning. Habitat. Int. 2016, 55, 109–123. [Google Scholar] [CrossRef]
- Thomas, R.; Bertolini, L. Defining critical success factors in TOD implementation using rough set analysis. J. Transp. Land Use 2017, 10, 139–154. [Google Scholar] [CrossRef]
- Bertolini, L. Nodes and places: Complexities of railway station redevelopment. Eur. Plan. Stud. 1996, 4, 331–345. [Google Scholar] [CrossRef]
- Cervero, R. Transit-Oriented Development in the United States: Experiences, Challenges, and Prospects; The National Academies Press: Washington, DC, USA, 2004. [Google Scholar]
- Lyu, G.; Bertolini, L.; Pfeffer, K. Developing a TOD typology for Beijing metro station areas. J. Transp. Geogr. 2016, 55, 40–50. [Google Scholar] [CrossRef]
- Jamme, H.-T.; Rodriguez, J.; Bahl, D.; Banerjee, T. A twenty-five-year biography of the TOD concept: From design to policy, planning, and implementation. J. Plan. Educ. Res. 2019, 39, 409–428. [Google Scholar] [CrossRef]
- Rodríguez, D.A.; Kang, C.D. A typology of the built environment around rail stops in the global transit-oriented city of Seoul, Korea. Cities 2020, 100, 102663. [Google Scholar] [CrossRef]
- Huang, R.; Grigolon, A.; Madureira, M.; Brussel, M. Measuring transit-oriented development (TOD) network complementarity based on TOD node typology. J. Transp. Land Use 2018, 11, 305–324. [Google Scholar] [CrossRef]
- Zhang, L.Z.; Hou, P.; Qiang, D. Transit-Oriented Development in New Towns: Identifying Its Association with Urban Function in Shanghai, China. Buildings 2022, 12, 1394. [Google Scholar] [CrossRef]
- Amini Pishro, A.; L’Hostis, A.; Chen, D.; Amini Pishro, M.; Zhang, Z.; Li, J.; Zhao, Y.; Zhang, L. The Integrated ANN-NPRT-HUB Algorithm for Rail-Transit Networks of Smart Cities: A TOD Case Study in Chengdu. Buildings 2023, 13, 1944. [Google Scholar] [CrossRef]
- Amini Pishro, A.; Yang, Q.; Zhang, S.; Amini Pishro, M.; Zhang, Z.; Zhao, Y.; Postel, V.; Huang, D.; Li, W. Node, place, ridership, and time model for rail-transit stations: A case study. Sci. Rep. 2022, 12, 16120. [Google Scholar] [CrossRef] [PubMed]
- Shi, D.H.; Fu, M.C. How Does Rail Transit Affect the Spatial Differentiation of Urban Residential Prices? A Case Study of Beijing Subway. Land 2022, 11, 1729. [Google Scholar] [CrossRef]
- Singh, Y.; Zuidgeest, M.; Flacke, J.; van Maarseveen, M. A design framework for measuring transit oriented development. WIT Trans. Built Environ. 2012, 128, 719–730. [Google Scholar]
- Seong, E.Y.; Lee, N.H.; Choi, C.G. Relationship between Land Use Mix and Walking Choice in High-Density Cities: A Review of Walking in Seoul, South Korea. Sustainability 2021, 13, 810. [Google Scholar] [CrossRef]
- Pan, H.J.; Huang, Y. TOD typology and station area vibrancy: An interpretable machine learning approach. Transp. Res. Part A Policy Pract. 2024, 186, 104150. [Google Scholar] [CrossRef]
- Shuai, C.; Shan, J.; Bai, J.; Lee, J.; He, M.; Ouyang, X. Relationship analysis of short-term origin–destination prediction performance and spatiotemporal characteristics in urban rail transit. Transp. Res. Part A Policy Pract. 2022, 164, 206–223. [Google Scholar] [CrossRef]
- Singh, Y.J.; Lukman, A.; Flacke, J.; Zuidgeest, M.; Van Maarseveen, M. Measuring TOD around transit nodes-Towards TOD policy. Transp. Policy 2017, 56, 96–111. [Google Scholar] [CrossRef]
- Singh, Y.J.; He, P.; Flacke, J.; Maarseveen, M. Measuring TOD over a region using GIS based multiple criteria assessment tools. Space 2015, 19, 1–22. [Google Scholar]
- Higgins, C.; Kanaroglou, P. Rapid transit, transit-oriented development, and the contextual sensitivity of land value uplift in Toronto. Urban Stud. 2018, 55, 2197–2225. [Google Scholar] [CrossRef]
- Yi, Z.; Zhang, Z.H.; Wang, H.M. Measuring metro station area’s TODness: An exploratory study of Shenyang based on multi-source urban data. Trans. GIS 2024, 28, 623–653. [Google Scholar] [CrossRef]
- Lin, J.-J.; Lin, T.-Y.; Kadali, B.R.; Subbarao, S.S. Zone-based TOD evaluation considering interdependences among criteria and zones. Transp. Policy 2023, 133, 108–119. [Google Scholar] [CrossRef]
- Li, S.; Chen, L.; Zhao, P. The impact of metro services on housing prices: A case study from Beijing. Transportation 2019, 46, 1291–1317. [Google Scholar] [CrossRef]
- Nelson, A.C.; Eskic, D.; Hamidi, S.; Petheram, S.J.; Ewing, R.; Liu, J.H. Office rent premiums with respect to light rail transit stations: Case study of Dallas, Texas, with implications for planning of transit-oriented development. Transp. Res. Rec. 2015, 2500, 110–115. [Google Scholar] [CrossRef]
- Qiang, D.; Zhang, L.; Huang, X. Quantitative evaluation of TOD performance based on multi-source data: A case study of Shanghai. Front. Public Health 2022, 10, 820694. [Google Scholar] [CrossRef] [PubMed]
- Sung, H.; Oh, J.-T. Transit-oriented development in a high-density city: Identifying its association with transit ridership in Seoul, Korea. Cities 2011, 28, 70–82. [Google Scholar] [CrossRef]
- Cucuzzella, C.; Owen, J.; Goubran, S.; Walker, T. A TOD index integrating development potential, economic vibrancy, and socio-economic factors for encouraging polycentric cities. Cities 2022, 131, 103980. [Google Scholar] [CrossRef]
- Zhang, T.; Yan, Y.B.; Chen, Q.; Liu, Z. Evaluation Method of Composite Development Bus Terminal Using Multi-Source Data Processing. Land 2022, 11, 1757. [Google Scholar] [CrossRef]
- Zhao, Y.R.; Hu, S.H.; Zhang, M. Evaluating equitable Transit-Oriented development (TOD) via the Node-Place-People model. Transp. Res. Part A-Policy Pract. 2024, 185, 104116. [Google Scholar] [CrossRef]
- Huang, J.; Chen, S.; Xu, Q.; Chen, Y.; Hu, J. Relationship between built environment characteristics of TOD and subway ridership: A causal inference and regression analysis of the Beijing subway. J. Rail Transp. Plan. Manag. 2022, 24, 100341. [Google Scholar] [CrossRef]
- An, D.D.; Tong, X.; Liu, K.; Chan, E.H.W. Understanding the impact of built environment on metro ridership using open source in Shanghai. Cities 2019, 93, 177–187. [Google Scholar] [CrossRef]
- Shanghai Municipal Transportation Commission. 2023 Shanghai Urban Rail Transit Service Quality Evaluation Results. 2023. Available online: https://jtw.sh.gov.cn/zxzfxx/20240208/b00cc25787c84ab08c415eb49e38b2de.html (accessed on 8 February 2024).
- Dittmar, H.; Ohland, G. The New Transit Town: Best Practices in Transit-Oriented Development; Island Press: Washington, DC, USA, 2012. [Google Scholar]
- Cervero, R.; Murakami, J. Rail and property development in Hong Kong: Experiences and extensions. Urban Stud. 2009, 46, 2019–2043. [Google Scholar] [CrossRef]
- Bertolini, L. Spatial development patterns and public transport: The application of an analytical model in the Netherlands. Plan. Pract. Res. 1999, 14, 199–210. [Google Scholar] [CrossRef]
- Su, S.L.; Wang, Z.L.; Li, B.Z.; Kang, M.J. Deciphering the influence of TOD on metro ridership: An integrated approach of extended node-place model and interpretable machine learning with planning implications. J. Transp. Geogr. 2022, 104, 103455. [Google Scholar] [CrossRef]
- Su, S.L.; Zhang, H.; Wang, M.; Weng, M.; Kang, M.J. Transit-oriented development (TOD) typologies around metro station areas in urban China: A comparative analysis of five typical megacities for planning implications. J. Transp. Geogr. 2021, 90, 102939. [Google Scholar] [CrossRef]
- Salat, S.; Ollivier, G. Transforming the Urban Space through Transit-Oriented Development: The 3V Approach; World Bank: Washington, DC, USA, 2017. [Google Scholar]
- Suzuki, H.; Cervero, R.; Iuchi, K. Transforming Cities with Transit: Transit and Land-Use Integration for Sustainable Urban Development; World Bank Publications: Washington, DC, USA, 2013. [Google Scholar]
- Kaiser, H.F. The application of electronic computers to factor analysis. Educ. Psychol. Meas. 1960, 20, 141–151. [Google Scholar] [CrossRef]
- Zhou, J.; Yang, Y.; Gu, P.; Yin, L.; Zhang, F.; Zhang, F.; Li, D. Can TODness improve (expected) performances of TODs? An exploration facilitated by non-traditional data. Transp. Res. Part D Transp. Environ. 2019, 74, 28–47. [Google Scholar] [CrossRef]


Disclaimer/Publisher’s Note: The statements, opinions and data contained in all publications are solely those of the individual author(s) and contributor(s) and not of MDPI and/or the editor(s). MDPI and/or the editor(s) disclaim responsibility for any injury to people or property resulting from any ideas, methods, instructions or products referred to in the content. |
© 2024 by the authors. Licensee MDPI, Basel, Switzerland. This article is an open access article distributed under the terms and conditions of the Creative Commons Attribution (CC BY) license (https://creativecommons.org/licenses/by/4.0/).