Abstract
Against the backdrop of rapid urbanization and coordinated development in the Beijing–Tianjin–Hebei region of China, urban residential land prices in Hebei Province have experienced significant increases, exacerbating housing pressures on residents. This study aims to elucidate the spatio-temporal evolution characteristics of urban residential land prices, identify the key influencing factors in Hebei Province of China, and offer insights on macro-control of the land market, optimization of the land supply structure, and guidance on the sustainable development of land and real estate markets in the region. Utilizing land price monitoring data from 11 prefecture-level cities in Hebei Province spanning the past five years, this research employs quantitative methods, such as the Theil index, the standard deviation ellipse, and the geographic detector model, to analyze the spatio-temporal dynamics and factors shaping urban residential land prices. The results show that: (1) Urban residential land prices in Hebei Province exhibited an overall upward trend from 2018 to 2022, characterized by pronounced spatial variations, with higher prices predominantly concentrated in the cities along the Shijiazhuang–Baoding–Langfang–Tangshan corridor; (2) The distribution pattern of urban residential land prices generally mirrors that of GDP, indicating a consistent movement of price centers with urban land price escalation; (3) Urban land prices are influenced by multiple factors in combination, where the interactions among these factors outweigh the impact of any single factor. Specifically, the proportion of GDP attributed to the tertiary industry and location conditions emerge as pivotal factors affecting urban residential land prices in Hebei Province. Given these significant spatial disparities, addressing the industrial structure and optimizing urban land resource allocation are critically imperative.
1. Introduction
China’s property reform in the late 20th century precipitated the rapid growth of the real estate sector. Bolstered by vigorous urbanization and substantial governmental backing, real estate swiftly emerged as a cornerstone industry that was crucial for national economic advancement [1]. Presently, the housing market constitutes a pivotal segment within the broader real estate sphere [2], intimately intertwined with economic progress and societal stability, thereby assuming critical significance in national welfare. Against a backdrop of swift urbanization, residential property prices in China’s primary and secondary cities have surged, spotlighting the enduring challenge of balancing urban population expansion against limited land resources [3]. Addressing the 20th National Congress of the Communist Party of China, Xi Jinping underscored the imperative of “advancing Chinese-style modernization through coordinated regional development” [4]. Integral to this vision, the integrated development of the Beijing–Tianjin–Hebei region places Hebei Province at a strategic crossroads, tasked with effectively managing the inflow of migrants to ensure sustainable urban expansion [5,6]. Land, as the foundational asset underpinning regional economic progress, assumes paramount importance in property development and construction [7]. Particularly, residential land prices serve as a barometer of the land’s economic utility and exert significant influence on the overall property market dynamics. Hence, understanding the spatial trajectory of urban land expansion vis-à-vis residential land prices is imperative in addressing the housing needs of burgeoning urban populations.
Urban residential land prices exert a pivotal influence on urban land price dynamics, directly shaping urban form and economic structure adjustments [8,9]. Consequently, comprehending urban residential land prices is crucial in facilitating informed land transactions [10] and formulating scientifically grounded urban planning strategies that align with city development trends [11,12]. Therefore, investigating the spatio-temporal evolution patterns and determinants of urban residential land prices in Hebei Province holds profound theoretical and practical significance for urban economic development and meticulous spatial management.
At present, domestic and international scholars have amassed extensive research on urban residential land prices, primarily categorized into two approaches: theoretical model development [13,14] and empirical analysis to identify the factors influencing residential land prices [15,16]. In the context of rapid urbanization, Ethiopia’s urban land policy represents a pivotal determinant influencing the efficacy of urban land utilization [17]. Similarly, urban planning policies within the Spanish city of Badajoz constitute a critical factor impacting land valuations [18]. Nonetheless, the correlation between urban housing dynamics and land prices remains a subject of ongoing debate [19]. Urban residential land prices exhibit regional characteristics, with spatial correlations observed among cities within the same region. Pollakowski [20] asserts that urban residential land prices are interdependent, typically decreasing with greater distances. Pede [21], using a spatial vector autoregressive model, uncovered significant spillover effects among diverse urban areas. Most models addressing urban residential land prices consider scale effects, analyzing these prices from the macro [22], meso [23], and micro [24] perspectives. However, existing research suffers from a notable absence of dynamic, continuous real-time monitoring of residential land prices throughout entire urban areas, compounded by inadequate accuracy and comprehensiveness in theoretical model construction and empirical analysis. Consequently, this study directs its focus to provincial-level cities as its research domain [25], utilizing real-time dynamic monitoring data on urban residential land prices [26]. This methodological approach endeavors to dynamically, promptly, accurately, and consistently depict the dynamics of the land market and fluctuations in land prices, thereby mitigating transactional price anomalies and benchmark price discontinuities.
Utilizing an exploratory spatial data analysis [27] and geo-statistics [16], researchers have been able to discern the spatio-temporal distribution patterns of urban residential land prices. These analyses have highlighted regional disparities and fluctuations in housing prices across Chinese urban areas, underscoring significant spatial correlations and regional variations. Consequently, there is a need for further investigation into the determinants of urban residential land prices, given the complexity and uncertainty that are inherent in their fluctuations. At the national level [28,29], the factors influencing urban residential land prices include government policies and broader socio-economic developments, while at the local level [30,31], transportation, education, and healthcare infrastructure play pivotal roles. Numerous studies have accumulated substantial findings on these influencing factors. Some scholars have analyzed changes in urban residential land prices by considering dynamic variables such as land prices, industrial concentration, and urban scale [26,32]. Others have employed the Geographically Weighted Regression (GWR) model to study how factors like transportation, community environment, and green spaces impact urban residential land prices [33,34]. However, while the GWR model captures spatial heterogeneity in research findings, the GeoDector model offers a more comprehensive approach. By integrating an interaction detector among its four sub-models, the GeoDector model quantifies the interactive forces among pairwise factors (X) affecting the dependent variable (Y). This framework provides a nuanced understanding of how multiple factors collectively influence urban residential land prices [35]. Therefore, this study aims to elucidate the mechanisms through which various influencing factors impact urban residential land prices by employing the GeoDector model.
The coordinated development of the Beijing–Tianjin–Hebei region, coupled with the decentralization of non-capital functions from Beijing and industrial relocations from Beijing and Tianjin, has underscored the urgent need for diverse land resources in underdeveloped areas of Hebei Province. This transformation has propelled certain cities in Hebei Province into regional focal points, attracting substantial inflows of external investment and population. Particularly notable is the “Jing-Jin-Tang” area, strategically positioned at the heart of the Beijing–Tianjin–Hebei region, which has geographical advantages that have rendered it one of the most dynamic hubs for human, logistical, and informational activities. Consequently, there has been an upward trajectory in urban residential land prices, intensifying the persistent upward trend in land values across this region.
In the context of the coordinated development of the Beijing–Tianjin–Hebei region, Hebei Province of China faces significant challenges and opportunities related to urban residential land prices. This study focuses on understanding the spatio-temporal evolution and influencing factors of these prices at the provincial level, particularly in 11 prefecture-level cities in Hebei Province. Utilizing continuous monitoring data on urban land prices spanning 20 quarters from 2018 to 2022, the study employs geostatistical methods and standard deviation ellipses to analyze the spatio-temporal evolution characteristics and migration directions of urban residential land prices. By employing these techniques, the research aims to elucidate how these prices vary across different regions and over time within Hebei Province. Moreover, the study intends to identify key factors influencing land prices using the geographic detector model. This analytical approach helps in pinpointing crucial variables that affect land prices, which is essential for government decision-making. It can assist in adjusting the scale and optimizing the structure and layout of the land supply. Furthermore, leveraging land effectively can contribute to economic development and guide the healthy, stable, and coordinated growth of the land and real estate markets in the Beijing–Tianjin–Hebei region. Ultimately, this research holds both theoretical significance and practical value by providing insights into the dynamics of urban residential land prices, thereby supporting informed policy-making and regional development strategies.
2. Overview of the Study Area and Data Sources
2.1. Overview of the Study Area
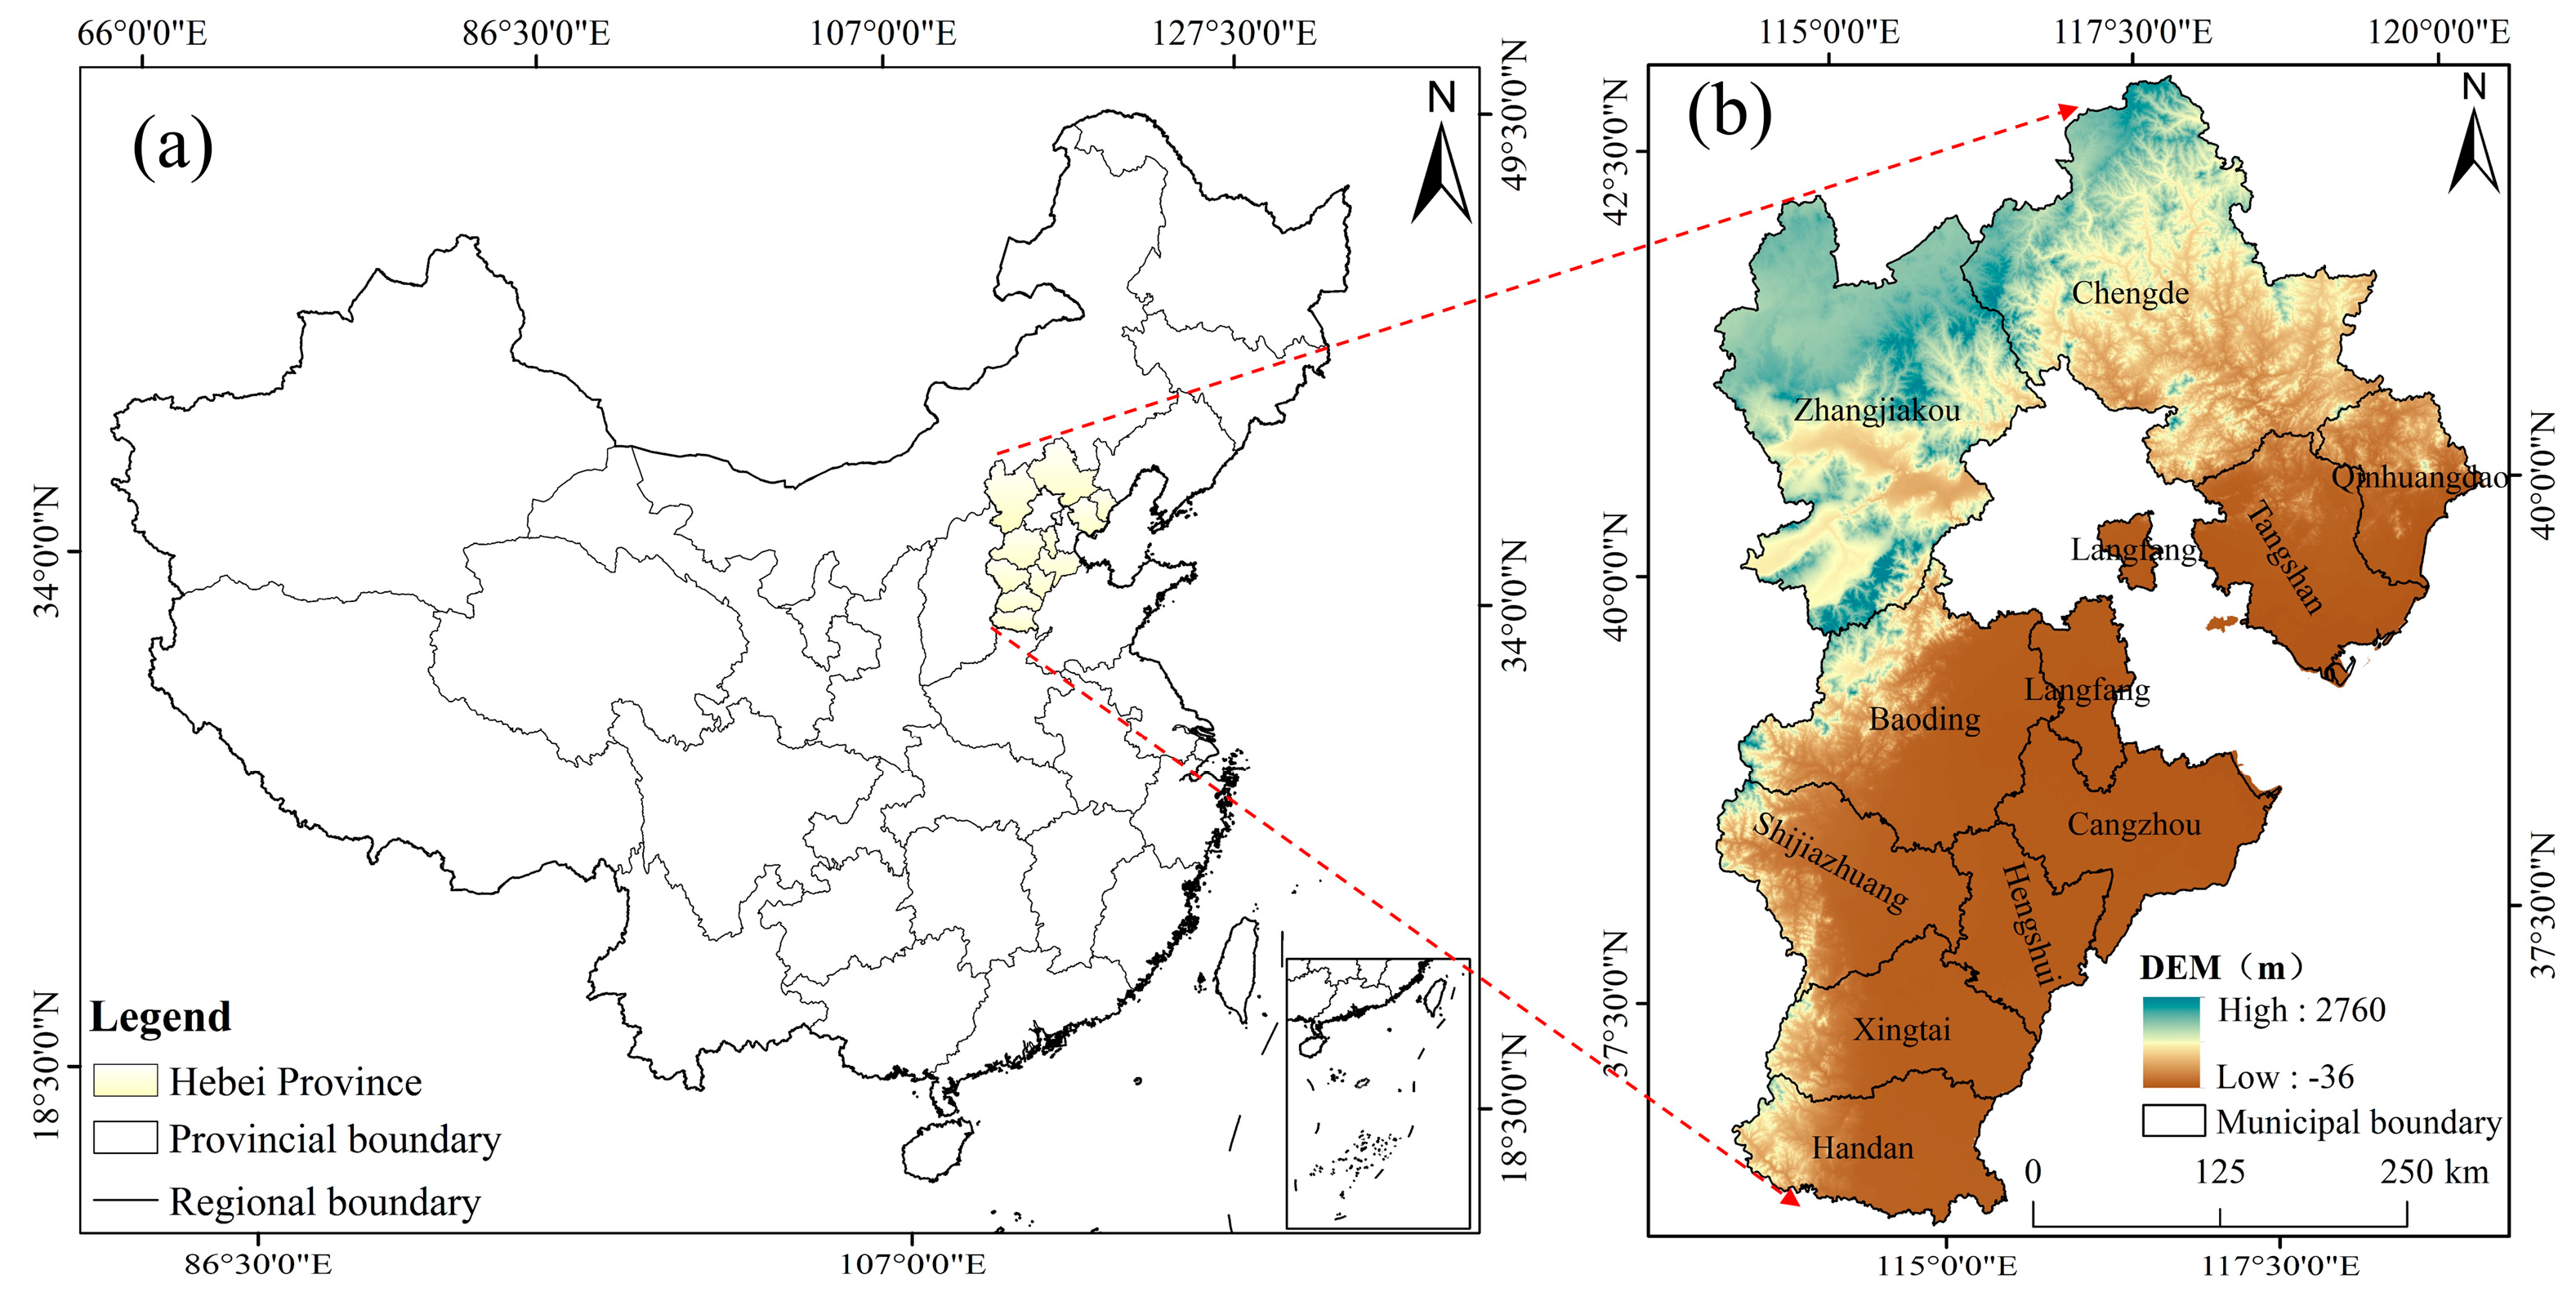
Hebei Province of China, encompassing 11 prefecture-level cities and 167 counties, plays a significant role within the Beijing–Tianjin–Hebei urban agglomeration. Geographically, Hebei spans between 113°27′ E to 119°50′ E longitude and 36°05′ N to 42°40′ N latitude (Figure 1). The province exhibits a diverse topography, characterized by higher elevations in the west and north, and lower elevations in the east and south, with its eastern border adjoining the Bohai Sea. The average annual precipitation is 484.5 mm, with an average annual temperature of 14.6 °C. Based on topographical features, geographical location, proximity to Beijing and Tianjin, and socio-economic development levels, this study categorizes Baoding and Langfang as peri-Beijing–Tianjin cities; Tangshan, Qinhuangdao, and Cangzhou as coastal cities; Shijiazhuang, Xingtai, Hengshui, and Handan as central-southern Hebei cities; and Zhangjiakou and Chengde as northwestern Hebei cities, thus delineating four distinct regions. As of the end of 2023, Hebei Province of China has a total population of 73.93 million and a gross domestic product (GDP) of 4.39441 trillion yuan.

Figure 1.
Overview of the study area. (a) Location of Hebei Province of China, (b) Hebei Province DEM.
2.2. Data Sources
The urban residential monitoring land price data in this study originate from the land market dynamic monitoring system of Hebei Province. According to the technical specifications for urban land price dynamic monitoring issued by the ministry of natural resources, multiple multi-purpose land price monitoring points have been established in 11 prefecture-level cities and are evaluated quarterly. By aggregating the weighted average land prices from these monitoring points, the monitoring land prices for commercial, residential, and industrial land in each city are determined. These data are subsequently reported to the land market dynamic monitoring system of Hebei Province and are published on a quarterly basis. This study utilizes monitoring land price data spanning 20 consecutive quarters over the past five years, which provide a more precise and timely reflection of the land market operation and price trends. Data pertaining to urbanization level, economic development, infrastructure, and city size are sourced from the Hebei Statistical Yearbook (http://tjj.hebei.gov.cn/hetj/tjsj/jjnj/, accessed on 1 April 2024), the China Urban Construction Statistical Yearbook (https://www.mohurd.gov.cn/gongkai/fdzdgknr/sjfb/tjxx/jstjnj/index.html, accessed on 6 April 2024), and the National Economic and Social Development Statistical Bulletin of various cities. Geographic spatial data are obtained from the National Basic Geographic Information System (https://www.ngcc.cn/, accessed on 13 February 2024). ArcGIS 10.6 was developed by Environmental Systems Research Institute, Inc. and is located in the city of Redlands, California, USA.
3. Methodology
3.1. Theil Index
The Theil index serves as a widely accepted metric for assessing income distribution inequality within distinct domains or geographic areas [36,37]. Typically, a lower value of the Theil index signifies a more equitable distribution of income, whereas a higher value indicates heightened income inequality. In this study, the Theil index is employed to offer a lucid portrayal of variations in urban residential land prices across four delineated regions within Hebei Province of China. The formula for its computation is outlined as follows [38]:
where TP represents the Theil index for region p, which ranges from [0, 1]. A smaller Theil index indicates less disparity in urban residential land prices within region p, while a larger index signifies greater disparity. KP denotes the number of cities in region p; Spq represents the residential land price of the city q in region p; and stands for the average residential land price of the cities in region p.
3.2. Standard Deviation Ellipse Method
Standard deviation ellipses serve as visualization tools to characterize the dispersion and correlation within multidimensional datasets [39,40]. They offer a quantitative interpretation from a global and spatial perspective of the centrality, distribution, orientation, and spatial morphology of geographical elements’ spatial arrangement [41].
The size of the ellipse indicates the concentration of spatial patterns across elements. An increase in the ellipse’s area suggests an expanding spatial distribution when the elements’ growth rates in the outer region exceed those in the inner region, whereas a decrease indicates a contraction [42]. The long and short axes of the ellipse, respectively, represent the orientation and the extent of element distribution. A higher eccentricity, denoting a greater disparity between these axes, signifies a more pronounced orientation of the elements, whereas a lower eccentricity suggests a less distinct orientation.
In this study, standard deviation ellipses are utilized to precisely describe the spatial distribution, orientation, dispersion, and variability of urban residential land prices in Hebei Province. Parameters such as axis lengths, ellipse area, and center are employed to reflect the spatial distribution characteristics [43]. The specific formula for standard deviation ellipses is provided below:
where SEDx is the length of the semi-major axis x; SEDy is the length of the semi-minor axis y; θ is the azimuth angle; σx is the standard deviation along axis x; σy is the standard deviation along axis y; n is the total number of samples in the study area; xi and yi are the spatial location coordinates of the study object; and are the arithmetic mean centers; and and are the differences between the arithmetic mean centers and and the coordinates x and y [44].
3.3. Geographical Detector Model
The geographic detector model is adept at discerning spatial variations in single-variable factors (stratified heterogeneity) and investigating how the spatial distribution of two-variable factors may interact, thereby analyzing the potential causal relationships between them [45,46]. Moreover, the model can elucidate how the interactions between factors influence land prices [47]. The formula is presented below:
where q is the degree of influence of the factor, with a value range of [0, 1]. The larger the value of q, the greater the degree of influence of the factor. N is the total number of samples; Nh is the number of samples in the stratum h; and and are the variances of the stratum h and the entire area, respectively; L stands for stratification [48].
3.4. Indicator Selection
Indicator selection is guided by principles such as data availability, scientific rationale, comprehensiveness, and the influence of dominant factors to investigate changes in urban residential land prices. Drawing on prior studies concerning factors impacting land prices [49,50] and tailored to Hebei Province’s specific context, this research explores the key determinants. Five dimensions were identified: urbanization level, economic development, location characteristics, basic infrastructure, and city size, encompassing a detailed analysis of nine indicators closely tied to residential land prices (Table 1).

Table 1.
Factors and variables affecting residential land prices in Hebei Province.
Regarding the urbanization level, the indicator chosen was the urbanization rate, as the growth in urban populations significantly drives up residential land prices. Economic development was represented by three indicators: per capita GDP, the share of GDP contributed by the tertiary sector, and urban residents’ disposable income [51]. These metrics gauge urban economic vigor and residents’ living standards, both positively influencing land prices. Location characteristics were assessed through the straight-line distance from Beijing, Tianjin, and the provincial capital. Infrastructure considerations included the road network density, the hospital bed capacity, and high school enrollment, which reflect the adequacy of urban amenities. Finally, city size was measured by built-up area, serving as a pivotal gauge of city scale and development, with larger areas typically correlating with higher land prices.
4. Results
4.1. Changes in Residential Land Prices in Cities in Hebei Province
4.1.1. Temporal Characteristics of Urban Residential Land Prices
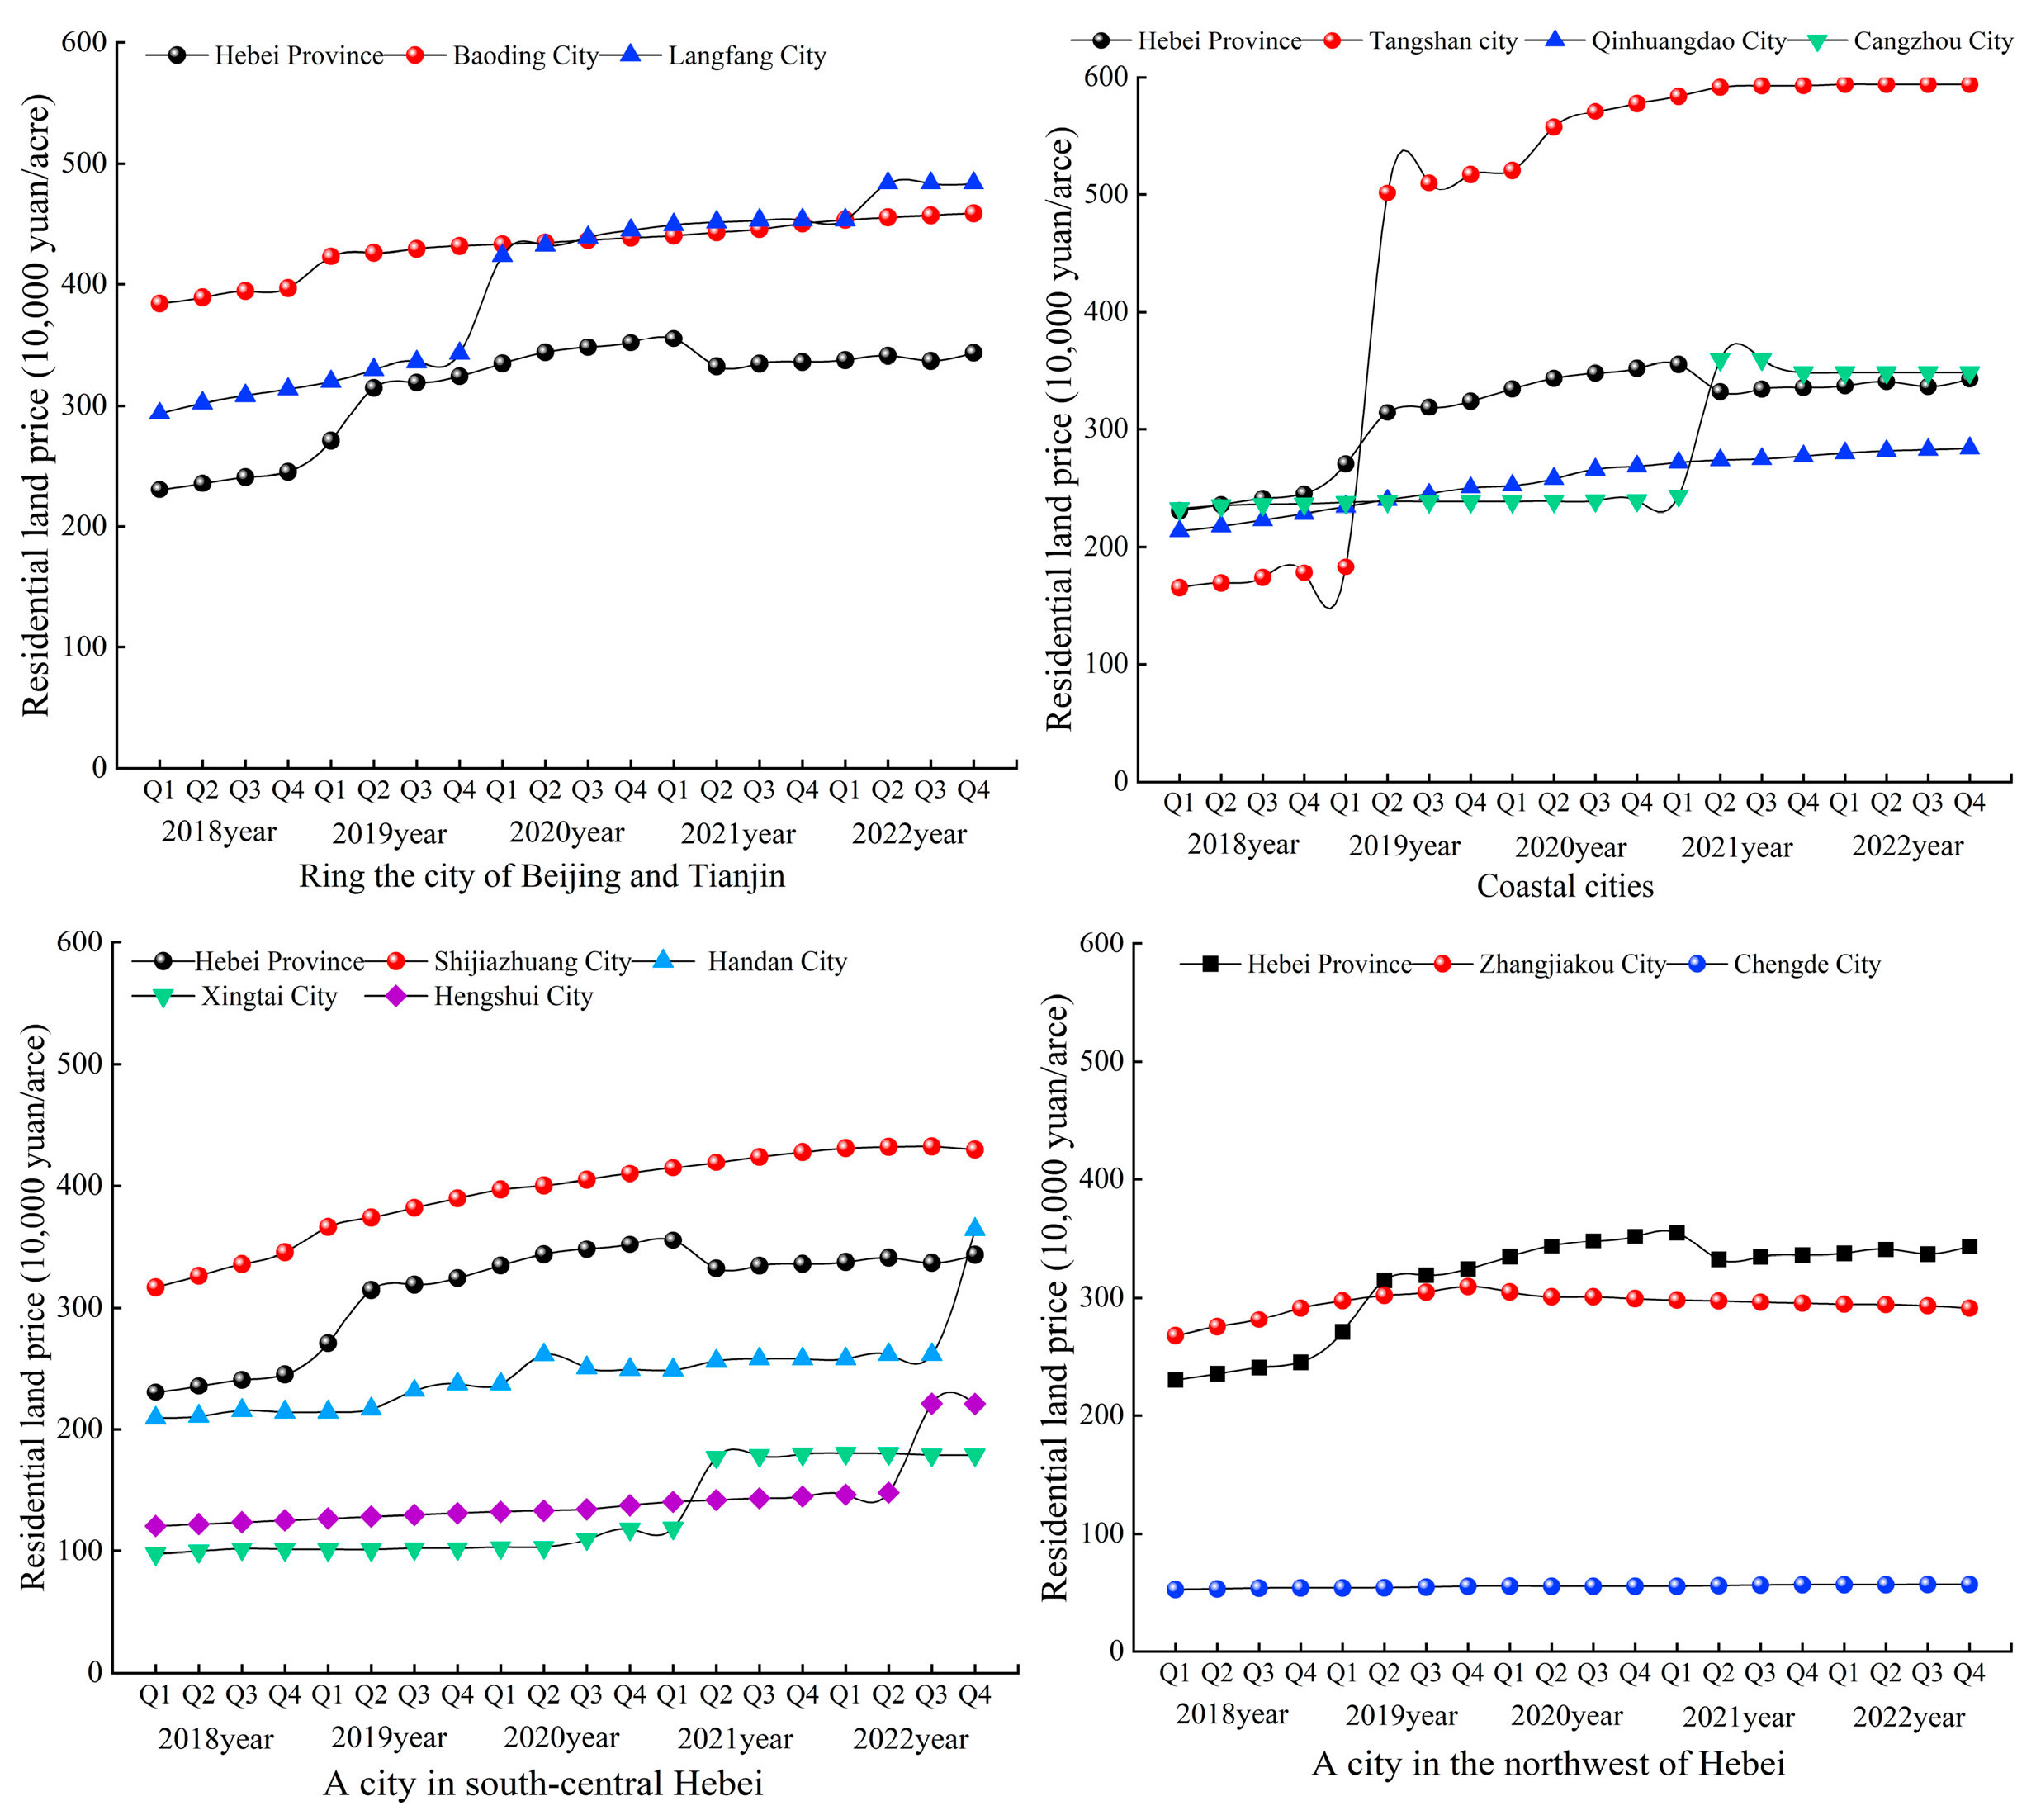
The land price monitoring data spanning 20 consecutive quarters from 2018 to 2022 in Hebei Province of China (Figure 2) were analyzed to delineate the dynamics of land price fluctuations across 11 cities distributed among four distinct regions. Over this period, residential land prices in Hebei Province exhibited a consistent upward trajectory. Notably, coastal cities, those in close proximity to Beijing and Tianjin, and southern central Hebei cities displayed accelerated growth rates. Tangshan City stood out with the most rapid increase, soaring from 1,652,000 yuan per acre in Q1 2018 to 5,940,700 yuan per acre by Q4 2022, marking a 2.59-fold rise. Following closely, Xingtai City saw its land prices escalate from 976,600 yuan per acre in Q1 2018 to 1,792,900 yuan per acre in Q4 2022, reflecting an 83.59% increase. Similarly, Langfang City experienced a growth from 2,935,300 yuan per acre in Q1 2018 to 4,838,000 yuan per acre in Q4 2022, representing a growth rate of 64.82%. In contrast, land prices in northwestern Hebei Province exhibited slower growth, with all growth rates below 10%.
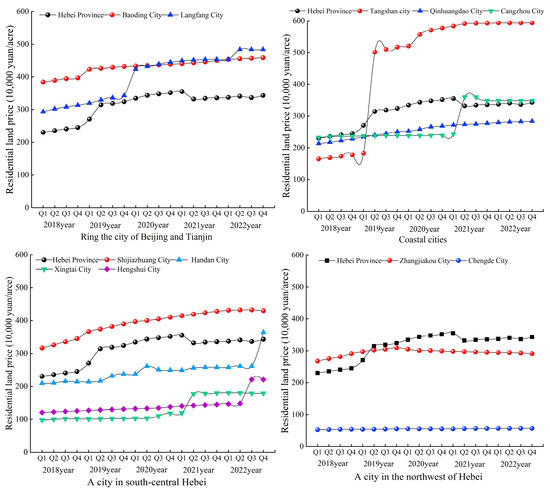
Figure 2.
Line chart of urban residential land price change in Hebei Province from 2018 to 2022.
Tangshan City’s residential land prices exhibited a remarkable leapfrog growth, surpassing those in the vicinity of Beijing and Tianjin to lead the province. Beginning at 1,652,000 yuan per acre in Q1 2018, Tangshan’s prices surged starting from Q2 2019 to reach 5,016,000 yuan per acre, culminating at 5,940,700 yuan per acre by Q4 2022. This surge can be attributed primarily to adjustments in the monitoring points and plot ratios implemented in 2019. Coupled with the ascendance of the Beijing–Tianjin–Tangshan metropolitan area, Tangshan’s robust economic expansion has been a key driver behind the rapid escalation in urban residential land prices.
From 2018 to 2022, residential land prices in the southern cities of central Hebei Province, namely Xingtai, Hengshui, and Handan, experienced significant growth rates of 83.59%, 82.67%, and 74.12%, respectively. As of the fourth quarter of 2022, the residential land prices in these cities stood at 1,792,900 yuan per acre, 2,206,700 yuan per acre, and 3,646,000 yuan per acre, respectively. Despite these increases, the overall land price level remains relatively low compared with the cities surrounding Beijing and Tianjin, as well as the coastal cities. In contrast, Shijiazhuang, the provincial capital city, demonstrated a steady rise in land prices from 3,168,700 yuan per acre in the first quarter of 2018 to 4,325,300 yuan per acre in the third quarter of 2022. However, there was a slight decrease to 4,300,000 yuan per acre in the fourth quarter of 2022. Due to its status as the provincial capital, Shijiazhuang enjoys relatively higher land prices compared with the southern cities of Hebei Province, yet they remain lower than those in the cities surrounding Beijing and Tianjin.
4.1.2. Spatial Distribution Features of Urban Residential Land Prices
To explore the spatial distribution of residential monitoring land prices in Hebei Province comprehensively, this study applies the ArcGIS 10.6 natural breakpoints method to classify average residential land prices from 2018 to 2022. Specifically, four breakpoints—1,426,700, 2,562,700, 2,948,600, and 3,999,600—are determined. The resulting classification categorizes residential monitoring land prices across various cities in Hebei Province into five distinct levels: low (land price ≤ 1,426,700), lower (1,426,700 < land price ≤ 2,562,700), medium (2,562,700 < land price ≤ 2,948,600), higher (2,948,600 < land price ≤ 3,999,600), and high (land price > 3,999,600) (Figure 3).
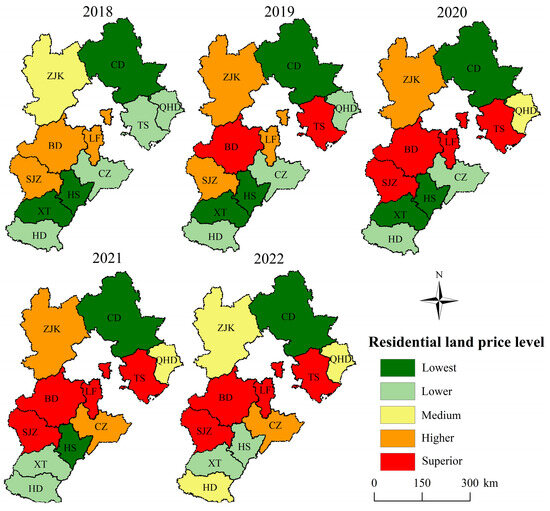
Figure 3.
Spatial distribution of urban residential land prices in Hebei Province from 2018 to 2022.
The residential land prices in cities exhibit distinct spatial distribution characteristics influenced by the geographical location, the regional conditions, and the advantages of the provincial capital. They demonstrate a pattern where higher prices are concentrated in the central region, while lower prices prevail in the northern and southern areas. Specifically, high-value areas are predominantly situated along the Shijiazhuang–Baoding–Langfang–Tangshan axis, whereas low-value areas are primarily found in the northern and southern extents along this axis.
The spatial distribution of high and low values shows consistency across different years, albeit with an overall upward shift in land price levels. In 2018, no areas within the province exhibited high land prices. By 2019, Baoding and Tangshan emerged as high-value areas, and from 2020 onwards, Baoding, Langfang, Tangshan, and Shijiazhuang all registered as high-land-price areas. Meanwhile, Hengshui and Xingtai transitioned gradually from low to relatively low price levels. Qinhuangdao and Handan moved from relatively low to moderate price levels, whereas Cangzhou saw a direct increase from a relatively low to a high level. Zhangjiakou fluctuated between a moderate and a high level, and Chengde maintained a stable low land price level throughout the analyzed period.
4.1.3. Analysis of Spatial Differences in Urban Residential Land Prices
The Theil index for residential land prices in Hebei Province, both overall and by region, is presented in Table 2. Over the period from 2018 to 2022, the provincial-level Theil index exhibited a discernible upward trajectory, indicating a widening divergence in residential land prices among cities across the province. Notably, prices surged notably in higher-priced regions, such as Shijiazhuang, Baoding, Langfang, and Tangshan, exacerbating the gap with lower-priced areas.
Table 2.
Theil index of residential land prices in Hebei Province as a whole and in various urban areas.
Regionally, the most pronounced inter-city price disparities are observed in northwest Hebei, followed by the central-southern Hebei region, whereas the Beijing–Tianjin area demonstrates the smallest price differentials. The central-southern Hebei region’s disparities are primarily attributed to Shijiazhuang’s status as the provincial capital, resulting in significantly higher land prices compared with Handan, Xingtai, and Hengshui, thereby contributing to a higher regional Theil index. Conversely, the Beijing–Tianjin area benefits from its dominant economic position, fostering relatively balanced land prices between Baoding and Langfang.
4.2. Evolution of Spatial Patterns Based on Standard Deviation Ellipses
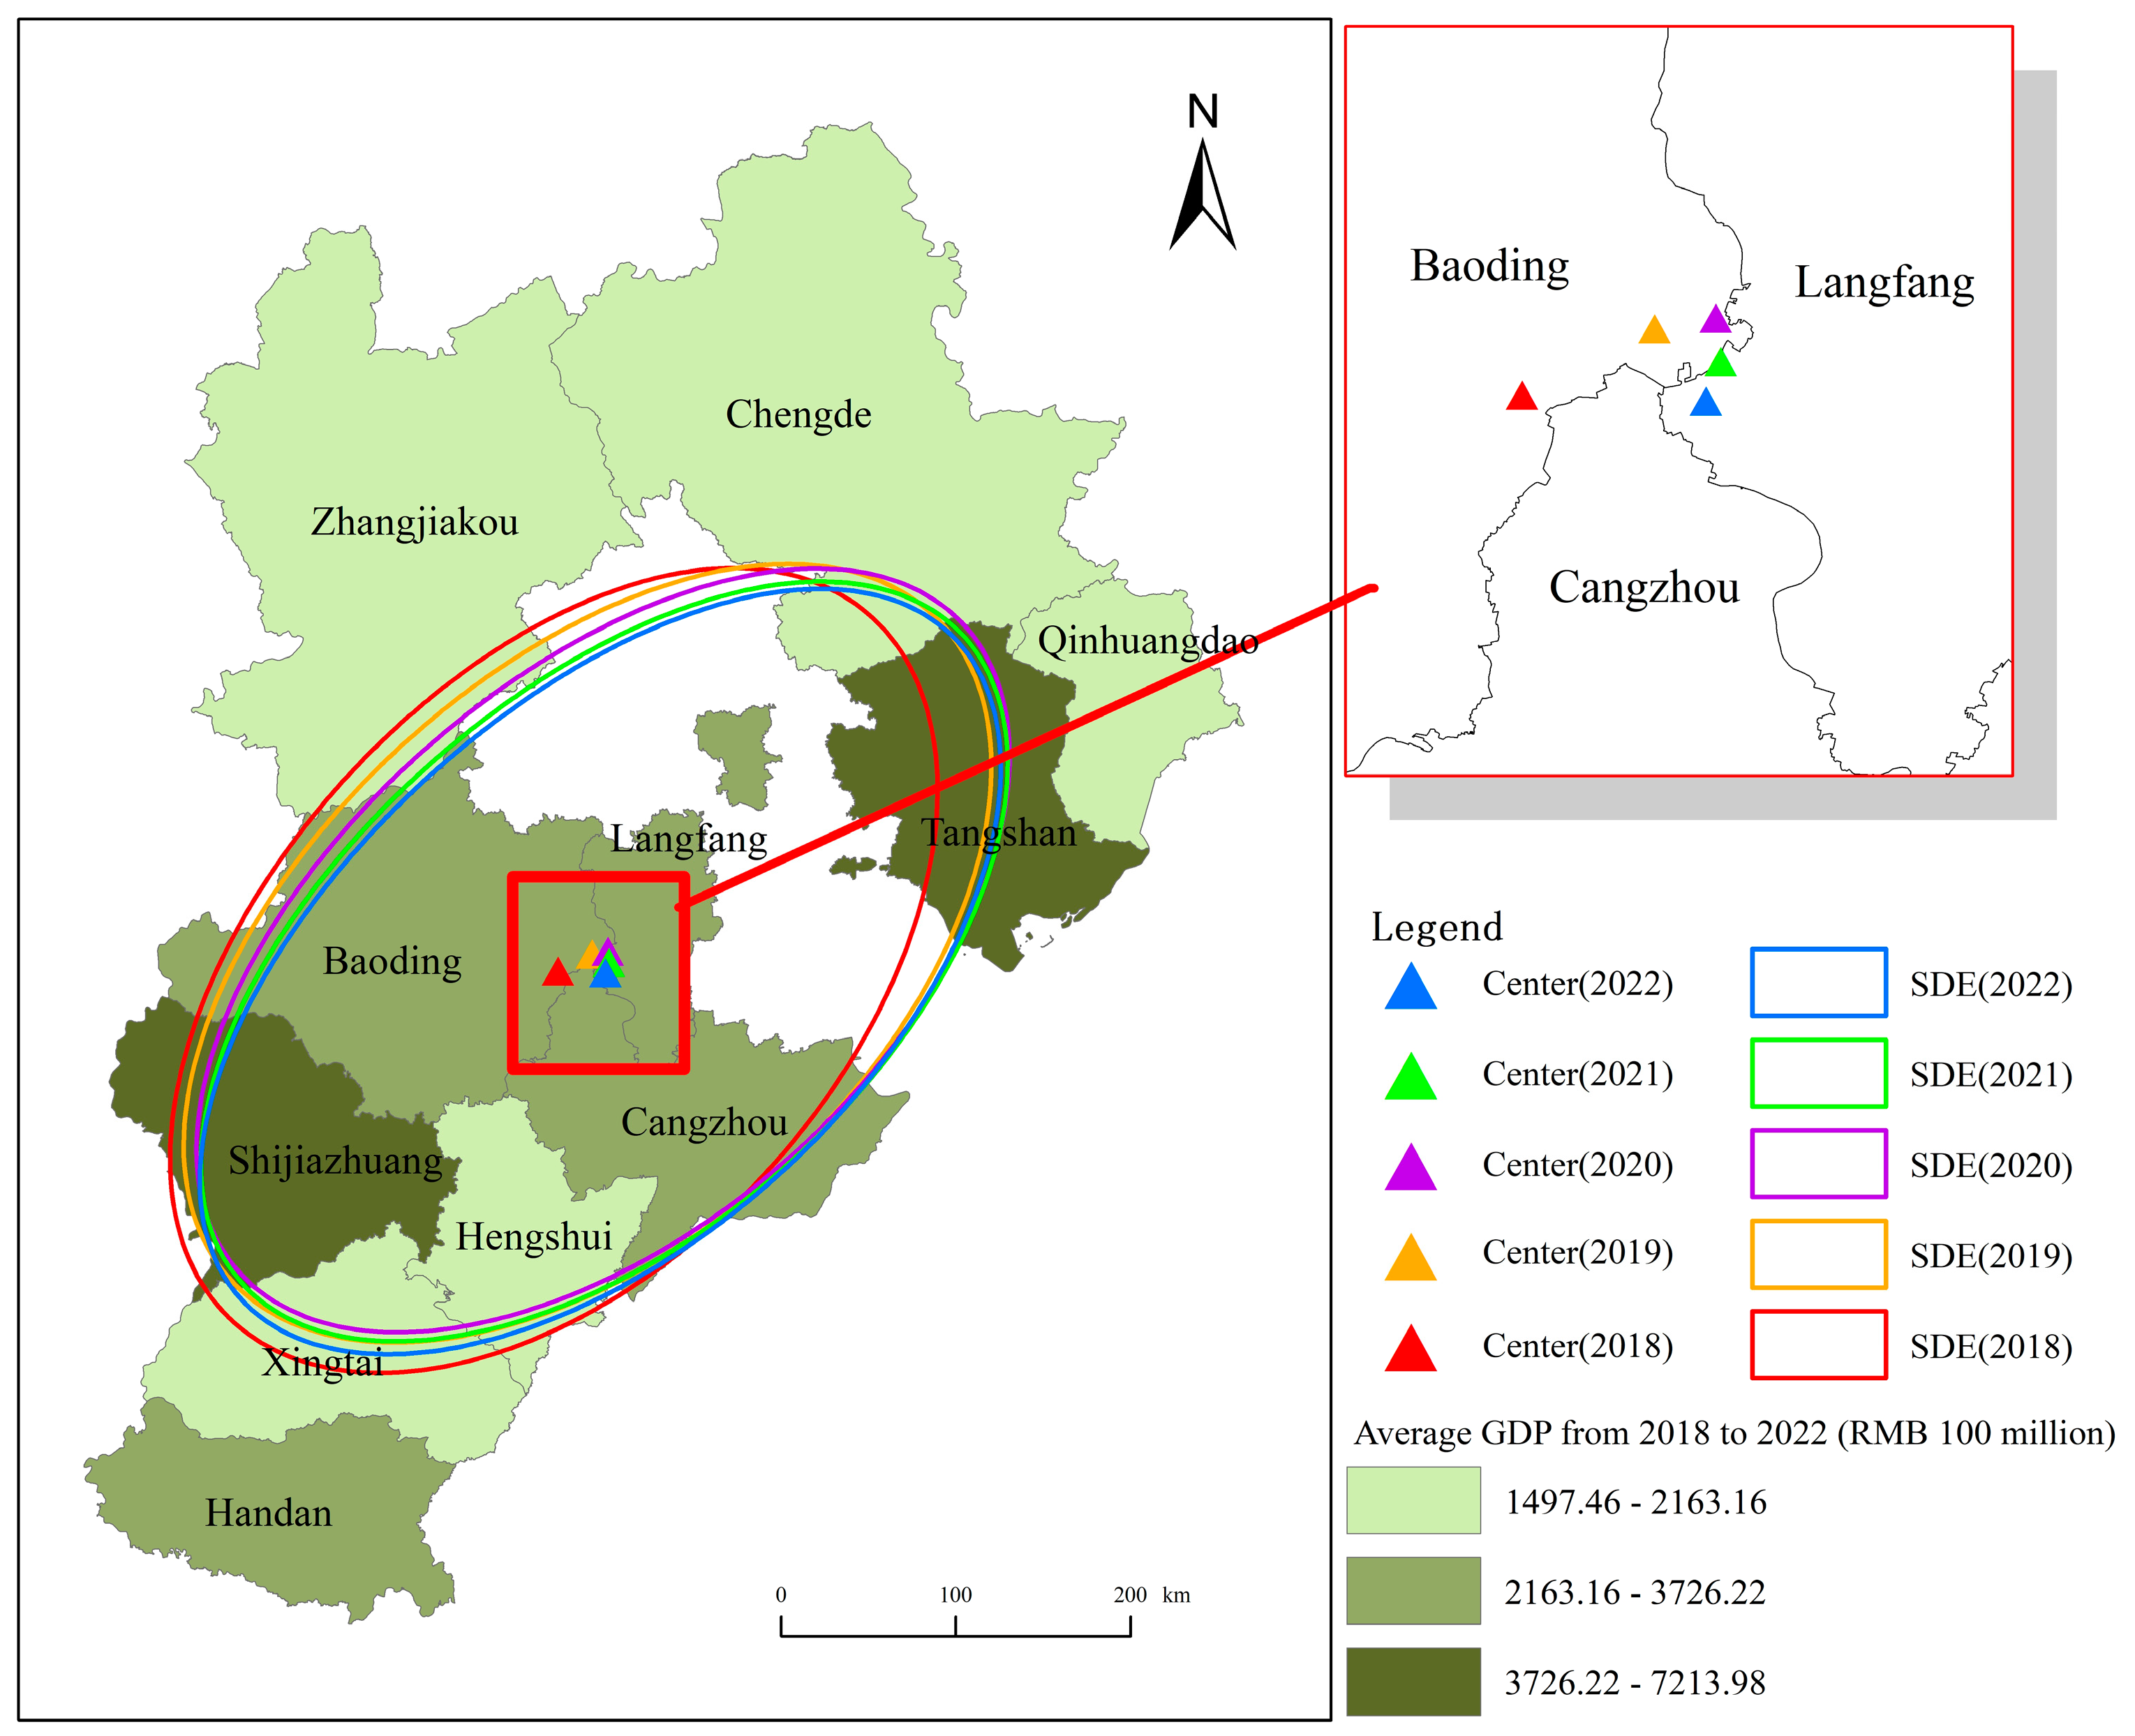
Based on the analysis of the spatial distribution of urban residential land prices in Hebei Province of China from 2018 to 2022, a predominant “northeast–southwest” directionality in the distribution pattern was observed. Initially, the center of the land prices shifted northeastward and subsequently southwestward, corresponding with the overall trajectory of urban residential land price escalation in the province (Figure 4). Growth rates of urban residential land prices were higher within the ellipse compared with areas outside it. The standard deviation ellipse expanded and then contracted, indicating an initial spatial dispersion followed by a concentration, ultimately leading to overall concentration trends.

Figure 4.
The elliptic distribution of the standard deviation of the urban residential land price in Hebei Province during 2018–2022.
The center of the land price ellipse exhibited continuous movement throughout the study period. Specifically, from 2018 to 2020, it shifted northeastward by 33.25 km (Figure 4, Table 3). Subsequently, from 2020 to 2022, the movement reversed, with a southwestward shift of 13.38 km. This directional change reflects rapid increases in land prices in northeastern cities such as Tangshan and Langfang from 2018 to 2020, followed by similar increases in southern and southwestern cities like Cangzhou, Hengshui, Xingtai, and Handan during the same period.
Table 3.
Basic parameters of the land price ellipse.
From 2018 to 2022, the standard deviation ellipse’s azimuth ranges between 41° and 48°, indicating a predominant “northeast–southwest” orientation in the distribution pattern of urban residential land prices across Hebei Province. Areas with higher land prices are predominantly situated along this axis, specifically in Tangshan, Langfang, Baoding, and Shijiazhuang. Tangshan, Shijiazhuang, Baoding, and Langfang exhibit among the highest land prices in the province, corresponding to their GDP levels (Figure 4).
The standard deviation ellipse area measured 166,714.34 km2 in 2018, increased to 167,153.69 km2 in 2019, and subsequently decreased to 156,738.11 km2 from 2020 to 2022 (Table 3). During the period from 2018 to 2019, land prices in the peripheral cities within the ellipse (e.g., Tangshan) escalated more rapidly compared with those in the central cities (e.g., Langfang, Cangzhou, Baoding, Shijiazhuang, Hengshui). Conversely, from 2020 to 2022, land prices in the central cities (e.g., Langfang, Cangzhou, Baoding, Shijiazhuang, Hengshui, Xingtai) exhibited faster growth than those in the peripheral cities (e.g., Zhangjiakou, Chengde, Qinhuangdao, Handan). In summary, the overall trend indicates that land prices in the central cities experienced a more pronounced increase compared with those in the peripheral areas.
The land prices of urban residential areas in Hebei Province exhibit a discernible pattern characterized by increasing dispersion along the major axis of an elliptical distribution, juxtaposed with a greater concentration along the minor axis. Over the period from 2018 to 2022, the standard deviation of the major axis length increased from 295.51 km to 302.11 km (Table 3), indicating a pronounced spatial dispersion aligned with the “northeast–southwest” orientation of urban residential land prices (Figure 4). In contrast, the minor axis length consistently decreased from 179.59 km in 2018 to 165.15 km in 2022, suggesting a trend towards a spatial concentration. The flatness of the ellipse has correspondingly increased from 0.24 to 0.29 over the same period, signifying a growing disparity between the major and minor axes of urban residential land prices in Hebei Province. This underscores an ongoing intensification of directional disparities in land price dynamics.
4.3. Analysis of Factors Influencing Urban Residential Land Prices in Hebei Province
4.3.1. Single-Factor Detection Results
From 2018 to 2022, the single-factor test results of the impact of various factors on urban residential land prices in Hebei Province of China (Table 4).
Table 4.
Geographical detection results of the influencing factors of residential land prices in cities of Hebei Province.
Overall, the proximity to Beijing, Tianjin, and the provincial capital stands out as the primary determinant of residential land prices in Hebei Province. A closer proximity to these centers correlates with higher land prices, owing to their economic influence and favorable geographic positioning. Additionally, the evolution of built-up areas, the relative contribution of the tertiary sector to GDP, and the availability of medical facilities over time also exert considerable influence on residential land valuations. These findings underscore the critical roles played by urban scale, economic development trajectory, and the adequacy of public amenities in shaping the dynamics of land pricing within the region.
4.3.2. Interactive Detection Results
Through an analysis of the top five factor combinations influencing the interactive effects in land price detection (see Table 5), it was observed that interactions between any two factors exerted a greater influence on land prices than individual factors alone.
Table 5.
Interactive detection results of influencing factors on urban residential land price in Hebei Province (top five).
In 2018, notable interactions were identified between the proportion of GDP derived from the tertiary industry and variables such as urban residents’ disposable income, the road network density, the number of medical beds, built-up area, and the per capita GDP. Subsequently, from 2019 to 2021, critical interactive factors included location conditions, urban residents’ disposable income, the number of secondary school students, the road network density, the number of medical beds, and the urbanization rate. By 2022, key interactions were noted among location conditions, urban residents’ disposable income, urbanization rate, the number of secondary school students, the number of medical beds, and the proportion of GDP from the tertiary industry. This underscores the dominant influence of the proportion of GDP in the tertiary industry and location conditions on land prices. The proportion of GDP from the tertiary industry serves as a proxy for economic development quality, with higher percentages correlating with greater impacts on land prices. Meanwhile, factors such as urban residents’ disposable income, the road network density, the number of medical beds, the number of secondary school students, and the urbanization rate reflect varying aspects of economic development, infrastructure quality, and urbanization level, all contributing significantly to land price dynamics.
5. Discussion
5.1. Driving Mechanism of Urban Residential Land Prices
Due to its distinctive geographical location and policy framework, Hebei Province of China assumes a pivotal role in the valuation of urban residential land. The province experiences significant inflows of external populations and encompasses extensive and varied land utilization practices. This dynamic not only illustrates the dual nature of the land market but also underscores its contribution to socio-economic development. Consequently, urban residential land prices have emerged as a focal topic of societal discourse and deliberation.
Due to a confluence of factors, including resource endowment, policy interventions, and infrastructural conditions, significant spatial disparities are evident in residential land prices across various cities [52]. Against the backdrop of the burgeoning Beijing–Tianjin–Hebei urban agglomeration, Tangshan has witnessed a rapid escalation in urban residential land prices. Similarly, as a pivotal center in Hebei Province for politics, economics, finance, and technology, Shijiazhuang benefits significantly from its strategic advantages in regional transportation and robust infrastructure, thereby catalyzing a pronounced escalation in urban residential land values. This phenomenon parallels the housing price hikes observed in central Taiwan, which are attributable to enhancements in transport infrastructure and demographic growth [53]. Baoding and Langfang, strategically positioned near the Beijing–Tianjin metropolitan region, have capitalized on favorable policies, resulting in elevated land transfer prices. These dynamics underscore Shijiazhuang, Baoding, and Langfang as high-value locales, characterized by distinct trajectories in economic, social, ecological, and holistic developmental patterns [54]. Conversely, Chengde and Zhangjiakou, located within the ecological conservation zones of the Yanshan and Taihang Mountains, feature rugged terrain and hills, and are subject to stringent ecological red line policies. These regulatory constraints have curtailed urban construction and expansion [55], contributing to inadequate transport accessibility and low levels of urbanization. Consequently, the real estate markets in these cities exhibit subdued activity, which is reflected in comparatively lower urban residential land values. In contrast, Hengshui and Xingtai, located in the southern plains of Hebei Province, exhibit modest urbanization rates, inadequate infrastructure development, and less favorable transportation conditions. These factors collectively constrain economic advancement and slow the progression of the regional real estate market, thereby influencing lower urban residential land prices in these areas.
During the period from 2020 to 2022, the Theil index of land prices in Hebei Province exhibited a slight decline, influenced by the COVID-19 pandemic. This downturn can be attributed to the broader economic contraction across diverse sectors, which adversely affected land prices in the urban residential areas of Hebei Province. Concurrently, peripheral cities experienced favorable trends in urban residential land prices, influenced by the radiative effects of the Beijing–Tianjin–Hebei metropolitan area. This was driven by the combined impact of various policies, stimulating rapid urban development. In contrast, cities further from the metropolitan area faced relatively stagnant urban residential land prices, due to incongruent government policy goals, unfavorable conditions for land circulation, and challenges in urban development.
Therefore, investigating the diverse factors influencing urban residential land prices in Hebei Province is beneficial not only for the equitable allocation of urban amenities to foster sustainable urban development but it also underscores the pivotal role of governmental interventions. By leveraging the nuanced insights provided by land prices, the government can strategically adjust the quantity and methods of land supply to refine policies that are conducive to spatial optimization management.
5.2. Management and Enlightenment of Urban Residential Land Price
Accurately delineating the spatio-temporal evolution characteristics and determining the influencing factors of urban residential land prices in Hebei Province of China will enable the relevant government agencies to effectively strengthen regulatory measures. Building upon the findings of this study, we propose recommendations for regulating urban residential land prices in Hebei Province from two perspectives:
- (1)
- Explore diverse residential land market regulation policies and establish a city cluster for the coordinated development of urban residential land prices. Given the uneven development among cities in Hebei Province, relevant government departments should integrate factors such as urban economic growth, functional zoning, industrial structure, and variations in land prices into urban development planning strategies. Confronted with the rapid escalation of urban residential land prices in central cities like Shijiazhuang, Baoding, Langfang, and Tangshan, measures such as the equitable allocation of new construction land, the activation of dormant land, and the optimization of residential land usage should be implemented to ensure the sustainable growth of the urban residential market. For peripheral and mountainous cities experiencing slower growth in urban residential land prices, maximizing ecological resources, developing urban transport networks, and enhancing inter-city economic cooperation are crucial. By employing strategies such as industrial structure adjustments and incentives for talent retention, the balanced development of urban residential land prices can be achieved.
- (2)
- Accelerate the optimization of the residential land price network structure within cities and actively foster collaborative external networks. Hebei Province should extend outward from its central cities, leveraging connectivity advantages to develop intermediate centers like Cangzhou and Hengshui. Simultaneously, the province should establish corridors such as the “Shijiazhuang–Xingtai–Handan” corridor to expand external influence, fostering communication among city and county networks. Within the framework of “Beijing–Tianjin–Hebei coordinated development”, efforts should focus on enhancing intra-provincial transportation routes, facilitating connectivity between peripheral and central cities. Additionally, enhancing the transparency of land market information is crucial to ensure market participants’ awareness of trends and policy changes, promoting informed decision-making and fostering stable urban residential land prices.
5.3. Shortcomings and Prospects
The study has certain limitations. Primarily, it employs quantitative analysis methods, which are suited for quantitative measures. Firstly, qualitative factors often involve broad and complex aspects, such as social, cultural, and policy dimensions. These factors are challenging to accurately assess and quantify through quantitative data alone. For instance, the impacts of policy environments, socio-cultural backgrounds, and local governance on land prices are typically multidimensional. Different qualitative factors may intertwine with each other, making it difficult to capture their true effects solely through a statistical analysis. Secondly, a qualitative analysis may occasionally be subject to subjective and interpretive biases, necessitating rigorous and systematic approaches to ensure the credibility and validity of the research findings. In our study, to mitigate subjective influences and uncertainties in the research conclusions, we opted for quantitative analysis methods to quantify the actual contributions of various economic and market factors to changes in land prices. Lastly, while acknowledging the importance of qualitative factors in land price formation, future research will explore the effective integration of quantitative and qualitative analyses to deepen the comprehensive understanding of urban land price dynamics.
Secondly, this study employs geographic detectors to quantitatively analyze urbanization levels, economic development, and location conditions but omits qualitative factors such as policy impacts on land prices. Future research should enhance the multifactor index system governing land prices and develop quantitative approaches for qualitative factors to improve research comprehensiveness and accuracy. Moreover, as temporal and spatial influences on land prices evolve, there is a critical need to investigate these dynamics across different periods and locations. Additionally, the monitoring of land prices in urban fringe areas should be intensified to offer enhanced guidance on land use decisions.
6. Conclusions
This study examines the spatio-temporal evolution characteristics of urban residential land prices across 11 prefecture-level cities in Hebei province, utilizing continuous urban land price monitoring data spanning 20 quarters from 2018 to 2022. It elucidates the primary factors influencing land prices and offers insights intended to guide government macroeconomic regulation of the land market, as well as timely adjustments to the structure and scale of land supply. The research findings are summarized as follows:
- (1)
- Regarding temporal trends, residential land prices in Hebei Province of China exhibit an overall upward trajectory. Notably, Tangshan has experienced a pronounced surge, surpassing nearby cities near Beijing and Tianjin. Meanwhile, southern cities in central Hebei are also witnessing rapid growth, albeit from a lower base. Spatially, urban residential land prices demonstrate significant disparities, primarily concentrated in high-price areas along the Shijiazhuang–Baoding–Langfang–Tangshan axis, while low-price areas are predominantly located north and south of this axis. This spatial divide between high- and low-price areas is widening over time.
- (2)
- In terms of spatial evolution patterns, residential land prices across cities in Hebei Province of China exhibit a “northeast–southwest” distribution, aligning closely with the GDP distribution pattern. The movement center of land prices corresponds to the direction of urban land price increases in Hebei Province of China. The distribution of residential land prices tends to scatter along the long axis of the ellipse and concentrate along the short axis, indicating a strengthening directional trend in land pricing over time.
- (3)
- The prices of urban residential land in Hebei Province of China are determined by a complex interplay of factors, including urbanization level, economic development, geographic location, infrastructure, and city size. The synergistic effects between these factors often outweigh the impact of any single factor on land prices. Particularly influential is the proportion of third-industry GDP and geographical location conditions, which emerge as pivotal determinants shaping urban residential land prices in Hebei Province of China.
Author Contributions
Y.W.: methodology, software, data curation, validation, and writing—original draft; J.Y.: conceptualization, funding acquisition, writing—review and editing. All authors have read and agreed to the published version of the manuscript.
Funding
This research was funded by the National Natural Science Foundation of China, grant number 42271282.
Data Availability Statement
All the relevant datasets in this study are described in the manuscript.
Conflicts of Interest
The authors declare no conflicts of interest.
References
- An, P.; Li, C.; Duan, Y.; Ge, J.; Feng, X. Inter-metropolitan land price characteristics and pattern in the Beijing-Tianjin-Hebei urban agglomeration, China. PLoS ONE 2021, 16, e256710. [Google Scholar] [CrossRef] [PubMed]
- Gatzlaff, D.; Tirtiroğlu, D. Real estate market efficiency: Issues and evidence. J. Real Estate Lit. 1995, 3, 157–189. [Google Scholar] [CrossRef]
- Chen, F. Spatial differentiation of urban housing prices in Guangdong province and its influencing factors. Modern Economy 2018, 9, 664. [Google Scholar] [CrossRef]
- Ju, W. The dynamic evolution of Chinese-style modernization level measurement. Front. Bus. Econ. Manag. 2024, 13, 155–162. [Google Scholar] [CrossRef]
- Jiang, R.; Lin, G.C. Placing China’s land marketization: The state, market, and the changing geography of land use in Chinese cities. Land Use Policy 2021, 103, 105293. [Google Scholar] [CrossRef]
- Luo, Y.; Zhou, D.; Tian, Y.; Jiang, G. Spatial and temporal characteristics of different types of pollution-intensive industries in the Beijing-Tianjin-Hebei region in China by using land use data. J. Clean. Prod. 2021, 329, 129601. [Google Scholar] [CrossRef]
- Nichols, J.B.; Oliner, S.D.; Mulhall, M.R. Swings in commercial and residential land prices in the United States. J. Urban Econ. 2013, 73, 57–76. [Google Scholar] [CrossRef]
- You, H. Quantifying megacity growth in response to economic transition: A case of Shanghai, China. Habitat Int. 2016, 53, 115–122. [Google Scholar] [CrossRef]
- Hui, E.C.; Dong, Z.; Jia, S. How do housing price and sentiment affect consumption distribution in China. Habitat Int. 2018, 77, 99–109. [Google Scholar] [CrossRef]
- Wang, W.; Chang, Y.; Wang, H. An application of the spatial autocorrelation method on the change of real estate prices in Taitung City. ISPRS Int. J. Geo-Inf. 2019, 8, 249. [Google Scholar] [CrossRef]
- Wen, H.; Gui, Z.; Tian, C.; Xiao, Y.; Fang, L. Subway opening, traffic accessibility, and housing prices: A quantile hedonic analysis in Hangzhou, China. Sustainability 2018, 10, 2254. [Google Scholar] [CrossRef]
- Hu, S.; Cheng, Q.; Wang, L.; Xie, S. Multifractal characterization of urban residential land price in space and time. Appl. Geogr. 2012, 34, 161–170. [Google Scholar] [CrossRef]
- Tan, R.; Xu, S. Urban growth boundary and subway development: A theoretical model for estimating their joint effect on urban land price. Land Use Policy 2023, 129, 106641. [Google Scholar] [CrossRef]
- Huang, N.; Yang, Z. Spatial dynamic models with short panels: Evaluating the impact of purchase restrictions on housing prices. Econ. Model. 2021, 103, 105597. [Google Scholar] [CrossRef]
- Zhou, J.; Hui, E.C. Housing prices, migration, and self-selection of migrants in China. Habitat Int. 2022, 119, 102479. [Google Scholar] [CrossRef]
- Liu, F.; Min, M.; Zhao, K.; Hu, W. Spatial-temporal variation in the impacts of urban infrastructure on housing prices in Wuhan, China. Sustainability 2020, 12, 1281. [Google Scholar] [CrossRef]
- Koroso, N.H.; Zevenbergen, J.A. Urban land management under rapid urbanization: Exploring the link between urban land policies and urban land use efficiency in Ethiopia. Cities 2024, 153, 105269. [Google Scholar] [CrossRef]
- Codosero Rodas, J.M.; Naranjo Gomez, J.M.; Castanho, R.A.; Cabezas, J. Land valuation sustainable model of urban planning development: A case study in Badajoz, Spain. Sustainability 2018, 10, 1450. [Google Scholar] [CrossRef]
- Ball, M.; Shepherd, E.; Wyatt, P. The relationship between residential development land prices and house prices. Town Plan. Rev. 2022, 93, 401–421. [Google Scholar] [CrossRef]
- Pollakowski, H.O.; Ray, T.S. Housing price diffusion patterns at different aggregation levels: An examination of housing market efficiency. J. Hous. Res. 1997, 8, 107–124. [Google Scholar]
- Kuethe, T.H.; Pede, V.O. Regional housing price cycles: A spatio-temporal analysis using US state-level data. Reg. Stud. 2011, 45, 563–574. [Google Scholar] [CrossRef]
- Qu, S.; Hu, S.; Li, W.; Zhang, C.; Li, Q.; Wang, H. Temporal variation in the effects of impact factors on residential land prices. Appl. Geogr. 2020, 114, 102124. [Google Scholar] [CrossRef]
- Wen, H.; Goodman, A.C. Relationship between urban land price and housing price: Evidence from 21 provincial capitals in China. Habitat Int. 2013, 40, 9–17. [Google Scholar] [CrossRef]
- Yang, S.; Hu, S.; Wang, S.; Zou, L. Effects of rapid urban land expansion on the spatial direction of residential land prices: Evidence from Wuhan, China. Habitat Int. 2020, 101, 102186. [Google Scholar] [CrossRef]
- Ha, P.T.; Tuan, N.T.; Van Quan, N.; Van Trung, N. Land Price Regression Model and Land Value Region Map to Support Residential Land Price Management: A Study in Nghe an Province, Vietnam. Real Estate Manag. Valuat. 2022, 30, 71–83. [Google Scholar] [CrossRef]
- Garang, Z.; Wu, C.; Li, G.; Zhuo, Y.; Xu, Z. Spatio-temporal non-stationarity and its influencing factors of commercial land price: A case study of Hangzhou, China. Land 2021, 10, 317. [Google Scholar] [CrossRef]
- Wang, Y.; Wang, S.; Li, G.; Zhang, H.; Jin, L.; Su, Y.; Wu, K. Identifying the determinants of housing prices in China using spatial regression and the geographical detector technique. Appl. Geogr. 2017, 79, 26–36. [Google Scholar] [CrossRef]
- Byun, P.; Esparza, A.X. A revisionist model of suburbanization and sprawl: The role of political fragmentation, growth control, and spillovers. J. Plan. Educ. Res. 2005, 24, 252–264. [Google Scholar] [CrossRef]
- Atack, J.; Margo, R.A. “Location, location, location!” The price gradient for vacant urban land: New York, 1835 to 1900. J. Real Estate Financ. Econ. 1998, 16, 151–172. [Google Scholar] [CrossRef]
- Du, X.; Huang, Z. Spatial and temporal effects of urban wetlands on housing prices: Evidence from Hangzhou, China. Land Use Policy 2018, 73, 290–298. [Google Scholar] [CrossRef]
- Kim, H.-S.; Lee, G.-E.; Lee, J.-S.; Choi, Y. Understanding the local impact of urban park plans and park typology on housing price: A case study of the Busan metropolitan region, Korea. Landsc. Urban Plan. 2019, 184, 1–11. [Google Scholar] [CrossRef]
- Liang, X.; Liu, Y.; Qiu, T.; Jing, Y.; Fang, F. The effects of locational factors on the housing prices of residential communities: The case of Ningbo, China. Habitat Int. 2018, 81, 1–11. [Google Scholar] [CrossRef]
- Tan, Y.; Xu, H.; Zhang, X. Sustainable urbanization in China: A comprehensive literature review. Cities 2016, 55, 82–93. [Google Scholar] [CrossRef]
- Stewart, F.A.; Charlton, M.; Brunsdon, C. The geography of parameter space: An investigation of spatial non-stationarity. Int. J. Geogr. Inf. Syst. 1996, 10, 605–627. [Google Scholar] [CrossRef]
- Yu, P.; Yung, E.H.K.; Chan, E.H.W.; Zhang, S.; Wang, S.; Chen, Y. The Spatial Effect of Accessibility to Public Service Facilities on Housing Prices: Highlighting the Housing Equity. ISPRS Int. J. Geo-Inf. 2023, 12, 228. [Google Scholar] [CrossRef]
- Zheng, X.; Zhu, M.; Shi, Y.; Pei, H.; Nie, W.; Nan, X.; Zhu, X.; Yang, G.; Bao, Z. Equity Analysis of the Green Space Allocation in China’s Eight Urban Agglomerations Based on the Theil Index and GeoDetector. Land 2023, 12, 795. [Google Scholar] [CrossRef]
- Sun, J.; Wu, H.; Shi, S. A research of the evaluation of preschool education resource allocation level and spatio-temporal differences: Based on repeated indicators method and Theil index. Heliyon 2023, 9, e16362. [Google Scholar] [CrossRef] [PubMed]
- Madan, S.; Yadav, M. Decomposing Skill Based Wage Inequality in India: An Application of Theil Index. Indian J. Labour Econ. 2022, 65, 967–979. [Google Scholar] [CrossRef]
- Guo, K.; Yuan, Y. Research on spatial and temporal evolution trends and driving factors of green residences in China based on weighted standard deviational ellipse and panel Tobit model. Appl. Sci. 2022, 12, 8788. [Google Scholar] [CrossRef]
- Zhang, Y.; Jiang, P.; Cui, L.; Yang, Y.; Ma, Z.; Wang, Y.; Miao, D. Study on the spatial variation of China’s territorial ecological space based on the standard deviation ellipse. Front. Environ. Sci. 2022, 10, 982734. [Google Scholar] [CrossRef]
- Zhao, Y.; Wu, Q.; Wei, P.; Zhao, H.; Zhang, X.; Pang, C. Explore the mitigation mechanism of urban thermal environment by integrating geographic detector and standard deviation ellipse (SDE). Remote Sens. 2022, 14, 3411. [Google Scholar] [CrossRef]
- Wang, S.; Ren, Z.; Xiao, Z.; Wang, N.; Yang, H.; Pu, H. Coupling analysis of population aging and economic growth with spatial-temporal variation: A case study in China. Int. J. Equity Health 2022, 21, 107. [Google Scholar] [CrossRef] [PubMed]
- Huang, J.; Song, L.; Yu, M.; Zhang, C.; Li, S.; Li, Z.; Geng, J.; Zhang, C. Quantitative spatial analysis of thermal infrared radiation temperature fields by the standard deviational ellipse method for the uniaxial loading of sandstone. Infrared Phys. Technol. 2022, 123, 104150. [Google Scholar] [CrossRef]
- Duman, Z.; Mao, X.; Cai, B.; Zhang, Q.; Chen, Y.; Gao, Y.; Guo, Z. Exploring the spatiotemporal pattern evolution of carbon emissions and air pollution in Chinese cities. J. Environ. Manag. 2023, 345, 118870. [Google Scholar] [CrossRef]
- Wang, H.; Qin, F.; Xu, C.; Li, B.; Guo, L.; Wang, Z. Evaluating the suitability of urban development land with a Geodetector. Ecol. Indic. 2021, 123, 107339. [Google Scholar] [CrossRef]
- Yu, H.; Liu, D.; Zhang, C.; Yu, L.; Yang, B.; Qiao, S.; Wang, X. Research on Spatial–Temporal Characteristics and Driving Factors of Urban Development Intensity for Pearl River Delta Region Based on Geodetector. Land 2023, 12, 1673. [Google Scholar] [CrossRef]
- Zhu, L.; Meng, J.; Zhu, L. Applying Geodetector to disentangle the contributions of natural and anthropogenic factors to NDVI variations in the middle reaches of the Heihe River Basin. Ecol. Indic. 2020, 117, 106545. [Google Scholar] [CrossRef]
- Zhao, Y.; Liu, L.; Kang, S.; Ao, Y.; Han, L.; Ma, C. Quantitative analysis of factors influencing spatial distribution of soil erosion based on geo-detector model under diverse geomorphological types. Land 2021, 10, 604. [Google Scholar] [CrossRef]
- Doan, Q.C. Determining the optimal land valuation model: A case study of Hanoi, Vietnam. Land Use Policy 2023, 127, 106578. [Google Scholar] [CrossRef]
- Chen, Y.; Jiao, J.; Farahi, A. Disparities in affecting factors of housing price: A machine learning approach to the effects of housing status, public transit, and density factors on single-family housing price. Cities 2023, 140, 104432. [Google Scholar] [CrossRef]
- Ruan, F.L.; Yan, L. Interactions among electricity consumption, disposable income, wastewater discharge, and economic growth: Evidence from megacities in China from 1995 to 2018. Energy 2022, 260, 124910. [Google Scholar] [CrossRef]
- Li, C.; Wei, W.; Duan, Y.; Feng, Z.; Feng, X.; Zhu, C.; An, P. Exploration of the regional correlation and network structure characteristics of land prices: A case study of Hebei, China. Front. Environ. Sci. 2023, 10, 1056042. [Google Scholar] [CrossRef]
- Tsai, I.C. Housing price convergence, transportation infrastructure and dynamic regional population relocation. Habitat Int. 2018, 79, 61–73. [Google Scholar] [CrossRef]
- Yin, Z.; Liu, Y.; Tang, L.; Zhou, W.; Pan, Y. Spatial-temporal evolution of agricultural land utilization benefits and tradeoffs/synergies in the Beijing-Tianjin-Hebei region. Ecol. Indic. 2023, 156, 111110. [Google Scholar] [CrossRef]
- Zhang, F.; Xu, N.; Wang, C.; Guo, M.; Kumar, P. Multi-scale coupling analysis of urbanization and ecosystem services supply-demand budget in the Beijing-Tianjin-Hebei region, China. J. Geogr. Sci. 2023, 33, 340–356. [Google Scholar] [CrossRef]

Disclaimer/Publisher’s Note: The statements, opinions and data contained in all publications are solely those of the individual author(s) and contributor(s) and not of MDPI and/or the editor(s). MDPI and/or the editor(s) disclaim responsibility for any injury to people or property resulting from any ideas, methods, instructions or products referred to in the content. |
© 2024 by the authors. Licensee MDPI, Basel, Switzerland. This article is an open access article distributed under the terms and conditions of the Creative Commons Attribution (CC BY) license (https://creativecommons.org/licenses/by/4.0/).