Article

Does the Upgrading of Development Zones Improve Land Use Efficiency under the Net-Zero Carbon City Goal? Prefectural-Level Evidence from Quasi-Natural Experiments in China

1
ZJU-STEC Urban Development and Planning Innovation Joint Research Center, Zhejiang University, Hangzhou 310058, China
2
Shanghai Urban Construction Design and Research Institute (Group) Co., Ltd., Shanghai 200000, China
3
College of Architecture and Urban Planning, Tongji University, Shanghai 200092, China
*
Author to whom correspondence should be addressed.
Land 2024, 13(8), 1245; https://doi.org/10.3390/land13081245
Submission received: 14 June 2024 / Revised: 31 July 2024 / Accepted: 7 August 2024 / Published: 8 August 2024

Abstract

:
Given the challenges of restricted land resources and net-zero carbon city initiatives, it is crucial to seek a balance between intensive land use and carbon neutrality during the construction of development zones. By incorporating net-zero carbon balance into the land use efficiency evaluation system and utilizing a quasi-natural experiment based on the 2009 provincial development zone upgrading policy, this study investigates the policy’s impact on urban land use efficiency under the net-zero carbon city goal. The study finds that the upgrading of provincial development zones significantly enhances urban land use efficiency, while exhibiting the dual effects of reducing carbon emissions and increasing carbon sinks. Mechanism analysis reveals that the upgrade policy improves land use efficiency by enhancing land-use and environmental regulations, optimizing resource allocation, and fostering green technological innovation. Heterogeneity analyses show that the policy effect is more significant in eastern and central cities, with the impact being strongest in central cities. Additionally, the impact of upgrading to a national high-tech development zone is greater than that of upgrading to a national economic development zone. This article provides insights into how to use industrial policies effectively to achieve intensive land use and high-quality development while aiming for carbon neutrality.

1. Introduction

In September 2020, China announced for the first time its dual carbon goals of peaking carbon emissions by 2030 and reaching carbon neutrality by 2060. At sub-global scales, net-zero carbon emissions specifically entail balancing carbon emissions and removals within a region’s territorial boundaries [1]. This differs from the broader concept of carbon neutrality, which implies achieving a balance within and beyond territorial responsibilities. Specific goals include reducing energy consumption, transitioning to renewable energy sources, promoting greening initiatives, and enhancing carbon sequestration and offsetting [2]. These efforts span various sectors, including energy, transportation, construction, residential areas, and green spaces. Land management is pivotal to achieving net-zero carbon cities. Agriculture, forestry, and other land use sectors serve dual roles as significant sources and sinks, influenced by agricultural production, land use changes, and forestry activities [3,4]. Urban construction’s rapid expansion into agricultural and forested lands reduces ecological reserves and carbon sequestration, while also increasing energy use and carbon emissions [5,6]. Development zones (DZs) benefit from specific policy advantages in land supply and utilization, significantly facilitating rapid urbanization and industrialization [7]. However, redundant and excessive construction of DZs resulted in significant urban encroachment on carbon sinks, such as agricultural and forested lands [8,9], as well as vacancies and low land use efficiency [10], thereby increasing carbon emissions [11]. Therefore, it is essential to incorporate carbon budget accounting into the land management of DZs to achieve efficient land use while emphasizing carbon balance. However, in recent years, the transformation of DZs in China has encountered two challenges. First, the harmonization of regional industrial policies has weakened DZs’ unique advantages in pioneering trials [12]. Second, the constraining effects of land quota bottlenecks have become more apparent [13]. During this critical period, China’s provincial DZs, a vital component of industrial zones, underwent a large-scale upgrade. Given the challenges of net-zero carbon initiatives and limited land resources, can the upgrade policy promote intensive land use and carbon neutrality, thus achieving a win–win scenario for economic development and environmental protection? Scientifically answering this question will provide insights for future zone construction, promoting green transformation and high-quality development.
The upgrade policy is closely linked to China’s reform strategy and macroeconomic changes [14]. Before 2009, most national economic development zones (EDZs) and high-tech development zones (HTDZs) were newly established, with only 25 out of 108 upgraded from the provincial level. From 2000 to 2009, the number of national DZs remained stable. In 2003, China began to rectify the disorder by closing some DZs, achieving completion in 2006. In 2009, the State Council reinitiated the upgrading of provincial DZs as a response to the 2008 financial crisis and to facilitate economic structural transformation, sparking a wave of “upgrading fever.” Recent advancements in DZ construction have strategically incorporated past experiences. In contrast to the establishment of early national DZs in cities with strong economic foundations, the upgrade policy applied to all cities. Most new national DZs were upgraded from existing provincial DZs [15]. According to the Ministry of Commerce of the People’s Republic of China’s January 2010 Review Principles and Standards for Upgrading Provincial Development Zones to National Economic and Technological Development Zones, only provincial DZs meeting rigorous criteria—economic development, technological innovation, intensive conservation, environmental protection, and social responsibility—were considered for upgrading to national status. Key indicators for assessing land use and green development include GDP per unit of land, land utilization rate, energy consumption, and carbon emissions per unit of GDP. This multi-criteria approach marks a pivotal transformation, emphasizing quality over quantity in the construction of DZs [16]. Additionally, the upgrade policy yields significant advantages. Benefits include enhanced authority to approve foreign investment projects and greater access to state support for land quotas and major projects. In 2012, the Ministry of Finance introduced the Measures for the Administration of Fiscal Interest Discount Funds for Infrastructure Projects in National Economic and Technological Development Zones and National Border Economic Cooperation Zones. These measures provide national DZs with loan interest discounts to enhance infrastructure and public utilities. Post-upgrade, preferential policies are standardized and expanded. The income tax rate for foreign-invested enterprises in national DZs is reduced to 15%, and specific industries and new enterprises enjoy additional tax benefits.
This study refines the land use efficiency evaluation system by incorporating the net-zero carbon balance and examines the impact of the upgrade policy on urban land use efficiency in the context of the net-zero carbon city goal. Methods employed include carbon budget accounting, the global super-efficiency epsilon-based measure model, and the staggered differences-in-differences model. The analysis uses data from 203 cities over the period 2006–2018. We introduce contrasting hypotheses to evaluate the impact of this significant change on urban land use efficiency. Specifically, we assess whether the alteration promotes the goals of intensive land use and carbon neutrality. First, we hypothesize that the upgrade policy enhances the urban land use efficiency under net-zero carbon city goals (Hypothesis I). National DZs are subjected to more rigorous assessments, particularly concerning environmental protection and land use efficiency. During construction, national DZs enhance pollution and emission control in production by installing real-time monitoring equipment and other technologies, effectively reducing energy consumption and carbon emissions [17]. Moreover, the dynamic exit mechanism for DZs integrates intensive land use evaluation into the overall assessment. Zones with low land use intensity receive warnings, and some even face downgrades or revocations. Efficient land use prevents the rapid expansion of construction areas and optimizes spatial structure, thereby enhancing carbon sequestration and reducing emissions [18]. Second, we hypothesize that the upgrade policy diminishes urban land use efficiency in pursuit of the net-zero carbon city goal (Hypothesis II). Although the upgrade policy yields benefits, it also leads to some issues. The abuse of preferential policies and the poor implementation of the intensive land use policy exacerbate disorderly expansion, leapfrog development, and environmental damage [10]. Furthermore, enterprises in the DZs subdivide industrial land and transfer land use rights to others, enabling some leading industries to make high profits by reselling property after prices increase rather than through actual production.
Early research on the economic consequences of the establishment of DZs indicates that regions with these zones outperform others in economic scale and foreign investment attraction [19,20]. Alder et al. [21] focus on urban economic growth and find that the establishment of DZs significantly increases urban GDP. Wang [22] focuses on FDI and export scale, discovering that the establishment of DZs significantly boosts a city’s investment attraction and export capacity. Notably, establishing DZs involves building from scratch, while upgrading existing ones elevates the level of pre-existing zones. While some research has not strictly distinguished between establishing and upgrading DZs, preliminary efforts have been made by other studies. Chen et al. [23] distinguish between provincial and national DZs, revealing that the industrial land use efficiency in national zones significantly exceeds that in provincial zones. Interjurisdictional competition causes this disparity, leading to significant differences in preferential policies [24]. Conversely, national DZs feature a higher administrative level [25], superior administrative and fiscal power [26], and stricter assessment [27], all of which contribute to a more favorable business environment and more substantial policy preferences. After 2009, the large-scale upgrading of provincial to national DZs provides a unique opportunity for identification. A limited body of literature on the upgrade policy predominantly concentrates on its economic effects. Most theoretical analyses in these studies focus on improvements in the business environment and the enhancement of policy incentives [28], emphasizing agglomeration and selection effects. Hu et al. [29] consider the upgrade policy as an exogenous impact and find that it helps curb population loss in shrinking cities. Li and Huang [30] suggest that the upgrading of HTDZs significantly promotes urban innovation by enhancing financing channels, infrastructure, and industrial agglomeration. According to Kong and Chai [14], the policy significantly improves urban economic efficiency through the selection effect.
Current studies indicate that the upgrade policy significantly benefits local population inflow, technological innovation, and economic efficiency. These elements are essential in influencing urban land use efficiency and net carbon emissions [31,32]. Regrettably, further exploration is lacking. In fact, provincial DZs were predominantly established to cater to interjurisdictional competition, prioritizing investment and economic expansion [33]. Poor governance, along with the abuse of industrial policies and administrative authority, are key factors in various urban land use issues [34,35], such as loss of arable land [36], uncoordinated urban sprawl [37], high carbon emission intensity [38], and environmental pollution [39]. Following the upgrading of provincial DZs, zones face more stringent assessments in land use and environmental protection. In 2014, the State Council issued the Opinions on Promoting the Transition, Upgrading, and Innovative Development of National Economic and Technology Development Zones, which specifically emphasized green low-carbon circular development and intensive land use as critical assessment criteria. The Assessment Methods for the Comprehensive Development Level of National Economic and Technological Development Zones issued by the Ministry of Commerce in 2016 more clearly list land use efficiency, energy efficiency, and pollutant emission intensity as assessment indicators for national DZs. However, existing literature on the relationship between DZs and land use [10], air pollution [40], and carbon emissions [41] is scarce and largely limited to zone establishment.
While the existing literature yields significant findings, several shortcomings emerge: First, prior research primarily focuses on the economic effects of the upgrade policy, neglecting potential environmental consequences. Second, the insufficient differentiation between establishing and upgrading DZs may lead to selection bias. Third, the integration of carbon balance into urban land use efficiency measurement remains underexplored. Fourth, existing studies primarily emphasize theoretical analyses of the business environment and preferential policies, overlooking other potential mechanisms. Overall, this study makes the following three contributions: First, this study explores the environmental effects of the upgrade policy within the dual constraints of land resources and carbon neutrality. This identification delineates the preconditions for carbon neutrality via industrial policies. It also avoids potential sample selection biases caused by not strictly distinguishing between establishing and upgrading DZs, thereby clarifying the policy’s net effect. Second, through carbon budget accounting, this study integrates carbon balance into urban land use efficiency measurement. This integration is essential to meet the global demand for sustainable land use, aligning with the goals of achieving carbon peak and neutrality, thus supporting a net-zero transition and high-quality development. Third, this study investigates three impact mechanisms stemming from changes in assessment and authority: land-use and environmental regulations, resource allocation optimization, and green technological innovation, thus enriching the current body of literature.
The study’s structure is as follows: the remainder of the first section discusses the research background and theoretical mechanisms; the second section describes the materials and methods; the third section presents the research results; the fourth section provides the discussion; and the final section concludes with policy implications.

2. Research Background and Theoretical Mechanisms

2.1. The Upgrade Policy and High-Quality Transformation in DZ Construction

In 2009, the State Council of the People’s Republic of China reinitiated the upgrading of provincial DZs. Figure 1 shows the specific spatial distribution of upgraded DZs in China. China’s upgrade policy has led to higher administrative levels, decentralized administrative and fiscal powers, increased national support, and more stringent indicator assessments within DZs. Specifically, these enhanced assessments and the dynamic exit mechanism have been instrumental in driving the high-quality transformation in these upgraded zones. Provincial DZs in China are typically established in response to interjurisdictional competition, prioritizing investment and growth while often neglecting land resource constraints and environmental protection [42]. In contrast, national DZs face stringent assessments that encompass economic progress, technological innovation, intensive conservation, environmental protection, and social responsibility. Also, the dynamic exit mechanism addresses the issue of inadequate incentives for local officials [43]. Furthermore, independent fiscal accounting and elevated administrative levels mitigate the interference of local governments [44]. As a result, the management committee of upgraded DZs prioritizes providing limited land and policy preferences to high-tech and high-value-added enterprises to meet assessment requirements.
Effective administrative management, strengthened preferential policies, prioritized land supply, and strong financial support—enabled by higher administrative levels, decentralized administrative and fiscal powers, and increased national support—have made China’s upgraded provincial DZs more effective at attracting high-quality investment. In certain economic management areas, the central government grants provincial and municipal authority to national DZs at a higher level than provincial DZs. Regarding preferential policies, provincial DZs are not directly managed by the central government, resulting in no significant differences in preferential policies within and outside these zones [23]. Conversely, national DZs, managed by China’s central government, uniformly reduce the income tax rate for foreign-invested enterprises to 15% and extend specific tax preferences to certain industries and new enterprises. When arranging annual land use plans, provincial governments prioritize the land needs of national zones. Regarding financial support, national HTDZs can issue long-term bonds through banks to support high-tech industries and establish venture capital funds for high-risk high-tech products. More mature national HTDZs may also establish venture capital companies. In contrast, provincial DZs lack these policies and rely primarily on coordinated and assisted financial support [15]. Moreover, the People’s Republic of China Ministry of Commerce strengthened infrastructure support for upgraded DZs through loan interest subsidy policies. Ultimately, these facilitated the high-quality transformation of upgraded DZs.

2.2. Theoretical Mechanisms

To align urban land use efficiency with the net-zero carbon city goal, it is essential to harmonize economic growth with sustainable land use and net-zero carbon emissions. This efficiency involves inputs like land, capital, and labor, and outputs such as economic and social benefits, along with the reduction of net carbon emissions. Net carbon emissions serve as a crucial indicator of carbon neutrality in a net-zero carbon city, where equivalent carbon removals offset emissions. We present a theoretical framework for land use efficiency aimed at fostering net-zero carbon cities (see Figure 2). This framework treats GDP and net carbon emissions as desired and undesirable outputs, respectively, and considers built-up area, capital stock, and employment numbers as inputs. The emphasis here is on land use within the net-zero carbon city context, excluding other environmental pollutants. Building on the above framework, we propose three important mechanisms by which the upgrade policy can promote urban land use efficiency, emphasizing carbon balance.
First, by strengthening land-use and environmental regulations, the upgrade policy increases land use intensity, improves carbon sinks, and reduces emissions. Provincial DZs upgraded to the national level are then subjected to more rigorous assessments. These assessments include land use efficiency and environmental protection indicators such as GDP per unit of land, land use intensity, and energy consumption per unit of GDP. Modern technologies, such as remote sensing, enhance land change monitoring during the construction of national DZs [45]. Meanwhile, the installation of real-time environmental monitoring equipment strengthens both source and terminal controls [46]. Beyond enhancing assessment indicators and monitoring, independent fiscal accounting, elevated administrative levels, and dynamic exit mechanisms further improve the assessment process’s effectiveness by reducing local intervention and strengthening official incentives. Strengthened assessments effectively promote efficient land use and reduce energy consumption intensity. Land use changes significantly influence the carbon cycle within terrestrial ecosystems, potentially serving as both carbon sources and sinks [47]. Efficient land use curbs the rapid expansion of construction areas and optimizes the spatial structure of land use, enhancing the carbon sequestration capacity of ecological land and reducing carbon emissions from construction land. Moreover, given China’s coal-centric energy structure [48], reduced energy consumption intensity significantly decreases the reliance on fossil fuels like coal, thereby reducing carbon emission intensity.
Second, the upgrade policy optimizes resource allocation to achieve synergistic effects, reducing carbon emissions and fostering intensive land use. Resource misallocation significantly contributes to China’s low land use intensity and high carbon emission intensity [49,50]. This is caused by market imperfections, institutional defects or obstacles, as well as improper administrative intervention or policy distortion [51]. After upgrading DZs, the enhancement of the administrative level effectively reduces local government interference, thereby alleviating resource misallocation. Furthermore, management committees, possessing information advantages, support key industries that align with local comparative advantages. The decentralization of administrative and fiscal powers gives these committees greater authority to create and enforce industrial policies, thereby minimizing resource misallocation through the selection effect. Moreover, administrative approval reform can effectively lower institutional costs, reduce factor mismatches within and between enterprises, and optimize resource allocation. Alleviating land misallocation can effectively curb the overdevelopment of enterprises with low land use intensity [52], thereby promoting structural optimization and land use intensity. Addressing capital misallocation can bridge the funding gap for enterprises to acquire green technology licenses and upgrade equipment [53], thereby optimizing the factor input structure and reducing carbon emission intensity. Consequently, the improvement in resource allocation due to the upgrade policy can effectively promote intensive land use and reduce carbon emissions.
Third, the upgrade policy fosters green technological innovation, thereby enhancing land use efficiency with a focus on carbon balance. Technological innovation is a core task of national DZs, particularly HTDZs, and is a crucial assessment indicator for upgraded DZs. Given resource constraints, management committees tend to support enterprises with strong innovation capabilities to meet these assessment requirements. This approach creates a virtuous cycle of “government subsidies—enterprise innovation—government incentives” through the selection effect. Also, due to high environmental costs, polluting enterprises find it imperative to promote green technological innovation to achieve sustainable development and lower environmental pollution control costs [54]. Meanwhile, optimized resource allocation minimizes the mismatch of innovation factors, enhancing innovation efficiency [55]. Streamlined administrative approval processes also reduce institutional transaction costs and encourage green technological innovation. Green technological innovation, as a central strategy for improving energy efficiency and reducing carbon emissions, can significantly enhance land use efficiency in pursuit of the net-zero carbon city goal.

3. Materials and Methods

3.1. Sample Selection and Data Description

Given that China completed the cleanup and rectification of provincial DZs in 2006, and considering the lack of certain statistical data, this study defines the research period as 2006–2018. Figure 3 shows the number of upgraded provincial DZs from 2009 to 2021. To avoid potential bias from not distinguishing between establishing and upgrading DZs, this study excludes cities with national EDZs or HTDZs established before 2009. Furthermore, cities without provincial EDZs or HTDZs established before 2009, as well as all autonomous prefectures, are excluded. This process yielded 203 cities, with 126 in the treatment group having upgraded DZs and 77 in the control group.
Data regarding DZs are sourced from the 2006 and 2018 editions of the China Development Zone Audit Announcement Catalogue. Provincial carbon emission data used in calculating net carbon emissions come from the China Energy Statistical Yearbook (2007–2019). Night light data (DMSP/OLS and NPP/VIIRS) are provided by the Earth Observation Group, and net primary productivity data are from NASA’s MODIS net primary productivity product (MOD17A3). Other land use efficiency data and control variables are derived from the China City Statistical Yearbook (2007–2019). Data on land transfer transactions are sourced from a detailed parcel-level database available on the Chinese land market website (http://www.landchina.com, accessed on 17 April 2024), supported by the Ministry of Land and Resources. The environmental administrative penalty data are from the Institute of Public and Environmental Affairs. The patent data are from the Chinese Research Data Services Platform. Capital stock is calculated using the perpetual inventory method. All price-based indicators are deflated to actual values, with 2006 as the base period. Missing values are filled in using linear interpolation.

3.2. Variable Settings

3.2.1. Dependent Variable

The urban land use efficiency (ULUE) is measured using the global super-efficiency epsilon-based measure model. The setting of returns to scale is variable returns to scale (VRS). Table 1 shows the variable descriptions of inputs and outputs. Section 3.3.1 shows the detailed calculation process for net carbon emissions.

3.2.2. Independent Variable

For cities with provincial DZs upgraded to national-level, the variable value of the DZ upgrading (UPDZ) is 1 for the current and subsequent years; otherwise, it is 0.

3.2.3. Control Variables

The control variables include economic development (Pgdp), government intervention (Gov), financial development (Fin), industrial structure (Indus), foreign direct investment (Fdi), and the number of provincial DZs (Num). Table 2 shows the specific definitions of control variables. Table A1 in Appendix A shows the descriptive statistics of all variables.

3.3. Methods

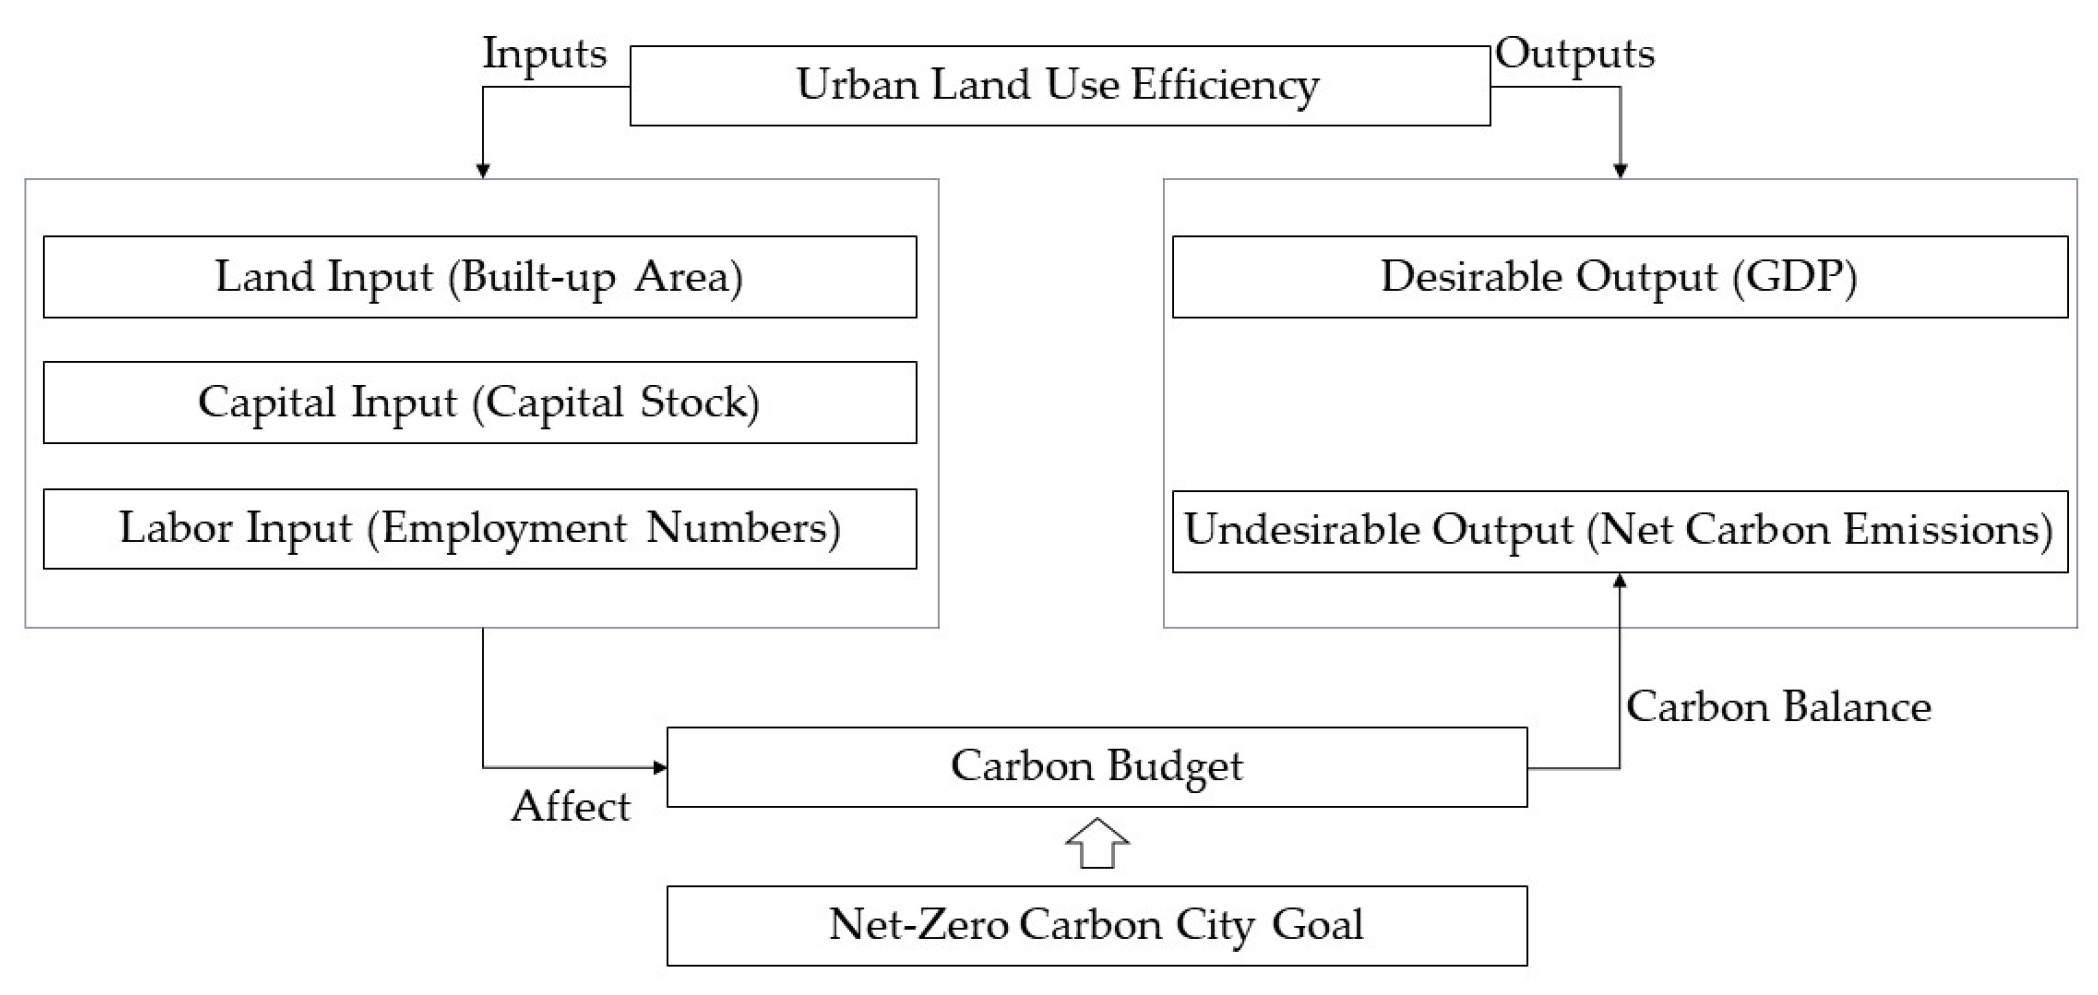
3.3.1. Carbon Budget Accounting

Carbon budget accounting requires accurate measurement of carbon emissions and sinks. Carbon sinks are assessed through the net primary productivity method, which calculates the net organic matter produced by vegetation, subtracting plant respiration, over a specific period and area [56,57]. Vegetation sequesters atmospheric CO2, producing glucose via photosynthesis and releasing oxygen, as depicted by the following chemical equation:
6 C O 2 + 6 H 2 O C 6 H 12 O 6 + 6 O 2 .
This indicates that 1.62 g of CO2 are sequestered for every gram of dry biomass produced, with this biomass constituting approximately 45% of total net primary productivity (NPP). Thus, the formula for calculating vegetation carbon sinks, CS, is
C S = ( N P P / 0.45 ) × 1.62 .
Carbon emissions (CE) are estimated using the PSO-BP algorithm, integrating DMSP/OLS and NPP/VIIRS nighttime light data with provincial carbon emission statistics [57]. Initially, a correlation between provincial carbon emissions and nighttime light intensity, represented by the sum of DN values, is established. Urban carbon emissions are inferred from these DN values using a weighted average. Provincial carbon emissions are calculated according to Intergovernmental Panel on Climate Change guidelines, using energy consumption data from energy balance sheets [58].
Therefore, the net carbon emissions, NCE, is
N C E = C E C S .

3.3.2. Global Super-Efficiency Epsilon-Based Measure Model

Data Envelopment Analysis is a critical tool for efficiency evaluation, encompassing radial and non-radial models. Radial models assume proportional reductions across all elements, an assumption often misaligned with real-world economic scenarios. Conversely, non-radial models, such as the slacks-based measure model, circumvent this proportionality but can lose original information. A significant innovation by Tone and Tsutsui [59] introduced the epsilon-based measure model, integrating both radial and non-radial models, thereby capturing the full spectrum of information. Additionally, to rank decision-making units (DMUs) with an efficiency score of 1 and compare land use efficiency over different periods, super efficiency is essential. Building on the studies by Zhang et al. [60] and Wang et al. [61], and considering cities as DMUs, we construct the global technology production possibility set as follows: for DMUi, with m input types denoted as xi = (xi1,xi2,…xim), producing s desirable outputs represented by yi = (yi1,yi2,…yis), and p undesirable outputs, indicated by bi = (bi1,bi2,…bim). The resulting production possibility set, reflecting land use efficiency, is defined accordingly:
P = x ¯ , y ¯ , b ¯ | t = 1 T j = 1 , j 0 n x j t γ j t x t ¯ ; t = 1 T j = 1 , j 0 n b j t γ j t b t ¯ ; t = 1 T j = 1 , j 0 n y j t γ j t y t ¯ t = 1 T j = 1 , j 0 n γ j t = 1 ; γ 0 .
Let x ¯ , y ¯ , b ¯ , represent the optimal solution of the model, with γ as the weight variable. The global super-efficiency epsilon-based measure model is expressed as follows:
K * = min θ , φ , γ , s , s + θ + ε x i = 1 m w i s i x i o φ ε y r = 1 s w r + s r + y r o ε b q = 1 p w q b s q b b q o
t = 1 T j = 1 , j 0 n x i j t γ j t s i θ x i o , i = 1 , , m t = 1 T j = 1 , j 0 n y r j t γ j t + s r + φ y r o , r = 1 , , s t = 1 T j = 1 , j 0 n b q j t γ j t s q b b q o , q = 1 , , p t = 1 T j = 1 , j 0 n γ j t = 1 γ 0 ,   s i 0 ,   s r + 0 , s q b 0 .
K* represents the optimal efficiency within the epsilon-based measure model. The nonnegative slack variables s i ¯ , s r + , and s q b ¯ correspond to the relaxation of the input factor, desirable output factor, and undesirable output factor, respectively. Similarly, the weights w i ¯ , w r + , and w q ¯ are associated with the input factor, desirable output factor, and undesirable output factor, respectively. The planning parameters for the radial component are denoted as θ and φ. The parameter ε, ranging from 0 to 1, is crucial in determining the balance between radial and non-radial relaxations. When ε = 0, the epsilon-based measure model aligns with the CCR model, while an ε value of 1 equates the epsilon-based measure model to the slacks-based measure model.

3.3.3. Staggered Differences-in-Differences Model

Traditional differences-in-differences models typically feature a single policy impact year. In contrast, the upgrade policy examined here spans from 2009 to 2018, requiring a staggered differences-in-differences method to accommodate inconsistent policy impact times. This method is less prone to confounding influences, given the minimal likelihood that unobserved factors and policy impacts share the same distribution annually. Therefore, this study employs the staggered differences-in-differences method to analyze the effects of phased provincial DZ upgrades on urban land use efficiency in the context of the net-zero carbon city goal. The baseline regression model is specified as follows:
U L U E i t = α + β U P D Z i t + λ X i t + γ t + μ i + ε i t .
Here, ULUEit stands for urban land use efficiency of city i in year t; UPDZit is a dummy variable indicating whether city i had its provincial DZ upgraded to a national-level DZ in year t; Xit comprises control variables that impact land use efficiency at the city level; μi is the city fixed effect; γt is the time fixed effect; and εit is the random error term.

4. Results

4.1. Stylized Facts of Urban Net Carbon Emissions and Land Use Efficiency

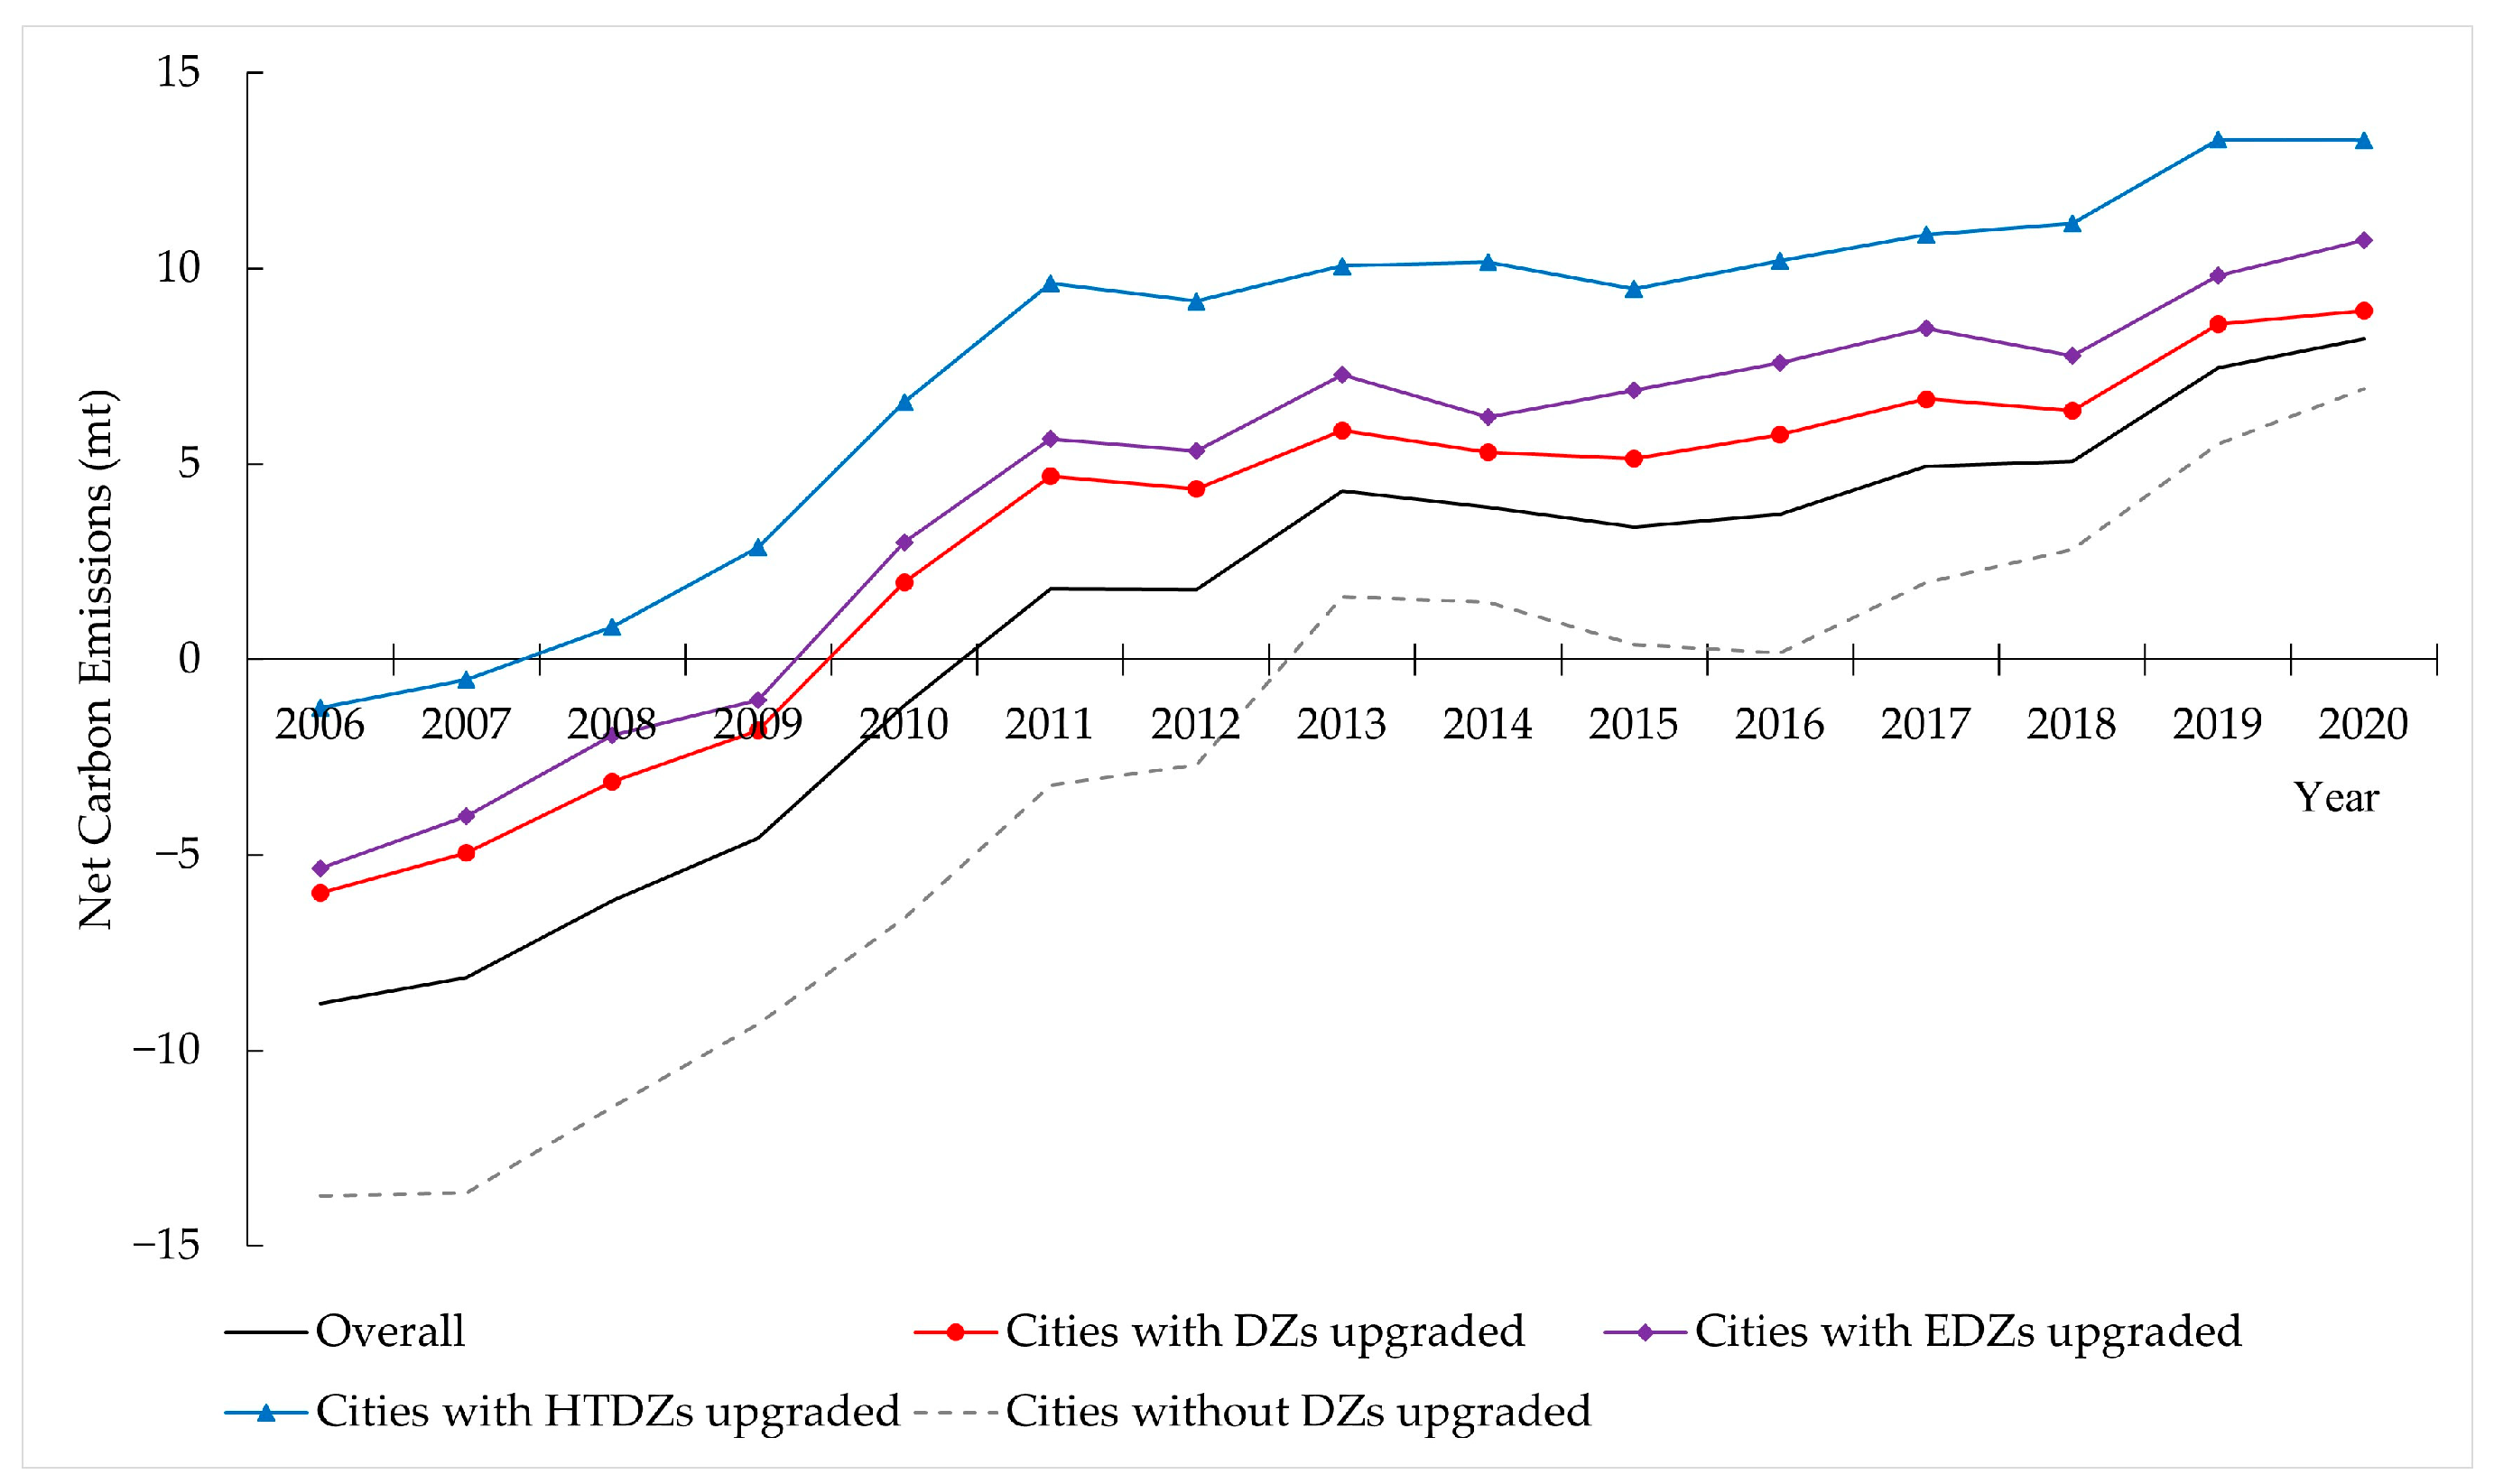
4.1.1. Stylized Facts of Urban Net Carbon Emissions

Figure 4 shows that the average net carbon emissions in Chinese cities rose from −8.80 mt in 2006 to 8.20 mt in 2020, with the growth rate slowing after 2011, indicating effective energy conservation and emission reduction efforts. This achievement can be linked to the 12th five-year plan on National Economic and Social Development of the Peoples Republic of China (2011–2015), which first mandated the reduction of carbon emission intensity as a binding target within national economic and social development plans. Analysis by group reveals that, since 2011, cities with DZs upgraded experienced a significantly slower increase in average net carbon emissions compared to those without DZs upgraded. Since 2010 marked a period of intensive DZ upgrades (see Figure 3), this trend likely indicates the emission reduction and sink enhancement effects of the upgrade policy. However, further empirical tests are needed, which will be further verified in Section 4.4. Additionally, trends in cities with EDZs and HTDZs upgraded are similar, warranting further heterogeneity testing.

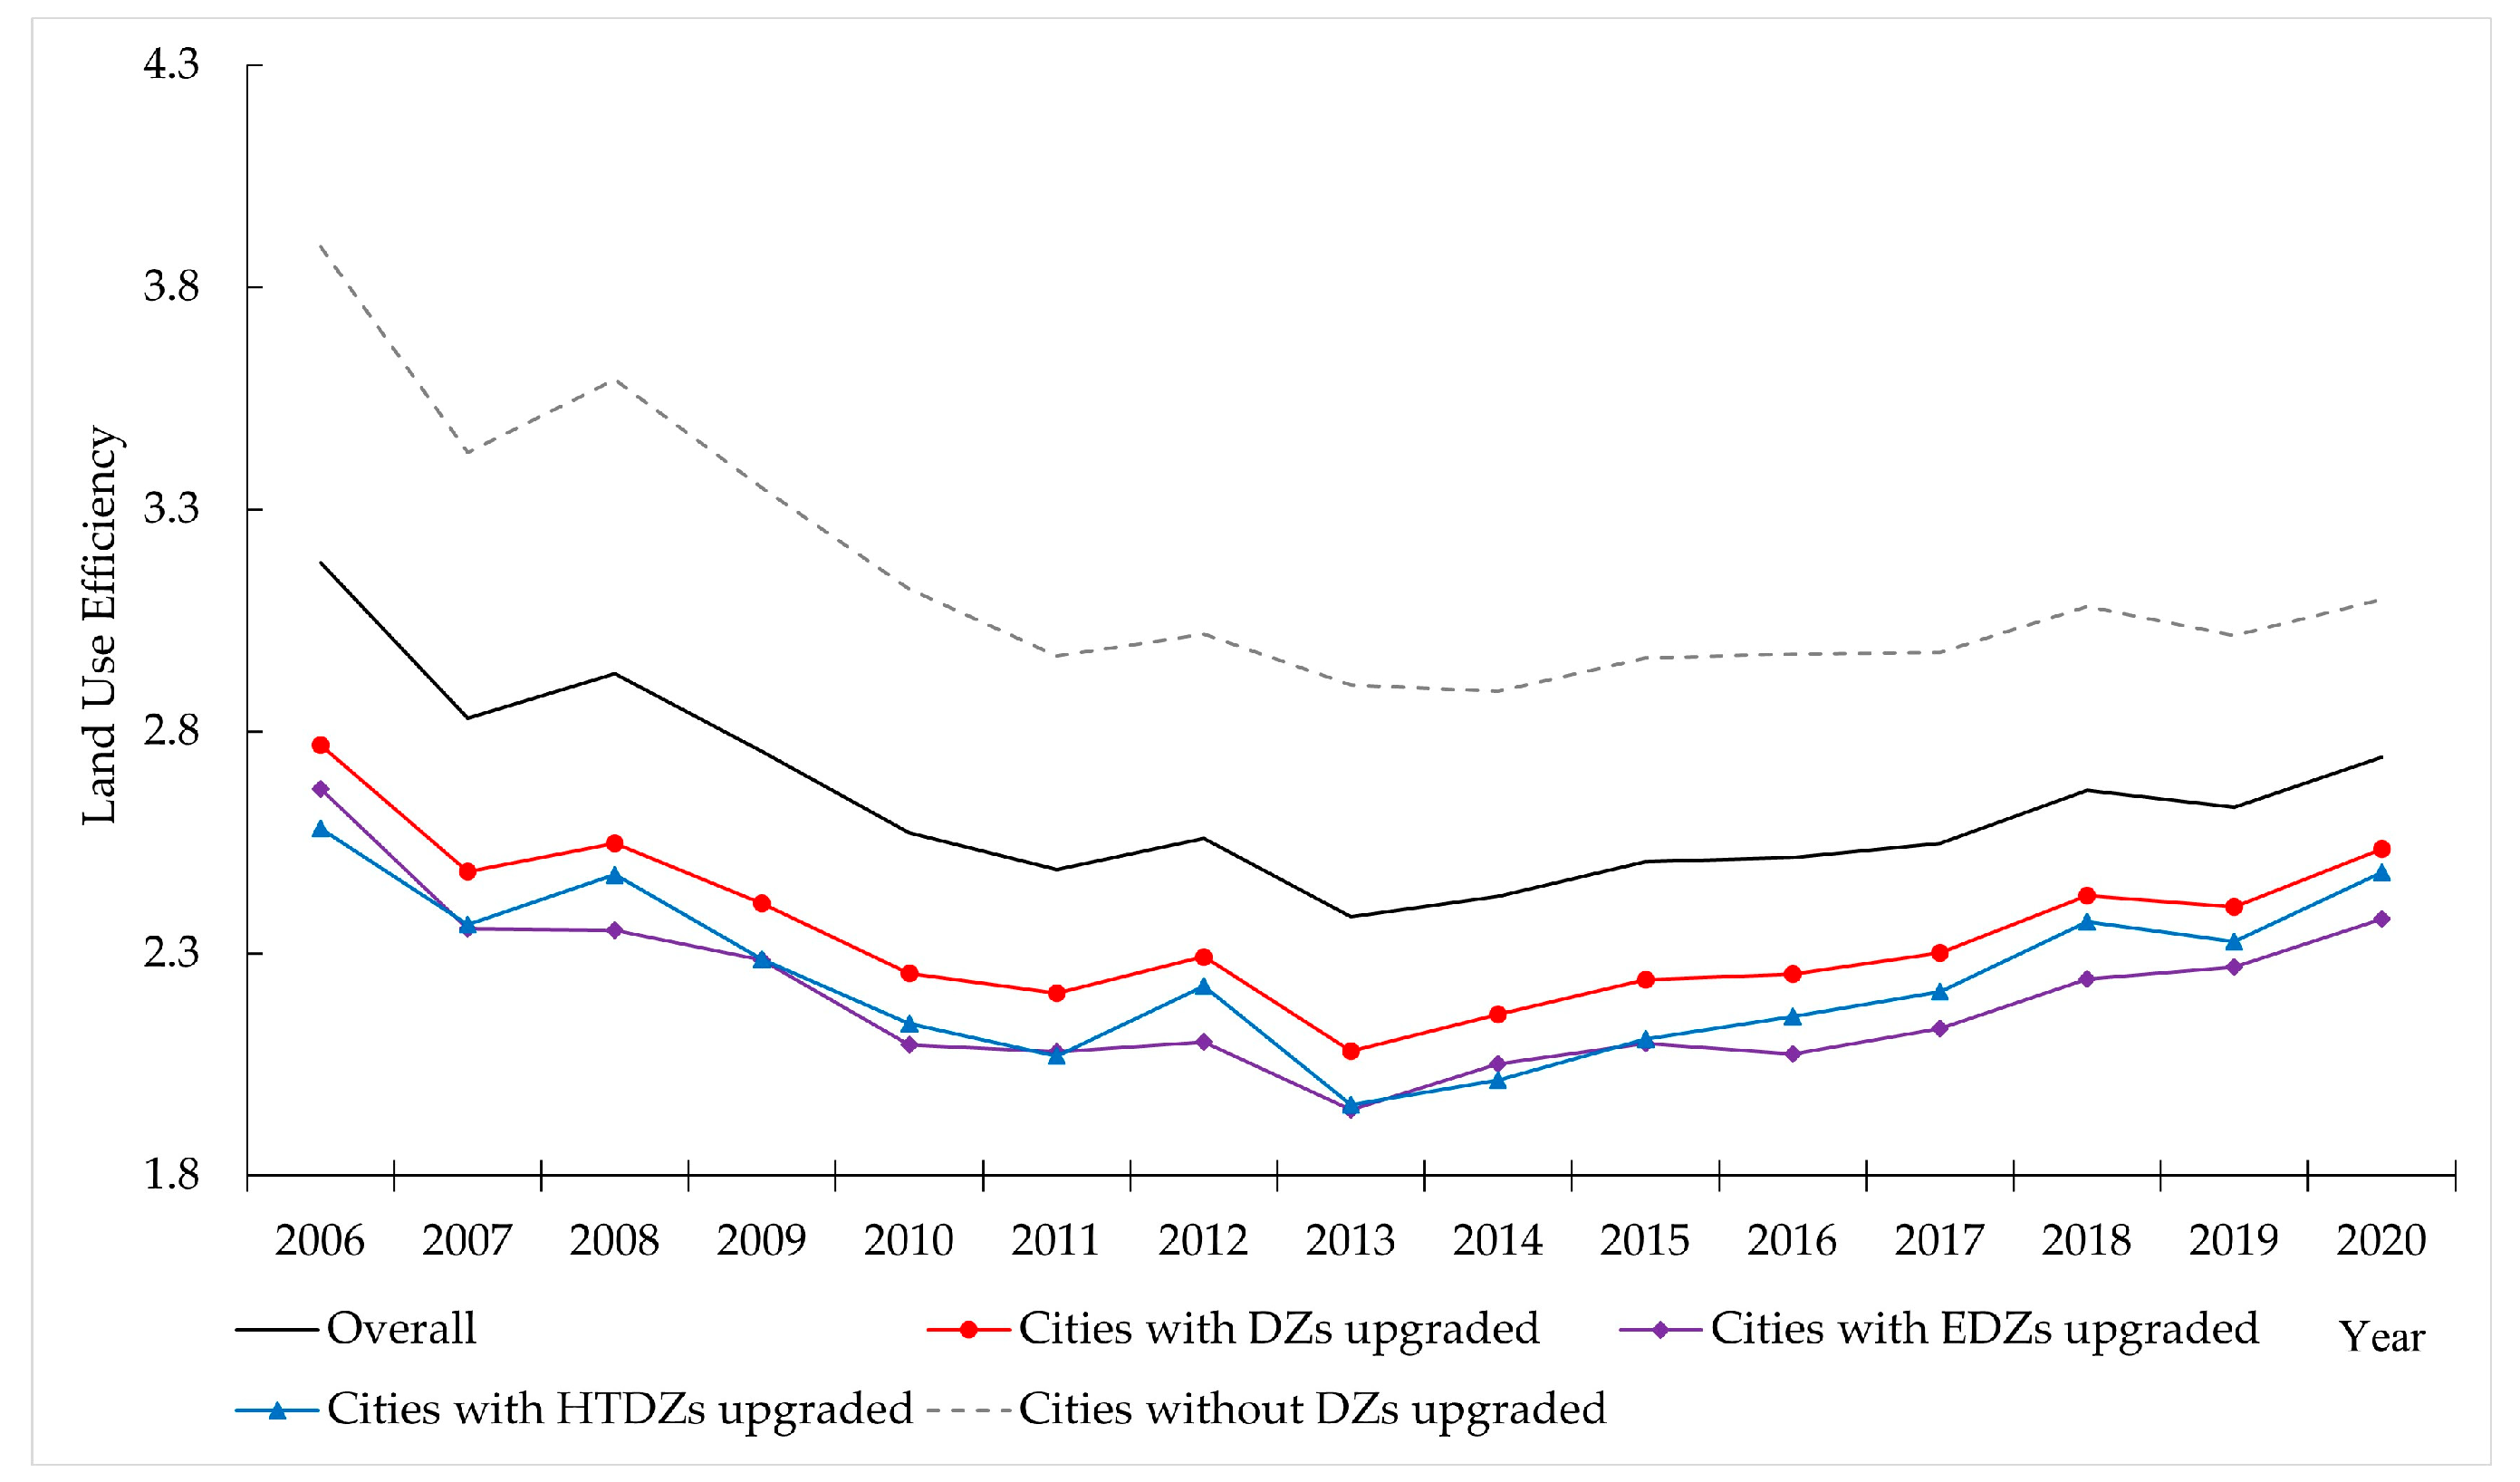
4.1.2. Stylized Facts of Urban Land Use Efficiency

As shown in Figure 5, the average land use efficiency in Chinese cities from 2006 to 2020 exhibits a clear U-shaped trend. The land use efficiency declined between 2006 and 2013 then gradually recovered. Group analysis shows that since 2013, there has been a significant difference in the upward trend of land use efficiency between cities with DZs upgraded and those without. The average land use efficiency in cities with DZs upgraded increased significantly after 2013, while the average land use efficiency in cities without DZs upgraded rose more slowly. This provides preliminary evidence that the upgrade policy can improve urban land use efficiency. However, we need additional empirical tests, which we will further verify in Section 4.2. Further comparisons show that upgrading to national HTDZs has a more pronounced policy effect than upgrading to national EDZs. The land use efficiency improvement of HTDZs after 2013 is more significant, indicating a stronger effect on promoting land use efficiency. Section 4.6 further verifies this.

4.2. Benchmark Results

Table 3 presents the impact of the upgrade policy on urban land use efficiency. Without control variables, the impact of DZ upgrading on urban land use efficiency is 0.053, which is significant at the 5% level. Including control variables results in a significant 1% impact of DZ upgrading on urban land use efficiency of 0.047. These findings indicate that the upgrade policy significantly enhances urban land use efficiency, aligning with the characteristic fact in Section 4.1.2. Hypothesis I has been preliminarily validated. The inclusion of control variables enhances the coefficient’s significance, suggesting robustness in the results. Further robustness tests, as detailed in Section 4.3, are necessary.

4.3. Robustness Tests

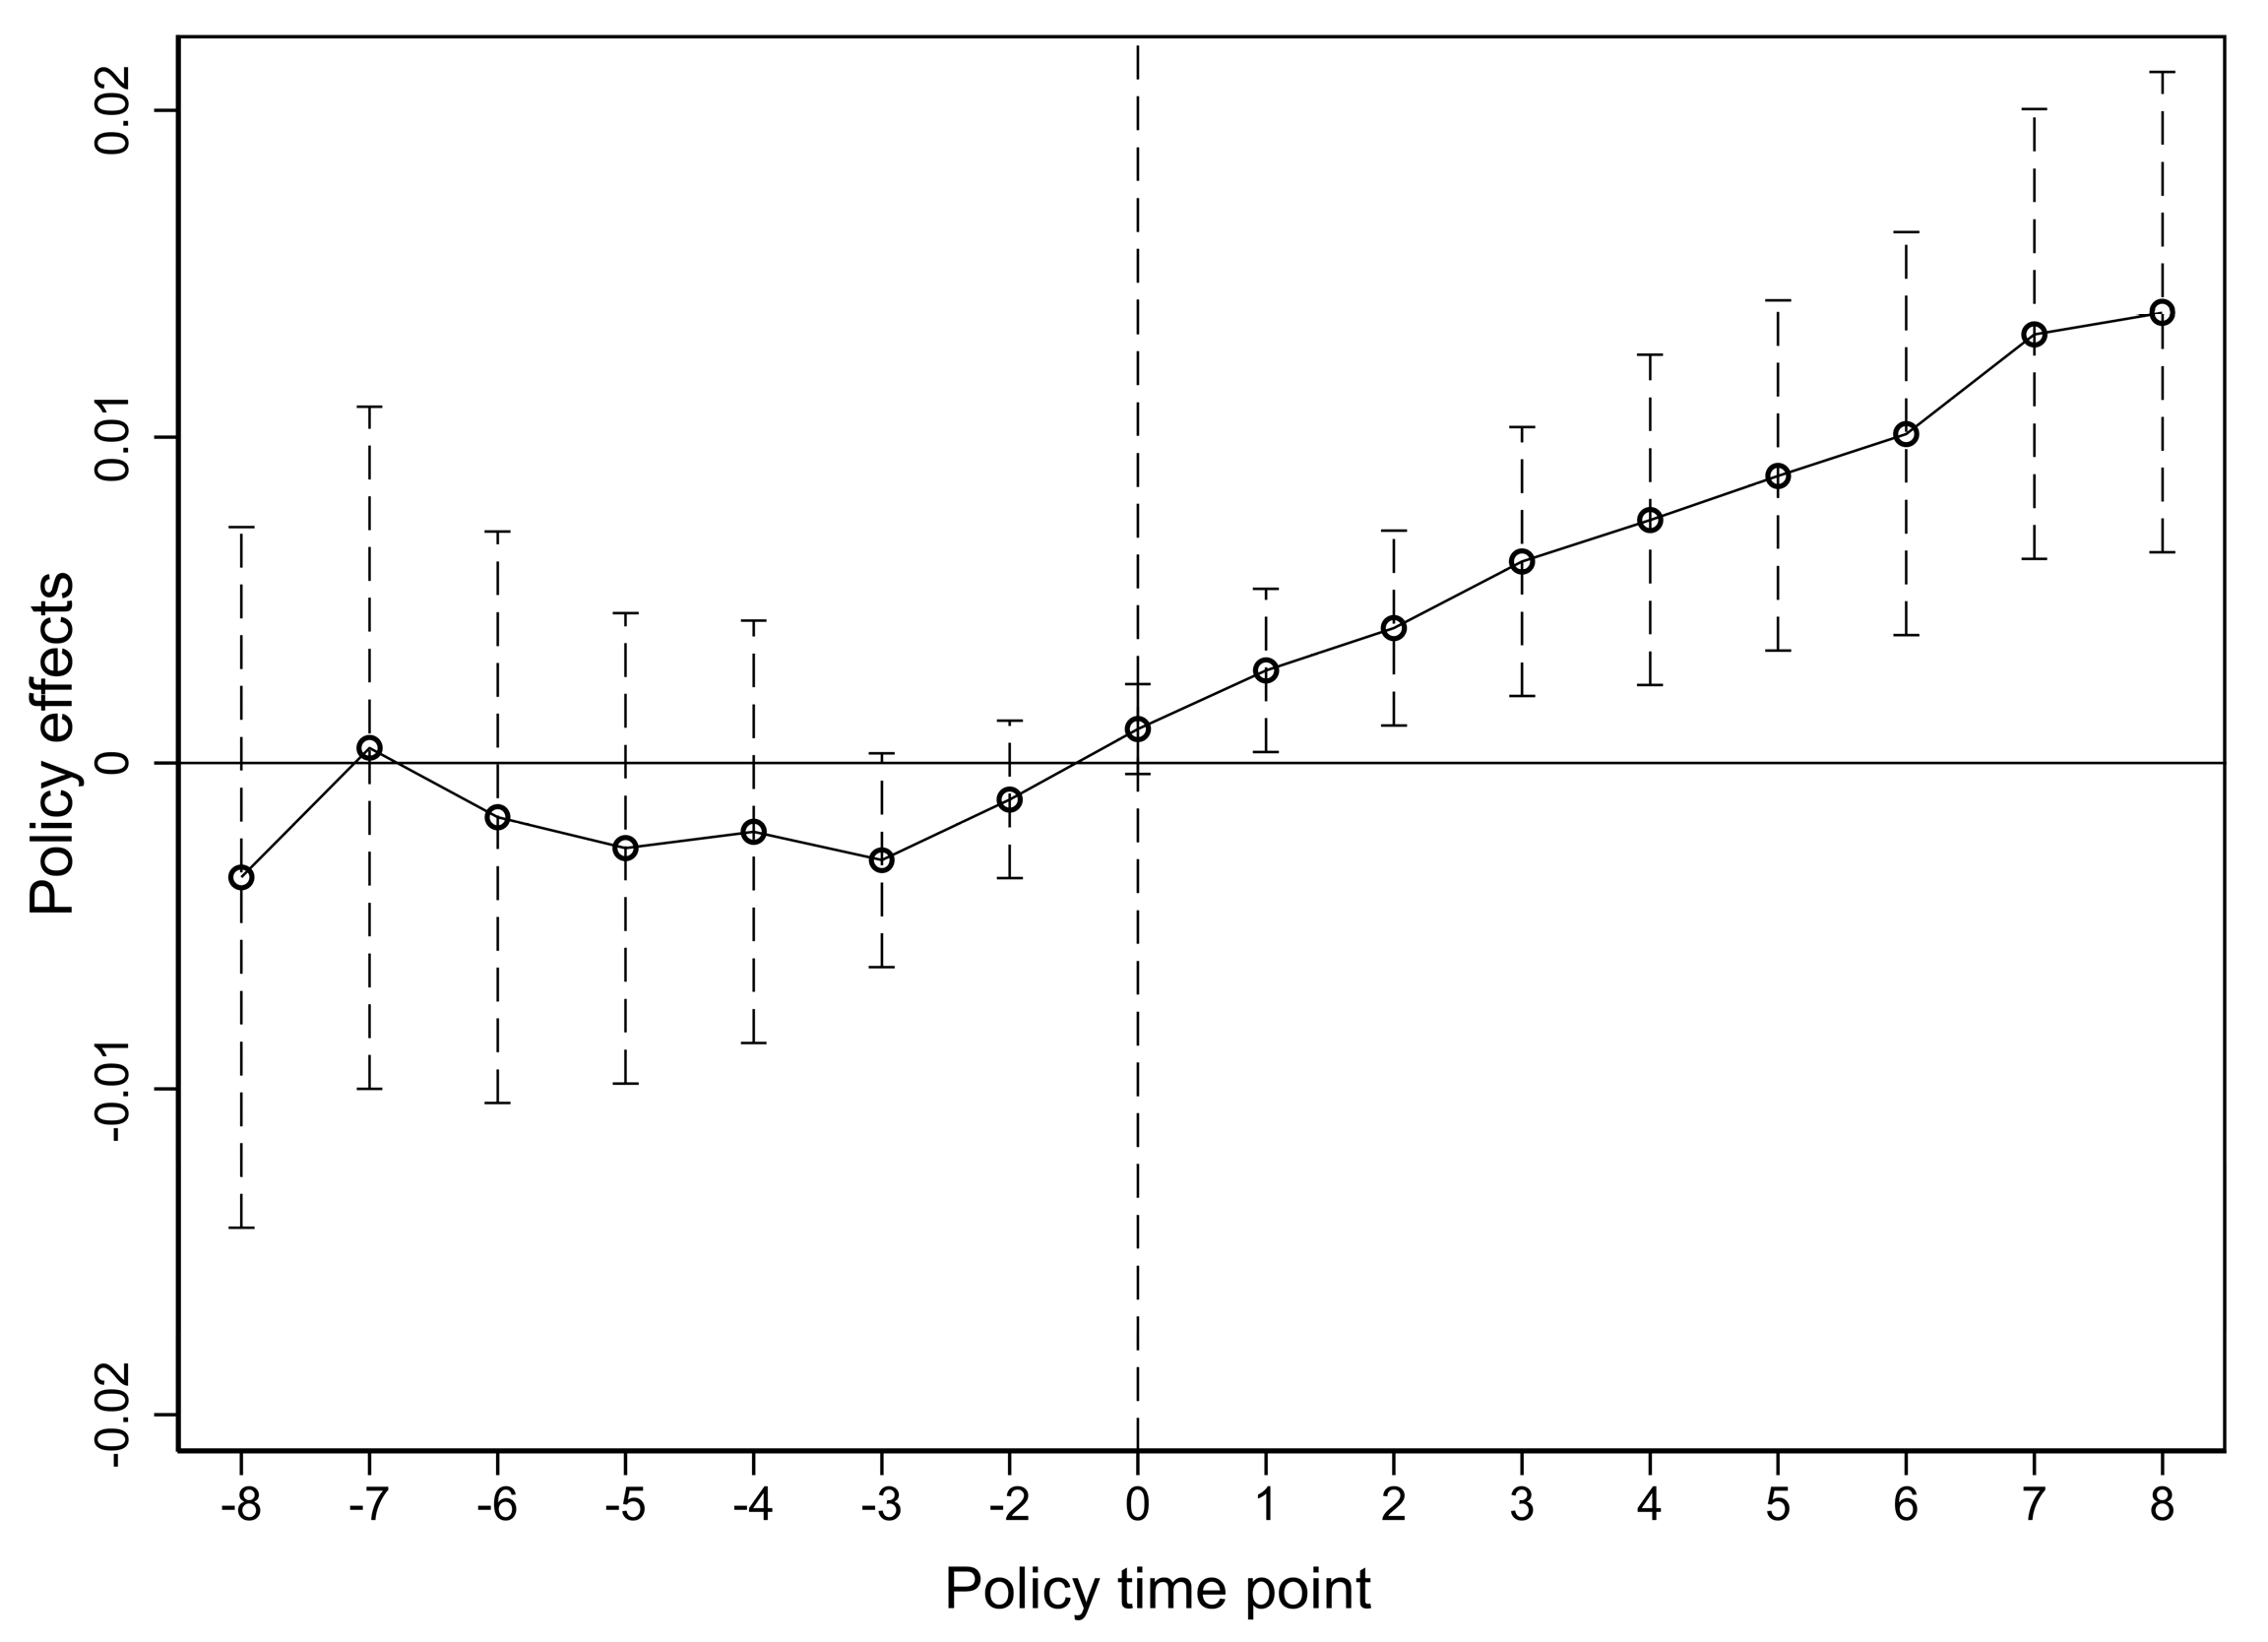
4.3.1. Parallel Trends Test and Dynamic Effects Analysis

The differences-in-differences method must satisfy the parallel trend assumption. Most empirical studies employ the event study method to conduct ex-ante trend tests, offering evidence for this assumption. Typically, we use the significance level of the ex-ante coefficient to evaluate the fulfillment of the parallel trend assumption. Specifically, ex-ante coefficients pass the parallel trend test if they are not significant [62]. This study uses this method to test the parallel trend assumption by examining whether the urban land use efficiency of the treatment and control groups follows the same trend before the provincial DZs were upgraded. Here is the specification for the event study model:
U L U E i t = α + k = 8 ,   k 1 8 β k P o l i c y i t k + λ X i t + γ t + μ i + ε i t .
Here, Policy signifies the relative year variable, taking the pilot year as the reference. The regression employs the year before the upgrading as the baseline period. Figure 6 reports the results of the parallel trend test. Initially, the estimated coefficients hovered around zero and lacked significance before the upgrade of provincial DZs. Post-upgrading, the coefficients rose significantly starting from the policy’s second year. This evidence implies that the enhancement in land use efficiency due to the upgrading of provincial DZs persists and intensifies over time, proving to be a lasting economic and environmental benefit. Thus, the parallel trend test in the differences-in-differences is robustly confirmed.

4.3.2. Synthetic Differences-in-Differences Estimation

Synthetic differences-in-differences estimation uses individual and time weights to match pre-treatment trends between treatment and control groups, balancing pre-treatment and post-treatment periods to enhance comparability. Through theoretical analysis and empirical testing, Arkhangelsky et al. found that the coefficients from the synthetic differences-in-differences method are more robust and accurate than those from synthetic control or traditional differences-in-differences methods [63]. This study conducts a synthetic differences-in-differences test by transforming the sample into balanced panel data and using bootstrapping for statistical inference. Table 4 presents the results of the synthetic differences-in-differences method, showing that, regardless of the inclusion of control variables, the regression coefficient of UPDZ remains significantly positive, confirming the robustness of the benchmark results.

4.3.3. Tests for Heterogeneous Treatment Effects

Given the varying times of provincial DZ upgrades in this study, using the traditional two-way fixed effect model may introduce estimation bias due to heterogeneous treatment effects. To address this issue, this study first decomposes the staggered differences-in-differences estimation results using the Goodman-Bacon approach [64]. Table 5, Panel B, presents the decomposition results for different subgroups. Subgroups with potential estimation bias account for only 7.3%, indicating that the estimation results are largely unaffected by bias. Although the Goodman-Bacon decomposition suggests that this study is unlikely to be affected by heterogeneous treatment effects, we use the Callaway and Sant differences-in-differences method for robustness testing [65]. This method divides the sample into subgroups, estimates their treatment effects, and then sums these effects using a specific strategy to calculate the average treatment effect (ATT) for the sample period. The summing strategy reduces the weights of potentially biased groups. The four types of average treatment effects (ATT) are: (1) simple weighted ATT, which uses equal weights; (2) dynamic ATT, which weights groups based on time since first treatment; (3) calendar ATT, which weights groups based on all years; and (4) group ATT, which weights groups based on time of first treatment. The specific results are shown in Table 5, Panel A. All four types of ATT indicate that the upgrade policy significantly promotes urban land use efficiency, consistent with benchmark results, affirming the robustness of our conclusions.

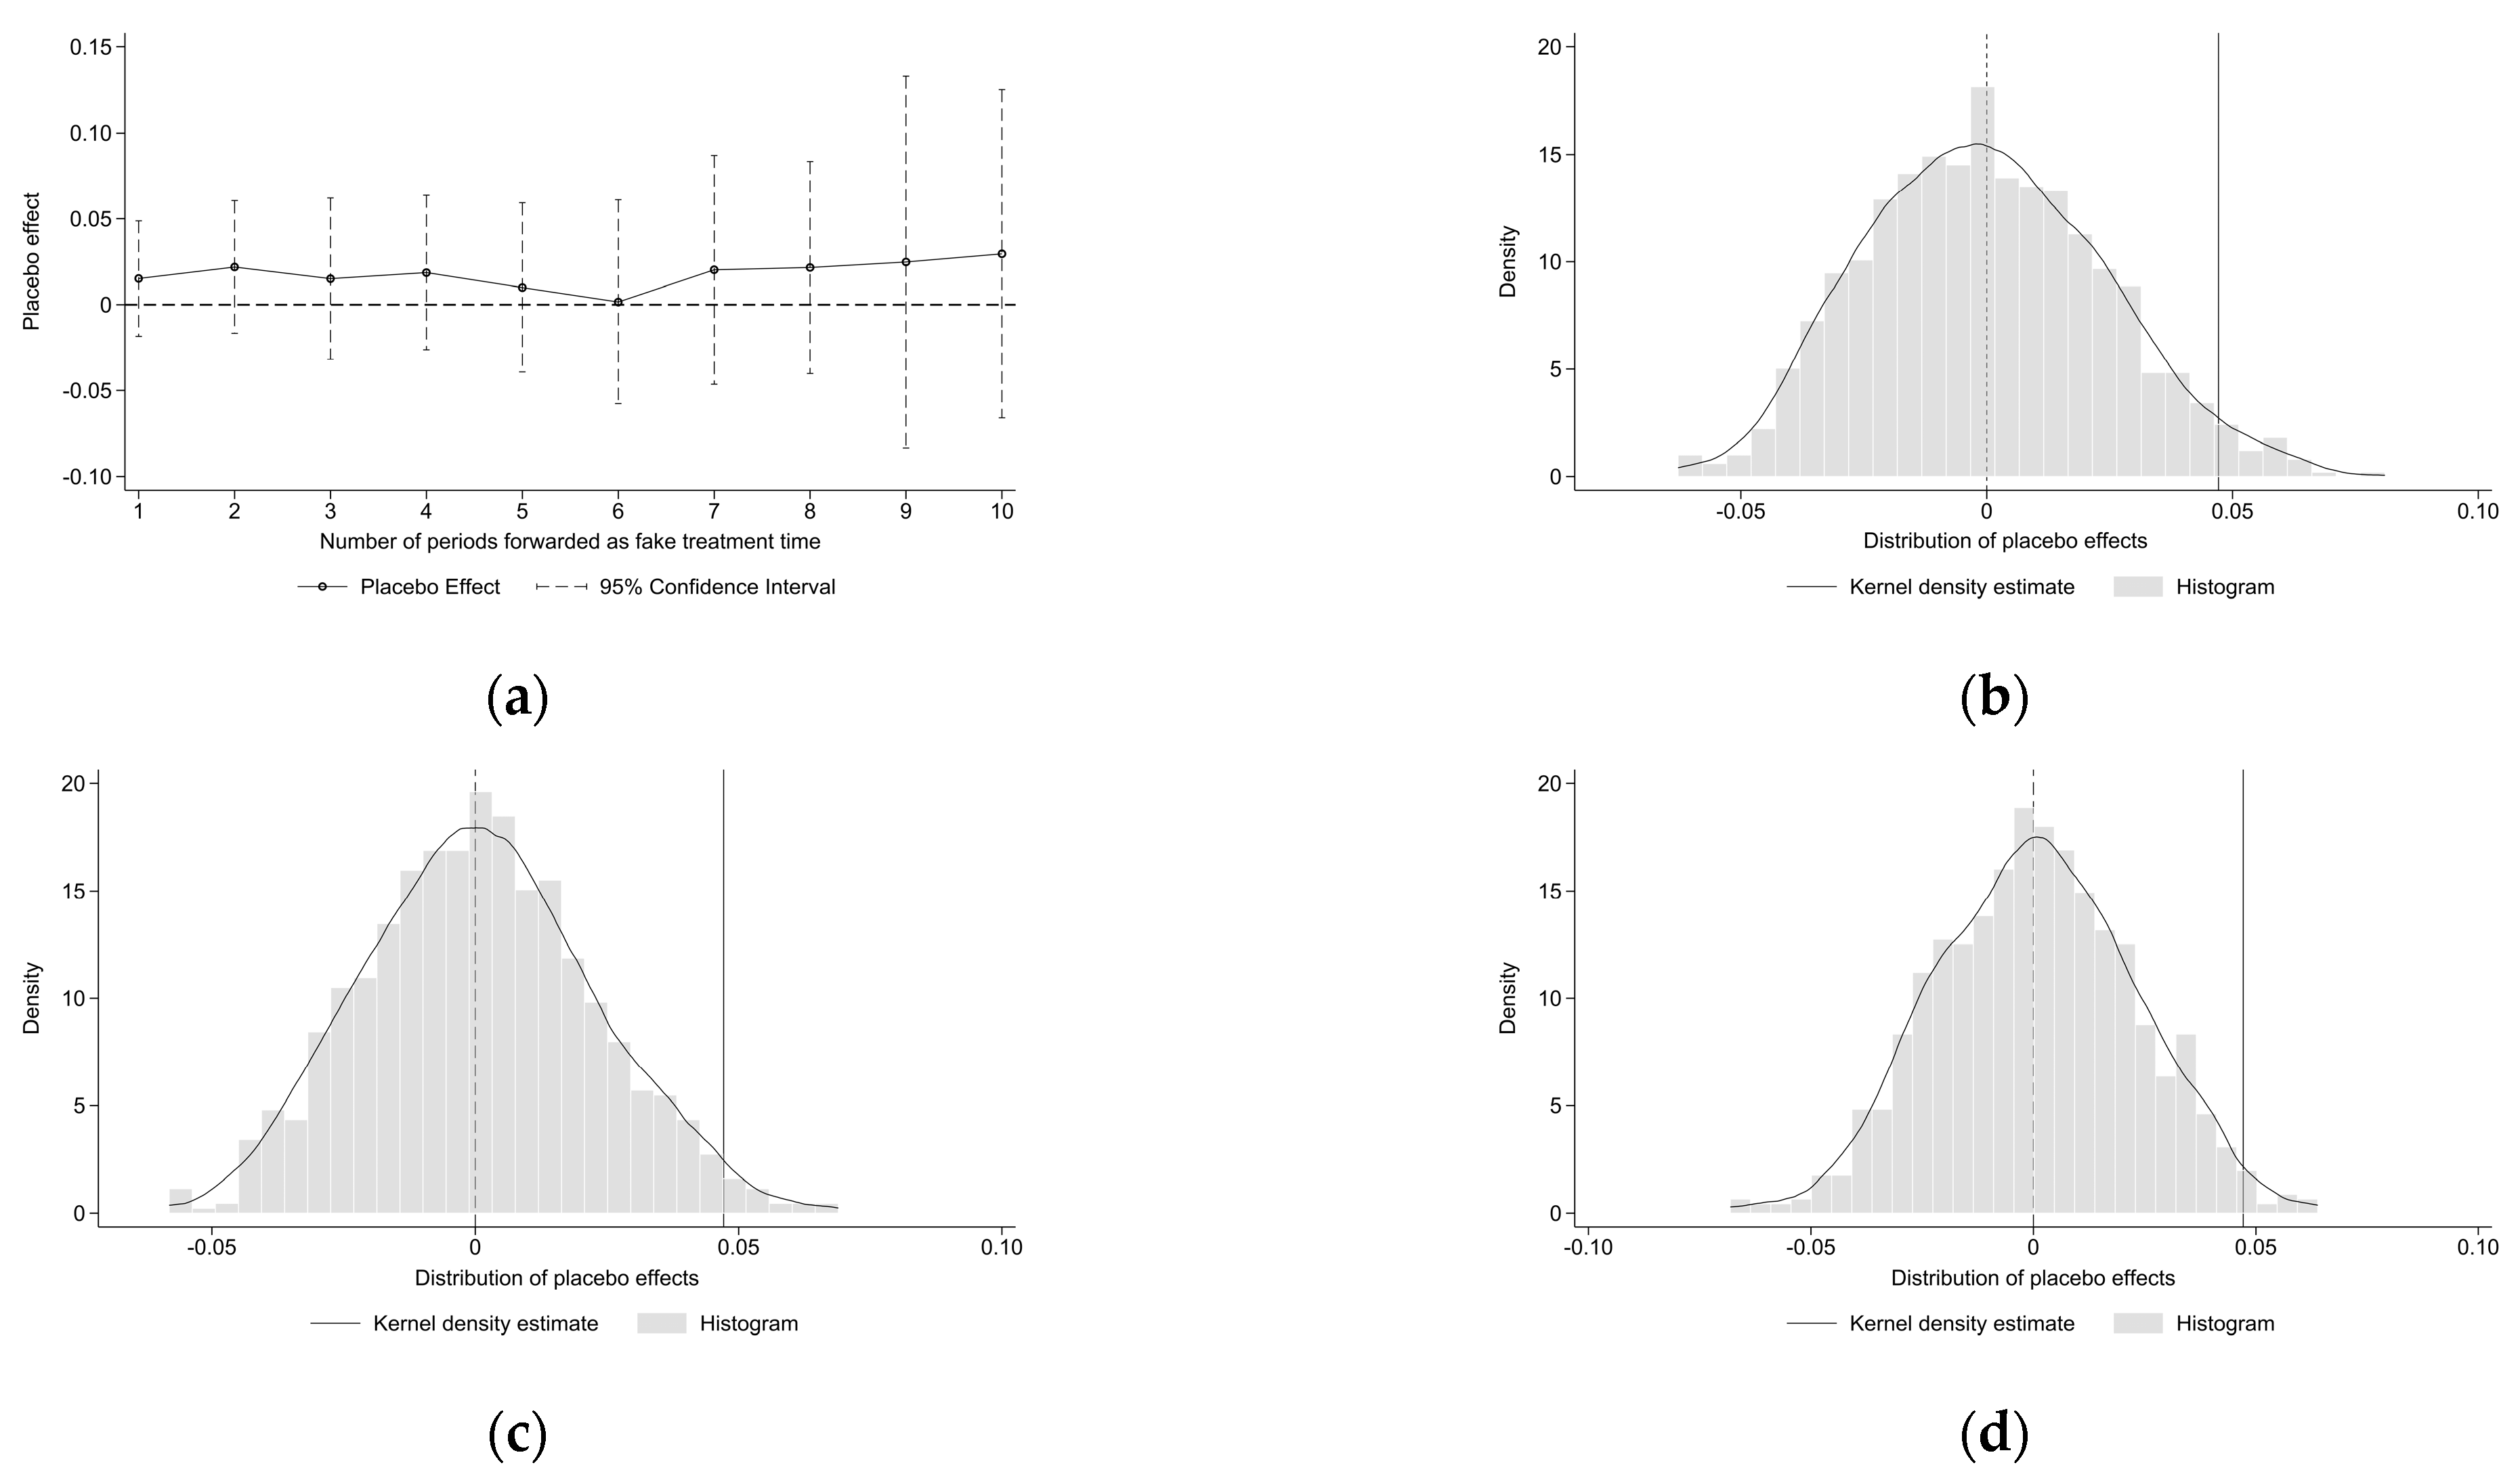
4.3.4. Placebo Tests

Confounding events may lead to endogeneity and estimation bias. To ensure that changes in urban land use efficiency are due to the upgrading of provincial DZs rather than other factors, this study generates pseudo-treatment variables and employs in-time, in-space, unrestricted mixed, and restricted mixed placebo tests. Figure 7 presents the results of all the placebo tests. The in-time placebo test, using fictitious policy implementation times, shows that the impact of the upgrade policy on urban land use efficiency is not significant when the implementation time is fictitious. The in-space placebo test, using fictitious treatment groups, indicates that the impact of the upgrading policy on urban land use efficiency is not significant with fictitious treatment groups. This study also distinguishes between unrestricted and restricted mixed placebo tests by using fictitious policy implementation times and treatment groups, depending on whether the number of treatment groups corresponding to the treatment time matches the real situation [66]. The mixed placebo test results show that under fictitious policy implementation times and treatment groups, the impact of the upgrade policy on urban land use efficiency is not significant.

4.4. Dual Effects of Emission Reduction and Sink Enhancement

In addition to emission reduction targets, carbon sink enhancement is equally important in achieving net-zero carbon goals. The upgrade policy’s potential to promote carbon sink enhancement while reducing emissions warrants further investigation. In this study, the urban land use efficiency in Equation (7) is changed to the natural logarithms of carbon emissions (CE) and carbon sinks (CS). This is undertaken to see how the upgrade policy can help reduce emissions and improve sinks. Table 6 presents the estimated effects of the upgrade policy on urban carbon emissions and carbon sinks. Columns (1) and (2) display results without and with control variables, respectively. The findings indicate that the upgrade policy significantly reduces urban carbon emissions, with coefficients of −0.092 and −0.083, both significant at the 1% level. Columns (3) and (4) show that the upgrade policy significantly enhances carbon sinks with coefficients of 0.003, both significant at the 5% level. However, the impact of the policy concentrates in the industrial sector, as the sink enhancement effect is significantly weaker than the emission reduction effect. In summary, the upgrade policy exhibits significant dual effects in reducing carbon emissions and enhancing carbon sinks, thereby contributing to the achievement of the net-zero carbon goal.

4.5. Mechanism Tests

4.5.1. Land-Use and Environmental Regulations

To examine whether the upgrading of DZs has strengthened land-use and environmental regulations, this study first calculates the average land transfer area per unit at the urban level to characterize the intensity of land regulations (LR). Additionally, following Ding et al. [67], we employ microdata on environmental administrative penalties to compute the natural logarithm of the number of environmental administrative penalty cases at the city level, indicating the intensity of environmental regulations (ER). The estimation results in Table 7 indicate that upgrading DZs significantly intensifies land-use and environmental regulations, verifying the theoretical mechanism in Section 2.2.

4.5.2. Resource Allocation Optimization

To test whether the upgrade policy has improved urban resource misallocation and structural optimization, this study first refers to the research by Hsieh and Klenow [68]. To measure resource misallocation (RM), we apply the production function method to evaluate the degree of factor market distortion in each city and then normalize these values against the maximum distortion level observed in that year. Secondly, we utilize land transaction data to calculate the proportions of land transfers and transferred area in the high-tech sector at the urban level, reflecting the degree of structural optimization (SO). Columns (1) and (2) of Table 8 report the impact of the upgrade policy on RM without and with control variables, respectively. Columns (3) and (4) report the impact of the upgrade policy on the proportions of land transfers and transferred area in the high-tech sector, respectively. The results indicate that the upgrade policy significantly reduces resource misallocation and promotes urban industrial structure optimization, thereby verifying the theoretical mechanism described in Section 2.2.

4.5.3. Green Technological Innovation

This study further investigates the impact of the upgrade policy on urban green technological innovation. To measure the overall technological innovation (TI) and green technological innovation (GTI), we use the logarithm of the number of urban invention patent applications and the logarithm of the number of urban green invention patent applications. The results, as shown in Table 9, indicate that the upgrade policy significantly enhances urban technological innovation and green technological innovation, thereby offering new impetus for improving urban land use efficiency.

4.6. Heterogeneity Analyses

4.6.1. Heterogeneity of National DZs

This study distinguishes between the impacts of upgrading provincial DZs to national HTDZs and national EDZs. When upgrading to the national level, notable differences emerge between these zones. Because some cities contain both national HTDZs and national EDZs, the analysis focused on these zones separately. We removed intersection sample points to isolate the effects, focusing solely on zones that underwent upgrades from provincial to national HTDZs or national EDZs. The empirical results, presented in Table 10, indicate that upgrading to either type of national zone significantly improves urban land use efficiency. Nonetheless, upgrading to a national HTDZ has a greater impact than upgrading to a national EDZ. By consolidating innovative resources, attracting high-tech talent, fostering high-tech industries, and converting scientific and technological advancements into high value-added, low-pollution productivity, national HTDZs aim to drive innovation-based economic growth, thereby fostering high-quality development in China. Conversely, national EDZs primarily aim to attract foreign investment, boost exports, and promote rapid industrial and manufacturing growth. Consequently, national HTDZs place a greater emphasis on high-quality development compared to EDZs. This difference explains the relatively stronger impact of HTDZs on land use efficiency, as indicated by the empirical results.

4.6.2. Heterogeneity of Regions

Unbalanced economic development among China’s regions has long been a significant issue, with the eastern region typically experiencing higher levels of development and marketization. Therefore, are there notable geographical differences in the impact of the upgrade policy on urban land use efficiency? To investigate this, we divide the samples into eastern, central, and western groups for regression analysis. The empirical results, presented in Table 11, reveal that the impact of the upgrade policy on urban land use efficiency is significantly greater in the central region compared to the eastern region, while it is not significant in the western region. The eastern cities’ higher resource acquisition capabilities and advantages may account for this disparity, making the addition of a national title less impactful. In contrast, the upgrade policy provides crucial support to central cities.

5. Discussion

Achieving intensive land use and carbon neutrality in industrial parks requires comprehensive changes across economic, social, technological, and energy domains. Several countries exemplify leading practices in transforming industrial parks towards low-carbon sustainability, notably through eco-industrial parks and industrial symbiosis. Since the 1960s, the eco-industrial park at Kalundborg, Denmark, has become a global benchmark by achieving significant economic and environmental benefits through systematic exchanges of water, energy, and waste, thus driving substantial carbon emission reductions [69]. Launched in 1997, Japan’s Eco-Town Program has fostered industrial and urban symbiosis to maximize economic and environmental benefits through the strategic geographic proximity of industrial and urban areas [70]. The program emphasizes resource reuse, waste minimization, and energy regeneration, adhering to zero-emission principles. South Korea’s National Eco-Industrial Park Project, launched in 2003 with the Ulsan Eco-Industrial Park as its initial pilot, has accomplished the transformation of traditional industrial parks into eco-industrial parks. The project achieves coordinated pollution and carbon reduction through symbiotic industrial relationships and optimized resource and energy usage [71,72]. These international experiences indicate that institutional reforms and industrial symbiosis are pivotal in achieving carbon neutrality. In comparison, China’s industrial parks have undergone a high-quality transformation through large-scale upgrades from provincial to national DZs. This upgrade policy was designed to improve land use efficiency and environmental performance while promoting economic development. Among them, the goals of green, low-carbon, and circular development are consistent with the principles of eco-industrial parks and industrial symbiosis. A significant advantage of China’s upgrade policy is its ability to reduce local government interference in park construction through assessment and decentralization, while maintaining the informational advantage of park management committees. This approach significantly enhances land use efficiency and facilitates a net-zero carbon transition.
The study affirms the effectiveness of China’s upgrading policy, though two primary limitations remain: data constraints and challenges in evaluating the policy’s impact on carbon neutrality. First, there are two types of data constraints. The first aspect is the accuracy of carbon sink data. Compared with carbon emissions, the measurement of carbon sinks is not yet that mature. Despite the widespread use of carbon sink accounting based on satellite remote sensing and meteorological data, the accuracy and precision of the data still lag behind official manual statistics. Regrettably, at the urban level, officials only count the area of urban built-up and administrative areas and do not have detailed land cover data. Therefore, using satellite data with higher resolution is a beneficial choice for future carbon sink measurements. The second aspect is the inability to account for carbon sinks other than vegetation. It is challenging to obtain such data due to the limited use of carbon capture and storage technology and gaps in official statistics. Although ecosystem carbon sinks are currently important, with the development of carbon capture utilization and storage technology, their accounting also deserves attention in the future. Prospective extensions of this work should first focus on broadening and refining data sources. Secondly, we should conduct a more convincing and precise examination of how the policy impacts carbon neutrality. Given that the dependent variable in this study is land use efficiency, carbon emissions and sinks serve as extended analyses. Determining the extent to which the upgrading of DZs contributes to carbon emission reduction, carbon sinks, or carbon neutrality, and explicitly mentioning these contributions, would be an exciting outcome. This represents a promising direction for future research.

6. Conclusions and Policy Implication

Given the tightening constraints on land resources and the intensifying pursuit of carbon neutrality, enhanced environmental governance will demand greater manpower, materials, and financial resources. Traditional governance methods may become unsustainable, complicating the achievement of intensive land use and carbon neutrality for governments. This study explores the feasibility of institutional reforms and the upgrading of provincial DZs to national status, suggesting a new path to carbon neutrality via soft governance. This strategy involves optimizing policy frameworks to enforce rigorous regulations, minimize resource misallocation, and encourage technological innovation. DZs in China, as pivotal drivers of economic development, have been essential for high-quality economic growth. This study reveals that upgrading DZs and implementing institutional reforms enhance urban land use efficiency, reduce carbon emissions, and increase carbon sinks, thus accepting Hypothesis I and rejecting Hypothesis II. Policy effects are more pronounced in the eastern and central cities, with the central cities having the greatest impact. Furthermore, upgrading to a national HTDZ has a more significant impact than upgrading to a national EDZ. These findings indicate that upgrading DZs is more cost-effective than traditional environmental policies. This approach offers a practical solution for achieving intensive land use and carbon neutrality goals via DZ reforms and endogenous pollution control. This study outlines the following policy implications.
First, provide guidance and incentives for provincial DZs to upgrade to national DZs. The upgrade policy, as a pivotal practice in high-quality industrial development, has produced significant results in promoting intensive land use and green, low-carbon development. This indicates that the upgrade policy is an effective strategy for promoting high-quality transformation. It is essential to actively encourage provincial DZs to apply for an upgrade to national status. Given the unbalanced resource endowment of DZs in eastern, central, and western China and the uneven distribution of national DZs, the central government should further optimize the layout of national DZ construction and encourage the upgrading of provincial DZs in central China.
Second, enhance the assessment mechanism and prioritize technological innovation. Mechanism analyses show that the upgrade policy can foster intensive land use and carbon neutrality by strengthening land-use and environmental regulations, optimizing resource allocation, and encouraging green technological innovation. Consequently, it is essential to further enhance the assessment mechanism, fully engage local governments, promote competitive industrial policies, and improve the input-output ratio of industrial policies. Furthermore, the focus on end-of-pipe governance should be moderately reduced, with greater emphasis placed on assessing the performance of green technological innovation and making it a primary criterion for fiscal policy support. Fiscal subsidies and tax incentives should be fully utilized to encourage green technological innovation, boosting enterprises’ enthusiasm for innovation and shifting emission reduction strategies from technological improvements to technological breakthroughs.
Third, emphasizing the unique characteristics of each zone and creating differentiated measures for constructing national DZs is essential. National HTDZs exhibit more effective policy outcomes than national EDZs. This difference may stem from the fact that national EDZs primarily focus on attracting foreign investment, boosting exports, and promoting rapid industrial and manufacturing growth. Accordingly, the construction process must take into account the variations among DZs and utilize a management model that capitalizes on their unique resource endowments. High-growth-target DZs often house many low-land-efficiency and high-carbon-emission enterprises, making it difficult to transform them into high-quality zones due to path dependence after upgrades. Hence, it is vital to raise the entry threshold for these enterprises, implement targeted policy incentives, promote the development of alternative industries with regional comparative advantages, and create a long-term framework for green and low-carbon development.

Author Contributions

Conceptualization, J.R.; methodology, D.Z.; software, D.Z.; validation, D.Z. and J.R.; formal analysis, J.R.; investigation, D.Z.; resources, D.Z.; data curation, D.Z.; writing—original draft preparation, J.R.; writing—review and editing, J.R. and X.Z.; visualization, D.Z. and X.Z.; supervision, J.R. and X.Z.; project administration, J.R. and X.Z.; funding acquisition, J.R. and X.Z. All authors have read and agreed to the published version of the manuscript.

Funding

This research was funded by ZJU-STEC Urban Development and Planning Innovation Joint Research Center Project (Grant No. 513000-I5220A/001).

Data Availability Statement

The data presented in this study are available on request from the authors.

Acknowledgments

Acknowledgment is given to Zhejiang University for their support through the ZJU-STEC Urban Development and Planning Innovation Joint Research Center Project (Grant No. 513000-I5220A/001). The authors also express their gratitude to Wei Shao for his suggestions on the article framework and data support.

Conflicts of Interest

Authors Jinguo Rao and Xiaosong Zhang were employed by the company Shanghai Urban Construction Design and Research Institute (Group) Co., Ltd. The remaining authors declare that the research was conducted in the absence of any commercial or financial relationships that could be construed as a potential conflict of interest.

Appendix A

Table A1. Descriptive statistics.
VariableNMeanS.D.MinimumMaximum
ULUE26392.6491.9850.03012.047
Pgdp263910.1880.6358.53811.608
Gov26390.1860.0950.0610.625
Fin26391.8770.6350.8494.033
Indus26390.8480.0770.6190.987
Fdi26390.0310.0260.0030.141
Num26391.5550.66002.890

References

  1. Fankhauser, S.; Smith, S.M.; Allen, M.; Axelsson, K.; Hale, T.; Hepburn, C.; Kendall, J.M.; Khosla, R.; Lezaun, J.; Mitchell-Larson, E.; et al. The meaning of net zero and how to get it right. Nat. Clim. Chang. 2022, 12, 15–21. [Google Scholar] [CrossRef]
  2. Sachdeva, S.; Hsu, A.; French, I.; Lim, E. A computational approach to analyzing climate strategies of cities pledging net zero. NPJ Urban Sustain. 2022, 2, 21. [Google Scholar] [CrossRef]
  3. DeFries, R.; Ahuja, R.; Friedman, J.; Gordon, D.R.; Hamburg, S.P.; Kerr, S.; Mwangi, J.; Nouwen, C.; Pandit, N. Land management can contribute to net zero. Science 2022, 376, 1163–1165. [Google Scholar] [CrossRef]
  4. Jin, G.; Peng, J.; Zhang, L.; Zhang, Z. Understanding land for high-quality development. J. Geogr. Sci. 2023, 33, 217–221. [Google Scholar] [CrossRef]
  5. Burchfield, M.; Overman, H.G.; Puga, D.; Turner, M.A. Causes of sprawl: A portrait from space. Q. J. Econ. 2006, 121, 587–633. [Google Scholar] [CrossRef]
  6. Chen, D.; Lu, X.; Liu, X.; Wang, X. Measurement of the eco-environmental effects of urban sprawl: Theoretical mechanism and spatiotemporal differentiation. Ecol. Indic. 2019, 105, 6–15. [Google Scholar] [CrossRef]
  7. Lu, Y.; Wang, J.; Zhu, L. Place-based policies, creation, and agglomeration economies: Evidence from China’s economic zone program. Am. Econ. J. Econ. Policy 2019, 11, 325–360. [Google Scholar] [CrossRef]
  8. Zhang, J. Interjurisdictional competition for FDI: The case of China’s “development zone fever”. Reg. Sci. Urban Econ. 2011, 41, 145–159. [Google Scholar] [CrossRef]
  9. Kuang, B.; Lu, X.; Han, J.; Fan, X.; Zuo, J. How urbanization influence urban land consumption intensity: Evidence from China. Habitat Int. 2020, 100, 102103. [Google Scholar] [CrossRef]
  10. Sun, Y.; Ma, A.; Su, H.; Su, S.; Chen, F.; Wang, W.; Weng, M. Does the establishment of development zones really improve industrial land use efficiency? Implications for China’s high-quality development policy. Land Use Policy 2020, 90, 104265. [Google Scholar] [CrossRef]
  11. Zhou, Y.; Chen, M.; Tang, Z.; Mei, Z. Urbanization, land use change, and carbon emissions: Quantitative assessments for city-level carbon emissions in Beijing-Tianjin-Hebei region. Sustain. Cities Soc. 2021, 66, 102701. [Google Scholar] [CrossRef]
  12. Mao, W.; Cai, S.; Lu, J.; Yang, H. What triggered China’s urban debt risk? Snowball effect under the growth target constraint. Struct. Chang. Econ. Dyn. 2023, 67, 1–13. [Google Scholar] [CrossRef]
  13. Liu, Y.; Fang, F.; Li, Y. Key issues of land use in China and implications for policy making. Land Use Policy 2014, 40, 6–12. [Google Scholar] [CrossRef]
  14. Kong, L.; Chai, Z. Does the upgrading of provincial development zones improve the cities’ economic efficiency? Evidence from a quasi-experiment of heterogeneous development zones. J. Manag. World 2022, 2022, 60–74. [Google Scholar] [CrossRef]
  15. Xie, Z.; Lu, W.; Yu, J.; Wu, Y.; Liu, Q. Development zones and green innovation: Evidence from Chinese listed companies. China Econ. Rev. 2022, 76, 101874. [Google Scholar] [CrossRef]
  16. Zhang, Z.; Wei, X.; Lin, X. The spatial effect of upgrading economic development zones on regional eco-efficiency: Evidence from China. Int. J. Sci. Environ. Technol. 2024, 21, 6851–6870. [Google Scholar] [CrossRef]
  17. Hua, Y.; Partridge, M.; Sun, W. Pollution effects of place-based policy: Evidence from China’s development-zone program. J. Reg. Sci. 2023, 63, 703–727. [Google Scholar] [CrossRef]
  18. Ling, X.; Gao, Y.; Wu, G. How Does Intensive Land Use Affect Low-Carbon Transition in China? New Evidence from the Spatial Econometric Analysis. Land 2023, 12, 1578. [Google Scholar] [CrossRef]
  19. Démurger, S.; D SACHS, J.; Woo, W.T.; Shuming, B.A.O.; Chang, G. The relative contributions of location and preferential policies in China’s regional development: Being in the right place and having the right incentives. China Econ. Rev. 2002, 13, 444–465. [Google Scholar] [CrossRef]
  20. Cheng, L.K.; Kwan, Y.K. What are the determinants of the location of foreign direct investment? The Chinese experience. J. Int. Econ. 2000, 51, 379–400. [Google Scholar] [CrossRef]
  21. Alder, S.; Shao, L.; Zilibotti, F. Economic reforms and industrial policy in a panel of Chinese cities. J. Econ. Growth 2016, 21, 305–349. [Google Scholar] [CrossRef]
  22. Wang, J. The economic impact of special economic zones: Evidence from Chinese municipalities. J. Dev. Econ. 2013, 101, 133–147. [Google Scholar] [CrossRef]
  23. Chen, W.; Su, Z.; Wang, Y.; Wang, Q.; Zhao, G. Do the rank difference of industrial development zones affect land use efficiency? A regional analysis in China. Socio-Econ. Plan. Sci. 2022, 80, 101168. [Google Scholar] [CrossRef]
  24. Liu, Y.; Martinez-Vazquez, J. Interjurisdictional tax competition in China. J. Reg. Sci. 2014, 54, 606–628. [Google Scholar] [CrossRef]
  25. Zhuang, L.; Ye, C. Changing imbalance: Spatial production of national high-tech industrial development zones in China (1988–2018). Land use policy 2020, 94, 104512. [Google Scholar] [CrossRef]
  26. Lin, J.Y.; Liu, Z. Fiscal decentralization and economic growth in China. Econ. Dev. Cult. Chang. 2000, 49, 1–21. [Google Scholar] [CrossRef]
  27. Yang, L.; Luo, X.; Ding, Z.; Liu, X.; Gu, Z. Restructuring for growth in development zones, China: A systematic literature and policy review (1984–2022). Land 2022, 11, 972. [Google Scholar] [CrossRef]
  28. Kong, Q.; Li, R.; Peng, D.; Wong, Z. High-technology development zones and innovation in knowledge-intensive service firms: Evidence from Chinese A-share listed firms. Int. Rev. Financ. Anal. 2021, 78, 101883. [Google Scholar] [CrossRef]
  29. Hu, Y.; Wang, Z.; Deng, T. Expansion in the shrinking cities: Does place-based policy help to curb urban shrinkage in China? Cities 2021, 113, 103188. [Google Scholar] [CrossRef]
  30. Li, X.; Tang, J.; Huang, J. Place-based policy upgrading, business environment, and urban innovation: Evidence from high-tech zones in China. Int. Rev. Financ. Anal. 2023, 86, 102545. [Google Scholar] [CrossRef]
  31. Lu, X.; Chen, D.; Kuang, B.; Zhang, C.; Cheng, C. Is high-tech zone a policy trap or a growth drive? Insights from the perspective of urban land use efficiency. Land Use Policy 2020, 95, 104583. [Google Scholar] [CrossRef]
  32. Lin, B.; Ma, R. Green technology innovations, urban innovation environment and CO2 emission reduction in China: Fresh evidence from a partially linear functional-coefficient panel model. Technol. Forecast Soc. Chang. 2022, 176, 121434. [Google Scholar] [CrossRef]
  33. Wei, Y.D. Zone fever, project fever: Development policy, economic transition, and urban expansion in China. Geogr. Rev. 2015, 105, 156–177. [Google Scholar] [CrossRef]
  34. Gar-On Yeh, A.; Wu, F. The new land development process and urban development in Chinese cities. Int. J. Urban Reg. Res. 1996, 20, 330–353. [Google Scholar]
  35. Cartier, C. ‘Zone Fever’, the Arable Land Debate, and Real Estate Speculation: China’s evolving land use regime and its geographical contradictions. J. Contem. China 2001, 10, 445–469. [Google Scholar] [CrossRef]
  36. Chien, S.S. Local farmland loss and preservation in China—A perspective of quota territorialization. Land Use Policy 2015, 49, 65–74. [Google Scholar] [CrossRef]
  37. Deng, F.F.; Huang, Y. Uneven land reform and urban sprawl in China: The case of Beijing. Prog. Plann. 2004, 61, 211–236. [Google Scholar] [CrossRef]
  38. Ding, Y.; Li, F. Examining the effects of urbanization and industrialization on carbon dioxide emission: Evidence from China’s provincial regions. Energy 2017, 125, 533–542. [Google Scholar] [CrossRef]
  39. Wong, S.W.; Tang, B.S. Challenges to the sustainability of ‘development zones’: A case study of Guangzhou Development District, China. Cities 2005, 22, 303–316. [Google Scholar] [CrossRef]
  40. Zhao, C.; Xie, R.; Ma, C.; Han, F. Understanding the haze pollution effects of China’s development zone program. Energy Econ. 2022, 111, 106078. [Google Scholar] [CrossRef]
  41. Gao, S.; Sun, D.; Wang, S. Do development zones increase carbon emission performance of China’s cities? Sci. Total Environ. 2023, 863, 160784. [Google Scholar] [CrossRef]
  42. Van der Kamp, D.; Lorentzen, P.; Mattingly, D. Racing to the bottom or to the top? Decentralization, revenue pressures, and governance reform in China. World Dev. 2017, 95, 164–176. [Google Scholar] [CrossRef]
  43. Li, H.; Zhou, L.A. Political turnover and economic performance: The incentive role of personnel control in China. J. Public Econ. 2005, 89, 1743–1762. [Google Scholar] [CrossRef]
  44. Hong, T.; Yu, N.; Mao, Z. Does environment centralization prevent local governments from racing to the bottom?--Evidence from China. J. Clean. Prod. 2019, 231, 649–659. [Google Scholar] [CrossRef]
  45. Long, H.; Qu, Y. Land use transitions and land management: A mutual feedback perspective. Land Use Policy 2018, 74, 111–120. [Google Scholar] [CrossRef]
  46. Shi, H.; Chertow, M.; Song, Y. Developing country experience with eco-industrial parks: A case study of the Tianjin Economic-Technological Development Area in China. J. Clean. Prod. 2010, 18, 191–199. [Google Scholar] [CrossRef]
  47. Piao, S.; Huang, M.; Liu, Z.; Wang, X.; Ciais, P.; Canadell, J.G.; Wang, K.; Bastos, A.; Friedlingstein, P.; Houghton, R.A.; et al. Lower land-use emissions responsible for increased net land carbon sink during the slow warming period. Nat. Geosci. 2018, 11, 739–743. [Google Scholar] [CrossRef]
  48. Feng, T.; Sun, L.; Zhang, Y. The relationship between energy consumption structure, economic structure and energy intensity in China. Energy Policy 2009, 37, 5475–5483. [Google Scholar] [CrossRef]
  49. Song, Y.; Yeung, G.; Zhu, D.; Xu, Y.; Zhang, L. Efficiency of urban land use in China’s resource-based cities, 2000–2018. Land Use Policy 2022, 115, 106009. [Google Scholar] [CrossRef]
  50. Zhou, D.; Huang, Q.; Chong, Z. Analysis on the effect and mechanism of land misallocation on carbon emissions efficiency: Evidence from China. Land Use Policy 2022, 121, 106336. [Google Scholar] [CrossRef]
  51. Huang, Z.; Du, X. Government intervention and land misallocation: Evidence from China. Cities 2017, 60, 323–332. [Google Scholar] [CrossRef]
  52. Gao, F.; He, Z. Digital economy, land resource misallocation and urban carbon emissions in Chinese resource-based cities. Resour. Policy 2024, 91, 104914. [Google Scholar] [CrossRef]
  53. Hao, Y.; Gai, Z.; Wu, H. How do resource misallocation and government corruption affect green total factor energy efficiency? Evidence from China. Energy Policy 2020, 143, 111562. [Google Scholar] [CrossRef]
  54. Porter, M.E.; Linde, C.V.D. Toward a new conception of the environment-competitiveness relationship. J. Econ. Perspect. 1995, 9, 97–118. [Google Scholar] [CrossRef]
  55. Li, H.C.; Lee, W.C.; Ko, B.T. What determines misallocation in innovation? A study of regional innovation in China. J. Macroecon. 2017, 52, 221–237. [Google Scholar] [CrossRef]
  56. Chen, J.; Fan, W.; Li, D.; Liu, X.; Song, M. Driving factors of global carbon footprint pressure: Based on vegetation carbon sequestration. Appl. Energy 2020, 267, 114914. [Google Scholar] [CrossRef]
  57. Chen, J.; Gao, M.; Cheng, S.; Hou, W.; Song, M.; Liu, X.; Liu, Y.; Shan, Y. County-level CO2 emissions and sequestration in China during 1997–2017. Sci. Data 2020, 7, 391. [Google Scholar] [CrossRef] [PubMed]
  58. Shan, Y.; Huang, Q.; Guan, D.; Hubacek, K. China CO2 emission accounts 2016–2017. Sci. Data 2020, 7, 54. [Google Scholar] [CrossRef] [PubMed]
  59. Tone, K.; Tsutsui, M. An epsilon-based measure of efficiency in DEA–a third pole of technical efficiency. Eur. J. Oper. Res. 2010, 207, 1554–1563. [Google Scholar] [CrossRef]
  60. Zhang, W.; Liu, X.; Wang, D.; Zhou, J. Digital economy and carbon emission performance: Evidence at China’s city level. Energy Policy 2022, 165, 112927. [Google Scholar] [CrossRef]
  61. Kuang, B.; Lu, X.; Zhou, M.; Chen, D. Provincial cultivated land use efficiency in China: Empirical analysis based on the SBM-DEA model with carbon emissions considered. Technol. Forecast. Soc. Chang. 2020, 151, 119874. [Google Scholar] [CrossRef]
  62. Roth, J.; Sant’Anna, P.H.; Bilinski, A.; Poe, J. What’s trending in difference-in-differences? A synthesis of the recent econometrics literature. J. Econom. 2023, 235, 2218–2244. [Google Scholar] [CrossRef]
  63. Arkhangelsky, D.; Athey, S.; Hirshberg, D.A.; Imbens, G.W.; Wager, S. Synthetic difference-in-differences. Am. Econ. Rev. 2021, 111, 4088–4118. [Google Scholar] [CrossRef]
  64. Goodman-Bacon, A. Difference-in-differences with variation in treatment timing. J. Econom. 2021, 225, 254–277. [Google Scholar] [CrossRef]
  65. Callaway, B.; Sant’Anna, P.H. Difference-in-differences with multiple time periods. J. Econom. 2021, 225, 200–230. [Google Scholar] [CrossRef]
  66. Chen, Q.; Qi, J.; Yan, G. Didplacebo: Implementing Placebo Tests for Difference-in-Differences Estimations; Shandong University Working Paper. 2023. Available online: https://econpapers.repec.org/software/bocbocode/s459225.htm (accessed on 6 August 2024).
  67. Ding, X.; Appolloni, A.; Shahzad, M. Environmental administrative penalty, corporate environmental disclosures and the cost of debt. J. Clean. Prod. 2022, 332, 129919. [Google Scholar] [CrossRef]
  68. Hsieh, C.T.; Klenow, P.J. Misallocation and manufacturing TFP in China and India. Q. J. Econ. 2009, 124, 1403–1448. [Google Scholar] [CrossRef]
  69. Jacobsen, N.B. Industrial symbiosis in Kalundborg, Denmark: A quantitative assessment of economic and environmental aspects. J. Ind. Ecol. 2006, 10, 239–255. [Google Scholar] [CrossRef]
  70. Van Berkel, R.; Fujita, T.; Hashimoto, S.; Geng, Y. Industrial and urban symbiosis in Japan: Analysis of the Eco-Town program 1997–2006. J. Environ. Manag. 2009, 90, 1544–1556. [Google Scholar] [CrossRef] [PubMed]
  71. Park, H.S.; Rene, E.R.; Choi, S.M.; Chiu, A.S. Strategies for sustainable development of industrial park in Ulsan, South Korea—From spontaneous evolution to systematic expansion of industrial symbiosis. J. Environ. Manag. 2008, 87, 1–13. [Google Scholar] [CrossRef]
  72. Shah, I.H.; Dong, L.; Park, H.S. Tracking urban sustainability transition: An eco-efficiency analysis on eco-industrial development in Ulsan, Korea. J. Clean. Prod. 2020, 262, 121286. [Google Scholar] [CrossRef]
Figure 1. Spatial distribution of upgraded DZs.
Land 13 01245 g001
Figure 2. Theoretical framework for land use efficiency under the net-zero carbon city goal.
Land 13 01245 g002
Figure 3. Number of upgraded DZs from 2009 to 2021.
Land 13 01245 g003
Figure 4. Trends in average urban net carbon emissions from 2006 to 2020.
Land 13 01245 g004
Figure 5. Trends of urban land use efficiency from 2006 to 2020.
Land 13 01245 g005
Figure 6. Parallel trends test and dynamic effects.
Land 13 01245 g006
Figure 7. Placebo tests: (a) in-time placebo test; (b) in-space placebo test; (c) unrestricted mixed placebo test; (d) restricted mixed placebo test.
Land 13 01245 g007
Table 1. Evaluation index system of urban land use efficiency.
Layer of CriteriaLayer of FactorsLayer of IndicatorsUnit
inputslabornumber of employees in the primary, secondary, and tertiary104 persons
landarea of built districtskm2
capitalcapital stock108 CNY
outputsdesirable outputGDP108 CNY
undesirable outputnet carbon emissionsmillion tones (mt)
Table 2. Description of control variables.
VariableDefinitionCodeUnit
economic developmentnatural logarithm of GDP per capitaPgdp-
government intervention(local fiscal expenditure)/regional GDPGov%
financial developmentdeposits and loans of financial institutions/regional GDPFin%
industrial structuresecondary and tertiary industry added value/regional GDPIndus%
foreign direct investmentnumber of foreign-invested enterprises/number of industrial enterprisesFdi%
number of provincial DZsnatural logarithm of number of provincial DZsNum-
Table 3. The upgrade policy and urban land use efficiency.
ULUE
(1)(2)
UPDZ0.053 **
(0.024)
0.047 ***
(0.011)
control variablesnoyes
constant termyesyes
time fixed effectyesyes
city fixed effectyesyes
sample size26392639
R-squared0.0090.011
*, **, *** are significant at 10%, 5%, and 1% levels, respectively. Robust standard errors are in parentheses.
Table 4. Synthetic differences-in-differences results.
ULUE
(1)(2)
UPDZ0.043 ***
(0.014)
0.045 ***
(0.016)
control variablesnoyes
time fixed effectyesyes
city fixed effectyesyes
*, **, *** are significant at 10%, 5%, and 1% levels, respectively. Robust standard errors are in parentheses.
Table 5. Tests for heterogeneous treatment effects.
Panel A: Robust Estimations ULUE
Simple Weighted ATTDynamic ATTCalendar ATTGroup ATT
(1)(2)(3)(4)
Simple ATT0.041 **
(0.019)
Pre_Avg 0.007
(0.005)
Post_avg 0.054 **
(0.025)
CAverage 0.034 **
(0.014)
GAverage 0.032 **
(0.014)
Panel B: Decomposed estimationsEstimated coefficientWeight
Earlier treatment vs. Later control 0.0430.241
Later treatment vs. Earlier control−0.0150.073
Treatment vs. Never treated0.0640.686
Weighted coefficient0.053
*, **, *** are significant at 10%, 5%, and 1% levels, respectively. Robust standard errors are in parentheses.
Table 6. Dual effects of carbon reduction and sink enhancement.
CECS
(1)(2)(3)(4)
UPDZ−0.092 ***
(0.029)
−0.083 ***
(0.029)
0.003 **
(0.001)
0.003 **
(0.001)
control variablesnoyesnoyes
constant termyesyesyesyes
time fixed effectyesyesyesyes
city fixed effectyesyesyesyes
sample size2639263926392639
R-squared0.0390.0440.0020.011
*, **, *** are significant at 10%, 5%, and 1% levels, respectively. Robust standard errors are in parentheses.
Table 7. Land and environmental regulation.
LRER
(1)(2)(3)(4)
UPDZ−0.095 ***
(0.037)
−0.093 **
(0.037)
0.251 ***
(0.065)
0.129 **
(0.065)
control variablesnoyesnoyes
constant termyesyesyesyes
time fixed effectyesyesyesyes
city fixed effectyesyesyesyes
sample size2028201824212383
R-squared0.0400.0300.6910.644
*, **, *** are significant at 10%, 5%, and 1% levels, respectively. Robust standard errors are in parentheses.
Table 8. Resource allocation optimization.
RMSO
(1)(2)(3)(4)
UPDZ−0.020 ***
(0.006)
−0.028 ***
(0.006)
0.018 **
(0.008)
0.014 ***
(0.005)
control variablesnoyesyesyes
constant termyesyesyesyes
time fixed effectyesyesyesyes
city fixed effectyesyesyesyes
sample size2421238320242018
R-squared0.0470.1990.0330.038
*, **, *** are significant at 10%, 5%, and 1% levels, respectively. Robust standard errors are in parentheses.
Table 9. Green technological innovation.
TIGTI
(1)(2)(3)(4)
UPDZ0.062 **
(0.030)
0.105 ***
(0.029)
0.153 ***
(0.037)
0.155 ***
(0.037)
control variablesnoyesnoyes
constant termyesyesyesyes
time fixed effectyesyesyesyes
city fixed effectyesyesyesyes
sample size2421238324212383
R-squared0.4000.4600.4670.532
*, **, *** are significant at 10%, 5%, and 1% levels, respectively. Robust standard errors are in parentheses.
Table 10. Heterogeneity of national DZs.
ULUE
EDZHTDZ
(1)(2)
UPDZ0.034 **
(0.017)
0.076 ***
(0.015)
control variablesyesyes
constant termyesyes
time fixed effectyesyes
city fixed effectyesyes
sample size16511586
R-squared0.0140.013
*, **, *** are significant at 10%, 5%, and 1% levels, respectively. Robust standard errors are in parentheses.
Table 11. Heterogeneity of regions.
ULUE
EasternCentralWestern
(1)(2)(3)
UPDZ0.023 ***
(0.007)
0.087 ***
(0.018)
0.003
(0.030)
control variablesyesyesyes
constant termyesyesyes
time fixed effectyesyesyes
city fixed effectyesyesyes
sample size7931092754
R-squared0.0250.0010.013
*, **, *** are significant at 10%, 5%, and 1% levels, respectively. Robust standard errors are in parentheses.
Disclaimer/Publisher’s Note: The statements, opinions and data contained in all publications are solely those of the individual author(s) and contributor(s) and not of MDPI and/or the editor(s). MDPI and/or the editor(s) disclaim responsibility for any injury to people or property resulting from any ideas, methods, instructions or products referred to in the content.

